17
Briefing on Results for the First quarter of the Fiscal Year ending March 31, 2018

Briefing on Results for the First quarter of theFiscal Year ending March 31, 2018

1
First quarter of
FY2017/3
First quarter of
FY2018/3
Change
(YoY)
Rate of
change
(YoY)
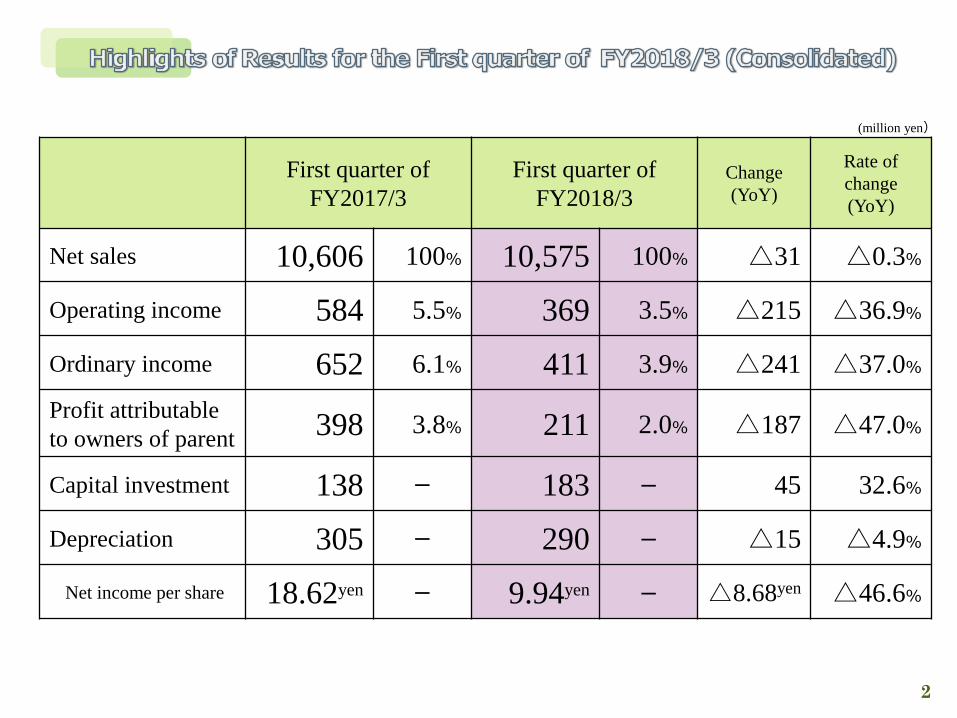
Net sales 10,606 100% 10,575 100% △31 △0.3%
Operating income 584 5.5% 369 3.5% △215 △36.9%
Ordinary income 652 6.1% 411 3.9% △241 △37.0%
Profit attributable
to owners of parent398 3.8% 211 2.0% △187 △47.0%
Capital investment 138 - 183 - 45 32.6%
Depreciation 305 - 290 - △15 △4.9%
Net income per share 18.62yen - 9.94yen - △8.68yen △46.6%
2
(million yen)

First quarter of
FY2017/3
First quarter of
FY2018/3
Change
(YoY)
Rate of
change
(YoY)
Net sales 10,606 100% 10,575 100% △31 △0.3%
By
pro
duct
Generators 7,776 73.3% 7,937 75.1% 161 2.1%
Welders 1,077 10.2% 1,113 10.5% 36 3.3%
Compressors 393 3.7% 232 2.2% △161 △41.0%
Others 1,360 12.8% 1,291 12.2% △69 △5.1%
(million yen)
3
First quarter of
FY2017/3
First quarter of
FY2018/3
Rate of change
(YoY)
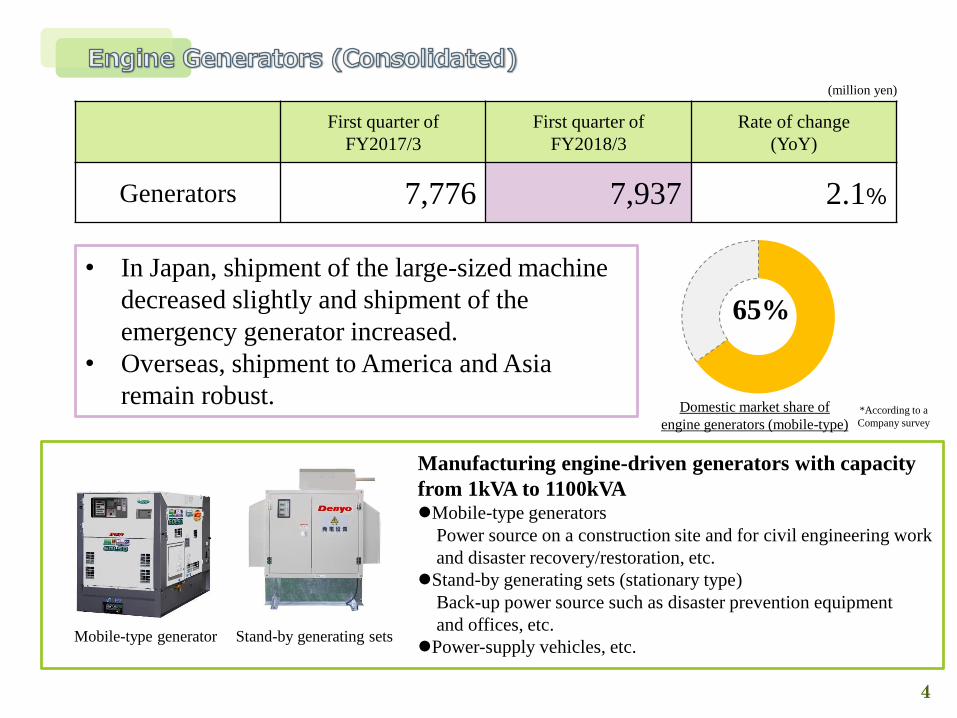
Generators 7,776 7,937 2.1%
• In Japan, shipment of the large-sized machine
decreased slightly and shipment of the
emergency generator increased.
• Overseas, shipment to America and Asia
remain robust.
(million yen)
4
Manufacturing engine-driven generators with capacity
from 1kVA to 1100kVAMobile-type generators
Power source on a construction site and for civil engineering work
and disaster recovery/restoration, etc.
Stand-by generating sets (stationary type)
Back-up power source such as disaster prevention equipment
and offices, etc.
Power-supply vehicles, etc.Mobile-type generator Stand-by generating sets
65%
Domestic market share of
engine generators (mobile-type)*According to a
Company survey

First quarter of
FY2017/3
First quarter of
FY2018/3
Rate of change
(YoY)
Welders 1,077 1,113 3.3%
• In Japan, the shipment decreased slightly.
• Overseas, shipment to America and Europe
increased.
5
55%
Domestic market share of
engine welders
*According to a
Company survey
Engine welder
The Company developed the first engine-driven welder for outdoor
work in Japan.
Ranging from 135A for welding light-gauge steel to a 500A engine-driven
welder for heavy-gauge steel, a TIG welder and a CO2 welder, etc.
Welding of steel construction for buildings, condominiums and bridges.
Welding of important structures such as petroleum storage tanks and
pipelines.
(million yen)
First quarter of
FY2017/3
First quarter of
FY2018/3
Rate of change
(YoY)
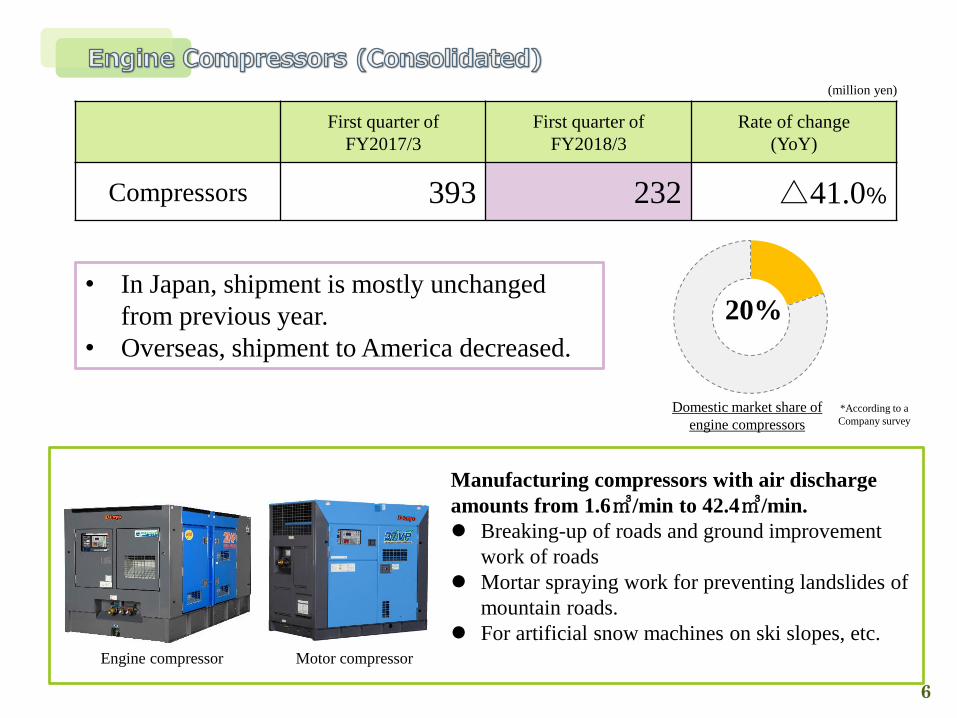
Compressors 393 232 △41.0%
• In Japan, shipment is mostly unchanged
from previous year.
• Overseas, shipment to America decreased.
6
(million yen)
Engine compressor Motor compressor
Manufacturing compressors with air discharge
amounts from 1.6㎥/min to 42.4㎥/min.
Breaking-up of roads and ground improvement
work of roads
Mortar spraying work for preventing landslides of
mountain roads.
For artificial snow machines on ski slopes, etc.
20%
Domestic market share of
engine compressors
*According to a
Company survey

First quarter of
FY2017/3
First quarter of
FY2018/3
Rate of change
(YoY)
Others 1,360 1,291 △5.1%
7
(million yen)
Sales of other productsSelf-propelled lifters
Water-related equipment
Parts
Secondhand equipment and purchased
merchandise
Repair sales, etc.
Self-propelled lifter
Load testing
equipment
• In Japan, shipment is mostly unchanged from the previous year.
• Overseas, shipment of the parts decreased slightly.
First quarter of
FY2017/3
First quarter of
FY2018/3
Change
(YoY)
Rate of change
(YoY)
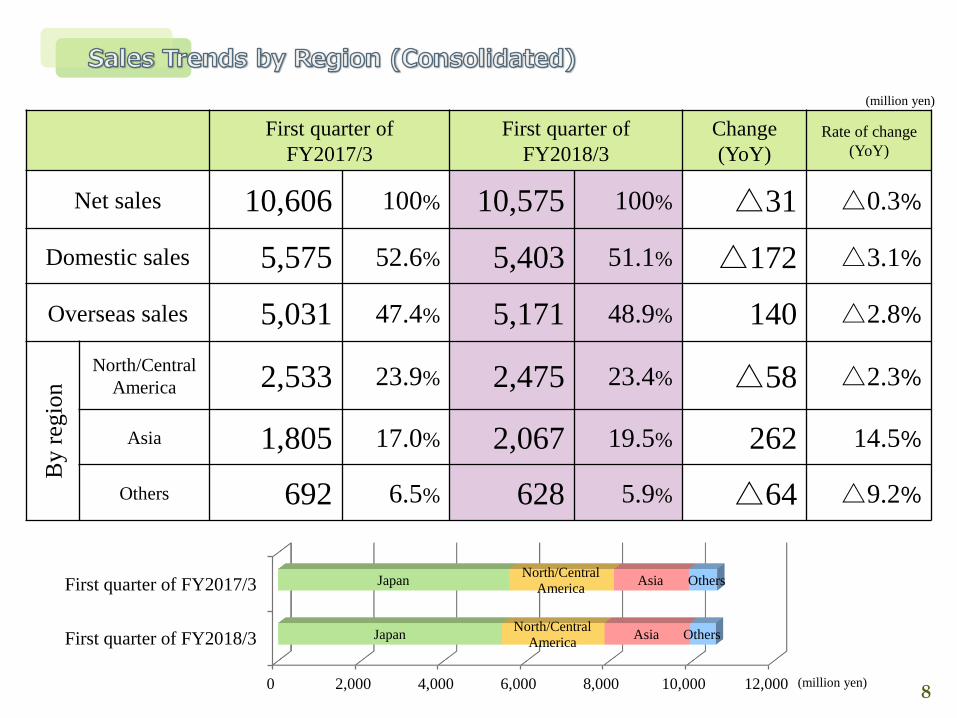
Net sales 10,606 100% 10,575 100% △31 △0.3%
Domestic sales 5,575 52.6% 5,403 51.1% △172 △3.1%
Overseas sales 5,031 47.4% 5,171 48.9% 140 △2.8%
By
reg
ion
North/Central
America 2,533 23.9% 2,475 23.4% △58 △2.3%
Asia 1,805 17.0% 2,067 19.5% 262 14.5%
Others 692 6.5% 628 5.9% △64 △9.2%
0 2,000 4,000 6,000 8,000 10,000 12,000
First quarter of FY2018/3
First quarter of FY2017/3
Japan
Japan
North/Central
America
North/Central
America
Asia
Asia
Others
Others
8(million yen)
(million yen)
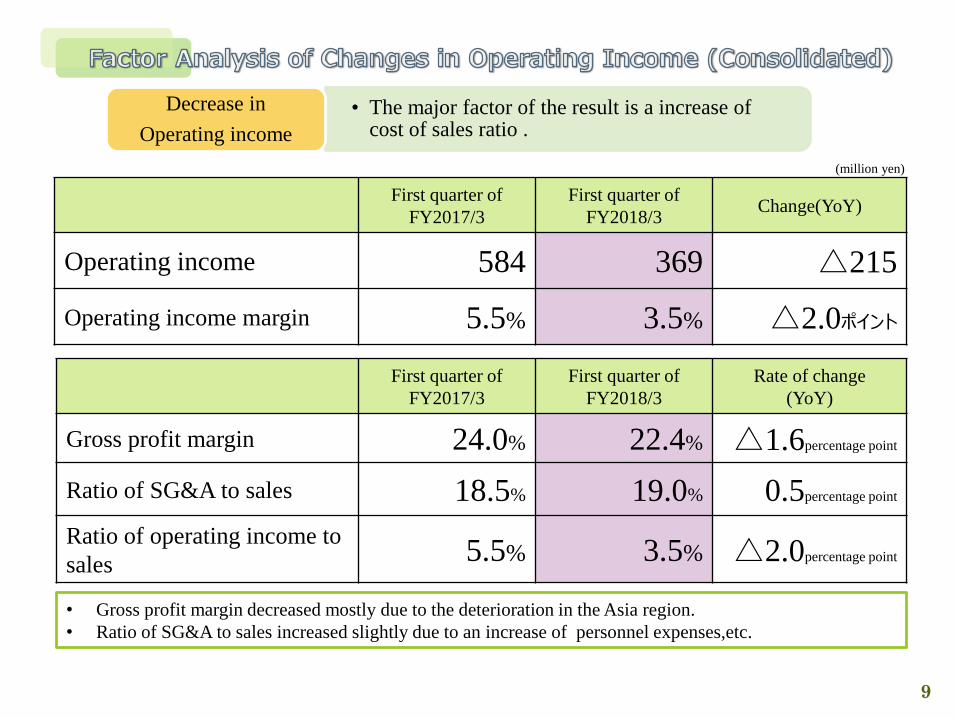
• The major factor of the result is a increase of cost of sales ratio .
Decrease in
Operating income
First quarter of
FY2017/3
First quarter of
FY2018/3Change(YoY)
Operating income 584 369 △215
Operating income margin 5.5% 3.5% △2.0ポイント
First quarter of
FY2017/3
First quarter of
FY2018/3
Rate of change
(YoY)
Gross profit margin 24.0% 22.4% △1.6percentage point
Ratio of SG&A to sales 18.5% 19.0% 0.5percentage point
Ratio of operating income to
sales5.5% 3.5% △2.0percentage point
• Gross profit margin decreased mostly due to the deterioration in the Asia region.
• Ratio of SG&A to sales increased slightly due to an increase of personnel expenses,etc.
9
(million yen)

10

• Net sales are expected to be 52.0 billion yen.
• Assumed exchange rate is 105 yen/dollar. Key points
FY2017/3 FY2018/3 (forecast) Change (YoY)Rate of
change(YoY)
Net sales 48,851 100% 52,000 100% 3,149 6.4%
Operating income 4,247 8.7% 4,600 8.8% 353 8.3%
Ordinary income 4,526 9.3% 5,000 9.6% 474 10.5%
Profit attributable to
owners of parent2,867 5.9% 3,150 6.1% 283 9.9 %
Capital investment 511 1,000 489 95.7%
Depreciation 1,211 1,200 △11 △0.9%
Net income per
share134.2yen 148.3yen 14.1yen
ROE 5.7% 6.2% *Equity is calculated by using the amount
of money at the end of FY2017/3.
Cash dividends per
share30.0yen 30.0yen - -
11
(million yen)

12
Denyo Manufacturing Corporation
End of March
2015
End of March
2016
End of March
2017
End of March
2018 (plan)
Cost of
equipment2,531 1,125 511 1,000
Main uses
• Machinery of Fukui plant,
etc. 440
• Nishinihon Generator Mfg.
160
• U.S. Plant 50
• Vietnam Plant 1,630
• Singapore 180
• Machinery of Fukui plant,
etc. 430
• Nishinihon Generator Mfg.
80
• Vietnam Plant 100
• Singapore 280
• Machinery of Fukui plant,
etc. 100
• Nishinihon Generator Mfg.
50
• U.S. Plant 250
• Vietnam Plant 20
• Machinery of Fukui plant,
etc. 600
• Nishinihon Generator Mfg.
70
• U.S. Plant 200
• Vietnam Plant 100
• Others 30
(million yen)
0
500
1,000
1,500
2,000
2,500
3,000
End of
March
2015
End of
March
2016
End of
March
2017
End of
March
2018
(plan)
Amount of capital investmentmillion yen
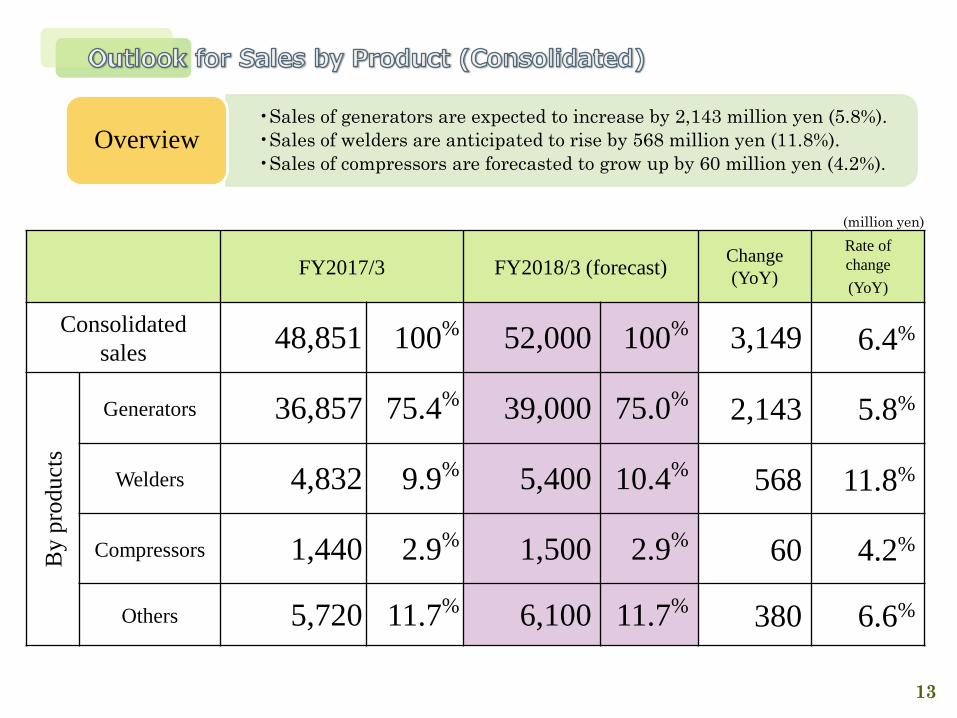
•Sales of generators are expected to increase by 2,143 million yen (5.8%).
•Sales of welders are anticipated to rise by 568 million yen (11.8%).
•Sales of compressors are forecasted to grow up by 60 million yen (4.2%). Overview
FY2017/3 FY2018/3 (forecast)Change
(YoY)
Rate of
change
(YoY)
Consolidated
sales48,851 100% 52,000 100% 3,149 6.4%
By
pro
duct
s
Generators 36,857 75.4% 39,000 75.0% 2,143 5.8%
Welders 4,832 9.9% 5,400 10.4% 568 11.8%
Compressors 1,440 2.9% 1,500 2.9% 60 4.2%
Others 5,720 11.7% 6,100 11.7% 380 6.6%
13
(million yen)
FY2017/3 FY2018/3 (forecast) Change (YoY)Rate of
change(YoY)
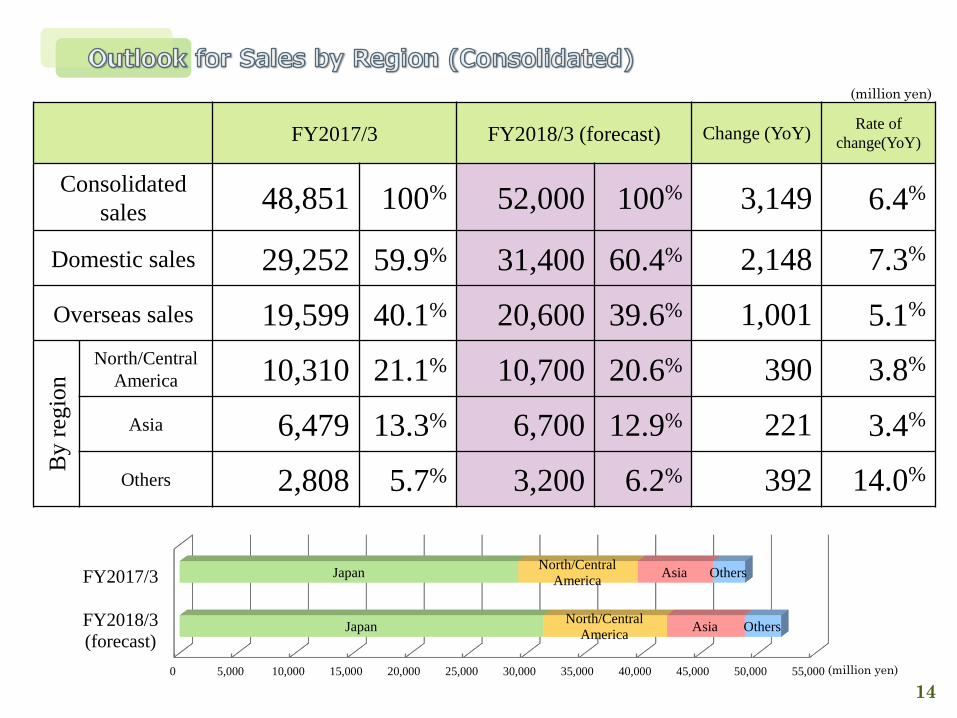
Consolidated
sales48,851 100% 52,000 100% 3,149 6.4%
Domestic sales 29,252 59.9% 31,400 60.4% 2,148 7.3%
Overseas sales 19,599 40.1% 20,600 39.6% 1,001 5.1%
By
reg
ion
North/Central
America 10,310 21.1% 10,700 20.6% 390 3.8%
Asia 6,479 13.3% 6,700 12.9% 221 3.4%
Others 2,808 5.7% 3,200 6.2% 392 14.0%
0 5,000 10,000 15,000 20,000 25,000 30,000 35,000 40,000 45,000 50,000 55,000
FY2018/3
(forecast)
FY2017/3
Japan
Japan
North/Central
America
North/Central
America
Asia
Asia
Others
Others
14
(million yen)
(million yen)

• The operating income margin slightly increased from the previous fiscal year and the operating income is expected to increase by 353 million yen.
Increase in operating
income
FY2017/3FY2018/3
(forecast)Change (YoY)
Operating income 4,247 4,600 353
Operating income margin 8.7% 8.8% 0.1percentage points
FY2017/3FY2018/3
(forecast)Change (YoY)
Gross profit margin 24.5% 25.0% 0.5percentage point
Ratio of SG&A to sales 15.8% 16.2% 0.4percentage point
Ratio of operating income to sales 8.7% 8.8% 0.1percentage point
• The gross profit margin are expected to be improved by an increase in the profitable product and the improvement of
production efficiency.
• The ratio of SG&A to sales are expected to be worsen due to an increase of personnel expenses and shipping cost, etc.
15
(million yen)

16
This material contains assumptions and outlooks for the future and
forecasts based on plans as of August 8, 2017.
Actual results may differ materially from projected values due to
future economic changes and competition.
This material is prepared for the purpose of providing information
and is not meant to solicit investment in securities issued by the
Company.
Investors are responsible for making their own final investment
decision.


