Page 1
University of Kansas
Broadband Local AccessBroadband Local Access
Joseph B. EvansCharles E. Spahr Professor of EECS
Director, Networking & Distributed Systems LaboratoryInformation & Telecommunication Technology Center
University of [email protected]
ISART 20007 September 2000
Page 2
University of Kansas
OutlineOutline• Motivation• Performance experiments• Long-term monitoring• MAC performance• Spectrum issues• Conclusions
Page 3
University of Kansas
MotivationMotivation• Determine suitability of wireless for local access• Components
• assess limits of technology via experimentation– performance (throughput and delay)– long-term monitoring (reliability)
• media access layer performance– compare different approaches to MAC layer– assess capability of MAC layers to provide particular services
• spectrum issues– working with under-utilized frequency bands
Page 4
University of Kansas
Faculty and StudentsFaculty and Students• Faculty
• Joe Evans• Jim Roberts
• Students• Mihir Thaker• Harish Sitaraman• Jesse Davis• Dragan Trajkov• Larry Sanders
• Sprint• Manish Mangal (now at Sprint PCS)
Page 5
University of Kansas
InfrastructureInfrastructure
Page 6
University of Kansas
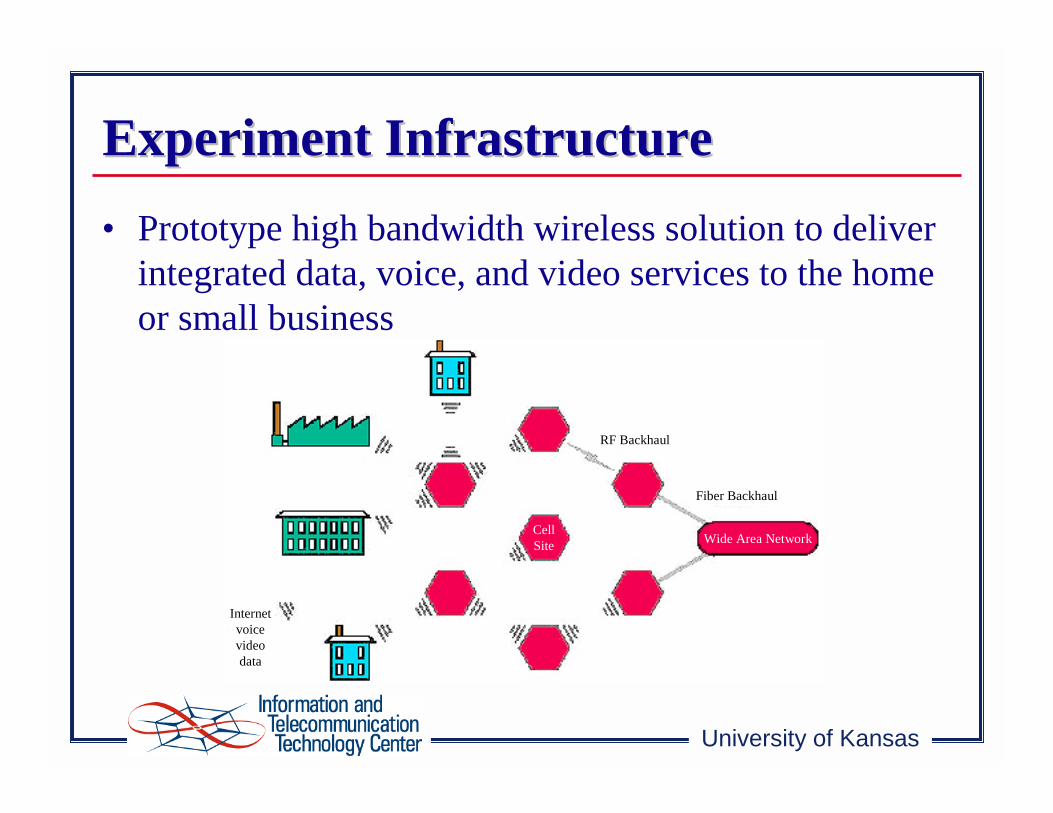
Internetvoicevideodata
CellSite Wide Area Network
RF Backhaul
Fiber Backhaul
Experiment InfrastructureExperiment Infrastructure• Prototype high bandwidth wireless solution to deliver
integrated data, voice, and video services to the home or small business
Page 7
University of Kansas
• Example wireless modem• AB-Access from Adaptive Broadband• 25 Mb/s shared per cellular sector in U-NII band• up to 256 users per sector• 3 km to 5 km range
Experiment InfrastructureExperiment Infrastructure
Page 8
University of Kansas
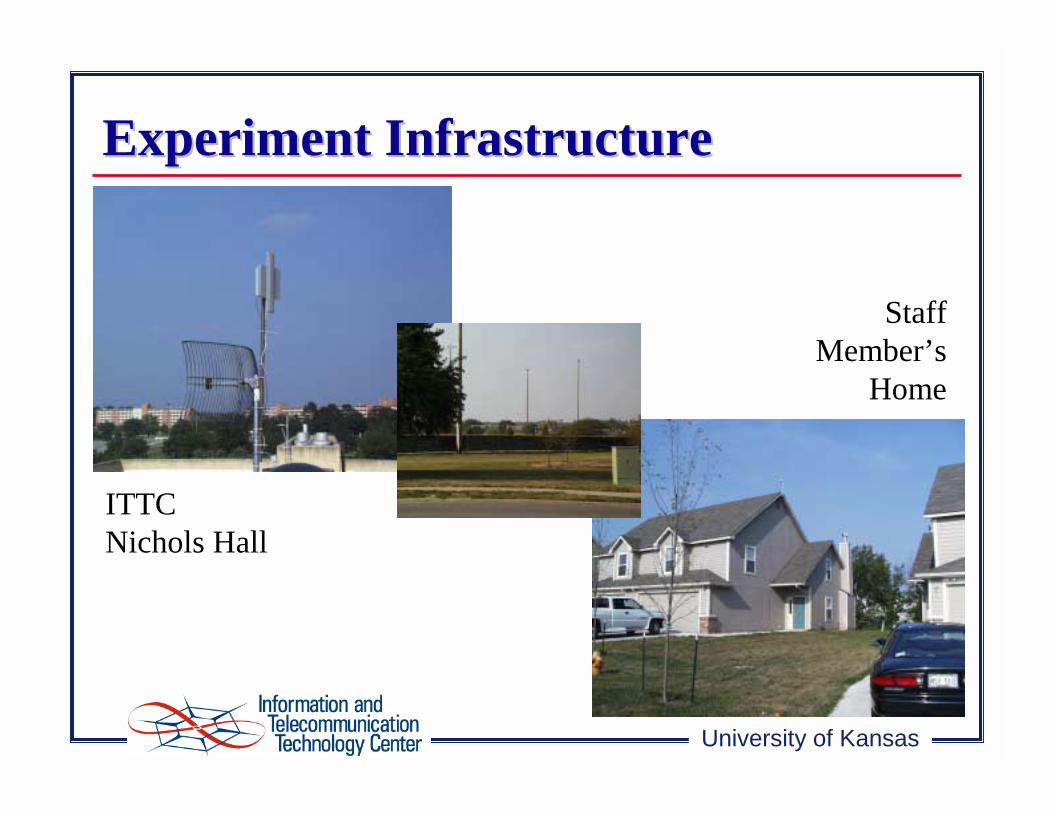
Experiment InfrastructureExperiment Infrastructure
ITTCNichols Hall
StaffMember’s
Home
Page 9
University of Kansas
Performance ExperimentsPerformance Experiments
Page 10
University of Kansas
Performance TestsPerformance Tests• Subscriber Unit (SU) #2 located 2.4 km from Access Point
(AP), SU #3 located 10 m from AP• NetSpec used to conduct measurement tests
• per-host as well as aggregate bandwidth measured• TCP streams used for tests
• Tests performed• flooding of link to determine maximum throughput• contention tests
Router APcontroller
Internet
SU modem
SU Test Host
VoIP gearAP modem
SU modem
SU Test Host
SU #3
SU #2
Page 11
University of Kansas
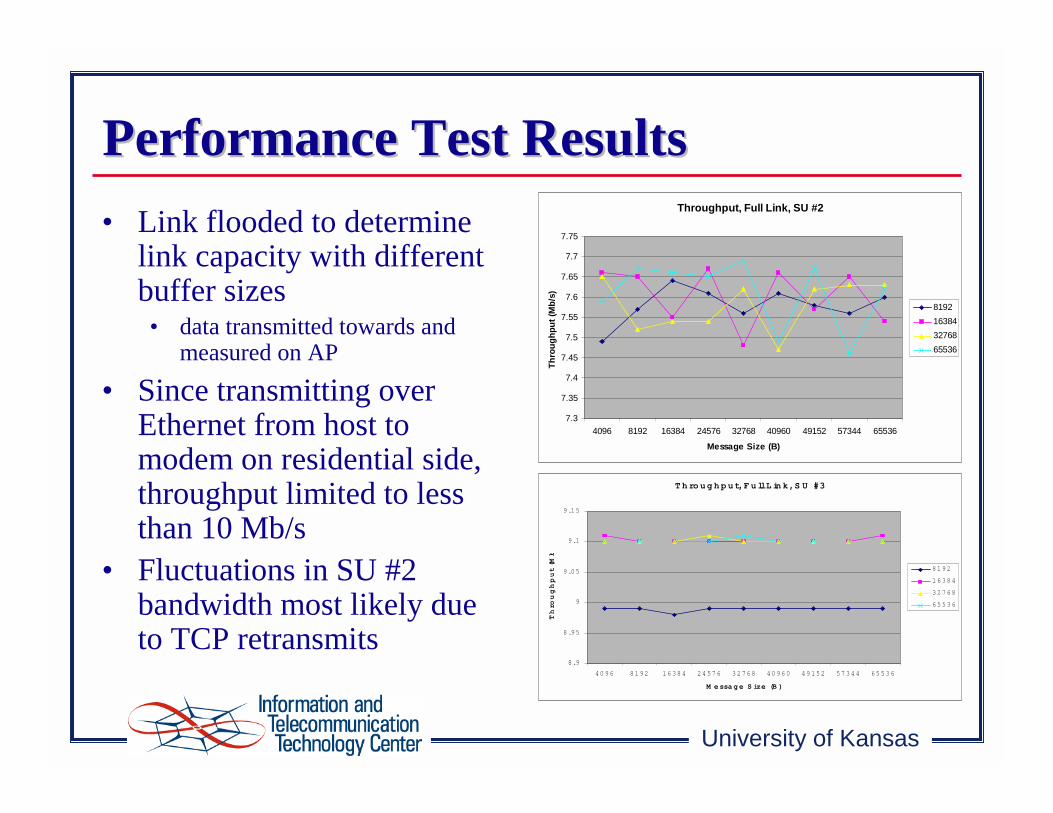
• Link flooded to determine link capacity with different buffer sizes• data transmitted towards and
measured on AP
• Since transmitting over Ethernet from host to modem on residential side, throughput limited to less than 10 Mb/s
• Fluctuations in SU #2 bandwidth most likely due to TCP retransmits
Throughput, Full Link, SU #2
7.3
7.35
7.4
7.45
7.5
7.55
7.6
7.65
7.7
7.75
4096 8192 16384 24576 32768 40960 49152 57344 65536
Message Size (B)
Thro
ughp
ut (M
b/s)
8192163843276865536
T h ro u g h p u t, F u ll L in k, S U #3
8.9
8.95
9
9.05
9.1
9.15
4096 8192 16384 24576 32768 40960 49152 57344 65536
M essage S ize (B )
Thro
ughput (M
b
8192
16384
32768
65536
Performance Test ResultsPerformance Test Results
Page 12
University of Kansas
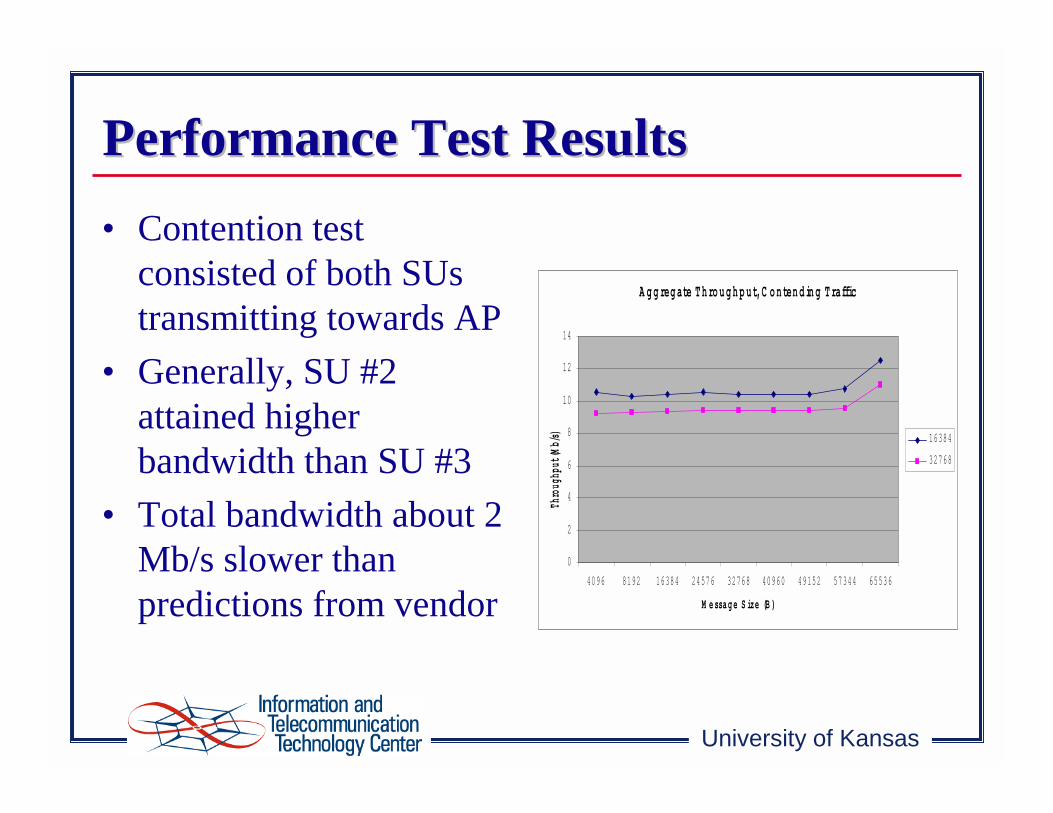
• Contention test consisted of both SUstransmitting towards AP
• Generally, SU #2 attained higher bandwidth than SU #3
• Total bandwidth about 2 Mb/s slower than predictions from vendor
A g g reg ate T h ro u g h p u t, C o n ten d in g T raffic
0
2
4
6
8
10
12
14
4096 8192 16384 24576 32768 40960 49152 57344 65536
M e ssag e S ize (B )
Thro
ughp
ut (M
b/s) 16384
32768
Performance Test ResultsPerformance Test Results
Page 13
University of Kansas
• Traffic sent from both sides of link between AP and SU #2
• Since transmitting over Ethernet from host to modem on residential side, throughput limited to less than 10 Mb/s
A g g re g ate Th ro u g h p u t, B id ire ctio n al Traffic
6.4
6.6
6.8
7
7.2
7.4
7.6
7.8
4096 8192 16384 24576 32768 40960 49152 57344 65536
M e s s ag e S ize (B )
Thro
ughp
ut (M
b/s) 16384
32768
65536
Performance Test ResultsPerformance Test Results
Page 14
University of Kansas
LongLong--term Monitoringterm Monitoring
Page 15
University of Kansas
LongLong--term Monitoring term Monitoring -- MotivationMotivation• Customers want stable, fast, and low delay TCP
connections• emerging always-on networks
• most traffic is TCP-based
• Software developed to measure, collect, and archive measurements on TCP connections
• New tool called “ConMon”
Page 16
University of Kansas
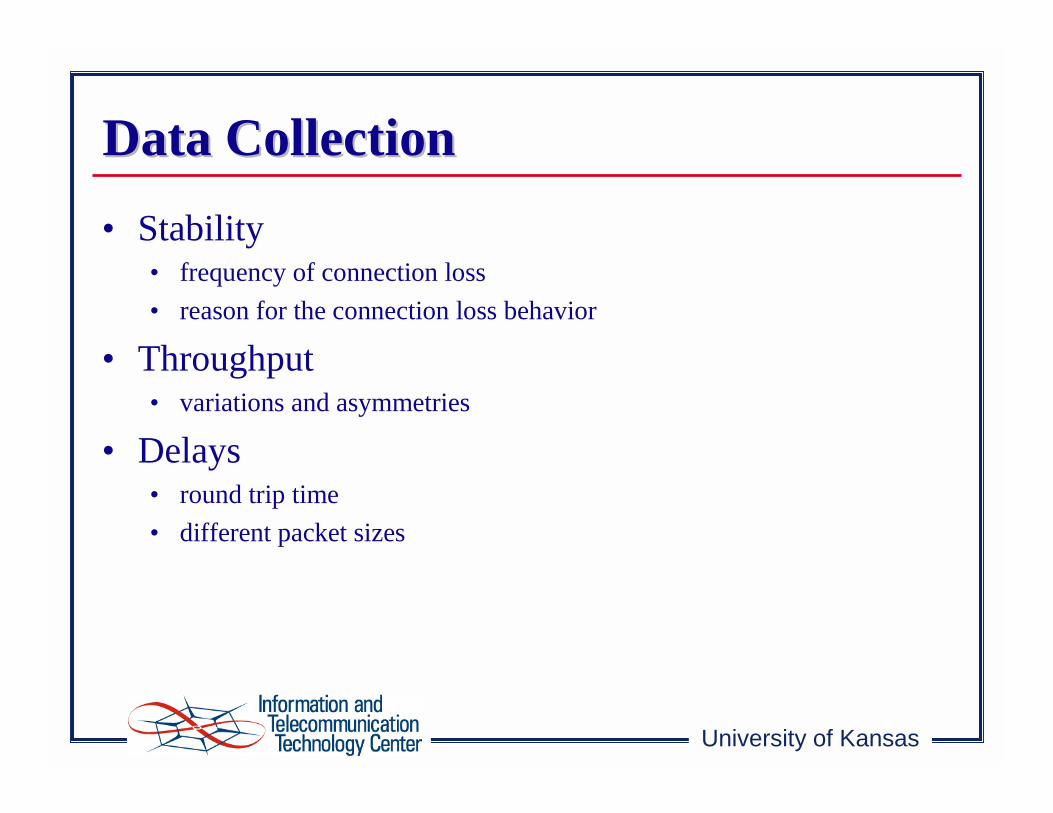
Data CollectionData Collection• Stability
• frequency of connection loss• reason for the connection loss behavior
• Throughput• variations and asymmetries
• Delays• round trip time• different packet sizes
Page 17
University of Kansas
ConMon Traceroute
Client 1
Client 2
Data Collection HostConMonProcess
ConMonProcess
TracerouteProcess
TracerouteProcess
TCP connections
ConMon ConMon -- Connection MonitorConnection Monitor
Page 18
University of Kansas
• Continuous monitoring• Measures connection stability, throughput and RTT• Client reconnects to server when connection drops• Excessive congestion results in a connection loss
• from an end-user’s perspective, long idle times • timers used to terminate a connection
• Traces the current path between the client & server• provides method to discern the reason for a connection loss
• Uses a plotter and table generator to display results
ConMon FeaturesConMon Features
Page 19
University of Kansas
• Server runs on a central data collection machine• Maintains information about parameters to use
• packet size, frequency of transmission, number of packets/sample etc...
• Clients connect to the server• Server notifies traceroute daemon• Connection is monitored from both ends• Client or server performs throughput measurement
ConMon OperationConMon Operation
Page 20
University of Kansas
• Modified version of the popular traceroute• Notified by ConMon daemon about client status
• starts monitoring the path when client connects• stops after a timeout when a connection is lost
• Maintains a file containing number of hops, hop at which route changed and time
• File updated on observation of route change or hop unreachable
ConMon Traceroute FacilityConMon Traceroute Facility
Page 21
University of Kansas
• Did not have throughput and traceroute features• Initial results - connection very unstable
• approximately 4-5 losses per day• round trip times varied widely
• Problem rectified• radio’s were operating on an indoor channel• reconfigured both the SU and the AP for outdoor testing
Preliminary ResultsPreliminary Results
Page 22
University of Kansas
• Connection more stable after reconfiguration• around 1-2 drops per day
• Simultaneous throughput tests using NetSpec• connection drops increased due to link saturation• loss rate increased as observed using mtr
• Tests also performed on cable modem network
Preliminary ResultsPreliminary Results
Page 23
University of Kansas
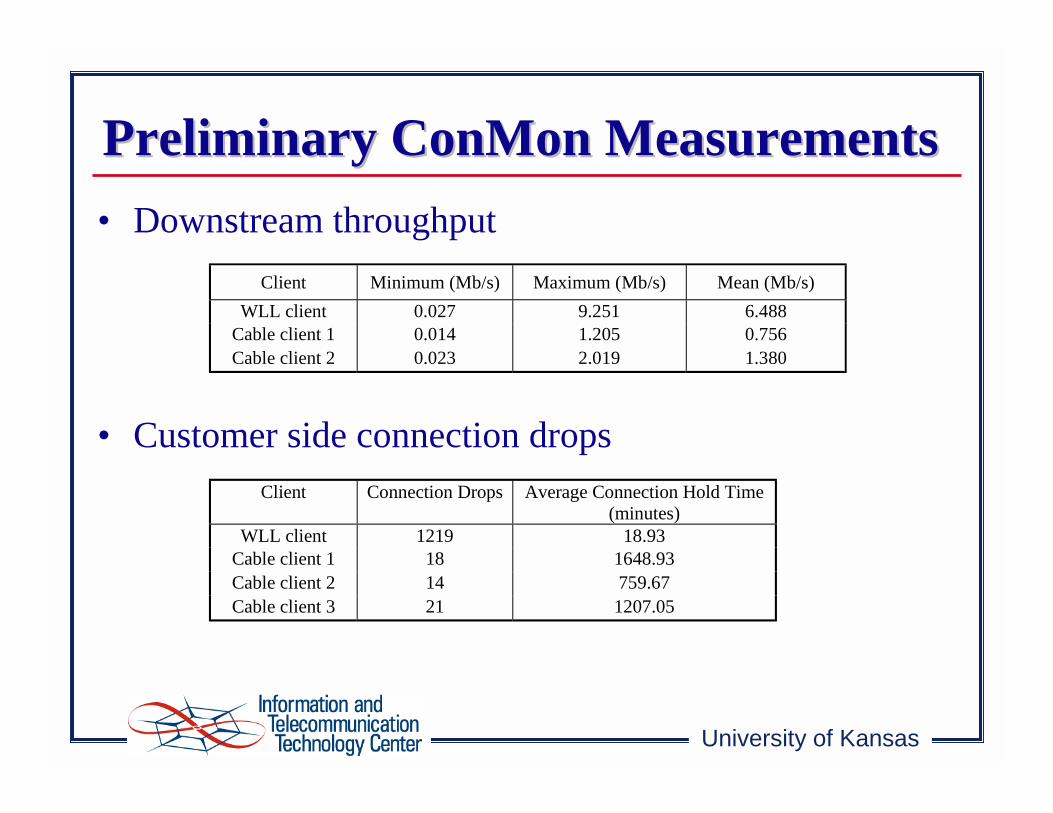
• Downstream throughput
• Customer side connection drops
Preliminary ConMon MeasurementsPreliminary ConMon Measurements
Client Minimum (Mb/s) Maximum (Mb/s) Mean (Mb/s)WLL client 0.027 9.251 6.488
Cable client 1 0.014 1.205 0.756Cable client 2 0.023 2.019 1.380
Client Connection Drops Average Connection Hold Time(minutes)
WLL client 1219 18.93Cable client 1 18 1648.93Cable client 2 14 759.67Cable client 3 21 1207.05
Page 24
University of Kansas
Media Access LayerMedia Access LayerPerformancePerformance
Page 25
University of Kansas
MAC Layer Evaluation MAC Layer Evaluation -- MotivationMotivation• Various MAC layer solutions offered by vendors• Compare different approaches to MAC layer
• media shared amongst customers
• Assess capability of MAC layers to provide particular services• basic best-effort Internet services• qualities of service or differentiated services
Page 26
University of Kansas
MAC Layer Evaluation StrategyMAC Layer Evaluation Strategy• Model components of typical broadband wireless
MAC layers• contention mode and data transfer mode
• Simulate using various traffic types• OPNET tool used with built-in traffic models• particular MAC layers modeled and tested
• Tested TCP applications running end-to-end
Page 27
University of Kansas
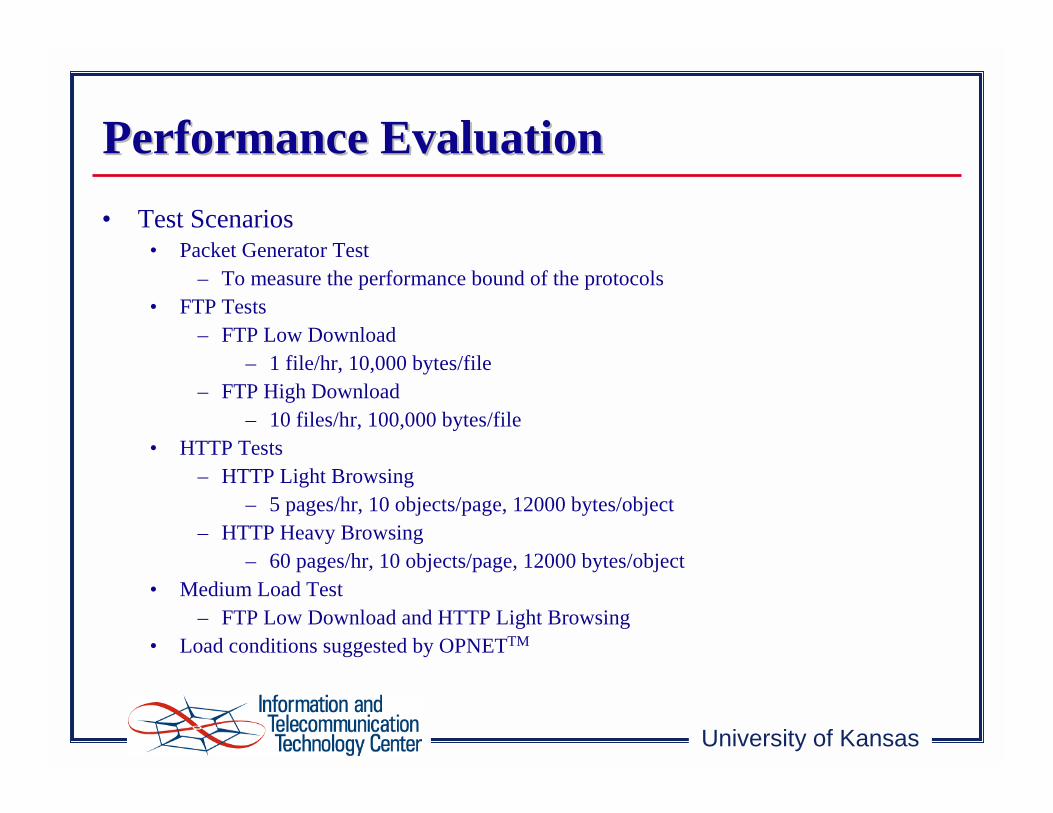
Performance EvaluationPerformance Evaluation• Test Scenarios
• Packet Generator Test– To measure the performance bound of the protocols
• FTP Tests– FTP Low Download
– 1 file/hr, 10,000 bytes/file– FTP High Download
– 10 files/hr, 100,000 bytes/file• HTTP Tests
– HTTP Light Browsing– 5 pages/hr, 10 objects/page, 12000 bytes/object
– HTTP Heavy Browsing– 60 pages/hr, 10 objects/page, 12000 bytes/object
• Medium Load Test– FTP Low Download and HTTP Light Browsing
• Load conditions suggested by OPNETTM
Page 28
University of Kansas
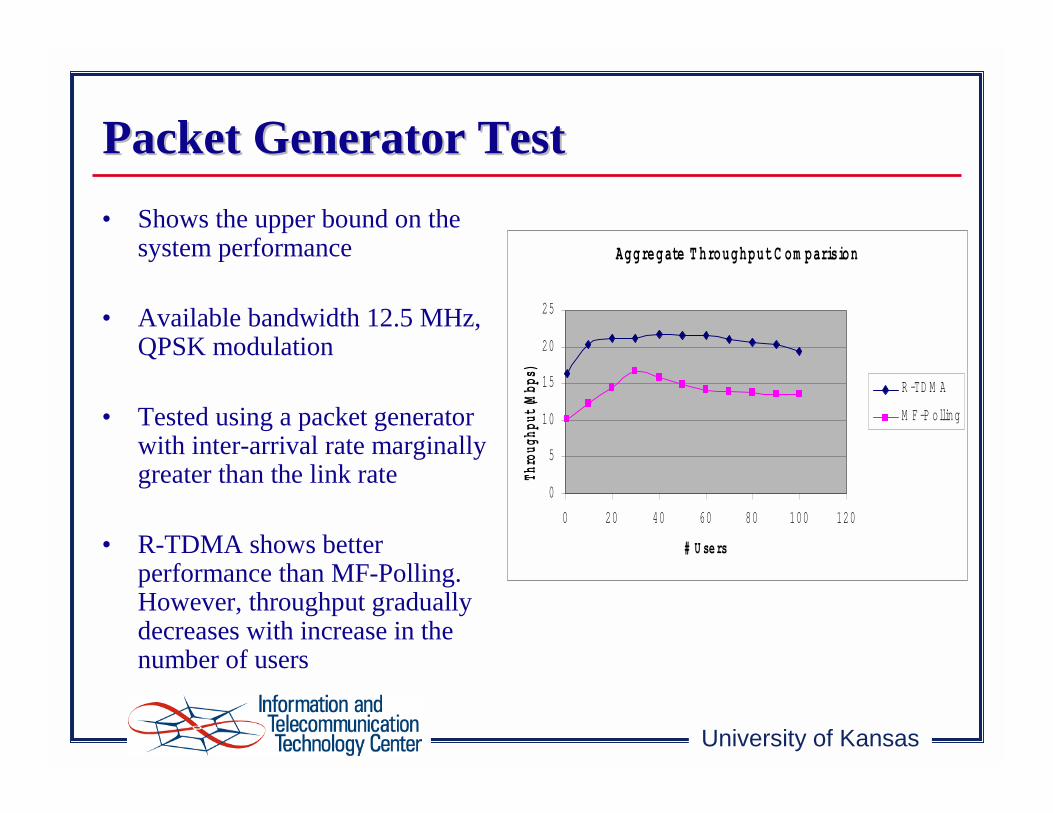
Packet Generator TestPacket Generator Test• Shows the upper bound on the
system performance
• Available bandwidth 12.5 MHz, QPSK modulation
• Tested using a packet generator with inter-arrival rate marginally greater than the link rate
• R-TDMA shows better performance than MF-Polling. However, throughput gradually decreases with increase in the number of users
Aggregate T hroughput C om parision
0
5
10
15
20
25
0 20 40 60 80 100 120
# U sersTh
roug
hput (M
bps)
R -TD M A
M F -P olling
Page 29
University of Kansas
Packet Generator TestPacket Generator Test• Devised a metric which
observes the product of number of users and throughput
• The MF-Polling system supports a large user population compared to the R-TDMA system
U ser-T hroughput P roduct C om parison
0
500
1000
1500
2000
2500
3000
0 50 100 150 200 250
# U sersUs
er-Thr
ough
ut P
rodu
ct
(use
r-Mbp
s) R -TD M A
M F -P olling
Page 30
University of Kansas
FTP Low DownloadFTP Low Download• Throughput degradation greater
for R-TDMA on account of high collision
• Light load conditions lead to lower throughput for MF-Polling
Aggregate T hroughput C om parison
0
200
400
600
800
1000
1200
0 10 20 30 40 50 60 70 80
# U sersTh
roug
hput (K
bps)
R -TD M A
M F -P olling
Page 31
University of Kansas
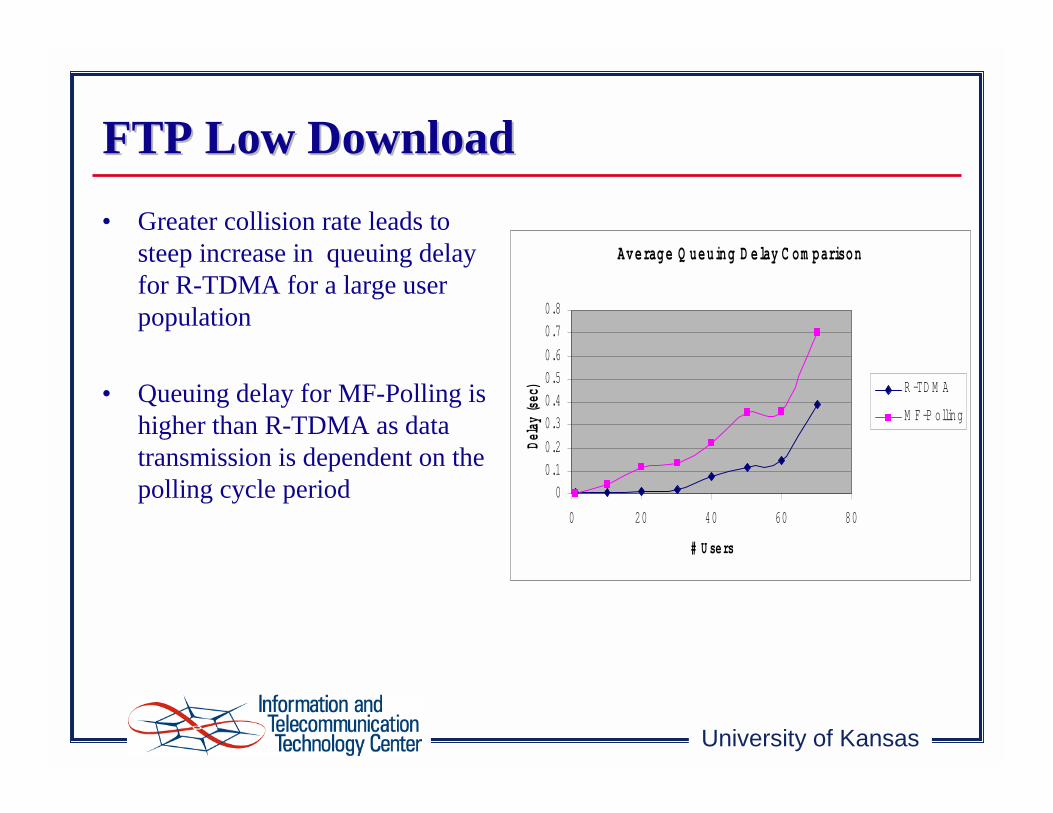
FTP Low DownloadFTP Low Download• Greater collision rate leads to
steep increase in queuing delay for R-TDMA for a large user population
• Queuing delay for MF-Polling is higher than R-TDMA as data transmission is dependent on the polling cycle period
Average Q ueuing D elay C om parison
00.10.2
0.30.40.50.6
0.70.8
0 20 40 60 80
# U sersDe
lay (sec
) R -TD M A
M F -P olling
Page 32
University of Kansas
FTP High DownloadFTP High Download• Gradual rise in throughput for
R-TDMA on account of reservation effect
• Large timeout value leads to lower contention for MF-Polling for higher number of users and thus performs better
Aggregate T hroughput C om parison
0
1000
2000
3000
4000
5000
0 20 40 60 80
# U sersTh
roug
hput (K
bps)
R -TD M A
M F -P olling
Page 33
University of Kansas
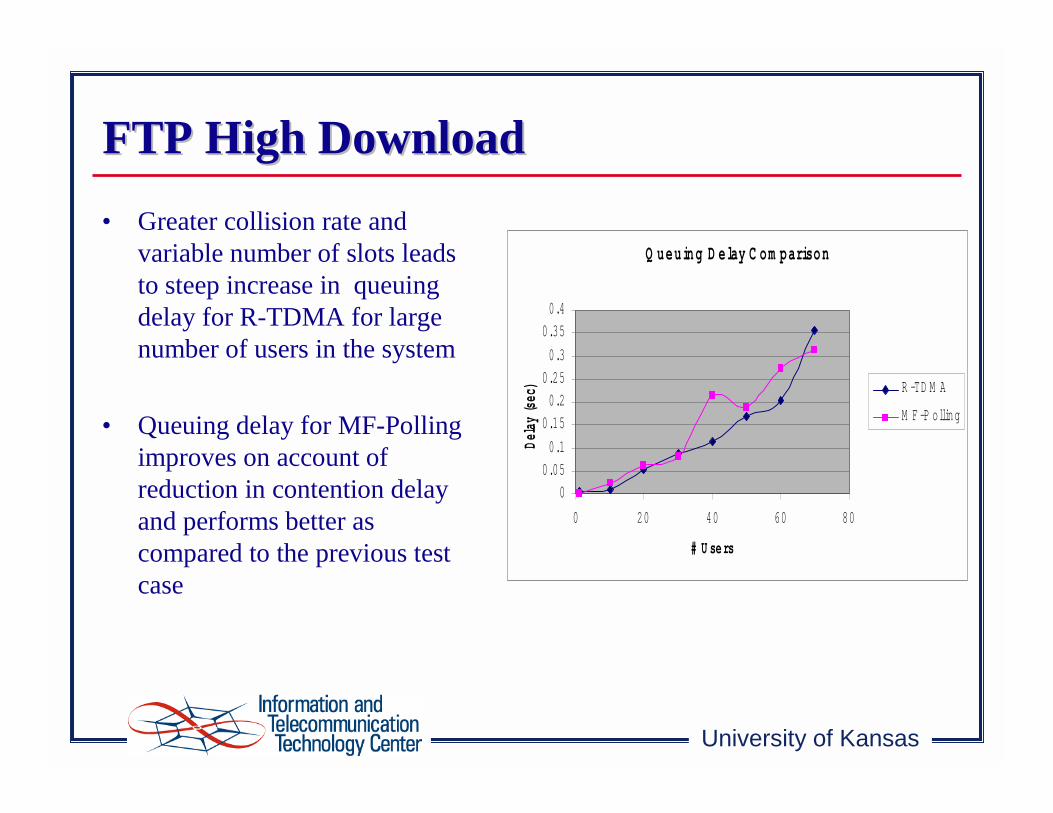
FTP High DownloadFTP High Download• Greater collision rate and
variable number of slots leads to steep increase in queuing delay for R-TDMA for large number of users in the system
• Queuing delay for MF-Polling improves on account of reduction in contention delay and performs better as compared to the previous test case
Q ueuing D elay C om parison
00.050.1
0.150.2
0.250.3
0.350.4
0 20 40 60 80
# U sersDe
lay (sec
) R -TD M A
M F -P olling
Page 34
University of Kansas
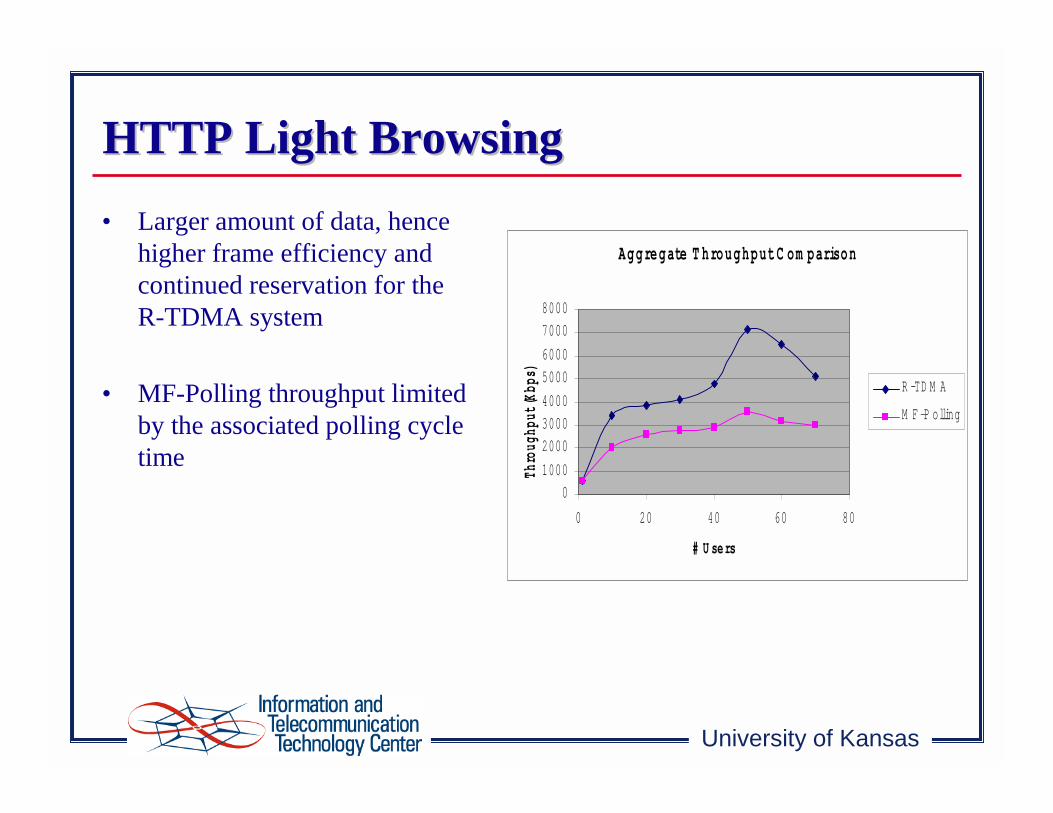
HTTP Light BrowsingHTTP Light Browsing• Larger amount of data, hence
higher frame efficiency and continued reservation for the R-TDMA system
• MF-Polling throughput limited by the associated polling cycle time
Aggregate T hroughput C om parison
01000
200030004000
50006000
70008000
0 20 40 60 80
# U sersTh
roug
hput (K
bps)
R -TD M A
M F -P olling
Page 35
University of Kansas
HTTP Light BrowsingHTTP Light Browsing• Reservation effect leads to
lower contention and lower queuing delay values for R-TDMA
• MF-Polling performance hampered on account of the large values of polling cycle time
Average Q ueuing D elay C om parison
0
0.05
0.1
0.15
0.2
0.25
0.3
0.35
0 20 40 60 80
# U sersDe
lay (sec
) R -TD M A
M F -P olling
Page 36
University of Kansas
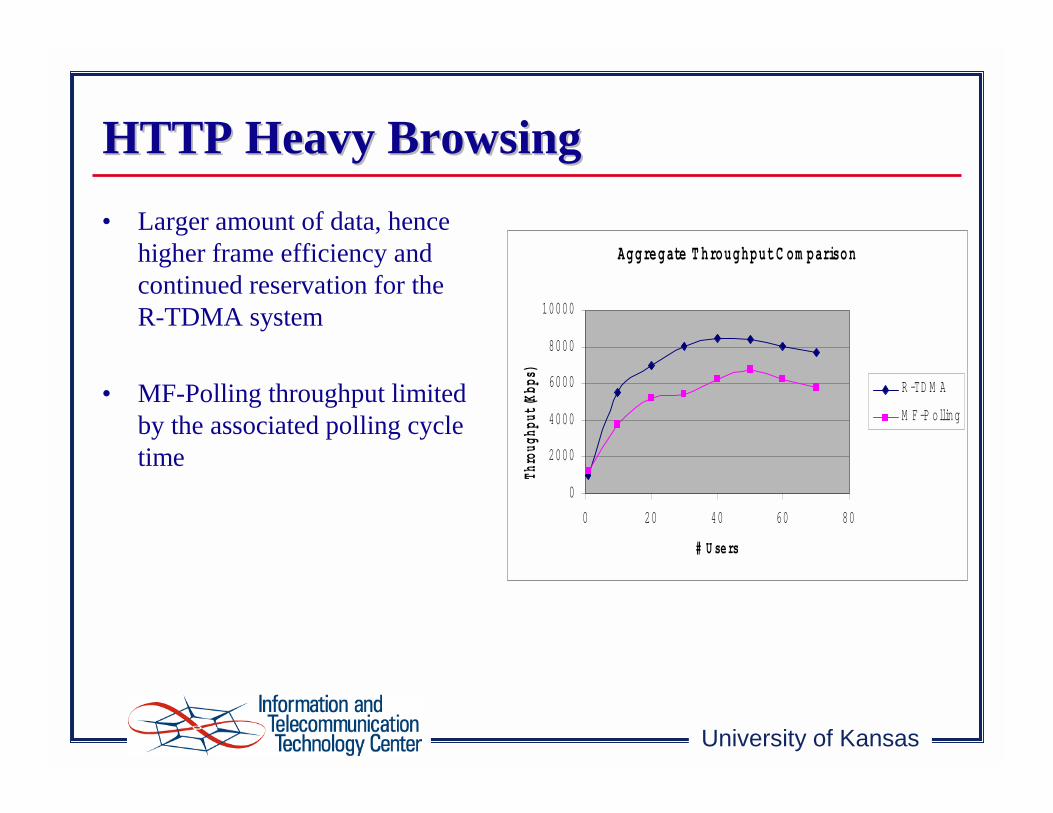
HTTP Heavy BrowsingHTTP Heavy Browsing• Larger amount of data, hence
higher frame efficiency and continued reservation for the R-TDMA system
• MF-Polling throughput limited by the associated polling cycle time
Aggregate T hroughput C om parison
0
2000
4000
6000
8000
10000
0 20 40 60 80
# U sersTh
roug
hput (K
bps)
R -TD M A
M F -P olling
Page 37
University of Kansas
HTTP Heavy BrowsingHTTP Heavy Browsing• Reservation effect in R-TDMA
leads to lower contention. However, prolonged reservation leads to high queuing delay comparable to MF-Polling
Q ueuing D elay C om parison
0
0.05
0.1
0.15
0.2
0.25
0.3
0.35
0 20 40 60 80
# U sersDe
lay (sec
) R -TD M A
M F -P olling
Page 38
University of Kansas
Medium LoadMedium Load• Combination of FTP Low
Download and HTTP Light Browsing
• MF-Polling throughput performance stable over a large range of users and hence can support a large user population
Aggregate T hroughput C om parison
0
1000
2000
3000
4000
5000
6000
7000
0 20 40 60 80
# U sersTh
roug
hput (K
bps)
R -TD M A
M F -P olling
Page 39
University of Kansas
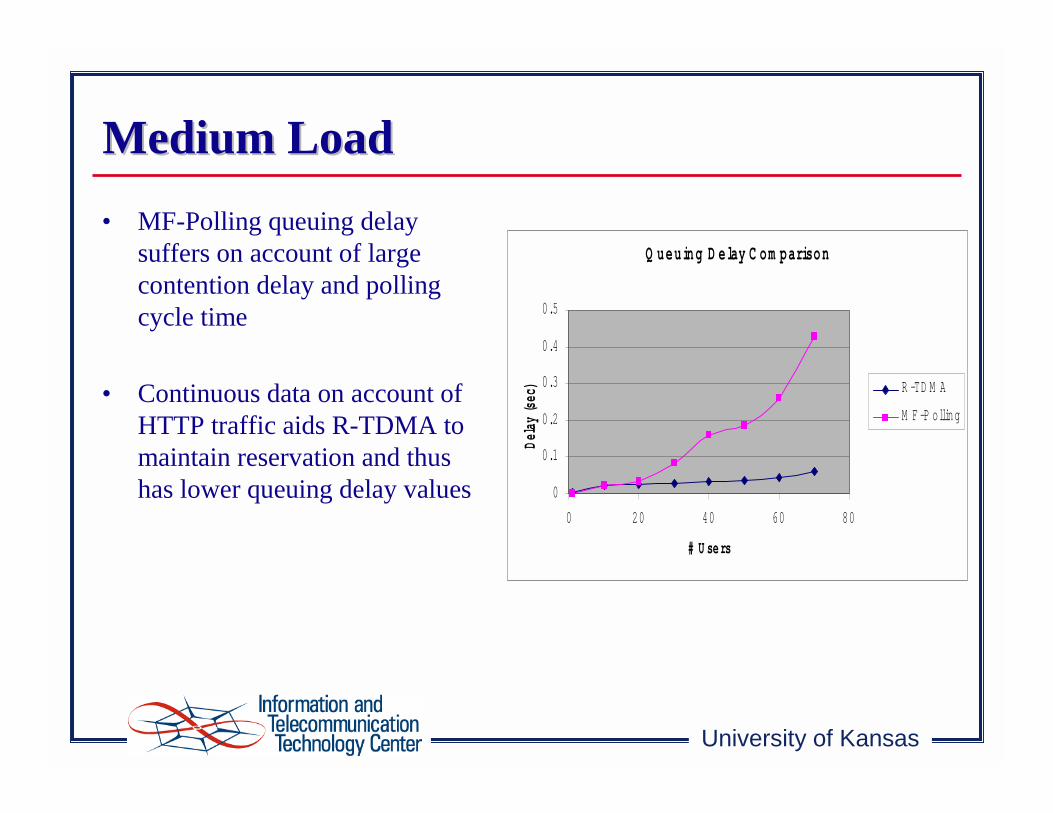
Medium LoadMedium Load• MF-Polling queuing delay
suffers on account of large contention delay and polling cycle time
• Continuous data on account of HTTP traffic aids R-TDMA to maintain reservation and thus has lower queuing delay values
Q ueuing D elay C om parison
0
0.1
0.2
0.3
0.4
0.5
0 20 40 60 80
# U sersDe
lay (sec
) R -TD M A
M F -P olling
Page 40
University of Kansas
Comparative ChartComparative Chart
Aggre ga te T hroughput Q ue uing De la y # Use rs S upporte d
T e st # Use rsP acket G enerator Low ( < 50) R -TD M A N /A M F -P olling
H igh (> = 50) R -TD M A N /AF TP Low D ow nload Low R -TD M A R -TD M A M F -P olling
H igh M F -P olling (R -TD M A ) R -TD M AF TP H igh D ow nload Low R -TD M A R -TD M A M F -P olling
H igh M F -P olling R -TD M A (M F -P olling)H TTP Light B row sing Low R -TD M A R -TD M A M F -P olling (R -TD M A )
H igh R -TD M A R -TD M AH TTP H eavy B row sing Low R -TD M A M F -P olling R -TD M A (M F -P olling)
H igh R -TD M A (M F -P olling) R -TD M AM edium Load Low R -TD M A R -TD M A M F -P olling ( R -TD M A )
H igh R -TD M A R -TD M A
Page 41
University of Kansas
Spectrum IssuesSpectrum Issues
Page 42
University of Kansas
Spectrum Issues Spectrum Issues -- Motivation Motivation
• Determine if it is possible to use a previously allocated frequency spectrum in a way that would not cause harmful interference to all other users in the area that use the same frequency
• Create a tool which will locate an adequate position for the access point in such manner that it does not cause interference, given that the data for the other antennas is provided
Page 43
University of Kansas
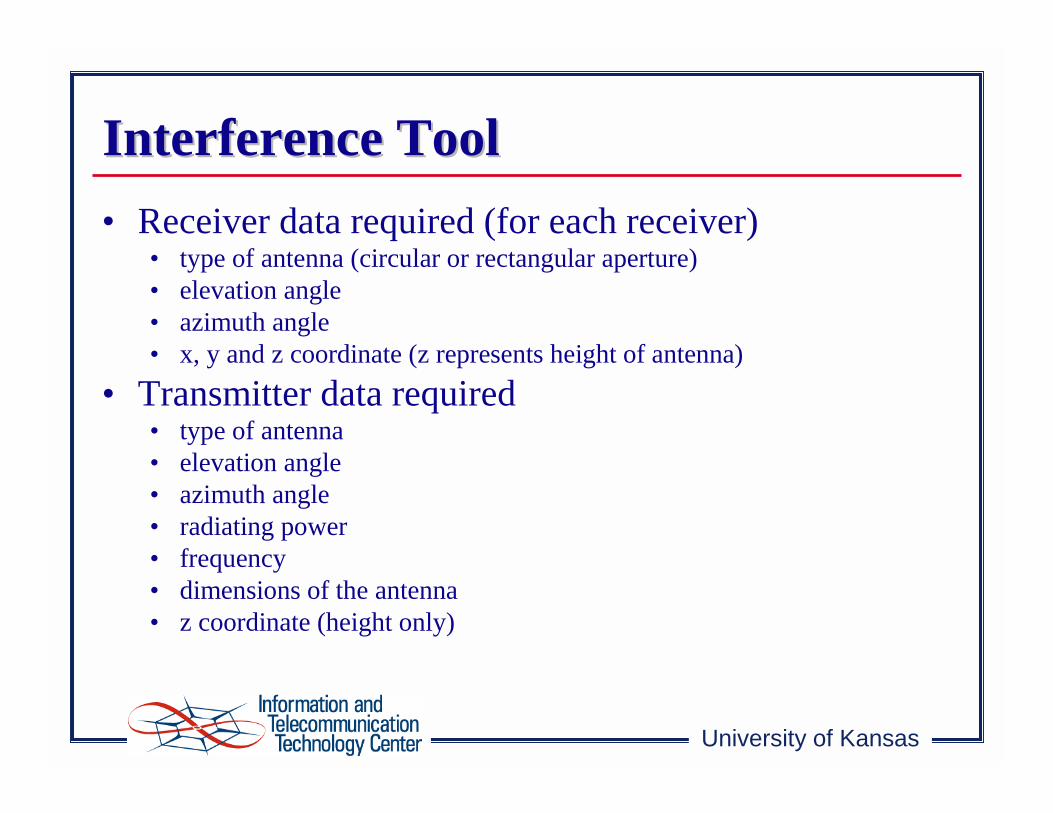
Interference Tool Interference Tool • Receiver data required (for each receiver)
• type of antenna (circular or rectangular aperture)• elevation angle• azimuth angle• x, y and z coordinate (z represents height of antenna)
• Transmitter data required • type of antenna• elevation angle• azimuth angle• radiating power• frequency• dimensions of the antenna• z coordinate (height only)
Page 44
University of Kansas
• Then moves transmitter to another location (x3,y3) and repeats
• Repeated for entire area of interest in the xy plane
• Procedure is repeated for each receiver
Interference Tool OperationInterference Tool Operation
(x3,y3,z3)
(x2,y2,z2)
(x1,y1,z1)
x3
y3
z3=z2
• Positions the transmitter on a certain location (x2,y2) and calculates the gains of the transmitter and the receiver in the direction of one another
• Using the two ray model, and desired interference level, calculates whether there is interference or not
Page 45
University of Kansas
Simulation ExampleSimulation Example• One AP and one satellite receiver in the area
• question - how close can the AP be placed, given that in the azimuth plane it always looks into the receiver?
• two simulation results, for different antenna heights
• Assumptions• AP antenna type is rectangular aperture• antenna type of the other users is circular aperture• harmful interference level is 1 dB
Page 46
University of Kansas
Simulation ExampleSimulation ExampleAP antenna height at 2 m
AP antenna height at 30 m
Page 47
University of Kansas
ConclusionConclusion
• Broadband wireless is a complex environment• service, link, and physical layer considerations
• Studying environment at different layers to insure that reliable and high performance services can be delivered