Broker RFP Results A review of the leasing services managed by the Department of Enterprise Services July 12, 2015 Contacts: Bob Covington, Deputy Director, (360) 407-9203 [email protected]Seth Wallace, Assistant Director, Real Estate Services (360) 407-8253 [email protected]
Transcript
Broker RFP Results
A review of the leasing services managed by the Department of Enterprise Services
July 12, 2015 Contacts: Bob Covington, Deputy Director, (360) 407-9203 [email protected] Seth Wallace, Assistant Director, Real Estate Services (360) 407-8253 [email protected]
TABLE OF CONTENTS EXECUTIVE SUMMARY Executive Summary ……………………………………………………………………………...1 BACKGROUND
Purpose and Scope of the Review ……………………………………………………………….3 Real Estate Services ……………………………………………………………………………...3 Current Organization Chart …………………………………………………………………….5
CURRENT SYSTEM
Roles and Responsibilities ……………………………………………………………………….7 Performance Monitoring ………………………………………………………………………..7 Leasing Process …………………………………………………………………………………..8
RESEARCH
Methodology ……………………………………………………………………………………...11 Broker Service Models within the Public Sector ……………………………………………....11 State of Florida Model …………………………………………………………………………...12 Findings …………………………………………………………………………………………...12 Challenges ………………………………………………………………………………………...13 Mitigations ………………………………………………………………………………………..14
PROCUREMENT PROCESS
Request for Proposals ……………………………………………………………………………17 Administrative Screenings ……………………………………………………………………....17 Phase 1-2 Evaluations and Results .…..…………………………………………………………18
Exhibit A – State Portfolios, Staffing Levels, Broker Services and Commissions …..………………….25 Exhibit B – List of Audits …………………………………..……………………………………….29 Exhibit C – Hourly Brokerage Company Rates …………..…………………………………………..30 Exhibit D – Potential Future RES Organization ……..……………………………………………….31
E
XE
CU
TIV
E SU
MM
AR
Y
EXECUTIVE SUMMARY
EXECUTIVE SUMMARY The 2011 law creating the Department of Enterprise Services (DES) directs the Office of Financial Management (OFM) to select up to six DES services for a review process to determine whether a program or service may be performed by the private sector in a more cost-efficient and effective manner. In 2014, OFM selected the Real Estate Services Division as one of the programs to be reviewed, narrowing the scope of the evaluation to the transactional function of the division, which includes leasing, design and planning. This report describes the development of the Request for Proposal (RFP), procurement and evaluation processes, and comparative financial analysis. In developing the RFP, the department studied the competitive procurement processes used by other states to contract for private sector assistance with real estate services, and the resulting contracts for broker services. DES incorporated best practices from mature broker programs, to include the use of a commission rate structure and the award of multiple contracts that support performance management of the contracted brokers and mitigate risk of a single firm. DES published the RFP on May 12, 2015. In order to ensure an “apples-to-apples” comparison with the costs of the current service, bidders were required to provide a flat fixed-rate fee and a commission-based fee for compensation. While DES has the option to select either compensation model, the department’s procurement approach was structured to make use of the commission-based fee model with the two top-scoring bidders. A pre-bid conference was held on May 27 to go over the RFP requirements and answer bidder questions. The procurement was closed on June 12, 2015. The procurement resulted in the receipt of four bids. Of the bids submitted, only two met the mandatory requirements of the procurement:
Jones Lang LaSalle (JLL) was the lowest priced bidder, proposing either an annual flat fixed fee of $2,460,000 or a commission rate structure resulting in an estimated $3,128,000 annual commission.
Royal Commercial Corp. proposed either an annual flat fee starting at $10,980,000 or a commission rate structure resulting in an estimated $22,904,000 annual commission.
To aid accurate comparison and to reduce decision risk, DES developed a standard approach and format to itemize and categorize costs when performing a cost analysis.
Page 1
The cost analysis shows a net increase in state costs of $1,615,974 per year if the service were contracted out to the lowest bidder’s proposed fixed-fee price. Details of the analysis can be found in the Cost Analysis Section.
Page 2
BA
CK
GR
OU
ND
BACKGROUND
BACKGROUND Purpose and Scope of the Review
Under state law (RCW 43.19.008), the Office of Financial Management (OFM) is directed to review the programs and services that are performed by the Department of Enterprise Services (DES) to determine whether a program or service may be performed by the private sector in a more cost-efficient and effective manner. Up to six activities and services may be selected by OFM for review each biennium until 2018. In 2014 OFM recommended that DES conduct a competitive procurement process to obtain bids from the private sector for real estate leasing services. OFM determined that the scope should be narrowed to the transactional activities involved in leasing new space or renewing existing leases. Buying and selling state property, another service provided by DES, was not considered for contracting out. DES used a competitive procurement process to determine if the work can be done at less cost and greater efficiency by the private sector. On May 12, 2015, DES issued an RFP with June 12 set as the deadline for submittals. Real Estate Services
The DES Real Estate Services Division manages nearly 700 leases covering nearly 10 million square feet of office, retail, warehouse, classrooms, land and other specialty space for $13.4 million in monthly base rent. These leases serve the needs of 108 state agencies, boards, commissions and community colleges, located in 37 out of the 39 counties in the state. The division is responsible for acquiring, leasing and disposing of real estate for state agencies. It supports the business needs of state agency customers by providing real estate portfolio management, transactional and planning and design services through a collaborative relationship while ensuring quality, efficiency, and cost control. The division’s legal authority, functions and duties are defined in RCW 43.82.010. The division’s services include:
Comprehensive leasing services including new transactions, renewals and extensions, and amendments
Acquisition and disposition of real property
Design, space planning, architectural services and construction supervision
Consulting and technical assistance, including project planning, problem resolution, financial analysis and more
Page 3
The division is funded through several different fees. All leasing and design services requested for new leases are funded through a project-based fee. The fee is based on the square footage of the space requested:
Projects involving 5,000 square feet and under are generally reimbursed at an hourly rate of $117.00 per hour.
Projects involving more than 5,000 square feet are charged a commission rate of 2.5% of the total value of the lease.
Renewal services are funded through an allocation to agencies known as the Lease Renewal Services fees. This allocation is based on a formula related to an agency's inventory of existing active leases, total square footage and lease value at biennial budget preparation.
The division has 22.75 FTEs and a biennial budget of $7.2 million. Most of the staff works at the 1500 Jefferson Street Building on the Capitol Campus, but the division has a four-member team assigned to work with the Department of Social and Health Services (DSHS); two are based at DSHS headquarters and one works at a DSHS office in Spokane and another in Seattle. There are three operating units, in addition to administrative and management staff. The division’s leasing unit is responsible for handling the state agency leasing transactions, including the procurement of space, lease negotiation, lease administration, and dispute resolution. The design unit is responsible for architectural and space design for leased facilities, including building design for lease/development projects. It produces specifications that set the quality for leased space. In addition, the unit provides construction project management, accessibility and energy assessment, and technical and programming assistance. The unit is occasionally asked to help resolve landlord performance issues when agencies are impacted by ongoing deferred maintenance or building condition issues. Another unit manages the acquisition and disposal of real property for agencies, boards, commissions and education institutions. The service covers negotiations, appraisals, environmental studies, surveys, easements and title review.
Page 4
Current Functional Organization Chart
Real Estate Services Mgr.
RE Design Manager
Contract Specialst 1
Property Specialist –Leasing, Acquisition
& Disposal
Contract Specialist 3
Facilities Senior Planner
Quality Assurance Mgr
DSHS Embedded Team Supervisor
Admin Assistant
Senior Planner
Senior Planner
Senior Planner
Leasing Agent
Leasing Agent
Leasing Agent
Leasing Agent
Architect
Architect
Architect
Planner
Planner
Planner
#1 ‐Existing
Real Estate Operations Manager
‐Supports DSHS facility planning ‐Leases space for
DSHS
‐‐Develop space plans/ oversee construction‐‐Manage consolidations and solicitations
‐Manage RES program‐Manage budgets‐Leasdership / high risk projects
Page 5
Page 6
C
UR
RE
NT
SY
ST
EM
CURRENT SYSTEM
CURRENT SYSTEM Roles and Responsibilities in the Current System The state’s system of real estate management is comprised of three major elements:
1. Department of Enterprise Services: Under state law (RCW 43.82.010), the department is authorized to provide real estate services to state agencies, commissions and educational institutions. Some agencies have their own statutory real estate authority [RCW 43.82.010(13)]. DES’ Real Estate Services (RES) Division is responsible for leasing and architectural services (including construction management), acquisition or disposition of state‐owned properties, and other real estate transactions. Facilities acquired are expected to conform to facility efficiency standards developed by DES and approved by OFM.
2. Office of Financial Management: OFM provides oversight to real estate procurement and management by applying a statewide perspective to analysis, long-term planning, policy development and state facility portfolio management.
3. Client Agencies: The division provides services to approximately 108 state entities. The use of real estate services provided to client agencies varies. Below are some examples of that variation:
The Department of Social and Health Services (DSHS) is the division’s largest customer representing about 40 percent of the leased portfolio. As a result, RES has leasing and planning staff embedded with this agency to provide more effective service.
Some agencies have their own facility managers, planners, and architects on staff. Agencies like the departments of Corrections, Employment Security, Labor and Industries, and Social and Health Services have larger portfolios with more specialized space requirements. Agency facility staff collects agency programmatic information, develops space plans, and coordinates deployment of furniture, fixtures, and equipment in support of their agency moves. They also directly engage vendors that provide telephony, cabling and other facility services.
Agencies with fewer space demands and more general office and warehouse space needs typically rely more on RES to provide all services related to leasing and design.
Performance Monitoring
RES uses the measures described below to monitor its performance. These measures are common in the real estate industry and are used by other states. Key Performance Indicators (KPIs) were included in the RFP and based in part on a review of the experiences of other states that have private broker contracts.
Page 7
o Timeliness KPI = renewals executed 60 days or more before the lease expiration. The transaction unit needs to enter into negotiation early enough not to lose leverage with the landlord for a robust negotiation.
o Competitive Lease Rates KPI = renewal rates compare favorably to market rents. o Budget KPI = lease rates are at or below budgeted rent in OFM’s enacted Six-Year Facilities
Plan.
New Lease: o Timeliness KPI = beneficial occupancy 30 days before lease commencement. o Budget KPI = lease rates are at or below budgeted rent in OFM’s enacted Six-Year Facilities
Plan and approved Modified Predesign.
Space Management: o Track quantifiable savings through improving space efficiency. o Record with each transaction compliance or non-compliance with space standard.
Energy Efficiency: For any facility with an U.S. EPA Energy Star program score lower than 75, document the landlord’s proposed measures to comply with state law (see RCW 19.27A).
Customer Service Surveys: DES has a commitment to providing exceptional customer service in all its programs. RES began conducting customer surveys after the completion of each project. Although the rate of return of these surveys does not provide a statistically significant set of data, the results did shed light on a number of process elements, such as timeliness in the completion of projects. The surveys, along with customer focus groups feedback, led to process improvement initiatives in how the division manages lease renewals and the leasing of new space.
Current Leasing Process
Each lease transaction may have varying levels of complexity. Some transactions may include multiple state agency leases, some with unique timing, varying budgetary constraints, and the need to relocate occupants within a building to reduce vacancy from time to time. These transactions require careful coordination among agencies to ensure ongoing business activities are not interrupted. Some may also require short-term extensions of existing leases as well as subleases with non-agency partner organizations.
Renewing or leasing new space takes between 18 to 24 months. Participants include the landlord, tenant agency, RES, and, at some level, the Attorney General’s Office and OFM. The leasing process for renewals and new space follow slightly different processes that include:
project initiation
project scope definition
project charter development to incorporate scope, budget and timelines
solicitation, if new space (RFP process or market search for new leases)
Page 8
Renewals:
proposal evaluation and site selection
negotiation of terms and lease document
lease approval and execution
space planning
evaluating tenant improvement budget
overseeing construction and/or build‐out of space
coordination between landlord and agency for move-in.
Page 9
Page 10
RE
SEA
RC
H
RESEARCH
RESEARCH
Methodology In developing the RFP, the department studied the competitive procurement processes used by other states to get private sector assistance with real estate services and the resulting contracts. RES interviewed states that contract for private broker services and some that do not. The department also asked the National Association of Facility Administrators (NAFSA) to distribute a survey to its state members with questions, about the size of their leased portfolio, if a broker contract is in place, the scope of broker services, how broker services are being used, the challenges faced and how these were accommodated, if at all. Broker Service Models within Public Sector
The scope of services for real estate broker services by states can be divided into three basic models:
1. Outsourced Service Model: An approach that replaces some or most in-house staff with external brokers to perform a range of real estate activities. The only states in our research that started with that approach were Florida and Michigan.
Michigan’s outsourcing was a result of a severe economic downturn that led to a reduction of central service staff. This forced the state to contract for broker services to surplus properties and close sites.
Florida eliminated all but two central service staff in 2004 and contracted with a single brokerage firm that worked directly with tenant agencies. However, Florida has since moved back to a more centralized model with brokers supporting both strategic and transactional work alongside of in-house staff. The Florida transactional staff now includes six leasing liaisons and eight design and planning staff covering a leased portfolio of 7.7 million square feet.
Research did not identify any states that currently employ this outsourced model.
2. Narrow Supplemental Service Model: This model provides a pool of qualified brokers in select areas of the state who provide transactional services only. Colorado and Georgia use this model, supplementing in-house real estate staff with private sector brokers in major metropolitan areas.
3. Comprehensive Supplemental Service Model: These contracts build on not only a transactional work scope for brokers but add strategic portfolio optimization and leasing strategies. For example, Florida and New York have or are increasing the level of occupancy within owned buildings while reducing the leased footprint based on optimization studies produced with the help of brokerage firms.
Page 11
State of Florida Model
The state of Florida has had broker contracts in place since 2004 and has one of the most mature broker programs. As a result, RES delved more deeply into how Florida structured its RFPs: studying closely the scope, multiple contracts, commission cost modelling, lessons learned in the procurement process, implementation, and management of the contracts. This influenced nearly every aspect of the RFP developed by DES. Other states reviewed include:
Colorado
Georgia
Illinois
Minnesota
Michigan
New York
Oregon
Tennessee
Virginia
West Virginia DES also researched how the federal General Services Administration uses private broker services. Findings from Other States1
The research into the broker models used by other states turned up a number of key findings, including:
Most states used broker contracts to supplement the activities of their in-house real estate division.
When asked about the impact of adding broker services to existing staff levels, state real estate department heads said they did not reduce staff. In addition, these states have higher staffing levels relative to the size of their leased portfolio compared to the size of the leased portfolio RES manages for the state of Washington.2
Some states use brokers only in large metropolitan areas where a broker is more likely to provide value due to their knowledge of the market and landlords are more apt to plan for commissions.
Many broker contracts included additional activities, such as leasing strategy plans, portfolio optimization, evaluation of property condition, and facilities management.
All of the contract examples reviewed relied on commission-based compensation for the contractor.
1 See Exhibit A - Matrix of Broker Services by State for more detailed information. 2 See Exhibit A.
Page 12
Some states provided design services using in-house staff; other states used a mix of in-house design staff and planning staff provided by landlords for new leases.
Outsourcing Challenges Identified
Research into other states’ contracting experiences of identified significant risks and challenges, as well as important mitigation strategies. These were highlighted in the results of a number of audits conducted by states of broker activities.3. The risks include:
State loses leverage: Without sufficient state oversight and controls, brokers may focus on completing transactions quickly and not strike a deal that is in the best interest of the state. For example:
o Lease length - Leases longer than five years in length earn brokers a higher commission than on a shorter term. Though a ten-year lease may be needed in transactions with a high tenant improvement cost, this practice, if not used properly, can earn brokers high commissions but lock in rent rates at the top of the market for longer than five years. Florida experienced this early using a single broker contract.
o Timeliness of leases - RES begins lease renewal activities 24 months before lease expiration to ensure negotiation leverage isn’t lost. The ability to negotiate a good lease rate could be lost if brokers, who proposed 12-18 months lead times, do not negotiate leases in a timely manner with agencies which generally require more lead time for decision making.
Misaligned Performance Incentives: Performance management objectives for private
commission-based contractors differ from those established for a state program.
o Brokerage firms in some states touted “savings” based on a comparison of the current rents negotiated as compared to the rent in the previous lease term. If lease rates in the previous term occurred at a high in the real estate cycle, this method will overstate cost avoidance.
o Standards to optimize space efficiency of workspace may be a low priority. Unless the state provides incentives, private brokers may have little motivation to reduce space when paid by commission.
Learning Curve/Contractor Availability: State government requirements differ
significantly from the private sector and some states have found the costs for training, potential loss of productivity during transition, and performance management issues have been significant. For example:
3 See Exhibit B-List of Audits
Page 13
o Several states and GSA4 found that ongoing training of brokers consumes significant time. Statutory and policy requirements for housing standards, competition, documentation and collaboration are more stringent in government than in the private sector. Also, individual brokers often switch firms so that the turnover in personnel requires ongoing training.
o State agency facility needs (siting, space requirements dictated by mission) can be complex and require extensive time to understand.
o Some states, such as Florida, experienced performance issues with a single broker contract. Having outsourced much of its staff, the state lacked in-house real estate resources or a second vendor to fall back on when problems arose. Florida found that the costs of rebid and continuation of services until a replacement occurs can be high.
Transfer of Costs: The experience of other states demonstrated that costs were shifted or
transferred rather than saved. For example:
o When Florida outsourced its centralized real estate activities, it eliminated most of its in-house real estate division in its central service agency. However, that led state agencies to hire their own facilities and real estate staff to work with the broker. Agencies failed to ask brokers for market information for each transaction to ensure that lease rates negotiated are at or below “market”. Key performance indicators were not tracked by agencies. As a result, leases negotiated were not always favorable to the state.
o Brokerage firms sometimes argue their services can be provided at ‘no cost’ to the state because landlords pay commissions. However, if not effectively managed, there is a loss of transparency and the costs of commissions can be added to the rent paid by tenant agencies.
State Liability: State standard lease language is necessary to preserve safeguards that protect
against liability. Processes needed to ensure such protections are not jeopardized.
Underestimating Workload: The state of Washington has a significantly larger and more geographically dispersed leased portfolio than other states. Bidders may underestimate the complexity of the portfolio and of state government rules and policies. If so, the work scope and the fees associated with it may be understated, creating a risk of contract dispute.
Mitigation of Risks
To mitigate some of the identified risks and challenges, RES took the following steps: 4 GSA July 15, 2009 Report to the House of Representatives-- “lease contracting is regulated by over 48 different laws, regulations and executive orders that make an acquisitions process-driven and documentation intensive compared to private sector commercial real estate deals. Documentation is necessary to avoid costly protests and litigation, comply with internal controls and achieve clean audits. The brokers have had to essentially learn to speak a new language.”
Page 14
Clearly defining the required scope, deliverables and tasks in a way that ensures comparability with the current RES processes.
Clearly defining the size, value, geographic distribution and complexity of the portfolio, and customer base. Brokerage firms are often concentrated in larger cities whereas the state’s portfolio is more diverse and scattered throughout the state.
Providing the bidders latitude to propose a different process if it is believed to be more efficient and effective.
Requiring bidders to provide detailed responses on how they would provide state-wide services, whether by their firm or through the use of subcontractors, in order to assess ability and competiveness for coverage.
Establishing appropriate performance metrics that are measurable and can be monitored and tracked.
Allowing for multiple awards to mitigate risk, promote competitive pricing and incentivize performance.
Including a list of relevant laws, regulations and policies that brokers must observe.
Devising a cost and compensation model that would allow effective comparison between the current RES service delivery and that of a bidder on an apples-to-apples basis.
Developing a method for both quantitative and qualitative evaluation of proposals.
Ensuring that bidders understand the need and expectation for transition planning and ongoing training.
Including numerous, specific review checkpoints to ensure that the services provided match the required deliverables and comply with executive orders, laws and policies, and sustain a level of service to OFM and agencies.
Requiring the ability to collect and analyze the data needed to make better decisions in managing the portfolio, including baseline information on the space allocation and utilization metrics, energy usage, etc.
Comprehensiveness: The RFP scope of work was limited to the specific services being considered for contracting out. DES wanted to be confident that brokerage firms did not underestimate the complexity of the work and the needs of the customers. Therefore, RES provided a detailed description of its current work tasks, deliverables and processes. The RFP tasks/deliverables describe in detail the services needed for each transaction type, including architectural space planning and construction oversight for new space or renewal transactions.
Page 15
However, bidders were also encouraged to propose an alternative methodology for meeting service objectives, as long as it complied with state statutes, executive orders and policies.5 The RFP also identified the transactional lease services that would be specifically provided by the bidder and administrative lease services that would be performed by the RES’ administrative and contract management group. Multiple Contract Awards: The state of Washington’s portfolio is broad in terms of size of space, types of space and where the space is located. The portfolio covered by the RFP is statewide – unlike RFPs released by some states – covering 37 of 39 counties. This diverse portfolio can result in varying degrees of interest by the brokerage community as to service delivery in some locations. Florida started with one brokerage firm, but discovered that when the service or coverage level was poor, state agencies did not have an alternative. As a result, Florida determined that competition among multiple contractors could improve performance as well as coverage. Florida’s next broker procurement awarded two contracts. This allows Florida to assign work to the best performing contractor(s). Florida officials said that this approach has led to better service and lower rent rates. With that in mind, the RFP developed by RES was framed around the award of up to two brokerages, giving the state the option of selecting either for specific transactions. The RFP relied on multiple broker awards as the primary means of contract performance management. Given the proposals received, it is unlikely RES could award multiple contracts and would need to seek ways to mitigate this risk as part of any contract negotiations. Bid Cost Comparison: The current funding for RES is a mix of fixed allocation to agencies, hourly fee and commission. The division’s renewal activity is funded through a fixed allocation to agencies. RES charges a fixed hourly fee of $117 per hour or a two-and-half percent commission for larger new space projects.6 While the predominant practice in the real estate industry is the use of commission pricing, RES required bidders to submit both fixed-price and commission-based price proposals to aid in evaluation of costs and to offer alternative models for consideration. In the market, commissions are most commonly paid by landlords. As a result, brokerage firms sometimes contend that their services can be provided at ‘no cost’ to the state. However, in some circumstances, these costs are included in the rent prices paid by tenant agencies. For this reason, the RFP assumes commission fees to be paid by RES.
5 More than one state reported that brokers often are not familiar with state statutes that govern leasing activities. This can result in rework for brokers and added oversight by in-house staff. A list of the applicable laws, executive orders, and policies was included. 6 See Exhibit A for brokerage fees for states with broker contracts and Exhibit C that summarizes hourly rates for the pool of brokers for the recent DES broker convenience contract.
Page 16
P
RO
CU
RE
ME
NT
PR
OC
ES
S
PROCUREMENT PROCESS
PROCUREMENT PROCESS
Request for Proposals
The RFP (#03715) was advertised on WEBS (ID: 29780) on May 12, 2015 and closed on June 12, 2015. To ensure maximum participation, RES contacted large brokerage firms directly. A pre-bid conference was scheduled for May 26, 2015. Bidders were instructed to submit written questions prior to the pre-bid conference. At the pre-bid conference DES would then address the issues raised and respond to any other questions regarding the solicitation. Bidder representatives attending the pre-bid conference included:
Royal Commercial (RCC)
Jones Lang LaSalle (JLL)
CBRE At the pre-bid conference, brokerage company representatives asked whether they could propose just a commission fee structure. DES made it clear that such proposals would be eliminated as non-responsive if they did not propose both types of fee methods. DES representatives added that a multiple award may be made if a decision were to go forward with a private broker contract. On May 27, 2015 following the pre-bid conference, DES issued Amendment 1, which formally addressed all the questions raised. Amendment 2 was issued on June 23. It provided clarification on the bid pricing worksheets and repeated the requirement that the bids must include a fixed flat-fee and commission-based price. Bidders were given a month to respond. The following real estate brokerage firms submitted bids:
Royal Commercial (RCC)
Jones Lang LaSalle (JLL)
CBRE
Cushman and Wakefield Administrative Screening
The initial review of the bids showed that CBRE and Cushman Wakefield did not include the required firm fixed price for providing these services, although Cushman Wakefield’s bid did include an estimate of “at least $500,000.” Since these bids did not meet the RFP requirements, both were rejected as non-responsive. The proposals submitted by JLL and RCC were determined to be responsive.
Page 17
Phase 1 Evaluation
The evaluation team consisted of three DES subject matter experts and one customer representative from RES’ largest customer, DSHS. The department’s Finance Division scored the price proposals. References were interviewed and scored by two other DES subject matter experts. The intent of Phase 1 evaluation and scoring was to advance at least two of the highest-scoring bidders to Phase 2 evaluation. A total of 100 points was available for Phase 1 scoring, which considered bidder qualifications (35 points), approach (40 points) and compensation/ pricing (25 points). Any bidder advancing to Phase 2 started on equal footing. Since only RCC and JLL were considered responsive, both advanced to Phase 2 of the evaluation. The evaluation team scored both bidders.
Verify that bidder’s proposal aligns with the purpose and intent of the state.
Seek additional clarification where appropriate.
Allow bidders an opportunity to further refine their offer as a result of the discussions. RCC and JLL were scheduled for interviews on June 23, 2015. During the interview, RCC indicated that a multiple award would not be acceptable. Following the interviews, the bidders were given until 2 pm Friday, June 26 to submit a Best and Final Offer.7
RCC’s Best and Final Offer pricing proposal was contingent upon a single award, which was inconsistent with the intent of the RFP. JLL’s proposed pricing was significantly less than RCC’s, so it received the highest point total. Phase 2 Results
Bidder Reference Check (40 points)
Interview/BAFO (60 points)
Total Points
JLL 39.6 55 94.6 RCC 35.1 30 65.1
7 In addition, the RFP price worksheet was missing a couple of price ranges and therefore bidders were asked to propose a percentage commission for these line items in their BAFO.
C
OS
T A
NA
LY
SIS
COST ANALYSIS
COST ANALYSIS Methodology
It is important to ensure a fair and accurate comparison of the cost to the Washington State government to either perform a service directly or to contract for the service with the private sector. To ensure an accurate comparison and to reduce decision risk, DES developed a standard approach and format to itemize and categorize costs when performing a cost analysis. If the comparison only looks at current RES costs and the bids submitted by vendors, important information may be missed. For example:
If a service is contracted out, the direct costs of performing the service will generally go away. However, some indirect and overhead costs associated with the service will likely continue to be paid by the agency or the state. For example, the division must continue to pay for internal administrative (indirect) costs and a portion of the lease payments for the 1500 Jefferson Street Building.
The service may be of a size that only fractions of FTEs are involved, so it could be difficult to fully reduce the direct costs of the service without harming another service.
DES may have conversion or transition costs, or revenue from the disposition of assets if a service is contracted out.
DES may have new costs due to administering and managing the contract. The costs for contracting out a service must include the bidder’s proposed costs to the state, plus any new costs to the state for exiting the service and managing the contract. The current costs to provide the service are shown in three categories:
Costs that would go away immediately if the service were contracted out.
Costs that would go away eventually, but not immediately.
Costs that would be transferred to other parts of DES or state government.
Page 19
Page 20
Page 21
Notes and Assumptions for the Real Estate Services Analysis DES Direct Staff Costs: The current leasing, design and planning services are provided by 15 full-time equivalents (FTEs) within the RES Division. [See: “Job Position Detail” tab in Cost Analysis Workbook E-file]. Total staffing costs, including salaries and benefits, are $1,463,500 per year. The analysis assumes a contract start date of January 1, 2016, with a nine-month transition period. RES staff subject to an outsourcing contract will transition out in phases as project work can be handed off to brokers who in turn must be trained. A straight-line reduction in costs over nine months has been used for this analysis. Thus, the estimated reduction in staffing and related direct costs is $309,200 in Fiscal Year 2016, $1,546,100 in Fiscal Year 2017 and $1,590,300 in Fiscal Year 2018 and beyond. DES Direct Non-Staff Costs: Other direct costs associated with this work include costs for staff training, travel, supplies and communications. These costs would be eliminated. A nine-month transition period is assumed with a straight-line reduction in these costs. DES Internal Shared Services, Rent, and Utilities Costs: This includes the FTE prorated share of the costs of agency shared services, such as human resources, finance, facility rent and utilities. The size of this share is relatively small, so there would be virtually no impact on the level of shared services costs if the service were contracted out. A nine-month transition period is assumed with a straight-line transfer of these costs to other DES services. External Cost Allocations to DES: This includes the FTE prorated share of the interagency costs allocated to DES, such as Archives, OCIO, etc. The size of this share is relatively small, so that there would be little impact on the level of external service costs to the agency in the first biennium if services were contracted out. It’s possible the agency could see some reduction related to these costs in the following biennium, but it was not possible to estimate what the impact might be. DES has not included fees for legal assistance from the Office of the Attorney General as a cost that would be eliminated or transferred since the division will continue to pay these fees related to leasing. A nine-month transition period is assumed with a straight-line transfer of these costs to other DES services. Contract Management: DES estimates that seven FTEs (two WMS, two architects, and three property acquisition specialists) would be needed to manage the work of the contractor. This work would include new functions not currently performed by DES.8 Leave Buyout Costs: Estimated at $102,600 in a one-time leave buyout cost based on current leave balances.
8 See Exhibit C for a description of the “Potential Future State” of RES if the selected functions are outsourced.
Page 22
Unemployment Costs: Estimated one-time costs for unemployment ($132,496), with costs calculated at $637 per week for 26 weeks, for 8.0 FTEs (15.0 - 7.0).9 Bidder Price Proposals
Bidders were asked to provide price proposals on both a flat fee basis and on the more common industry practice of commission based compensation. Bidder price proposals and price evaluation scoring are summarized below:
Bidder Fixed Price Estimated
Commission Price Total Points
(JLL) Jones, Lang, LaSalle
$2,460,000 $3,128,677 94.6
(RCC) Royal Commercial Corp
$10,980,720 $22,904,692 65.1
CBRE Did not bid fixed price
$7,158,627 Bidder did not meet mandatory RFP requirements
Cushman & Wakefield
Did not bid fixed price
$5,828,110 Bidder did not meet mandatory RFP requirements
The comparison of these costs elements shows a net increase in state costs of $1,615,974 per year if the service were contracted out to the lowest bidder’s proposed fixed fee price. Given the result of the bids received, it is unlikely that DES could make an award to the top two bidders as originally designed, and instead would be limited to a single award. Details of the cost analysis can be found in tables and assumptions in this section and in the Excel workbook provided.
Bidder Proposals
DES requested both a fixed-price and a commission-rate structure in the RFP for the portfolio of work. The fixed price mimics the predictability of the costs for RES to provide these services and provides a basis for an apples-to-apples comparison. The commission pricing structure will fluctuate as rent rates go up or down, but commission compensation for brokers is the industry norm.
Commission rates are based on the 2014 rental rates, not on a projected workload or projected rental rates. Actual rent rates would fluctuate given market conditions.
Commission rates proposed would be higher than is typical given that design and construction oversight are included.
9 For unemployment calculation approach see Unemployment Benefits.
Page 23
Bidders’ Proposed Costs: The commission-based bids received from RCC and JLL were modeled using actual Fiscal Year 2014 lease data and the bidders’ commission rates to determine the estimated future cost of these bidders. To evaluate the two bidders compared to DES’ costs, the department used whichever bid was lower – fixed price or commission. While this was used for evaluation purposes, it was the intent of DES to use the commission model and make multiple contract awards to ensure effective performance of contracted brokers and delivery of quality service to agency customers.
JLL had a fixed-price bid of $2,460,000 per year, which was lower than their estimated commission structure bid cost of approximately $3,128,667 per year.
RCC had a fixed-price bid of $10,980,720 per year, which was lower than their estimated revised commission structure bid cost of approximately $22,904,692 per year.
Incremental Contract Cost Section
This section of the analysis shows the total incremental cost to the state if the specified real estate functions were contracted out instead of being performed by DES. The calculation for incremental cost/savings to the state is:
The bidders proposed cost of the contract; plus the new costs DES would incur as a result of contracting out; minus the state costs that are eliminated as a result of contracting out.
This section does not include costs for any of the existing RES functions that were out of scope for this procurement such as acquisition and disposal services. DES would continue to provide these services and funding would still need to be provided for these functions.
Page 24
EX
HIB
ITS
EXHIBITS
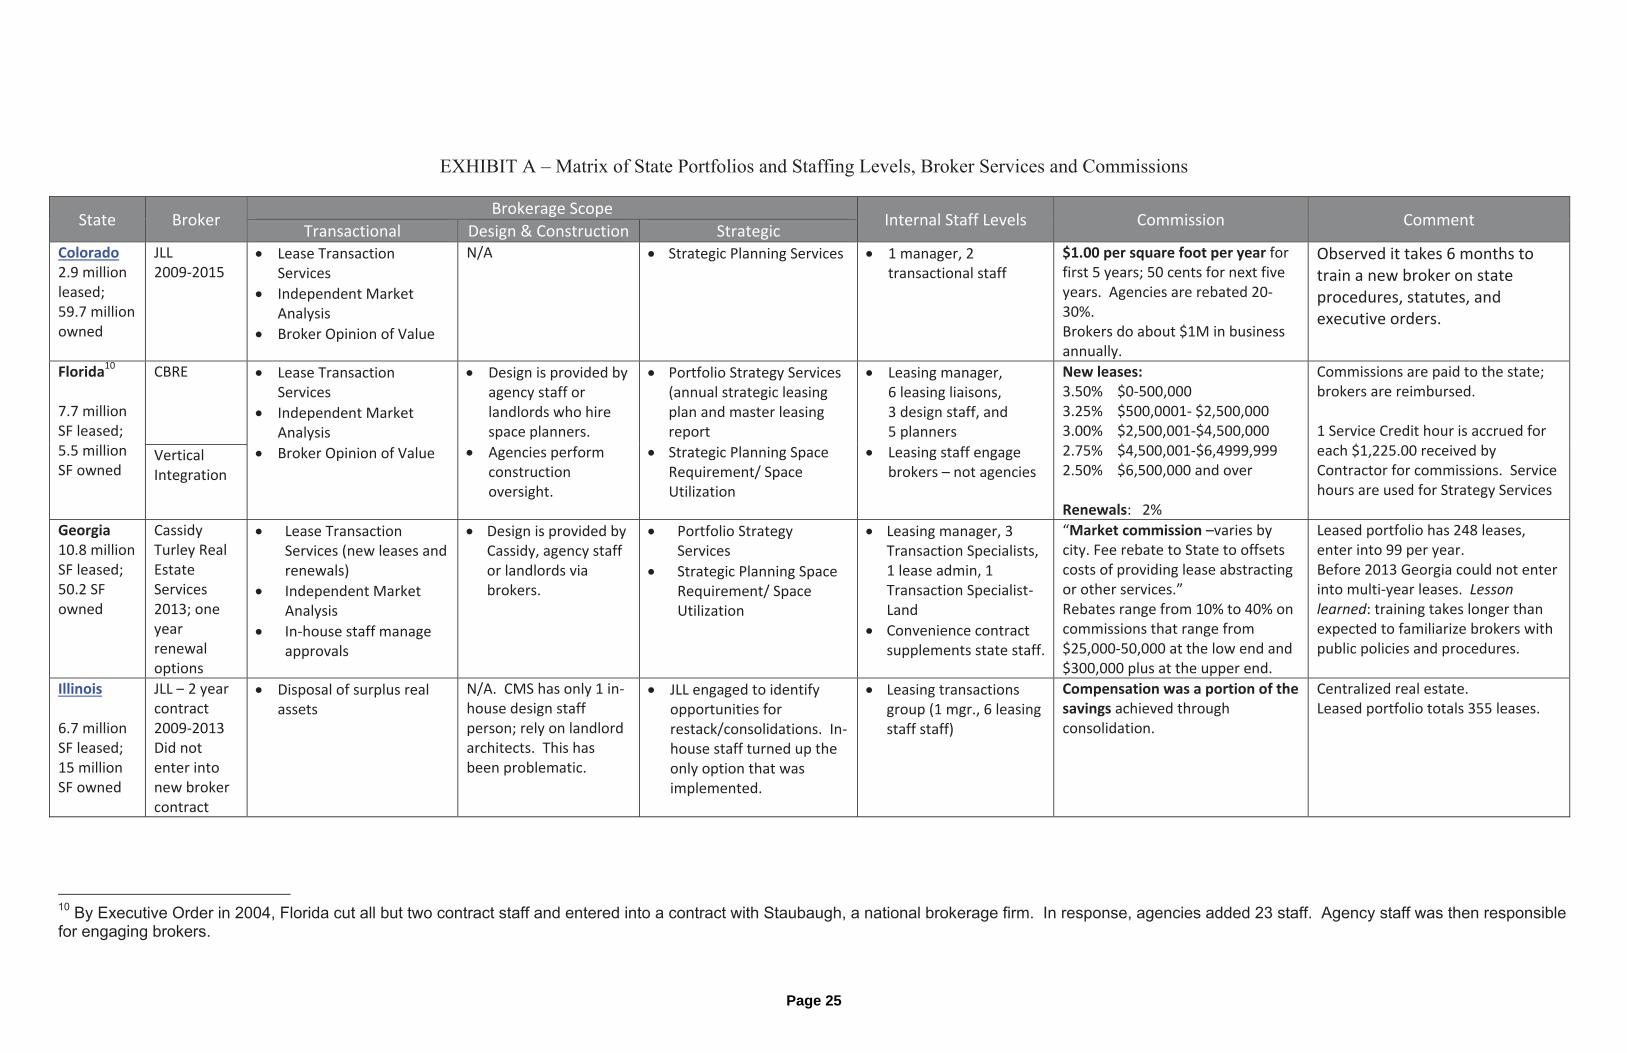
EXHIBIT A – Matrix of State Portfolios and Staffing Levels, Broker Services and Commissions
State Broker Brokerage Scope
Internal Staff Levels Commission Comment Transactional Design & Construction Strategic
New leases:3.50% $0 500,000 3.25% $500,0001 $2,500,000 3.00% $2,500,001 $4,500,000 2.75% $4,500,001 $6,4999,999 2.50% $6,500,000 and over
Renewals: 2%
Commissions are paid to the state; brokers are reimbursed. 1 Service Credit hour is accrued for each $1,225.00 received by Contractor for commissions. Service hours are used for Strategy Services
Vertical Integration
Georgia10.8 million SF leased; 50.2 SF owned
Cassidy Turley Real Estate Services 2013; one year renewal options
Lease Transaction Services (new leases and renewals)
Independent Market Analysis
In house staff manage approvals
Design is provided by Cassidy, agency staff or landlords via brokers.
Portfolio Strategy Services
Strategic Planning Space Requirement/ Space Utilization
“Market commission –varies by city. Fee rebate to State to offsets costs of providing lease abstracting or other services.” Rebates range from 10% to 40% on commissions that range from $25,000 50,000 at the low end and $300,000 plus at the upper end.
Leased portfolio has 248 leases, enter into 99 per year. Before 2013 Georgia could not enter into multi year leases. Lessonlearned: training takes longer than expected to familiarize brokers with public policies and procedures.
Illinois 6.7 million SF leased; 15 million SF owned
JLL – 2 year contract 2009 2013 Did not enter into new broker contract
Disposal of surplus real assets
N/A. CMS has only 1 inhouse design staff person; rely on landlord architects. This has been problematic.
JLL engaged to identify opportunities for restack/consolidations. Inhouse staff turned up the only option that was implemented.
Leasing transactions group (1 mgr., 6 leasing staff staff)
Compensation was a portion of thesavings achieved through consolidation.
Centralized real estate. Leased portfolio totals 355 leases.
10 By Executive Order in 2004, Florida cut all but two contract staff and entered into a contract with Staubaugh, a national brokerage firm. In response, agencies added 23 staff. Agency staff was then responsible for engaging brokers.
Page 25
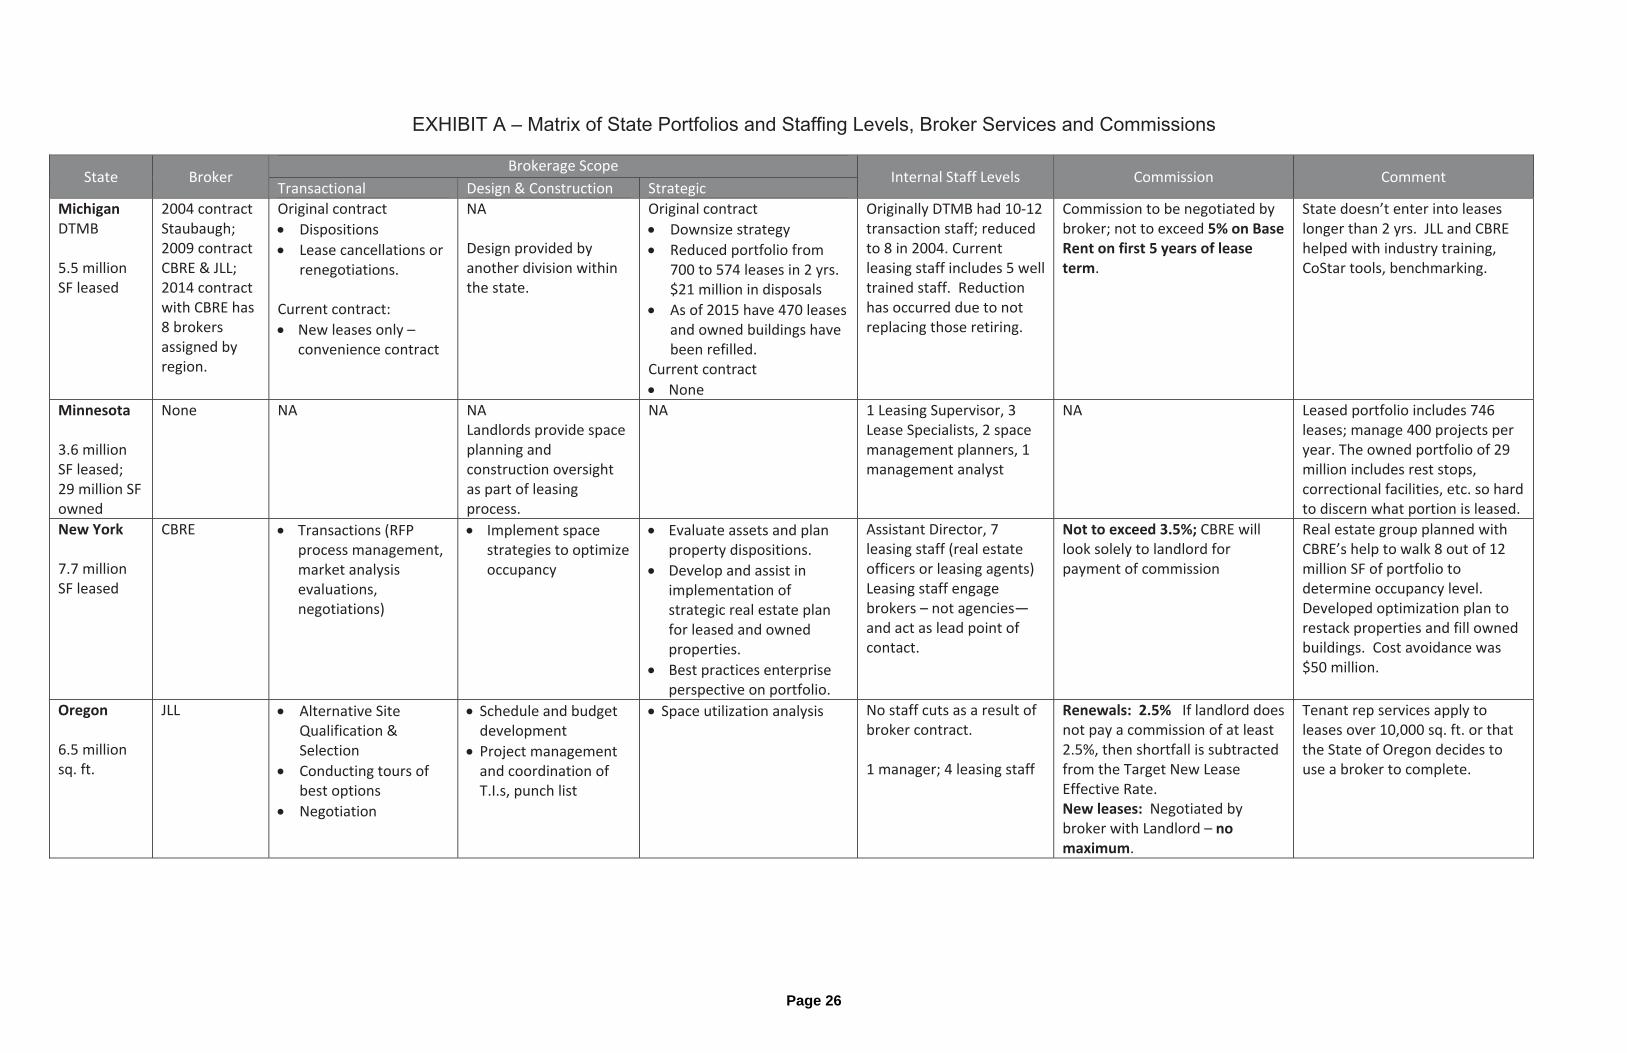
EXHIBIT A – Matrix of State Portfolios and Staffing Levels, Broker Services and Commissions
State Broker Brokerage Scope
Internal Staff Levels Commission Comment Transactional Design & Construction Strategic
MichiganDTMB 5.5 million SF leased
2004 contract Staubaugh; 2009 contract CBRE & JLL; 2014 contract with CBRE has 8 brokers assigned by region.
Original contract
Dispositions
Lease cancellations or renegotiations.
Current contract:
New leases only – convenience contract
NA Design provided by another division within the state.
Original contract
Downsize strategy
Reduced portfolio from 700 to 574 leases in 2 yrs. $21 million in disposals
As of 2015 have 470 leases and owned buildings have been refilled.
Current contract
None
Originally DTMB had 10 12 transaction staff; reduced to 8 in 2004. Current leasing staff includes 5 well trained staff. Reduction has occurred due to not replacing those retiring.
Commission to be negotiated by broker; not to exceed 5% on BaseRent on first 5 years of leaseterm.
State doesn’t enter into leases longer than 2 yrs. JLL and CBRE helped with industry training, CoStar tools, benchmarking.
Minnesota 3.6 million SF leased; 29 million SF owned
None NA NALandlords provide space planning and construction oversight as part of leasing process.
NA 1 Leasing Supervisor, 3 Lease Specialists, 2 space management planners, 1 management analyst
NA Leased portfolio includes 746 leases; manage 400 projects per year. The owned portfolio of 29 million includes rest stops, correctional facilities, etc. so hard to discern what portion is leased.
New York 7.7 million SF leased
CBRE Transactions (RFP process management, market analysis evaluations, negotiations)
Implement space strategies to optimize occupancy
Evaluate assets and plan property dispositions.
Develop and assist in implementation of strategic real estate plan for leased and owned properties.
Best practices enterprise perspective on portfolio.
Assistant Director, 7 leasing staff (real estate officers or leasing agents) Leasing staff engage brokers – not agencies—and act as lead point of contact.
Not to exceed 3.5%; CBRE will look solely to landlord for payment of commission
Real estate group planned with CBRE’s help to walk 8 out of 12 million SF of portfolio to determine occupancy level. Developed optimization plan to restack properties and fill owned buildings. Cost avoidance was $50 million.
Oregon 6.5 million sq. ft.
JLL Alternative Site Qualification & Selection
Conducting tours of best options
Negotiation
Schedule and budget development
Project management and coordination of T.I.s, punch list
Space utilization analysis
No staff cuts as a result of broker contract. 1 manager; 4 leasing staff
Renewals: 2.5% If landlord does not pay a commission of at least 2.5%, then shortfall is subtracted from the Target New Lease Effective Rate.New leases: Negotiated by broker with Landlord – nomaximum.
Tenant rep services apply to leases over 10,000 sq. ft. or that the State of Oregon decides to use a broker to complete.
Page 26
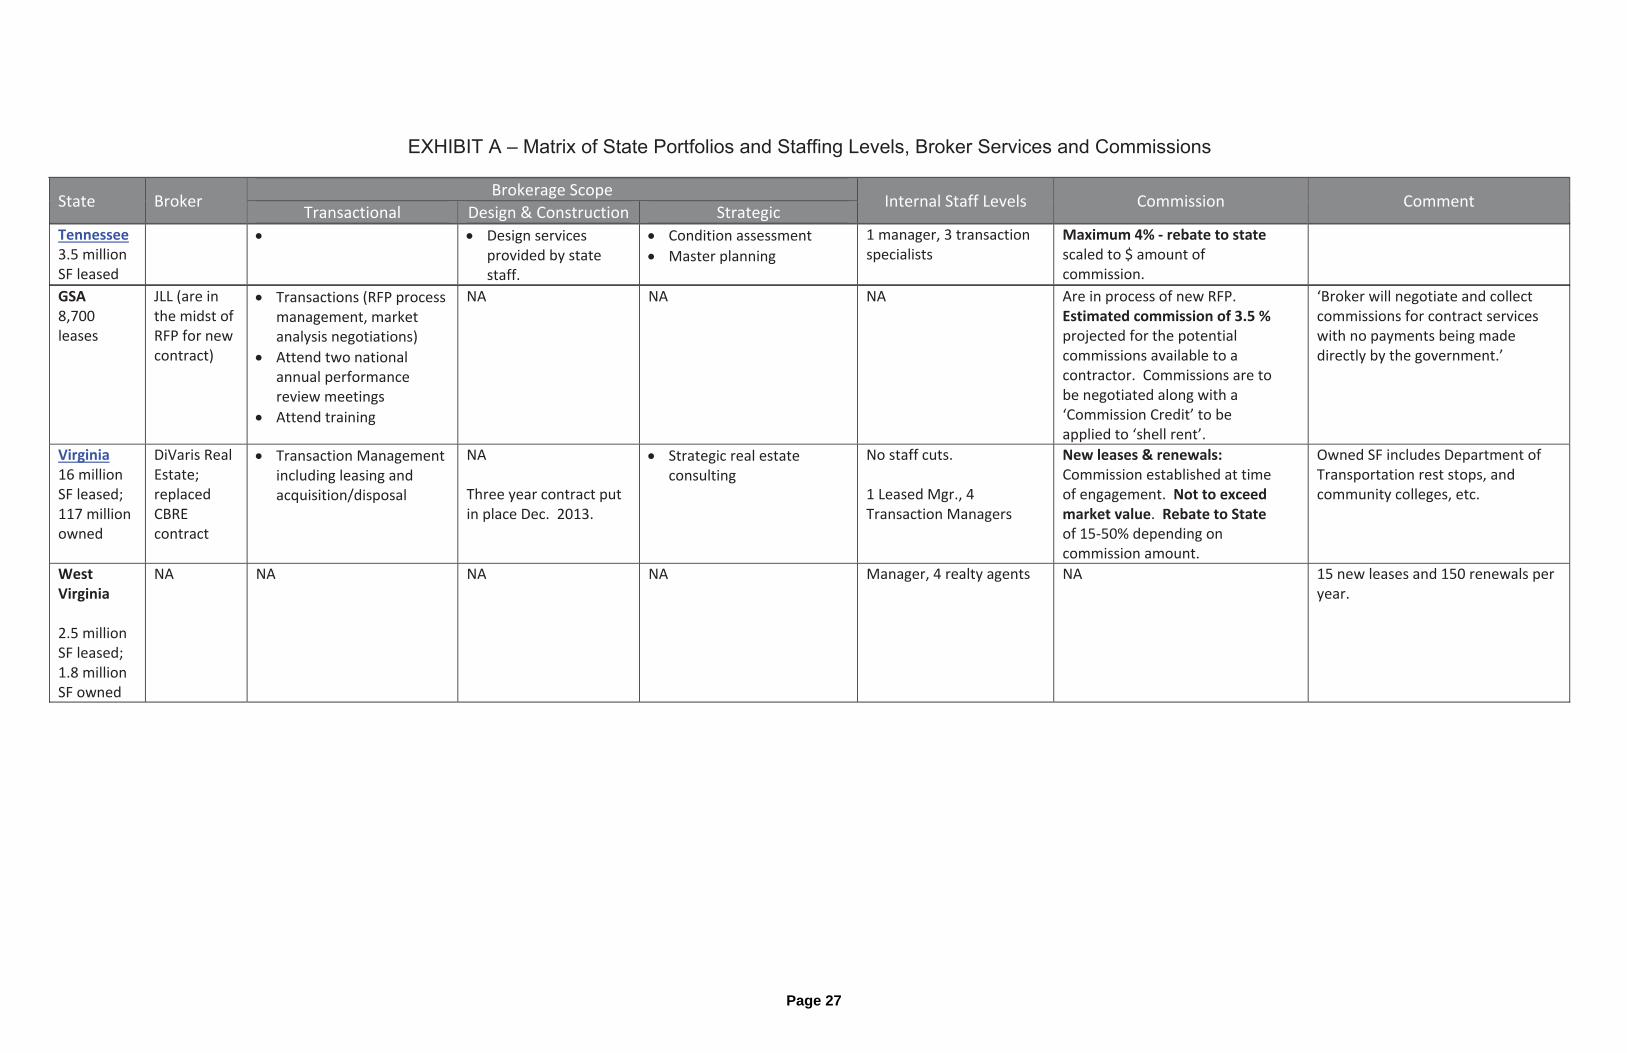
EXHIBIT A – Matrix of State Portfolios and Staffing Levels, Broker Services and Commissions
State Broker Brokerage Scope
Internal Staff Levels Commission Comment Transactional Design & Construction Strategic
Tennessee3.5 million SF leased
Design services provided by state staff.
Condition assessment
Master planning
1 manager, 3 transaction specialists
Maximum 4% rebate to statescaled to $ amount of commission.
GSA8,700 leases
JLL (are in the midst of RFP for new contract)
Transactions (RFP process management, market analysis negotiations)
Attend two national annual performance review meetings
Attend training
NA NA NA Are in process of new RFP. Estimated commission of 3.5 % projected for the potential commissions available to a contractor. Commissions are to be negotiated along with a ‘Commission Credit’ to be applied to ‘shell rent’.
‘Broker will negotiate and collect commissions for contract services with no payments being made directly by the government.’
Virginia16 million SF leased; 117 million owned
DiVaris Real Estate; replaced CBRE contract
Transaction Management including leasing and acquisition/disposal
NA Three year contract put in place Dec. 2013.
Strategic real estate consulting
No staff cuts. 1 Leased Mgr., 4 Transaction Managers
New leases & renewals: Commission established at time of engagement. Not to exceedmarket value. Rebate to State of 15 50% depending on commission amount.
Owned SF includes Department of Transportation rest stops, and community colleges, etc.
WestVirginia
2.5 million SF leased; 1.8 million SF owned
NA NA NA NA Manager, 4 realty agents NA 15 new leases and 150 renewals per year.
Page 27
Page 28
Exhibit B List of Audits
BKD LLP and Zimmer Real Estate Services. “State of Nebraska-Department of Administrative Services - State Building Division-Property Management Group - Assessment of Owned and Leased Property Program”. March 2014
State of Tennessee - Comptroller of the Treasury. “Department of General Services Performance Audit Report.” November 2013;
U.S. Government Accountability Office. “Federal Real Property – Excess and Underutilized Property is an Ongoing Challenge.” April, 2013
Deloitte. State of Colorado-Office of the State Auditor-“Performance Evaluation of State Capital Asset Management and Lease Administration Practices”. November 2012
Georgia Department of Audits & Accounts - “Performance Audit-State Properties Commission”. January 2012 Florida Legislature-Office of Program Policy Analysis and Government Accountability - “While the State’s Leasing Process Uses Reasonable Processes, Centralized Responsibility for Real Estate Management and Implementing Other Improvements Would Generate Savings.” Research Memorandum. February, 2010 Florida Legislature-Office of Program Policy Analysis and Government Accountability - “DMS Has Improved State Leasing Processes, Additional Performance Measures Needed.” Report # 08-22. April, 2008 Florida Legislature-Office of Program Policy Analysis and Government Accountability - “Workplace Management Initiative Can Benefit State, But DMS Not Taking Adequate Steps to Ensure Goals Are Met.” Report #06-06. January, 2006.
State of Illinois - Office of the Auditor General, “Department of Central Management Services: Administration of the State’s Space Utilization Program”. February 2004.
Page 29
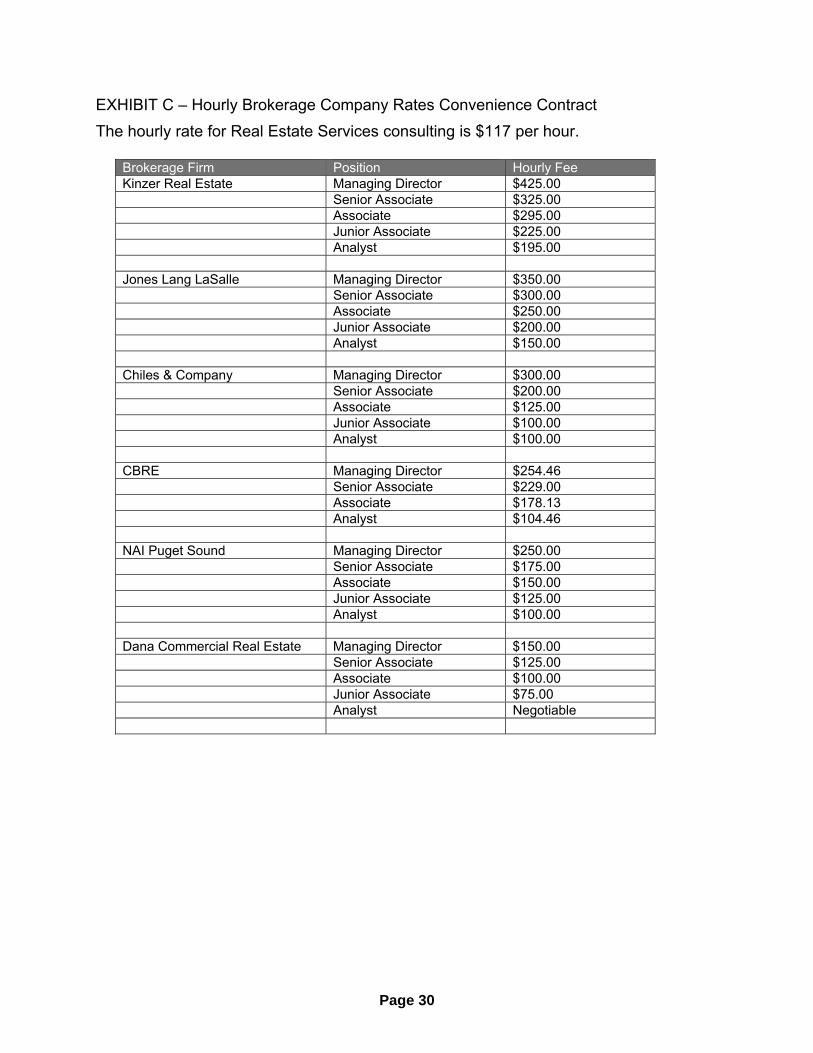
EXHIBIT C – Hourly Brokerage Company Rates Convenience Contract
The hourly rate for Real Estate Services consulting is $117 per hour.
Brokerage Firm Position Hourly Fee Kinzer Real Estate Managing Director $425.00 Senior Associate $325.00 Associate $295.00 Junior Associate $225.00 Analyst $195.00 Jones Lang LaSalle Managing Director $350.00 Senior Associate $300.00 Associate $250.00 Junior Associate $200.00 Analyst $150.00 Chiles & Company Managing Director $300.00 Senior Associate $200.00 Associate $125.00 Junior Associate $100.00 Analyst $100.00 CBRE Managing Director $254.46 Senior Associate $229.00 Associate $178.13 Analyst $104.46 NAI Puget Sound Managing Director $250.00 Senior Associate $175.00 Associate $150.00 Junior Associate $125.00 Analyst $100.00 Dana Commercial Real Estate Managing Director $150.00 Senior Associate $125.00 Associate $100.00 Junior Associate $75.00 Analyst Negotiable
Page 30
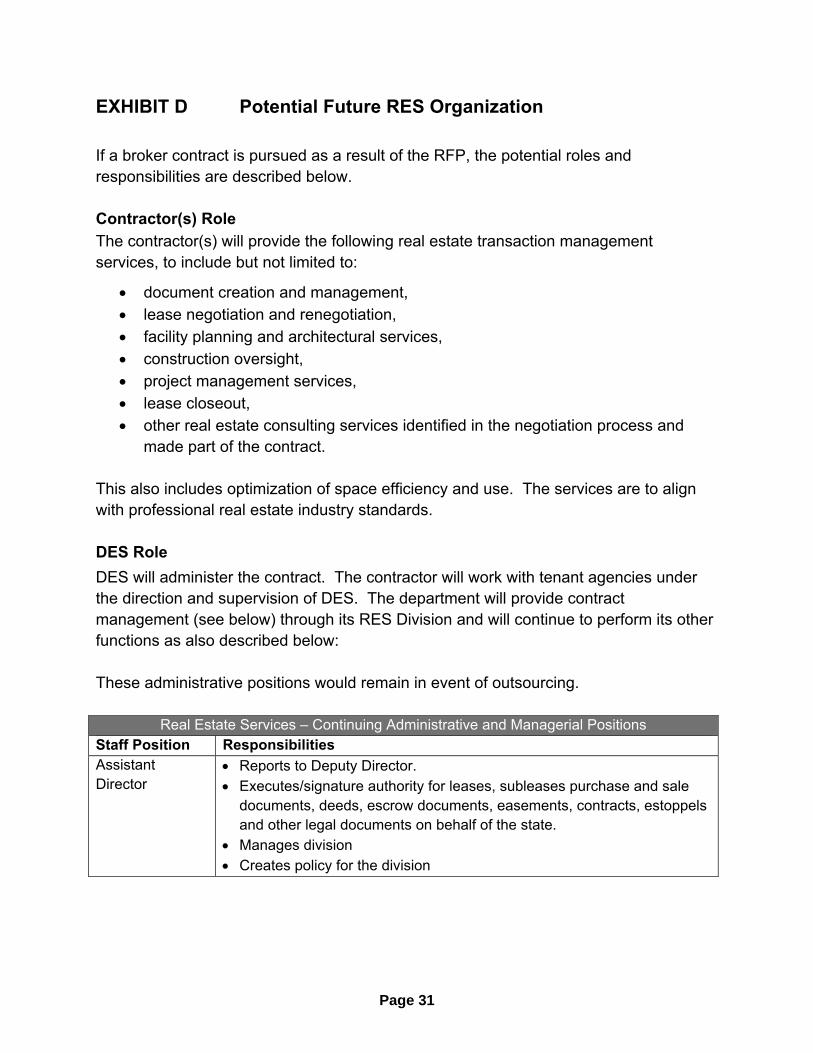
EXHIBIT D Potential Future RES Organization
If a broker contract is pursued as a result of the RFP, the potential roles and responsibilities are described below. Contractor(s) Role
The contractor(s) will provide the following real estate transaction management services, to include but not limited to:
document creation and management, lease negotiation and renegotiation, facility planning and architectural services, construction oversight, project management services, lease closeout, other real estate consulting services identified in the negotiation process and
made part of the contract. This also includes optimization of space efficiency and use. The services are to align with professional real estate industry standards. DES Role
DES will administer the contract. The contractor will work with tenant agencies under the direction and supervision of DES. The department will provide contract management (see below) through its RES Division and will continue to perform its other functions as also described below: These administrative positions would remain in event of outsourcing.
Real Estate Services – Continuing Administrative and Managerial Positions Staff Position Responsibilities Assistant Director
Reports to Deputy Director. Executes/signature authority for leases, subleases purchase and sale
documents, deeds, escrow documents, easements, contracts, estoppels and other legal documents on behalf of the state.
Manages division Creates policy for the division
Page 31
Real Estate Services – Continuing Administrative and Managerial Positions Staff Position Responsibilities Operations Manager
Review lease agreements, amendments, extensions and management of the state’s standard lease agreement.
Manage the coordination and collaboration with OFM, as well as the required consultations, approvals, and reports
Performs staff evaluations, sets performance expectations and creates personal development plans
Provides continuity of operation/delegated authority in the absence of the Assistant Director
Admin Assistant Supports executive positions HR coordination Coordinate administrative support
Contract Specialist 1
Front office support Generate Interagency Agreements for billable work Manage timekeeping Maintaining contracts, records and file system
Contract Specialist 3
Manage administrative amendments to leases, including lease amendments that cover a change of ownership; requests for estoppels; or subordination, non-disturbance, and attornment (SNDA) agreements; or other non-financial changes to leases.
Preliminary review of draft leases Input lease and project information into Real Estate Management
System. Senior Planner Develop policy / statutory interpretation, including responses to tenant
agency non-compliance. Review any request for waivers from DES policy or procedures.
Manage public process for new space solicitations Program lead for development of the program’s strategic and business
plans and liaison for agency strategic plan; Program lead for community relations and planning activities; Program legislative lead, including:
o Primary responsibility for bill analysis and input for fiscal notes as well as coordinating legislative responses.
o Primary responsibility for preparing legislative reports
Evaluate and grant Delegations of Authority
Page 32
Real Estate Services – Continuing Administrative and Managerial Positions Management Analyst 5
Administer the new real estate management system. Manage key performance metric data capture and reporting Backup for legislative lead for bill analysis and fiscal notes. Co-lead business plan development Establish and maintain market rate methodology Lead process improvement activities and results Lead procurement activities
Property Acquisition Specialist 6
Purchase and sale of state-owned properties.
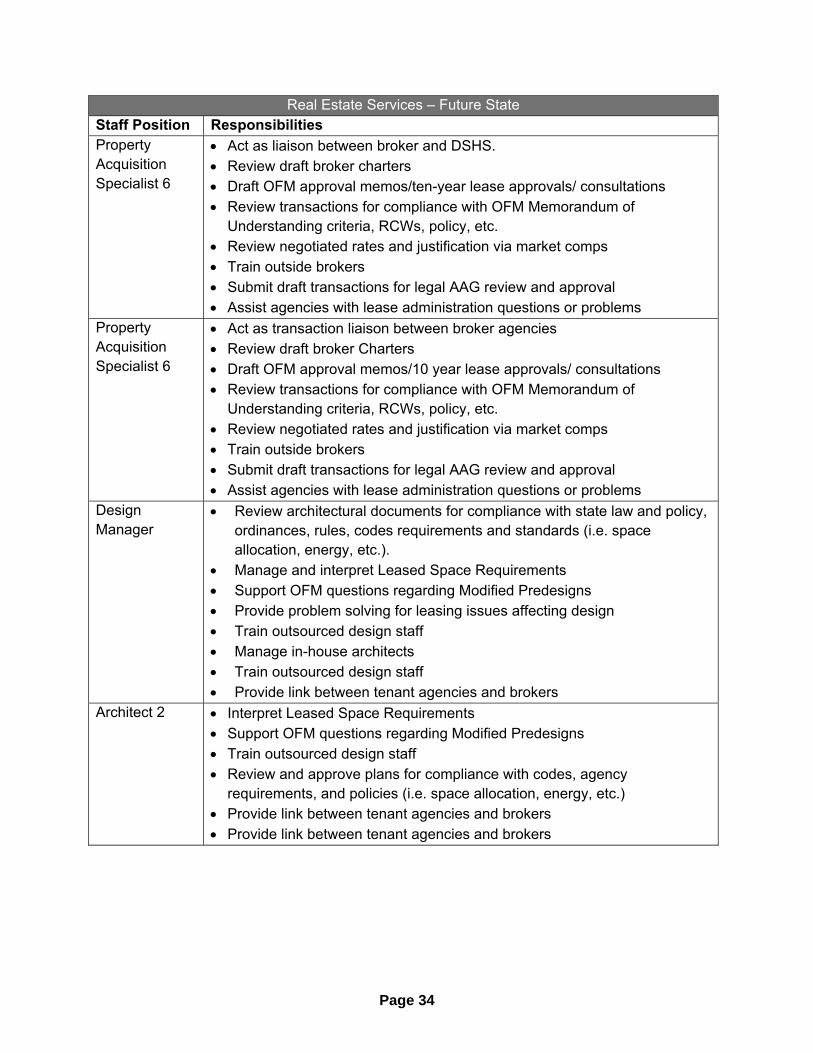
The following positions are identified as new positions for the management of the transactional activities provided by brokerage firm(s).
Real Estate Services – Future State Staff Position Responsibilities Leasing Manager (New)
Assign projects to brokers Manage internal leasing liaison staff Oversee Thurston County transactions
Manage lease transactions in state-owned properties. Review broker draft charters Draft OFM approval memos,10-year lease approvals/consultations Review transactions for compliance with OFM Memorandum of
Understanding criteria, RCWs, policy, etc. Review negotiated rates and justification via market comps Train outside brokers
Property Acquisition Specialist 6
Act as liaison between broker and Department of Corrections, Employment Security, and other agencies.
Review draft broker charters Draft OFM approval memos/10-year lease approvals/ consultations Review transactions for compliance with OFM Memorandum of
Understanding criteria, RCWs, policy, etc. Review negotiated rates and justification via market comps Train outside brokers Submit draft transactions for legal AAG review and approval Assist agencies with lease administration questions or problems
Page 33
Real Estate Services – Future State Staff Position Responsibilities Property Acquisition Specialist 6
Act as liaison between broker and DSHS. Review draft broker charters Draft OFM approval memos/ten-year lease approvals/ consultations Review transactions for compliance with OFM Memorandum of
Understanding criteria, RCWs, policy, etc. Review negotiated rates and justification via market comps Train outside brokers Submit draft transactions for legal AAG review and approval Assist agencies with lease administration questions or problems
Property Acquisition Specialist 6
Act as transaction liaison between broker agencies Review draft broker Charters Draft OFM approval memos/10 year lease approvals/ consultations Review transactions for compliance with OFM Memorandum of
Understanding criteria, RCWs, policy, etc. Review negotiated rates and justification via market comps Train outside brokers Submit draft transactions for legal AAG review and approval Assist agencies with lease administration questions or problems
Design Manager
Review architectural documents for compliance with state law and policy, ordinances, rules, codes requirements and standards (i.e. space allocation, energy, etc.).
Manage and interpret Leased Space Requirements Support OFM questions regarding Modified Predesigns Provide problem solving for leasing issues affecting design Train outsourced design staff Manage in-house architects Train outsourced design staff Provide link between tenant agencies and brokers
Architect 2 Interpret Leased Space Requirements Support OFM questions regarding Modified Predesigns Train outsourced design staff Review and approve plans for compliance with codes, agency
requirements, and policies (i.e. space allocation, energy, etc.) Provide link between tenant agencies and brokers Provide link between tenant agencies and brokers
Page 34
Staff Position Responsibilities Architect 2 Interpret Leased Space Requirements
Support OFM questions regarding Modified Predesigns Train outsourced design staff Review and approve plans for compliance with codes, agency
requirements, and policies (i.e. space allocation, energy, etc.) Provide link between tenant agencies and brokers
Below is a projected organizational chart for DES Real Estate Services Division in the event of outsourcing.
AssistantDirector
Leasing Manager
Properties & Acquisition Specialist 6
Architect 2
Senior PlannerAcquisition &
DisposalContract
Specialist 3
FACILITIES DIVISIONREAL ESTATE SERVICES
DRAFT‐CONFIDENTIAL Future State
Real Estate Operations Manager
Design Manager
Admin Assistant 4
Contract Specialist 1
Management Analyst 5
TRANSACTION MONITORING
Architect 2
Properties & Acquisition Specialist 6
Properties & Acquisition Specialist 6
‐‐Exec Point of Contact ‐‐Oversight – High Risk/‐‐ High Cost Projects‐‐OFM Review Coordination