12
B!SA True high-resolution CATALOG2015

B!SA True high-resolution
CATALOG2015

a word from the team
Welcome to our 2015 Catalog! At Aragon Photonics we believe in continuous innovation and hard work to bring you the best test & measurement solutions that you need to make the networks and devices of tomorrow closer. That is why we are so excited to introduce to you the latest version of our flagship product, the BOSA 200.
We have redesigned BOSA 200 both externally, with a much more durable and attractive enclosure and a better screen, and internally, with a brand new software interface and more advanced hardware that will allow the BOSA to keep improving in the years to come.
In this catalog you will also find all the information about the complete list of options that make BOSA 200 the most advanced and versatile high-resolution OSA you can find today, and about the BOSA Lite, the most affordable high-resolution OSA in the market.
All the Best, The Aragon Photonics team
index
Technology 3 Applications 4 Series & Models BOSA Lite 6 100 Series 7 200 Series 7 Common features 8 Additional Options Option 210: Tunable Laser Source 9 Option 220: Passive Component Analyzer 9 Option 230: Polarimetry extension 10 Option 300: Phase measurement 10
2

BOSA
Technology
Based on revolutionary all-optical patented technology, Aragon Photonics produces the most advanced and versatile Subpicometric Optical Spectrum Analyzer products.
The principle behind BOSA performance is stimulated Brillouin scattering (SBS), a non-linear optical effect produced by narrow-linewidth high-power light propagating through an optical medium that causes a very narrow filtering effect. By pumping SBS with an external cavity tunable laser source (TLS), the filter is swept along the spectral region of interest, revealing the high-resolution optical spectrum.
The non-linearity of SBS gives the BOSA great advantages over other classic spectroscopy methods such as diffraction gratings, Fabry-Perot filters or heterodyne OSAs, all of them linear. The amplification effect of SBS greatly enhances the dynamic range of the measurement compared to passive filtering. The threshold imposed by SBS also helps cancel the spurious effects of the local oscillator sidemodes and lineshape that produce measurement artifacts in heterodyne OSAs, giving the highest spurious-free dynamic range measurement available in any high-resolution OSA.
BOSA technology is available in different models to fit all requirements and budgets! The essence of BOSA can be found in BOSA Lite, the most compact, lightweight & affordable sub-picometric OSA in the market. For the highest performance BOSA200 is the best OSA you can find
and adding some of the available options it is also the most versatile OSA in the market.
Including a laser output and precise trigger (Option 210) the user can take advantage of the internal TLS for other applications when not using the OSA. The high performance of the BOSA can also now applied to characterize passive components by measuring their transmission and reflection losses spectral profile when sweeping the TLS (Option 220).
Based on our new patent-pending technology, full polarization analysis functions can now be added (Option 230) to both the optical spectrum measurement and the passives measurement, enabling easy evaluation of critical parameters such as polarization dependent losses (PDL) or polarization mode dispersion (PMD).
Aragon Photonics also holds the patent for spectral phase measurement. Taking advantage of the SBS filtering capabilities but simultaneously selecting adjacent spectral components, the phase of the optical spectrum can be measured (Option 300). Together with the high-resolution spectrum information, the complex spectrum is obtained, opening radically new possibilities for optical signal analysis, as with the complex spectrum information and through inverse Fourier transform, all the time-domain information can be retrieved: eye diagram, constellation, time-resolved chirp, etc. And because the measurement is made in the spectral domain, it is not rate-limited by electronics, making it really future-proof.
3

BOSA
Applications
BOSA's unique combination of high-resolution and high dynamic-range brings a new range of measurement possibilities to the optical domain. BOSA reveals the optical spectra of the signals with a detail and precision that enable direct measurement of performance parameters for lasers and modulated signals that until now had to be measured by complicated setups or could not be measured at all and can help identify design or construction problems that are hidden for most instruments and help you optimize you device and system designs.
Laser characterization The characterization of laser parameters such as relative intensity noise (RIN), relaxation oscillations frequency, linewidth enhancement factor, etc. can be a tedious and time-consuming task that involves many different instruments and requires the laser to be modulated with high frequency and analyzed in the electrical domain. However, the optical spectrum of a laser contains meaningful information about many of these laser parameters in its spectral shape.
In this measurement the spectral shape of a DFB laser is shown. Even without applying any modulation, the laser own intensity noise modulates it, showing its intrinsic response and revealing its potential bandwidth. Also, just by measuring the spectral linewidth at different bias currents the linewidth enhancement factor can be extracted.
In the above measurement example, the spectrum of a narrow external cavity laser is shown. Thanks to its dynamic range and absence of artifacts, the BOSA reveals the true spectral shape of the laser, whereas in heterodyne OSAs the spectral shape of the local oscillator will be imprinted in all the spectrum distorting the measurement.
In this trace we can also appreciate one of the key differences when evaluating spectra compared with a “normal” OSA. With such a narrow resolution, signals that are normally considered spectral lines are wider now than the resolution of the instrument. As a results, apparent SMSR (peak-to-peak) will normally be higher than in a “normal” OSA. However, we can observe how the sidemodes are wider than 10 MHz and thus have their power spread into several measurement points. In this case, power integral will help us extract the most precise results.
BOSA is also a great tool to analyze dynamic effects on lasers and semiconductor devices. In the measurement examples above and below we can observe a close-up of a Fabry Perot mode which is directly modulation with a 500 MHz tone and a picosecond pulsed laser with a 10 GHz repetition rate.
4

BOSA
Applications
Optical communications systems analysis The additional detail provided by the high-resolution spectrum of advanced modulation formats can give you very useful performance information of modulated signals. In the above measurement example a several channels of an in-service DWDM network are captured. 10G RZ and NRZ channels with a 100G PolMux QPSK in the middle are shown. The BOSA captures the measurement with the maximum resolution and dynamic range whatever the span is, so a full band measurement contains all the spectral detail for all channels.
Fine-tuning of the modulation parameters is also really easy aided by the BOSA thanks to its detail but also to the fast measurement that allows seeing the results almost in real time. In the measurement example below, a 40G DRZ modulation is shown, where even the very low power residual carrier and clock components can still be observed in the spectrum.
OFDM & Nyquist WDM signal analysis For new modulation formats aimed at ultra-high spectral efficiency such as OFDM and Nyquist WDM, the high-resolution spectrum is mandatory to assess the proper behavior of the subsystems.
In the example below, 8 OFDM channels are shown. Aligning these signals to avoid overlapping with a normal OSA requires constantly switching off channels to see the carrier wavelength and taking leaps of faith on the unseen spectrum, whereas with BOSA all the information is seen in a single scan.
In the example below, an upconverted OFDM signal after optimizing the ADC stage thanks to the information obtained by BOSA. Seeing the spectral shape is critical!
5

BOSA
100 & 200 Series
Intuitive GUI
BOSA graphic user interface has been completely redesigned to be fast and operative either through its included touch screen (with big clear buttons, ideal for use when mounted in a rack) or with mouse and keyboard and external monitor (getting advantage of shortcuts and contextual menus, great when installed in a lab workbench or in a cart). Advanced functions Take the most out of your measurements with some of the advanced functions: - Trace locking, uses an automatic or user-defined
portion of the spectrum for reference to lock traces and obtain the most accurate averaging results.
- Peak-tracking markers, that follow the peaks of the signal to always obtain meaningful information.
- Variable resolution, to get results more easily comparable with your old OSA while you get used to the amount of detail a BOSA gives you.
- Power integral, that allows measuring the total power of the signal in a user-defined portion of the spectrum.
- Dual-channel polarization measurement, that allow seeing the separate orthogonal polarization components of the signal simultaneously.
Easy automation BOSA makes it easy to take long sets of measurements and automate measurement procedures. The unit can be controlled remotely through GPIB and Ethernet using SCPI commands. The user can also program measurement macros using the included Macro Editor, which enable not only to make fast measurements but also to control other lab instruments through SCPI commands and process, represent and export the results. Remote desktop control can also be enabled for the instrument.
5 6

BOSA
Lite
Designed to find the best balance between performance, features and cost, the new BOSA Lite is the new access point to the world of ultra-high optical resolution and the most affordable sub-picometric OSA in the market. Its simultaneous 20 MHz (0.16 pm) resolution and 80 dB spurious-free dynamic range, make the BOSA Lite a truly capable instrument fit for most applications. Don't be fooled by its small form factor and light weight, BOSA Lite is a fully functional BOSA (including the scanning laser) that only requires a single USB connection to a PC or laptop to work. BOSA Lite is also available in mainframe version (including computer and screen) as BOSA 800 series. ü Great performance: 20 MHz (0.16 pm) pure optical
resolution. ü High spurious-free dynamic range 80 dB.
Maximum reliability with no measurement artifacts. ü Two orthogonal polarization channels ü Compact & lightweight: very portable. ü Rack-mount version also available.
BOSA Lite
Optical Resolution (@3dB) 1 0.16 pm (20MHz @1550nm) Wavelength Range 1525 nm -1564 nm Wavelength Accuracy ± 2 pm Spurious-free Dynamic Range1 >80 dB
Close-in Dynamic Range1 >40 dB @ ±0.8 pm >60 dB @ ±2.0 pm
Calibrated Input Power Range +13 to -70 dBm Maximum Safe Total Input Power +20 dBm Sensitivity1 -70 dBm / 0.16 pm Power Accuracy1 ± 0.5 dB Polarization Measurement Two orthogonal polarizations Measurement time 1s for a 2.5 nm span Internal Wavelength Calibrator C12 HCN
1 Typical values, measured at 0 dBm @ 1550 nm.
7

BOSA
100 & 200 Series
BOSA200
Its simultaneous 10 MHz (80 fm) resolution and 80 dB spurious-free dynamic range, make the BOSA200 the best performing high-resolution OSA. The non-linear nature of SBS creates a filter that is not only narrow but extremely sharp, maintaining a width under 1 pm more than 50 dB below the peak, which allows for precise measurement of signal components even really close to the optical carrier. The high performance of the BOSA is only possible by using top quality components and controlling them very carefully. The SBS core is engineered for maximum filtering efficiency and stability and the detection stage uses fast high quality 16-bit DAQs. In our BOSA200 series we include an external cavity fast tunable laser, which is precisely monitored with a physical standard wavelength reference for maximum accuracy.
BOSA100
If you already own a compatible Tunable Laser Source (TLS) you can achieve the maximum performance of BOSA200 at a much more affordable price with BOSA100. BOSA 100 controls the third-party TLS using GPIB or USB and uses it for scanning the spectrum with the Brillouin filter, achieving the same performance than BOSA200. Some compatible TLS are: Yenista Tunics 100S/R/Reference, Agilent 81600B, Luna Phoenix 1400... For other laser models, please ask us at [email protected].
Also, BOSA100 is upgradeable to BOSA200 anytime!
BOSA 1002 & 200 series C band model C+L band model
Optical Resolution (@3dB) 2 80fm (10MHz @1550nm) Wavelength Range3 1525 nm -1565 nm 1525 - 1610 nm Wavelength Accuracy3 ± 1 pm ± 2 pm Spurious-free Dynamic Range2 >80dB
Close-in Dynamic Range2 >40 dB @ ±0.3 pm >60 dB @ ±0.6 pm
Calibrated Input Power Range +13 to -70dBm Maximum Safe Total Input Power +20 dBm Sensitivity2 -70dBm/0.1pm Power Accuracy3 ±0.5 dB
Polarization Measurement Two orthogonal polarization channels
(+Option 230) Full state-of-polarization measurement Measurement time3 1s for a 10 nm span Internal Wavelength Calibrator C12 HCN C12HCN + C12 CO + C13 CO
2 Typical values, measured at 0 dBm @ 1550 nm. 3 BOSA 100 specs may depend on the laser model used, please contact [email protected] for information on your laser. Specifications in this table are given for a LUNA Phoenix 1400 tunable laser (C band option) and an Agilent 81640A tunable laser (C+L option).
7 8

BOSA
Options for 200 series
Integrated in the same mainframe, BOSA options add multiple measurement capabilities to your unit, making it a real all-terrain instrument for your research lab. Additional measurement modes with specific software can be selected when options are installed.
Option 210 – Tunable laser output This option provides access to the internal tunable laser source included in BOSA200 series so that it can be used for additional applications. BOSA TLS is a high-quality external cavity laser with very good scanning performance. It can be controlled through GPIB or Ethernet interfaces with SCPI commands.
BOSA option 210 C band model C+L band model
Wavelength range 1516-1565 1520-1630 Scanning repeatability ±1.5 pm ±2 pm Tuning speed 1-100 nm/s Output power > 1 mW Side-mode suppression >43 dB >45 dB Relative intensity noise <-145 dB/Hz <-140 dB/Hz Laser linewidth <1 MHz Trigger output BNC (others on request)
Option 220 – Component analyzer
This option turns your BOSA into a passive component analyzer (option 210 is required). Including a high-dynamic range (>70 dB) measurement port synchronized with the TLS sweep, the response of optical filters, Bragg gratings, etc. can be measured.
Connect a passive optical device between the AUX Output and AUX Input ports of your BOSA and the spectral profile of insertion loss (IL) and return loss (RL) of your passive optical devices can be measured with great detail and precision thanks to the benefits of BOSA technology.
Option 220 has its own optimized measurement GUI
but also shares many of the advanced functionalities of BOSA: - Fully programmable with SCPI commands through
GPIB or Ethernet interfaces. Build you own monitoring applications easily!
- Internal reference gas cell for wavelength referencing and locking allows great accuracy.
- Simultaneous measurement of insertion and return losses.
- Dual polarization scanning for PDL-independent measurement.
BOSA option 220 C band model C+L band model
Wavelength range 1516-1565 nm 1521-1630 nm
Wavelength accuracy ±1 pm ±2 pm Power accuracy ±0.2 dB
Polarization measurement 2 orthogonal polarization states
(+Option 230) Pol. Dependent Losses Output power >0 dBm Sensitivity (IL) -70 dBm Calibrated input range +10 dBm to -70 dBm Sensitivity (RL) -45 dBm Measurement time 1s for 10 nm
9

BOSA
Options for 100 & 200 series
Option 230 – Polarimetry extension Option 300 – Phase measurementWith this option, you can turn your BOSA into the most advanced tool for polarization analysis. This option is not a stand-alone module but an extension to the spectrum analysis module and the component analyzer module.
When using the optical spectrum analysis module with option 230 activated, the spectrally-resolved state of polarization (SOP) can be measured. Use markers to measure polarization differences between different light sources or different spectral components. You can also check the polarization changes of a signal under different testing conditions.
The continuous evolution of the state of polarization can also be measured. Select a portion of the measured span to plot the evolution of the SOP with high resolution.
This enables real-time measurement of the instantaneous differential group delay (DGD) of the channels present in an in-service DWDM link. By monitoring DGD over time, polarization mode dispersion (PMD) of the fiber can be measured.
Aragon Photonics’ BOSA Option 300 (BOSAphase) turns the BOSA into an Optical Complex Spectrum Analyzer (OCSA) that still uses the 10MHz resolution from his brother BOSA and takes advantage of the Brillouin effect to obtain the optical phase of modulated signals.
Working with a Pulse Pattern Generator (PPG) BOSAphase provides Time domain information useful to characterize new optical advanced modulation formats in a reliable and fast measurement equipment. Measure the eye-diagram, constellation and time-resolved chirp of your signals. A must-have for advanced modulation formats and pulsed sources analysis.
BOSA option 300 (BOSAphase)
C band C+L band
Wavelength range 1525-1565 nm 1525-1610 nm
Bandwidth 80 MHz to full span
Pattern frequency range
88-1450 MHz
Phase accuracy ±1 deg
Electrical reference input power
+5 to -10 dBm
Sensitivity for phase measurement
-60 dBm
Measurement time 2s for 10 nm
9 10

BOSA
Phase measurement features & examples
Eye-diagram The eye diagram represents the possible transitions that occur in a modulated signal, giving a clear idea of the quality of the signal. Measuring the eye diagram of high bit-rate signals gives rise to noisy traces and with low bit-depth. With BOSAphase the measurement is carried out in the spectral domain and the measurement bandwidth is orders of magnitude lower than the measured, virtually suppressing the noise.
For phase measurements, only the I and Q eye diagrams can be measured as they require demodulation. However, as BOSAphase performs its measurement with no need for demodulation, the real phase eye diagram can be obtained. This allows as shown in the example measurement below, rendering the multi-level phase eye diagram of a QPSK modulation.
Constellation The constellation diagram normally shows the sampled points of a signal modulated in amplitude and/or phase in phase (I) and quadrature (Q) after a demodulator. With BOSAphase not only the sampling point is represented, but the complete I-Q transition plot, showing much more detail from the modulator performance and allowing the assessment of complex impairments distorting the signal.
Time-Resolved Chirp Frequency chirp is a critical parameter that is very difficult to measure due to the lack of appropriate tools. The time-resolved chirp (TRC) represents the instantaneous frequency drift of a signal modulated in amplitude and is normally measured using FROG methods that have low sensitivity, high noise and poor repeatability. From a BOSAphase measurement, the TRC is easily extracted as the derivative of the instantaneous phase, rendering the TRC with good detail. Calculating the alpha parameter (aka LEF) is also very direct.
Complex transfer function Measuring the complex spectrum of a frequency comb before and after propagation through a device or medium under test and simply dividing the resulting complex spectra gives you its complex transfer function. Dispersive effects can be measured using this technique
11
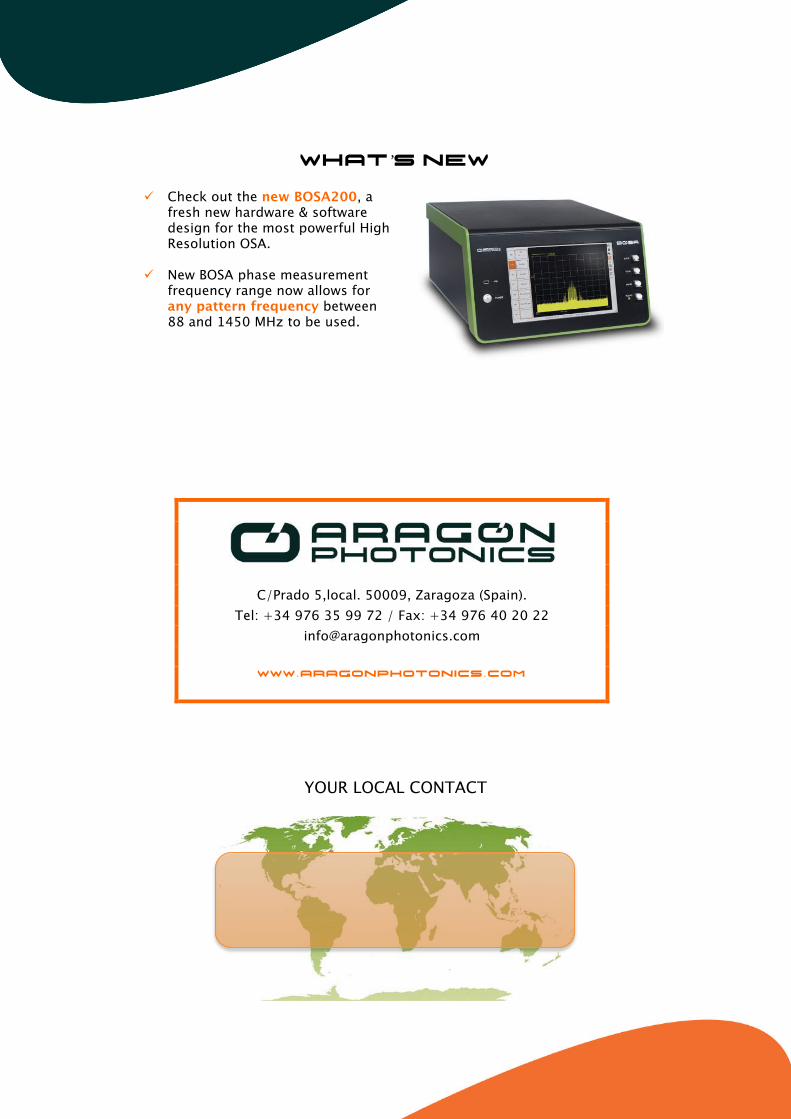
WHAT’S NEW
ü Check out the new BOSA200, a
fresh new hardware & software design for the most powerful High Resolution OSA.
ü New BOSA phase measurement
frequency range now allows for any pattern frequency between 88 and 1450 MHz to be used.
C/Prado 5,local. 50009, Zaragoza (Spain). Tel: +34 976 35 99 72 / Fax: +34 976 40 20 22
www.aragonphotonics.com
YOUR LOCAL CONTACT


