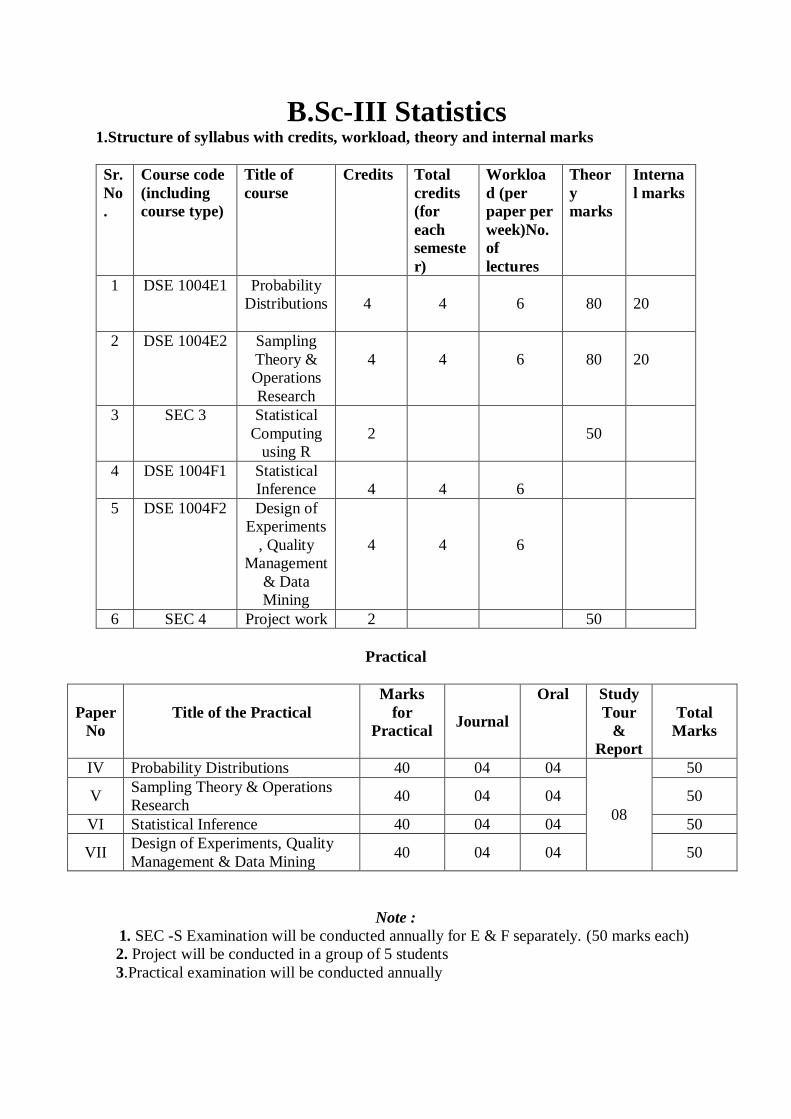
B.Sc-III Statistics 1.Structure of syllabus with credits, workload, theory and internal marks Sr. No . Course code (including course type) Title of course Credits Total credits (for each semeste r) Workloa d (per paper per week)No. of lectures Theor y marks Interna l marks 1 DSE 1004E1 Probability Distributions 4 4 6 80 20 2 DSE 1004E2 Sampling Theory & Operations Research 4 4 6 80 20 3 SEC 3 Statistical Computing using R 2 50 4 DSE 1004F1 Statistical Inference 4 4 6 5 DSE 1004F2 Design of Experiments , Quality Management & Data Mining 4 4 6 6 SEC 4 Project work 2 50 Practical Paper No Title of the Practical Marks for Practical Journal Oral Study Tour & Report Total Marks IV Probability Distributions 40 04 04 08 50 V Sampling Theory & Operations Research 40 04 04 50 VI Statistical Inference 40 04 04 50 VII Design of Experiments, Quality Management & Data Mining 40 04 04 50 Note : 1. SEC -S Examination will be conducted annually for E & F separately. (50 marks each) 2. Project will be conducted in a group of 5 students 3.Practical examination will be conducted annually
Transcript
B.Sc-III Statistics 1.Structure of syllabus with credits, workload, theory and internal marks
Sr.
No
.
Course code
(including
course type)
Title of
course
Credits Total
credits
(for
each
semeste
r)
Workloa
d (per
paper per
week)No.
of
lectures
Theor
y
marks
Interna
l marks
1 DSE 1004E1 Probability
Distributions
4
4
6
80
20
2 DSE 1004E2 Sampling
Theory &
Operations
Research
4
4
6
80
20
3 SEC 3 Statistical
Computing
using R
2
50
4 DSE 1004F1 Statistical
Inference
4
4
6
5 DSE 1004F2 Design of
Experiments
, Quality
Management
& Data
Mining
4
4
6
6 SEC 4 Project work 2 50
Practical
Paper
No
Title of the Practical
Marks
for
Practical
Journal
Oral Study
Tour
&
Report
Total
Marks
IV Probability Distributions 40 04 04
08
50
V Sampling Theory & Operations
Research 40 04 04 50
VI Statistical Inference 40 04 04 50
VII Design of Experiments, Quality
Management & Data Mining 40 04 04 50
Note :
1. SEC -S Examination will be conducted annually for E & F separately. (50 marks each)
2. Project will be conducted in a group of 5 students
3.Practical examination will be conducted annually
2.Eqivalence of syllabus
Semester
No.
Paper No. Title of Old paper Title of New
paper
Course code
1 IX Probability
Distributions I
Probability
Distributions
DSE 1004E1
X Statistical Inference I Sampling
Theory &
Operations
Research
DSE 1004E2
XI Design of
Experiments
XII Operations Research
2 XIII Probability
Distributions II
Statistical
Inference
DSE 1004F1
XIV Statistical Inference
II
Design of
Experiments,
Quality
Management &
Data Mining
DSE 1004F2
XV Sampling Theory
XVI Quality management
and Data mining
3.Structure of assessment and question paper pattern
1.Internal Evaluation per paper
Semester Evaluation Marks
V 1. Unit test
2. Multiple choice questions.
10
10
VI 1. Unit test
2. Multiple choice questions.
10
10
2.Theory Evaluation per paper/course for each semester
Nature of Theory Question Paper Total marks 80
Instructions:
1) All the questions are compulsory.
2) Answers to the two sections should be written in same answer book.
3) Figures to the right indicate full marks.
4) Draw neat labeled diagrams wherever necessary.
5) Use of log table/calculator is allowed.
SECTION-I Total Marks: 40
Q.1. Choose correct alternative. (8 marks)
i) A) B) C) D)
ii) A) B) C) D)
iii) A) B) C) D)
iv) A) B) C) D)
v) A) B) C) D)
vi) A) B) C) D)
vii) A) B) C) D)
viii) A) B) C) D)
Q.2. Attempt any two. (16 marks)
A)
B)
C)
Q.3. Attempt any four. (16 marks)
a)
b)
c)
d)
e)
f)
Nature of question paper for Section II is same as Section I
3. Nature of practical papers:
(i) Each practical question paper must contain Four questions.
(ii) Each question should contain Two bits from different units.
(iii) Student should attempt Any Two questions.
(iv) Each question should carry 20 marks and to be distributed according to
Following points:
(a) Aim of the Experiment: 2 Marks
(b) Statistical formulae: 4 Marks
(c) Observation Tables: 6 Marks
(d) Calculations: 6 Marks
(e) Conclusion/ result of the experiment :2 Marks.
4.Cours/paper wise syllabus
B. Sc. Part – III Statistics
Semester: V Paper- DSE 1004E1
Probability Distributions
Marks: 80 Theory: 72 Hours Credits 4
Section I: Probability Distributions-I
Course Objectives: To understand the concept of standard continuous distributions. To study various real-life situations where these continuous distributions are applicable.
To learn the concept of truncated distribution and its applications.
To understand the concept of multivariate random variables.
Course Outcomes: The students will acquire
knowledge of important univariate distributions such as Laplace, Cauchy, Lognormal, Weibull, Logistic, Pareto, Power Series Distribution.
knowledge of Multinomial and Bivariate Normal Distribution.
knowledge of Truncated Distributions. Knowledge to apply standard continuous probability distributions to different real life
data/situations.
Unit Content Hours
Allotted
1 Univariate Continuous Probability Distributions
1.1 Laplace (Double Exponential) Distribution P. d. f. with parameters (μ, λ), Nature of the probability curve, Distribution
function, quartiles, m. g. f., mean, variance, moments, β1, β2, γ1 and γ2,
Laplace distribution as the distribution of the difference of two i. i. d. exponential variates with parameter θ, examples and problems.
1.3 Cauchy Distribution P. d. f. with parameters (μ, λ), nature of the probability curve, distribution
function, quartiles, non-existence of moments, additive property for two
independent Cauchy variates (statement only), statement of distribution of the
sample mean, relationship with uniform and Students’ t distribution, distribution of X/Y where X and Y are i. i. d. N(0, 1), examples and problems.
1.4 Weibull Distribution P. d. f. with parameters (α, β), distribution function, quartiles, mean and
variance, coefficient of variation, relation with gamma and exponential
distribution, examples and problems.
15
2
Univariate and Multivariate Probability Distributions
2. 1 Logistic distribution:
P.d.f. with parameters (μ,σ ) ,c.d.f., mean, mode , variance, skewness using
12
mode, applications. 2..2 Paroto distribution:
P.d.f. with parameters (α, β), mean, variance, mode, skewness using mode,
applications.
2.3 Power series distribution:
P.m.f. mean, mode, variance, Binomial, Poisson, Geometric and negative
binomial distribution as particular cases of power series distribution.
2.4 Multinomial distribution:
P.m.f, m.g.f., marginal distribution, mean, variance, covariance, variance and
covariance matrix, correlation coefficient, additive property, Trinomial distribution as particular case of multinomial distribution.
3 Truncated Distributions Truncated distribution as conditional distribution, truncation to the right, left
and on both sides. Binomial distribution B(n, p) left truncated at X = 0 (value
zero not observable ), its p.m.f, mean, variance.
Poisson distribution P(m), left truncated at X = 0 (value zero not observable), its p.m.f., mean and variance.
Normal distribution N(µ, σ2) truncated
(i) to the left below a (ii) to the right above b
(iii) to the left below a and to the right above b, its p.d.f. and mean.
Exponential distribution with parameter left truncated below a, its p.d.f., mean and variance. Examples and problems.
8
4 Bivariate Normal Distribution
p. d. f. of a bivariate normal distribution, BN(𝜇1,𝜇2, 𝜎12, 𝜎2
2, 𝜌) marginal and
conditional distributions, identification of parameters, conditional
expectation and conditional variance, regression of Y on X and of X on Y., independence and uncorrelated-ness imply each other, m. g. f and moments.
Distribution of aX + bY + c, where a, b and c are real numbers.
Cauchy distribution as the distribution of Z = X/Y where
(X,Y)~BN(0,0,𝜎21,𝜎2
2, ρ), Examples and problems.
10
Books Recommended
1. Cramer H.: Mathematical Methods of Statistics, Asia Publishing House, Mumbai.
2. Mood, A. M., Graybill K, Bose. D. C.: Introduction to Theory of Statistics. (Third edition) Mc-GrawHiil Series.
3. Lindgren B. W.: Statistical Theory (Third Edition), Collier MacmillanInternational Edition,
Macmillan Publishing Co. Inc. New York. 4. Hogg, R. V. and Craig A. T. : Introduction to Mathematical Statistics (Third Edition), Macmillan Publishing
Company, Inc. 866, 34d Avenue, New York, 10022.
5. Sanjay Arora and BansiLal: New Mathematical Statistics (First Edition), Satya Prakashan, 16/17698, New Market, New Delhi, 5 (1989).
6. Gupta S. C and Kapoor V. K.: Fundamentals of Mathematical Statistics, Sultan Chand and Sons,
88, Daryaganj, New Delhi 2.
7. Rohatgi V. K.: An Introduction to Probability Theory and Mathematical Statistics, Wiley Eastern Ltd., New Delhi.
8. Feller. W.: An Introduction of Probability Theory and its Applications, Wiley Eastern Ltd. Mumbai.
9. Jhonson and Kotz: Continuous Univariate Distributions I and II : Discrete Distributions
: Multivariate Distributions 10. Bhat B. R.: Modern Probability Theory. New Age International.
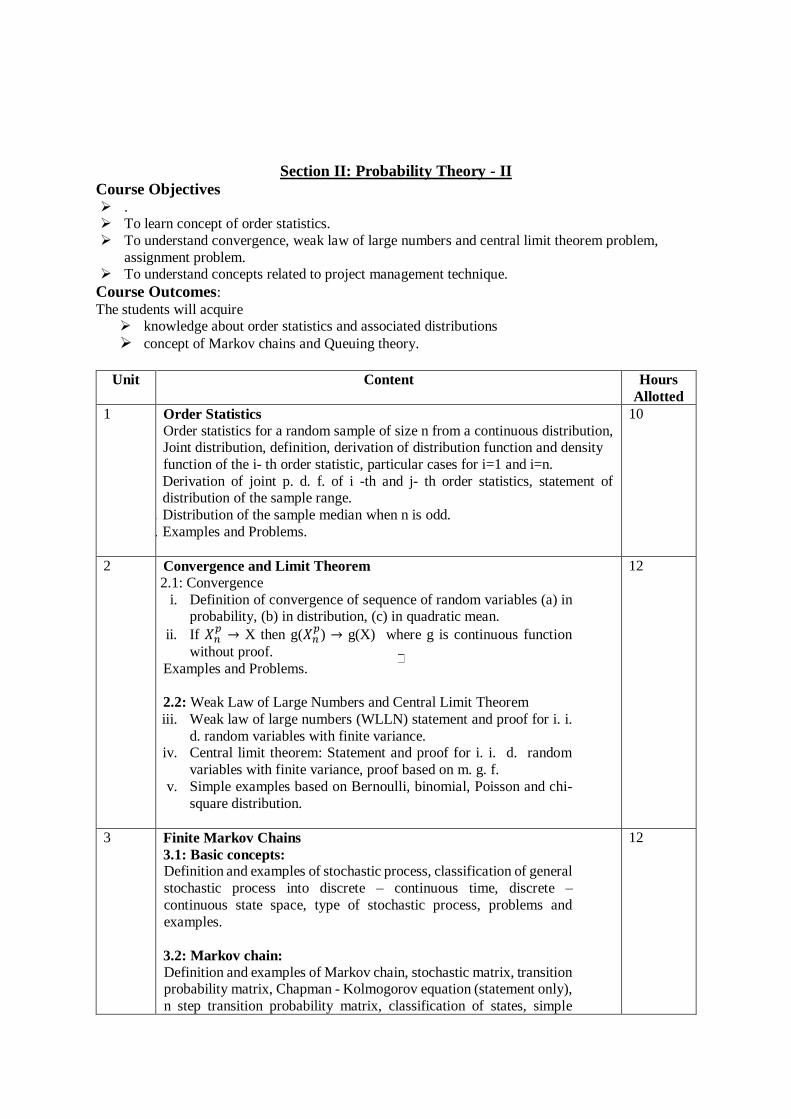
Section II: Probability Theory - II
Course Objectives . To learn concept of order statistics.
To understand convergence, weak law of large numbers and central limit theorem problem,
assignment problem. To understand concepts related to project management technique.
Course Outcomes:
The students will acquire knowledge about order statistics and associated distributions
concept of Markov chains and Queuing theory.
Unit Content Hours
Allotted
1 Order Statistics
Order statistics for a random sample of size n from a continuous distribution, Joint distribution, definition, derivation of distribution function and density
function of the i- th order statistic, particular cases for i=1 and i=n.
i. Derivation of joint p. d. f. of i -th and j- th order statistics, statement of distribution of the sample range.
ii. Distribution of the sample median when n is odd.
iii. Examples and Problems.
10
2 Convergence and Limit Theorem
2.1: Convergence
i. Definition of convergence of sequence of random variables (a) in probability, (b) in distribution, (c) in quadratic mean.
ii. If 𝑋𝑛𝑝
→ X then g(𝑋𝑛𝑝
) → g(X) where g is continuous function
without proof.
Examples and Problems.
2.2: Weak Law of Large Numbers and Central Limit Theorem
iii. Weak law of large numbers (WLLN) statement and proof for i. i.
d. random variables with finite variance. iv. Central limit theorem: Statement and proof for i. i. d. random
variables with finite variance, proof based on m. g. f.
v. Simple examples based on Bernoulli, binomial, Poisson and chi-
square distribution.
12
3 Finite Markov Chains
3.1: Basic concepts: Definition and examples of stochastic process, classification of general
stochastic process into discrete – continuous time, discrete –
continuous state space, type of stochastic process, problems and
examples.
3.2: Markov chain:
Definition and examples of Markov chain, stochastic matrix, transition probability matrix, Chapman - Kolmogorov equation (statement only),
n step transition probability matrix, classification of states, simple
12
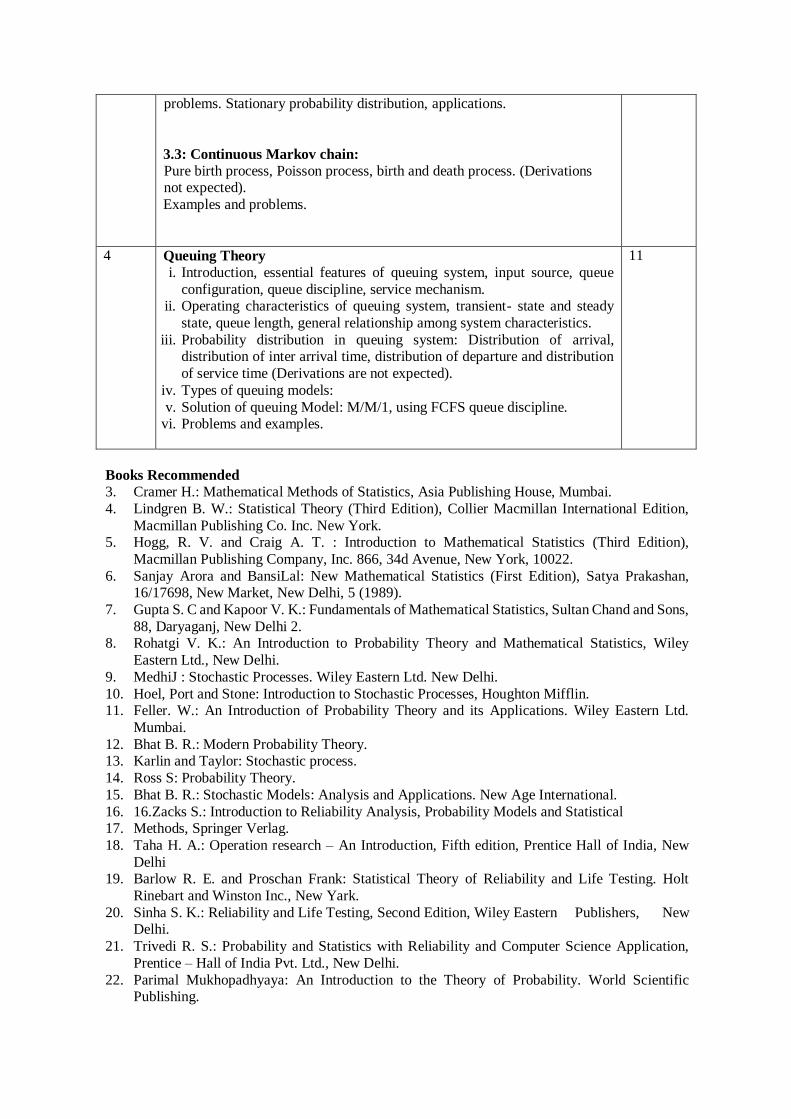
problems. Stationary probability distribution, applications.
3.3: Continuous Markov chain:
Pure birth process, Poisson process, birth and death process. (Derivations not expected).
Examples and problems.
4 Queuing Theory i. Introduction, essential features of queuing system, input source, queue
configuration, queue discipline, service mechanism. ii. Operating characteristics of queuing system, transient- state and steady
state, queue length, general relationship among system characteristics.
iii. Probability distribution in queuing system: Distribution of arrival, distribution of inter arrival time, distribution of departure and distribution
of service time (Derivations are not expected).
iv. Types of queuing models:
v. Solution of queuing Model: M/M/1, using FCFS queue discipline. vi. Problems and examples.
11
Books Recommended
3. Cramer H.: Mathematical Methods of Statistics, Asia Publishing House, Mumbai.
4. Lindgren B. W.: Statistical Theory (Third Edition), Collier Macmillan International Edition,
Macmillan Publishing Co. Inc. New York. 5. Hogg, R. V. and Craig A. T. : Introduction to Mathematical Statistics (Third Edition),
Macmillan Publishing Company, Inc. 866, 34d Avenue, New York, 10022.
6. Sanjay Arora and BansiLal: New Mathematical Statistics (First Edition), Satya Prakashan, 16/17698, New Market, New Delhi, 5 (1989).
7. Gupta S. C and Kapoor V. K.: Fundamentals of Mathematical Statistics, Sultan Chand and Sons,
88, Daryaganj, New Delhi 2. 8. Rohatgi V. K.: An Introduction to Probability Theory and Mathematical Statistics, Wiley
Eastern Ltd., New Delhi.
9. MedhiJ : Stochastic Processes. Wiley Eastern Ltd. New Delhi.
10. Hoel, Port and Stone: Introduction to Stochastic Processes, Houghton Mifflin. 11. Feller. W.: An Introduction of Probability Theory and its Applications. Wiley Eastern Ltd.
Mumbai.
12. Bhat B. R.: Modern Probability Theory. 13. Karlin and Taylor: Stochastic process.
14. Ross S: Probability Theory.
15. Bhat B. R.: Stochastic Models: Analysis and Applications. New Age International.
16. 16.Zacks S.: Introduction to Reliability Analysis, Probability Models and Statistical 17. Methods, Springer Verlag.
18. Taha H. A.: Operation research – An Introduction, Fifth edition, Prentice Hall of India, New
Delhi 19. Barlow R. E. and Proschan Frank: Statistical Theory of Reliability and Life Testing. Holt
Rinebart and Winston Inc., New Yark.
20. Sinha S. K.: Reliability and Life Testing, Second Edition, Wiley Eastern Publishers, New Delhi.
21. Trivedi R. S.: Probability and Statistics with Reliability and Computer Science Application,
Prentice – Hall of India Pvt. Ltd., New Delhi.
22. Parimal Mukhopadhyaya: An Introduction to the Theory of Probability. World Scientific Publishing.
B. Sc. Part – III Statistics
Semester: V Paper- DSE 1004E2
Sampling Theory & Operation Research
Marks: 80 Theory: 72 Hours Credits 4
Section I: Sampling Theory
Course Objectives To design and execute sample surveys. To learn some sampling methods and its applications in appropriate situations.
To estimate population parameters using sampling distribution of estimator and obtaining
estimators of standard error in estimation. To determine adequate sample size for various sampling procedures.
Course Outcomes: The students shall get basic knowledge of complete enumeration and sample, sampling frame sampling distribution,
sampling and non-sampling errors, principle steps in sample surveys, sample size determination,
limitations of sampling etc. introduced to various sampling methods such as simple random sampling, stratified random
sampling, systematic sampling and cluster sampling.
an idea of conducting sample surveys and selecting appropriate sampling techniques.
knowledge of comparing various sampling techniques. knowledge of ratio and regression estimators.
Unit Content Hours
Allotted
1 Basic Terminology and Simple Random Sampling
1.1: Basic Terminology
Concept of distinguishable elementary units, sampling units, sampling frame, random sampling and non-random sampling. Advantages of
sampling method over census method, objectives of a sample survey,
Designing a questionnaire, Characteristics of a good questionnaire, Concept of sampling and non-sampling errors. Handling of non- response
cases.
1.2: Simple random sampling i. Simple random sampling from finite population of size N with
replacement (SRSWR) and without replacement (SRSWOR):
Definitions, population mean and population total as parameters, inclusion probabilities.
ii. Following results with proof.
a) In SRSWOR, the probability of a specified unit being selected in sample at any given draw is equal to 1/N.
b) In SRSWOR, the probability of a specific unit included in the
sample is n/N. c) In SRSWOR, the probability of drawing a sample of size ‘n’ from
a population of size N units is 1/ (𝑁
𝑛).
d) In SRSWR, the probability of a specific unit included in the sample
is 1- (1 −1
𝑁)
𝑛
e) In SRSWR, the probability of drawing a sample of size ‘n’ from a
population of size N units is 1/ 𝑁𝑛
iii. Sample mean �̅� as an estimator of population mean �̅�𝑁, derivation of
its expectation, standard error and estimator of standard error.
15
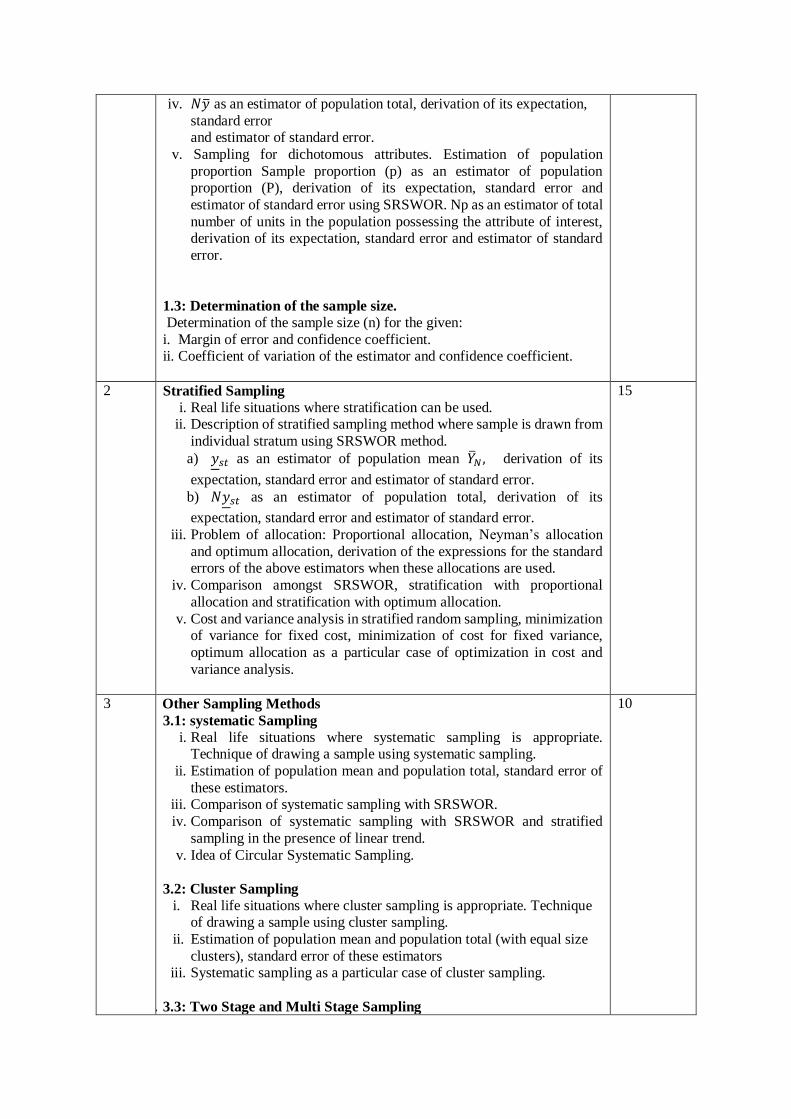
iv. 𝑁�̅� as an estimator of population total, derivation of its expectation,
standard error and estimator of standard error.
v. Sampling for dichotomous attributes. Estimation of population
proportion Sample proportion (p) as an estimator of population proportion (P), derivation of its expectation, standard error and
estimator of standard error using SRSWOR. Np as an estimator of total
number of units in the population possessing the attribute of interest, derivation of its expectation, standard error and estimator of standard
error.
1.3: Determination of the sample size.
Determination of the sample size (n) for the given:
i. Margin of error and confidence coefficient. ii. Coefficient of variation of the estimator and confidence coefficient.
2 Stratified Sampling
i. Real life situations where stratification can be used. ii. Description of stratified sampling method where sample is drawn from
individual stratum using SRSWOR method.
a) 𝑦𝑠𝑡 as an estimator of population mean �̅�𝑁 , derivation of its
expectation, standard error and estimator of standard error.
b) 𝑁𝑦𝑠𝑡 as an estimator of population total, derivation of its
expectation, standard error and estimator of standard error.
iii. Problem of allocation: Proportional allocation, Neyman’s allocation
and optimum allocation, derivation of the expressions for the standard errors of the above estimators when these allocations are used.
iv. Comparison amongst SRSWOR, stratification with proportional
allocation and stratification with optimum allocation.
v. Cost and variance analysis in stratified random sampling, minimization of variance for fixed cost, minimization of cost for fixed variance,
optimum allocation as a particular case of optimization in cost and
variance analysis.
15
3 Other Sampling Methods
3.1: systematic Sampling
i. Real life situations where systematic sampling is appropriate. Technique of drawing a sample using systematic sampling.
ii. Estimation of population mean and population total, standard error of
these estimators. iii. Comparison of systematic sampling with SRSWOR.
iv. Comparison of systematic sampling with SRSWOR and stratified
sampling in the presence of linear trend.
v. Idea of Circular Systematic Sampling.
3.2: Cluster Sampling
i. Real life situations where cluster sampling is appropriate. Technique of drawing a sample using cluster sampling.
ii. Estimation of population mean and population total (with equal size
clusters), standard error of these estimators iii. Systematic sampling as a particular case of cluster sampling.
iv. 3.3: Two Stage and Multi Stage Sampling
10
Idea of two-stage and multistage sampling.
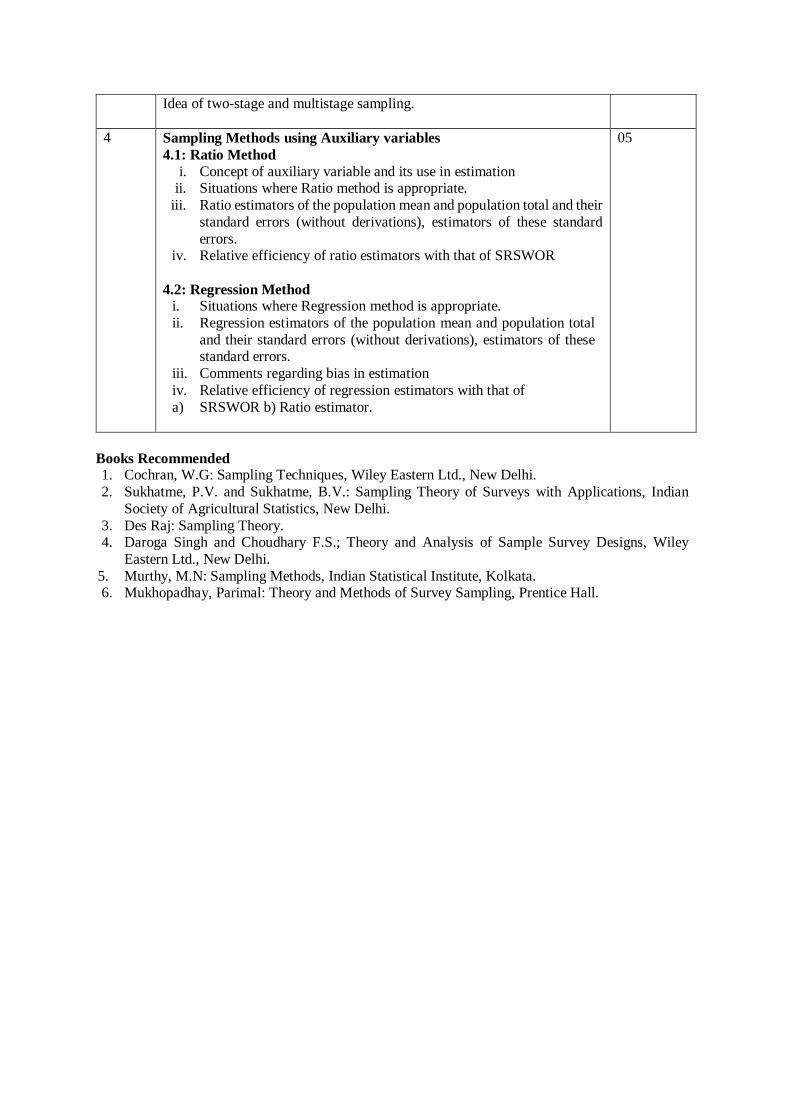
4 Sampling Methods using Auxiliary variables
4.1: Ratio Method
i. Concept of auxiliary variable and its use in estimation ii. Situations where Ratio method is appropriate.
iii. Ratio estimators of the population mean and population total and their
standard errors (without derivations), estimators of these standard
errors. iv. Relative efficiency of ratio estimators with that of SRSWOR
4.2: Regression Method i. Situations where Regression method is appropriate.
ii. Regression estimators of the population mean and population total
and their standard errors (without derivations), estimators of these standard errors.
iii. Comments regarding bias in estimation
iv. Relative efficiency of regression estimators with that of
2. Sukhatme, P.V. and Sukhatme, B.V.: Sampling Theory of Surveys with Applications, Indian
Society of Agricultural Statistics, New Delhi.
3. Des Raj: Sampling Theory. 4. Daroga Singh and Choudhary F.S.; Theory and Analysis of Sample Survey Designs, Wiley
Eastern Ltd., New Delhi.
5. Murthy, M.N: Sampling Methods, Indian Statistical Institute, Kolkata. 6. Mukhopadhay, Parimal: Theory and Methods of Survey Sampling, Prentice Hall.
Section II: Operation Research
Course Objectives To convert given practical situations to the format of linear programming problem. To learn concept of optimal solution.
To understand special cases of LPP viz. transportation problem, assignment problem.
To understand decision theory.
Course Outcomes:
The students will acquire
Concept of Linear programming problem. Knowledge of solving LPP by graphical and Simplex method.
Knowledge of Transportation, Assignment and Sequencing problems.
Knowledge of types of decision making environments and to take decisions in such environments.
Knowledge of simulation technique and Monte Carlo technique of simulation.
Unit Content Hours
Allotted
1 Linear programming
1.1: Basic concepts
Statement of the Linear Programming Problem (LPP), formulation of problem as Linear programming problem. Definition of (i) a slack variable, (ii) a
surplus variable. L.P. problem in (i) canonical form, (ii) standard form.
Definition of (i) a solution, (ii) a feasible solution, (iii) basic variable and non-basic variable, (iv) a basic feasible solution, (v) a
degenerate and a non-generate solution, (vi) an optimal solution.
1.2: Solution of L.P.P.
i. Graphical Method: Solution space, obtaining an optimal solution, unique
and non- unique optimal solutions.
ii. Simplex Method: a) Initial basic feasible solution (IBFS) is readily available: obtaining an
IBFS, criteria for deciding whether obtained solution is optimal, criteria
for unbounded solution, more than one optimal solution. b) IBFS not readily available: introduction of artificial variable, Big-M
method, modified objective function, modifications and applications of
simplex method to L.P.P., criterion for no solution.
1.3: Duality Theory:
Writing dual of a primal problem, solution of L.P.P. with artificial variable.
Examples and problems.
15
2 Transportation and Assignment Problems
2.1: Transportation problem
i. Transportation problem (T. P.), statement of T. P., balanced and unbalance T. P.
ii. Methods of obtaining initial basic feasible solution of T.P. (a) North West
corner rule (b)Method of matrix minima (least cost method), (c) Vogel's approximation (VAM).
iii. MODI method of obtaining Optimal solution of T. P, uniqueness and non-
uniqueness of optimal solutions, degenerate solution. iv. Examples and problems.
2.2: Assignment Problem
12
i. Statement of an assignment problem, balanced and unbalanced assignment problem, relation with T.P, optimal solution of an assignment problem
using Hungarian method.
ii. Examples and problems.
2.3: Sequencing Problem
i. Introduction. Statement of problem.
ii. Procedure of processing n jobs on two machines. iii. Procedure of processing n jobs on three machines and m
machines. Computations of elapsed time and idle times.
iv. Examples and problems.
3 Decision Theory
i. Introduction, steps in decision theory approach.
ii. Type of decision-making environments. iii. Decision making under uncertainty: Criteria of optimism, criteria of
pessimism, equally likely decision criterion, criterion of regret.
iv. Decision making under risk: Expected monetary value, expected
opportunity loss, expected value of perfect information. v. Examples and problems.
08
4 Simulation Techniques Meaning of simulation, Monte Carlo simulation, advantages and
disadvantages of simulation, definition and properties of random numbers,
generation of pseudo random numbers, Mid-Square method, Techniques of
generating random numbers from uniform distribution, Tests for randomness and uniformity distribution, random variate generation using inverse cdf
method, random variate generation from Bernoulli, Binomial, Poisson,
Geometric, Exponential and normal distributions.
10
Book Recommended 1. Gass E.: Linear Programming Method and Applications, Narosa Publishing House, New Delhi.
2. Shrinath L. S.: Linear Programming.
3. Taha H. A.: Operation research – An Introduction, Fifth Edition, Prentice Hall of India, New Delhi. 4. Saceini, Yaspan, Friedman: Operations Research Method and Problems, Wiley International
Edition.
5. Shrinath, L. S.: Linear Programming, Affiliated East-West Press Pvt. Ltd., New Delhi. 6. Phillips, D. T., Ravindra, A., Solberg, J.: Operations Research Principles and Practice, John Wiley
and Sons Inc.
7. Sharma, J. K.: Mathematical Models in Operations Research, Tau McGraw Hill Publishing
Company Ltd., New Delhi. 8. Kapoor, V. K.; Operations Research, Sultan Chand and Sons, New Delhi.
9. Gupta, P. K. and Hira, D. S.: Operations Research, S. Chand and Company Ltd., New Delhi.
10. Luc Devroye:Non-Uniform Random Variate Generation, Springer – Verlag, New York. 11. Gentle, J. E.: Random Number Generation and Monte Carlo Methods, Springer- Verlag.
12. Robert, C. P. and Casella, G.: Monte Carlo Statistical methods, Springer-Verlag.
13. Rubinstien, R. Y.: Simulation and Monte Carlo Method, John Wiley, New York.
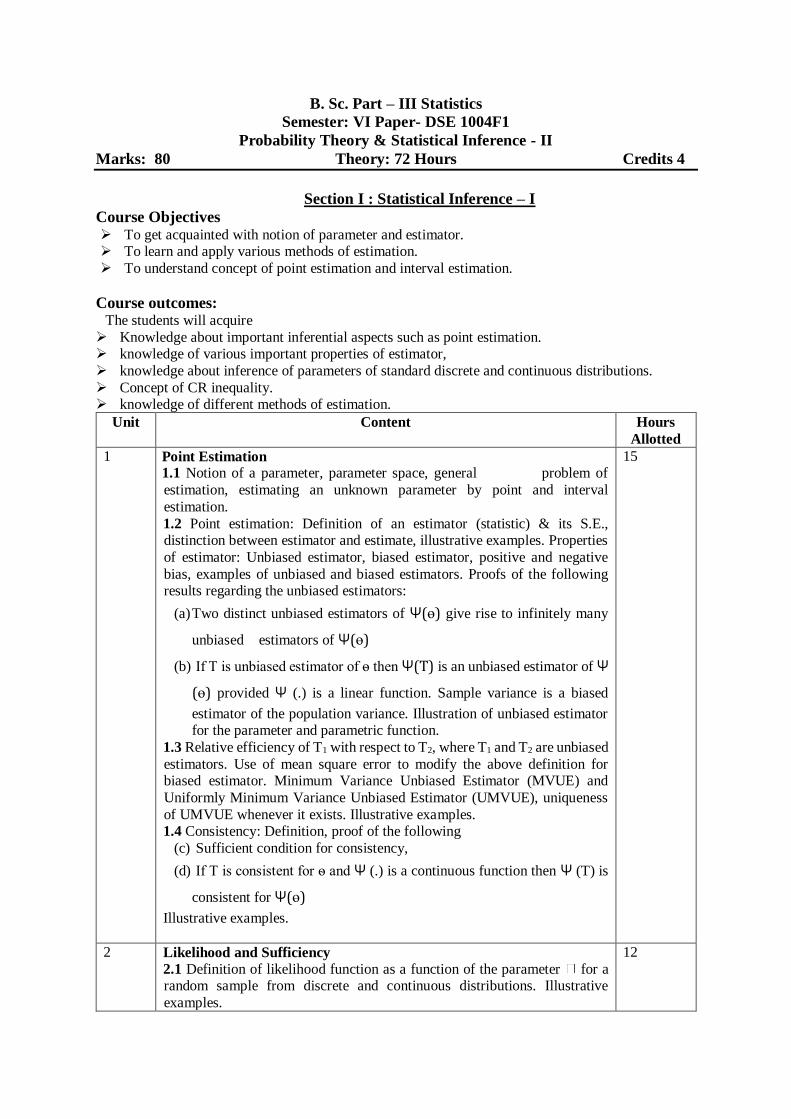
B. Sc. Part – III Statistics
Semester: VI Paper- DSE 1004F1
Probability Theory & Statistical Inference - II
Marks: 80 Theory: 72 Hours Credits 4
Section I : Statistical Inference – I
Course Objectives To get acquainted with notion of parameter and estimator. To learn and apply various methods of estimation.
To understand concept of point estimation and interval estimation.
Course outcomes: The students will acquire
Knowledge about important inferential aspects such as point estimation. knowledge of various important properties of estimator,
knowledge about inference of parameters of standard discrete and continuous distributions.
Concept of CR inequality. knowledge of different methods of estimation.
Unit Content Hours
Allotted
1 Point Estimation 1.1 Notion of a parameter, parameter space, general problem of
estimation, estimating an unknown parameter by point and interval
estimation.
1.2 Point estimation: Definition of an estimator (statistic) & its S.E., distinction between estimator and estimate, illustrative examples. Properties
of estimator: Unbiased estimator, biased estimator, positive and negative
bias, examples of unbiased and biased estimators. Proofs of the following results regarding the unbiased estimators:
(a) Two distinct unbiased estimators of Ψ(ɵ) give rise to infinitely many
unbiased estimators of Ψ(ɵ)
(b) If T is unbiased estimator of ѳ then Ψ(T) is an unbiased estimator of Ψ
(ɵ) provided Ψ (.) is a linear function. Sample variance is a biased
estimator of the population variance. Illustration of unbiased estimator for the parameter and parametric function.
1.3 Relative efficiency of T1 with respect to T2, where T1 and T2 are unbiased
estimators. Use of mean square error to modify the above definition for biased estimator. Minimum Variance Unbiased Estimator (MVUE) and
of UMVUE whenever it exists. Illustrative examples. 1.4 Consistency: Definition, proof of the following
(c) Sufficient condition for consistency,
(d) If T is consistent for ѳ and Ψ (.) is a continuous function then Ψ (T) is
consistent for Ψ(ɵ)
Illustrative examples.
15
2 Likelihood and Sufficiency
2.1 Definition of likelihood function as a function of the parameter for a random sample from discrete and continuous distributions. Illustrative
examples.
12
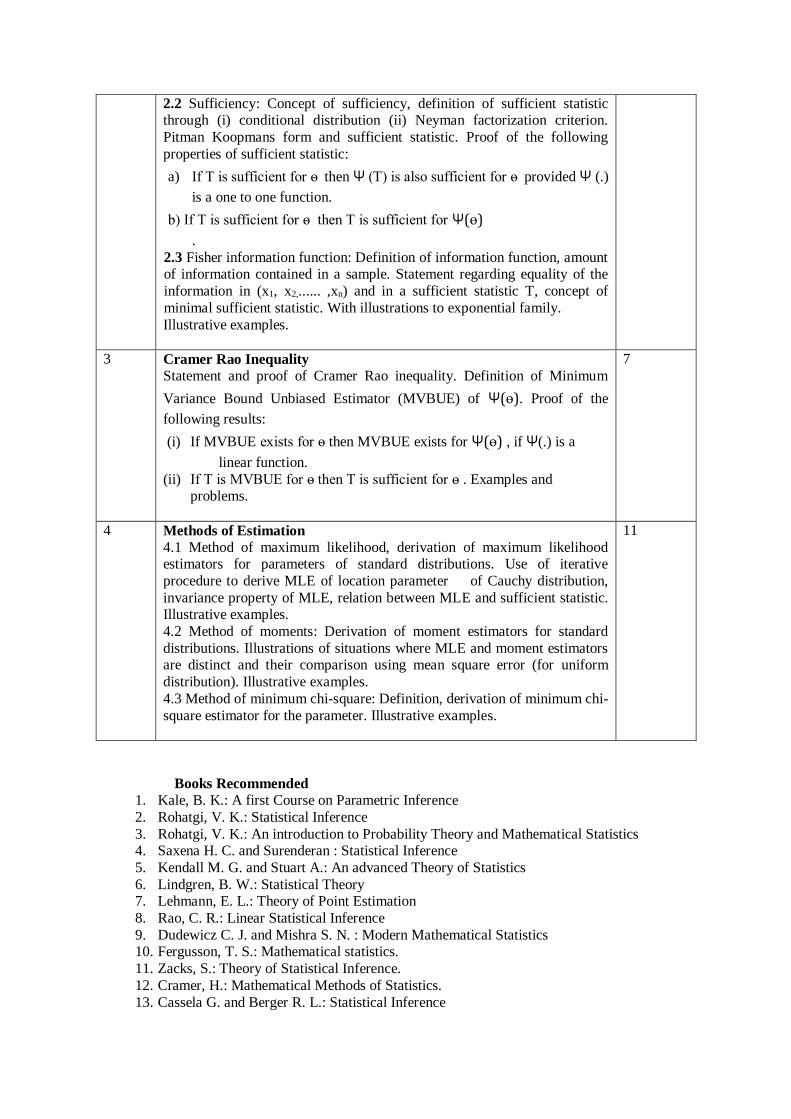
2.2 Sufficiency: Concept of sufficiency, definition of sufficient statistic through (i) conditional distribution (ii) Neyman factorization criterion.
Pitman Koopmans form and sufficient statistic. Proof of the following
properties of sufficient statistic:
a) If T is sufficient for ѳ then Ψ (T) is also sufficient for ѳ provided Ψ (.)
is a one to one function.
b) If T is sufficient for ѳ then T is sufficient for Ψ(ɵ)
.
2.3 Fisher information function: Definition of information function, amount of information contained in a sample. Statement regarding equality of the
information in (x1, x2,...... ,xn) and in a sufficient statistic T, concept of
minimal sufficient statistic. With illustrations to exponential family.
Illustrative examples.
3 Cramer Rao Inequality
Statement and proof of Cramer Rao inequality. Definition of Minimum
Variance Bound Unbiased Estimator (MVBUE) of Ψ(ɵ). Proof of the
following results:
(i) If MVBUE exists for ѳ then MVBUE exists for Ψ(ɵ) , if Ψ(.) is a
linear function.
(ii) If T is MVBUE for ѳ then T is sufficient for ѳ . Examples and problems.
7
4 Methods of Estimation
4.1 Method of maximum likelihood, derivation of maximum likelihood estimators for parameters of standard distributions. Use of iterative
procedure to derive MLE of location parameter of Cauchy distribution,
invariance property of MLE, relation between MLE and sufficient statistic. Illustrative examples.
4.2 Method of moments: Derivation of moment estimators for standard
distributions. Illustrations of situations where MLE and moment estimators are distinct and their comparison using mean square error (for uniform
distribution). Illustrative examples.
4.3 Method of minimum chi-square: Definition, derivation of minimum chi-
square estimator for the parameter. Illustrative examples.
11
Books Recommended
1. Kale, B. K.: A first Course on Parametric Inference
2. Rohatgi, V. K.: Statistical Inference
3. Rohatgi, V. K.: An introduction to Probability Theory and Mathematical Statistics 4. Saxena H. C. and Surenderan : Statistical Inference
5. Kendall M. G. and Stuart A.: An advanced Theory of Statistics
6. Lindgren, B. W.: Statistical Theory 7. Lehmann, E. L.: Theory of Point Estimation
8. Rao, C. R.: Linear Statistical Inference
9. Dudewicz C. J. and Mishra S. N. : Modern Mathematical Statistics 10. Fergusson, T. S.: Mathematical statistics.
11. Zacks, S.: Theory of Statistical Inference.
12. Cramer, H.: Mathematical Methods of Statistics.
13. Cassela G. and Berger R. L.: Statistical Inference
Section II: Statistical Inference – II
Course Objectives To understand concept of statistical hypothesis and use of its in real life situations. To learn MP and UMP test procedure and difference between them.
To understand Parametric and Nonparametric tests
Course outcomes: The students will get
Knowledge of interval estimation.
Acquainted with testing of hypotheses. Knowledge of nonparametric statistical inference and various tests.
Unit Content Hours
Allotted
1 Interval Estimation 1.1: Notion of interval estimation, definition of confidence interval, length of
confidence interval, confidence bounds. Definition of Pivotal quantity and its
us in obtaining confidence intervals and bounds.
1.2: Interval estimation for the following cases:
i. Mean 𝜇 of normal distribution (𝜎2known and 𝜎2 unknown).
ii. Variance 𝜎2 of normal distribution (𝜇 known and 𝜇 unknown).
iii. Difference between two means 𝜇 1- 𝜇 2, a) for a sample from bivariate normal population,
b) for samples from two independent normal populations.
iv. Ratio of variances for samples from two independent normal
populations. v. Mean of exponential distribution.
vi. Population proportion and difference of two population
proportions of two independent large samples. vii. Population median using order statistics.
viii. Illustrative examples.
11
2 Parametric Tests 2.1: Statistical hypothesis, problems of testing of hypothesis, definitions and
illustrations of simple hypothesis composite hypothesis, critical region, type I
and type II error, probabilities of type I & type II errors. Power of a test, p-value, size of a test, level of significance, problem of controlling probabilities
of type I & type II errors.
2.2: Definition of Most Powerful (MP) test. Statement and proof (sufficient
part) of Neyman-Pearson (NP) lemma for simple null hypothesis against
13
simple alternative hypothesis for construction of MP test. Examples of
construction of MP test of level 𝛼. 2.3: Power function of a test, power curve, definition of uniformly most
powerful (UMP) level 𝛼 test. Use of NP lemma for constructing UMP level
𝛼 test for one-sided alternative. Illustrative examples. 2.4: Likelihood Ratio Test: Procedure of likelihood ratio test, statement of its
properties, Likelihood Ratio test involving mean and variance of normal
population.
3 Sequential Tests
General theory of sequential analysis and its comparison with fixed sample
procedure. Wald’s SPRT of strength (𝛼, 𝛽), for simple null hypothesis against simple alternative hypothesis. Illustrations for standard distributions like
binomial, Poisson, exponential and normal. Graphical and tabular procedure
for carrying out the test. Illustrative examples.
09
4 Non- parametric Test
Notion of non-parametric statistical inference (test) and its comparison with
parametric statistical inference. Concept of distribution free statistic. Test procedure of:
i. Run test for one sample (i.e. test for randomness) and run test for
two independent sample problems.
ii. Sign test for one sample and two sample paired observations iii. Wilcoxon's signed rank test for one sample and two sample paired
observations.
iv. Mann-Whitney U - test (two independent samples) v. Median test
vi. Kolmogorov Smirnov test for one and for two independent samples.
12
Books Recommended
1. Kale, B. K.: A first Course on Parametric Inference
2. Rohatgi, V. K.: Statistical Inference 3. Rohatgi, V. K.: An introduction to Probability Theory andMathematical Statistics
4. Saxena H. C. and Surenderan : Statistical Inference
5. Kendall M. G. and Stuart A.: An advanced Theory of Statistics 6. Lindgren, B. W.: Statistical Theory
7. Cassela G. and Berger R. L.: Statistical Inference
8. Lehmann, E. L: Testing of Statistical Hypothesis
9. Rao, C. R.: Linear Statistical Inference 10. Dudewicz C. J. and Mishra S. N. : Modern Mathematical Statistics
11. Fergusson, T. S.: Mathematical statistics.
12. Zacks, S.: Theory of Statistical Inference. 13. Cramer, H.: Mathematical Methods of Statistics.
14. Gibbons, J. D.: Non-parametric Statistical Inference.
15. Doniel: Applied Non-parametric Statistics
16. Siegel, S.: Non-parametric Methods for the behavioral sciences. 17. Kunte, S.: Purophit, S. G. and Wanjale, S.K.: Lecture notes on Non-parametric Tests.
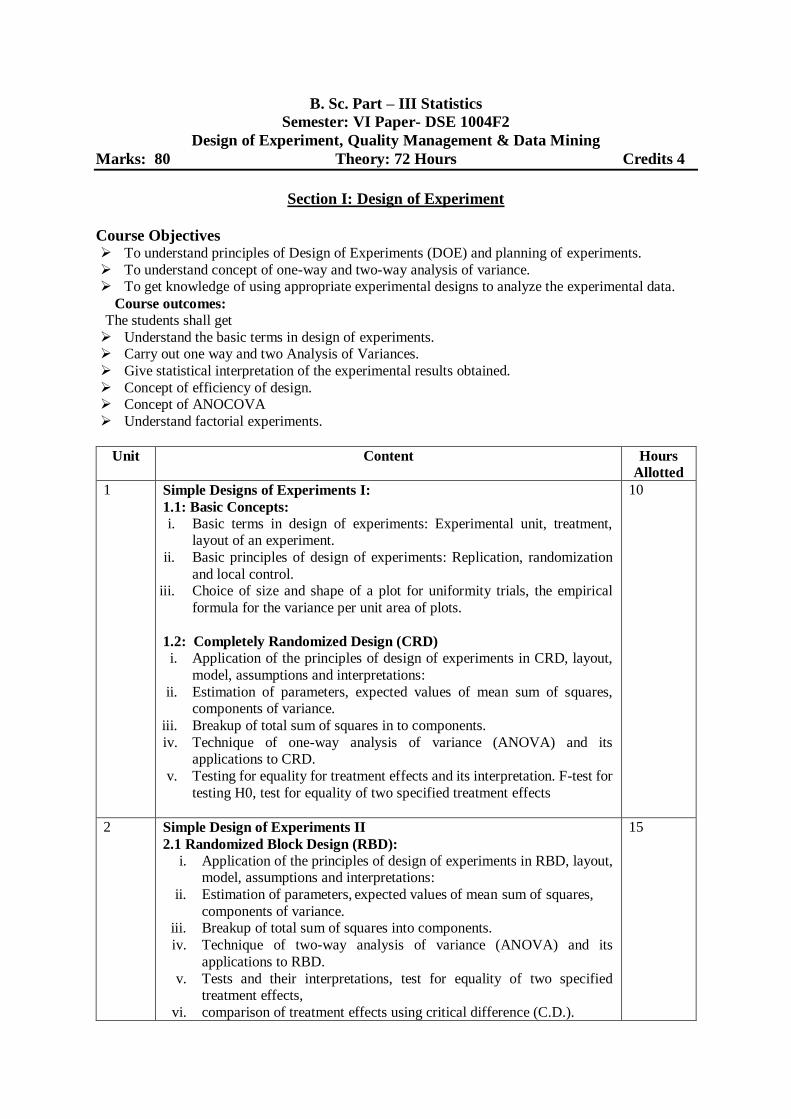
B. Sc. Part – III Statistics
Semester: VI Paper- DSE 1004F2
Design of Experiment, Quality Management & Data Mining
Marks: 80 Theory: 72 Hours Credits 4
Section I: Design of Experiment
Course Objectives To understand principles of Design of Experiments (DOE) and planning of experiments.
To understand concept of one-way and two-way analysis of variance. To get knowledge of using appropriate experimental designs to analyze the experimental data.
Course outcomes:
The students shall get
Understand the basic terms in design of experiments. Carry out one way and two Analysis of Variances.
Give statistical interpretation of the experimental results obtained.
Concept of efficiency of design. Concept of ANOCOVA
Understand factorial experiments.
Unit Content Hours
Allotted
1 Simple Designs of Experiments I:
1.1: Basic Concepts:
i. Basic terms in design of experiments: Experimental unit, treatment, layout of an experiment.
ii. Basic principles of design of experiments: Replication, randomization
and local control. iii. Choice of size and shape of a plot for uniformity trials, the empirical
formula for the variance per unit area of plots.
1.2: Completely Randomized Design (CRD)
i. Application of the principles of design of experiments in CRD, layout,
model, assumptions and interpretations:
ii. Estimation of parameters, expected values of mean sum of squares, components of variance.
iii. Breakup of total sum of squares in to components.
iv. Technique of one-way analysis of variance (ANOVA) and its applications to CRD.
v. Testing for equality for treatment effects and its interpretation. F-test for
testing H0, test for equality of two specified treatment effects
10
2 Simple Design of Experiments II
2.1 Randomized Block Design (RBD):
i. Application of the principles of design of experiments in RBD, layout, model, assumptions and interpretations:
ii. Estimation of parameters, expected values of mean sum of squares,
components of variance. iii. Breakup of total sum of squares into components.
iv. Technique of two-way analysis of variance (ANOVA) and its
applications to RBD.
v. Tests and their interpretations, test for equality of two specified treatment effects,
vi. comparison of treatment effects using critical difference (C.D.).
15
vii. Idea of missing plot technique. viii. Situations where missing plot technique is applicable.
ix. Analysis of RBD with single missing observation.
2.2 Latin Square Design (LSD) i. Application of the principles of design of experiments in LSD, layout,
model, assumptions and interpretations:
ii. Breakup of total sum squares into components. iii. Estimation of parameters, expected values of mean sum of squares,
components of variance. preparation of analysis of variance (ANOVA)
table.
iv. Tests and their interpretations, test for equality of two specified treatment effects, comparison of treatment effects using critical
difference (C.D.).
v. Analysis of LSD with single missing observation. vi. Identification of real-life situations where CRD, RBD AND LSD are
used.
3 Efficiency of design and ANOCOVA 3.1 Efficiency of design
i. Concept and definition of efficiency of a design.
ii. Efficiency of RBD over CRD. iii. Efficiency of LSD over CRD and LSD over RBD.
3.2 Analysis of Covariance (ANOCOVA) with one concomitant variable
iv. Purpose of analysis of covariance. v. Practical situations where analysis of covariance is applicable.
vi. Model for analysis of covariance in CRD and RBD. Estimation of
parameters (derivations are not expected).
vii. Preparation of analysis of covariance (ANOCOVA) table, test for β = 0, test for equality of treatment effects (computational technique
only).
Note: For given data, irrespective of the outcome of the test of regression coefficient β, ANOCOVA should be carried out.
10
4 Factorial Experiments
i. General description of factorial experiments, 22 and 23 factorial experiments arranged in RBD.
ii. Definitions of main effects and interaction effects in 22 and 23 factorial
experiments. iii. Model, assumptions and its interpretation.
iv. Preparation of ANOVA table by Yate’s procedure, test for
main effects and interaction effects.
v. General idea and purpose of confounding in factorial experiments. vi. Total confounding (Confounding only one interaction):
ANOVA table, testing main effects and interaction effects.
vii. Partial Confounding (Confounding only one interaction per replicate): ANOVA table, testing main effects and
interaction effects.
viii. Construction of layout in total confounding and partial confounding in 23factorial experiment.
10
Books Recommended
1. Federer, W.T.: Experimental Design, Oxford and IBH publishing Company, New Delhi.
2. Cochran, W.G. and Cox, G.M.: Experimental Design, John Wiley and Sons, Inc., New York. 3. Montgomery, D.C.: Design and Analysis of Experiments, Wiley Eastern Ltd., New Delhi.
4. Das, M.N. and Giri, N.C.: Design and Analysis of Experiments, Wiley Eastern Ltd., New Delhi.
5. Goulden, G.H.: Methods of Statistical Analysis, Asia Publishing House, Mumbai.
6. Kempthrone, O.: Design and Analysis of Experiments, Wiley Eastern Ltd., New Delhi. 7. Snedecor, G.W. and Cochran, W.G.: Statistical Methods, Affiliated East-West Press, New Delhi.
8. Goon, Gupta, Dasgupta: Fundamental of Statistics, Vol. I and II, The World Press Pvt. Ltd. Kolkata.
9. Gupta, S.C. and Kapoor, V.K.: Fundamentals of Applied Statistics, S. Chand & Sons, New Delhi. 10. C.F. Jeff Wu, Michael Hamada: Experiments, Planning Analysis and Parameter Design
Optimization.
Section II: Quality Management and Data Mining
Course Objectives To study the concepts of quality and its dimensions. To get acquainted with Six Sigma methodology.
To study some acceptance sampling plans.
To understand basic terms of data mining.
To learn some classification and clustering techniques.
Course outcomes: The students will get
knowledge of quality tools used in Quality management.
Knowledge of Six sigma methodology.
Difference between process control and product control.
Basic knowledge of data mining.
Unit Content Hours
Allotted
1 Quality Tools
Meaning and dimensions of quality, quality philosophy, Magnificent tools of quality:
Histogram, Check sheet, Pareto diagram, cause and effect diagram, scatter diagram, control chart, flow chart. Deming’s PDCA cycle for continuous improvements and its
applications.
10
2 Process Control CUSUM chart, tabular form, use of these charts for monitoring process mean. Moving
average and exponentially weighted moving average charts. Introduction to six-sigma
methodology, DMAIC cycle and case studies.
12
3 Product Control
Sampling Inspection plans for attribute inspection: Concept of AQL, LTPD, Consumer’s
risk, producer’s risk, AOQ, AOQL, OC, ASN and ATI. Description of Single and double sampling plans with determination of above constants.
13
4 Data Mining. 4.1: Data preparation for knowledge discovery: Data understanding and data cleaning
tools, Data transformation, Data Discretization, Data Visualization.
4.2: Data Mining Process: CRISP and SEEMA; Concept of training data, testing data
and validation of model. Supervised and unsupervised learning techniques: Problem of classification, classification techniques: k nearest neighbor, Naïve Bayes rule for two-
class problem with only one attribute variable, accuracy sensitivity and specificity of
classifiers, cluster analysis using k-means with illustration for bivariate data.
10
Books Recommended 1. Introduction to quality Control – Montgomery D. C.
2. Quality Control and Industrial statistics Duncan A J
3. Statistical Quality Control by E L Grant 4. Data Mining-Concept and Techniques: JiaweiHan.MichelineKamber and Jian Pei.
5. Data Mining- Introductory and Advanced Topics: Margret.H and Dunham
6. Introduction to Data Mining with case studies: G.K.Gupta
7. Data Mining Application with R: Zhao.
Practical Paper IV
Probability Distributions and R – Software
1. Model sampling from Laplace and Cauchy distributions
2. Model sampling from pareto distribution 3. Model sampling from truncated binomial and poison distributions.
4. Model sampling from truncated normal and exponential
distributions. 5. Model sampling from bivariate normal distribution.
6. Fitting of truncated binomial distribution.
7. 7.Fitting of truncated Poisson
distribution. 8. Application of multinomial distribution.
9. Application of bivariate normal distribution.
10. Data input/output, diagrammatic and graphical representation of data using R-Software. 11. Computation of probabilities of type I and type II errors and power of a test
using R- Software.
12. Model sampling from log-normal and Weibull distributions using R-Software. 13. Model sampling from logistic distribution using R-Software.
14. Fitting of Binomial and Poisson distribution using R-Software.
15. Fitting of Normal distribution using R-Software.
16. Fitting of log-normal distribution using R-Software. 17. Analysis of Completely Randomized Design (CRD)using R-Software.
18. Analysis of Randomized Block Design (RBD)using R-Software.
Reference Books:
1. Purohit Sudha: Lecture notes on R.
2. Verzani: Using R for introductory Statistics.
PRACTICAL PAPER – V
Statistical Inference - I
1. Point estimation by method of moments for discrete distributions. 2. Point estimation by method of moment for continuous distributions.
3. Point estimation by method of maximum likelihood (one parameter).
4. Point estimation by method of maximum likelihood (two parameters).
5. Point estimation by method of minimum chi-square. 6. Interval estimation of location and scale parameters of normal distribution
(single sample).
7. Interval estimation of difference of location and ratio of scale parameters of normal distribution (two samples).
8. Interval estimation for population proportion and difference between two
population proportions.
9. Interval estimation for population median using order statistics. 10. Construction of MP test.
11. Construction of UMP test.
12. Construction of SPRT for binomial, Poisson distributions, graphical representation of procedure.
13. Construction of SPRT for exponential and normal distribution, graphical representation
of procedure. 14. NP test- -Run test (for one and two independent samples).
15. NP test –Sign test and Wilcoxon’s signed rank test (for one and two samples paired observation).
16. 16 NP test-- Mann-Whitney U- test (for two independent samples).
17. NP test –Median test (for two large independent samples)
18. NP test—Kolmogorov - Smirnov test (for one and two independent samples).
PRACTICAL PAPER – VI
Design of Experiments and Sampling Methods
1. Analysis of CRD and RBD.
2. Analysis of Latin Square Design (LSD).
3. Missing Plot Technique for RBD and LSD with one missing observation. 4. Efficiency of i) RBD over CRD and ii) LSD over CRD and RBD.
5. Analysis of Covariance in CRD.
6. Analysis of Covariance in RBD.
7. Analysis of 22 and 23 Factorial Experiment. 8. Total Confounding.
9. Partial Confounding.
10. Simple Random Sampling for Variables. 11. Simple Random Sampling for Attributes.
12. Determination of Sample Size in SRS for Variables and Attributes.
13. Stratified Random Sampling – I 14. Stratified Random Sampling – II
15. Ratio Method of Estimation.
16. Regression Method of Estimation.
17. Systematic Sampling. 18. Cluster Sampling.
PRACTICAL PAPER VII
Operations Research and Quality Management
1. L.P.P. by simplex method I (Slack variable) 2. L.P.P. by simplex method II (Big M method)
3. Transformation problem-I.
4. Transformation problem-II. (Degeneracy)
5. Assignment problem. 6. Sequencing Problem.
7. Decision Theory.
8. Simulation I (Discrete distribution) 9. Simulation II (Continuous