OTC 5294 Buckling Considerations in the Design of the Gravel Cover for a High.:remperature Oil Line by S. Boer and C.H. Hulsbergen, Delft Hydraulics Laboratory; D.M. Richards, Lloyd's Register of Shipping; A. Klok, Pipeline Engineering Services; and J.P. Biaggi, Total Oil Marine Engineering & Construction Ltd. Copyright 1986 Offshore Technology Conference This paper was presented at the 18th Annual OTC in Houston, Texas, May 5-8, 1986. The material is subject to correction by the author. Permission to copy is restricted to an abstract of not more than 300 words. ABSTRACT Total Oil Marine have recently installed a 15.3 km long 12" pipeline in the UK sector of the North Sea as part of the development of the Alwyn Field. The pipeline is completely covered by gravel for physical protection. This paper discusses design engineering problems related to anticipated buckling phenomena associated with high oil temperatures during operation of the pipeline. Special studies were performed by LLOYD'S REGISTER OF SHIPPING and DELFT HYDRAULICS LABORATORY concerned, respectively, with buckling and heat transfer aspects of the pipeline design. In addition, full scale pull-out tests were carried out. INTRODUCTION The Alwyn North field is located in the northern part of the UK sector of the North Sea, some 160 kms east of the Shetlands and 110 kms north of the Frigg field and has been developed by Elf UK (66.7%) and Total Oil Marine (33.3%), TOM being the Operator. The development plan consists of the following f acili ties: one drilling and accommodation steel platform (NAA) one production steel platform (NAB) two export subsea pipelines: • a 12" pipeline for the transport of the oil production from Alwyn NAB to Ninian Central. • a 24" pipeline for the transport of the gas production from Alwyn NAB to Frigg TP-1. References and illustrations at end of paper. 9 The Alwyn-Ninian oil pipeline is 15.3 kms long and made up of 12" X65 (API 5LX) -0.406" W.T. - seamless, epoxy and 2" concrete coated pipes. For physical protection purposes the Alwyn- Ninian pipeline is covered by a continuous gravel embankment over its entire length. As such it is amongst the longest pipelines completely covered with gravel in the North Sea. The gravel embankment has a triangular shape of which the height relative to the seabed varies from 1.4 m to 1.0 m and a maximum embankment slope of 20· to meet the requirements of the fishing industry. Due to high oil temperatures to be sustained in operation (design temperature 84°C at riser sea bottom extremity), a potential bar buckling problem induced by large thermal stresses was investigated as part of the normal pipeline engineering design. Lloyd's Register of Shipping - Ocean Engineering Department (LRS) were commissioned to perform a specific study to analyse all the aspects of this potential bar buckling. LRS first findings were that, assuming the pipeline to be an extremely long beam "snaking" on the sea bottom, there was no risk from bar buckling as such. However an increase of the initial lateral deflection would occur which did not induce dangerous additional bending stresses. Such a model was particularly suitable for an uncovered pipeline simply laid on the seabed. This concept, however, did not allow the proper analysis of the local phenomenon, i.e. a straight section of 100-200 m long completely laterally restrained by gravel. LRS therefore developed an alternative model which indicated that the pipeline might buckle locally and emerge vertically from the gravel embankment if the depth of cover was not sufficient. Stability curves giving the minimum required depth of cover in terms of pipeline wall temperature were established and as a result, a
Transcript
OTC 5294
Buckling Considerations in the Design of the Gravel Cover fora High.:remperature Oil Lineby S. Boer and C.H. Hulsbergen, Delft Hydraulics Laboratory; D.M. Richards,Lloyd's Register of Shipping; A. Klok, Pipeline Engineering Services; and J.P. Biaggi,Total Oil Marine Engineering & Construction Ltd.
Copyright 1986 Offshore Technology Conference
This paper was presented at the 18th Annual OTC in Houston, Texas, May 5-8, 1986. The material is subject to correction by the author. Permissionto copy is restricted to an abstract of not more than 300 words.
ABSTRACT
Total Oil Marine have recently installed a 15.3km long 12" pipeline in the UK sector of the NorthSea as part of the development of the Alwyn Field.The pipeline is completely covered by gravel forphysical protection.This paper discusses design engineering problemsrelated to anticipated buckling phenomenaassociated with high oil temperatures duringoperation of the pipeline. Special studies wereperformed by LLOYD'S REGISTER OF SHIPPING andDELFT HYDRAULICS LABORATORY concerned,respectively, with buckling and heat transferaspects of the pipeline design. In addition, fullscale pull-out tests were carried out.
INTRODUCTION
The Alwyn North field is located in thenorthern part of the UK sector of the North Sea,some 160 kms east of the Shetlands and 110 kmsnorth of the Frigg field and has been developed byElf UK (66.7%) and Total Oil Marine (33.3%), TOMbeing the Operator.
The development plan consists of the followingf acilities:
one drilling and accommodation steel platform(NAA)one production steel platform (NAB)two export subsea pipelines:• a 12" pipeline for the transport of the oil
production from Alwyn NAB to NinianCentral.
• a 24" pipeline for the transport of the gasproduction from Alwyn NAB to Frigg TP-1.
References and illustrations at end of paper.
9
The Alwyn-Ninian oil pipeline is 15.3 kms longand made up of 12" X65 (API 5LX) -0.406" W.T. seamless, epoxy and 2" concrete coated pipes.
For physical protection purposes the AlwynNinian pipeline is covered by a continuous gravelembankment over its entire length. As such it isamongst the longest pipelines completely coveredwith gravel in the North Sea. The gravelembankment has a triangular shape of which theheight relative to the seabed varies from 1.4 m to1.0 m and a maximum embankment slope of 20· tomeet the requirements of the fishing industry.
Due to high oil temperatures to be sustained inoperation (design temperature 84°C at riser seabottom extremity), a potential bar bucklingproblem induced by large thermal stresses wasinvestigated as part of the normal pipelineengineering design.
Lloyd's Register of Shipping - OceanEngineering Department (LRS) were commissioned toperform a specific study to analyse all theaspects of this potential bar buckling.
LRS first findings were that, assuming thepipeline to be an extremely long beam "snaking" onthe sea bottom, there was no risk from barbuckling as such. However an increase of theinitial lateral deflection would occur which didnot induce dangerous additional bending stresses.Such a model was particularly suitable for anuncovered pipeline simply laid on the seabed. Thisconcept, however, did not allow the properanalysis of the local phenomenon, i.e. a straightsection of 100-200 m long completely laterallyrestrained by gravel. LRS therefore developed analternative model which indicated that thepipeline might buckle locally and emergevertically from the gravel embankment if the depthof cover was not sufficient.
Stability curves giving the minimum requireddepth of cover in terms of pipeline walltemperature were established and as a result, a
2 BUCKLING OF HIGH TEMPERATURE OIL LINE COVERED BY GRAVEL OTC 5294
depth of cover profile along the pipelinecorresponding to the temperature drop could bedefined. Thus, a minimum depth of cover of 1.0 mis required near NAB where the temperature ismaximum whereas only 0.6 m is sufficient nearNinian Central. This also represents the minimumrequirement in terms of protection againstdragging cables.
In parallel with the above studies, thepossibility of thermal convection inside thegravel embankment was identified and had to beinvestigated. A conventional heat loss model basedon pure conduction predicted an arrivaltemperature at Ninian CentraLin the order of 60'Cfor an inlet temperature of 84°c at NAB whereas afirst calculation taking into account thermalconvection had indicated that a lower arrivaltemperature of about 30·C could be reached.
Delft Hydraulics Laboratory (DHL) werecommissioned to perform a study to develop a heatloss model. The model enables the computation ofheat transfer coefficients from which theresulting temperature drop along the pipeline wasderived. The computation method, in which thepipe, the gravel embankment and the surroundingsea water constitute a single system, takes intoaccount the forced convection through the gravelembankment as a result of bottom currents.
The temperature profile determined by DHL wasused in combination with the LRS study results tooptimise gravel dumping requirements. It was thuspossible to reduce the originally specified requirements from 145,000 T to 95,000 t, representing agravel dumping cost reduction of about 50%, thesecosts being almost directly proportional to thegravel quantity to be dumped. .
Tests
In addition, pipeline pull-out tests werecarried out by DilL to confirm the calculatedvertical restraining forces exerted by the gravelembankment on the pipeline to resist verticalbuckling.Full scale tests were performed underwater at theDHL Delta Flume facilities, on a 3 m section ofpipeline. The tests were set up to minimise endeffects and to measure directly the relationshipbetween pull-out force and gravel depth of cover.A good correlation between the observed resultsand those predicted by theoretical calculationswas found.
Offshore Works--------------The gravel dumping works·were entrusted to ACZ
Marine Contractors [1] using their new D.P. graveldumping vessel "TROLLNES" (8,200 T capaCity, flexible fall-pipe technique). Already 90% of the12" Alwyn-Ninian pipeline has been coveredaccording to the above requirements in 1985 duringthe first phase. The remainder will be achieved in1986 during a second phase after completion ofsubsea tie-ins connecting the pipeline ends toplatform risers. A section of 300 m was left 'uncovered at both extremites to allow fornecessary pipe handling during 1986.
10
BUCKLING OF COVERED PIPELINES
General-------The development of marginal fields has required
the design of small diameter export lines to workat high pressure and temperatures. Pipelines ofthis type are highly stressed and VUlnerable toaccidental damage, and will usually be protectedby trenching or gravel dumping.A pipeline laid on a comparatively flat sea bedwill occupy a path which is not preciselystraight, following an approximately sinusoidalpath as the pre-specified route is pursued by theconstructor. This shape is maintained inequilibrium by transverse friction forces actingat the point of contact. When such a pipeline ispressurised and heated, the resulting thermal andmechanical strains may be accommodated by anaccentuation of transverse displacements withoutexcessive wall stresses. However, if transverseresistance is high, as in the case of trenched orcovered lines, these movements cannot easily takeplace and large axial compressive forces willbuild up. This situation leads in turn to thepossibility of upheaval buckling.As with other forms of structural instability, theupheaval buckling mode provides the possibility ofan alternative equilibrium configuration or bifurcation. Again, by analogy with other bucklingphenomena, the existence of geometricimperfections allow eqUilibrium paths to be tracedbetween states by appropriate analysis.For a pipeline, the imperfections concerned mayinclude a crest in the sea bed profile, or a prop,as when an isolated rock is located immediatelybelow the line or another pipeline is to becrossed. Other less obvious possibilities includethe free span gap or trench step, or an angularlymismatched field joint.The upheaval phenomenon has historically been ofconcern to railroad engineers who have to considertrack buckling under solar heating conditions[2,3]. More recently the pipeline problem has beendiscussed by various authors including Hobbs [4],Kyriakides [5] and F~iedman [6].Upheaval buckling must be given seriousconsideration at the project stage for a number ofreasons. In the first instance, upheaval must beavoided otherwise the pipeline will almost certainly be overstressed and probably permanentlydamaged. The other aspect is essentially economicsince the temperature which may be withstood isdirectly dependent on pipeline weight, or negativebuoyancy and effective download. This relatesdirectly to the cover depth or trench depthnecessary to eliminate the possibility ofupheaval. Hence the importance of the pull-outtests described in this paper which were used toconfirm the relationship between effectivedownload or upheaval resistance, and cover depth.
In order to illustrate the analytical treatmentof upheaval, the case of a pipeline supported byrigid object of height h above an otherwise flatsea bed will be discussed.
The subsequent post-upheaval behaviour is given bythe conditions:
Generalised plots of these functions are shownin Figures 3 and 4, which may be used to study thecomplete stress and deformation history for apropped pipeline under increasing axial load P.
It now becomes necessary to interpret the axialload P in terms of internal pressure p and walltemperature increase T. The axial load is made upof the axial pressure force Pc and the axial wallforce Pw' so that assuming compression ispositive:
~~ w~r (1)
~8 w[}r (2)
h2W[Tr (3)
and central
( 4)
6lEI h Ml[1] + ~2 M2[1] + ~3 F8f +
62EI ~5Ml[1] + ~6 M2[1] + ~7 F[1f +
/) EI ~ ~9Ml[1f+ hOM2[1f + ~l1F&] \
Where 61,6 2 and /) are boundary slopesdisplacement, respectively, and .
The equilibrium of a simply supported slenderbeam (Figure 1) of span L, loaded by a uniformlateral load w, an axial force P, a centralvertical force F, and boundary moments Ml and M2,is conveniently expressed in the following form:
EI ~ pipeline bending stiffness
The coefficients ~l to ~12 are functions of jonly and may be derived directly from standardbeam column theory [7]. The algebraic form ofthese functions depends on the nature of the axialload P. Thus if P is compressive, the ~n arecircular functions, if P is tensile the ~n arehyperbolic and when P~O the ~n are algebraic.
The interpretation of axial force in terms oftemperature increment for any given internalpressure is decided by the requirement for axialstrain compatibility which gives at all stages:
For the propped pipeline (Figure 2), beforeupheaval when the pipeline is still in contactwith the rock, the following conditions apply:
61 ~ 62 ~ 0
Ml M2 '" 0
F -V/) -h
where 1TPc '" 4" Dr pDi '" internal diameter
(13)
Upheaval begins when the rock reaction V becomeszero, i.e when
(14)
-vpDi
-Pw
AEaxial wall strain '"
steel area
Poissons ratio
'" thermal strain coefficient
'" axial friction coefficient
'" Poisson pressure strain
1T /) 2'" curvature strain '" - 4" (i)
'" boundary displacement strain '" 2 ~L
(P _ P ) 2woo w
'" second moment of area
'" thermal strain '" aT
2EA lJW'" external steel diameter
E + € + € + € + Ed ~ constantapt c
Individual strain components are:
€a
€p
€t
€c
€d
6.
DoA
I
v
a
II
11
(9)
( 5)
(10)
8.9868, for which (5),
4.5148
p '" P* '" 3.9621
~" '" tan (.1) _.1.;. 0 (8).. 2 2
L L*
this occurs when j '" j*(7) give:
4 BUCKLING OF HIGH TEMPERATURE OIL LINE COVERED BY GRAVEL OTC 5294
By comparing current with initial layingconditions, (14) may be used to find either theinternal pressure for any given temperature andtotal axial load, or for fixed pressure, tocalculate pipeline temperature. In this way thecomplete pressure/temperature history may betraced through the upheaval process, together withcorresponding stresses, spans and displacements.
Qplication--------
The above procedure has been applied to the 12”Alwyn-Ninian oil pipeline configuration todemonstrate the nature of the phenomenon, and toshow in detail the effects of vertical constraintforce and prop height.Figure 5 shows a typical complete upheaval historyincluding pipeline temperature (T), vertical dis-placement (y), maximum equivalent stress (u/uy),internal pressure (p) and prop reaction (V).The feature of particular interest 2s the equili-brium temperature T, which rises to the upheavalvalue T1 after internal design pressure has beenreached. After upheaval, the temperature requiredfor equilibrium falls to a minimum T2, beforerising again continuously. Thus if pipeline tempe-rature is increased beyond the upheaval value Tl,the configuration will experience a catastrophe;jump to a greatly increased deformation as indica-ted in Figure 5.The effects of prop height h and download w onequilibrium temperature history are illustrated inmore detail in Figures 6 to 9. Figure 6 indicateshow all equilibrium temperatures are increased byincreasing download, i.e. gravel cover. A curiousfeature of the phenomenon is illustrated in Figure7, which shows that although upheaval temperatureis increased for smaller prop heights, the post-upheaval minimum temperature is virtuallyunchanged. Upheaval, and post-upheaval minimumtemperatures T1 and T2 are plotted in_Figures 8and 9 against prop height and download.Because of uncertainties in predicting ormeasuring prop height, and the possibility oftransient loss of cover effectiveness due tohydrodynamic or other actions, T2 is recommendedas the design value for cover depth choicetogether with a margin to cover construction andoperational variations.The damaging effects of upheaval are emphasised bythe nominal stress levels achieved at upheaval asshown in Figure 10.
HEAT TRANSFER STUDY
General-------
The heat loss of the oil pipe and thesubsequent temperature drop along the line dependson the initial oil temperature, the masa flow ofthe oil, the thermal conductivity of the compositepipe and the subsequent heat transport in thegravel surrounding the pipe. The heat releasedfrom the oil pipe can be transported through the
gravel both by conduction and convection. The
conductive heat transport is controlled by thethermal conductivity of the gravel material andcontained pore water. It occurs even in the caseof static pore water. Convective heat transportoccurs only in the case of pore water flow throughthe gravel embankment. Whether conduction orconvection dominates the heat transport stronglydepends on the pore water flow characteristics.The flow through the gravel embankment is con-trolled by the permeability of the gravel materialand hydraulic pressure gradients resulting frombottom currents, however buoyancy effects may alsoplay a part.The heat loss model determines the 2-D flow andtemperature field around the pipe. In the model,turbulent as well as laminar flow characteristicscan be taken into account. From the resultingtemperature field the corresponding heat transfercoefficient can be derived which is used tocompute the temperature drop along the line. Tothat end a model has been applied which solves the1-D heat transport equation for the oil. In themodel a non linear relation between heat transfercoefficient and oil temperature is taken intoaccount, as well as effects of variation ofdensity and specific heat.
Computation of Flow and Temperature Field--- ----------------------- -------------
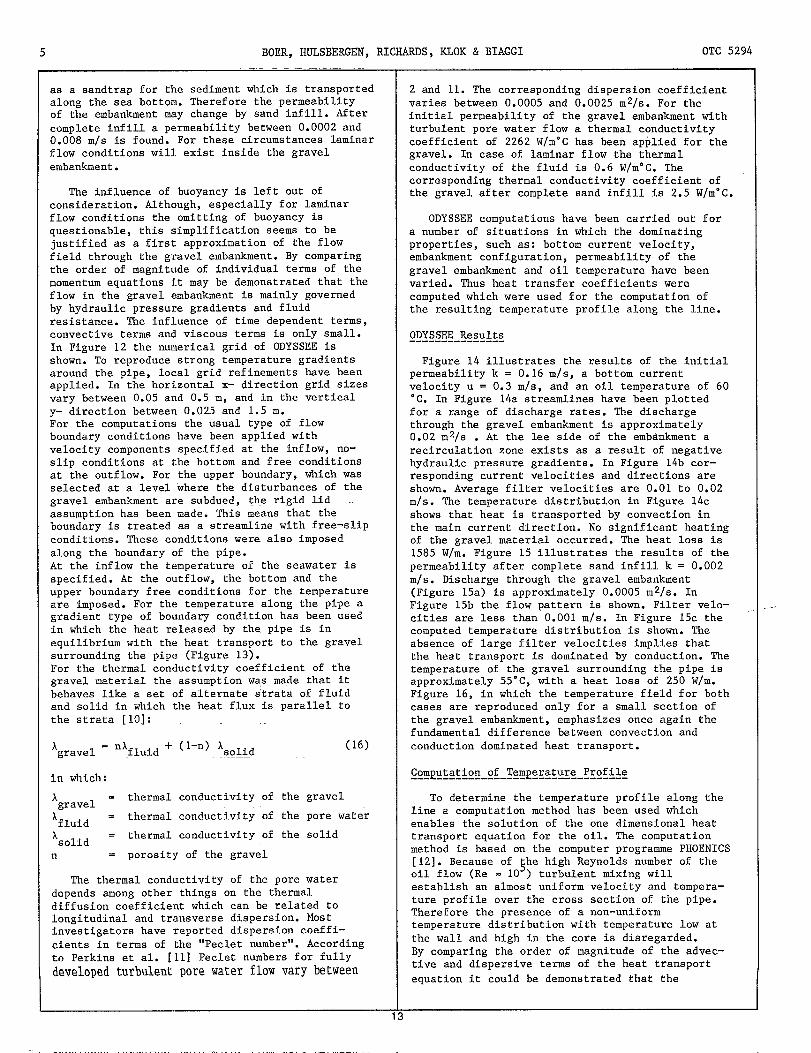
To determine the flow and temperature fieldaround the pipe the full Navier-Stokes equationsrepresenting flow of an incompressible fluid intwo dimensions, together with the heat transportequation were used. The computation method isbased on the computer programme ODYSSEE [8], whichis a joint product of Delft Hydraulics Laboratoryand Laboratoire National dtHydraulique in Chatou,France.In the model the pipe, the gravel embankment andthe surrounding sea water are handled as a singlesystem for which the flow and temperature field iscomputed. To schematize the fluid resistance ofthe gravel material additional source terms havebeen added to the momentum equations. The flowthrough the gravel has been described in amicroscopical way, applying a general formulationof
In doing so the permeability is the counterpartthe momentum losses encountered by the flow.
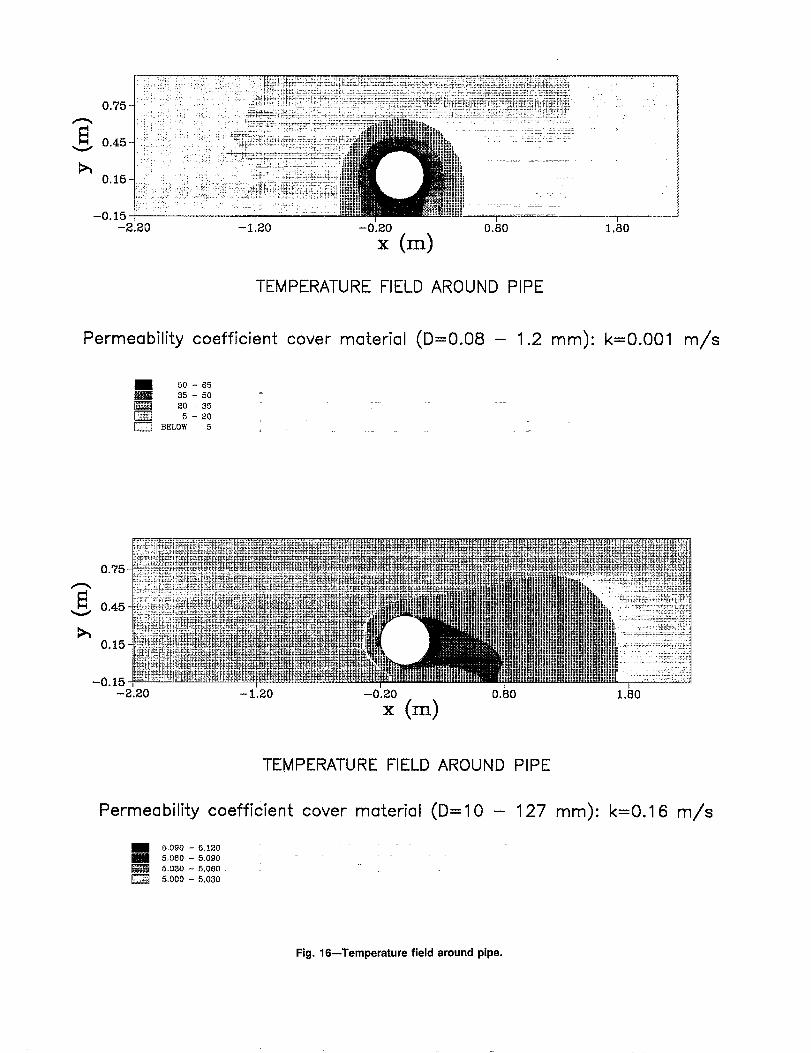
For gravel the permeability usually varies between0.001 and 1 m/s. Figure 11 [9] shows thepermeability for various porous materials. Thereis a gradual transition from laminar (a=l) tofully developed turbulent flow (a=2). Thepermeability of the gravel material used for theconstruction of the embankment varies between 0.14and 0.22 m/s. Therefore it is liable thatturbulent flow characteristics will occur insidethe embankment. Rowever, the embankment will act
as a sandtrap for the sediment which is transported 2 and 11. The corresponding dispersion coefficientalong the sea bottom. Therefore the permeability varies between 0.0005 and 0.0025 m2/s. For theof the embankment may change by sand infill. After initial permeability of the gravel embankment withcomplete infill a permeability between 0.0002 and turbulent pore water flow a thermal conductivity0.008 m/s is found. For these circumstances laminarflow conditions will exist inside the gravel
coefficient of 2262 W/m”C has been applied for thegravel. In case of laminar flow the thexmal
embankment. conductivity of the fluid is 0.6 W/m”C. Thecorresponding thermal conductivity coefficient of
The influence of buoyancy is left out of the gravel after complete sand infill is 2.5 W/m”C.consideration. Although, especially for laminarflow conditions the omitting of buoyancy is ODYSSEE computations have been carried out forquestionable, this simplification seems to be a number of situations in which the dominatingjustified as a first approximation of the flow properties, such as: bottom current velocity,field through the gravel embankment. By comparing embankment configuration, permeability of thethe order of magnitude of individual terms of the gravel embankment and oil temperature have beenmomentum equations it may be demonstrated that the varied. Thus heat transfer coefficients wereflow in the gravel embankment is mainly governed computed which were used for the computation ofby hydraulic pressure gradients and fluid the resulting temperature profile along the line.resistance. The influence of time dependent terms,convective terms and viscous terms is only small. ODYSSEE ResultsIn Figure 12 the numerical grid of ODYSSEE is
---------------
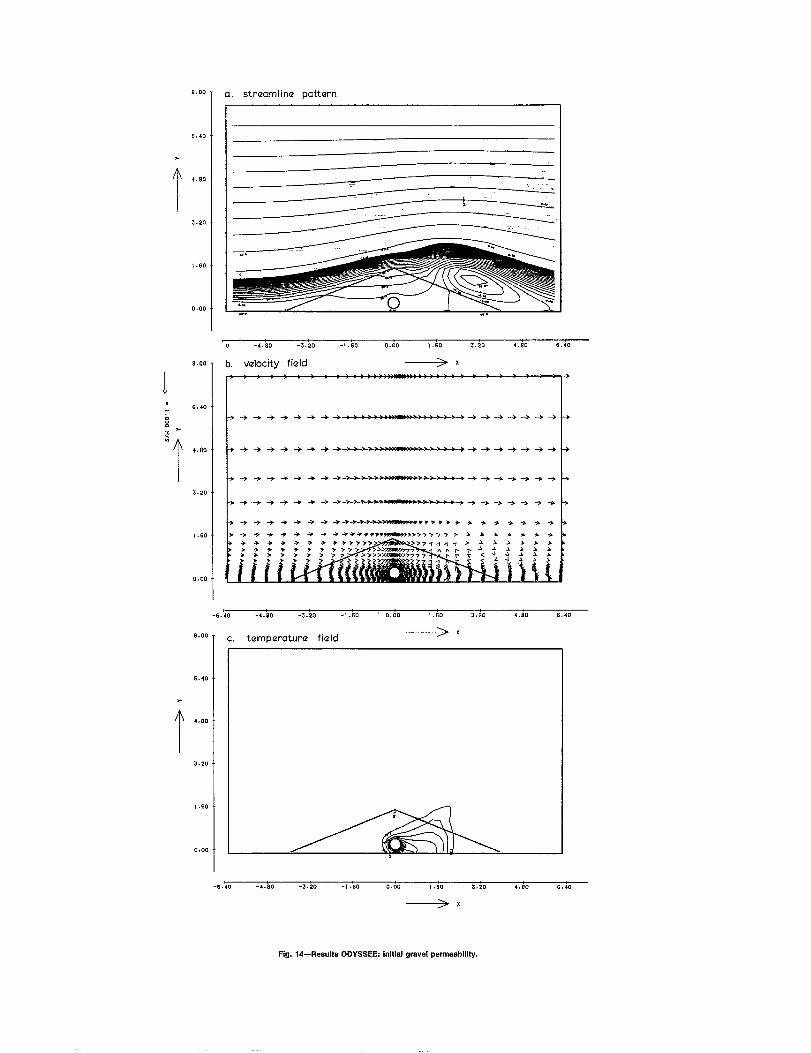
shown. To reproduce strong temperature gradients Figure 14 illustrates the results of the initialaround the pipe, local grid refinements have been permeability k = 0.16 mjs, a bottom currentapplied. In the horizontal x- direction grid sizes velocity u = 0.3 m/s, and an oil temperature of 60vary between 0.05 and 0.5 m, and in the vertical “C. In Figure 14a streamlines have been plottedY- direction between 0.025 and 1.5 m. for a range of discharge rates. The dischargeFor the computations the usual type of flow through the gravel embankment is approximatelyboundary conditions have been applied with 0.02 m2/s . At the lee side of the embankment avelocity components specified at the inflow, no- recirculation zone exists as a result of negativeslip conditions at the bottom and free conditions hydraulic pressure gradients. In Figure 14b cor-at the outflow. For the upper boundary, which was responding current velocities and directions areselected at a level where the disturbances of the shown. Average filter velocities are 0.01 to 0.02gravel embankment are subdued, th_erigid lid m/s. The temperature distribution in Figure 14cassumption has been made. This means that theboundary is treated as a streamline with free-slip
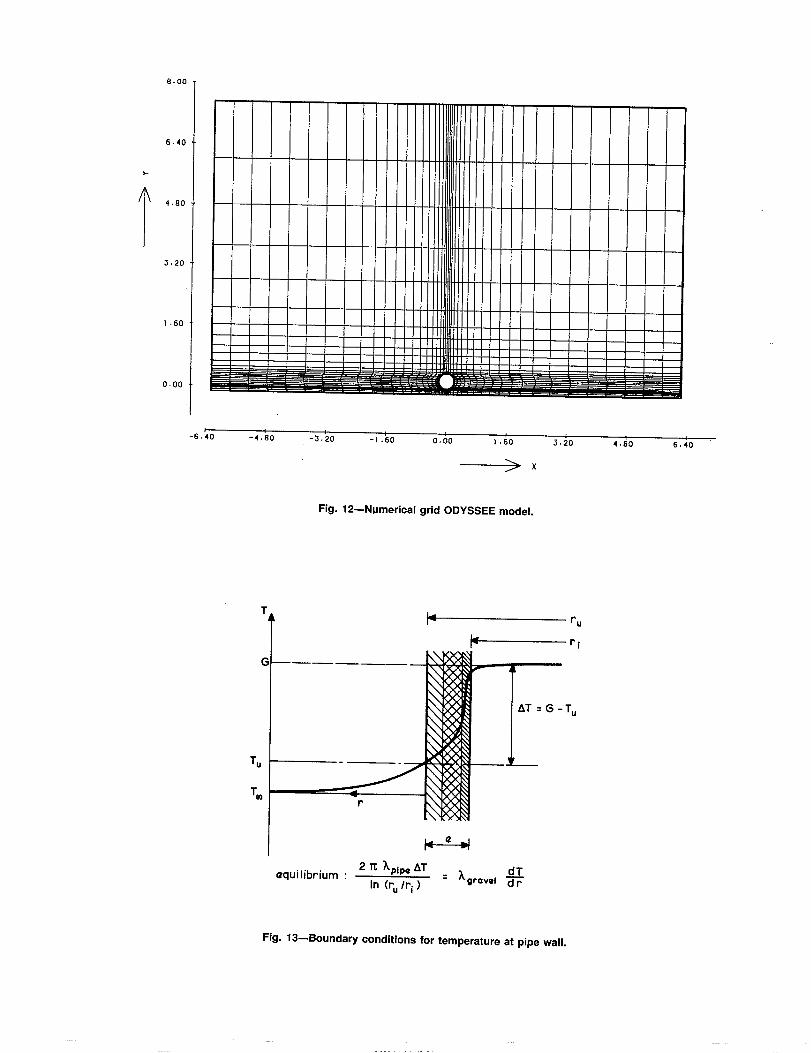
shows that heat is transported by convection inthe main current direction. No significant heating
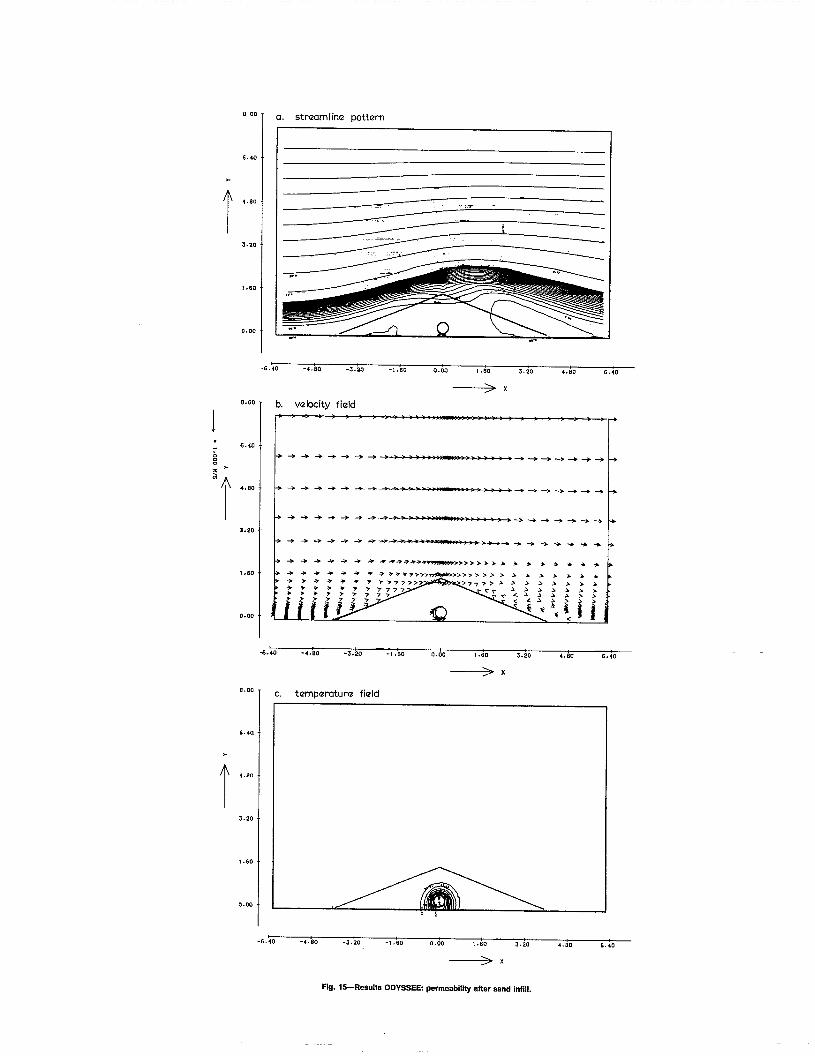
conditions. These conditions were also imposed of the gravel material occurred. The heat loss isalong the boundary of the pipe. 1585 W/m. Figure 15 illustrates the results of theAt the inflow the temperature of the seawater is permeability after complete sand infill k = 0.002specified. At the outflow, the bottom and the mjs. Discharge through the gravel embankmentupper boundary free conditions for the temperature (Figure 15a) is approximately 0.0005 m2/s. Inare imposed. For the temperature along the pipe a Figure 15b the flow pattern is shown. Filter velo-gradient type of boundary condition has been used cities are less than 0.001 m/s. In Figure 15c thein which the heat released by the pipe is in computed temperature distribution is shown. Theequilibrium with the heat transport to the gravel absence of large filter velocities implies thatsurrounding the pipe (Figure 13). the heat transport is dominated by conduction. TheFor the thermal conductivity coefficient of the temperature of the gravel surrounding the pipe isgravel material the assumption was made that itbehaves like a set of alternate strata of fluid
approximately 55”C, with a heat loss of 250 W/m.Figure 16, in which the temperature field for both
and solid in which the heat flux is parallel to cases are reproduced only for a small section ofthe strata [10]: the gravel embankment, emphasizes once again the
in which:Computation of Temperature Profile--- -------------- ---------------
A thermal conductivity of the gravel To determine the temperature profile along thegravel =A thermal conductivity of the pore water
line a computation method has been used whichfluid =a
enables the solution of the one dimensional heat= thermal conductivity of the solid transport equation for the oil. The computation
solidn = porosity of the gravel
method is based on the computer programme PHOENICS[12]. Because of
The thermal conductivity of the pore water
$he high Reynolds number of theoil flow (Re = 10 ) turbulent mixing will
depends among other things on the thermalestablish an almost uniform velocity and tempera-
diffusion coefficient which can be related toture profile over the cross section of the pipe.
longitudinal and transverse dispersion. MostTherefore the presence of a non-uniform
investigators have reported dispersion coeffi-temperature distribution with temperature low at
cients in terms of the “Peclet number”. According the wall and high in the core is disregarded.
to Perkins et al. [11] Peclet numbers for fullyBy comparing the order of magnitude of the advec-
developed turbulent pore water flow vary betweentive and dispersive terms of the heat transport
equation it could be demonstrated that the
.-13
6 BUCKLING OF HIGH TF@ERATURE OIL LINE COVERED BY GILA~L OTC 5294
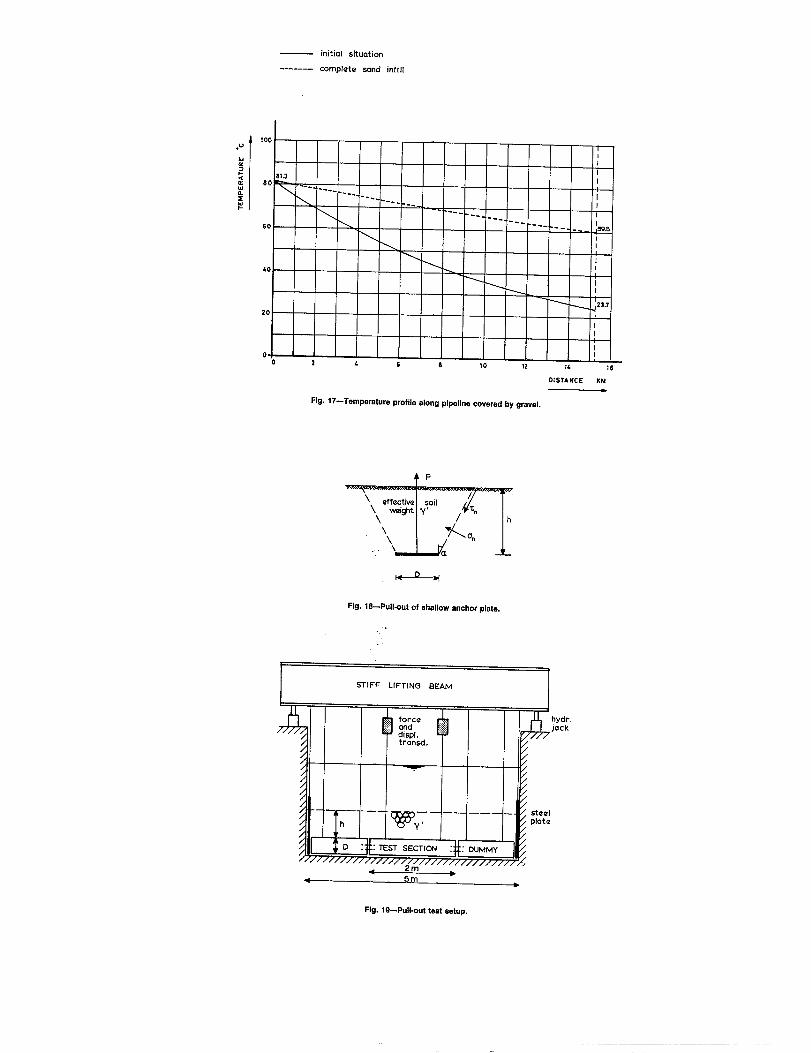
dispersive transport of heat is small compared tothe advective transport. The dispersive transportwas therefore neglected.In essence the temperature drop along the linedepends on the initial temperature of the oil, thethermal conductivity of the composite pipe, theheat transport in the gravel surrounding the pipeand the mass flow, density and specific heat ofthe oil.The density and specific heat are funct~ons of thetemperature and pressure. Since the actual pressurevariation was not computed the magnitude of thedensity and specific heat were selected on thebasis of the average pressure of the oil flowalong the line. To that end the pressure drop wasestimated. This pressure drop is converted via thewall shear stress and the internal shear stress ofthe oil into heat. It Is estimated that a tempera-ture rise of approximately 2°C results from thisphenomenon.For the computation of temperature profile theline was divided into 8 sections. For each sectiona representative thermal conductivity coefficientof the pipe was established.The initial oil temperature at NAB is 84”c. Forthe sections which preceed the section covered bygravel a temperature drop of 2.7°C has been compu-ted. This temperature drop refers to a heat lossof an unprotected pipe in open air or sea water of5“C. In Figure 17 the computed temperature profilesfor the pipeline covered by gravel are shown. Thetemperature drop is strongly influenced by heattransport through the gravel. For the initialcondition an oil temperature of 24°C occurs at theend of the section whereas after complete sandinfill this temperature will be 60”c.
PULL-OUT TESTS
Aim of the Tests------.-.--.--—
The aim of the tests was the assessment of thepull-out force P as function of depth of gravelcover h under realistic conditions, simtlar tothose of the gravel covered pipeline offshore,subjected to upheaval forces, and to provide anexperimental check on the computations made by LRS.
Geotechnical literature on pull-out force Pmainly refers to horizontal anchor plates in finegranular soils with horizontal upper boundary.Although the basic internal mechanisms are similarfor cylinders, the computed solutions or experi-mental data of anchor plate pull-out forces cannotbe applied directly to a pipeline covered withgravel. This limitation, and the lack of verifiedmethods to calculate pipeline pull-out force, wereimportant reasons for the full scale pipelinepull-out tests which were carried out by DelftHydraulics Laboratory in close collaboration withDeIft Soil Mechanics Laboratory.
Distinction is made between shallow and deepanchors with respect to failure mechanisms. Duringfailure of shallow anchors continuous displacementoccurs in the entire zone between plate andsurface. On the other hand failure of deep anchorsis characterized as a deformation in a limitedzone around the plate, hardly affecting thesurface. In the present case only shallow be-
—
havi.ouris considered since the cover depth/pipe
diameter ratio h/D < 2.6 whereas deep behaviouroccures if h/D > 5 [13,14].Pull-out of an infinitely long shallow horizontalanchor plate with width D and burrial depth h isillustrated in Figure 18. The pull out force P isusually written as:
P = y’Dh(l +} ● f) (17)
where P = pull-out force per unit length ofanchor plate
On the right hand side of equation (17) thefirst term represents the weight of the soil rightabove the plate, whereas the second term with faccounts for all other vertical force componentsincluding the weight of both lateral triangles.The literature for shallow anchors under ahorizontal surface shows a wide variation inexperimental f-values, ranging from f = 0.36(loose sand, h/D = 1, [14]) to f = 0.68 (loosesand, h/D = 1 [13]). In [15] full scale pull-outtests with pipelines in sand produced f-valuesranging from f = 0.3 (loose sand) to f = 0.7(density packed sand).In the present case some important deviatingaspects are the non-horizontal upper surface andthe large gravel “grains”. In terms of equation(17), the best set-up aims at finding P- and f-values as a function of h, for a specific set of
Y’- and D values.
Test Set-u~ and Procedure---------- --------------
In [16] a complete description is given of alltest set-up requirements and of the method howthese were met. The main aspects are brieflymentioned here.
- Plane strain conditions must be obtained, i.e.no gradients are allowed in stresses andstrains in a direction parallel to the pipeaxis, and no shear stress should occur in aplane perpendicular to the pipe. The test set-up designed to meet these requirements isillustrated in Figure 19. In the 5 m wide DeltaFlume [171 the 2 m long central pipe serves asthe proper test section, while on both sidesdummy sections accommodatethe wall effects.Moreover, steel plates on both ends furtherreduce wall effects. During pull-out the threepipe sections and end plates, which all areseparately suspended from a stiff steel liftingbeam, are lifted without mutual transfer ofvertical forces due to a special construction.The complete history of pull-out force andvertical displacement is measured by trans-ducers incorporated in both suspension nodeswhich pull the central pipe section.
- For the tests a smooth steel pipe was used withouter diameter D = 422 mm. All pull-out forcesin this paper are nett values, i.e. aftereliminating the proper pipe weight.
The gravel has mass density p = 3090 kg/m3,pore volume of some 42%, and immersed effectivesoil weight y! = 11.4 kN/m3. Median grain sizeis about 70 mm.The cross section of the gravel cover has a
symmetric triangular form with a slope of 20”.For each test a fresh gravel cover was carefullyconstructed in the dry flume, but the actualpull-out tests were carried out in submergedconditions in still water.For the pull-out procedure electroniccontrolled hydraulic jacks were used in twosubsequent phases: a force-control phase and adisplacement-control phase. During the firstphase the applied force was increased in smallsteps, until the maximum load was achievedafter a lift of some 1 to 2 cm. Thereafter theload was released and the continuous pull-outphase started, applying a lift speed of 1 cm/minute. In both phases a maximum pull-out forcewas obtained by both suspension rod transducers,giving four pull-out force values per test.
est Results-----------
typical force/displacement curve ia presented inigure 20, which was obtained during theisplacement-control phase with depth of cover h =.80 m. The curve is jagged due ‘to”theiscontinuous rearrangement of the coveringtones. After reaching a maximum value, the pull-ut force gradually decreases as the pipe isulled towards the surface. The pull-out forceesults are summarised below.
depth of cover max. pull-out force(average value)
h (m) P (kN/m)
0.60 6.320.80 9.38~ooo---
11.951.15 15.05
h
Ising equation (17) the following f-values result:
This apparent negative correlation of f and h/D!ay tentatively be described as:
= 0.96 - 0.14 h/D (18)
~ith (18), equation (17) changes finally to theollowing empirical equation:
‘ = y’ (Dh+ 0.96 h2 - 0.14 h3/D) (19)
which is presented in Figure 21 together with
experimental results. The gravel cover designconfirmed using these results.
CONCLUSIONS
The final gravel cover profile which waseventually specified (Figure 22) was based on
the
was
boththe LRS and DHL studies and tests. Compared withthe profile suggested by pipeline engineeringstudies previously performed, the overall gravelrequirements could be reduced from 145,000 T downto 95,000 T by diminishing the depth of cover by0.2 m in average along the line. Such a reduction
comes mainly from the DHL findings with regard tothe temperature drop to be considered along thepipeline.The LRS study, although leading to results quitesimilar to those obtained by using previouspipeline upheaval phenomenon analyses and models,in terms of critical temperatures at which thebuckling occurs [4, 5 and 6], included a completepost-upheaval and sensitivity analyses. These newdevelopments allowed a better understanding of thepipeline behaviour throughout the buckling processand hence a better evaluation of the margin ofsafety required.The DHL and LRS results were also used todetermine the gravel depth of cover required forprotection at the point where the 12” Alwyn-Ninianpipeline crosses over the 36” FLAGS line on abridge made up of grout bags supports, byconsidering the crossing as a large seabedimperfection.The DHL pull-out tests confirmed the assumptionsmade in the LRS study regarding the upheavalresistance provided by the gravel embankment.The DHL theoretical heat transfer study was notsubjected to a specific test even at reducedscale. However, it will be possible to verify thisanalysis when the pipeline is put into operationat the end of 1987. In any case for the firstyear, the throughput of the 12” Alwyn-Ninian linewill not exceed 30% of the maximum design flow of100,000 bbls/d which has been considered in DHLtemperature drop calculations.As a result, should significant discrepanciesbetween the measured temperature values and thosepredicted by the DHL model be observed at NinianCentral, depth of cover could be increased in1987/1988 by additional gravel-dumping to avoidany risk of upheaval.
ACKNOWLEDGEMENTS
The Authors wish to thank Elf UK and Total OilMarine for permission to publish this paper.
REFERENCES
1. Groothuizen, A.G.M.: “The Design andConstruction of Stabilization and Protectionof Subsea Pipelines and Cables up to 600 mWater Depth”. Paper OTC 5219, presented at the1986 Offshore Technology Conference, Houston,
May 5-8, 1986.
8 BUCKLING OF HIGH TEMPEti~RE OIL LINE COVI?JU3DBY GWVEL OTC 5294
2. Kerr, A.D., “On the Stability of the Railroad 10. Combarnous, M.A. and Bories, S.A.:Track in the Vertical Plane”. Rail “Hydrothermal Convection in Saturated PorousInternational, Vol. 5, Feb., 1974, pp 131-142. Media”. Advances in Hydroscience, VO1. 10,
1975, Acadamic Press.3. Kerr, A.D.: “On Thermal Buckling of Straight
Railroad Tracks and the Effect of Track Length 11. Perkins, T.K. and Johnston, O.C.: ‘1A Reviewon the Track Response”. Rail International, of Diffusion and Dispersion in Porous Media”.Vol. 9, Septh., 1979, pp 759-768. Society of Petroleum Engineers Journal, March,
4.1963.
Hobbs, R.E.: “In-Service Buckling of HeatedPipelines”. Journal of Transportation 12. Rosten, H.I. and Spalding, D.B.: “The Mathe-Enigeering, ASCE, Vol. 110, No. 2, March,1984.
matical Basis of the PHOENICS-EARTH ComputerCode”. CRAM Ltd, London, January 1981.
5. Yun, H. and Kyriakides, S.: “Model for Beam-Mode Buckling of Buried Pipelines”. Journal of 13. Das, B.M. and Seeley, G.R.: “Uplift CapacityEngineering Mechanics, ASCE, Vol. 112, No. 2, of Shallow Inclined Anchors”.Feb., 1985, pp. 235-253. Proc. 9 th Int. Conf. Soil Mech. Found. Engn,
6.Vol. 1, pp. 463-466, Tokyo, 1977.
Friedman, Y.: IfsomeAspects of the Design of
Buried Hot Pipelines”. Offshore Oil and Gas 14. Rowe, R.K. and Davis, E.H.: “The Behaviour ofPipeline Technology Seminar, Paris, Jan., Anchor Plates in Sand”.1986. Geotechnique 32, no. 1, pp. 25-41, 1982.
7. Timoshenko, S.P., and Gere, J.M.: “Theory of 15. Delft Soil Mechanics Laboratory: “SiteElastic Stability”. Investigations and Behaviour of Pipelines”.2nd ed. Mc Graw-Hill, New York, 1961. Report CO-272040/75, 1985.
8. Officier, M.J., Vreugdenhil, C.B. and Wind, 16. Delft Hydraulics Laboratory: “Full Scale Pull-H.G.: “Applications in Hydraulics of Numerical Out Tests for 12” Alwyn Oil Pipeline project”.Solutions of the Navier-Stokes Equations”. Report M 2153, October 1985.Recent Advances in Numerical Fluid Dynamics.Taylor, C. (cd.), Swansea; Pineridge press,_ 17. Kroezen, M., Vellinga, P., Lindenberg, J. and1984. Burger, A.M.: “Geotechnical and hydraulic
9.aspects with regard to seabed and slope
Graauw, A. de, Van Der Meulen, T. and Van Der stability”.Does De Bye, M.: DeIft Hydr. Lab. publication series no. 272,“Design Criteria for Granular Filters”. Delft June 1982.Hydraulics Laboratory.Publication no. 287, January 1983.