26
Budget at a Glance Presented by: Chris Whelton and John Reiniche
Budget at a Glance
Presented by:
Chris Whelton and
John Reiniche
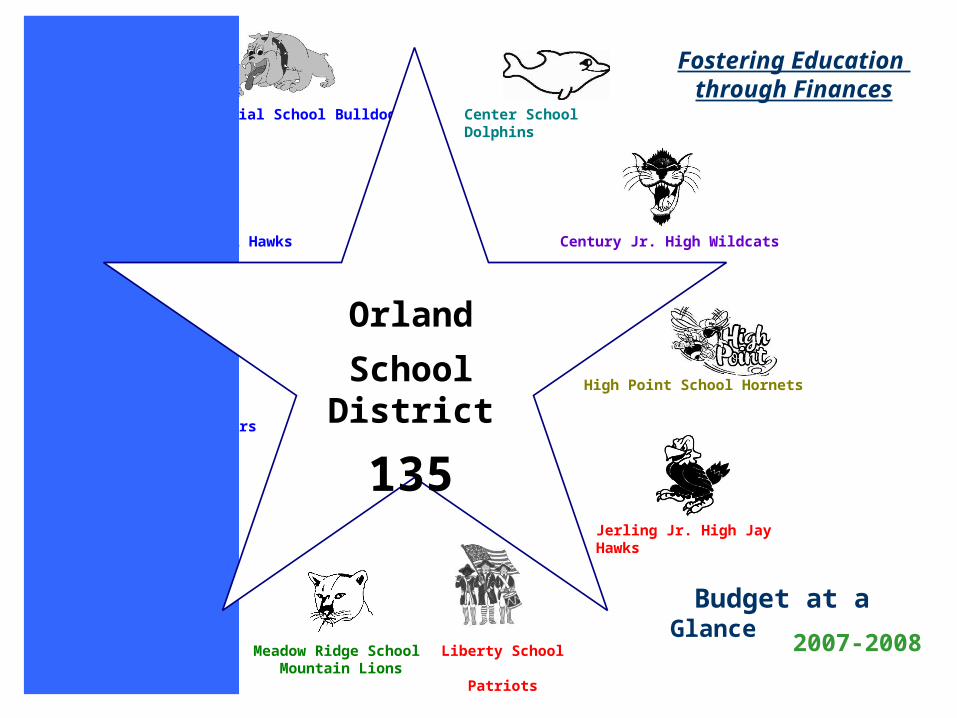
Liberty School Patriots
Centennial School Bulldogs Center School Dolphins
Park School Panthers
Prairie School Hawks
High Point School Hornets
Meadow Ridge School
Mountain Lions
Jerling Jr. High Jay Hawks
Orland Jr. High
Eagles
Century Jr. High Wildcats
Orland
School District
135
Fostering Education through Finances
Budget at a Glance2007-2008
Table of Contents
A Letter from the Superintendent and Board President 2
Board of Education 3
The District’s Demographics 4
Budget Highlights 5
Revenues by Source and Property Taxes 6
Consumer Price Index and Property Tax Refunds 7
General State Aid and Interest Income 8
State Funding 9
Enrollment 10
Expenditures by Fund and Object 11
Instruction Takes Top Priority 12-13
District Points of Pride 14
Education Initiatives 15
Achievement Data 16
Contact Information 17
www.orland135.orgOrland School District 135 is proud to be part of a community that values education, its children, and its future. As leaders of District 135, we takeseriously our responsibility to educate our students and to provide sound financial planning for our school district. We focus our time, our energy, and our resources on improving instruction and enhancing the day-to-day interaction between teachers and students. We prioritize activities, focus funding, and allocate and reallocate resources to serve schools more effectively.
This “Budget at a Glance” booklet continues our community conversation about fiscal accountability and student achievement. It will help put all the facts and figures into perspective. It explains where our schools get their funding, how those funds are spent, and where our financial and instructional future lies.
Orland School District 135 wants to continue to honor our community’svalues and priorities as demonstrated through sound financial practices.
Sincerely, Mr. Dennis SoustekSuperintendent Ms. Suzanne CacheyBoard of Education President
Dear School Community Member,
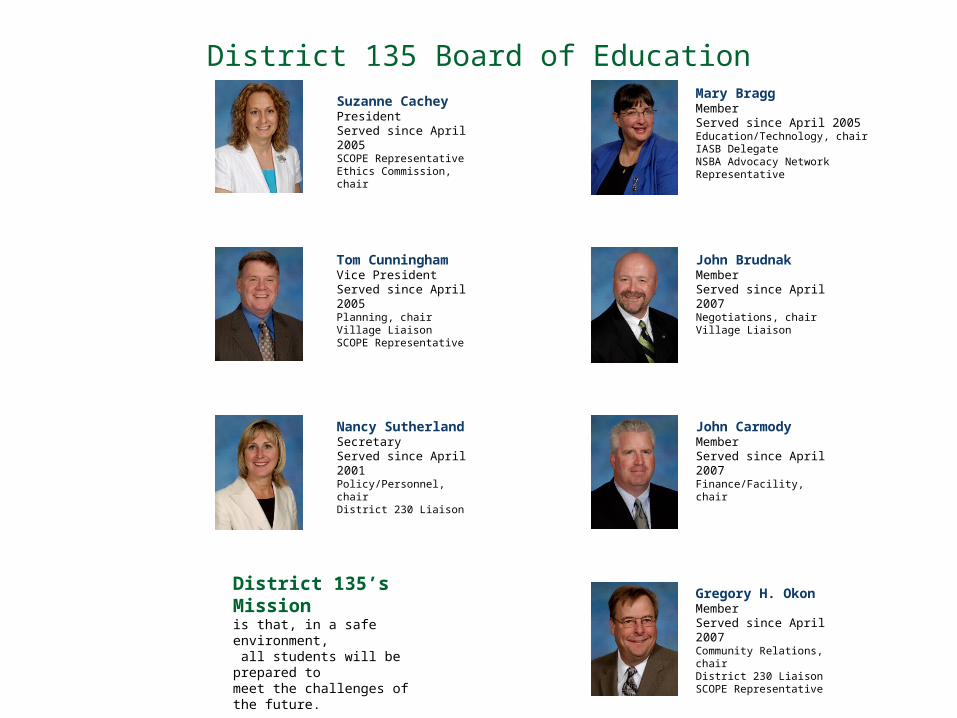
District 135 Board of EducationSuzanne CacheyPresidentServed since April 2005SCOPE RepresentativeEthics Commission, chair
Nancy SutherlandSecretaryServed since April 2001Policy/Personnel, chairDistrict 230 Liaison
Mary BraggMemberServed since April 2005Education/Technology, chairIASB DelegateNSBA Advocacy Network Representative
Tom CunninghamVice PresidentServed since April 2005Planning, chairVillage LiaisonSCOPE Representative
John BrudnakMemberServed since April 2007Negotiations, chairVillage Liaison
John CarmodyMemberServed since April 2007Finance/Facility, chair
Gregory H. OkonMemberServed since April 2007Community Relations, chairDistrict 230 LiaisonSCOPE Representative
District 135’s Mission is that, in a safe environment, all students will be prepared to meet the challenges of the future.
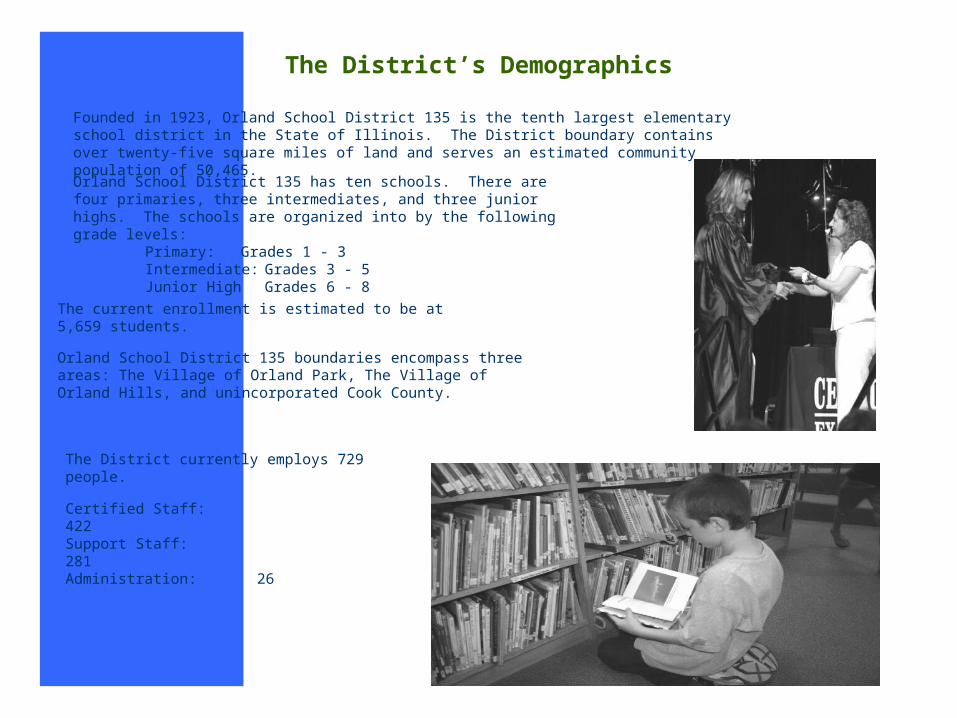
Founded in 1923, Orland School District 135 is the tenth largest elementary school district in the State of Illinois. The District boundary contains over twenty-five square miles of land and serves an estimated community population of 50,465.
The District’s Demographics
Orland School District 135 has ten schools. There are four primaries, three intermediates, and three junior highs. The schools are organized into by the following grade levels:
Primary: Grades 1 - 3Intermediate: Grades 3 - 5Junior High Grades 6 - 8
The current enrollment is estimated to be at 5,659 students.
Orland School District 135 boundaries encompass three areas: The Village of Orland Park, The Village of Orland Hills, and unincorporated Cook County.
The District currently employs 729 people.
Certified Staff: 422Support Staff: 281Administration: 26
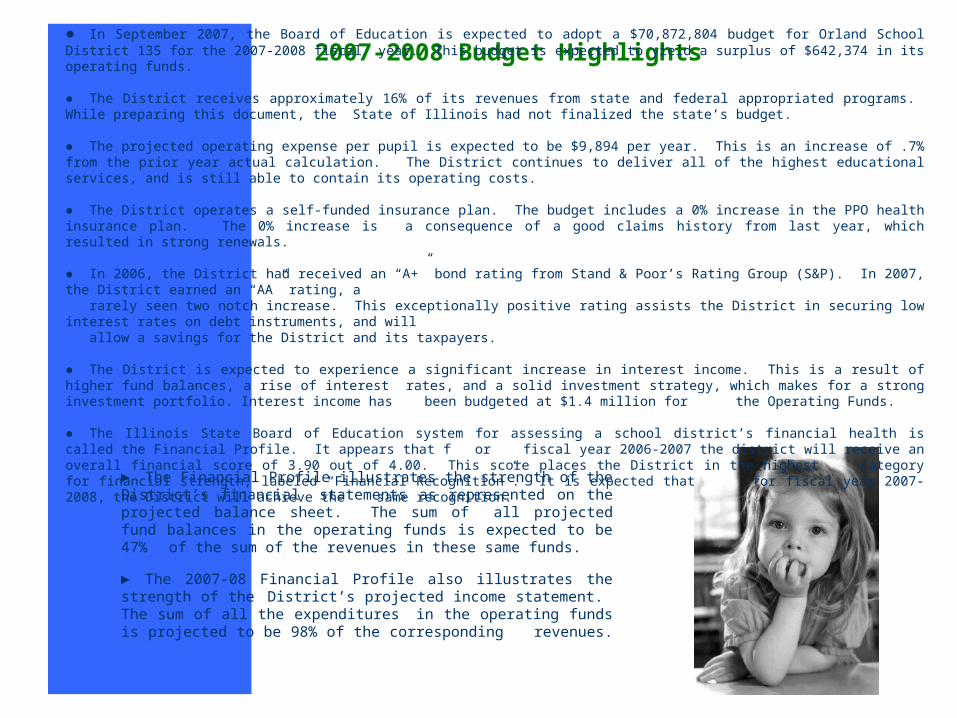
2007-2008 Budget Highlights● In September 2007, the Board of Education is expected to adopt a $70,872,804 budget for Orland School District 135 for the 2007-2008 fiscal
year. This budget is expected to yield a surplus of $642,374 in its operating funds.
● The District receives approximately 16% of its revenues from state and federal appropriated programs. While preparing this document, the State of Illinois had not finalized the state’s budget.
● The projected operating expense per pupil is expected to be $9,894 per year. This is an increase of .7% from the prior year actual calculation. The District continues to deliver all of the highest educational services, and is still able to contain its operating costs.
● The District operates a self-funded insurance plan. The budget includes a 0% increase in the PPO health insurance plan. The 0% increase is a consequence of a good claims history from last year, which resulted in strong renewals.
● In 2006, the District had received an “A+” bond rating from Stand & Poor’s Rating Group (S&P). In 2007, the District earned an “AA” rating, a rarely seen two notch increase. This exceptionally positive rating assists the District in securing low interest rates on debt instruments, and will allow a savings for the District and its taxpayers.
● The District is expected to experience a significant increase in interest income. This is a result of higher fund balances, a rise of interest rates, and a solid investment strategy, which makes for a strong investment portfolio. Interest income has been budgeted at $1.4 million
for the Operating Funds.
● The Illinois State Board of Education system for assessing a school district’s financial health is called the Financial Profile. It appears that for fiscal year 2006-2007 the district will receive an overall financial score of 3.90 out of 4.00. This score places the District in
the highest category for financial strength, labeled “Financial Recognition”. It is expected that for fiscal year 2007-2008, the District will achieve the same recognition.
► The Financial Profile illustrates the strength of the District’s financial statements as represented on the projected balance sheet. The sum of all projected fund balances in the operating funds is expected to be 47% of the sum of the revenues in these same funds.
► The 2007-08 Financial Profile also illustrates the strength of the District’s projected income statement. The sum of all the expenditures in the operating funds is projected to be 98% of the corresponding revenues.
Property Tax
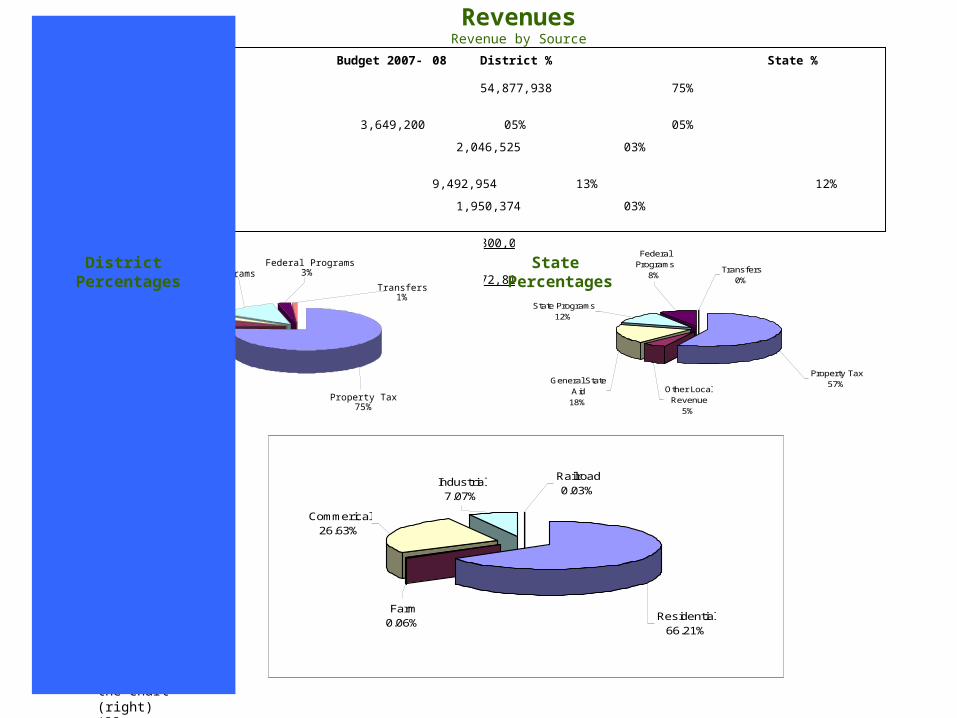
Orland School District 135 has the good fortune of a strong property tax base. The Equalized Assessed Valuation for the District has a good mix of property as the chart (right) illustrates.
Revenue Source Budget 2007- 08 District % State %
Property Tax 54,877,938 75% 57%
Other Local Revenue 3,649,200 05% 05%
General State Aid 2,046,525 03% 18%
State Programs 9,492,954 13% 12%
Federal Programs 1,950,374 03% 08%
Transfers 800,000 01% 00%
Total 72,816,991 100% 100%
General State Aid3%
Transfers1%
Federal Programs3%State Programs
13%
Other Local Revenue5%
Property Tax75%
Property Tax57%
Transfers0%
Federal Programs
8%
State Programs12%
General State Aid18%
Other Local Revenue
5%
Farm0.06%
Commerical26.63%
Industrial7.07%
Railroad0.03%
Residential66.21%
RevenuesRevenue by Source
District Percentages
State Percentages
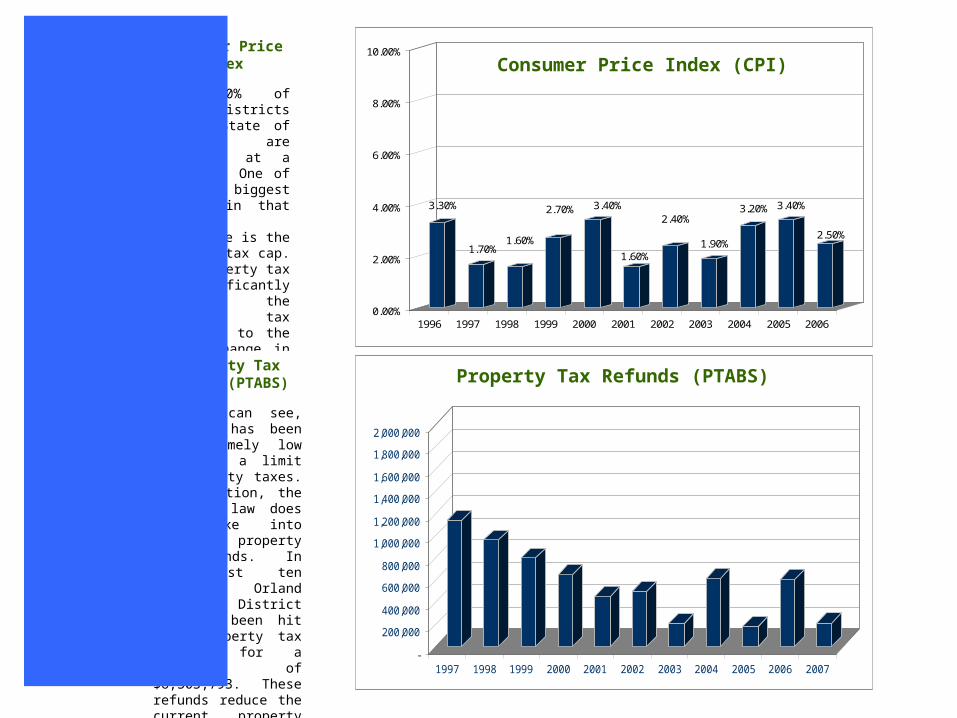
Consumer Price Index
Over 80% of school districts in the State of Illinois are operating at a deficit. One of the biggest factors in that alarming percentage is the property tax cap. The property tax cap significantly limits the property tax extension to the annual change in the Consumer Price Index (CPI). The following is a chart of the CPI for the past ten years (right).
3.30%
1.70%1.60%
2.70% 3.40%
1.60%
2.40%
1.90%
3.20% 3.40%
2.50%
0.00%
2.00%
4.00%
6.00%
8.00%
10.00%
1996 1997 1998 1999 2000 2001 2002 2003 2004 2005 2006
Consumer Price Index (CPI)
-
200,000
400,000
600,000
800,000
1,000,000
1,200,000
1,400,000
1,600,000
1,800,000
2,000,000
1997 1998 1999 2000 2001 2002 2003 2004 2005 2006 2007
Property Tax Refunds (PTABS)Property Tax
Refunds(PTABS)
As you can see, the CPI has been an extremely low index as a limit on property taxes. In addition, the tax cap law does not take into account property tax refunds. In the past ten years, Orland School District 135 has been hit with property tax refunds for a total of $6,303,793. These refunds reduce the current property taxes and are not considered in the tax cap law. The chart (right) illustrates the last ten years of refunds.
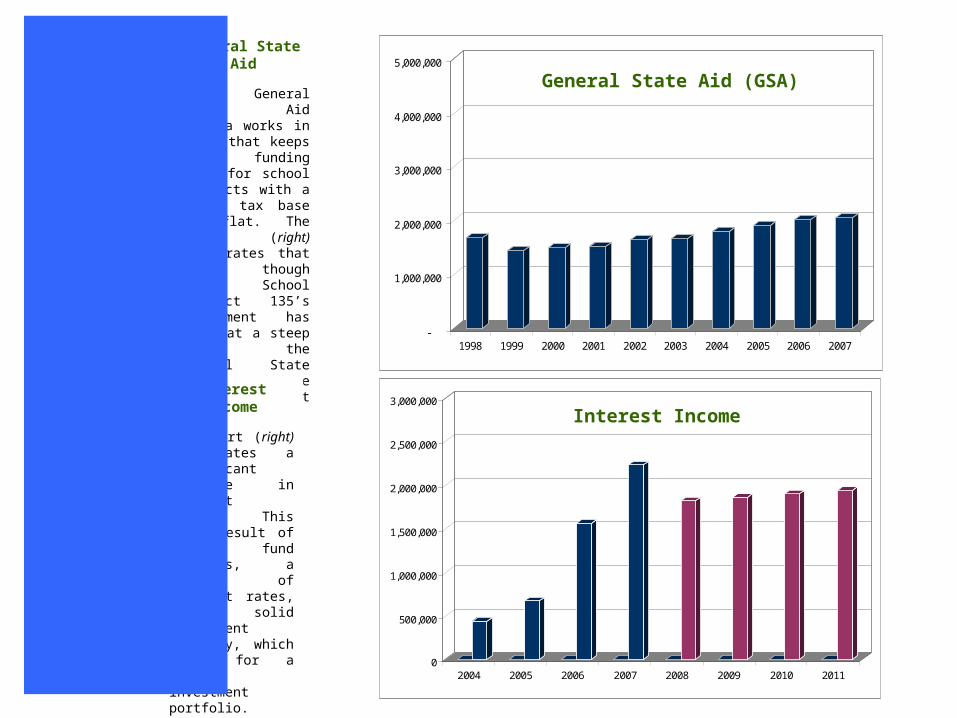
General State Aid
The General State Aid Formula works in a way that keeps the funding level for school districts with a strong tax base very flat. The chart (right) illustrates that even though Orland School District 135’s enrollment has grown at a steep rate, the General State Aid has for the most part remained flat.
-
1,000,000
2,000,000
3,000,000
4,000,000
5,000,000
1998 1999 2000 2001 2002 2003 2004 2005 2006 2007
0
500,000
1,000,000
1,500,000
2,000,000
2,500,000
3,000,000
2004 2005 2006 2007 2008 2009 2010 2011
Interest Income
The chart (right) illustrates a significant increase in interest income. This is a result of higher fund balances, a rise of interest rates, and a solid investment strategy, which makes for a strong investment portfolio. Interest income has been budgeted at approximately $1.8 million for the year.
General State Aid (GSA)
Interest Income
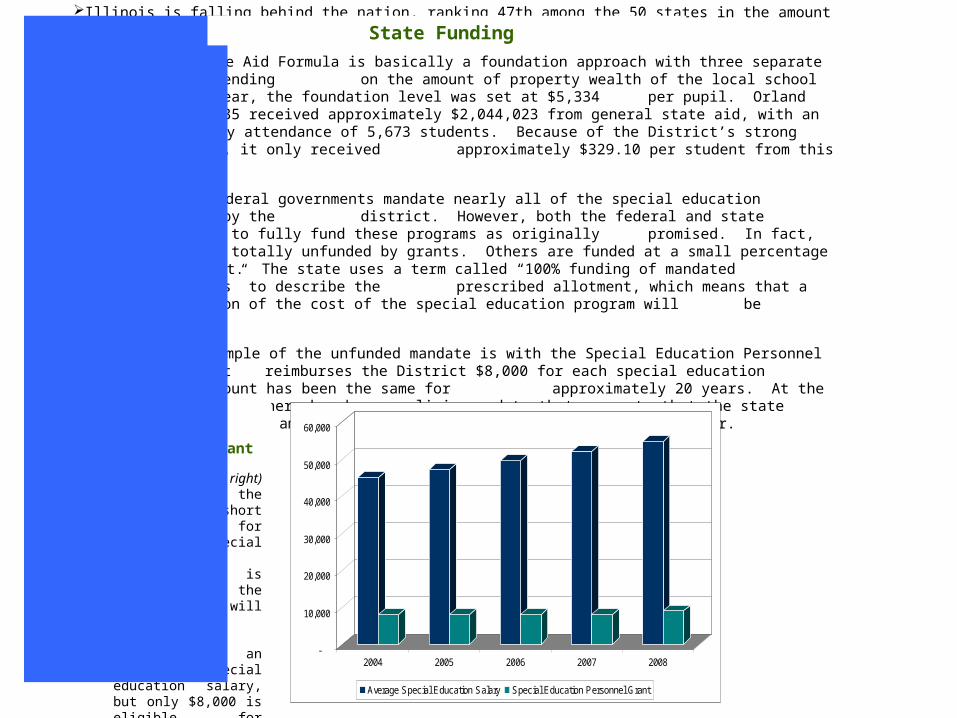
Illinois is falling behind the nation, ranking 47th among the 50 states in the amount of funding the state provides for education.
The General State Aid Formula is basically a foundation approach with three separate calculations, depending on the amount of property wealth of the local school district. Last year, the foundation level was set at $5,334 per pupil. Orland School District 135 received approximately $2,044,023 from general state aid, with an average daily attendance of 5,673 students. Because of the District’s strong property tax base, it only
received approximately $329.10 per student from this revenue source.
The state and federal governments mandate nearly all of the special education programs offered by the district. However, both the federal and state legislatures fail to fully fund these programs as originally promised. In fact, some mandates are totally unfunded by grants. Others are funded at a small percentage
of the true cost. The state uses a term called “100% funding of mandated categorical grants” to describe the prescribed allotment, which means that a very small fraction of the cost of the special education program will be reimbursed.
An excellent example of the unfunded mandate is with the Special Education Personnel Grant. This grant reimburses the District $8,000 for each special education teacher. This amount has been the same for approximately 20 years. At the time of this report, there has been preliminary data that suggests that the
state may increase this amount to $9,000 for each special education teacher.
Special Education Personnel Grant
As the chart (right) illustrates the state falls short of funding for mandated special education programs. It is projected that the District will spend approximately $55,000 on an average special education salary, but only $8,000 is eligible for Special Education Personnel Grant reimbursement. -
10,000
20,000
30,000
40,000
50,000
60,000
2004 2005 2006 2007 2008
Average Special Education Salary Special Education Personnel Grant
State Funding
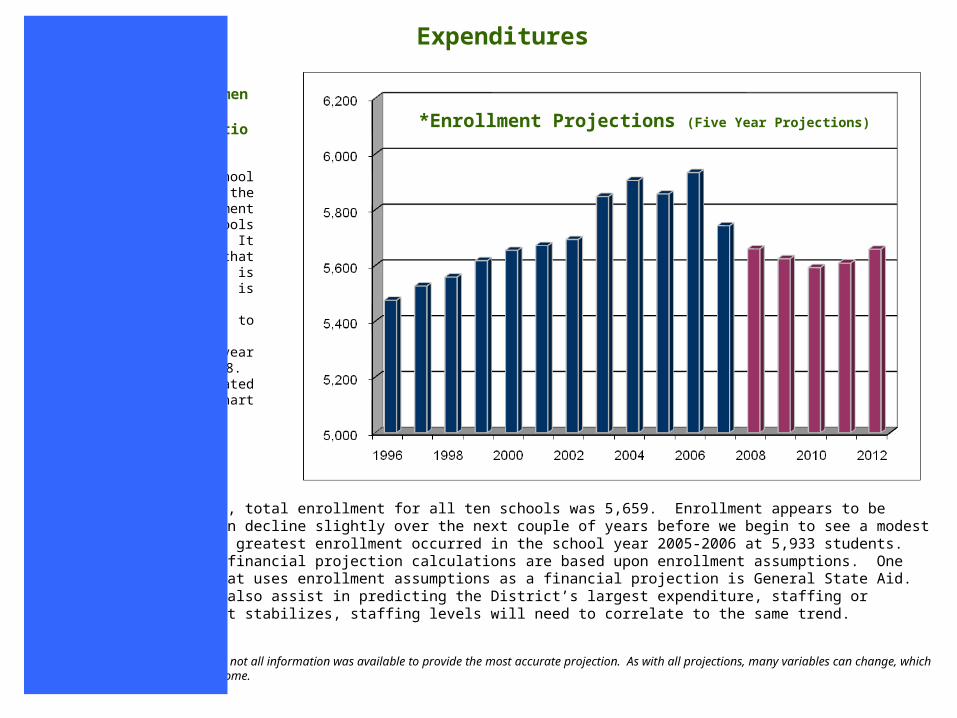
Enrollment Projections
In the school year 2007, the total enrollment for all schools was 5,742. It appears that enrollment is declining and is hopefully expected to stabilize through the year 2012 to 5,658. As illustrated on the chart (right).
As of September 5, 2007, total enrollment for all ten schools was 5,659. Enrollment appears to be stabilizing and may even decline slightly over the next couple of years before we begin to see a modest growth once again. The greatest enrollment occurred in the school year 2005-2006 at 5,933 students. Some of the District’s financial projection calculations are based upon enrollment assumptions. One major revenue source that uses enrollment assumptions as a financial projection is General State Aid. Enrollment assumptions also assist in predicting the District’s largest expenditure, staffing or salaries. As enrollment stabilizes, staffing levels will need to correlate to the same trend.
* At the time this report was prepared not all information was available to provide the most accurate projection. As with all projections, many variables can change, which in turn could produce a different outcome.
Expenditures
*Enrollment Projections (Five Year Projections)
Life Safety0%
Operations and Maintenance
7% Education72%
Working Cash1%
Site & Construction0%
Bond and Interest11%
Transportation7%
IMRF2%
Salaries52%
Tuition1%
Transfers1%
Bond Payments11%
Supplies4%
Capital Outlay2%
Purchased Services10%
Benefits19%
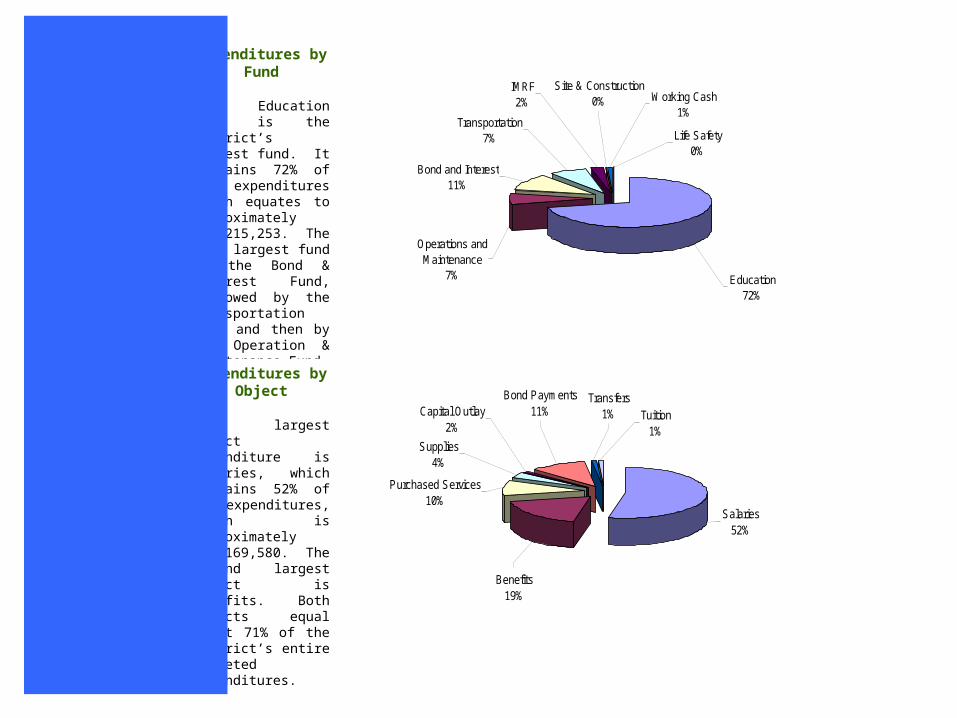
Expenditures byFund
The Education Fund is the District’s largest fund. It contains 72% of all expenditures which equates to approximately $51,215,253. The next largest fund is the Bond & Interest Fund, followed by the Transportation Fund and then by the Operation & Maintenance Fund.
Expenditures byObject
The largest Object expenditure is Salaries, which contains 52% of all expenditures, which is approximately $38,169,580. The second largest object is Benefits. Both objects equal about 71% of the District’s entire budgeted expenditures.
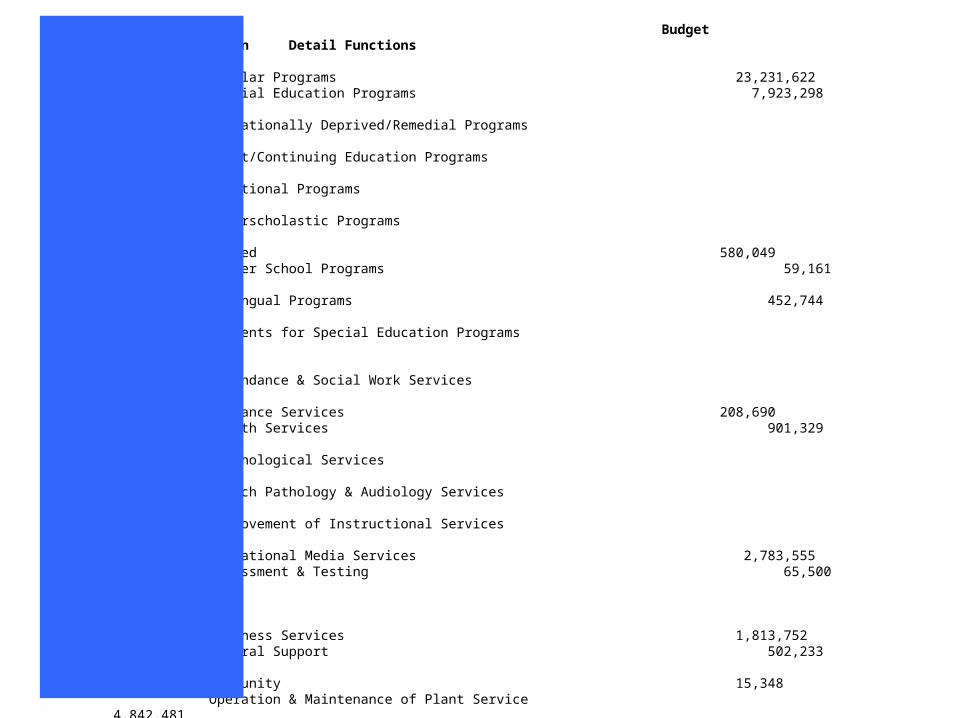
Budget Function Detail Functions 2007-2008
Regular Programs 23,231,622 Special Education Programs 7,923,298 Educationally Deprived/Remedial Programs 983,959 Adult/Continuing Education Programs 1,282 Vocational Programs 0 Interscholastic Programs 304,070 Gifted 580,049 Summer School Programs 59,161 Bilingual Programs 452,744 Payments for Special Education Programs 702,404
Attendance & Social Work Services 828,820 Guidance Services 208,690 Health Services 901,329 Psychological Services 614,585 Speech Pathology & Audiology Services 996,046 Improvement of Instructional Services 688,628 Educational Media Services 2,783,555 Assessment & Testing 65,500
Business Services 1,813,752 Central Support 502,233 Community 15,348 Operation & Maintenance of Plant Service 4,842,481 Transportation 5,150,521 IMRF/FICA 1,753,594
Board of Education Services 1,113,135 Executive Administration Services 193,751 Special Area Administration Services 402,241 Office of the Principal Services 2,649,051
Debt Service 7,595,955 Life Safety 0
Total 67,357,804
INS
TR
UC
TIO
NO
TH
ER
LE
AD
ER
SH
IPO
PE
RA
TIO
NS
INS
TR
UC
TIO
NA
L
SU
PP
OR
T
$0 $10,000,000 $20,000,000 $30,000,000 $40,000,000
Instruction
Instructional Support
Operations
Other Commitments
Leadership
2006-2007 2007-2008
Instruction Takes Top Priority at District 135
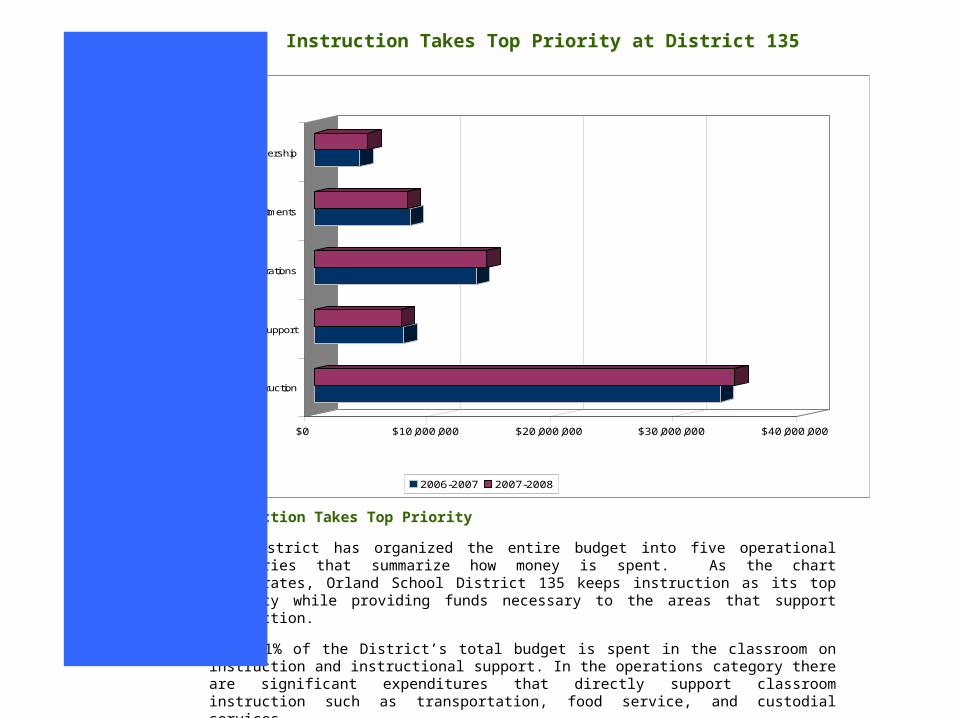
Instruction Takes Top Priority
The District has organized the entire budget into five operational categories that summarize how money is spent. As the chart illustrates, Orland School District 135 keeps instruction as its top priority while providing funds necessary to the areas that support instruction.
Over 61% of the District’s total budget is spent in the classroom on instruction and instructional support. In the operations category there are significant expenditures that directly support classroom instruction such as transportation, food service, and custodial services.
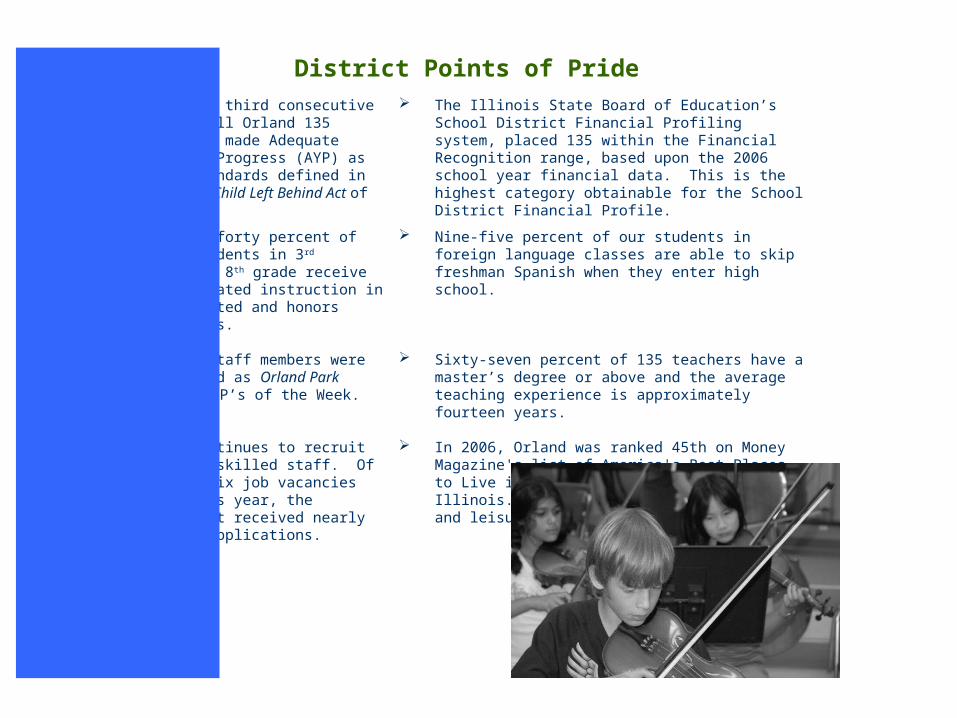
For the third consecutive year, all Orland 135 schools made Adequate Yearly Progress (AYP) as per standards defined in the No Child Left Behind Act of 2001.
The Illinois State Board of Education’s School District Financial Profiling system, placed 135 within the Financial Recognition range, based upon the 2006 school year financial data. This is the highest category obtainable for the School District Financial Profile.
Almost forty percent of our students in 3rd through 8th grade receive accelerated instruction in our gifted and honors programs.
Nine-five percent of our students in foreign language classes are able to skip freshman Spanish when they enter high school.
Seven staff members were featured as Orland Park Prairie VIP’s of the Week.
Sixty-seven percent of 135 teachers have a master’s degree or above and the average teaching experience is approximately fourteen years.
135 continues to recruit highly skilled staff. Of fifty-six job vacancies for this year, the District received nearly 2,200 applications.
In 2006, Orland was ranked 45th on Money Magazine's list of America's Best Places to Live in the United States, 2nd in Illinois. Orland scored highest in arts and leisure, followed by Education.
District Points of Pride
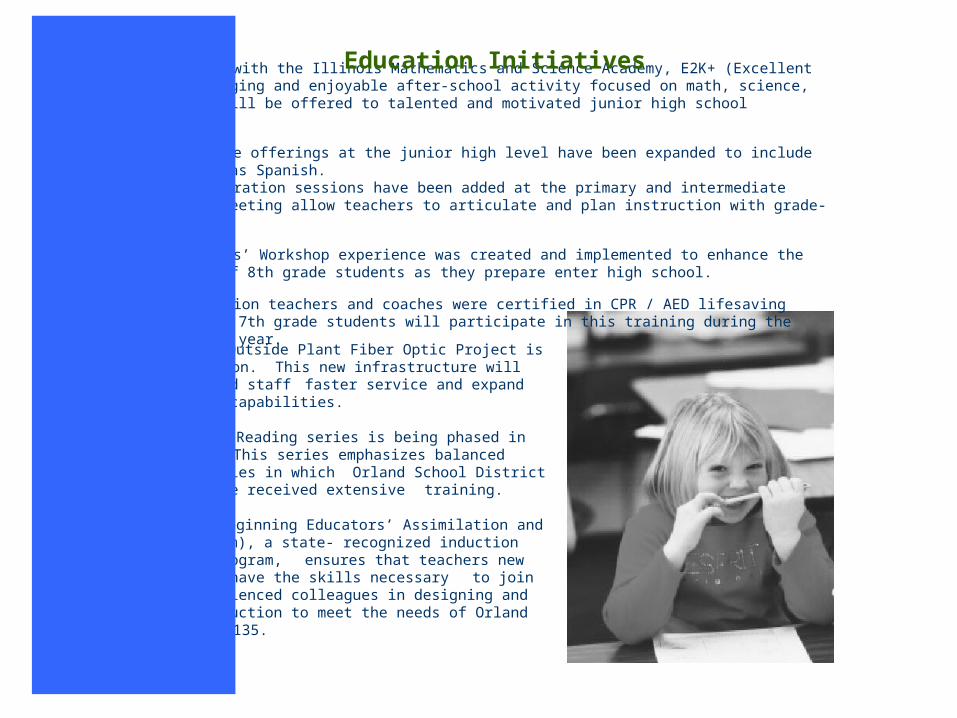
The two year Outside Plant Fiber Optic Project is nearing completion. This new infrastructure will give students and staff faster service and expand Internet access capabilities.
The Treasures Reading series is being phased in at grades K-5. This series emphasizes balanced literacy strategies in which Orland School District 135 teachers have received extensive training.
B.E.A.M.S. (Beginning Educators’ Assimilation and Mentoring System), a state- recognized induction and mentoring program, ensures that teachers new to the district have the skills necessary to join their more experienced colleagues in designing and delivering instruction to meet the needs of Orland School District 135.
In partnership with the Illinois Mathematics and Science Academy, E2K+ (Excellent 2000+) a challenging and enjoyable after-school activity focused on math, science, and technology will be offered to talented and motivated junior high school students.
Foreign language offerings at the junior high level have been expanded to include German, as well as Spanish.Teacher Collaboration sessions have been added at the primary and intermediate levels. These meeting allow teachers to articulate and plan instruction with grade-level colleagues.
A summer Writers’ Workshop experience was created and implemented to enhance the writing skills of 8th grade students as they prepare enter high school.
Physical Education teachers and coaches were certified in CPR / AED lifesaving techniques. All 7th grade students will participate in this training during the 2007-2008 school year.
Education Initiatives
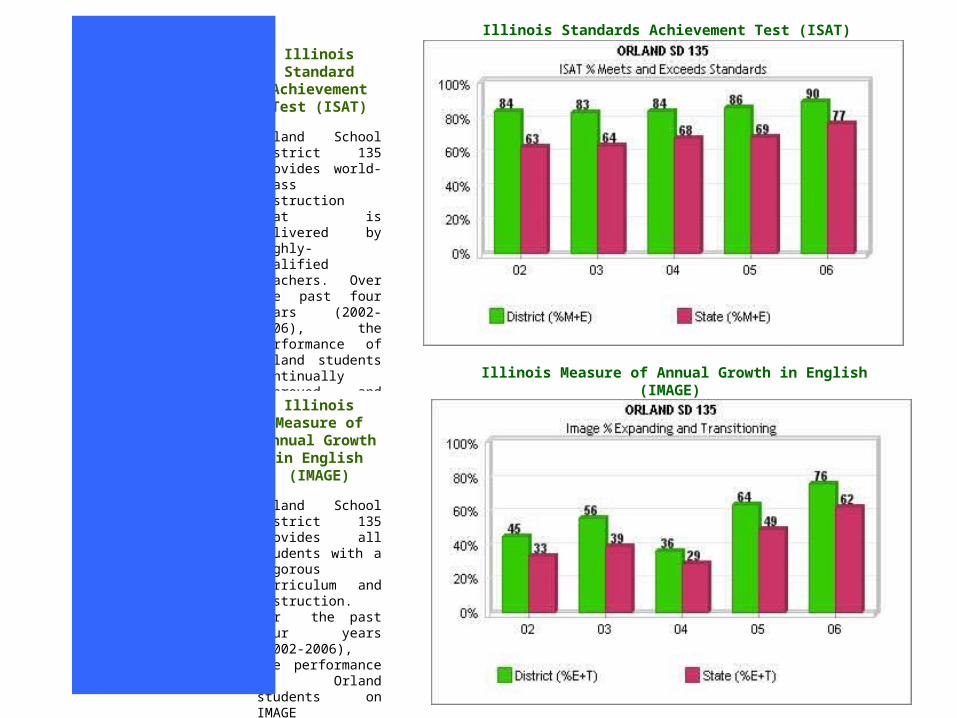
Illinois Standards Achievement Test (ISAT)
Illinois Measure of Annual Growth in English (IMAGE)
Illinois Standard Achievement Test
(ISAT)
Orland School District 135 provides world-class instruction that is delivered by highly-qualified teachers. Over the past four years (2002-2006), the performance of Orland students continually improved and exceeded state averages, as illustrated on the chart (right).
Illinois Measure of Annual Growth in English (IMAGE)
Orland School District 135 provides all students with a rigorous curriculum and instruction. For the past four years (2002-2006), the performance of Orland students on IMAGE assessments continually improved and exceeded state averages, as illustrated on the chart (right).
This booklet was prepared by the Orland School District 135 Business Services Department for the benefit of our community. It presents an overview of the budget for the 2007-08 school year with various analysis and comparisons. If you have any questions, please contact the Office of Assistant Superintendent of Business Services at (708) 364-3312 or [email protected].
Contact Information
Riverside Brookfield High School District 208
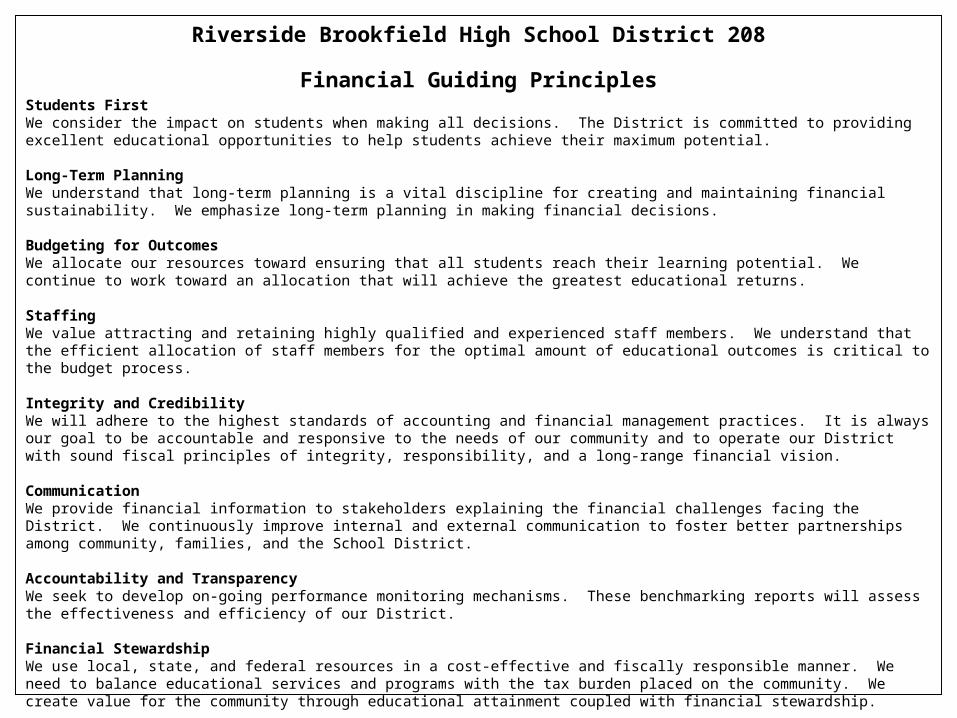
Financial Guiding PrinciplesStudents FirstWe consider the impact on students when making all decisions. The District is committed to providing excellent educational opportunities to help students achieve their maximum potential.
Long-Term PlanningWe understand that long-term planning is a vital discipline for creating and maintaining financial sustainability. We emphasize long-term planning in making financial decisions.
Budgeting for OutcomesWe allocate our resources toward ensuring that all students reach their learning potential. We continue to work toward an allocation that will achieve the greatest educational returns.
StaffingWe value attracting and retaining highly qualified and experienced staff members. We understand that the efficient allocation of staff members for the optimal amount of educational outcomes is critical to the budget process.
Integrity and CredibilityWe will adhere to the highest standards of accounting and financial management practices. It is always our goal to be accountable and responsive to the needs of our community and to operate our District with sound fiscal principles of integrity, responsibility, and a long-range financial vision.
CommunicationWe provide financial information to stakeholders explaining the financial challenges facing the District. We continuously improve internal and external communication to foster better partnerships among community, families, and the School District.
Accountability and TransparencyWe seek to develop on-going performance monitoring mechanisms. These benchmarking reports will assess the effectiveness and efficiency of our District.
Financial StewardshipWe use local, state, and federal resources in a cost-effective and fiscally responsible manner. We need to balance educational services and programs with the tax burden placed on the community. We create value for the community through educational attainment coupled with financial stewardship.
Continuous ImprovementWe seek ways to continuously improve the quality of the financial management of District 208.
Riverside Brookfield High School District 208
Financial Goals and Objectives
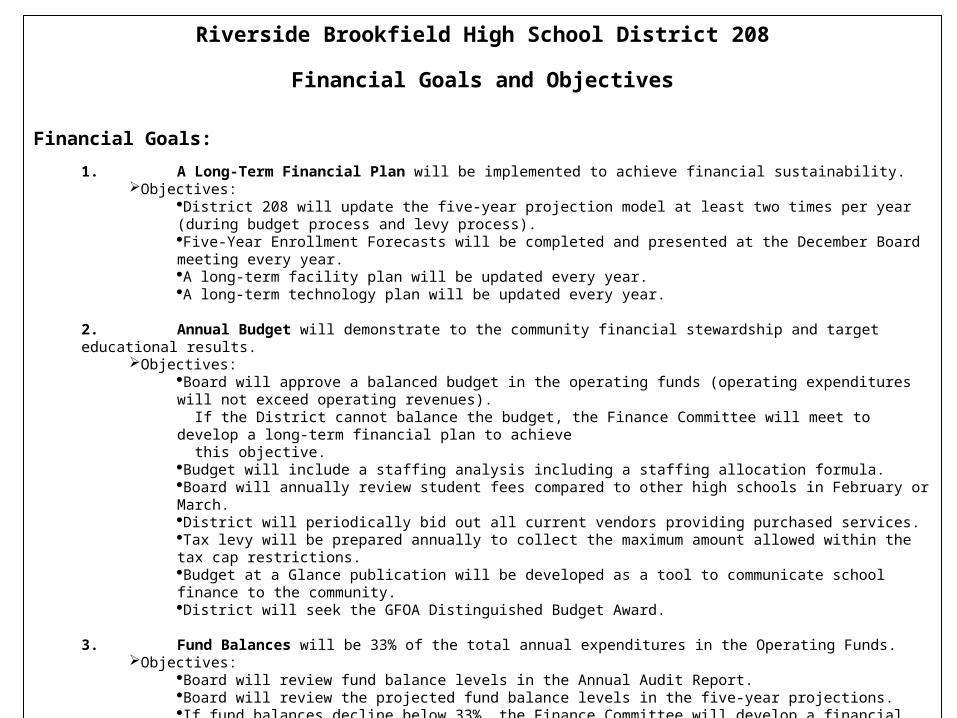
Financial Goals:
1. A Long-Term Financial Plan will be implemented to achieve financial sustainability.Objectives:
District 208 will update the five-year projection model at least two times per year (during budget process and levy process).Five-Year Enrollment Forecasts will be completed and presented at the December Board meeting every year.A long-term facility plan will be updated every year.A long-term technology plan will be updated every year.
2. Annual Budget will demonstrate to the community financial stewardship and target educational results.Objectives:
Board will approve a balanced budget in the operating funds (operating expenditures will not exceed operating revenues). If the District cannot balance the budget, the Finance Committee will meet to develop a long-term financial plan to achieve this objective.Budget will include a staffing analysis including a staffing allocation formula.Board will annually review student fees compared to other high schools in February or March.District will periodically bid out all current vendors providing purchased services.Tax levy will be prepared annually to collect the maximum amount allowed within the tax cap restrictions.Budget at a Glance publication will be developed as a tool to communicate school finance to the community.District will seek the GFOA Distinguished Budget Award.
3. Fund Balances will be 33% of the total annual expenditures in the Operating Funds.Objectives:
Board will review fund balance levels in the Annual Audit Report.Board will review the projected fund balance levels in the five-year projections.If fund balances decline below 33%, the Finance Committee will develop a financial plan to achieve the desired levels.
Financial Goals: (Continued)
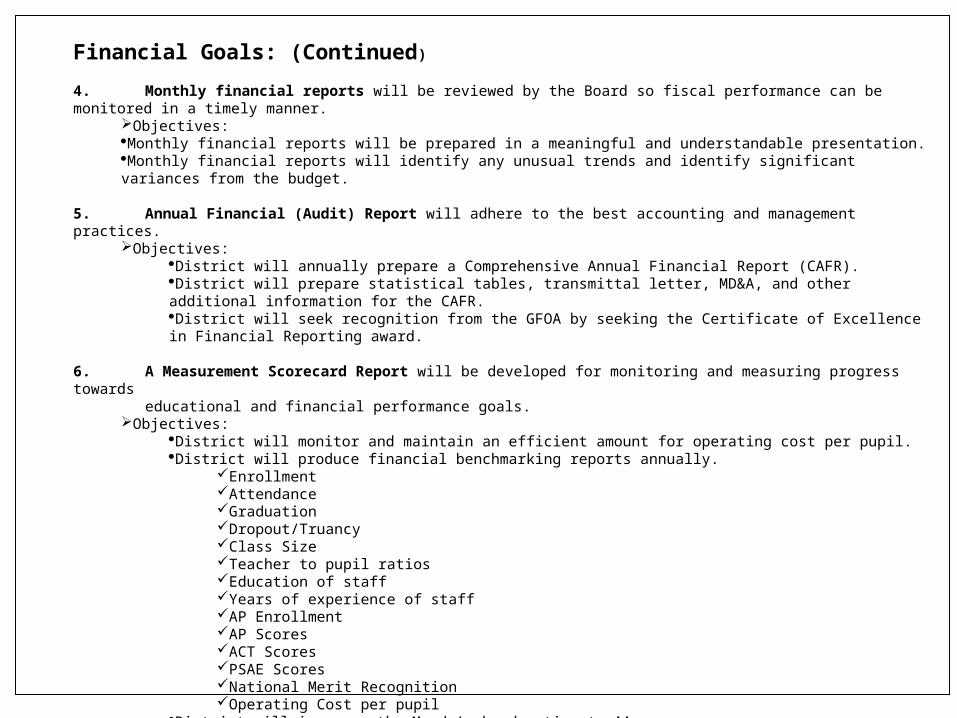
4. Monthly financial reports will be reviewed by the Board so fiscal performance can be monitored in a timely manner.Objectives:Monthly financial reports will be prepared in a meaningful and understandable presentation.Monthly financial reports will identify any unusual trends and identify significant variances from the budget.
5. Annual Financial (Audit) Report will adhere to the best accounting and management practices.Objectives:
District will annually prepare a Comprehensive Annual Financial Report (CAFR).District will prepare statistical tables, transmittal letter, MD&A, and other additional information for the CAFR.District will seek recognition from the GFOA by seeking the Certificate of Excellence in Financial Reporting award.
6. A Measurement Scorecard Report will be developed for monitoring and measuring progress towards educational and financial performance goals.
Objectives:District will monitor and maintain an efficient amount for operating cost per pupil.District will produce financial benchmarking reports annually.
EnrollmentAttendanceGraduationDropout/TruancyClass SizeTeacher to pupil ratiosEducation of staffYears of experience of staffAP EnrollmentAP ScoresACT ScoresPSAE ScoresNational Merit RecognitionOperating Cost per pupil
District will increase the Moody’s bond rating to AA.District will increase their score in the ISBE financial profile to the Recognition category.
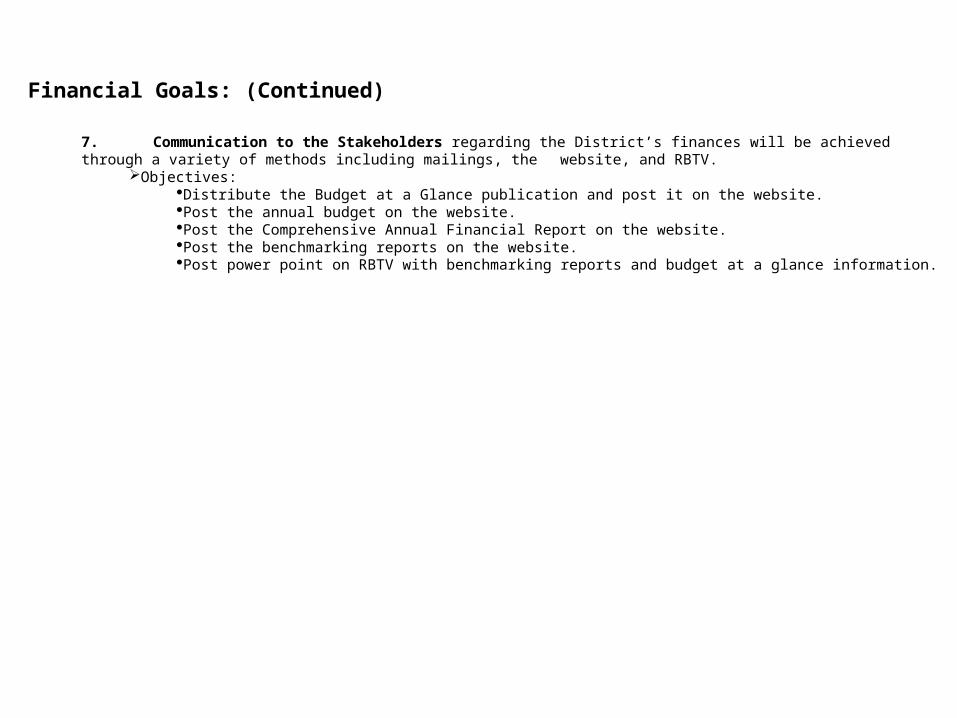
7. Communication to the Stakeholders regarding the District’s finances will be achieved through a variety of methods including mailings, the website, and RBTV.
Objectives:Distribute the Budget at a Glance publication and post it on the website.Post the annual budget on the website.Post the Comprehensive Annual Financial Report on the website.Post the benchmarking reports on the website.Post power point on RBTV with benchmarking reports and budget at a glance information.
Financial Goals: (Continued)
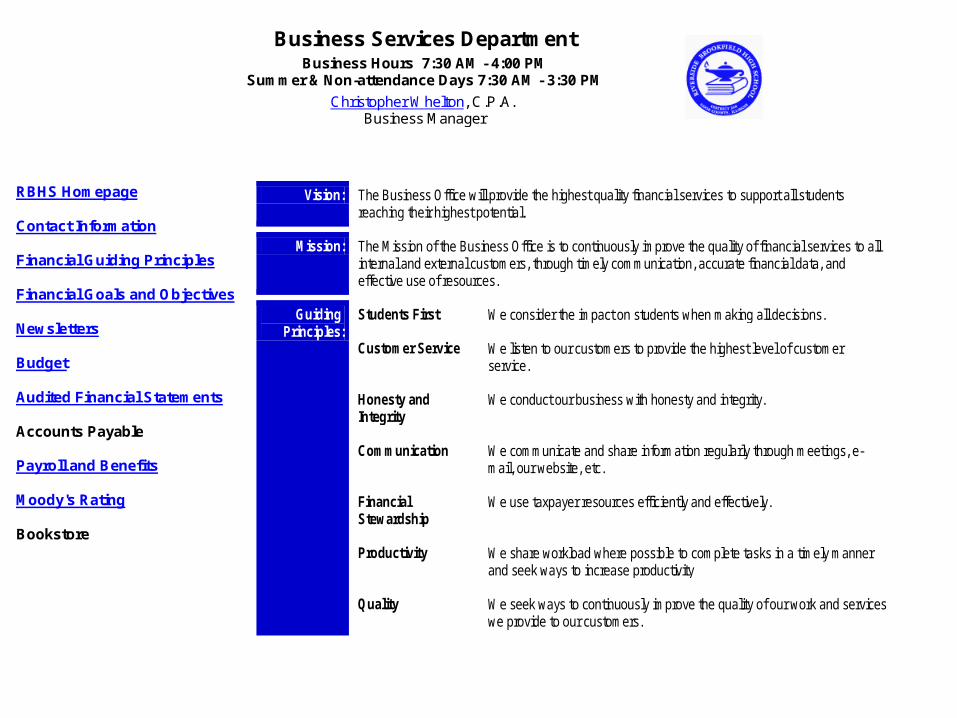
Vision: The Business Office will provide the highest quality financial services to support all students reaching their highest potential.
Mission: The Mission of the Business Office is to continuously improve the quality of financial services to all internal and external customers, through timely communication, accurate financial data, and effective use of resources.
Guiding Principles:
Students First We consider the impact on students when making all decisions.
Customer Service We listen to our customers to provide the highest level of customer service.
Honesty and Integrity
We conduct our business with honesty and integrity.
Communication We communicate and share information regularly through meetings, e-mail, our website, etc.
Financial Stewardship
We use taxpayer resources efficiently and effectively.
Productivity We share workload where possible to complete tasks in a timely manner and seek ways to increase productivity
Quality We seek ways to continuously improve the quality of our work and services we provide to our customers.
Business Services Department
Business Hours 7:30 AM - 4:00 PM Summer & Non-attendance Days 7:30 AM - 3:30 PM
Christopher Whelton, C.P.A. Business Manager
RBHS Homepage
Contact Information
Financial Guiding Principles
Financial Goals and Objectives
Newsletters
Budget
Audited Financial Statements
Accounts Payable
Payroll and Benefits
Moody's Rating
Bookstore