24
Building a Security Dashboard Joel M Snyder jms@opus1.com Senior Partner Opus One
| Date post: | 17-Nov-2018 |
| Category: |
Documents |
| Upload: | vuongkhuong |
| View: | 217 times |
| Download: | 0 times |

AgendaAgenda
• What’s a Dashboard?• What s a Dashboard?
• How do I build one (part 1)?How do I build one (part 1)?
• <parts 2 through n> don’t fit in an p ghour
A Security Dashboard ProvidesA Security Dashboard Provides…
• “At a Glance” view of your security • At a Glance view of your security posture

“Security Posture?”What’s that?What s that?
• Since Since Security is Risk Avoidance, Joel’s D fi iti iDefinition is:
Security Posture: The Security Posture: The Degree to Which You Are Exposed to RiskAre Exposed to Risk
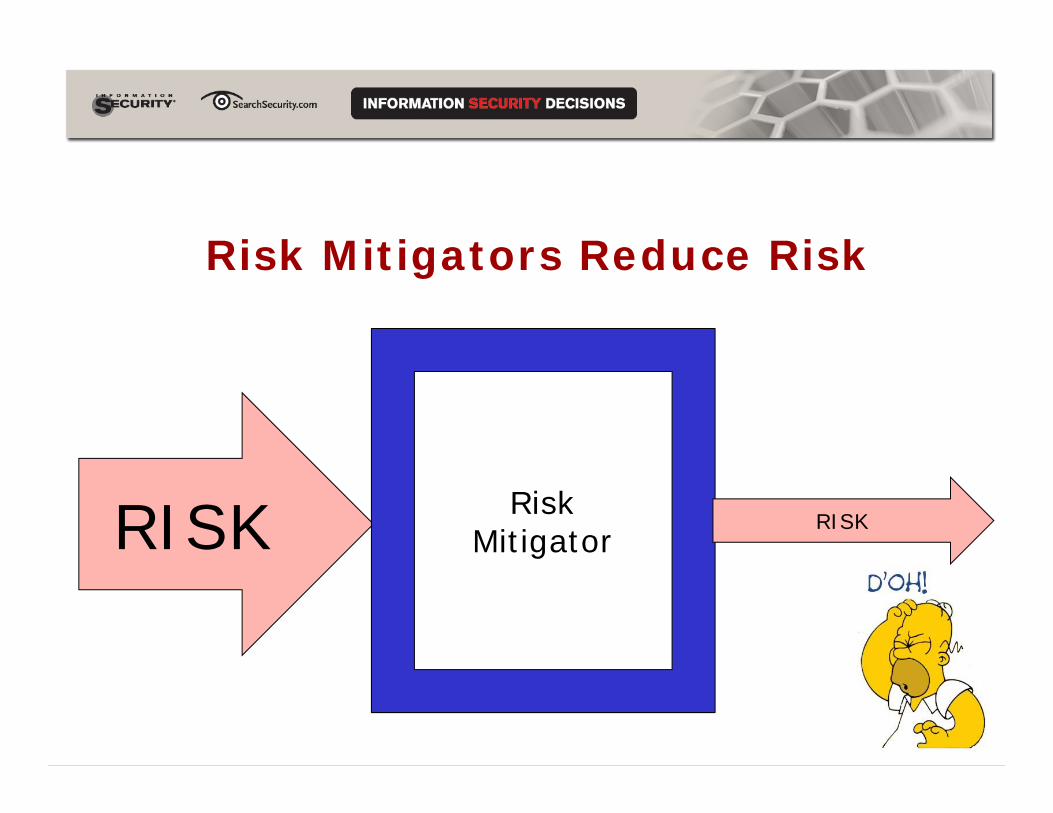
Risk Mitigators Reduce RiskRisk Mitigators Reduce Risk
RISK RiskMitigator
RISK
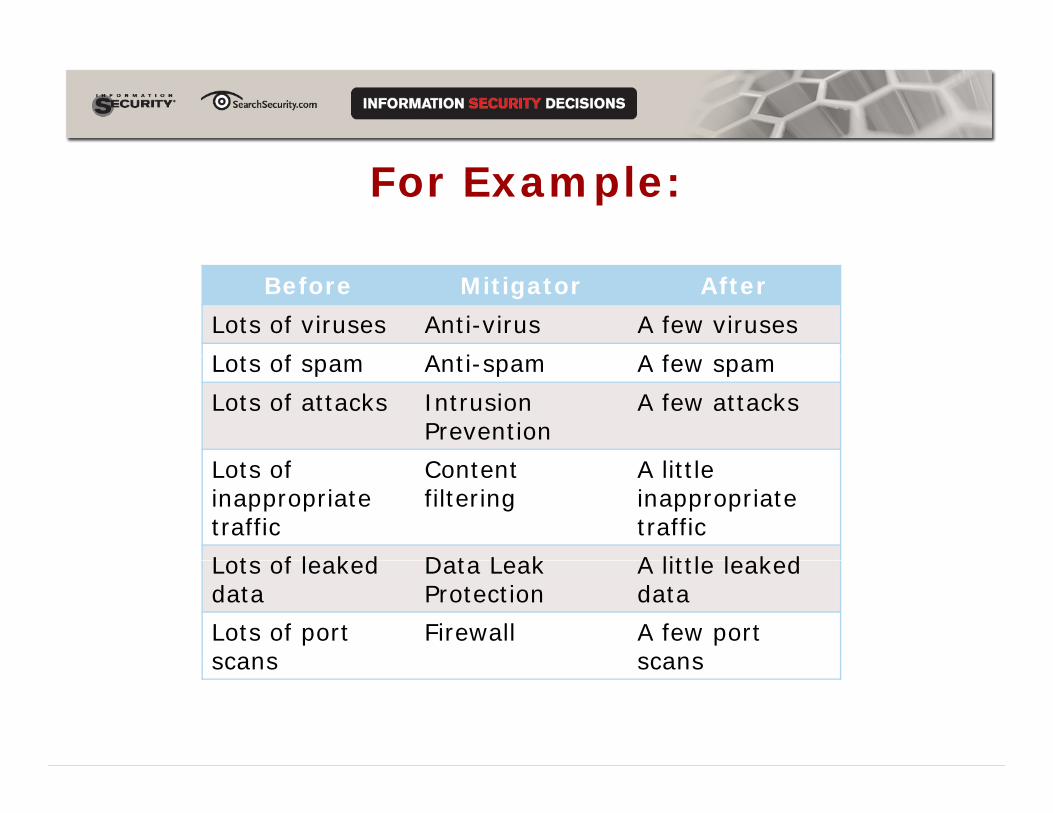
For Example:
Before Mitigator After
Lots of viruses Anti-virus A few viruses
L t f A ti A f Lots of spam Anti-spam A few spam
Lots of attacks Intrusion Prevention
A few attacks
Lots of inappropriate traffic
Content filtering
A little inappropriate traffic
Lots of leaked Data Leak A little leaked Lots of leaked data
Data Leak Protection
A little leaked data
Lots of port scans
Firewall A few port scansscans scans

Anomaly Detectors can Detect RiskDetect Risk
+1 standard deviation
Secondary signs of increase in risk are also visible in the form of anomalous activity
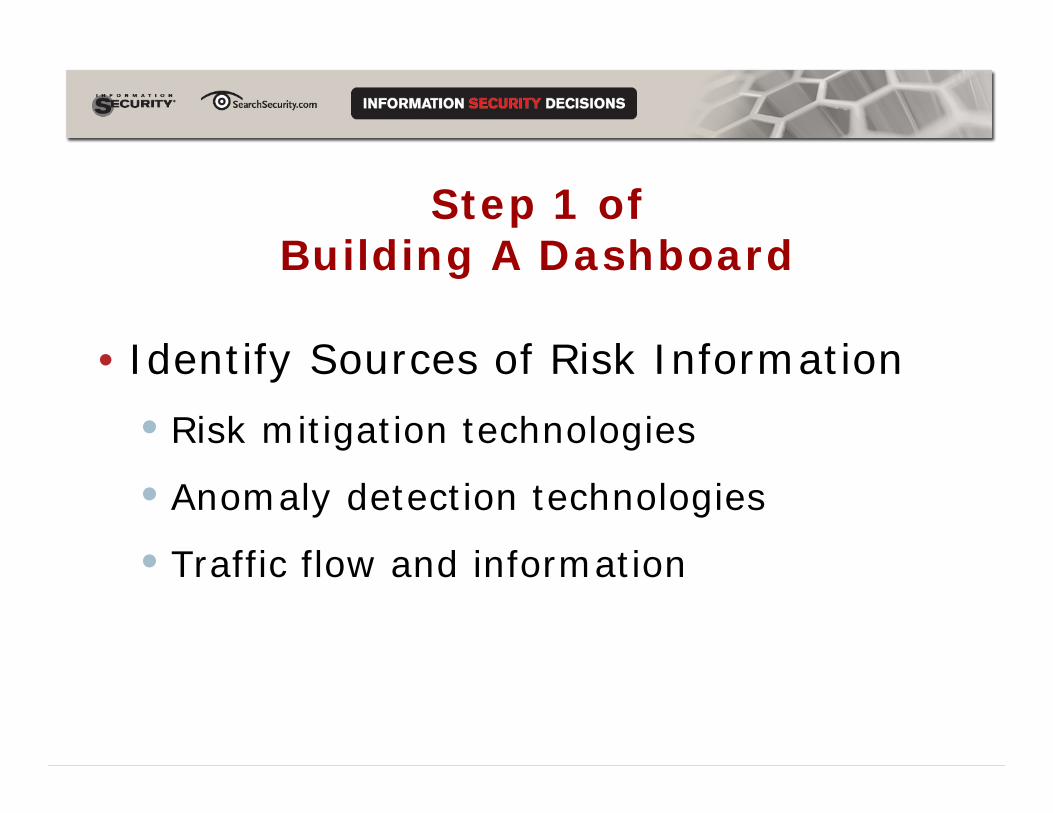
Step 1 of Building A DashboardBuilding A Dashboard
• Identify Sources of Risk Information• Identify Sources of Risk Information
• Risk mitigation technologies
• Anomaly detection technologies
• Traffic flow and information• Traffic flow and information

Example: Opus OneSource of I f ti
Type of InformationInformation
Firewall Traffic Log
Traffic in/out of the network; prohibited inbound/outbound attempts
Mail Security Gateway
Level of inbound email traffic; number of viruses and spam blocked
IDS/IPS Alerts on suspicious traffic; alerts on blocked traffic
Network Monitoring
Systems up/down; ping latency; link/disk/memory/CPU usage
Bandwidth Traffic levels at network port granularityGraphing
Vulnerability Analyzer
System vulnerability detection; deltas in vulnerabilities; changes in open ports
Log Collector Information from SYSLOG, Windows Event Log, SNMP
Tripwire Changes in system security or sensitive files
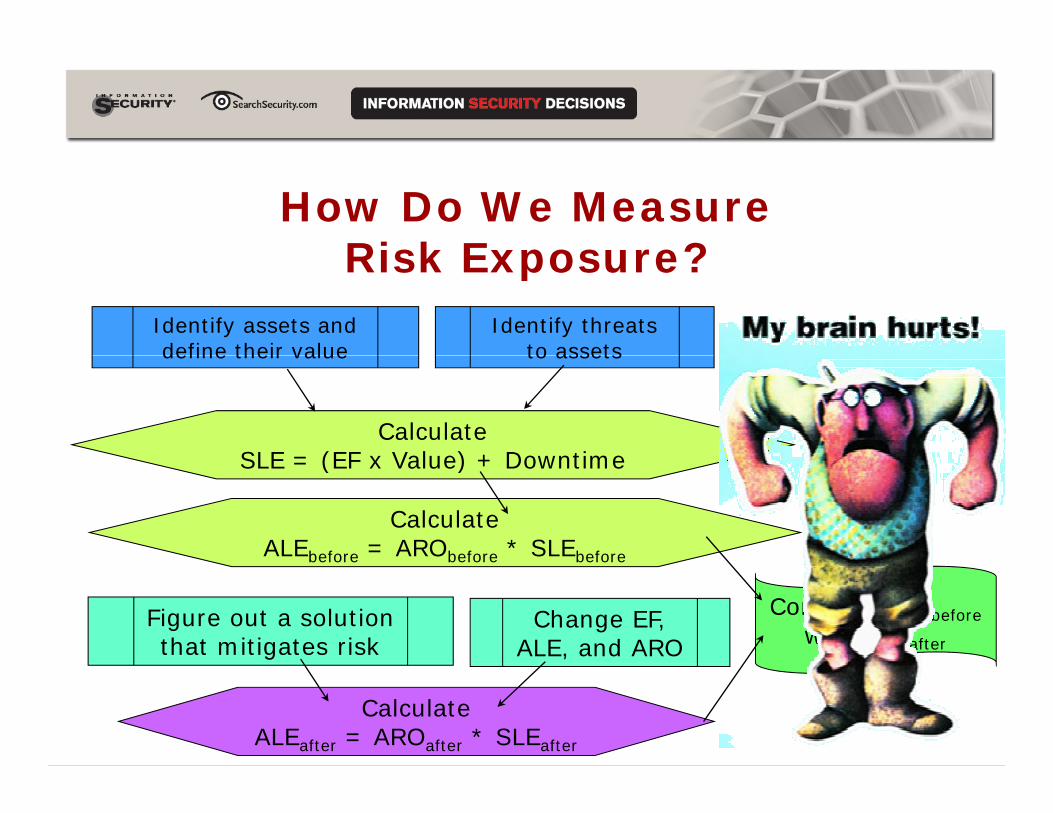
How Do We Measure Risk Exposure?Risk Exposure?
Identify assets and define their value
Identify threats to assets define their value to assets
Calculate SLE = (EF x Value) + DowntimeSLE = (EF x Value) + Downtime
Calculate ALEbefore = ARObefore * SLEbeforebefore before before
Figure out a solution that mitigates risk
Change EF, ALE, and ARO
Compare ALEbeforewith ALEafter
Calculate ALEafter = AROafter * SLEafter

OK, Better Question:What Do Our Data Tell Us?What Do Our Data Tell Us?
• Mitigators can’t tell you when they’re • Mitigators can t tell you when they re broken
• But you may be able to see it
• Anomaly detectors can’t tell you when something is brokeng
• But you may be able to see it

For Example, Mail Security GatewayMail Security Gateway
What can you see in this information that helps you to evaluate security posture and risk?

This Turns IntoThis Turns Into…
1 hr, 8 hr, 100 hr
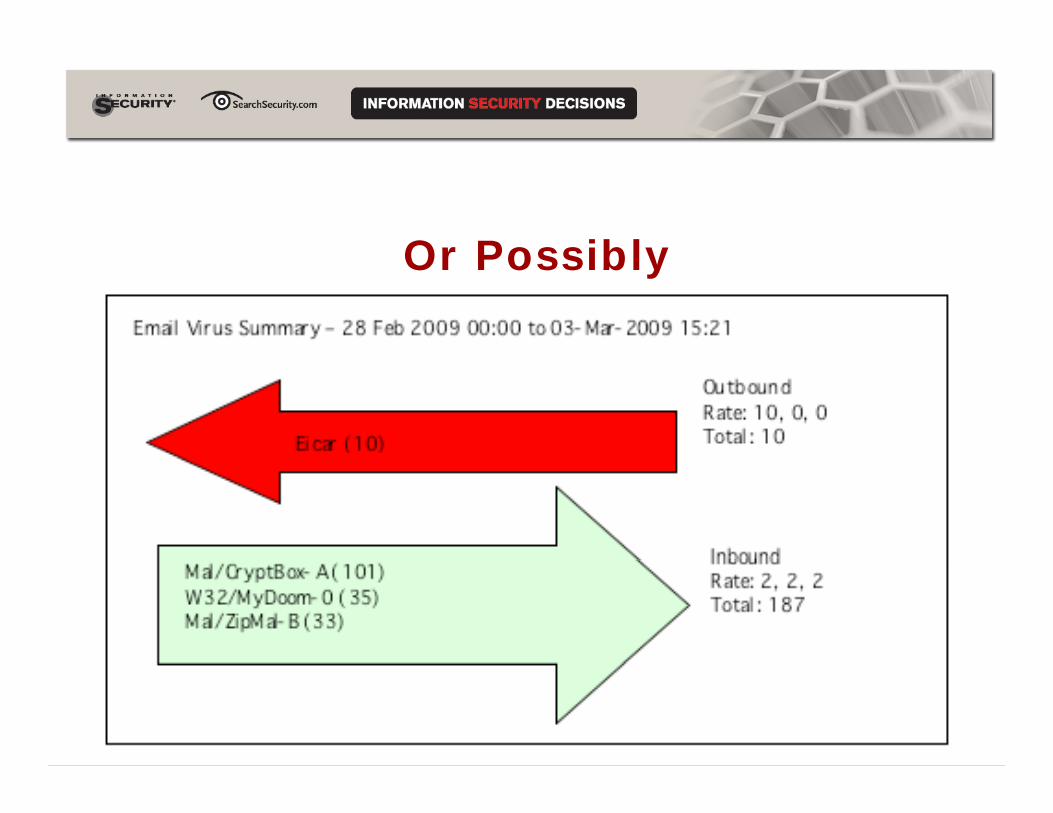
Or PossiblyOr Possibly

Example 2: Network Status
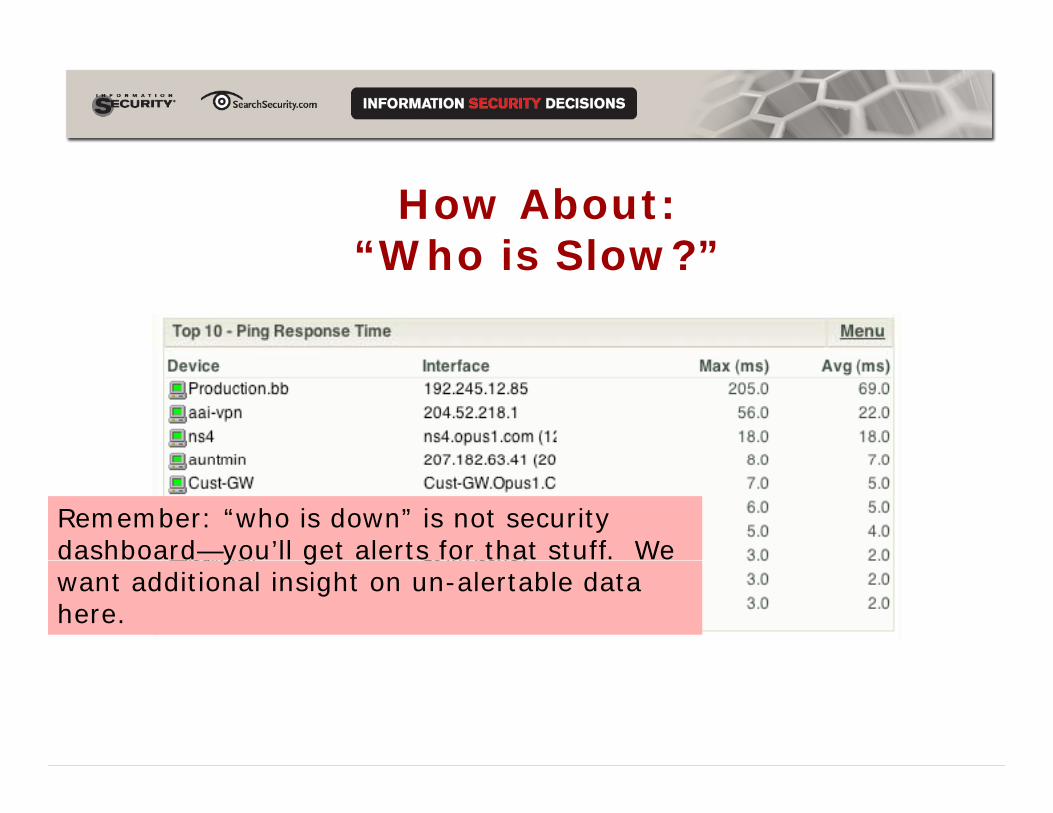
How About: “Who is Slow?”Who is Slow?
Remember: “who is down” is not security dashboard—you’ll get alerts for that stuff. We y gwant additional insight on un-alertable data here.

Too Generic:“Who is Unusually Fast/Slow?”
Better… but would be good to Better… but would be good to color code based on how far off of normal behavior this is.Even better … don’t fixate on “ping” but extend response time to applications

Step 2 of Building a DashboardBuilding a Dashboard
2 Reduce output of risk mitigation tools 2. Reduce output of risk mitigation tools to minimum needed to determine security posture!
If you want the full boat, you can always click-through to the original data or a more detailed original data or a more detailed display

Incorporating Anomaly Detection Requires BaseliningRequires Baselining
Quick: is there something wrong here or not?
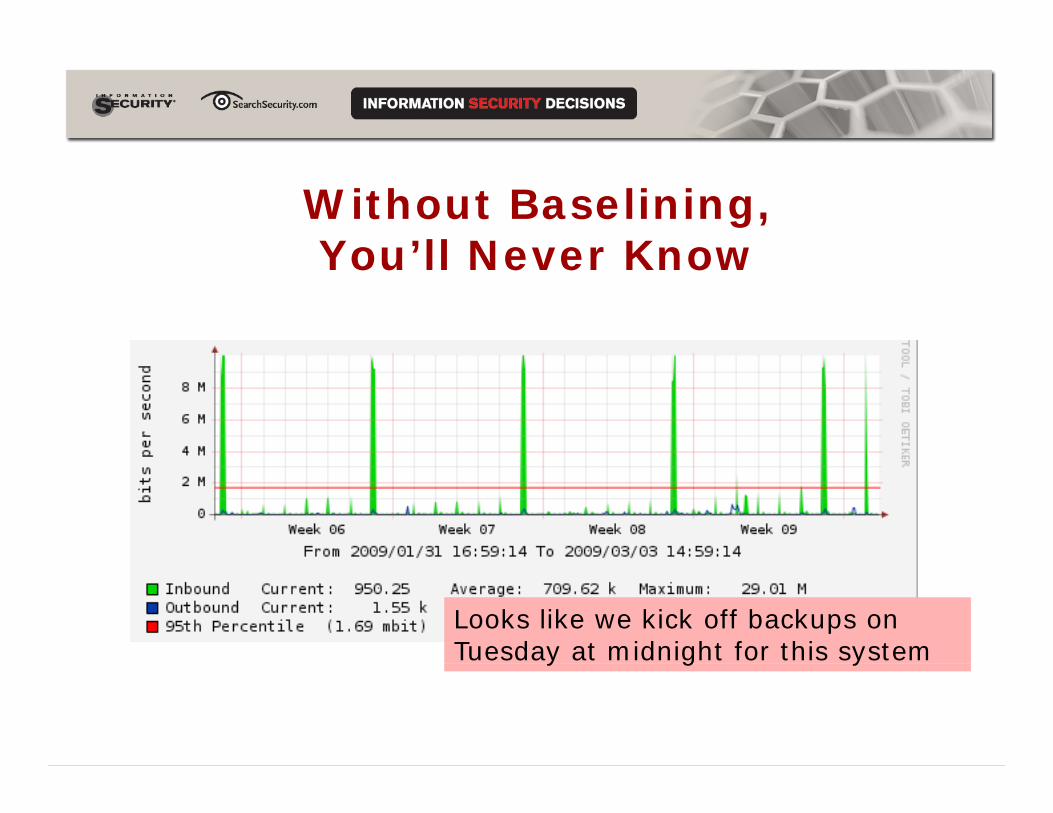
Without Baselining, You’ll Never Know You ll Never Know
Looks like we kick off backups on Tuesday at midnight for this systemy g y

Examples of Baseline DeviationExamples of Baseline DeviationSource of Information
Deviation To Look ForInformation
Firewall Traffic Log
Traffic high/low; outbound “deny” high
Network Application “slower” than normalNetwork Monitoring
Application slower than normal
Vulnerability Analyzer
Delta in open ports/responding servicesy
Log Collector SYSLOG/Windows Log/SNMP Trap above normal levels for each system
Tripwire Tripwire is all about deviations!Tripwire Tripwire is all about deviations!
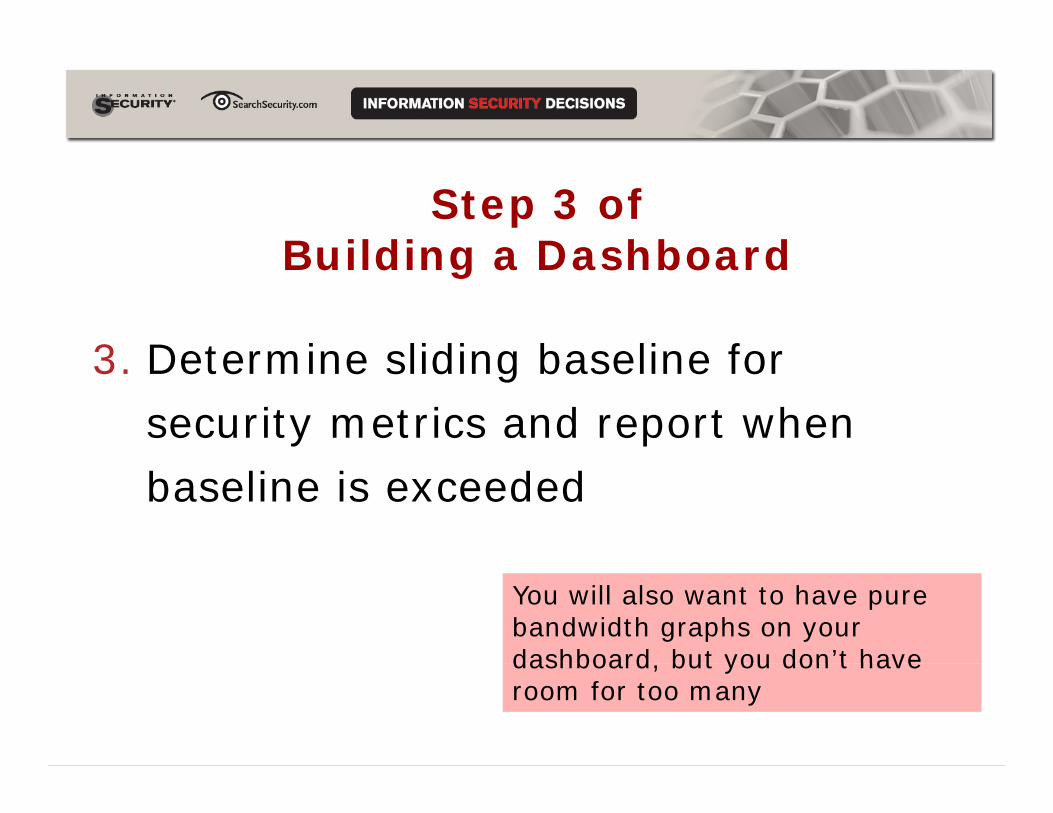
Step 3 of Building a DashboardBuilding a Dashboard
3 Determine sliding baseline for 3. Determine sliding baseline for security metrics and report when baseline is exceeded
You will also want to have pure bandwidth graphs on your dashboard but you don’t have dashboard, but you don t have room for too many

Next Steps
4. Identify most critical 12 to 16 “panes” of data giving insight into security postureposture
5. Bring together into graphical format
6. Reconcile with alerting
7. Get promotion from drooling boss


