29
CIBC World Markets 10 th Annual Whistler Institutional Investor Conference Steve Snyder, President & CEO February 23, 2007 Building on strengths

CIBC World Markets10th Annual Whistler Institutional Investor Conference
Steve Snyder, President & CEOFebruary 23, 2007
Building on strengths

Forward looking statementsThis presentation may contain forward-looking statements, including statements regarding the business and anticipated financial performance of TransAlta Corporation. All forward-looking statements are based on our beliefs and assumptions based on information available at the time the assumption was made. These statements are not guarantees of our future performance and are subject to a number of risks and uncertainties that may cause actual results to differ materially from those contemplated by the forward-looking statements. Some of the factors that could cause such differences include cost of fuels to produce electricity, legislative or regulatory developments, competition, global capital markets activity, changes in prevailing interest rates, currency exchange rates, inflation levels and general economic conditions in geographic areas where TransAlta Corporation operates. Given these uncertainties, the reader should not place undue reliance on this forward-looking information, which is given as of this date. The material assumptions in making these forward-looking statements are disclosed in our 2005 Annual Report to shareholders and other disclosure documents filed with securities regulators.
Unless otherwise specified, all dollar amounts are expressed in Canadian dollars.
Outline
• Corporate Overview
• 2006 Highlights
• Performance Against Key Measures
• 2007 - What Investors Can Expect
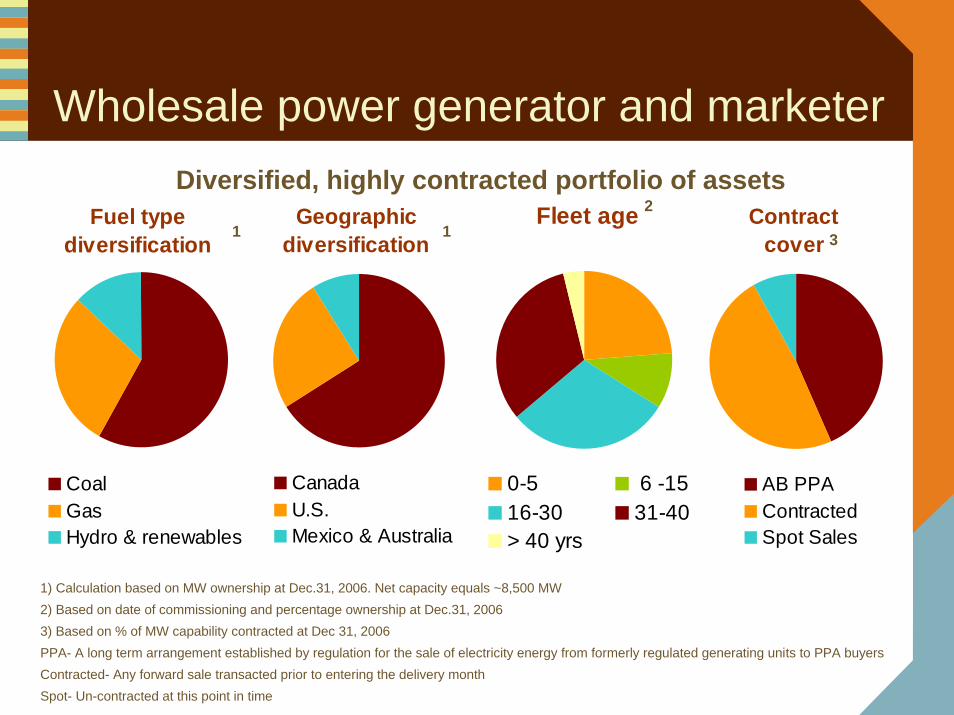
Wholesale power generator and marketerDiversified, highly contracted portfolio of assets
1) Calculation based on MW ownership at Dec.31, 2006. Net capacity equals ~8,500 MW2) Based on date of commissioning and percentage ownership at Dec.31, 20063) Based on % of MW capability contracted at Dec 31, 2006PPA- A long term arrangement established by regulation for the sale of electricity energy from formerly regulated generating units to PPA buyersContracted- Any forward sale transacted prior to entering the delivery monthSpot- Un-contracted at this point in time
Geographicdiversification
CanadaU.S.Mexico & Australia
Fuel typediversification
CoalGasHydro & renewables
Fleet age
0-5 6 -1516-30 31-40> 40 yrs
Contractcover
AB PPAContractedSpot Sales
112
3

2006 highlights: Strong operations, increased energy trading margins and OM&A savings
2004 - 2006, strong operations, comparable earnings growth and increased cash flow have resulted in investment grade ratings,
share price appreciation and free cash flow alternatives
1 2006 net earnings includes $153.6 million after tax charge related to Centralia Mine closure, $84.4 million impairment of CentraliaGas facility, $6.2 million Q1 after tax writedown of a turbine in inventory, and $53.3 million benefit from Q2 tax rate changes 2 2005net earnings includes $12 million after tax gain on discontinued operations, and $13 million from tax settlement on a deferredreceivable 3 Free cash flow after dividend payment, debt repayment and sustaining capex. 2006 CF includes $185 millionreceivable received Jan. 2, 2007 due to timing of collection of November sales
$-
$0.20
$0.40
$0.60
$0.80
$1.00
$1.20
$1.40
2004 2005 2006
Cash flow & Free cash3 Share priceNet EPS1,2 & Comparable EPS
$185 MM
$-
$5
$10
$15
$20
$25
$30
2004 2005 2006$-
$50
$100
$150
$200
$250
TransAlta
TSX CappedUtilities Index
$-
$200
$400
$600
$800
2004 2005 2006
Availability
89.2% 89.4% 89.0%
0.0%
20.0%
40.0%
60.0%
80.0%
100.0%
2004 2005 2006
MM

Strong credit ratios, focus on ROCE improvement
1. Return on capital employed (ROCE) = earnings before non-controlling interests, income taxes and net interest expense/average annual invested capital
2. On a net basis, including one-time events, Return on capital employed would be 2.5%
Financial ratios Target 2006 2005 2004
Cash flow to interest (x) 4.2
28
48
10
4.8 4.3
Cash flow to total debt (%)
5.5
26.1
40.9
23.5 19.1
Return on capital employed (%)1 8.32 7.1
Debt to total capital (%) 43.6 46.4
7.5

Financial objectives and measuresObjectives Measures 2007 Goals 2006
9%8.3%1
$1.16
$675 MM2
Investment grade
$7.93
Flat
48%7.1%
Increase comparable earnings per share Comparable EPS 6 - 10% $0.82
$620 MM
Investment grade
$8.13
+225 MW(G3 online)
Deliver long-term shareholder return
TSRROCE
10%10%
Improve productivity OM&A/installed MWh Offset
inflation/ reduce
with growth
Grow capacity profitably Installed capacity Increase ~5%/yr
Increase operating cash flow Operating cash flow $650 - $750 MM
Maintain strong financial ratios Credit ratios
Investment grade
2005
1. On a comparable basis, Return on capital employed would be 2.5%2. Includes $185 MM receivable received Jan. 2, 2007 due to timing of collection of November sales.

Operating objectives and measuresObjectives Measures 2007 Goals 2006
90% 89%1
87%
$1.5 B
$233 MM
Compliance in all markets
>75% 2
Increase
Make sustaining capex predictable
Sustaining capex budget $320 - $345 MM $153 MM
< emissionsintensity
Maintain targeted availability
Fleet availability 88.6%
Contract plant output Contracted output 83%
Reduce environmental footprint
Emissions reductions
Compliance in all markets
Increase gross margin Margin $1.4 B
2005
1. Includes impact of the August 6, 2006 Centralia blade failure. Excluding the blade failure, availability was 89.6%2. At December 31, 2006, 93% of plant capability is contracted for 2007.

Short term increase in sustaining capex
2006 2007$MM
Increase in sustaining capital supports Alberta mine activities and Centralia fuel blend modifications. Growth capex includes Sun 4
uprate and New Brunswick wind projects.
Sustaining $214 $320 - $345Routine capital $100 $100 - $105
Mine capital $27 $80 - $85
Centralia Fuel Blend - $55 - $60
Major maintenance $87
$10
$85 - $95
Growth $55 - $65
Mexico $10 $3 - $5
Total $234 $378 - $415As of Jan. 26, 2007

Centralia coal transition plan • Nov. 27, 2006 announced decision to
stop mining immediately – existing operations no longer economic
• 600 employees laid off
• $154MM ($0.76 per share) after tax charge to Q4’06 earnings
• Sourcing 100% Powder River Basin coal• Long-term transportation contract w/
BNSF Railway • Coal contracts w/ Rio Tinto Energy America
and Peabody Energy
• 2007/2008 - Centralia coal-fired plant transition
• $50 - $60 MM planned investment in rail uploading facilities – increase to 10 trains/wk
• $50 - $60 MM in plant modifications to burn PRB at 100% sustainably
• Plant derated to 1,000 MW/year 2007-2008

Balanced, steady growth
Growth in the markets and technologies we know -- targeting
avg. of 5% capacity growth per year over the next 5 years
2006 Portfolio
8,500MW
2011 Target
10,500MW
We are in good geographies with tightening reserve margins and requirements for cleaner energy alternatives
• Western Canada - economic growth driving demand increase• Eastern Canada - new supply and cleaner energy alternatives • Western US - large market, consolidations and renewable opportunities • Australia - global demand for minerals driving customer demand
• Mexico - CFE committed to IPP program and providing long-term contracts

Disciplined capital allocation process1. Strategic fit
– Commercial and operational criteria
– Merchant vs. contracted
– Brownfield, acquisition and greenfield
2. Internal rate of return
– Project specific hurdle rates
– Unlevered IRR must be greater than WACC
– Assumes 50:50 capital structure
3. Net present value
– Allocate capital to projects yielding greatest cash flow
4. Earnings per share
– Should be accretive in each year1
5. Credit quality
– Supports investment grade credit rating
• Decisions benchmarked
vs. 10% TSR and 10%
ROCE goals
• Balance between
brownfield expansion,
acquisition and
greenfield development
manages cash
resources and supports
credit ratios1 Excludes construction period for greenfield and brownfield development
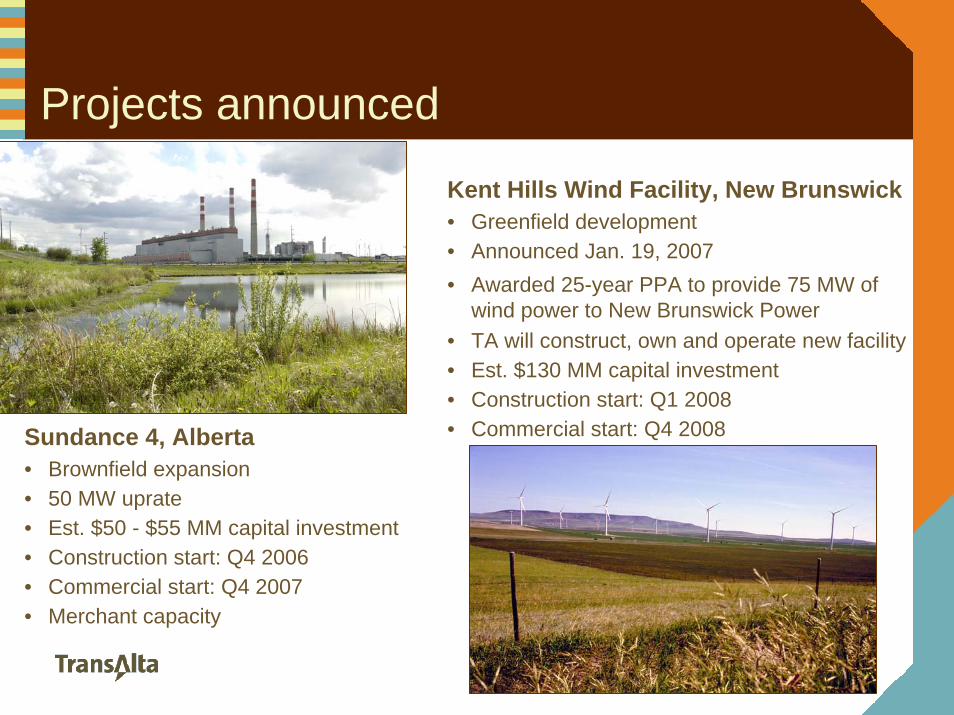
Projects announced
Kent Hills Wind Facility, New Brunswick • Greenfield development• Announced Jan. 19, 2007• Awarded 25-year PPA to provide 75 MW of
wind power to New Brunswick Power• TA will construct, own and operate new facility• Est. $130 MM capital investment• Construction start: Q1 2008• Commercial start: Q4 2008Sundance 4, Alberta
• Brownfield expansion• 50 MW uprate• Est. $50 - $55 MM capital investment• Construction start: Q4 2006• Commercial start: Q4 2007• Merchant capacity

Projects under developmentKeephills, Alberta• 450 MW Brownfield expansion on TA site • 50:50 JV with EPCOR• Supercritical facility utilizing the same
technology currently in operation at the Genesee 3 facility – only second plant in Canada
• TransAlta and EPCOR will independently dispatch and market their own share of electrical output
• AEUB approval Feb. 13, 2007• Merchant capacity
• Replaces TransAlta’s WAB 4 facility (279 MW), scheduled to retire 2010
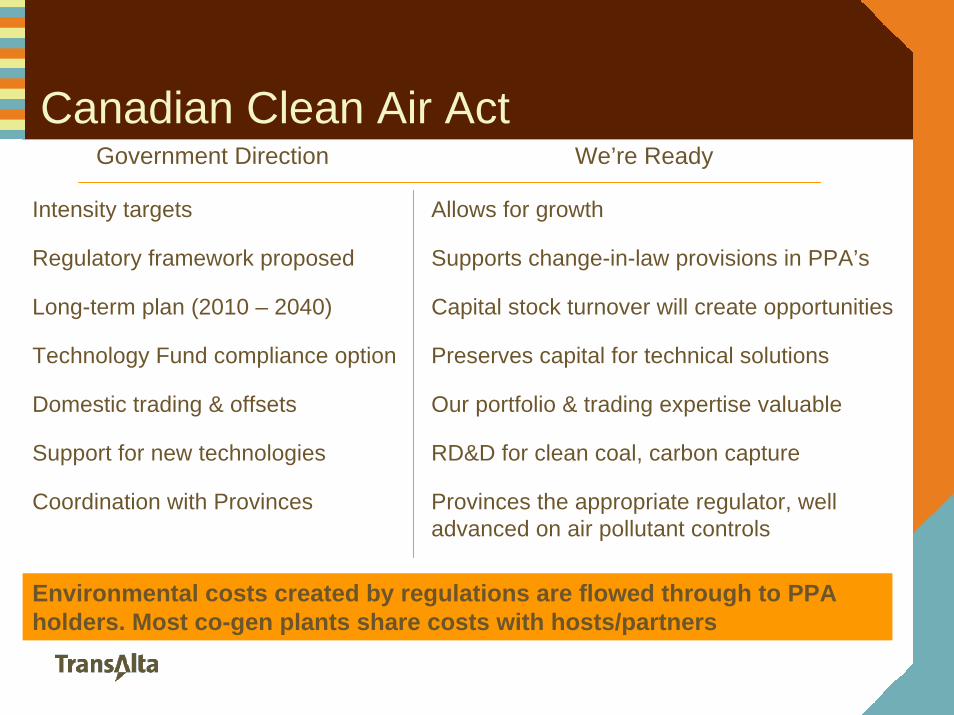
Canadian Clean Air Act Government Direction We’re Ready
Intensity targets
Regulatory framework proposed
Long-term plan (2010 – 2040)
Technology Fund compliance option
Domestic trading & offsets
Support for new technologies
Coordination with Provinces
Allows for growth
Supports change-in-law provisions in PPA’s
Capital stock turnover will create opportunities
Preserves capital for technical solutions
Our portfolio & trading expertise valuable
RD&D for clean coal, carbon capture
Provinces the appropriate regulator, well advanced on air pollutant controls
Environmental costs created by regulations are flowed through to PPA holders. Most co-gen plants share costs with hosts/partners
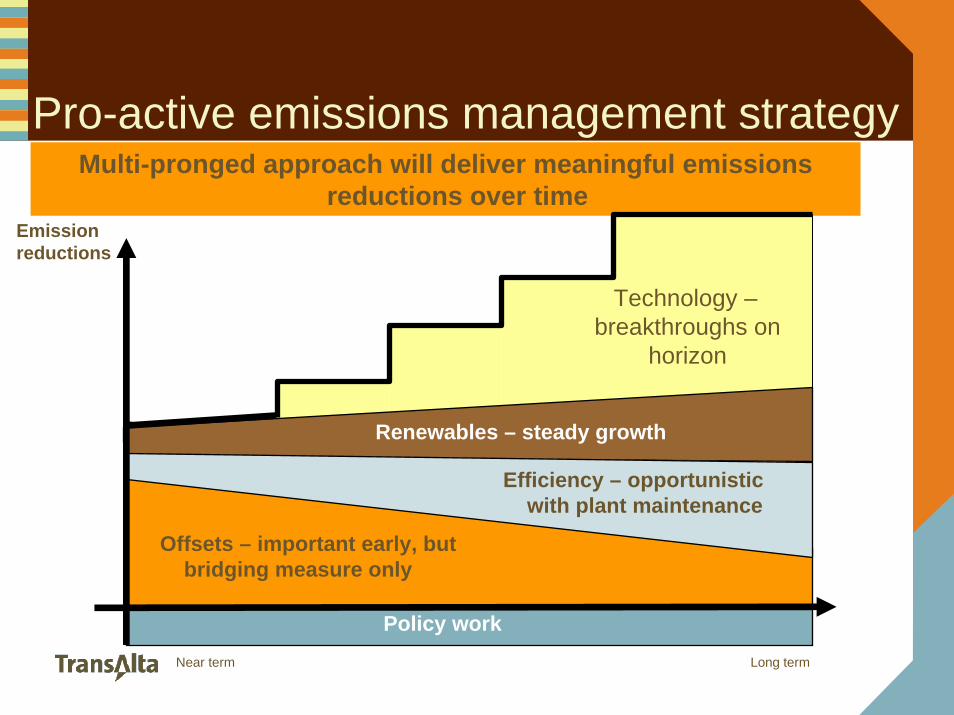
Pro-active emissions management strategy
Emissionreductions
Offsets – important early, but bridging measure only
Efficiency – opportunistic with plant maintenance
Multi-pronged approach will deliver meaningful emissions reductions over time
Technology –breakthroughs on
horizon
Renewables – steady growth
Policy work Near term Long term

We’re building on strengths to achieve goals and objectives
• Wholesale power generator and marketer
• Diversified & highly contracted
• Strong cash generation
• Stable BBB credit rating
• Financial discipline
• Reliable operations
• Life-cycle management
• Portfolio management
• Long-term rail and coal assets
• Well positioned in growing markets
• Recognized leader in sustainable development

Appendix
A P R I L 2 7, 2 0 0 6

Q4 and FY 2006 highlightsQ4 2006• Continued strong availability across
fleet (89.9% vs. 90.4% in Q4 ’05)• Generation gross margins increased
by $73 million before inventory write-down, includes gain on certain Centralia coal-fired asset contracts and CN Rail settlement
• Energy Trading margins comparable in the quarter
• Centralia mine closure impact $0.76 per share ($153.6 million after tax loss)
• Centralia gas-fired plant impairment impact $0.42 per share ($84.4 million after tax loss)
FY 2006, also included:• Strong fleet availability – despite
Centralia coal-fired unplanned outages and derates (89.0% vs. 89.4% in 2005)
• Generation gross margins increased $85 million before inventory write-down
• Energy Trading gross margins up $8.8 million to $65.7 million
• Decreased income tax expense due to federal and provincial rate changes $165.4 million
• OM&A savings of $16.7 million YOY• Lower interest expense of $20 million
due to lower debt and favorable settlement of investment hedges

Strong gross margins, lower OM&A and income tax expense offset by Centralia one-time events
Net Earnings 3 mo. Ended December 31
12 mo. Ended December 31
Net Earnings, 2005 (as restated)1 $ 59.9 $ 186.3
Increased Generation gross margins before write down of coal inventory
72.9 85.0
Higher Energy Trading margins 0.6 8.8
Decrease in operations, maintenance and administration costs 6.4 14.7
Increase in depreciation expense (3.1) (42.4)
Coal inventory write-down to lower of cost and market (44.4) (44.4)
Centralia mine closure costs (191.9) (191.9)
Increase asset impairment charges (93.8) (93.8)
Increase in equity loss (15.6) (16.1)
Increase in non-controlling interest (34.1) (33.0)
Decreased income tax expense 112.7 165.4
Increase (decrease) in net interest expense (2.0) 20.1
Tax recovery on discontinued operations (2005) (12.0) (12.0)
Other (1.6) (1.8)
Net Earnings, 2006 $ (146.0) $ 44.91 TransAlta adopted the standard for stripping costs incurred in the production phase of a mining operation on Jan. 1, 20062 $130 million for Centralia Gas less $36.2 million Ottawa impairment in 2005

Centralia decisions impact on 2006
1
2
to be received in 2007 and the balance in 2008
Event(values are approximate)
EBT(MM)
EPS Cash flow (MM)
Inventory write down $44.4 $0.14 $ -
Mine equipment and infrastructure write down 2
$72.1 $0.23 $ -
Asset retirement obligation $81.3 $0.26 $ -
Severance and other 1 $38.5 $0.13 $7
Total impact of mine closure
$236.3 $0.76 $7
Centralia Gas write down $130.0 $0.42 $ -
Total 2006 impact of Centralia decisions
$366.3 $1.18 $7
2007 cash impact includes est. $22 million in severance and other related costsMine equipment sales forecast to be in excess of book value of $100 MM; 70% of which is forecast

2006 comparable earnings3 mo.
Ended Dec. 31 2006
3 mo. Ended Dec. 31
2005
12 mo. Ended Dec.
31, 2006
$47.9 $ 233.8
(6.2)
55.3
Centralia Gas impairment, net of tax (84.4) - (84.4) -
Centralia Coal writedown, net of tax (153.6) - (153.6) -
Gain from discontinued operations, net of tax 12.0 - 12.0
-
49.9
200.8
$ 1.16
-
-
59.9
198.0
$0.24
12 mo. Ended Dec.
31, 2005
Earnings on a comparable basis $ 92.0 $161.3Turbine impairment, net of tax - -Change in tax related to prior periods - -
Tax settlement on deferred receivable 13.0Net (loss) earnings (146.0) 186.3
Weighted average common shares outstanding in the period
202.0 196.8
Earnings on a comparable basis per share $ 0.46 0.82
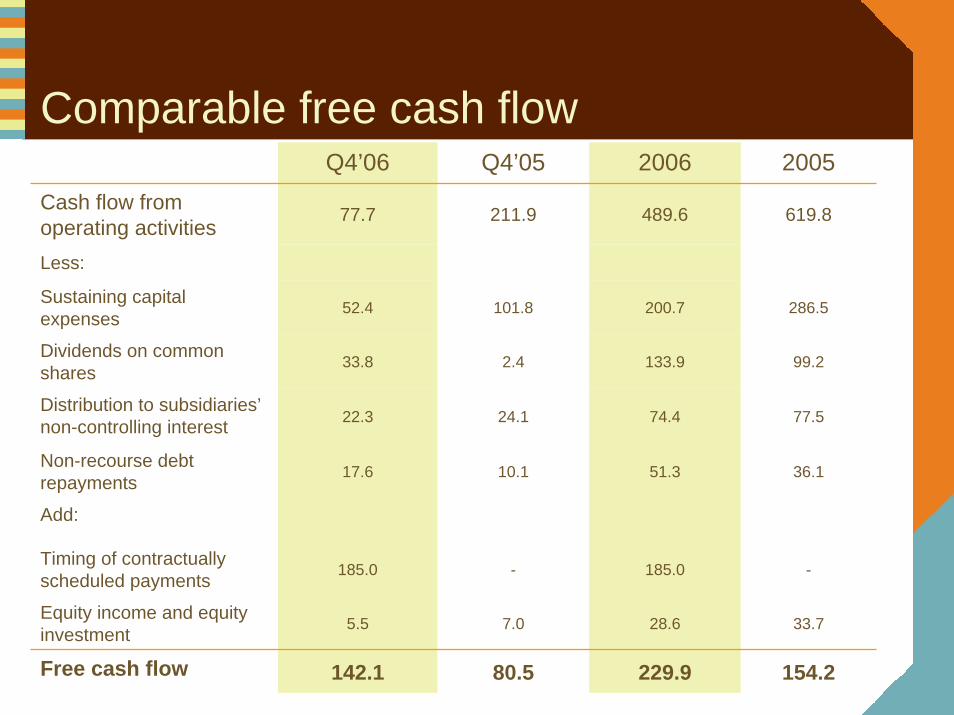
Comparable free cash flowQ4’06 Q4’05 2006 2005
Cash flow from operating activities 77.7 211.9 489.6 619.8
Less:
Sustaining capital expenses 52.4 101.8 200.7 286.5
Dividends on common shares 33.8 2.4 133.9 99.2
Distribution to subsidiaries’non-controlling interest 22.3 24.1 74.4 77.5
Non-recourse debt repayments 17.6 10.1 51.3 36.1
Add:
Timing of contractually scheduled payments 185.0 - 185.0 -
Equity income and equity investment 5.5 7.0 28.6 33.7
Free cash flow 142.1 80.5 229.9 154.2

Q4 & full-year comparison
Average Spot Electricity Prices
$84.40
$71.45
$54.30
$42.98
$70.01 $68.40
$80.58
$45.40 $46.41
$116.51 $116.99
$58.52
$0
$20
$40
$60
$80
$100
$120
$140
Alberta Pac NW Ontario
$ per MWh
Q4 2005 Q4 2006 YTD 2005 YTD 2006

2006 market conditions
Average Spot Electricity Prices
$49
$57$51
$24
$54
$45
$95
$55
$46
$117
$45 $43
$0
$20
$40
$60
$80
$100
$120
$140
Alberta Pac NW Ontario
$ per MWh
Q1 2006 Q2 2006 Q3 2006 Q4 2006
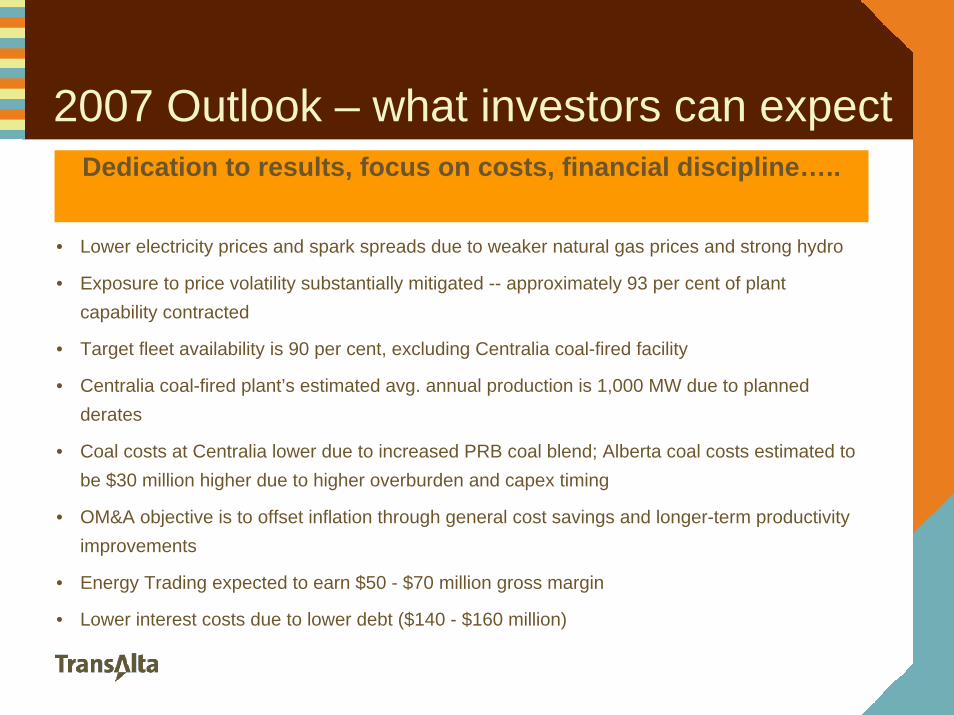
2007 Outlook – what investors can expect
• Lower electricity prices and spark spreads due to weaker natural gas prices and strong hydro
• Exposure to price volatility substantially mitigated -- approximately 93 per cent of plant capability contracted
• Target fleet availability is 90 per cent, excluding Centralia coal-fired facility
• Centralia coal-fired plant’s estimated avg. annual production is 1,000 MW due to planned derates
• Coal costs at Centralia lower due to increased PRB coal blend; Alberta coal costs estimated to be $30 million higher due to higher overburden and capex timing
• OM&A objective is to offset inflation through general cost savings and longer-term productivity improvements
• Energy Trading expected to earn $50 - $70 million gross margin
• Lower interest costs due to lower debt ($140 - $160 million)
Dedication to results, focus on costs, financial discipline…..

Contracts enhance cash flow stability
• Objective: >75% contracted greater than one year
• Current contracting levels:
~ 93% in 2007
~ 84% in 2008 - 2010
• Recontracting plans have specific regional and asset targets to achieve balance between cash flow stability and capture of near-term market opportunity
Contracting Levels
0%
20%
40%
60%
80%
100%
2006 2007 2008 2009 2010
Contracted Open Position/Spot Sales
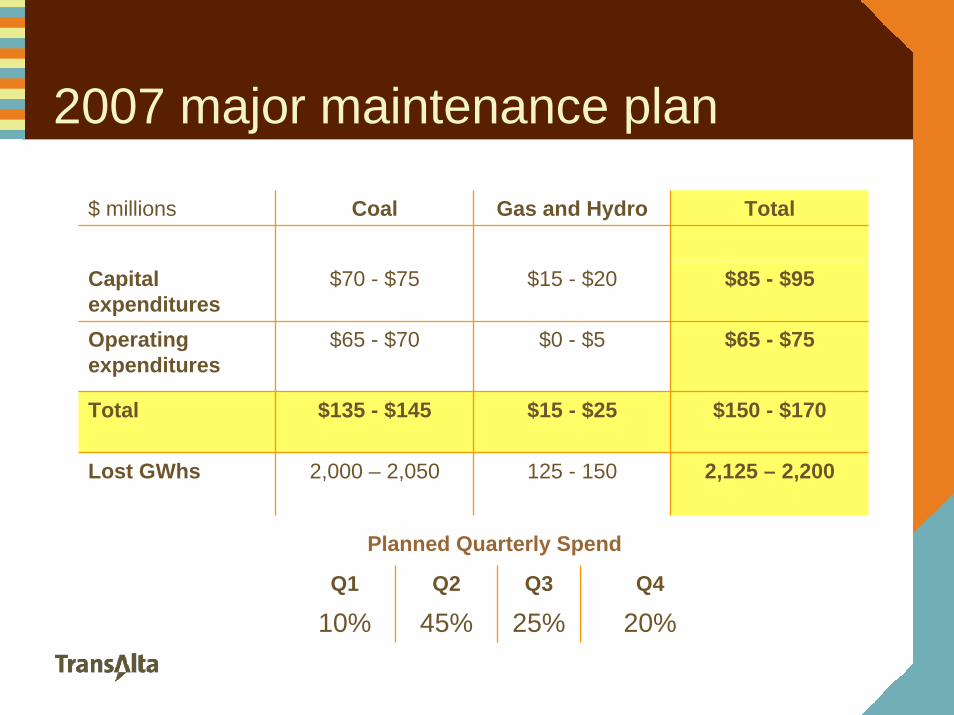
2007 major maintenance plan
$ millions Coal Gas and Hydro Total
Capital expenditures
$70 - $75 $15 - $20 $85 - $95
Operating expenditures
$65 - $70 $0 - $5 $65 - $75
Total $135 - $145 $15 - $25 $150 - $170
Lost GWhs 2,000 – 2,050 125 - 150 2,125 – 2,200
Planned Quarterly Spend
Q1 Q2 Q3 Q4
10% 45% 25% 20%

Pro-active emissions management • Policy engagement with government to
encourage rational regulations.• Capital planning for the use of technology to
meet emission requirements on existing fleet and future fleet design.
• Leverage of renewable energy investments to reduce our emissions intensity per MWh.
• Applying our energy trading skills to emissions trading in GHG and S02.
– Leader in carbon trading– Active in US and Ontario NOx/SO2
marketGHG EMISSION INTENSITY (kgs/MWh)
650
700
750
800
850
900
950
1000
2000
2001
2002
2003
2004
2005
2006
2007
2008
2009
2010
Net of offsets
SO2 & NOx EMISSION INTENSITY (kgs/MWh)
0.00
0.50
1.00
1.50
2.00
2.50
3.00
3.50
2000
2001
2002
2003
2004
2005
2006
2007
2008
2009
2010
SO2
NOx
MERCURY EMISSION INTENSITY (g/MWh)
0
4
8
12
16
20
2000
2001
2002
2003
2004
2005
2006
2007
2008
2009
2010
• SO2 <42%, primarily from Centralia scrubber• NOx <21% due to WAB retirement and G3
• Testing enhanced activated carbon injection, target to reduce 70% by 2010
• < 11% since ’90 by retiring WAB 1,2,3 & investment in gas and renewables


