Author: Andrew Cooper, Director | Reviewed: Ed Gabbitas, Director | Issue Status: 2.0 BUILDING SIMULATION REPORT FOR GUILDFORD BOROUGH COUNCIL A Mixed Use Scheme – Large Office Building 5 TH APRIL 2017
Transcript
Author: Andrew Cooper, Director | Reviewed: Ed Gabbitas, Director | Issue Status: 2.0
BUILDING SIMULATION REPORT FOR GUILDFORD BOROUGH COUNCIL
A Mixed Use Scheme – Large Office Building 5TH APRIL 2017
Page 1
Author: Andrew Cooper, Director | Reviewed: Ed Gabbitas, Director | Issue Status: 2.0
1.1. The Simulations ................................................................................................................................................................................................. 3 1.2. Building Information Model (BIM) ....................................................................................................................................................................... 4 1.3. Report Structure ................................................................................................................................................................................................ 5 1.4. Disclaimers ........................................................................................................................................................................................................ 6
2. Executive Summary ...................................................................................................................................................................................................... 8 2.1 System 1: Results .............................................................................................................................................................................................. 8 2.2 System 2: Results ............................................................................................................................................................................................ 10 2.3 A Comparison of System Performance ............................................................................................................................................................ 12
3. Simulation Results ...................................................................................................................................................................................................... 14 3.1 System 1: 4 Pipe Fan Coil Unit System with Mechanical Ventilation ................................................................................................................ 14 3.2 System 2: VRV/F System with Mechanical Ventilation ..................................................................................................................................... 20
5. System 1, Simulation 1 ............................................................................................................................................................................................... 29 6. System 1, Simulation 2 ............................................................................................................................................................................................... 30 7. System 1, Simulation 3 ............................................................................................................................................................................................... 31 8. System 1, Simulation 4 ............................................................................................................................................................................................... 32 9. System 2, Simulation 1 ............................................................................................................................................................................................... 33 10. System 2, Simulation 2 ............................................................................................................................................................................................... 34 11. System 2, Simulation 3 ............................................................................................................................................................................................... 35 12. System 2, Simulation 4 ............................................................................................................................................................................................... 36
Page 2
Author: Andrew Cooper, Director | Reviewed: Ed Gabbitas, Director | Issue Status: 2.0
1. INTRODUCTION
This building simulation report summarises the findings of eight simulations on two building energy models of a large office building. These models are
based on an actual building that has been adapted for the purpose of this study.
The simulations study the performance of two different but common building services solutions for mechanically ventilated office premises, which we
refer to throughout this report as System 1 and System 2. In both building models the building fabric, lighting and domestic hot water are the same.
However, the heating, ventilation and air conditioning (HVAC) strategy varies in each building. Low and Zero Carbon (LZC) technologies are
incorporated to augment or replace conventional non-LZC technologies.
The modelled simulations calculate a building’s Built Emission Rate (BER) as a result of the energy it is predicted to consume. Templates around
occupancy and occupational parameters, such as hours of operation and temperature set points, are provided in a National Calculation Method (NCM)
which was developed by the Building Research Establishment (BRE) for government. To comply with Part L2A Conservation of fuel and power in
buildings other than dwellings of Building Regulations (Part L2A), a Target Emission Rate (TER) is set and the BER must achieve or better (≤) this target.
The TER is based on the performance of the Notional Building which is also defined in the NCM.
In addition to building regulations, the TER is used in planning policy as a benchmark for sustainable development by setting out the maximum level of
predicted CO2 emissions that a building or development is permitted to emit. As part of an extant planning policy Guildford Borough Council (GBC)
requires the BER of a new building to be at least 10% lower than the TER, with any reduction achieved through the use of on-site LZC technologies.
Page 3
Author: Andrew Cooper, Director | Reviewed: Ed Gabbitas, Director | Issue Status: 2.0
GBC is currently in consultation to increase this target to either 15 or 20% and this document forms part of a series of reports to help determine if these
targets are technically feasible, and if so, what the potential effect of revising this policy would be in terms of development costs to property developers.
1.1. The Simulations
Part L2A has five criterion and a requirement for any developer to analyse and take into account the technical, environmental and economic feasibility of
using high-efficiency alternative systems in construction, if available1. For a building to pass the exacting requirements of Part L2A it must be designed
and constructed to a standard that meets or betters the TER of a Notional Building (BER ≤ TER.). A building that is constructed to the limiting parameters
of Part L2A will fail Criterion 1, which is the Criterion that requires the BER ≤ TER.
Each model simulated is identical in every respect other than its building services, which may or may not include renewable energy systems. To ensure
that the model is capable of passing Part L2A the building fabric is based upon the requirements of a Notional Building, and these remain unchanged
throughout the various iterations of the model(s). By ensuring that the building construction and fabric remains as a constant, we can calculate a ‘base
building’ construction cost. This in turn allows us to identify where additional expenditure is required to facilitate the CO2 reduction targets of four
benchmarks, detailed below.
System 1 starts with the least number of LZC technologies possible for a typical services solution, and as the targets become more challenging, then
more efficient conventional systems and/or LZC technologies are incorporated into the model(s) to augment or replace less efficient and/or non LZC
1 These systems are to include decentralised energy supply systems based on energy from renewable sources, cogeneration, district or block heating or cooling, particularly where it is based entirely or partially on energy from renewable sources, and heat pumps.
Page 4
Author: Andrew Cooper, Director | Reviewed: Ed Gabbitas, Director | Issue Status: 2.0
technologies. System 2 on the other hand starts with LZC technologies, for example, primary fossil fuel heating is typically replaced with heat pumps.
Simulations have been run against four benchmarks, these are:
1) The Building Emission Rate is equal to or lower than the Target Emission Rate (BER≤ TER). This is a requirement of Criterion 1 of Approved Document
Part L2A of Building Regulations 2010 (Part L)
2) The BER must be 10% lower than the TER. This is the Extant Policy
3) The BER must be 15% lower than the TER. This is a proposed borough policy which we refer to as Proposed Policy A
4) The BER must be 20% lower than the TER. This is a proposed borough policy which we refer to as Proposed Policy B
1.2. Building Information Model (BIM)
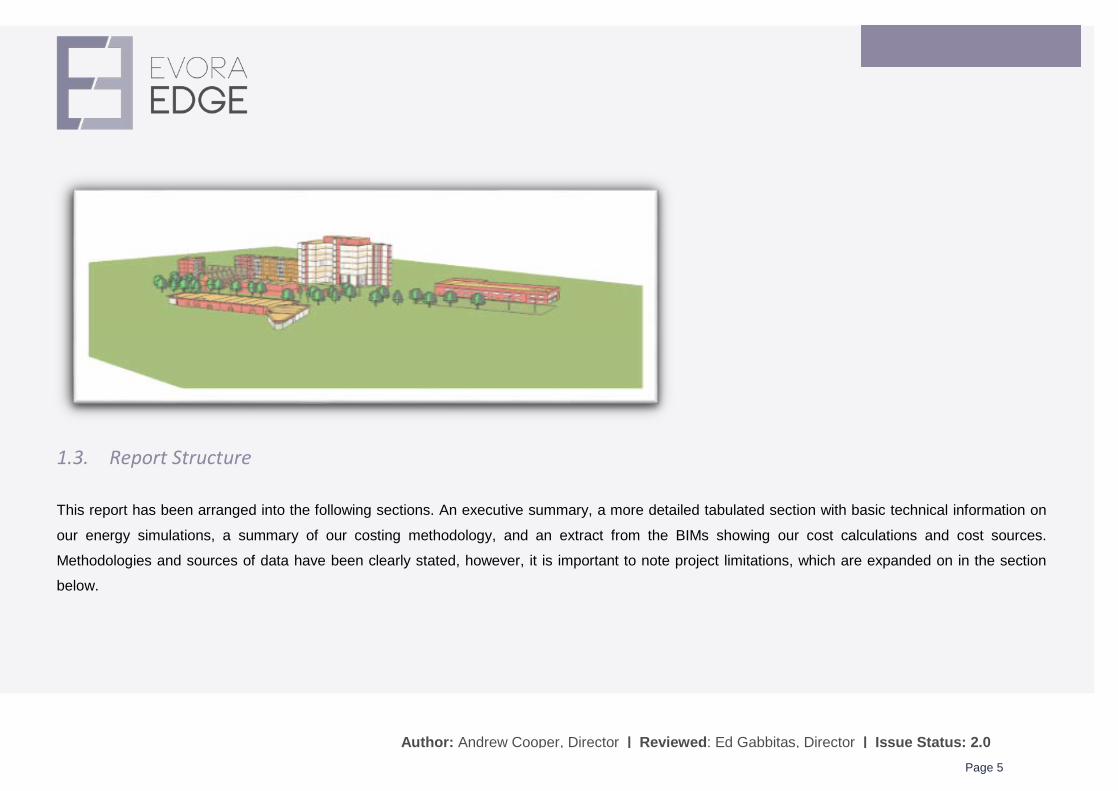
To prepare this report we have used a building information model or BIM using IES engineering software - the Virtual Environment or VE. PDF drawings
were provided to EVORA EDGE by GBC on a proposed development in Guildford for this study. These were converted into DWG files and scaled using
AutoDesk AutoCad, and then in turn converted to DXF drawings so that they could be imported into the VE. We then imported additional models of
commercial buildings from previous projects using gbXML and/or GEM files to create a ‘virtual mixed use scheme’. This allowed us to model various
types and numbers of buildings using a federated BIM which was shared between two principal energy modellers.
The BER and TER calculations and costs were all undertaken in the same model(s) and these are in turn available as IES Cabinet Files for future use.
Nomenclature of itemised costs are based on the RICS New Rules of Measurement Order of cost estimating and cost planning for capital building works.
A representation of the federated BIM is shown below.
Page 5
Author: Andrew Cooper, Director | Reviewed: Ed Gabbitas, Director | Issue Status: 2.0
1.3. Report Structure
This report has been arranged into the following sections. An executive summary, a more detailed tabulated section with basic technical information on
our energy simulations, a summary of our costing methodology, and an extract from the BIMs showing our cost calculations and cost sources.
Methodologies and sources of data have been clearly stated, however, it is important to note project limitations, which are expanded on in the section
below.
Page 6
Author: Andrew Cooper, Director | Reviewed: Ed Gabbitas, Director | Issue Status: 2.0
1.4. Disclaimers
With any building, existing or proposed, there are almost an infinite number of design parameters for architects and engineers to consider including:
• Structure
• Orientation and Massing
• HVAC and Lighting Types
• Combination of HVAC and Fuel Types
• LZC Technologies
Whilst we have considered many scenarios, it is not possible to cover all potential design parameters. The aim of this research is to identify if it is possible
to pass four benchmarks using the geometry and construction type of buildings which either already exist, or are proposed as part of a planning application;
while assuming common design parameters and HVAC systems which are based upon a Notional Building or best (typical) market practice.
To do this we have looked at a number of building and system types adopting a hierarchical approach to favour the most efficient system(s). Where values
or efficiencies are detailed in the Notional Building these are adopted. However where these values are not provided, or where they seem low when
assessed against technologies readily available in the market, then these were replaced by values or efficiencies detailed in either Part L2A, or the Energy
Technology List (ETL)2, or other reputable or market sources.
2 The ETL (or Energy Technology Product List, ETPL) is a government-managed list of energy-efficient plant and machinery, such as boilers, electric motors, and air conditioning and refrigeration systems that qualify for full tax relief.
Page 7
Author: Andrew Cooper, Director | Reviewed: Ed Gabbitas, Director | Issue Status: 2.0
Costs are indicative and for benchmarking purposes only. They exclude VAT and fees associated with design, professional services and project
management. They do however include for preliminaries, profit and overheads for the services contractor. Build costs have typically been taken at the
median of a range of costs detailed in SPONS 2017 unless indicated otherwise. Greater detail and information on our costing methodology has been
provided in Section 4. of this report.
Page 8
Author: Andrew Cooper, Director | Reviewed: Ed Gabbitas, Director | Issue Status: 2.0
2. EXECUTIVE SUMMARY
Our findings over the following pages are summarised in the form of two schematics, one for each type of HVAC system including; a four pipe fan coil unit
system and a variable refrigerant flow or volume system. Each schematic shows the effect of each iterative simulation on the BER in order to meet or
better a benchmark, the financial cost to the developer for each metre square (m2) of building space to achieve this. Finally the schematic shows, expressed
as a percentage increase, the cost of improving a building from Part L2A and the Extant Policy to a building that can comply with Proposed Policy B – the
most stringent of the proposed policies.
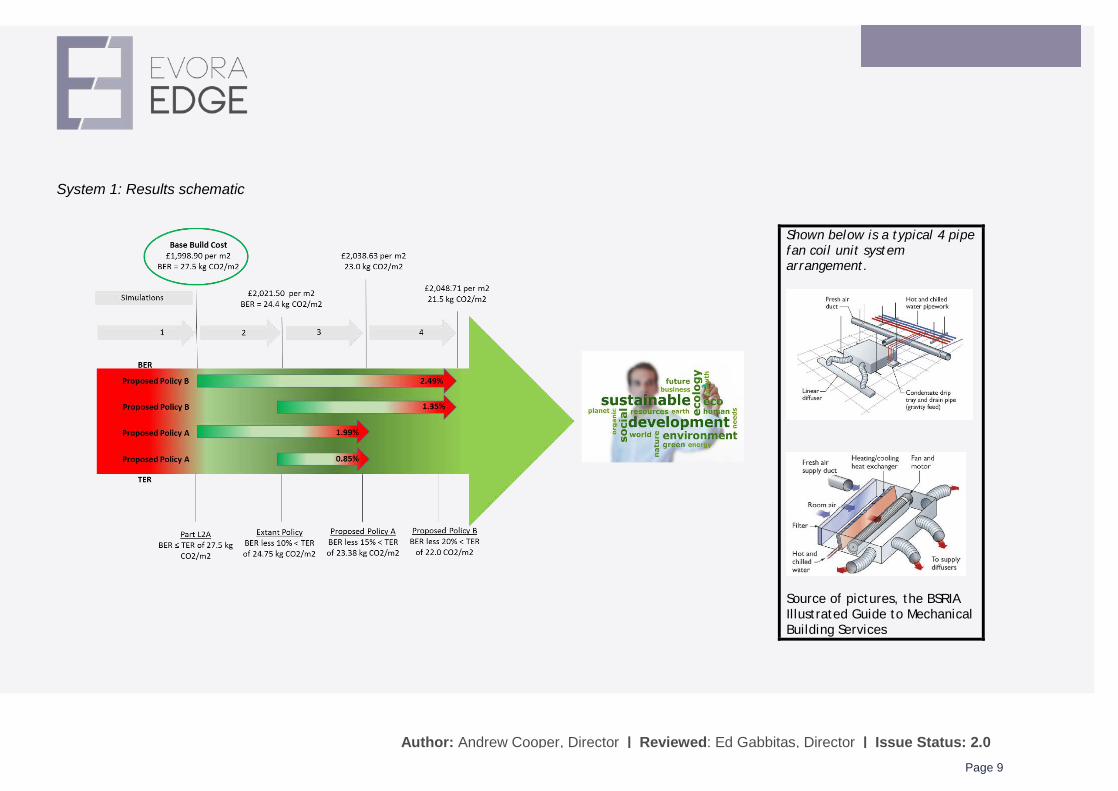
2.1 System 1: Results
System 1 is a four pipe fan coil unit (FCU) system with an ancillary low temperature hot water (LTHW) hydronic circuit to non–office space. A fan coil
draws air across hot and/or cold water pipework and heat exchangers – preheated or precooled fresh air is typically ducted to the rear of each FCU.
System 1 is capable of passing Part L2A and the Extant Policy but requires PV in both cases to do this. In order to pass Proposed Policies A and B a
locally sited combined heat and power (CHP) plant is required – this is in addition to the PV. The results of the case studies are as follows:
• The cost of Proposed Policy B is up to 2.49% more expensive than constructing a building that complies with Criterion 1 of Part L2A.
• The difference in cost between Extant Policy construction costs and Policy B construction costs is up to 1.35%.
• The cost of Proposed Policy A is up to 1.99% more expensive than constructing a building that complies with Criterion 1 of Part L2A.
• The difference in cost between Extant Policy construction costs and Policy A construction costs is up to 0.85%.
Page 9
Author: Andrew Cooper, Director | Reviewed: Ed Gabbitas, Director | Issue Status: 2.0
System 1: Results schematic
Shown below is a typical 4 pipe fan coil unit system arrangement.
Source of pictures, the BSRIA Illustrated Guide to Mechanical Building Services
Page 10
Author: Andrew Cooper, Director | Reviewed: Ed Gabbitas, Director | Issue Status: 2.0
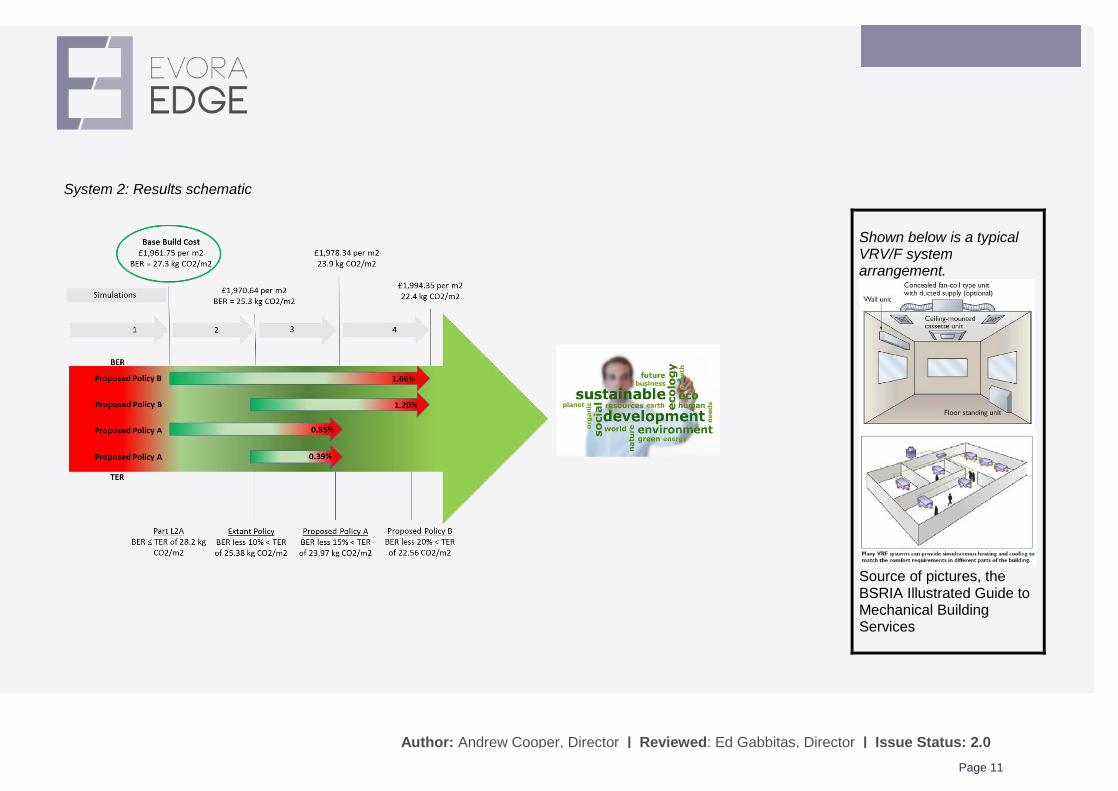
2.2 System 2: Results
System 2 incorporates a variable refrigerant flow (VRF) or volume (VRV) system with mechanical ventilation and an ancillary low temperature hot water
(LTHW) hydronic circuit to non–office space. Based on Annex 2 of GBC’s Sustainable Design and Construction Supplementary Planning Document, air
source heat pumps (ASHP) are classified as an LZC technology. VRF/V is an ASHP technology, typically with additional heat recovery, and under the
right conditions can be extremely efficient. Unlike other sources of heating, energy is not converted to heat or cooling, but is instead consumed by plant
moving heat from point A to point B. System 2 is capable of passing Part L2A without any additional LZC technology such as PV, but this is required in
increasing capacity in order to pass the Extant Policy, Policy A and Policy B. The results of the case studies are as follows:
• The cost of Proposed Policy B is up to 1.66% more expensive than constructing a building that complies with Criterion 1 of Part L2A.
• The difference in cost between Extant Policy construction costs and Policy B construction costs is up to 1.20%.
• The cost of Proposed Policy A is up to 0.85% more expensive than constructing a building that complies with Criterion 1 of Part L2A.
• The difference in cost between Extant Policy construction costs and Policy A construction costs is up to 0.39%.
Page 11
Author: Andrew Cooper, Director | Reviewed: Ed Gabbitas, Director | Issue Status: 2.0
System 2: Results schematic
Shown below is a typical VRV/F system arrangement.
Source of pictures, the BSRIA Illustrated Guide to Mechanical Building Services
Page 12
Author: Andrew Cooper, Director | Reviewed: Ed Gabbitas, Director | Issue Status: 2.0
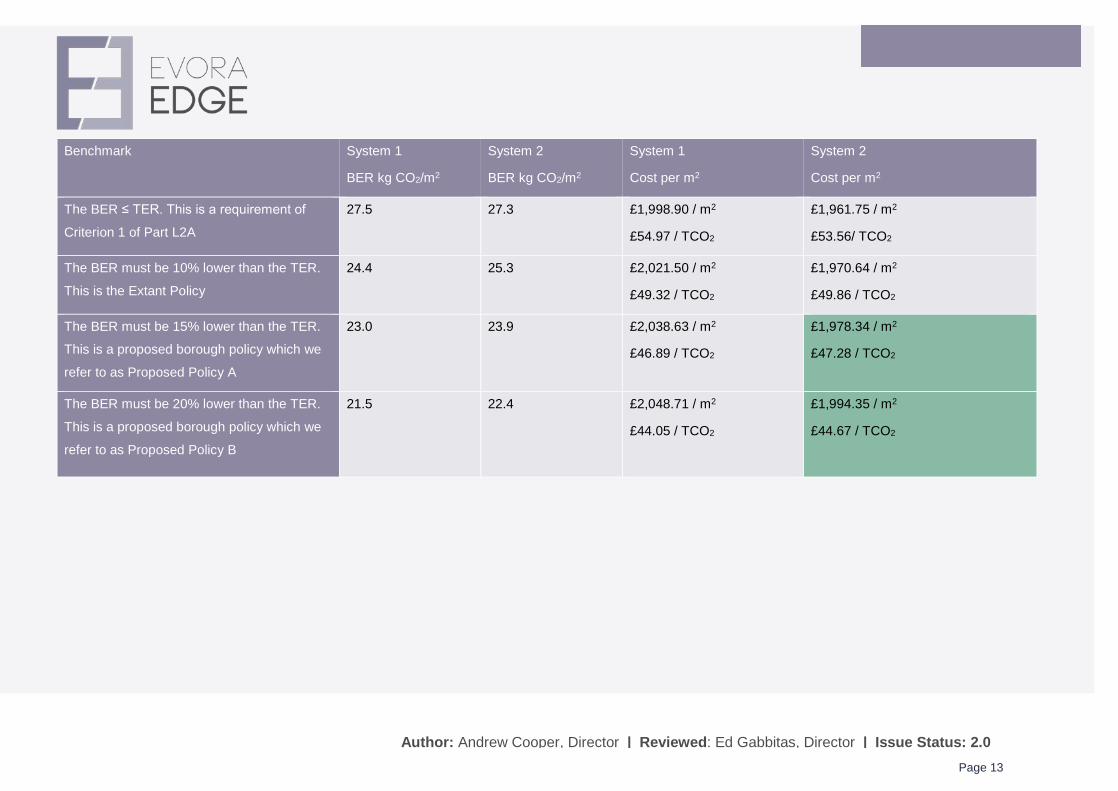
2.3 A Comparison of System Performance
The table below compares the results of our simulations so that we can better understand cost-effectiveness alongside the impact on predicted CO2
emissions. CO2 emission are linked to energy consumption (kWh) and therefore, potentially, operational costs. System performance can be judged in two
ways. The first, and in all probability, the most relevant to developers is establishing the most cost-effective way to reach Proposed Policy A or B. This is highlighted in green. In this case System 2, below, is the most cost-effective. Boxes that have been blacked out indicate that the previous simulation was
capable of passing the target benchmark, and as a result it is not necessary to run additional simulations. For example, the simulation run to pass
benchmark 1 for System 2 also passes benchmark 2, so this has been blacked out.
The second metric assesses the cost (£) of reducing CO2 emissions. 0 = Zero operational carbon, the further away from zero the higher the cost (£) per
Tonne (T) of CO2 saved3. In this case, as an example, although System 2 is the most cost-effective system, for each £ invested per m2 a greater amount
of CO2 savings are typically achieved for System 1 (with the exception of Simulation 1). As a result, it is likely that the operational running costs of System
1 will be the lowest of the two systems.
3 Calculated as: BER * system cost / 1,000 (= Tonnes of CO2)
Page 13
Author: Andrew Cooper, Director | Reviewed: Ed Gabbitas, Director | Issue Status: 2.0
Benchmark System 1
BER kg CO2/m2
System 2
BER kg CO2/m2
System 1
Cost per m2
System 2
Cost per m2
The BER ≤ TER. This is a requirement of
Criterion 1 of Part L2A
27.5 27.3 £1,998.90 / m2
£54.97 / TCO2
£1,961.75 / m2
£53.56/ TCO2
The BER must be 10% lower than the TER.
This is the Extant Policy
24.4 25.3 £2,021.50 / m2
£49.32 / TCO2
£1,970.64 / m2
£49.86 / TCO2
The BER must be 15% lower than the TER.
This is a proposed borough policy which we
refer to as Proposed Policy A
23.0 23.9 £2,038.63 / m2
£46.89 / TCO2
£1,978.34 / m2
£47.28 / TCO2
The BER must be 20% lower than the TER.
This is a proposed borough policy which we
refer to as Proposed Policy B
21.5 22.4 £2,048.71 / m2
£44.05 / TCO2
£1,994.35 / m2
£44.67 / TCO2
Page 14
Author: Andrew Cooper, Director | Reviewed: Ed Gabbitas, Director | Issue Status: 2.0
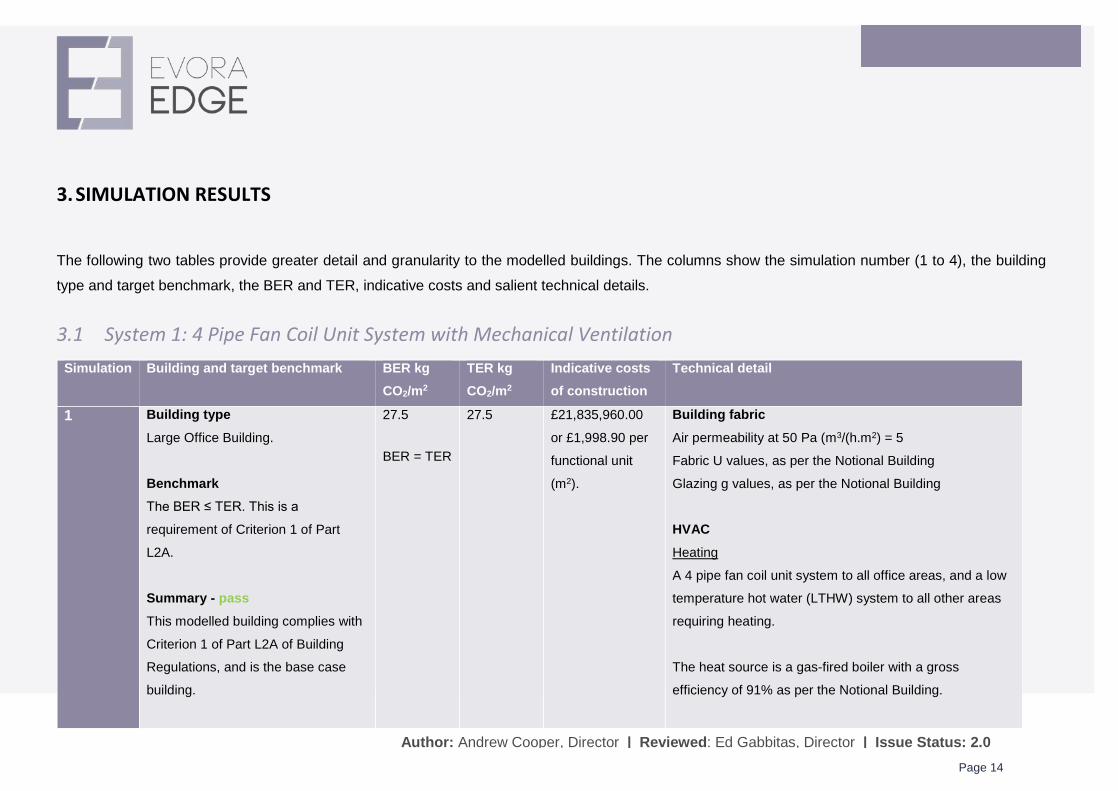
3. SIMULATION RESULTS
The following two tables provide greater detail and granularity to the modelled buildings. The columns show the simulation number (1 to 4), the building
type and target benchmark, the BER and TER, indicative costs and salient technical details.
3.1 System 1: 4 Pipe Fan Coil Unit System with Mechanical Ventilation Simulation Building and target benchmark BER kg
CO2/m2 TER kg CO2/m2
Indicative costs of construction
Technical detail
1 Building type Large Office Building.
Benchmark The BER ≤ TER. This is a
requirement of Criterion 1 of Part
L2A.
Summary - pass
This modelled building complies with
Criterion 1 of Part L2A of Building
Regulations, and is the base case
building.
27.5
BER = TER
27.5 £21,835,960.00
or £1,998.90 per
functional unit
(m2).
Building fabric Air permeability at 50 Pa (m3/(h.m2) = 5
Fabric U values, as per the Notional Building
Glazing g values, as per the Notional Building
HVAC Heating
A 4 pipe fan coil unit system to all office areas, and a low
temperature hot water (LTHW) system to all other areas
requiring heating.
The heat source is a gas-fired boiler with a gross
efficiency of 91% as per the Notional Building.
Page 15
Author: Andrew Cooper, Director | Reviewed: Ed Gabbitas, Director | Issue Status: 2.0
Simulation Building and target benchmark BER kg CO2/m2
TER kg CO2/m2
Indicative costs of construction
Technical detail
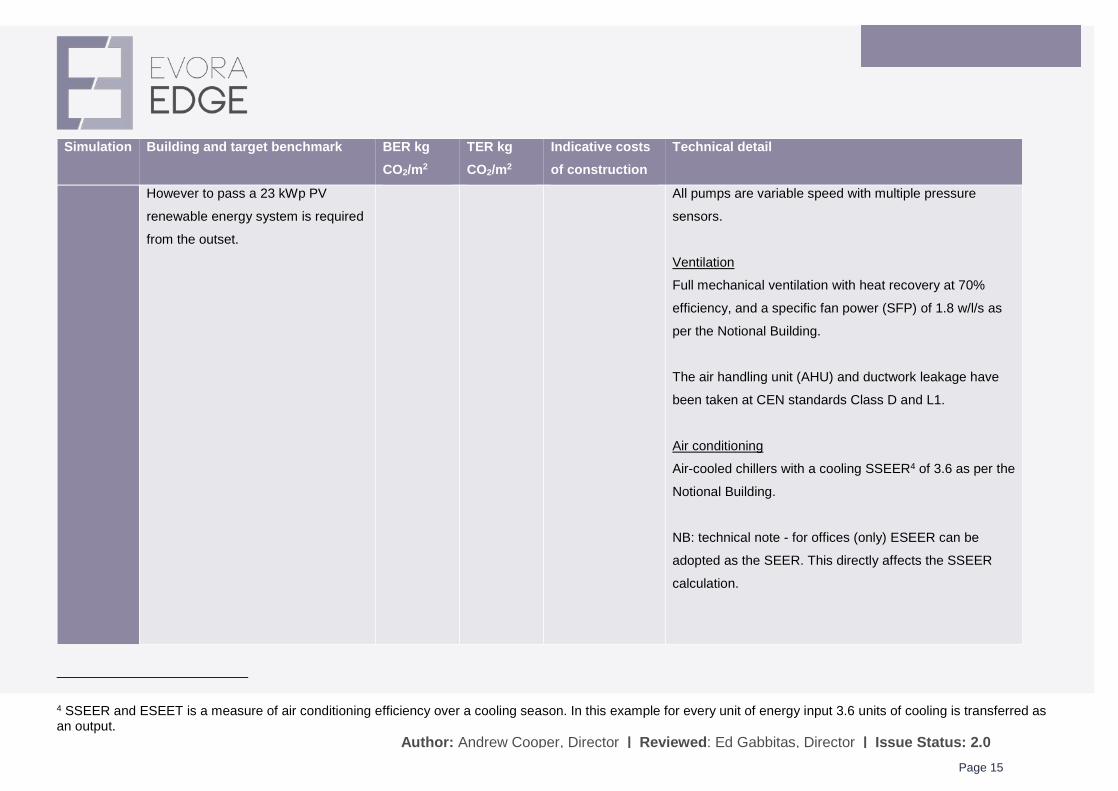
However to pass a 23 kWp PV
renewable energy system is required
from the outset.
All pumps are variable speed with multiple pressure
sensors.
Ventilation
Full mechanical ventilation with heat recovery at 70%
efficiency, and a specific fan power (SFP) of 1.8 w/l/s as
per the Notional Building.
The air handling unit (AHU) and ductwork leakage have
been taken at CEN standards Class D and L1.
Air conditioning
Air-cooled chillers with a cooling SSEER4 of 3.6 as per the
Notional Building.
NB: technical note - for offices (only) ESEER can be
adopted as the SEER. This directly affects the SSEER
calculation.
4 SSEER and ESEET is a measure of air conditioning efficiency over a cooling season. In this example for every unit of energy input 3.6 units of cooling is transferred as an output.
Page 16
Author: Andrew Cooper, Director | Reviewed: Ed Gabbitas, Director | Issue Status: 2.0
Simulation Building and target benchmark BER kg CO2/m2
TER kg CO2/m2
Indicative costs of construction
Technical detail
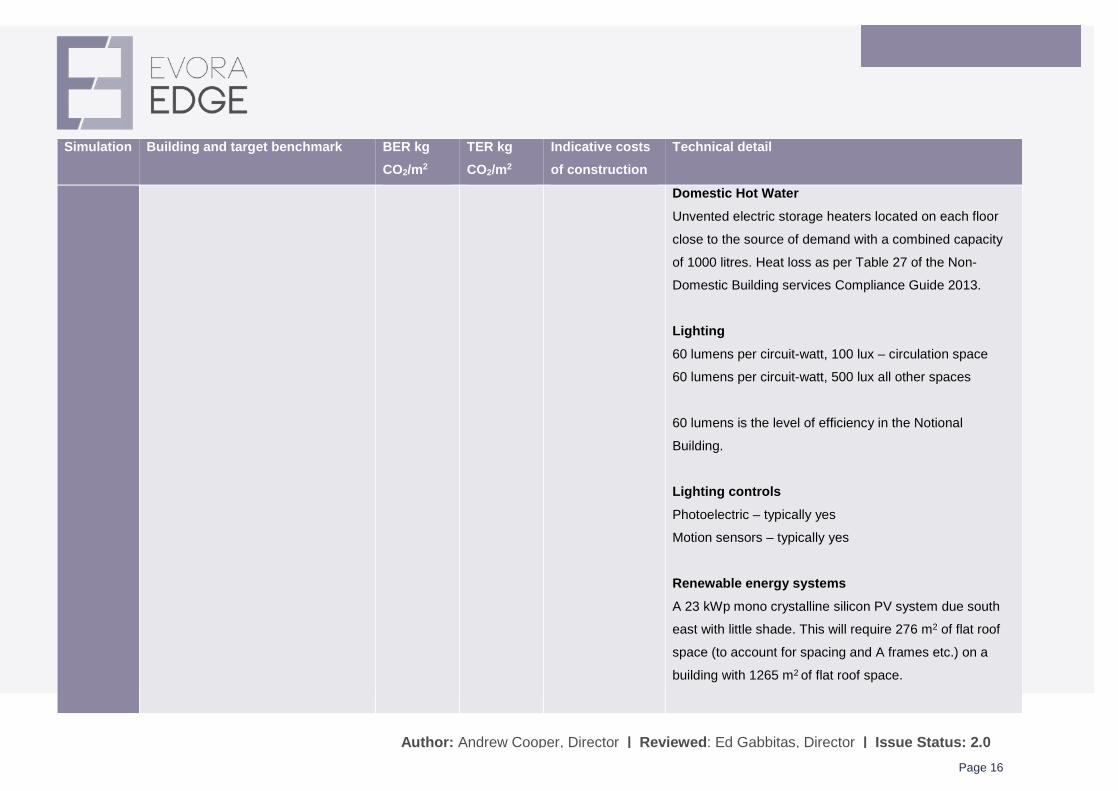
Domestic Hot Water Unvented electric storage heaters located on each floor
close to the source of demand with a combined capacity
of 1000 litres. Heat loss as per Table 27 of the Non-
Domestic Building services Compliance Guide 2013.
Lighting 60 lumens per circuit-watt, 100 lux – circulation space
60 lumens per circuit-watt, 500 lux all other spaces
60 lumens is the level of efficiency in the Notional
Building.
Lighting controls Photoelectric – typically yes
Motion sensors – typically yes
Renewable energy systems A 23 kWp mono crystalline silicon PV system due south
east with little shade. This will require 276 m2 of flat roof
space (to account for spacing and A frames etc.) on a
building with 1265 m2 of flat roof space.
Page 17
Author: Andrew Cooper, Director | Reviewed: Ed Gabbitas, Director | Issue Status: 2.0
Simulation Building and target benchmark BER kg CO2/m2
TER kg CO2/m2
Indicative costs of construction
Technical detail
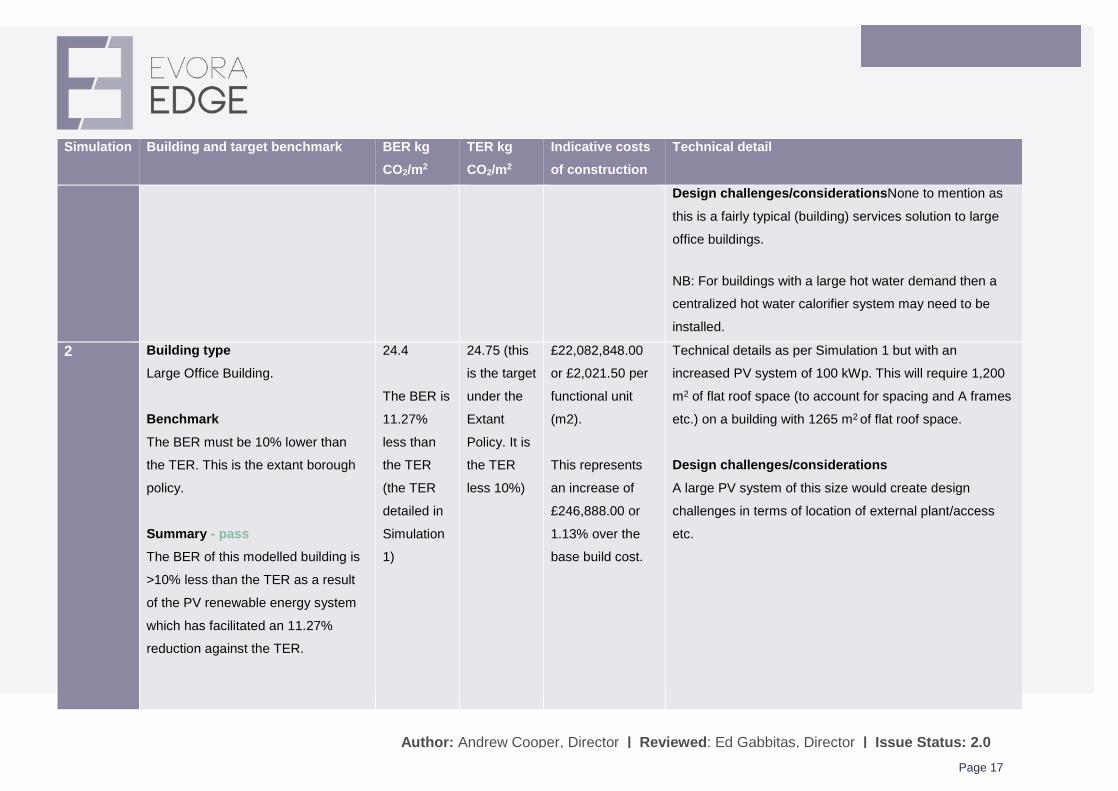
Design challenges/considerationsNone to mention as
this is a fairly typical (building) services solution to large
office buildings.
NB: For buildings with a large hot water demand then a
centralized hot water calorifier system may need to be
installed.
2 Building type Large Office Building.
Benchmark The BER must be 10% lower than
the TER. This is the extant borough
policy.
Summary - pass The BER of this modelled building is
>10% less than the TER as a result
of the PV renewable energy system
which has facilitated an 11.27%
reduction against the TER.
24.4
The BER is
11.27%
less than
the TER
(the TER
detailed in
Simulation
1)
24.75 (this
is the target
under the
Extant
Policy. It is
the TER
less 10%)
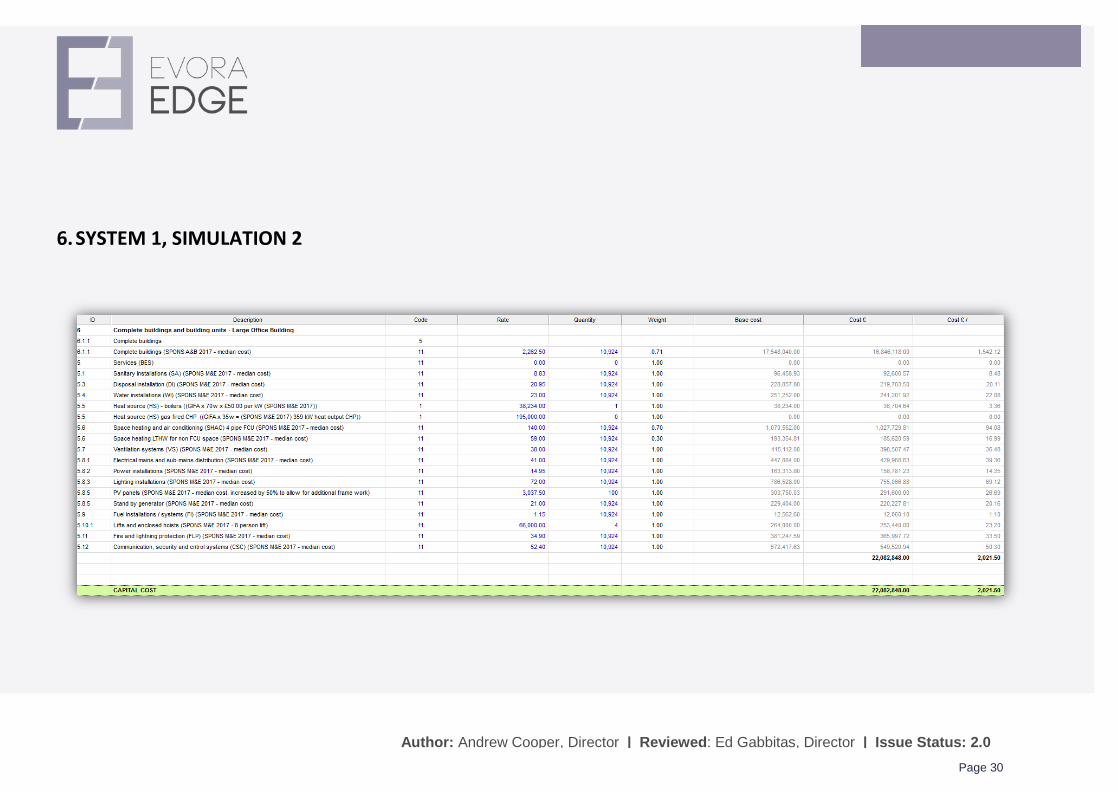
£22,082,848.00
or £2,021.50 per
functional unit
(m2).
This represents
an increase of
£246,888.00 or
1.13% over the
base build cost.
Technical details as per Simulation 1 but with an
increased PV system of 100 kWp. This will require 1,200
m2 of flat roof space (to account for spacing and A frames
etc.) on a building with 1265 m2 of flat roof space.
Design challenges/considerations A large PV system of this size would create design
challenges in terms of location of external plant/access
etc.
Page 18
Author: Andrew Cooper, Director | Reviewed: Ed Gabbitas, Director | Issue Status: 2.0
Simulation Building and target benchmark BER kg CO2/m2
TER kg CO2/m2
Indicative costs of construction
Technical detail
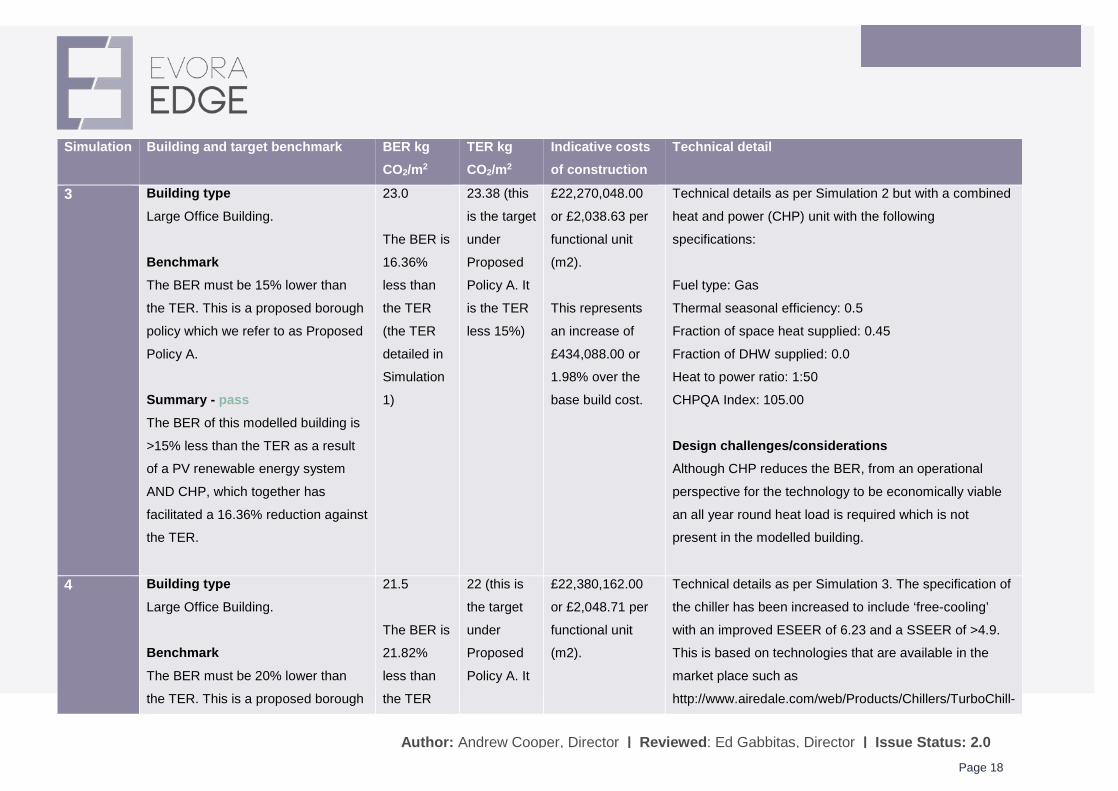
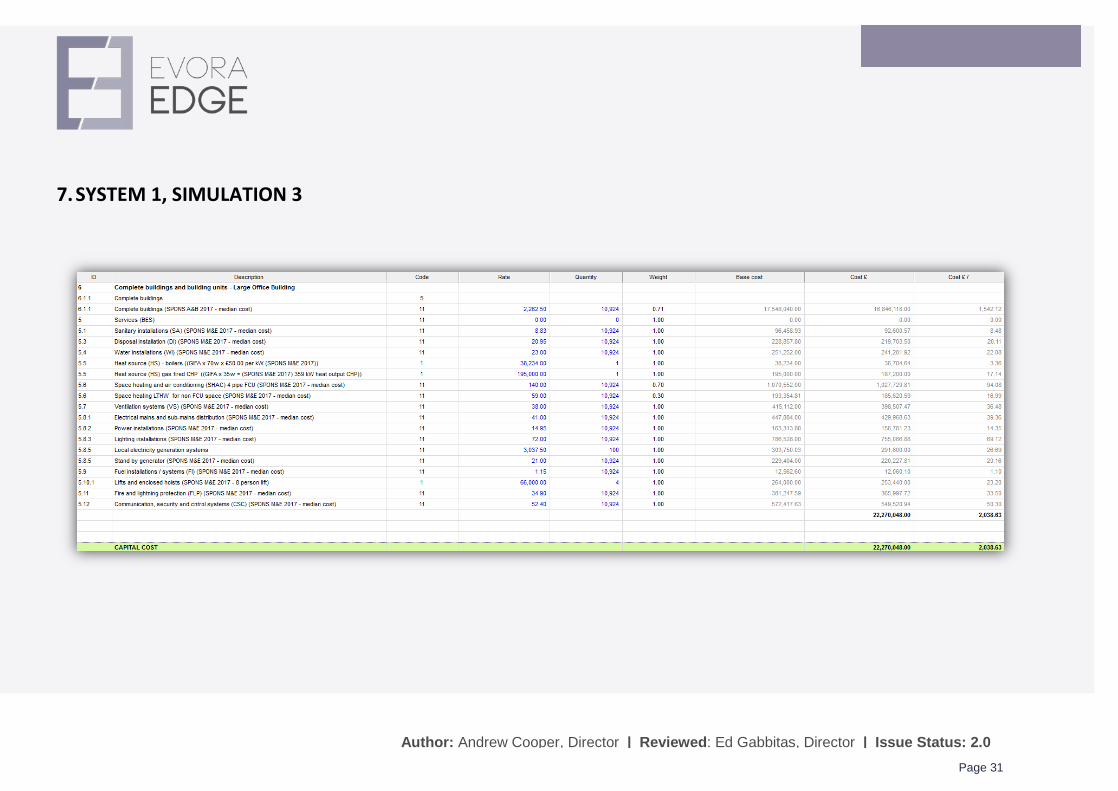
3 Building type Large Office Building.
Benchmark The BER must be 15% lower than
the TER. This is a proposed borough
policy which we refer to as Proposed
Policy A.
Summary - pass The BER of this modelled building is
>15% less than the TER as a result
of a PV renewable energy system
AND CHP, which together has
facilitated a 16.36% reduction against
the TER.
23.0
The BER is
16.36%
less than
the TER
(the TER
detailed in
Simulation
1)
23.38 (this
is the target
under
Proposed
Policy A. It
is the TER
less 15%)
£22,270,048.00
or £2,038.63 per
functional unit
(m2).
This represents
an increase of
£434,088.00 or
1.98% over the
base build cost.
Technical details as per Simulation 2 but with a combined
heat and power (CHP) unit with the following
specifications:
Fuel type: Gas
Thermal seasonal efficiency: 0.5
Fraction of space heat supplied: 0.45
Fraction of DHW supplied: 0.0
Heat to power ratio: 1:50
CHPQA Index: 105.00
Design challenges/considerations Although CHP reduces the BER, from an operational
perspective for the technology to be economically viable
an all year round heat load is required which is not
present in the modelled building.
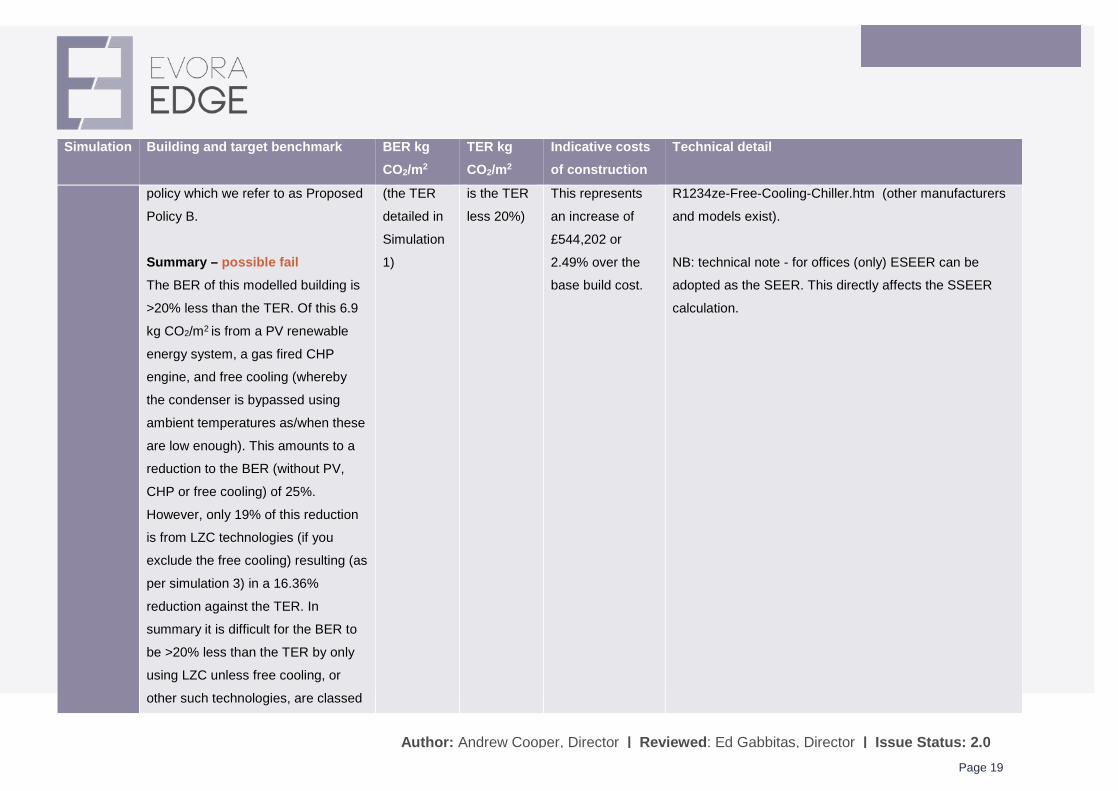
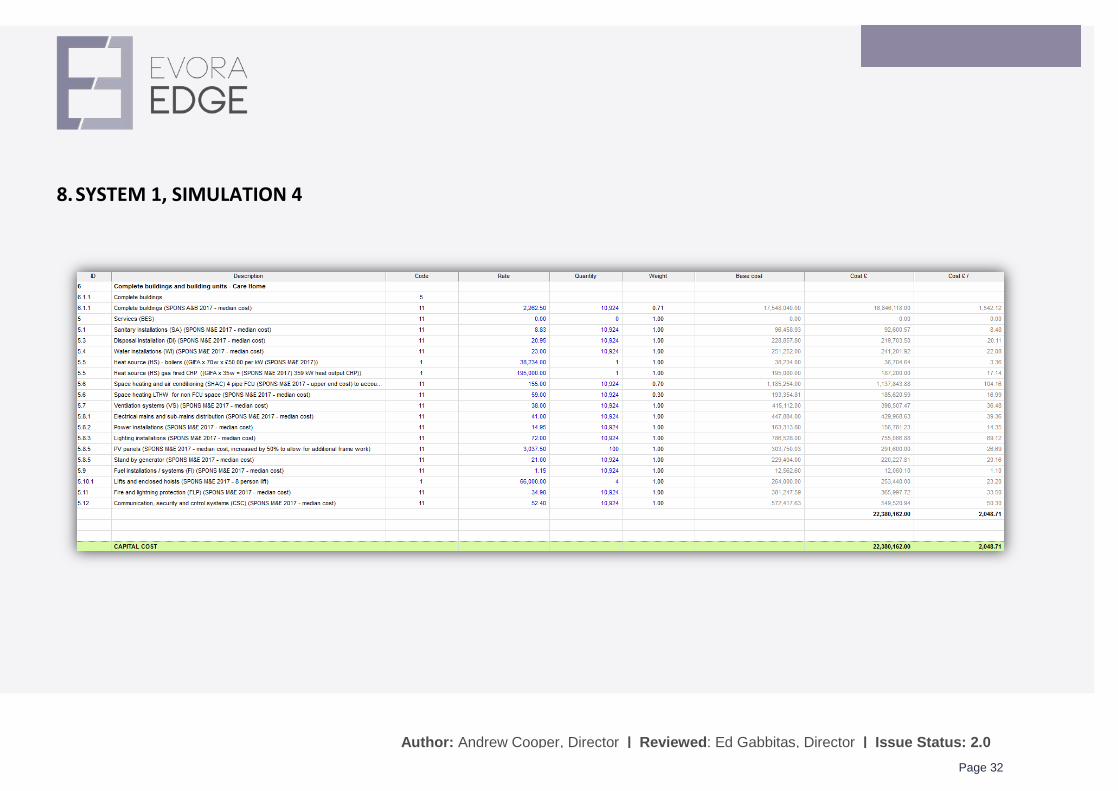
4 Building type Large Office Building.
Benchmark The BER must be 20% lower than
the TER. This is a proposed borough
21.5
The BER is
21.82%
less than
the TER
22 (this is
the target
under
Proposed
Policy A. It
£22,380,162.00
or £2,048.71 per
functional unit
(m2).
Technical details as per Simulation 3. The specification of
the chiller has been increased to include ‘free-cooling’
with an improved ESEER of 6.23 and a SSEER of >4.9.
This is based on technologies that are available in the
Author: Andrew Cooper, Director | Reviewed: Ed Gabbitas, Director | Issue Status: 2.0
Simulation Building and target benchmark BER kg CO2/m2
TER kg CO2/m2
Indicative costs of construction
Technical detail
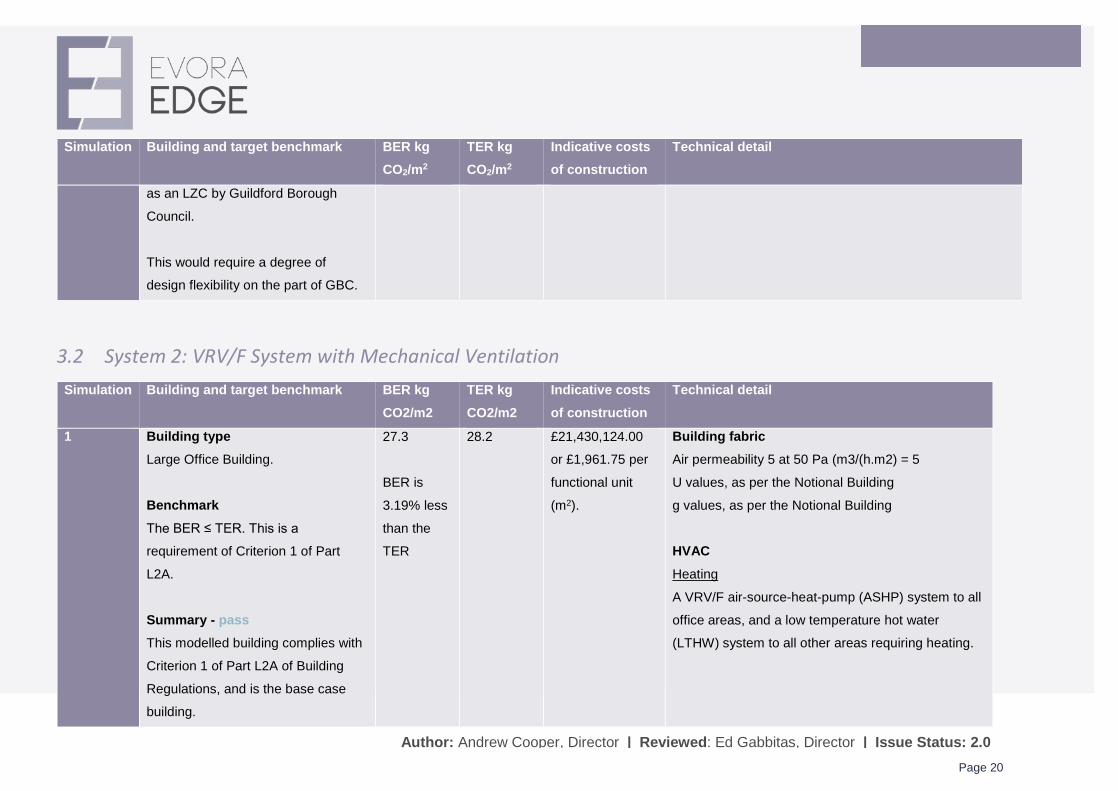
as an LZC by Guildford Borough
Council.
This would require a degree of
design flexibility on the part of GBC.
3.2 System 2: VRV/F System with Mechanical Ventilation Simulation Building and target benchmark BER kg
CO2/m2 TER kg CO2/m2
Indicative costs of construction
Technical detail
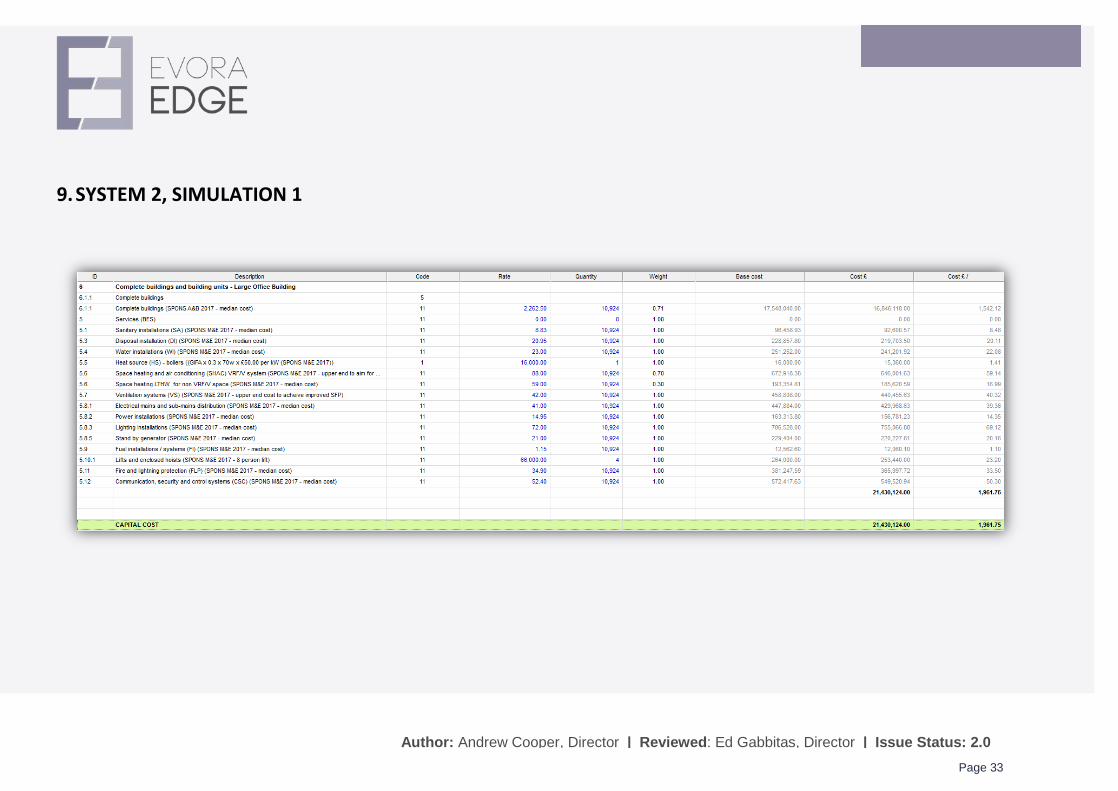
1 Building type Large Office Building.
Benchmark The BER ≤ TER. This is a
requirement of Criterion 1 of Part
L2A.
Summary - pass This modelled building complies with
Criterion 1 of Part L2A of Building
Regulations, and is the base case
building.
27.3
BER is
3.19% less
than the
TER
28.2 £21,430,124.00
or £1,961.75 per
functional unit
(m2).
Building fabric Air permeability 5 at 50 Pa (m3/(h.m2) = 5
U values, as per the Notional Building
g values, as per the Notional Building
HVAC Heating
A VRV/F air-source-heat-pump (ASHP) system to all
office areas, and a low temperature hot water
(LTHW) system to all other areas requiring heating.
Page 21
Author: Andrew Cooper, Director | Reviewed: Ed Gabbitas, Director | Issue Status: 2.0
Simulation Building and target benchmark BER kg CO2/m2
TER kg CO2/m2
Indicative costs of construction
Technical detail
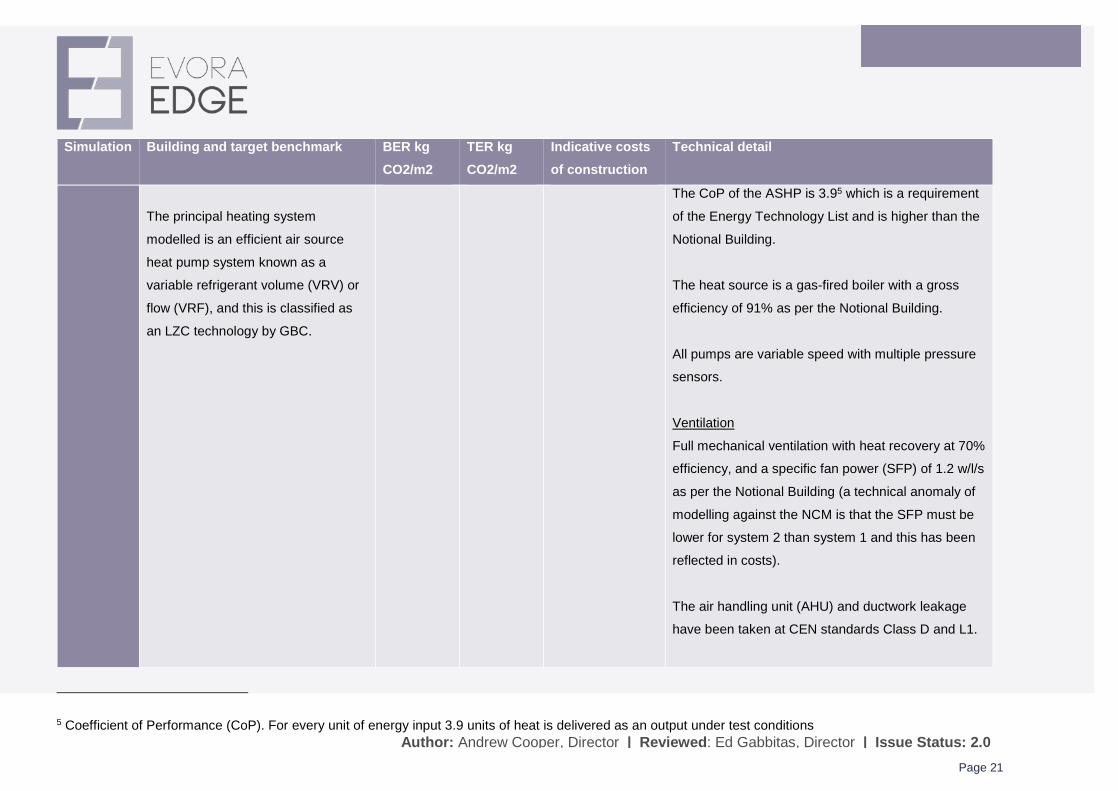
The principal heating system
modelled is an efficient air source
heat pump system known as a
variable refrigerant volume (VRV) or
flow (VRF), and this is classified as
an LZC technology by GBC.
The CoP of the ASHP is 3.95 which is a requirement
of the Energy Technology List and is higher than the
Notional Building.
The heat source is a gas-fired boiler with a gross
efficiency of 91% as per the Notional Building.
All pumps are variable speed with multiple pressure
sensors.
Ventilation
Full mechanical ventilation with heat recovery at 70%
efficiency, and a specific fan power (SFP) of 1.2 w/l/s
as per the Notional Building (a technical anomaly of
modelling against the NCM is that the SFP must be
lower for system 2 than system 1 and this has been
reflected in costs).
The air handling unit (AHU) and ductwork leakage
have been taken at CEN standards Class D and L1.
5 Coefficient of Performance (CoP). For every unit of energy input 3.9 units of heat is delivered as an output under test conditions
Page 22
Author: Andrew Cooper, Director | Reviewed: Ed Gabbitas, Director | Issue Status: 2.0
Simulation Building and target benchmark BER kg CO2/m2
TER kg CO2/m2
Indicative costs of construction
Technical detail
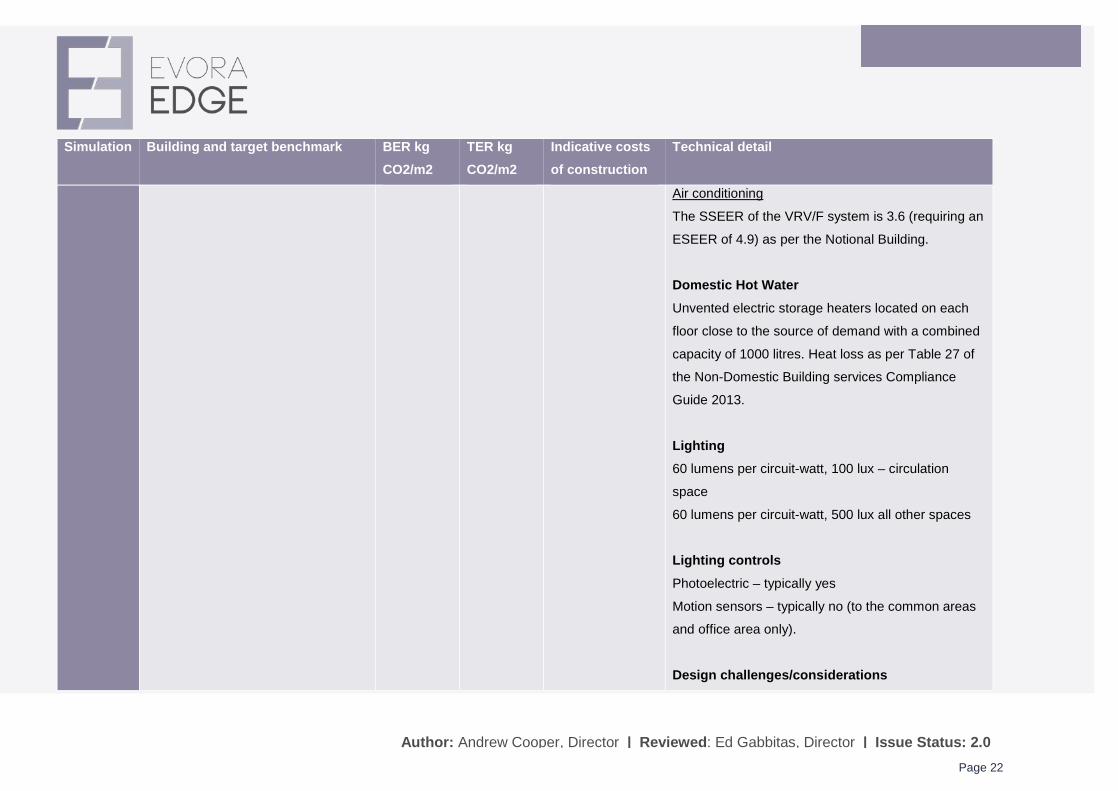
Air conditioning
The SSEER of the VRV/F system is 3.6 (requiring an
ESEER of 4.9) as per the Notional Building.
Domestic Hot Water Unvented electric storage heaters located on each
floor close to the source of demand with a combined
capacity of 1000 litres. Heat loss as per Table 27 of
the Non-Domestic Building services Compliance
Guide 2013.
Lighting 60 lumens per circuit-watt, 100 lux – circulation
space
60 lumens per circuit-watt, 500 lux all other spaces
Lighting controls Photoelectric – typically yes
Motion sensors – typically no (to the common areas
and office area only).
Design challenges/considerations
Page 23
Author: Andrew Cooper, Director | Reviewed: Ed Gabbitas, Director | Issue Status: 2.0
Simulation Building and target benchmark BER kg CO2/m2
TER kg CO2/m2
Indicative costs of construction
Technical detail
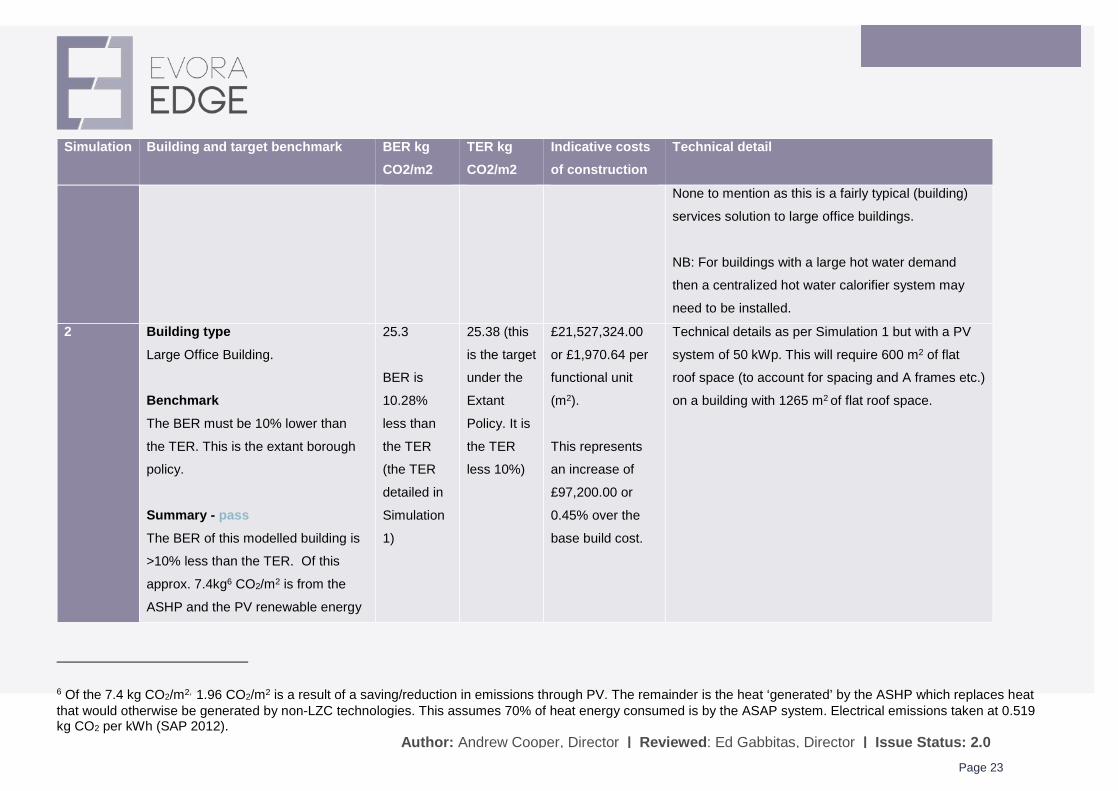
None to mention as this is a fairly typical (building)
services solution to large office buildings.
NB: For buildings with a large hot water demand
then a centralized hot water calorifier system may
need to be installed.
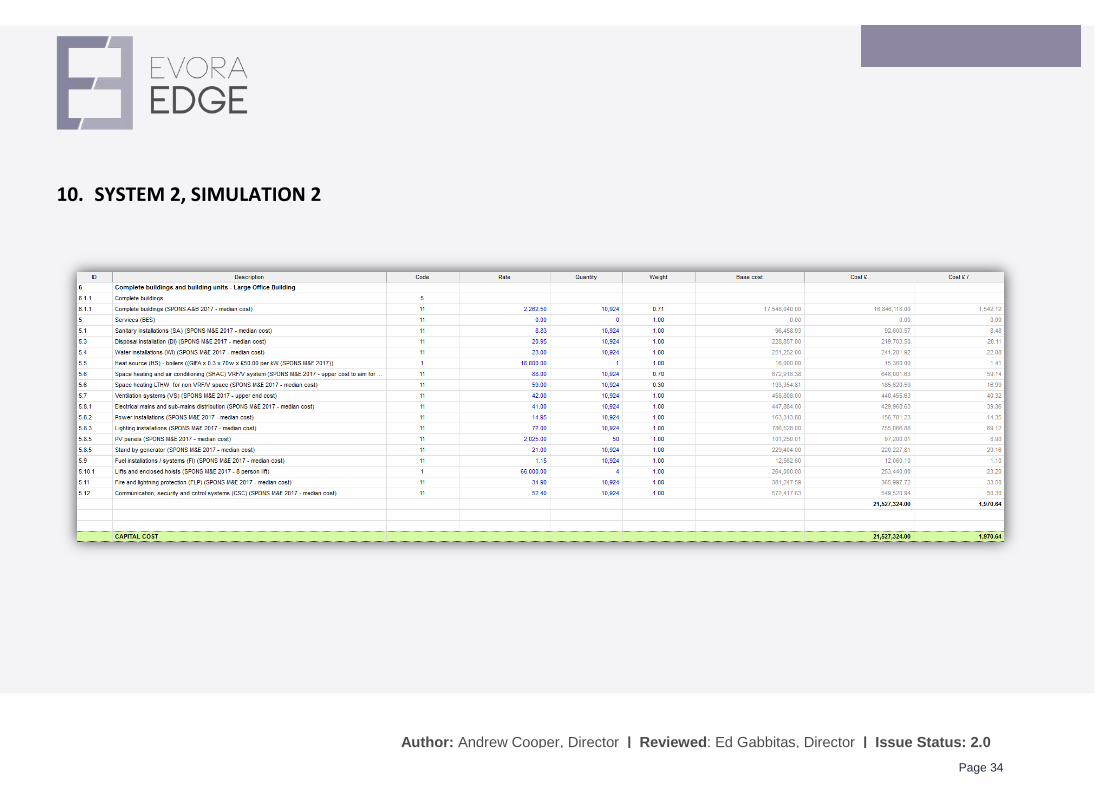
2 Building type Large Office Building.
Benchmark The BER must be 10% lower than
the TER. This is the extant borough
policy.
Summary - pass The BER of this modelled building is
>10% less than the TER. Of this
approx. 7.4kg6 CO2/m2 is from the
ASHP and the PV renewable energy
25.3
BER is
10.28%
less than
the TER
(the TER
detailed in
Simulation
1)
25.38 (this
is the target
under the
Extant
Policy. It is
the TER
less 10%)
£21,527,324.00
or £1,970.64 per
functional unit
(m2).
This represents
an increase of
£97,200.00 or
0.45% over the
base build cost.
Technical details as per Simulation 1 but with a PV
system of 50 kWp. This will require 600 m2 of flat
roof space (to account for spacing and A frames etc.)
on a building with 1265 m2 of flat roof space.
6 Of the 7.4 kg CO2/m2, 1.96 CO2/m2 is a result of a saving/reduction in emissions through PV. The remainder is the heat ‘generated’ by the ASHP which replaces heat that would otherwise be generated by non-LZC technologies. This assumes 70% of heat energy consumed is by the ASAP system. Electrical emissions taken at 0.519 kg CO2 per kWh (SAP 2012).
Page 24
Author: Andrew Cooper, Director | Reviewed: Ed Gabbitas, Director | Issue Status: 2.0
Simulation Building and target benchmark BER kg CO2/m2
TER kg CO2/m2
Indicative costs of construction
Technical detail
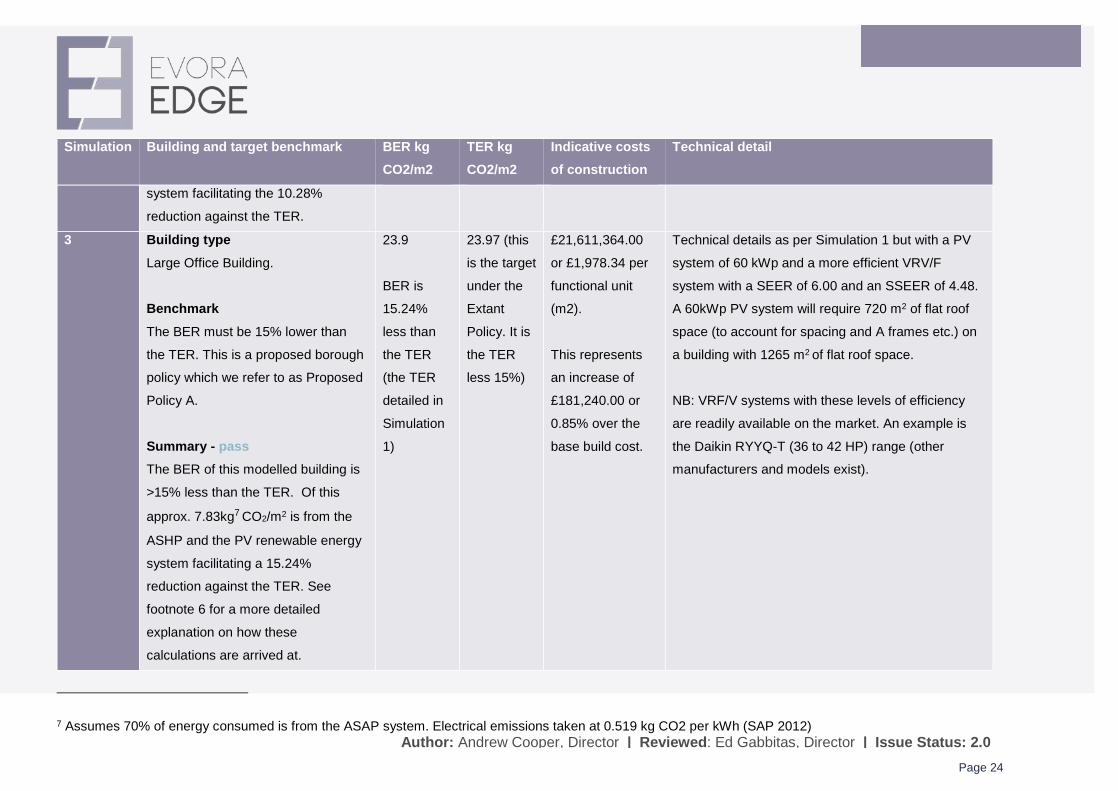
system facilitating the 10.28%
reduction against the TER.
3 Building type Large Office Building.
Benchmark The BER must be 15% lower than
the TER. This is a proposed borough
policy which we refer to as Proposed
Policy A.
Summary - pass The BER of this modelled building is
>15% less than the TER. Of this
approx. 7.83kg7 CO2/m2 is from the
ASHP and the PV renewable energy
system facilitating a 15.24%
reduction against the TER. See
footnote 6 for a more detailed
explanation on how these
calculations are arrived at.
23.9
BER is
15.24%
less than
the TER
(the TER
detailed in
Simulation
1)
23.97 (this
is the target
under the
Extant
Policy. It is
the TER
less 15%)
£21,611,364.00
or £1,978.34 per
functional unit
(m2).
This represents
an increase of
£181,240.00 or
0.85% over the
base build cost.
Technical details as per Simulation 1 but with a PV
system of 60 kWp and a more efficient VRV/F
system with a SEER of 6.00 and an SSEER of 4.48.
A 60kWp PV system will require 720 m2 of flat roof
space (to account for spacing and A frames etc.) on
a building with 1265 m2 of flat roof space.
NB: VRF/V systems with these levels of efficiency
are readily available on the market. An example is
the Daikin RYYQ-T (36 to 42 HP) range (other
manufacturers and models exist).
7 Assumes 70% of energy consumed is from the ASAP system. Electrical emissions taken at 0.519 kg CO2 per kWh (SAP 2012)
Page 25
Author: Andrew Cooper, Director | Reviewed: Ed Gabbitas, Director | Issue Status: 2.0
Simulation Building and target benchmark BER kg CO2/m2
TER kg CO2/m2
Indicative costs of construction
Technical detail
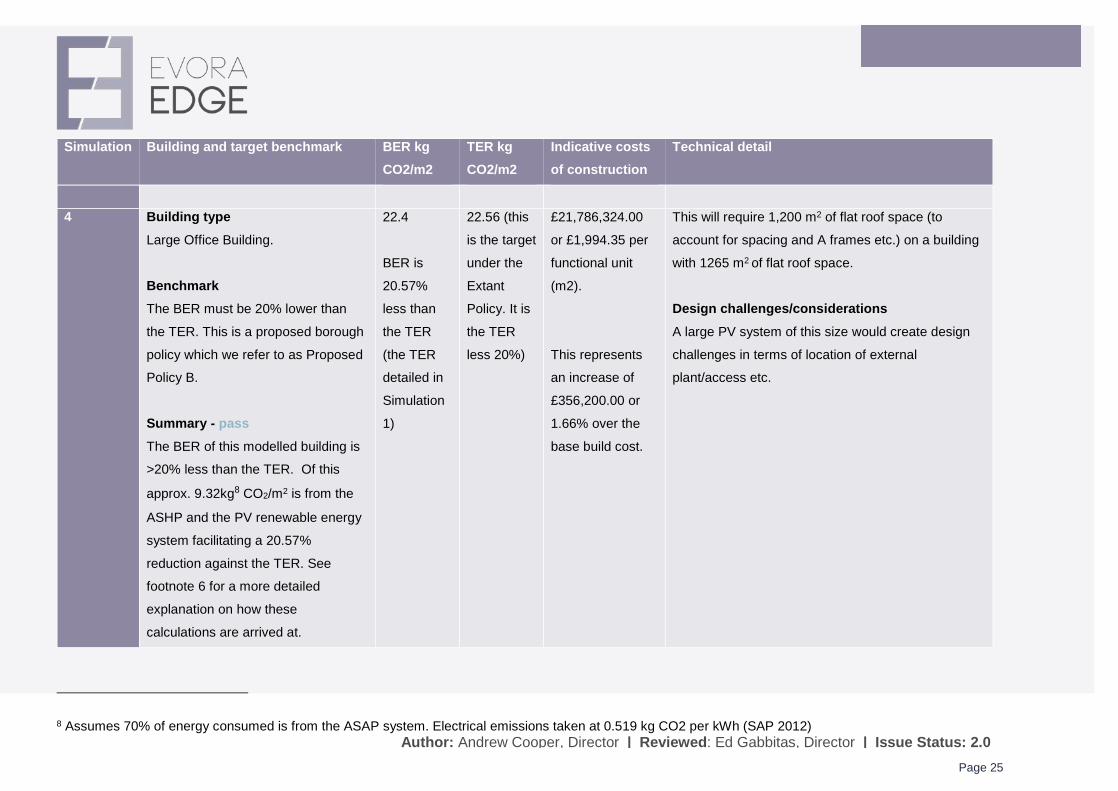
4 Building type Large Office Building.
Benchmark The BER must be 20% lower than
the TER. This is a proposed borough
policy which we refer to as Proposed
Policy B.
Summary - pass The BER of this modelled building is
>20% less than the TER. Of this
approx. 9.32kg8 CO2/m2 is from the
ASHP and the PV renewable energy
system facilitating a 20.57%
reduction against the TER. See
footnote 6 for a more detailed
explanation on how these
calculations are arrived at.
22.4
BER is
20.57%
less than
the TER
(the TER
detailed in
Simulation
1)
22.56 (this
is the target
under the
Extant
Policy. It is
the TER
less 20%)
£21,786,324.00
or £1,994.35 per
functional unit
(m2).
This represents
an increase of
£356,200.00 or
1.66% over the
base build cost.
This will require 1,200 m2 of flat roof space (to
account for spacing and A frames etc.) on a building
with 1265 m2 of flat roof space.
Design challenges/considerations A large PV system of this size would create design
challenges in terms of location of external
plant/access etc.
8 Assumes 70% of energy consumed is from the ASAP system. Electrical emissions taken at 0.519 kg CO2 per kWh (SAP 2012)
Page 26
Author: Andrew Cooper, Director | Reviewed: Ed Gabbitas, Director | Issue Status: 2.0
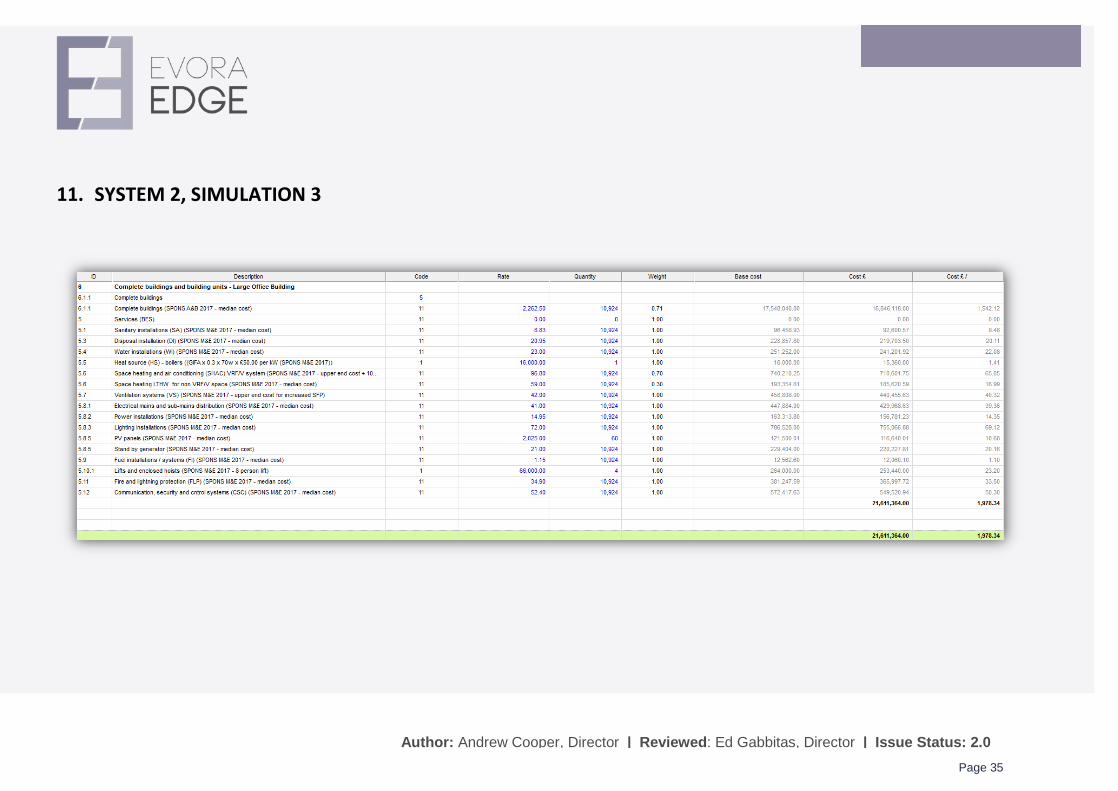
4. COSTS
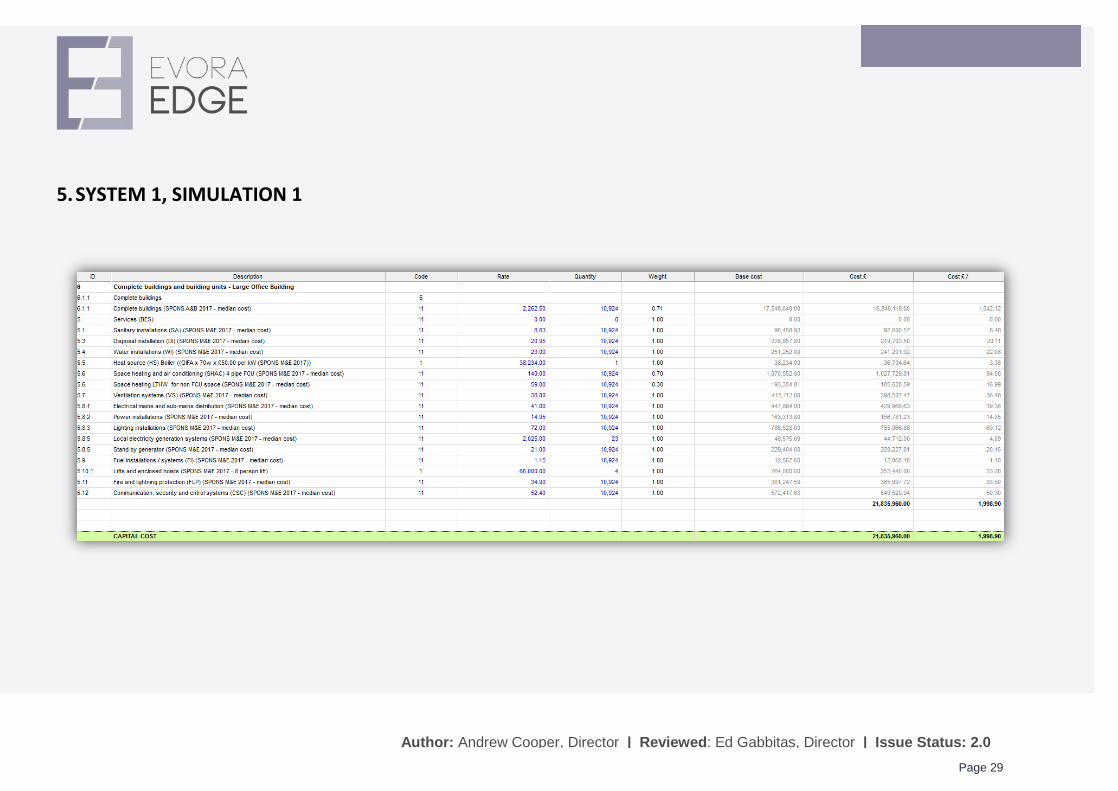
The costs detailed over the following pages have been taken from the BIMs which are available as cabinet files (CAB files). The headings include an ID, a
code which defines the basis of the cost multiplier, a rate (£), quantity, weight, base cost, cost £, and cost £ /. Explanations are provided below:
1.1 ID
The ID is based on the nomenclature of the RICS New Rules of Measurement.
1.2 Code
The code is assigned through the VE and informs the quantity. Code 11, as an example, is the code for multiplying the rate by the quantity which is based
on the Gross Internal Floor Area (GIFA), while Code 1 measures the quantity by item. For example, 1 or 2 No. boilers etc.
1.3 Rate
This is the rate (£) to be multiplied by the quantity.
1.4 Quantity
This is the basis of the cost multiplier.
Page 27
Author: Andrew Cooper, Director | Reviewed: Ed Gabbitas, Director | Issue Status: 2.0
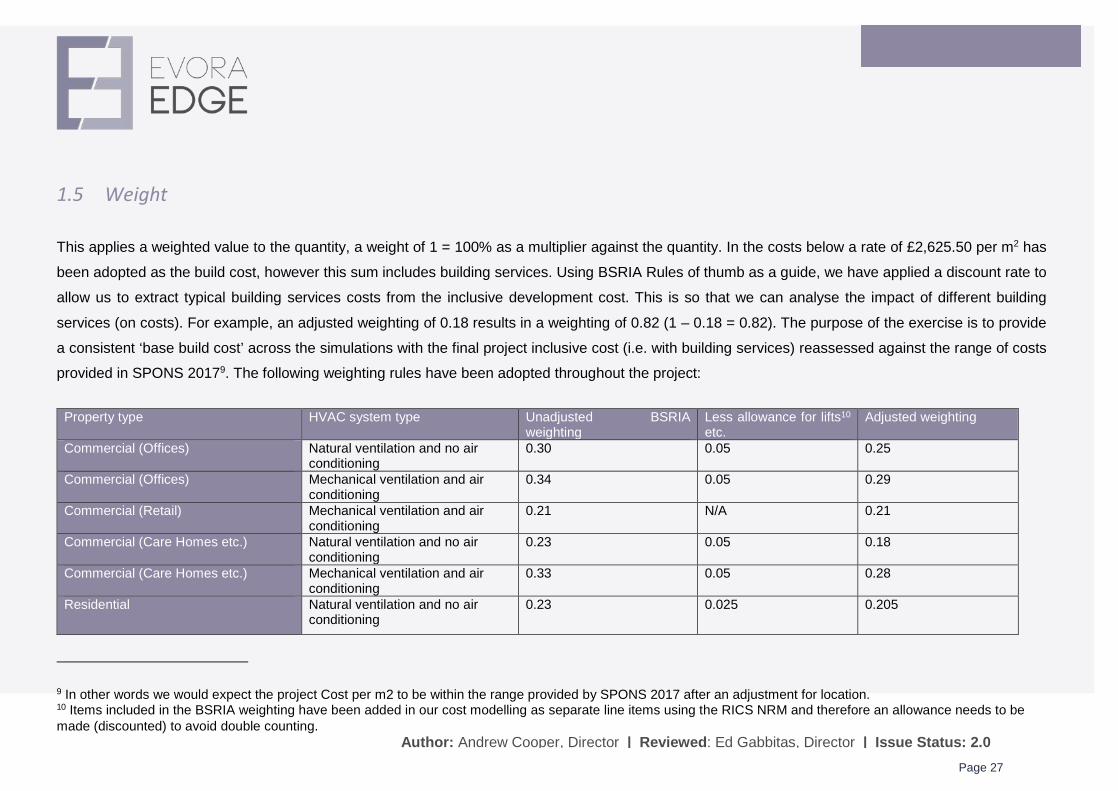
1.5 Weight
This applies a weighted value to the quantity, a weight of 1 = 100% as a multiplier against the quantity. In the costs below a rate of £2,625.50 per m2 has
been adopted as the build cost, however this sum includes building services. Using BSRIA Rules of thumb as a guide, we have applied a discount rate to
allow us to extract typical building services costs from the inclusive development cost. This is so that we can analyse the impact of different building
services (on costs). For example, an adjusted weighting of 0.18 results in a weighting of 0.82 (1 – 0.18 = 0.82). The purpose of the exercise is to provide
a consistent ‘base build cost’ across the simulations with the final project inclusive cost (i.e. with building services) reassessed against the range of costs
provided in SPONS 20179. The following weighting rules have been adopted throughout the project:
Property type HVAC system type Unadjusted BSRIA weighting
Less allowance for lifts10 etc.
Adjusted weighting
Commercial (Offices) Natural ventilation and no air conditioning
0.30 0.05 0.25
Commercial (Offices) Mechanical ventilation and air conditioning
0.34 0.05 0.29
Commercial (Retail) Mechanical ventilation and air conditioning
0.21 N/A 0.21
Commercial (Care Homes etc.) Natural ventilation and no air conditioning
0.23 0.05 0.18
Commercial (Care Homes etc.) Mechanical ventilation and air conditioning
0.33 0.05 0.28
Residential Natural ventilation and no air conditioning
0.23 0.025 0.205
9 In other words we would expect the project Cost per m2 to be within the range provided by SPONS 2017 after an adjustment for location. 10 Items included in the BSRIA weighting have been added in our cost modelling as separate line items using the RICS NRM and therefore an allowance needs to be made (discounted) to avoid double counting.
Page 28
Author: Andrew Cooper, Director | Reviewed: Ed Gabbitas, Director | Issue Status: 2.0
NB: Where adjustments to the weighting are made under RICS NRM item 5.6, these simply apportion the area conditioned by the system subject to the
adjustment. For example if a fan coil unit services approximately 70% of a building, then a weighting of 0.7 is applied.
1.6 Base Cost
The base cost is an unadjusted cost (rate x quantity).
1.7 Cost
This is the adjusted cost. It is the cost multiplied by a location adjustment factor, a quality factor, and a complexity factor. In SPONS 2017 the location
adjustment factor for the south east is 0.96, while a quality and complexity factor of unity (1) has been applied in the BIM representing a medium quality,
medium complexity development for the type of building modelled.
1.8 Cost £ /
This is the cost per functional unit. In this case the functional unit is taken as m2.
Page 29
Author: Andrew Cooper, Director | Reviewed: Ed Gabbitas, Director | Issue Status: 2.0
5. SYSTEM 1, SIMULATION 1
Page 30
Author: Andrew Cooper, Director | Reviewed: Ed Gabbitas, Director | Issue Status: 2.0
6. SYSTEM 1, SIMULATION 2
Page 31
Author: Andrew Cooper, Director | Reviewed: Ed Gabbitas, Director | Issue Status: 2.0
7. SYSTEM 1, SIMULATION 3
Page 32
Author: Andrew Cooper, Director | Reviewed: Ed Gabbitas, Director | Issue Status: 2.0
8. SYSTEM 1, SIMULATION 4
Page 33
Author: Andrew Cooper, Director | Reviewed: Ed Gabbitas, Director | Issue Status: 2.0
9. SYSTEM 2, SIMULATION 1
Page 34
Author: Andrew Cooper, Director | Reviewed: Ed Gabbitas, Director | Issue Status: 2.0
10. SYSTEM 2, SIMULATION 2
Page 35
Author: Andrew Cooper, Director | Reviewed: Ed Gabbitas, Director | Issue Status: 2.0
11. SYSTEM 2, SIMULATION 3
Page 36
Author: Andrew Cooper, Director | Reviewed: Ed Gabbitas, Director | Issue Status: 2.0