144
INDOFOOD AGRI RESOURCES LTD. | Annual Report 2009 Building Sustainable Growth

INDOFOOD AGRI RESOURCES LTD. | Annual Report 2009
BuildingSustainableGrowth

Mission
1. To be a low-cost producer, through high yields and
cost-effective and effi cient operations
2 To continuously improve our people, processes
and technology
3. Exceed our customers’ expectations, whilst
ensuring the highest standards of quality
4. Recognise our role as responsible and
engaged corporate citizens in all our
business operations, including sustainable
environmental and social practices
5. To continuously increase stakeholders’ value
Values
1. CONSISTENT
2. Our Success Rests On Satisfying CUSTOMERS’ Needs
3. INNOVATION Is Our Key To Future Growth
4. Reliable STAFF Is Our Biggest Asset
5. EXCELLENCE Is Our Way Of Life
6. TEAMWORK Makes A Winning Team
Vision
To Become a Leading Integrated
Agribusiness, and one of the world-
class agricultural research and seed
breeding Companies.

At a Glance Indofood Agri Resources Ltd (“IndoAgri”) is a vertically
integrated agribusiness group with activities spanning the entire
supply chain from research and development, seed breeding,
oil palm cultivation and milling; as well as the production
and marketing of cooking oil and margarine. Headquartered
in Jakarta, we are among the largest palm oil producers in
Indonesia. Our branded cooking oil, shortening and margarine
products garner a leading share in the domestic market. As a
diversified agribusiness group, IndoAgri also engages in the
cultivation of sugar cane, rubber and other crops.
Staff force of more than 29,000 people
Over 500,000 hectares of land bank with over 220,000 hectares planted
Leading market position in Indonesia, with renowned brands of cooking oil and margarine
01 At A Glance
02 Milestones
04 Key Events in 2009
05 Corporate Structure
06 Location Map
10 Chairman’s Statement
11 CEO’s Statement
14 Business Overview
16 Financial Highlights
17 Operational Highlights
20 Operations Review
31 Manufacturing Process
32 Environment & Corporate Social Responsibility
36 Board of Directors
40 Corporate Information
41 Corporate Governance
50 Financial Statements
126 Interested Person Transactions
127 Estates Location
129 Statistics of Shareholdings
131 Notice of Annual General Meeting
CONTENTS
0 1B U I L D I N G S U S T A I N A B L E G R O W T HINDOFOOD AGRI RESOURCES LTD. ANNUAL REPORT 2009

Diversifi ed into sugar business via the
subscription of 60%-stake in PT Laju
Perdana Indah.
Entered into a joint venture with
Ghanian Council for Scientifi c and
Industrial Research to develop and
realize the genetic potential of oil palm
for commercial production.
Achieved the world’s fi rst patent to
produce F1 oil palm hybrid seeds.
Acquired plantation land bank of 82,300
hectares in South Sumatra and Central
Kalimantan, Indonesia.
Acquired a bulking facility at the Dumai
port, Indonesia.
2007
2008
Completed a reverse takeover
of CityAxis Holdings Limited in
January and changed name to
Indofood Agri Resources Ltd.
Listed on the main board of the SGX-ST
on 14 February and raised S$420 million
proceeds from the placement of 338 million
new shares.
Acquired plantation land bank of 98,491
hectares in South Sumatra
and Kalimantan.
Acquired a 58.8% effective interest in
Lonsum, becoming one of the largest
plantation companies in Indonesia with land
bank doubling to over 400,000 hectares.
n
ooo
2007
0 2

MILESTONESSINCE LISTING IN FEBRUARY 2007, INDOAGRI
ACHIEVED RESPECTABLE GROWTH IN ITS PLANTED
AREA AND PRODUCTION VOLUME. ITS NORTH
SUMATRA OIl PALM ESTATES AND MILLS ARE NOW
CERTIFIED AS SUSTAINABLE UNDER RSPO.
2009
Achieved the Roundtable on Sustainable
Palm Oil (RSPO) certifi cation for its North
Sumatra estates and factories.
Raised Rp730 billion or approximately
US$78 million from 5-year Indonesian
Rupiah Bonds and Islamic
Lease-based Bonds.
Acquired plantation land bank of 10,000 hectares
in South Sumatra, Indonesia.
Incorporated a new subsidiary to own barges,
tugboats and operation of shipping logistics
business.
B U I L D I N G S U S T A I N A B L E G R O W T HINDOFOOD AGRI RESOURCES LTD. ANNUAL REPORT 2009
0 3

KEY EVENTS IN 2009
ACHIEVED RSPO CERTIFICATION, EXPANSION OF LAND BANK AND PLANTED AREA, STRENGTHENED CAPITAL STRUCTURE.
2009
17 February PT SIMP increased its shareholding interest in PT Sarana Inti Pratama (PT SAIN) and PT Mitra Inti Sejati Plantation (PT MISP) from 70.02% and 70% respectively to 100%.
The acquisition of minority interest in PT MISP is in line with the Group’s strategy to enhance its integrated agribusiness model and to improve operating effi ciency and execution effectiveness.
The acquisition of the minority stake in PT SAIN is in line with IndoAgri’s strategy to merge the seeds business and breeding expertise of PT SIMP and Lonsum to achieve greater value and higher yields through seed breeding, best-practice agronomy and crop protection.
12 June PT SIMP, our 90%-owned subsidiary, incorporated a wholly-owned subsidiary – PT Samudera Sejahtera Pratama (PT SSP) in Jakarta. The principle activity of the new subsidiary is to own barges, tugboats and operation of shipping logistics business.
The incorporation of PT SSP is in line with IndoAgri’s strategy to have an integrated supply chain and reducing our reliance on external parties for the shipment of CPO from the tank farms located at the port of Dumai and Rengat in the province of Riau, Indonesia to our refi neries at Jakarta and Surabaya.
18 June PT PP London Sumatra Indonesia Tbk (“Lonsum”) attained the Roundtable on Sustainable Palm Oil (RSPO) certifi cation for sustainable palm oil for its North Sumatra estates and factories. The RSPO certifi cation covers approximately 20% of the Group’s annual palm oil production.
13 July As part of the Group’s effort to optimise its capital structure and enhance its fi nancial position, PT SIMP announced its intention to consider the issuance of 5-year Indonesian Rupiah Bonds up to Rp1.0 trillion to refi nance its existing borrowings.
14 August IndoAgri’s subsidiaries, PT Serikat Putra and PT Indoagri Inti Plantation acquired 100% interest of PT Intimegah Bestari Pertiwi (“PT IBP”), adding a total of land bank of 10,000 hectares in South Sumatra, Indonesia. This acquisition was completed on 12 October 2009.
20 November PT SIMP raised Rp452 billion and Rp278 billion (total aggregate of Rp730 billion or approximately US$78 million) from 5-year Indonesian Rupiah Bonds and Islamic Lease-based Bonds respectively, with a coupon rate of 11.65%. The bonds were listed in the Indonesia Stock Exchange on 2 Dec 2009.
0 4

CORPORATE STRUCTURE
0 5B U I L D I N G S U S T A I N A B L E G R O W T HINDOFOOD AGRI RESOURCES LTD. ANNUAL REPORT 2009
83.8%
69.4%
100.0%
90.0%
56.4%
8.4%
8.0%
INDOFOOD SINGAPOREHOLDINGS PTE LTD
INDOFOOD OIL & FATS PTE LTD
PT SALIM IVOMAS PRATAMA
5656.4.4%%
30.6%
PUBLIC

LOCATION MAP
OUR PLANTATIONS AND REFINERIESIndoAgri owns strategically located plantations and production facilities across the
Indonesia archipelago. We have over 500,000 hectares of land bank, largely located in
Sumatra and Kalimantan, of which over 220,000 hectares are planted. Oil palm is our
dominant crop, followed by rubber, sugar cane, cocoa and tea. On the downstream,
our refineries are strategically located at major cities in Jakarta, Surabaya, Medan
and Bitung.
S U M A T R AS I N G A P O R E
M A L A Y S I A
J A V A
Medan
Palembang
Jakarta
Pekanbaru Pontianak
0 6

Our workers gather for routine briefi ngs at the start of each day.
K A L I M A N T A N
S U L A W E S I
N O R T HM A L U K U
Surabaya
Samarinda
TOBELO
Makassar
Muotong
Bitung
Town / City
Oil Palm
Sugar Cane
Rubber
Cocoa
Tea
Refinery
Copra Mill
LEGEND
0 7B U I L D I N G S U S T A I N A B L E G R O W T HINDOFOOD AGRI RESOURCES LTD. ANNUAL REPORT 2009

8

WE CONTINUE TO EXPAND OUR OIL PALM ACREAGE

CHAIRMAN’S STATEMENT
Dear Shareholders,
In the short time since IndoAgri’s listing on the Singapore Exchange in 2007, we have made signifi cant progress in realising our vision to become a leading Integrated Agribusiness Group. Our key achievements such as the acquisition of Lonsum, our expansion into sugar cane plantations and continued investments to boost R&D and production capacities have placed us on a faster but sustainable track for growth.
With rising global consumption and a projected world population of 9.2 billion people by 2050 (50% of the population growth will be in Asia), we will continue to strengthen our business model and identify new business opportunities in Indonesia, to position ourselves for escalating market growth.
TAPPING INTO A RESILIENT HOME BASEWhile most economies are only just beginning to recover from the global fi nancial crisis, Indonesia has been up on its feet as early as the start of 2009. This is attributable to a strong domestic market that was less dependent on exports. Its population of 240 million makes it Southeast Asia’s biggest economy with domestic consumption accounting for 70% of its estimated GDP of over US$500 billion.
The Rupiah’s strength against the US dollar has enabled local businesses, including plantation owners, to weather the economic turbulence relatively well. In January 2010, Fitch Ratings upgraded the country’s sovereign debt from ‘BB’ to ‘BB+’ with a “stable outlook”, citing Indonesia’s resilience amidst the global fi nancial crisis and a well-managed state budget.
The upbeat economic outlook, coupled with political stability, has increased investor confi dence in Indonesia. Together with its strong population growth, we expect demand for palm oil products to improve and domestic
consumption in Indonesia to remain robust in the short to medium term.
Additionally, the World Bank has estimated a GDP growth rate of 5.6% in 2010 compared to 4.5% in 2009 supported by strong domestic consumption and government infrastructure-related projects. We are confi dent that IndoAgri will be able to ride the turbulent times and emerge from the economic crisis with confi dence and strength.
UNLOCKING OUR FULL POTENTIALChanneling our expertise and resources to become one of the largest plantation owners in Indonesia has been the right strategy for our business. Indonesia remains one of the world’s cheapest places to grow palm oil, and is ideally placed to service the increasing import demands of India and China and other emerging Asian economies.
Expanding the scope of our agribusiness to include sugar production has resonated well with the Group’s objective in harnessing greater economies of scale and tapping into synergies from our expertise in large-scale plantation management.
Besides the good synergistic fi t, we believe this will enhance our competitive edge in the commodities market. The completion of our cutting-edge sugar refi nery in 3Q2010 will give us the capacity to grow this business and to realise our potential. Indonesia currently has a domestic shortfall of approximately 2 million tonnes of sugar, which equates to 40% of consumption, allowing further scope for us to expand our sugar footprint.
Our commitment to sustainable agriculture was further enhanced with our North Sumatra estates gaining Roundtable on Sustainable Palm Oil (RSPO) Certifi cation for sustainable palm oil.
GEARING FOR GROWTHLooking ahead, we will continue to pursue strategic opportunities, including the identifi cation of new and suitable land banks in Indonesia and beyond, in order to expand our planted area and improve our production yields. We will balance this with a fi rm commitment to manage our business operations in a sustainable manner, supported by a strong R&D emphasis and a prudent approach to managing resources, underscored by the highest standards of corporate governance.
APPRECIATIONI would like to thank the Board of Directors, management and staff for their hard work and dedication; and our shareholders for their continued confi dence and support in a challenging year. We are well placed to reap the harvest in the coming years.
Mr Edward LeeCHAIRMAN
1 0

THE TURBULENT ECONOMY HAS NOT DETERRED INDOAGRI FROM ACHIEVING A NUMBER OF SUCCESSES THIS FINANCIAL YEAR. WE CONTINUED TO DRIVE RESULTS THROUGH EFFICIENT AND COST-EFFECTIVE MEASURES THAT HONE OUR OPERATIONS. WE ALSO STEPPED-UP ON R&D EFFORTS AND STREAMLINED OUR VERTICALLY INTEGRATED AGRIBUSINESS MODEL IN ORDER TO BUILD SUSTAINABLE GROWTH.
CEO’S STATEMENT
Dear Shareholders,
A leading integrated Agribusiness group with strong R&D and seed breeding operations.
Despite a diffi cult year for all sectors, commodity prices were surprisingly buoyant in 2009. We expect the trend to remain well supported in 2010 as stability and world consumption increases after the global crisis, coupled with stronger demand for biodiesel driven by government mandates in Europe, Brazil and Argentina.
In 2009, adverse weather triggered most of the volatility in commodity prices. Severe droughts in Argentina affected the production of soybean, a close palm oil substitute, resulting in 14 million tonnes decline in actual crops harvested. Additionally wet weather in India caused a reduction in their oilseed crops, driving the increase in India’s import of palm oil from 5.8 million tonnes in 2008 to 6.8 million tonnes in 2009.
Resultantly, CPO prices staged a strong recovery from the second quarter of 2009 with a range of US$640 (CIF Rotterdam) to US$801 per tonne before ending the year at US$792 per tonne. Prices averaged US$683 per tonne in 2009 against US$949 per tonne in 2008. Palm oil remains a low-cost vegetable oil to produce given its high yield per hectare as compared to other crops; capturing strong growth from major economies like China and India, where demand is likely to remain vibrant despite challenging economic conditions.
On the other hand, rubber prices, which were severely affected in late 2008 by a signifi cant drop in demand, ranged from a low of US$1,420 to a high of US$2,885 per tonne by the end of 2009. As signs of recovery return, we expect to see improved demand as we enter 2010.
PRUDENT RESPONSES TO THE GLOBAL CRISISAlthough the effects from the severe economic crisis will be felt for some time to come and recovery in the fi nancial sector is underway, 2009 proved to be far less volatile in our markets than 2008. What became very apparent in 2009 is that US consumer spending, which supported most of the previous decade’s global growth, will diminish in prominence as new markets provide the impetus for stronger demands in the medium term.
As a Group, our response to the global crisis was quick and prudent. Our immediate reaction was to protect our cash fl ow and increase the focus on our balance sheet. We acted swiftly to reduce capital expenditure by slowing down our new plantings and focusing on our core capital programme to deliver our expansion plans while ensuring tighter cost control. We also took a much closer scrutiny on counterparty risks, and an increased focus on receivables to protect our cash fl ow.
1 1B U I L D I N G S U S T A I N A B L E G R O W T HINDOFOOD AGRI RESOURCES LTD. ANNUAL REPORT 2009

CEO’S STATEMENT
In November 2009, we strengthened the Group’s capital structure by issuing 5-year Indonesia Rupiah Bonds amounting to Rp730 billion, refi nancing our short-term borrowings to accommodate the cash fl ow patterns of our continued business expansion plans.
Looking ahead, emerging markets like Brazil, India and China will drive global economic growth. Our priority is to ensure that IndoAgri is well positioned to benefi t from the opportunities, as our agribusiness model caters to consumption growth particularly in the Indonesian and Asian economies.
DELIVERING STEADY PERFORMANCE AMIDST CHALLENGING TIMESGiven the unprecedented high in CPO prices in the fi rst half of 2008, the Group’s revenue of Rp9.0 trillion (S$1.3 billion) in 2009, which was 24% lower than a year ago, was attributed mainly to lower average selling prices of commodities during the year in review. This was partially offset by stronger sales volume growth in CPO, palm kernel (PK) and margarine of 4%, 11% and 8% respectively in 2009 compared to the same period last year.
Nonetheless, EBITDA margins expanded to 33.0% from 26.1% in 2008 as a result of foreign currency gains, lower operating expenses and tighter cost control. We also achieved a strong net profi t attributable to equity holders of Rp1.5 trillion (S$213 million), up 92% compared to 2008.
Notwithstanding economic challenges, the Group is committed to continued growth and expansion in 2010.
HARNESSING SYNERGIES The acquisition of Lonsum has enabled the Group to realise a number of operational synergies beyond scale. It has boosted internal CPO from 274,000 tonnes in 2007 to 457,000 tonnes in 2009, giving us greater assurance over the quality of raw material used for downstream refi nement.
Our research centres pool R&D technology, information from fi eld trials and plantation production data to accelerate our breeding and seed cultivation programmes and to achieve better quality and higher-yielding seed material. Our combined purchases have given us greater economies of scale and improved bargaining power with our suppliers.
Harnessing internal resources, fresh fruit bunches (FFB) production from our Kalimantan estates are now fully processed at Lonsum’s new 45 tonne/hour palm oil mill in East Kalimantan, thereby preserving the freshness of our fruit quality and reducing the costs of transporting our FFB to third party mills located 400 km away.
As a result, we have added more trucks to our fl eet at Lonsum, as increased in-house transportation allows us greater logistical control and a more economical alternative to outsourcing. We intend to achieve 100% in-house FFB transportation by end-2010.
In the longer term, we expect the synergies from the Lonsum acquisition to contribute more signifi cantly to the Group through sustainable cost reductions and improved productivity that will help us to realise higher profi tability and increased returns for our shareholders.
STRENGTHENING OUR CORPORATE GOVERNANCE FRAMEWORKA well integrated and coordinated approach to Enterprise Risk Management or ERM is critically essential to an effi cient risk management framework, and to ensure the day to day tracking, monitoring and control of risks.
In 2009, we established a central ERM unit with the primary objective of promoting a more systematic, integrated and well-coordinated approach to risk management strategies across all our operating and functional units. Adopting a prudent approach to risk management as we navigate through volatile commodity markets underpins our ability to execute on our growth strategy in creating shareholder value.
The ERM unit immediately consolidated all existing risk management activities under its ambit in order to monitor and assess the Group’s overall risk profi le. It has embarked on a comprehensive risk management awareness and integration programme to develop and enhance our formal risk policies and procedures; develop and update our risk management methodologies, guides and tools; and work closer with operating units and functional departments on critical matters relating to risk management.
We will sustain our priorities in risk management by promoting awareness through staff communication and ERM training to key employees. The development of a comprehensive Risk Management Manual that details the roles and responsibilities of management and respective employees, will further aid the effective implementation of ERM, and is core to our ongoing business process improvements.
LEVERAGING IT FOR BETTER DECISION MAKING In 2008, we decided to increase our investment in Information Technology as a strategic business support tool that would enable us to leverage on scalability as we grow our business.
1 2

As such, the Group upgraded its IT platform in 2009 by adopting SAP as the enterprise resource planning system for its refi nery operations. SAP has enabled an integrated platform for quicker and more effi cient decision making, as well as more effective business planning and execution. In the year ahead, we expect to move into the next phase of design as well as testing and implementing the SAP system across our plantation operations.
NURTURING OUR HUMAN CAPITAL The Group’s single most important competitive advantage lies in its people. We value the importance of teamwork, cohesiveness and a productive work environment in achieving our full potential. As such, we will continue to engage and motivate our employees through regular communication, as well as training and development opportunities.
As part of ongoing improvements across the Group, we have engaged in a new phase of our human capital management that will help us to align our HR strategies to organisational goals. We are undertaking a wide-ranging review of our HR practices, with a strong focus on leadership renewal. To expedite results, we have recruited a senior HR executive to spearhead these efforts Group-wide.
We have also embarked on leadership training programmes as well as formal processes for succession planning, so that talented employees may be identifi ed and developed for higher roles and responsibilities under a planned development programme.
These, together with our other HR initiatives, will enable us to build the right competencies and capability to deliver on our expansion plans.
GEARING TOWARDS SUSTAINABLE PRODUCTIONThe Group continues to advocate responsible farming and agribusiness practices, and has a long-term commitment to the sustainable production of our products.
This year, we are very proud to have achieved the Roundtable on Sustainable Palm Oil (RSPO) certifi cate, the highest global recognition for sustainable production, for our North Sumatra oil palm estates and mills. The RSPO sustainable certifi cate covers 8 principles and 39 criteria, which are in turn measured by external RSPO-certifi ed auditors across 139 indicators. This certifi cation is both comprehensive and relevant in today’s business environment, while accounting for 170,000 tonnes of sustainable palm oil produced each year by the Group.
We are already well under way to expanding this certifi cation within our plantations in Sumatra, and aim to extend our production of certifi ed sustainable palm oil in the future.
ACCELERATING INNOVATION THROUGH R&DR&D remains a key pillar in our efforts to build sustainable growth. Working through Sumatra Bioscience and PT SAIN, the Group’s in-house research centres, we will continue to focus on improving plantation yields and cultivation practices in 4 key areas: plant breeding, agronomy, crop protection and data analysis.
As pioneers of the world’s fi rst patented process for the production of F1 oil palm hybrids, we are confi dent that we will be able to signifi cantly improve conventional oil palm yields. Capitalising on our fi rst-mover advantage, we have embarked on our 10-year roadmap to commercialise the production of our F1 oil palm hybrids.
More importantly, we believe these efforts will contribute signifi cantly to environmental sustainability with less land being required for crop cultivation.
IN APPRECIATIONI would like to take this opportunity to extend my appreciation to the Board of Directors for their dedication, support and valuable inputs in charting the Group’s strategy.
I would also like to thank our suppliers and business partners for their commitment and unfailing support.
To the management and staff at IndoAgri, I would like to express my special thanks for the loyalty and hard work, and for going the extra mile during an extremely challenging year.
Last but not least, my heartfelt appreciation goes to you, our shareholders, for your unwavering trust during a turbulent year. Your confidence in the Group has contributed to our success.
Mr Mark WakefordCHIEF EXECUTIVE OFFICER
1 3B U I L D I N G S U S T A I N A B L E G R O W T HINDOFOOD AGRI RESOURCES LTD. ANNUAL REPORT 2009

BUSINESS OVERVIEW
INDOFOOD AGRI RESOURCES LTD (“INDOAGRI” OR “THE GROUP”) IS A VERTICALLY INTEGRATED AGRIBUSINESS GROUP WITH ACTIVITIES SPANNING THE ENTIRE SUPPLY CHAIN FROM RESEARCH AND DEVELOPMENT, SEED BREEDING AND OIL PALM CULTIVATION; TO PLANTATION AND MILLING OF PALM OIL AND COPRA; AND THE PRODUCTION AND MARKETING OF BRANDED COOKING OIL AND MARGARINE. AS A DIVERSIFIED AGRIBUSINESS, WE ARE ALSO ENGAGED IN THE CULTIVATION OF SUGAR CANE, RUBBER AND OTHER CROPS.
Headquartered in Jakarta, the Group is among the largest palm oil producers in Indonesia. Our branded cooking oil, shortening and margarine products garner a leading share in the domestic consumer market. IndoAgri is listed on the Singapore Exchange, and is organised into three business divisions: Plantation, Cooking Oil & Fats, and Commodity.
FINANCIAL HIGHLIGHTSAmidst the challenges of 2009, IndoAgri recorded revenue of Rp9.0 trillion (S$1.3 billion), a 24% decline compared to a year ago given the lower average prices of CPO, palm kernel (PK), rubber, edible oil products and reduced volume in the sales of cooking oil. This was partially offset by stronger sales volume growth in CPO, PK and margarine of 4%, 11% and 8% respectively in 2009 compared to the same period last year.
Despite the weaker revenue, EBITDA margins grew from 26.1% to 33.0% this year due to reduced selling and distribution costs on lower export taxes, tighter cost controls and net gains on foreign currency.
The Group’s 2009 net profi t attributable to equity holders grew 92% to Rp1.5 trillion (S$213 million) compared to the previous year, driven mainly by gains on biological assets, lower operating costs and net gains on foreign currency.
CHARTING STRATEGIES FOR SUSTAINABLE GROWTHThe Group remains one of Indonesia’s largest plantation owners with an aggregate land bank of 549,287 hectares and a planted area of 227,721 hectares. Nonetheless, due to economic uncertainties arising from the fi nancial crisis, we reduced new plantings of oil palm to 11,773 hectares in 2009, compared to the 22,014 hectares achieved in the previous year.
OIL PALMS – CONTINUED EXPANSION• As our dominant crop, oil palm constitutes 193,613
hectares or 85% of our total planted area as at end December 2009. This includes 61,053 hectares of immature plantings (roughly the size of Singapore), which will come into maturity over the next 24 months ensuring continued growth in our CPO production.
REVENUE
0
14.0
12.0
10.0
8.0
6.0
4.0
2.0
05 06 07 08 09
R p t r i l l i o n
PROFORMA PROFORMA ACTUAL ACTUAL ACTUAL
3.64.1
6.5
11.8
9.0
PROFIT FROM OPERATIONS
0
3.5
3.0
2.5
2.0
1.5
1.0
0.5
05 06 07 08 09
R p t r i l l i o n
PROFORMA PROFORMA ACTUAL ACTUAL ACTUAL
0.91.2
1.61.9
3.3
1 4

• Bolstered by maturing new estates, the Group achieved an FFB output of 2,613,345 tonnes, a 5% increase over the previous year.
• CPO production grew 7% to 762,570 tonnes on the back of higher FFB output and higher purchases from plasma and third party farmers. Additional capacities from two 45 tonne/hour palm oil mills in Kalimantan completed in 2009 will improve our CPO production in the years ahead.
• We will continue to increase our oil palm acreage, and look forward to the completion of two new palm oil mills in 2011.
SUGAR – COMING ON STREAM• In 2009, the Group’s investment in the sugar business
produced 295,948 tonnes of sugar cane from its South Sumatra estates, while its sugar mill in Central Java produced 8,751 tonnes of sugar and 6,188 tonnes of molasses.
• As at the end of December 2009, our planted acreage of 8,672 hectares of sugar cane is well on the way to achieving our targeted planted area by 2011.
• Completion of our 8,000 TCD sugar mill in South Sumatra in 3Q2010 will enable us to achieve the vertical integration we require for full-scale operations and growth.
COOKING OIL & FATS – EXPANDING REFINING CAPACITY• The Medan refi nery expansion programme, which was
completed in 1Q2009, has enabled us to expand our refi ning capacity to 1 million tonnes per annum.
• The new 420,000-tonne per year refi nery in Jakarta, which is scheduled to complete in 4Q2010, will further enhance our speciality fats capability and output levels whilst reducing operating costs.
The Group advocates responsible farming and agribusiness practices, achieving the highest global recognition – the Roundtable on Sustainable Palm Oil (RSPO) certifi cate – for our North Sumatra oil palm estates and mills in 2009. The certifi cation accounts for 170,000 tonnes of sustainable palm oil produced each year.
Strengthening our capital structure, the Group issued 5-year Indonesian Rupiah Bonds amounting to Rp730 billion to refi nance our short-term borrowings and accommodate the cash fl ow patterns of our business expansion plans.
R&D remains a key pillar in our efforts to build sustainable growth, as we continue to seek greater economies of scale as a competitive and vertically integrated agribusiness group.
NET PROFIT TO EQUITY HOLDERS
0
1.8
1.6
1.4
1.2
0.8
1.0
0.6
0.4
0.2
05 06 07 08 09
R p t r i l l i o n
PROFORMA PROFORMA ACTUAL ACTUAL ACTUAL
0.5
0.7
0.90.8
1.5
NAV PER SHARE
0
7,000
6,000
5,000
4,000
3,000
2,000
1,000
05 06 07 08 09
R p
PROFORMA PROFORMA ACTUAL ACTUAL ACTUAL
2,0962,762
4,9435,506
6,567
1 5B U I L D I N G S U S T A I N A B L E G R O W T HINDOFOOD AGRI RESOURCES LTD. ANNUAL REPORT 2009
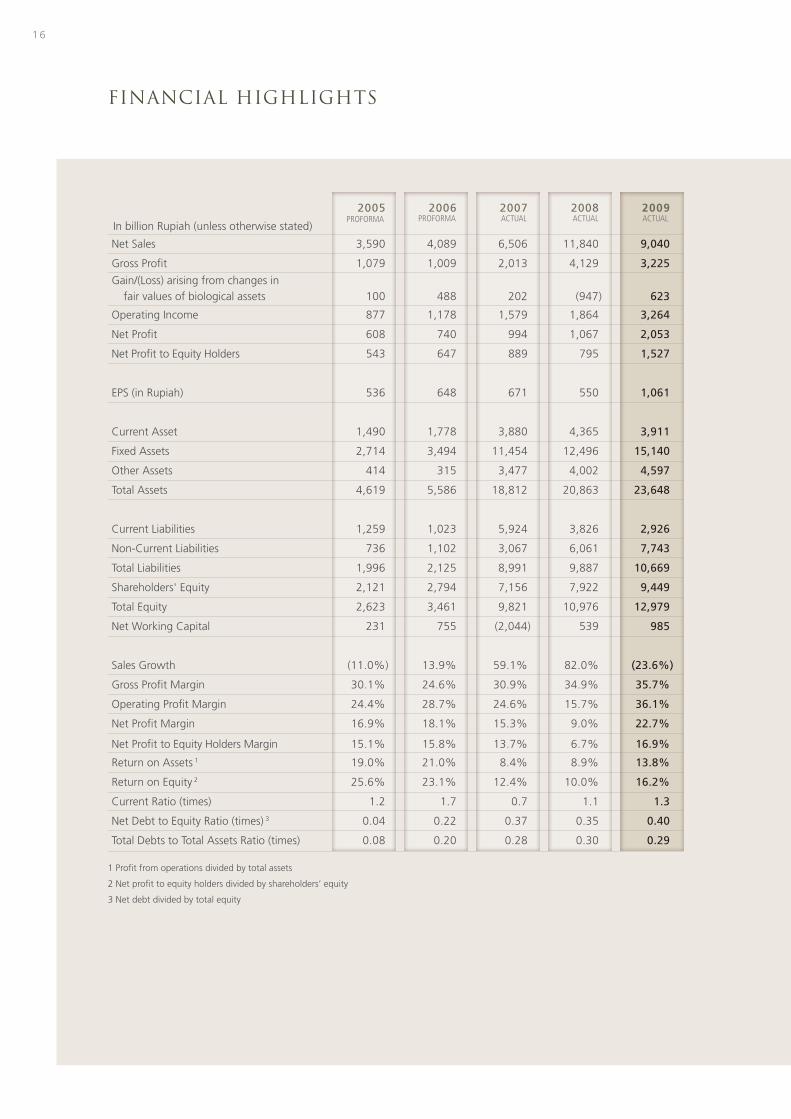
FINANCIAL HIGHLIGHTS
1 Profi t from operations divided by total assets
2 Net profi t to equity holders divided by shareholders’ equity
3 Net debt divided by total equity
2005 2006 2007 2008 2009
In billion Rupiah (unless otherwise stated)
Net Sales 3,590 4,089 6,506 11,840 9,040
Gross Profi t 1,079 1,009 2,013 4,129 3,225
Gain/(Loss) arising from changes in fair values of biological assets 100 488 202 (947) 623
Operating Income 877 1,178 1,579 1,864 3,264
Net Profi t 608 740 994 1,067 2,053
Net Profi t to Equity Holders 543 647 889 795 1,527
EPS (in Rupiah) 536 648 671 550 1,061
Current Asset 1,490 1,778 3,880 4,365 3,911
Fixed Assets 2,714 3,494 11,454 12,496 15,140
Other Assets 414 315 3,477 4,002 4,597
Total Assets 4,619 5,586 18,812 20,863 23,648
Current Liabilities 1,259 1,023 5,924 3,826 2,926
Non-Current Liabilities 736 1,102 3,067 6,061 7,743
Total Liabilities 1,996 2,125 8,991 9,887 10,669
Shareholders' Equity 2,121 2,794 7,156 7,922 9,449
Total Equity 2,623 3,461 9,821 10,976 12,979
Net Working Capital 231 755 (2,044) 539 985
Sales Growth (11.0%) 13.9% 59.1% 82.0% (23.6%)
Gross Profi t Margin 30.1% 24.6% 30.9% 34.9% 35.7%
Operating Profi t Margin 24.4% 28.7% 24.6% 15.7% 36.1%
Net Profi t Margin 16.9% 18.1% 15.3% 9.0% 22.7%
Net Profi t to Equity Holders Margin 15.1% 15.8% 13.7% 6.7% 16.9%
Return on Assets 1 19.0% 21.0% 8.4% 8.9% 13.8%
Return on Equity 2 25.6% 23.1% 12.4% 10.0% 16.2%
Current Ratio (times) 1.2 1.7 0.7 1.1 1.3
Net Debt to Equity Ratio (times) 3 0.04 0.22 0.37 0.35 0.40
Total Debts to Total Assets Ratio (times) 0.08 0.20 0.28 0.30 0.29
PROFORMA PROFORMA ACTUAL ACTUAL ACTUAL
1 6

OPERATIONAL HIGHLIGHTS
2005 2006 2007 2008 2009In Hectares (unless otherwise stated)Planted Area - NucleusOil Palm 61,408 66,900 161,457 183,113 193,613
Mature 56,939 60,817 118,030 124,169 132,560
Immature 4,469 6,083 43,427 58,944 61,053
Rubber 5,015 5,015 22,003 22,410 21,738Mature 5,015 5,015 18,956 17,873 17,263Immature - - 3,048 4,537 4,475
Sugar - - - 4,174 8,672Mature - - - 4,174 8,672
Others - - 3,522 3,631 3,698Mature - - 2,800 2,870 2,971Immature - - 722 761 727
Plasma 25,000 25,000 61,000 76,472 76,851
Age Maturity of Oil Palm TreesImmature 3,344 5,604 43,427 58,944 61,0534 - 6 years 6,231 5,365 9,331 12,332 19,5597 - 20 years 51,734 47,072 90,628 82,008 73,262Above 20 years 99 8,859 18,070 29,829 39,739Total 61,408 66,900 161,457 183,113 193,613
Distribution of Planted Areas-Nucleus
Riau 56,009 56,610 57,003 57,003 56,782North Sumatra - - 40,535 40,506 40,463South Sumatra - - 43,692 61,254 71,385West Kalimantan 5,399 10,290 18,632 21,758 21,878East Kalimantan 5,015 5,015 19,030 24,478 28,120Central Kalimantan - - - - 725Java - - 2,555 2,795 2,860Sulawesi - - 5,535 5,534 5,508Total 66,423 71,915 186,982 213,328 227,721
Production Volume (‘000 Tonnes)Nucleus Fresh Fruit Bunch (FFB) 1,295 1,324 1,506 2,496 2,613Processed FFB 1,294 1,320 1,708 3,160 3,346Crude Palm Oil (CPO) 299 300 384 714 763Palm Kernel (PK) 61 63 85 166 181Oil Palm Seed ('000) - 800 5,550 24,839 18,713Rubber - 4 8 28 28
Sales Volume (‘000 Tonnes)Crude Palm Oil (CPO) 297 305 361 730 759Palm Kernel (PK) 59 64 82 161 179Rubber 1 3 7 26 25Cooking Oil 322 371 371 424 387
Magarine 177 178 183 161 173
Coconut Oil 84 87 109 108 82
PROFORMA PROFORMA ACTUAL ACTUAL ACTUAL
1 7B U I L D I N G S U S T A I N A B L E G R O W T HINDOFOOD AGRI RESOURCES LTD. ANNUAL REPORT 2009

OIL PALM SEED BREEDING
P L A N T A T I O N S
PALM OIL MILLSSS
R E F I N E R I E S
OO
R E S E A R C H & D E V E L O P M E N T
P L A N T A T I O N SP

D I S T R I B U T I O NN
F I N I S H E D P R O D U C T S
OURINTEGRATEDAGRIBUSINESS MODEL

OPERATIONS REVIEW
PLANTATION | Palm Oil
OVERVIEWThe Plantation Division manages IndoAgri’s strategically located estates across Indonesia. The Group’s land bank of 549,287 hectares, including 227,721 hectares of planted area, makes us one of the largest plantation owners in the archipelago.
Oil palm, our dominant crop, occupies 193,613 hectares or 85% of total planted area, followed by rubber and sugar plantations at 10% and 4% respectively. With 61,053 hectares or 32% of our oil palm estates demarcated by young or immature trees, the Group is poised for stronger FFB output as these trees approach their productive ages.
Leveraging the combined heritage of our subsidiaries, PT SIMP and Lonsum, the Group brings together nearly 130 years of plantation management experience and expertise, scaling new heights in seed breeding and cultivation programmes that have made us one of the most productive plantation companies in Indonesia. Our focus on cutting-edge R&D has also rewarded us with a patented process that produces seed material with improved quality and yields.
Through the division, the Group operates 20 palm oil mills across Sumatra and Kalimantan, with a total processing capacity of 4.5 million tonnes of FFB per year. We also operate four crumb rubber factories, three sheet rubber factories, a cocoa factory, a tea factory and a sugar factory.
Our mills and estates in North Sumatra are certifi ed to the rigorous standards of the Roundtable on Sustainable Palm Oil (RSPO), producing 170,000 tonnes of sustainable crude palm oil per annum.
With Lonsum in its second year of operation under our wings, the Group is reaping signifi cant progress from acquisition synergies.
Our diversifi cation into the sugar business has also yielded encouraging results, with construction of new facilities proceeding on schedule for full-scale operations in 2010.
2009 REVIEWSigns of stabilisation in the global economy, coupled with increased imports and consumption in emerging markets like China and India, have helped commodity prices to rebound from their recent low in Q42008. Higher demand, fuelled by tighter supplies and a severe drought in Argentina, which reduced soybean output from 46 to 32 million tonnes, drove the recovery of CPO prices (CIF Rotterdam) in 2009 to US$683 per tonne, from US$503 per tonne in December 2008. Rubber prices refl ected a similar rebound; prompted by lower global production, recovery in global demand and higher mineral oil prices.
INDOAGRI REMAINS ONE OF THE
INDONESIA’S LARGEST PLANTATION
OWNERS WITH A PLANTED OIL PALM
ACREAGE OVER 193,000 HECTARES.
2 0

Rows of seedlings cultivated in our oil palm plantations.
0.00
3.50
3.00
2.00
2.50
1.50
1.00
0.50
U S $ / k g
Rubber Price (RSS 3 SICOM)
Jun
-05
Dec
-05
Jun
-06
Dec
-06
Jun
-07
Dec
-07
Jun
-08
Dec
-08
Jun
-09
Dec
-09
2 1B U I L D I N G S U S T A I N A B L E G R O W T HINDOFOOD AGRI RESOURCES LTD. ANNUAL REPORT 2009
0
1400
1200
800
1000
600
400
200
U S $ / t o n n e
CPO Price (CIF N.W.Europe)
Jun
-05
Dec
-05
Jun
-06
Dec
-06
Jun
-07
Dec
-07
Jun
-08
Dec
-08
Jun
-09
Dec
-09

For the year in review, the plantation division recorded total sales of Rp6,046 billion (S$842million), a 11% decrease against 2008 due to lower average selling prices of CPO, PK and rubber. The decline was partially mitigated by higher CPO and PK sales volume of 4% and 11% respectively, as well as sales of sugar cane and sugar products.
Operating profi t margin, excluding biological asset gains, was lower at 37% compared to 42% in 2008. This was attributed to lower selling prices of plantation crops.
Through the division, the Group harvested 2,613,345 tonnes of nucleus FFB in 2009, a 5% increase over the previous year. The stronger production was driven by higher output in our North Sumatra estates as the trees recover from biological stress in 2008, and higher production in South Sumatra and Kalimantan due to increased mature area and yield improvements.
CPO production increased 7% to 762,570 tonnes on the back of higher FFB processed. Oil extraction rate (OER) remained relatively stable at 22.8%, compared to 22.6% in 2008.
Rubber production improved marginally by 1% from 28,100 tonnes in 2008 to 28,329 tonnes in 2009. The Group also harvested 295,948 tonnes of sugar cane in 2009, as our sugar plantations complete their fi rst year in operation.
As at 31 December 2009, the Group’s oil palm planted area stood at 193,613 hectares, a 10,500-hectare increase over the previous year. Mature oil palm estates span 132,560 hectares, an 8,391-hectare increase over 2008, as young trees begin to bear fruit.
SYNERGIES THROUGH LONSUM The acquisition of Lonsum has enabled the Group to realise a number of operational synergies beyond scale. It has boosted internal CPO supply to our refi neries from 274,000 tonnes in 2007 to 457,000 tonnes in 2009, giving us greater assurance over the quality of raw material used for downstream refi nement. Our research centres pool R&D technology, information from fi eld trials and plantation production data to accelerate our breeding and seed cultivation programmes and to achieve better quality and higher-yielding seed material. Our combined purchases have given us greater economies of scale and higher bargaining power.
FFB production from Lonsum’s Kalimantan estates are now fully processed at our new 45 tonne/hour palm oil mill in East Kalimantan, thereby preserving the freshness of our fruit quality and reducing the costs of transporting our FFB to third party mills located 400 km away. We have added more trucks to our fl eet at Lonsum, as increased in-house transportation allows us greater logistics control and a more economical alternative to outsourcing. We intend to achieve 100% in-house FFB transportation by end-2010.
OPERATIONS REVIEW
0
3000
2000
2500
1500
1000
500
05 06 07 08 09
‘ 0 0 0 m t
PROFORMA PROFORMA ACTUAL ACTUAL ACTUAL
1,295 1,3241,506
2,4962,613
FFB production (nucleus)
0
1000
800
600
400
200
05 06 07 08 09
‘ 0 0 0 m t
PROFORMA PROFORMA ACTUAL ACTUAL ACTUAL
CPO production
299 300384
714 763
2 2
Above 20 Years20%
7-20 Years38%
4-6 Years10%
Immature32%
Oil palm plantation age profi le

We are improving the road infrastructure in our South Sumatra estates, which will signifi cantly enhance the transportation of crops and fertilizer, especially during the rainy season. We are also building new houses in our South Sumatra estates to reduce reliance on contract workers, improve the productivity of our operational staff, and enable them to live together with their families on the plantations.
THE ACQUISITION OF LONSUM HAS
ENABLED INDOAGRI TO ACHIEVE
OPERATIONAL SYNERGIES INCLUDING
INCREASED INTERNAL CPO SUPPLY TO
REFINERIES, R&D, GREATER ECONOMIES
OF SCALE AND HIGHER
BARGAINING POWER.
2010 OUTLOOK Looking ahead, we expect CPO prices to remain volatile in 2010 as they hinge on multiple factors that include global production and consumption rates for vegetable oil, mineral oil prices, robustness of the economy and stability of the US Dollar.
Long-term prospects for the palm oil industry remain positive. The lower cost of producing palm oil will continue to drive its demand as the most widely consumed vegetable oil at 27% compared to soybean at 22% and rapeseed oil at 13%. CPO demand will also be supported by the introduction of government mandates to increase the percentage of biofuel content in conventional transportation fuels, particularly in Europe and South America.
Despite the challenging economic climate, we expect demand for palm oil to remain resilient in 2010. We will continue our strategy to increase our oil palm acreage, and look forward to the targeted completion of two new palm oil mills in 2011. We will also continue to invest in R&D to capture additional value and improve our competitive advantage.
ABOVE: Oil palm seedlings contributing to the lush greenery.
RIGHT: A harvester transporting FFB in a wheelbarrow.
2 3B U I L D I N G S U S T A I N A B L E G R O W T HINDOFOOD AGRI RESOURCES LTD. ANNUAL REPORT 2009

OPERATIONS REVIEW
PLANTATION | Sugar
THE DIVERSIFICATION INTO SUGAR HAS
OFFERED STRATEGIC FIT AND NUMEROUS
COMPETITIVE ADVANTAGES FOR
INDOAGRI.
OVERVIEWIn 2008, IndoAgri diversifi ed into the lucrative industry of sugar cultivation, plantation and production – a decision backed by shortfalls in domestic supply, increasing population growth and the development of processed F&B industries in Indonesia. As net importers of sugar, the government imposes various policies ranging from price regulation to import quotas to protect and promote the domestic sugar industry in Indonesia. In 2009, about 40% of the estimated domestic consumption of 4.9 million tonnes of sugar was imported.
We believe the sugar industry offers both strategic fi t and numerous competitive advantages for the Group. Upstream, we believe we are able to achieve better yields and lower cost through economies of scale and our vast experience in large-scale plantation management. The completion of our modern sugar mill in 3Q2010 will enable us to operate at higher effi ciency levels, with higher extraction, lower wastage and lower processing cost per unit. Additionally, signifi cant savings will be achieved from leveraging Indofood’s distribution network for our end products.
During the year in review, the market witnessed a huge rallying in global sugar prices on the New York Board of Trade, with the price of CSCE No. 11 rising 84% from US$13.59 cent/lb in January to its 28-year high of US$27.45 cent/lb in December. This was triggered by adverse weather and poor harvest conditions in Brazil and India, two of the world’s largest sugar producers, which saw global sugar supply defi cits of approximately 9 million tonnes in 2009.
2 4
0.00
30.00
20.00
25.00
15.00
10.00
5.00
U S c e n t / l b
Sugar Price (CSCE No.11)
Jun
-05
Dec
-05
Jun
-06
Dec
-06
Jun
-07
Dec
-07
Jun
-08
Dec
-08
Jun
-09
Dec
-09

2009 REVIEWThe sugar business made headways in its second year of operation with new plantings and the construction of new milling facilities. While revenue contributions for 2009 were relatively subdued at Rp146 billion, we expect this to increase in 2010 as our increased sugar cane plantings mature and when our new 8,000 tonnes of cane per day (TCD) sugar processing mill in South Sumatra is commissioned in 3Q2010.
The Group achieved a sugar cane planted area of 8,672 hectares as at end-December 2009, an increase of 4,498 hectares from 4,174 hectares as at end-December 2008. Our harvested area of 3,693 hectares yielded 80 tonnes of sugar cane per hectare, producing 295,948 tonnes of sugar cane in 2009.
2010 OUTLOOKMoving forward, we will continue with our sugar planting and expansion plans over the next two years in order to achieve the targeted planted area by end-2011. Our South Sumatra sugar mill construction is on schedule for completion in 3Q2010 and we expect the division to make notable contributions to Group revenue in 2011.
Sugar cane plantation in South Sumatra.
2 5B U I L D I N G S U S T A I N A B L E G R O W T HINDOFOOD AGRI RESOURCES LTD. ANNUAL REPORT 2009

PLANTATION | R&D
OPERATIONS REVIEW
A STRONG RESEARCH FOUNDATION
IS THE FIRST STEP TO IMPROVING
PLANTATION YIELDS.
OVERVIEWUnderlying IndoAgri’s business strategy is a fi rm commitment to research practices that are focused on improving plantation yields and cultivation practices. Through Sumatra Bioscience (SumBio, formerly known as Bah Lias Research Station), an advanced agriculture research centre founded in 1983, and PT SAIN located in Pekanbaru, the Group owns in-house capabilities and a strong R&D heritage in the analysis of soil, plant tissue, oil palm and latex. Our laboratories and comprehensive facilities equip us for cutting-edge research in tissue culture, biotechnology, pathology and entomology.
Through SumBio’s advanced programmes in palm oil seed breeding, it produces up to 25 million superior oil palm seeds per annum. We also operate a research and seed breeding facility in Riau that produces up to 8 million seeds per annum.
The Group’s R&D activities are focused in four key areas:
• Plant breeding: The development of top quality seed and planting material through traditional breeding methods, a diverse germ-plasm base and biotechnology, supported by fi eld trials that test progenies across a range of breeding environments.
• Agronomy: Detailed analyses that provide our estates with optimal recommendations on crop management and planting densities, fertilizer and herbicide usage, as well as predictions on yields and oil extraction rates.
• Crop protection: The development of integrated pest management systems to minimise crop losses and to monitor potential pest and disease outbreaks.
• Data analysis: The analyses of data collected from fi eld trials, as well as information pertaining to crop genetics and estate for future reference.
With innovative plant breeding, agronomy and crop protection, the Group aims to improve yields per hectare while reducing labour costs. We also leverage R&D and seed-breeding programmes to improve production costs, improve environmental sustainability and maximise profi tability in the long run.
2009 REVIEWThe Group reported a decline in the sales volume of oil palm seeds from 18 million seeds in 2008 to 5 million seeds in 2009 due largely to lower demand and a recession-induced reduction in new plantings across the industry. Despite the challenging year, the market for oil palm seedlings showed signs of recovery as orders gained momentum during 4Q2009.
Through SumBio, the Group owns the world’s fi rst patented process for the production of F1 oil palm hybrids. These hybrids, which are produced without any genetic modifi cation, have been patented in selected countries around the world.
2 6
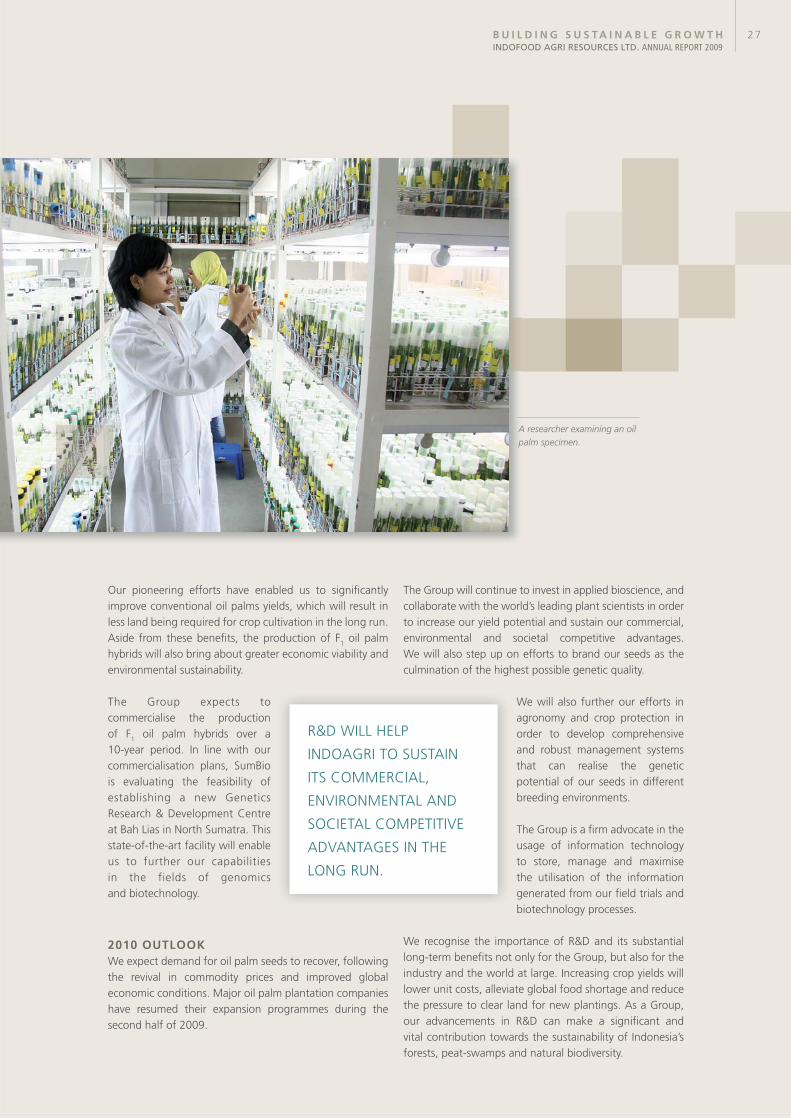
A researcher examining an oil palm specimen.
Our pioneering efforts have enabled us to signifi cantly improve conventional oil palms yields, which will result in less land being required for crop cultivation in the long run. Aside from these benefi ts, the production of F1 oil palm hybrids will also bring about greater economic viability and environmental sustainability.
The Group expects to commercialise the production of F1 oil palm hybrids over a 10-year period. In line with our commercialisation plans, SumBio is evaluating the feasibility of establishing a new Genetics Research & Development Centre at Bah Lias in North Sumatra. This state-of-the-art facility will enable us to further our capabilities in the fields of genomics and biotechnology.
2010 OUTLOOKWe expect demand for oil palm seeds to recover, following the revival in commodity prices and improved global economic conditions. Major oil palm plantation companies have resumed their expansion programmes during the second half of 2009.
The Group will continue to invest in applied bioscience, and collaborate with the world’s leading plant scientists in order to increase our yield potential and sustain our commercial, environmental and societal competitive advantages. We will also step up on efforts to brand our seeds as the culmination of the highest possible genetic quality.
We will also further our efforts in agronomy and crop protection in order to develop comprehensive and robust management systems that can realise the genetic potential of our seeds in different breeding environments.
The Group is a fi rm advocate in the usage of information technology to store, manage and maximise the utilisation of the information generated from our fi eld trials and biotechnology processes.
We recognise the importance of R&D and its substantial long-term benefi ts not only for the Group, but also for the industry and the world at large. Increasing crop yields will lower unit costs, alleviate global food shortage and reduce the pressure to clear land for new plantings. As a Group, our advancements in R&D can make a signifi cant and vital contribution towards the sustainability of Indonesia’s forests, peat-swamps and natural biodiversity.
R&D WILL HELP
INDOAGRI TO SUSTAIN
ITS COMMERCIAL,
ENVIRONMENTAL AND
SOCIETAL COMPETITIVE
ADVANTAGES IN THE
LONG RUN.
2 7B U I L D I N G S U S T A I N A B L E G R O W T HINDOFOOD AGRI RESOURCES LTD. ANNUAL REPORT 2009

COOKING OIL & FATS
OPERATIONS REVIEW
INDOAGRI COMMANDS A LEADING
MARKET SHARE IN INDONESIA FOR
BRANDED COOKING OIL, MARGARINE
AND SHORTENING PRODUCTS.
OVERVIEWThe Cooking Oil and Fats Division manufactures and markets IndoAgri’s downstream products, which include leading brands of cooking oil, margarine and shortening for both exports and domestic consumption. Bimoli, along with its other brands, Happy Salad Oil and Delima, the Group continues to command a leading share in the Indonesian market for branded cooking oils.
Our margarine & shortening products, branded under Simas Palmia, Palmia and Amanda, are also market leaders in the domestic margarine & shortening market. Approximately 75% of our margarine and shortening sales were derived from the domestic market, with the bulk of sales coming from industrial pack margarine and shortening which are supplied to bakeries, snack and biscuit manufacturers.
Supporting our marketing strategy is a comprehensive network of 120 distributors, who deliver our end products to 255,000 retail outlets across the Indonesian archipelago. We also leverage our parent company’s distribution network to supplement our market penetration efforts in Indonesia.
The division operates four refi neries located strategically in major cities across Indonesia: Jakarta, Surabaya, Medan and Bitung. With the target completion of our 420,000 tonnes per year refi nery in Jakarta by end-2010, our total refi ning capacity will achieve 1.4 million tonnes per year.
The Group refi ned 595,000 tonnes of CPO in 2009, of which 457,000 tonnes were supplied by our own plantations. To ensure consistent supplies of high quality CPO and enhance logistics management, we intend to increase internal CPO supplies in 2010.
2009 REVIEWThe division recorded mixed results for its edible oil products in 2009. Strong industrial demand delivered a sales volume of 172,970 tonnes of margarine and shortening products, or an 8% improvement over the previous year. Sales volume of cooking oil declined by 9% to 387,391 tonnes due to:
• A 10% VAT on branded cooking oil products in January 2009, which widened the price gap between branded and unbranded products; and
• An overall shrinkage in the domestic market for branded cooking oil as some consumers switched to unbranded products.
Despite the overall shrinkage in the branded cooking oil market in Indonesia, we retained our market leadership in this segment and strengthened our leading Bimoli brand though TV commercials, which promoted the product as “cooking oil perfection”.
2 8

ABOVE: Margarine being packaged for consumption.
RIGHT: Bimoli Spesial on the conveyor belt.
Margarine sales volume improved on stronger demand for industrial margarine. We also participated in a culinary program with a national TV channel to promote Simas Palmia as a multipurpose margarine. Other activities included the Palmia Baker’s Forum, a baking demonstration conducted in 29 cities across Indonesia, and participation in the Interfood Exhibition, a food and beverage showcase.
The division won a number of awards during the year. Bimoli won the Top Brand award in the cooking oil category from SWA Frontier for the fourth consecutive year, and the Platinum Brand IBBA - SWA MARS award for the sixth consecutive year.
The division reported total sales of Rp5,181 billion in 2009, a 21% decline against 2008 due to lower average selling prices and lower sales volume of cooking oil. Operating profi ts fell 50% to Rp119 billion due to lower gross profi t and higher distribution costs. The division’s profi t margin declined from 3.7% in 2008 to 2.3% in 2009.
2010 OUTLOOK Despite the challenging business conditions, we will continue to review our pricing strategy from time-to-time to maintain our competitiveness in the market. Given the Group’s market leadership, established brands, comprehensive distribution network, strong sales and marketing efforts and expertise, we believe we are well positioned for the challenges ahead.
In the year ahead, our key strategies will be centred on:
• Strengthening of brand identity and brand loyalty through enhanced product packaging and quality
• Rebranding and re-launch of our core brands: Bimoli and Bimoil Spesial
• Focused advertising and promotional activities to raise awareness and brand image
• Deeper penetration of distribution to increase product visibility as well as improved after sales services; and
• Focus on High Class Outlets (HCO) in line with their rapid growth in Indonesia
2 9B U I L D I N G S U S T A I N A B L E G R O W T HINDOFOOD AGRI RESOURCES LTD. ANNUAL REPORT 2009

COMMODITIES
OPERATIONS REVIEW
INDOAGRI OPERATES THREE
COPRA-CRUSHING PLANTS WITH A
COMBINED CAPACITY OF 270,000
TONNES PER ANNUM.
OVERVIEWThe Commodities Division manufactures crude coconut oil (CNO) and other by-products from crushed copra for export to the United States, Europe and Asia. Most of our CNO and derivative products are bought by manufacturing plants producing oleochemicals such as fatty acids and glycerine used in the production of detergents, personal care products, lubricants, solvents and bioplastics, while by-products such as copra pellets are sold as animal feeds in overseas markets.
The division operates three copra-crushing plants located at Bitung in North Sulawesi, Moutong in Central Sulawesi and Tobelo on Halmahera Island, with a combined production capacity of 270,000 tonnes per annum.
2009 REVIEWCommodity traders continued to battle price instabilities in 2009, with CNO prices (CIF Rotterdam) averaging US$726 per tonne or 41% lower than its transacted rate of US$1,224 per tonne in 2008. The division recorded a 49% decline in revenue over the same period last year, due mainly to lower selling prices and lower sales volume of copra-based and palm oil-based products.
Operating losses for the division totalled Rp47 billion in 2009, largely attributable to lower revenue and negative effects emerging from a stronger Rupiah against US Dollars, given that the Group does not hedge the foreign exchange fl uctuations arising from its sales, which are conducted in US currency, and its raw material purchases, which are transacted in Rupiah.
2010 OUTLOOKBracing for further uncertainties, we will continue to secure back-to-back contracts from both our suppliers and customers to lower the impact of price volatility. We will also step up on management strategies for currency risks by exploring various options to cushion our currency exposure.
Other key initiatives for the division include increasing the utilisation of our copra crushing facilities, exploring new export opportunities through closer analysis of potential markets and increasing the level of marketing in those markets.
3 0

MANUFACTURING PROCESS
Fresh Palm Fruit Bunches
3 1B U I L D I N G S U S T A I N A B L E G R O W T HINDOFOOD AGRI RESOURCES LTD. ANNUAL REPORT 2009
Milling
Crude Palm Oil
Refining
RBD Palm Oil
Fractionating & Filtration
RBD Palm Stearin Lauric Oil
Margarine Plant
Blending
Mixing Tank
Chilling Chilling
Packaging Packaging
Mixing Tank
Blending
RBD Palm Olein
Shortening Margarine
Palm Fatty Acid Distillate Crude Palm Kernel Oil
Palm Kernel Meal Crushing
Palm Kernel
Empty Fruit Bunches and By Products
Nitrogen gas
Water & Salt
Flavouring &Vitamins
Fresh Palm Fruit Bunches
Shorteningg
Cooking OilCooking Oil
Margarine
Packaging
ENVIRONMENT & CORPORATE SOCIAL RESPONSIBILITY
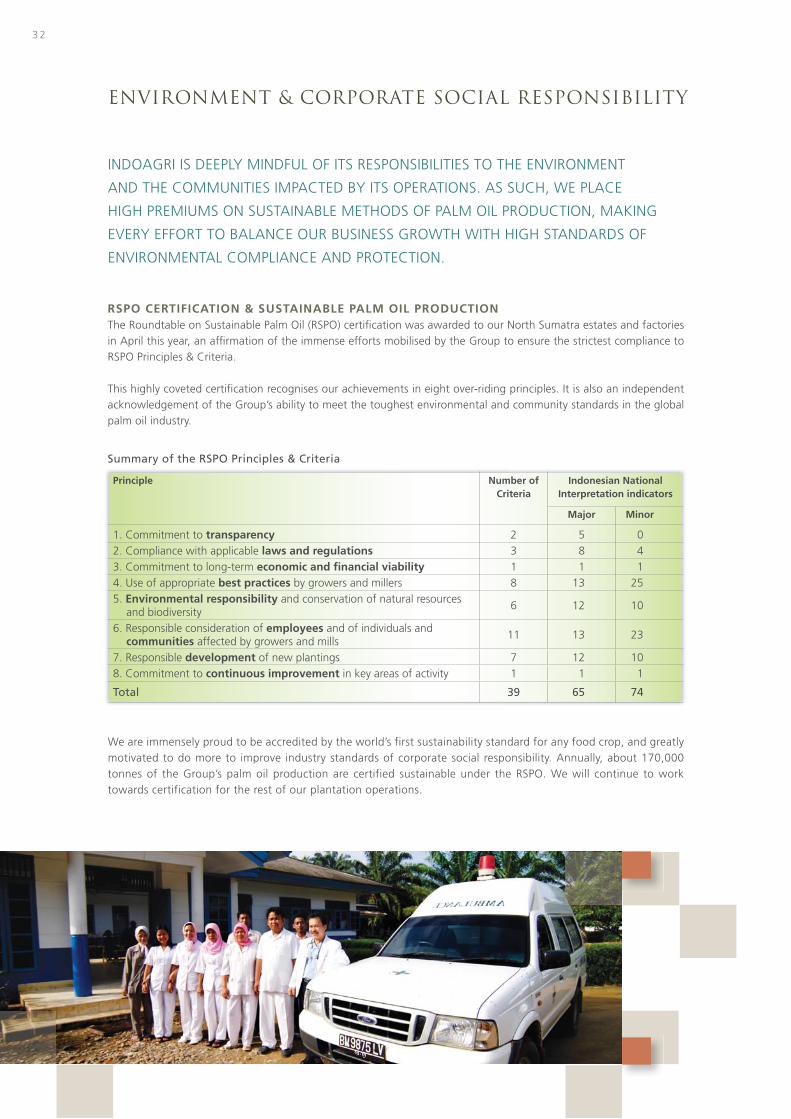
RSPO CERTIFICATION & SUSTAINABLE PALM OIL PRODUCTIONThe Roundtable on Sustainable Palm Oil (RSPO) certifi cation was awarded to our North Sumatra estates and factories in April this year, an affi rmation of the immense efforts mobilised by the Group to ensure the strictest compliance to RSPO Principles & Criteria.
This highly coveted certifi cation recognises our achievements in eight over-riding principles. It is also an independent acknowledgement of the Group’s ability to meet the toughest environmental and community standards in the global palm oil industry.
INDOAGRI IS DEEPLY MINDFUL OF ITS RESPONSIBILITIES TO THE ENVIRONMENT
AND THE COMMUNITIES IMPACTED BY ITS OPERATIONS. AS SUCH, WE PLACE
HIGH PREMIUMS ON SUSTAINABLE METHODS OF PALM OIL PRODUCTION, MAKING
EVERY EFFORT TO BALANCE OUR BUSINESS GROWTH WITH HIGH STANDARDS OF
ENVIRONMENTAL COMPLIANCE AND PROTECTION.
Summary of the RSPO Principles & Criteria
We are immensely proud to be accredited by the world’s first sustainability standard for any food crop, and greatly motivated to do more to improve industry standards of corporate social responsibility. Annually, about 170,000 tonnes of the Group’s palm oil production are certified sustainable under the RSPO. We will continue to work towards certification for the rest of our plantation operations.
3 2
Principle Number of Criteria
Indonesian National Interpretation indicators
Major Minor
1. Commitment to transparency 2 5 02. Compliance with applicable laws and regulations 3 8 43. Commitment to long-term economic and fi nancial viability 1 1 14. Use of appropriate best practices by growers and millers 8 13 255. Environmental responsibility and conservation of natural resources
and biodiversity6 12 10
6. Responsible consideration of employees and of individuals and communities affected by growers and mills
11 13 23
7. Responsible development of new plantings 7 12 108. Commitment to continuous improvement in key areas of activity 1 1 1
Total 39 65 74

As part of efforts to further our cause, the Group’s main operating subsidiaries, PT SIMP and Lonsum, continue to serve as members of the RSPO, helping the RSPO to promote the growth and use of sustainable oil palm products through credible global standards and dialogue with stakeholders in the supply chain.
The Group is also a founding member of the Indonesian National Interpretation Working Group (INA-NIWG), which formulates the interpretation of RSPO Principles & Criteria within the context of the laws and regulations of Indonesia.
ENVIRONMENTALLY FRIENDLY AGRICULTURAL PRACTICESThe Group believes that every conscientious effort can make a positive difference to long-term sustainability. During the year in review, we continued to implement various sustainable agricultural practices across our plantation estates and processing plants.
We adopt a zero burning policy for the clearing of plantation land. Across our plantation operations, fully mechanical methods are deployed for land clearing and replanting – whether to fell trees or to stack them into planting rows. Wherever possible, we encourage the
practice of non-polluting techniques that minimise global warming and preserve the physical properties of soil.
During plantation expansion, we emphasise the management and monitoring of High Conservation Value (HCV) forests in order to protect these areas. Our efforts include the careful mapping of designated HCV zones, monitoring for signs of erosion and training programmes to educate our staff in the identifi cation of various fl ora and fauna.
We have a scheme to recycle all solid and liquid by-products (empty fruit bunch, decanter solid, mill effl uent) at our palm oil mills, reusing them in the fi eld as mulch/irrigation water and fertilizer substitutes. As a result, the use of inorganic fertilizers is greatly reduced.
Since 1997, the innovative use of barn owls has helped to combat the prevalence of rats in our plantations. While traditional pest control methods involving anti-coagulant rodenticides, herbicides and insecticides are effective, creating a natural habitat that favours the rat-hunting instincts of barn owls has enabled us to minimise the release of harmful chemicals into our ecosystem.
A FFB harvestor.
3 3B U I L D I N G S U S T A I N A B L E G R O W T HINDOFOOD AGRI RESOURCES LTD. ANNUAL REPORT 2009

ENVIRONMENT & CORPORATE SOCIAL RESPONSIBILITY
LEVERAGING TECHNOLOGICAL ADVANCEMENTSConcurrently, the Group leverages its strengths in R&D to push the frontiers of environmental sustainability. In particular, we have paid special attention to the study of genomics, tissue culture research and seed breeding to maximise plantation yields in order to increase the productivity of our land bank and resources.
As a result of these technological achievements, the Group successfully registered a patented process for the production of high-yielding F1 oil palm hybrids. The hybrids will alleviate the pressure on usage and expansion of land for palm oil cultivation to satisfy growing global demands.
The Group is currently embarking on plans to commercialise the production of its patented F1 oil palm hybrids. We expect these efforts to bring positive impact to the environment in the next few years.
REACHING OUT TO OUR COMMUNITIESAs one of Indonesia’s largest plantation owners, communities are important stakeholders in our business. In line with the Group’s CSR efforts, we strive to establish mutually benefi cial relationships with these stakeholders through a diversity of community development initiatives.
• Employment: The Group creates jobs for residents in the local and plasma community through a range of direct and indirect employment opportunities. As at 31 December 2009, the Group employs a direct workforce of 29,401 in various capacities.
However, our footprint extends much further than our
29,401 employees, as their families, local communities, plasma farmers, contractors and suppliers all share in the economic benefi t of our operations.
• Education: We continue to promote literacy and a secure future for the next generation by making education accessible through the establishment of schools and scholarships. As at 31 December 2009, the Group sponsors a total of 18 schools, providing free education at elementary and junior high level, and highly subsidised fees at the senior high levels. These efforts have benefi ted close to 8,000 of our employee’s children.
We also contribute learning aids and teaching tools such as textbooks, furniture, science labs and computers for the schools, as well as salaries paid to their teachers and administrative staff.
In 2009, we were extremely heartened when one of our elementary schools was voted the best elementary school, while one of our junior high schools emerged among the top-10 schools in their respective regencies.
3 4

• Health: The health of our employees and their families is a responsibility we take very seriously. Local health clinics and hospitals are often too far away from our plantations for effective medical care. Therefore, we provide public health infrastructure by building medical clinics and emergency care units that extend their services to surrounding communities.
We also organise blood donation drives, promote immunisation programmes and carry out regular fogging to destroy mosquito-breeding areas.
• Infrastructure/Public Facilities: We build and repair roads/bridges to improve transportation access. We also facilitate the construction of public installations for telephone networks, power and water supply.
• Religious: We participate in local customs and contribute to the building and repair of religious infrastructures such as mosques and churches. We also provide religious teachers and distribute Lebaran and Christmas packages to less advantaged families.
• Sports & Youth, Arts & Culture: We contribute facilities for sports and recreation, and organise and/or sponsor local tournaments, musical concerts, cultural activities and religious events to encourage community bonding and team spirit.
• Local Business Development: We support the development of small businesses and offer incentive programmes for local trades such as goat breeding and pallet production.
The Group fully appreciates its symbiotic relationship with its communities and the environment. We remain fi rmly committed to responsible agribusiness practices and sustainable operations, and believe this can be achieved only if our communities grow and develop in tandem with us. As we chart sustainable growth, we will continue to engage and bring value to our community stakeholders.
Our educational programmes promote literacy and a secure future for the next generation.
3 5B U I L D I N G S U S T A I N A B L E G R O W T HINDOFOOD AGRI RESOURCES LTD. ANNUAL REPORT 2009

BOARD OF DIRECTORS
Mr Lee Kwong Foo Edward Chairman and Lead Independent Director
Mr Lee spent 36 years in the Singapore Administrative Service (Foreign Service Branch), during which time he has served as Singapore’s High Commissioner in Brunei Darussalem (1984 to 1990), Ambassador to the Philippines (1990 to 1993) and Ambassador to Indonesia (1994 to June 2006).
Mr Lee was awarded the Public Administration Medal (Silver) in 1996, the Long Service Medal in 1997, the Public Administration Medal (Gold) in 1998 and the Meritorious Service Medal in 2006 by the Singapore Government. He was also awarded the Order of Sikatuna, Rank of Datu (Grand Cross) by the Philippine government in 1993. In 2007, the Indonesian Government awarded him the highest civilian honour, the Bintang Jasa Utama (First Class Order of Services).
Mr Lee holds a Masters of Arts from Cornell University and is the Chief Executive of PT Ekalumintas, an investment consultancy fi rm in Jakarta.
Mr Mark WakefordChief Executive Offi cer and Executive Director
Mr Wakeford is currently the President Director of PT Salim Ivomas Pratama and a director of PT Perusahaan Perkebunan London Sumatra Indonesia Tbk (Lonsum). He started his career with Kingston Smith & Co, a fi rm of Chartered Accountants in London, England. Mr. Wakeford has been in the plantation industry since 1993, working with plantation companies in Indonesia, Papua New Guinea, Soloman Islands and Thailand. He started his plantation career as the Finance Director of Lonsum in 1993, based in Indonesia, before moving to Pacifi c Rim Plantations Limited (PROPL) as the CFO from 1995 to 1999, based in Papua New Guinea. In 1999, Mr. Wakeford became CEO and Executive Director of PROPL. PROPL was sold to Cargill in 2005, and Mr. Wakeford spent one year with Cargill, prior to joining the Company in January 2007.
Mr. Wakeford trained and qualifi ed as a Chartered Accountant in London, England. He also attended the Senior Executive Program at the London Business School.
3 6

Mr Moleonoto Tjang Executive Director and Head of Finance and Corporate Services
Mr Tjang is currently a Vice President Director of PT Salim Ivomas Pratama and a director of PT Perusahaan Perkebunan London Sumatra Indonesia Tbk. He started his career in 1984 with Drs Hans Kartikahadi & Co., a public accounting fi rm in Jakarta. In 1990, he joined the Salim Plantations Group as Manager and became Assistant Vice President (Commercial and Accounting) in 1993. In 1996, he was appointed as Vice President (Finance) of the Salim Plantations Group. He was made CFO of the PT ISM Group’s Plantations Division in 2001 and subsequently the Deputy Head of Corporate Treasury of the PT ISM Group in 2003.
He has a Bachelor of Accountancy degree from the University of Tarumanagara, a degree in Bachelor of Management and a Master of Science in Administration & Business Policy from
the University of Indonesia. Mr Tjang is also a registered accountant in Indonesia.
Mr Gunadi Executive Director and Head of Plantation Operations
Mr Gunadi is currently a director PT Salim Ivomas Pratama. Mr Gunadi started his career in 1977 with Drs Hans Kartikahadi & Co. , a public accounting fi rm in Jakarta. He was with PT Besuki Indah Electric Industry (Luxor), Jakarta in 1979 as Finance Manager before joining PT Lippo Mulia Jakarta in 1980 as Finance and Administration Manager.
From 1981 to 1991, Mr Gunadi was with PT Broco, Jakarta, as Group Finance Director. In 1991, Mr Gunadi joined the Salim Plantations Group (which was subsequently acquired by PT ISM) as Senior Vice President (Finance). In 2004, he was appointed to the position of Chief Operating Offi cer of PT SIMP.
Mr Gunadi has a Bachelor of Accountancy degree from University of Indonesia.
Mr Suaimi SuriadyExecutive Director and Head of Refi nery and Commodity Division
Mr Suriady started his career with an automotive battery distributor, PT Menara Alam Teknik of Astra group and moved on to consumer goods manufacturer, Konica Film and Paper, in 1991. He joined PT Indofood Fritolay Makmur, a JV between Indofood group and Pepsi International, as National Sales Manager in 1994 and was promoted to Sales and Marketing Manager in 1997. Before his appointment as President Director in PT Indofood Fritolay Makmur in 2002, he worked as the Branch Manager of the Noodle Division of PT Indofood Sukses Makmur Tbk from Jan 2000 to April 2002.
Mr Suaimi has a MBA degree from De Montfort University, United Kingdom.
3 7B U I L D I N G S U S T A I N A B L E G R O W T HINDOFOOD AGRI RESOURCES LTD. ANNUAL REPORT 2009

BOARD OF DIRECTORS
Mr Tjhie Tje Fie Non-executive Director
Mr Tjhie is currently the director of PT Indofood Sukses Makmur Tbk and PT Indofood CBP Sukses Makmur, as well as the Head of Treasury Division of these companies. In addition, he is currently vice President Director of PT Salim Ivomas Pratama and a director of PT Perusahaan Perkebunan London Sumatra Indonesia Tbk. Previously, he was director of PT Indomiwon Citra Inti and senior executive of PT Kitadin Coal Mining.
Mr Tjhie was awarded a Bachelor’s degree in Accountancy from the Perbanas School of Economics.
Mr Axton SalimNon-Executive Director
Mr Axton is currently the director of PT IndoFood Sukses Makmur Tbk and PT Indofood CBP Sukses Makmur. In addition, he is currently a commissioner of PT Perusahaan Perkebunan London Sumatra Indonesia Tbk.
Mr Axton has a Degree in Bachelor of Science, Business Administration from University of Colorado.
Mr Lim Hock San Independent Director
Mr Lim is presently the President and CEO of United Industrial Corporation Limited and Singapore Land Limited. He is also the Non-executive Chairman and Independent Director of Gallant Venture Ltd. Mr Lim started his career in 1966 with the then Inland Revenue Department of Singapore. He became an Accountant at Mobil Oil Malaya Sdn Bhd in 1967 before joining the Port of Singapore Authority in 1968, where he served in various management positions. From 1975 to 1992, he was with the Civil Aviation Authority of Singapore and fi nally promoted to the position of the Director-General. He has a Bachelor of Accountancy degree from the then University of Singapore, a Master of Science (Management) degree from the Massachusetts Institute of Technology and attended the Advanced Management Program at Harvard Business School. He is a Fellow of The Chartered Institute of Management Accountants (UK) and a Fellow and past President of the Institute of Certifi ed Public Accountants of Singapore. He is also a recipient of the Singapore Government Meritorious Service Medal, the Public Administration Medal (Gold) and the Public Service Medal.
3 8

Mr Hendra Susanto Independent Director
Mr Susanto began his career with the Standard Chartered Bank as an Account Relationship Manager of the Corporate Banking division in 1990. He joined PT BNP Lippo Leasing in 1993 as the Head of the Corporate Marketing division. In 1996, he joined PT ING Indonesia Bank as Vice President in the Project and Structured Finance division and was subsequently promoted to Director in the Wholesale Banking division of the bank. Mr Susanto also acted as the Chief Representative of ING Bank N.V. in Indonesia until 2005.
Mr Susanto has a Bachelor of Computer Science degree and a Master of Commerce degree from the University of New South Wales, Australia.
Mr Goh Kian Chee Independent Director
Mr Goh is presently the CFO of National University of Singapore, Centre For The Arts (NUS). He is also an independent director of AsiaMedic Limited, in which the Salim Group has a shareholding interest. Mr Goh started his career in 1979 as an audit trainee with Goldblatt & Co (UK). He joined American International Assurance Pte Ltd in 1981 as an Accounting Supervisor. In 1982, he became a Regional Internal Auditor in Mobil Oil Singapore Pte Ltd and rose to the position of Regional Credit and Insurance Manager in 1987. In 1990, he joined Mobil Petrochemicals International Ltd where he served as Regional Accounting Manager and later, as the Financial Controller of the Asia Pacifi c region. Before his present position in NUS, Mr Goh was the Regional Vice President & Controller as well as an Executive Director of John Hancock International Pte Ltd.
Mr Goh has a Bachelor of Arts (Hons) degree in Accounting and Economics from Middlesex University (London, United Kingdom).
3 9B U I L D I N G S U S T A I N A B L E G R O W T HINDOFOOD AGRI RESOURCES LTD. ANNUAL REPORT 2009

CORPORATE INFORMATION
EXECUTIVE COMMITTEEMark Wakeford (Chairman)
Tjhie Tje Fie
Moleonoto Tjang
Gunadi
Suaimi Suriady
AUDIT COMMITTEEGoh Kian Chee (Chairman)
Lim Hock San
Hendra Susanto
NOMINATING COMMITTEELee Kwong Foo Edward (Chairman)
Tjhie Tje Fie
Lim Hock San
Hendra Susanto
REMUNERATION COMMITTEELim Hock San (Chairman)
Tjhie Tje Fie
Goh Kian Chee
REGISTRARBoardroom Corporate &
Advisory Services Pte. Ltd.
50 Raffl es Place
Singapore Land Tower #32-01,
Singapore 048623
REGISTERED OFFICE8 Eu Tong Sen Street
#16-96/97 The Central
Singapore 059818
Chairman and Lead Independent Director Lee Kwong Foo Edward
Chief Executive Offi cer and Executive Director Mark Wakeford
Executive Director and Head of Finance and Corporate Services
Moleonoto Tjang
Executive Director and Head of Plantation Operations
Gunadi
Executive Director and Head of Refi nery and Commodity
Suaimi Suriady
Non-Executive Director Tjhie Tje Fie
Non-Executive Director Axton Salim
Independent Director Lim Hock San
Independent Director Goh Kian Chee
Independent Director Hendra Susanto
DIRECTORS
COMPANY SECRETARIESLee Siew Jee, Jennifer
Mak Mei Yook
AUDITORSErnst & Young LLP
One Raffl es Quay
North Tower, Level 18
Singapore 048583
AUDIT PARTNERVincent Toong Weng Sum (appointed 20 April 2007)
4 0

CORPORATE GOVERNANCE
THE BOARD AND MANAGEMENT OF INDOFOOD AGRI RESOURCES LTD. (THE “COMPANY”)
ARE COMMITTED TO CONTINUALLY ENHANCING THE STANDARD OF CORPORATE
GOVERNANCE PRINCIPLES AND PROCESSES IN MANAGING THE BUSINESS AND AFFAIRS,
SO AS TO IMPROVE THE PERFORMANCE, ACCOUNTABILITY, AND TRANSPARENCY OF
THE COMPANY.
This Corporate Governance Report sets out the Company’s corporate governance framework and practices, with specific reference to the principles and guidelines of the Code of Corporate Governance issued by the Ministry of Finance in July 2005 (the “Code”).
During 2009, the Company instituted the Corporate Enterprise Risk Management (ERM) function to enhance its risk management capabilities. This is explained in more details under the ERM section in Page 47 to 49.
BOARD MATTERS
The Board’s Conduct of its Affairs (Principle 1)
The Board comprises Directors with a wide range of skills and experience in the fields of operations management, banking, finance, accounting, industry knowledge and knowledge of risk management. The Board considers that its Directors posses the necessary competencies to lead and govern the Company effectively. Each member of the Board will hold office pursuant to the provisions of the Articles and thereafter, shall be eligible for re-election unless disqualified from holding office.
The Board has overall responsibility for the corporate governance of the Company. Apart from its statutory responsibilities, the Board is responsible for:-(1) reviewing the financial performance and condition of the Group;(2) approving the Group’s strategic plans, key operational initiatives, major investment and funding decisions; (3) identifying principal risks of the Group’s business and implementing systems to manage the risks; and
set the Company’s values and standards, continually to make them exemplary and the highest, and ensure thatobligations to shareholders and other stakeholder are understood and met.
All Directors exercise independent judgement and make decisions objectively in the best interest of the Company.
The Board is assisted by various Board Committees, including Executive Committee, Audit Committee, Nominating Committee and the Remuneration Committee with clearly defined terms of reference. The term of reference set out the duties, authority and accountabilities of each committee.
The Corporate Governance Structure is as follows:
Remuneration Committee
Nominating Committee
Shareholders
Board of Directors
Executive Committee (“EXCO”)
Enterprise Risk Managment
Audit Committee
Internal Audit
4 1B U I L D I N G S U S T A I N A B L E G R O W T HINDOFOOD AGRI RESOURCES LTD. ANNUAL REPORT 2009

CORPORATE GOVERNANCE
Board Composition (Principle 2)
As of 31 March 2010, the Board comprises of ten Directors, of whom four are Executive Directors, two are Non-executives and four are Independent Directors.
Name
Board of Directors ExecutiveCommittee
AuditCommittee
NominatingCommittee
Remuneration CommitteeStatus Position
Lee Kwong Foo, Edward Lead Independent Chairman Chairman
Mark Wakeford Executive Member Chairman
Moleonoto Tjang Executive Member Member
Gunadi Executive Member Member
Suaimi Suriady Executive Member Member
Tjhie Tje Fie Non-executive Member Member Member Member
Axton Salim Non-executive Member
Lim Hock San Independent Member Member Member Chairman
Goh Kian Chee Independent Member Chairman Member
Hendra Susanto Independent Member Member Member
The Executive Committee (“Exco”) comprises Mr Mark Wakeford, Mr Tjhie Tje Fie, Mr Suaimi Suriady, Mr Gunadi and Mr Moleonoto Tjang. Mr Wakeford is the Chairman of the Exco. The Board delegates the Exco certain discretionary limits and authority for business development, investment/divestment activities, capital expenditure, finance/treasury, budgeting and human resource management, drawing up the Group’s annual budget and business plan for the Board’s approval, supervising the implementation of business strategies as approved in the annual budget and business plan, implementing appropriate systems of internal accounting and other controls, instituting a risk management framework and monitoring for compliance, adopting suitably competitive human resource practices and compensation policies, and ensuring that the Group operates within budget.
Regular meetings are held to deliberate the strategic policies of the Company including significant acquisitions and disposals, review and approve annual budgets, review the performance of the business and approve the release to the public of periodic financial results. In the event Directors are unable to attend Board meetings because of overseas commitments, they may still participate via telephone or any other forms of communication facilities.
The number of meetings and attendance by Board members are set out in the table below:
BoardAudit
CommitteeNominatingCommittee
Remuneration Committee
Number of meetings held during the financial year ended 31 December 2009
6 7 1 2
Lee Kwong Foo, Edward 6/6 n/a 1/1 n/a
Mark Wakeford 6/6 n/a n/a n/a
Moleonoto Tjang 6/6 n/a n/a n/a
Gunadi 4/6 n/a n/a n/a
Suaimi Suriady 5/6 n/a n/a n/a
Tjhie Tje Fie 4/6 n/a 1/1 2/2
Axton Salim 5/6 n/a n/a n/a
Lim Hock San 5/6 5/7 1/1 2/2
Goh Kian Chee 6/6 7/7 n/a 2/2
Hendra Susanto 6/6 7/7 1/1 n/a
Chairmann/a – “not applicable”
4 2

Chairman and Chief Executive Officer (Principle 3)
The roles of the Chairman and Chief Executive Officer (“CEO”) are separate persons with their own areas of responsibilities and accountabilities to ensure an appropriate balance of power and independency. The office of the Chairman of the Company is assumed by Mr Edward Lee, who is also the Lead Independent Director. As the Chairman, Mr Edward Lee bears responsibility for the working of the Board and reviewing the effectiveness of the governance process of the Board. The Chairman plays an important role in fostering constructive dialogue between shareholders, the Board and management at the AGM and other shareholder meetings.
The office of CEO is assumed by Mr Mark Wakeford. As the CEO, Mr Wakeford’s responsibilities include the charting and reviewing of corporate directions and strategies, which cover areas of marketing and strategic alliances. He is responsible for providing the Company with strong leadership and vision. The CEO and the Exco are responsible for day-to-day operation and management of the business.
Board Membership and Performance (Principles 4 and 5)
The Nominating Committee (“NC”) of the Company is chaired by Mr Edward Lee, the Chairman of the Board and the Lead Independent Director, with Mr Tjhie Tje Fie, Mr Hendra Susanto and Mr Lim Hock San as members.
The NC terms and reference were adopted from the Code and include the following duties and functions:-
(1) make recommendations to the Board on all board appointments and re-nomination having regard to the Director’s contribution and performance;
(2) ensure that all Directors submit themselves for re-nomination and re-election at regular intervals and at least once in every three years;
(3) determine annually whether a Director is independent, guided by guidelines in the Code;(4) decide if a Director is able and has adequately carried out his duties as a Director of the Company where he has
multiple board representations; and (5) decide how the Board’s performance may be evaluated and propose objective performance criteria.
Each year, the Directors are requested to complete appraisal forms to access the overall effectiveness of the Board. The NC will assess and discuss the performance of the Board as a whole and will ascertain key areas for improvement and requires follow-up actions. The results of the evaluation, including comments and recommendations from the Board members, will be presented by the NC Chairman to the Board with a view to enhance the effectiveness of the Board as a whole.
Access to Information (Principle 6)
Prior to each Board meeting, Management provides the Board with timely and complete information to enable them to be fully cognizant of the decisions and actions of the Company’s executive management and to discharge their duties effectively.
The Directors have separate and independent access to the Company Secretaries. The Company Secretaries attend the Board and committee meetings to ensure that Board procedures are followed and applicable rules and regulations are complied with.
Senior members of the management are available to provide briefings to the Directors or presentation at the Board Meetings, or by external consultants engaged on specific projects.
4 3B U I L D I N G S U S T A I N A B L E G R O W T HINDOFOOD AGRI RESOURCES LTD. ANNUAL REPORT 2009

CORPORATE GOVERNANCE
4 4
REMUNERATION MATTERS (Principles 7, 8 and 9)
Procedures in Developing Remuneration Policies
The Remuneration Committee (“RC”) of the Company is chaired by Mr Lim Hock San, an Independent Director, with Mr Tjhie Tje Fie and Mr Goh Kian Chee as members.
The role of the RC is to review and approve the remuneration package and terms of employment of the Company’s Directors and key executives who are connected and deemed to be Substantial Shareholders of the Company.
In its review and approval of the recommendations on remuneration policies and packages for the Company Directors, the RC will cover all aspects of remuneration including but not limited to Directors’ fees, salaries, allowances, bonuses, share options and benefits-in-kind. The RC’s recommendations will be made in consultation with the CEO and submitted for endorsement by the entire Board. Payments of Directors’ fees are subject to shareholders’ approval at the AGM.
RC members will abstain from deliberations in respect of their own remuneration and the RC is also empowered to review human resource management policies of the Group.
The remuneration policy of the Group will seek, inter alia, to align the interests of employees with the Group, to reward and encourage performance based on its core values and to ensure that remuneration is commercially competitive to attract and retain talent. Proposed Directors’ fees will be submitted as a lump sum for shareholders’ approval in general meeting and the sum is divided amongst the Directors with those having additional responsibilities as chairman or members of Board Committees receiving a higher portion of the approved sum.
Disclosure on Remunerations
The remunerations of the Directors and Key Executives, in the bands of S$250,000, for the financial year ended 31 December 2009 are set out in the table below. The remunerations of the Executive Director and the Key Executive contain a component that is performance related and linked to the consolidated results of the Group.
Name of Directors/Key Executives and Remuneration Bands
Base/FixedSalary
%Bonus/ Benefits
%
DirectorsFee%
Share Options %
Directors of the Company
S$750,000 to S$1,000,000
Mark Wakeford 84 16 – –
Moleonoto Tjang 25 75 – –
S$500,000 to S$750,000
Gunadi 33 67 – –
Below S$250,000
Lee Kwong Foo, Edward – – 100 –
Lim Hock San – – 100 –
Goh Kian Chee – – 100 –
Hendra Susanto – – 100 –
Tjhie Tje Fie (1) – – – –
Axton Salim (1) – – – –
Suaimi Suriady (1) – – – –

4 5B U I L D I N G S U S T A I N A B L E G R O W T HINDOFOOD AGRI RESOURCES LTD. ANNUAL REPORT 2009
Name of Directors/Key Executives and Remuneration Bands
Base/FixedSalary
%Bonus/ Benefits
%
DirectorsFee%
Share Options %
Key Executives of the Group
Between S$500,000 to S$750,000
Wilihar Tamba(Chief Operating Officer - Plantation)
36 64 – –
Between S$250,000 to S$500,000
Rolly B MendozaVice President Controller
48 52 – –
C.Y.O. Sorongan Senior Technical Advisor Engineering
44 56
Below S$250,000
Mak Mei YookChief Financial Officer
83 17 – –
Tan Agustinus DermawanGroup Controller
38 62 – –
(1) Remunerations were paid by the parent company, PT Indofood Sukses Makmur Tbk or other group of companies.
There was no employee in the Group who was an immediate family member of a Director and/or a Substantial Shareholder whose remuneration exceeded S$150,000 during financial year ended 31 December 2009.
Other Remuneration Matters
The Company’s Share Option Scheme 2002 was approved by the former Board and shareholders of the Company at an Extraordinary General Meeting held on 19 June 2002. No option was granted during the financial year ended 31 December 2009. The Board will be looking into whether a new ESOS should be implemented.

CORPORATE GOVERNANCE
4 6
ACCOUNTABILITY AND AUDIT (Principles 10, 11, 12 and 13)
Accountability
The Board is accountable to the shareholders and is mindful of its obligations to furnish timely information and to ensure full disclosure of material information to shareholders in compliance with statutory requirements and the Listing Manual of the SGX-ST.
Audit Committee (“AC”)
The AC of the Company comprises three independent Directors, including the Chairman. The AC is chaired by Mr Goh Kian Chee with Mr Lim Hock San and Mr Hendra Susanto as members. A majority of the AC members, including the AC Chairman, have expertise or experience in financial management and are qualified to discharge the AC’s responsibilities.
The AC has the following functions:-
(1) review with the external auditors the audit plan, their evaluation of the system of internal accounting controls, their audit report, their management letter and the management’s response;
(2) review the quarterly, half-yearly and annual financial statements before submission to the Board for approval, focusing on changes in accounting policies and practices, major risk areas, significant adjustments resulting from the audit, the going concern statement, compliance with applicable accounting standards and stock exchange and statutory/ regulatory requirements;
(3) review the effectiveness and adequacy of the Group’s internal financial controls, operational and compliance controls and procedures, risk management policies and systems and co-ordination between the external auditors and the management, review the assistance given by management to the auditors and discuss problems and concerns, if any, arising from the interim and final audits, and any matters which the auditors may wish to discuss (in the absence of management where necessary);
(4) review and discuss with the external auditors any suspected fraud or irregularity, or suspected infringement of any relevant laws, rules or regulations, which has or is likely to have a material impact on the Company’s operating results or financial position, and the management’s response;
(5) consider the appointment or re-appointment of the external auditors, the audit fee, and matters relating to the resignation or dismissal of the auditors;
(6) review Interested Person Transactions;
(7) review the whistle-blower arrangements instituted by the group through which staff may in confidence, raise concerns and possible improprieties in matters of financial or other matters.
(8) review the Group’s ERM reports.
(9) undertake such other reviews and projects as may be requested by the Board and report to the Board its findings from time to time on matters arising and requiring the attention of the AC; and
(10) generally undertake such other functions and duties as may be required by statute or the Listing Manual, and by such amendments made thereto from time to time.
External Auditors
The external auditor assists the AC in driving risk management activities and the Board in fulfilling its overall responsibilities relating to compliance risk concerns and systems of internal controls.
The AC recommends to the Board the appointment, re-appointment and removal of the external auditors, and approves the remuneration and terms of engagement of the external auditors.
The AC reviews the scope and results of audit work carried out by external auditors and independence of the external auditors annually. The AC met with the external auditors 4 times a year including once without the presence of management.

4 7B U I L D I N G S U S T A I N A B L E G R O W T HINDOFOOD AGRI RESOURCES LTD. ANNUAL REPORT 2009
The AC, having reviewed the range and value of the non-audit services performed during the financial year by the external auditors, Ernst & Young LLP, was satisfied that the independence of the external auditors has not been impaired by the provision of those services. The AC recommended that Ernst & Young LLP be nominated for re-appointment as the external auditors at the forthcoming AGM.
Internal Audit
The Group has an Internal Audit Department (IAD) that is independent of the activities it audits. The IAD plans its internal audit schedules in consultation with Management and submits its plan to the AC for approval. The Head of Internal Audit reports directly to the Chairman of the Audit Committee on the internal audit matters.
The duties and responsibilities of the IAD with regard to risk management and internal controls are summarized below:
(1) review the risk profile of the Company;
(2) identify and make recommendations to eliminate or control risks to improve the risk profile;
(3) recommend risk parameters within which the Company should operate;
(4) review risk mitigation efforts and its cost;
(5) monitor the implementation of the mitigation efforts and risk parameters
(6) establish and maintain a risk reporting and risk monitoring framework
IAD operates within the framework set out in the Internal Audit Charter and Code of Ethics which is approved by the Management and the AC. It implements a systematic, disciplined approach to evaluate and improve the effectiveness of risk management, controls and governance processes. The IA work plan is established independent of management which is also approved by the AC.
The Audit Committee, with the assistance of internal audit, reviews the adequacy and effectiveness of the system of internal controls of the Group on an on-going basis.
The Group also engages Deloitte Touche Tohmatsu (Deloitte), from time to time, on an assignment basis to perform the internal controls system review. Deloitte has a direct reporting line to the Audit Committee.
Enterprise Risk Management (“ERM”)
In line with its vision of becoming a leading integrated Agribusiness group of companies, and as part of its strong commitment to promoting good corporate governance in all aspects of its businesses and operations, the Group recognizes that prudent risk management practices must be in place to ensure healthy and sustainable business growth amidst the ever growing challenges and uncertainties that it is facing in a tough and competitive business environment.
In May 2009, the Group established its ERM Unit with the primary objective of promoting more systematic, integrated and well-coordinated risk management strategies and approach across all operating and functional units within Group. The ERM Unit, which reports directly to the Exco and the AC, is responsible for the development of ERM framework and policies, facilitating risk assessments and monitoring and reporting risk issues.
The ERM Unit, as an initial step, immediately engaged to coordinate and consolidate all existing/on-going risk management initiatives and activities in the Group in order to monitor more effectively and systematically assess the Group’s overall risk profile. Simultaneously, the ERM Unit has also embarked in a continuing comprehensive risk management awareness and integration program which involves, among others, the development/enhancement of formal Group’s risk policies and procedures; development and continuous updating of risk management methodologies, guides and tools; and work and coordinate closer with the operations units/functional departments and member entities on critical and important matters relating to risk management. The said ERM program primarily aims to promote a group-wide risk awareness, common risk knowledge and understanding, and a more uniform and systematic approach/process of risk identification and assessment.

CORPORATE GOVERNANCE
4 8
A More Structured Group-wide ERM Team
A well-integrated and coordinated ERM team is critically essential to a more focused, efficient and effective risk management framework that will help ensure the day to day tracking, monitoring and control of risks. Recognizing such critical importance of a solid risk management team, the Group’s ERM Unit Organizational Structure has been approved and formalized by the Group’s management and presented to the AC. This includes the official appointment of ERM Coordinators for each operating units, functional departments and member entities. Having such a well-structured and fully supported ERM team, the Group is more confident of clearer risk roles and responsibilities, better risk communication and reporting/escalation, and hence, better risk management decision making and improved overall capability to manage a broad range of potential issues and risks before they escalate.
Uniform and Systematic Risk Management Approach/Process
The following important ERM initiatives have been undertaken in order to promote a uniform and systematic risk management approach/process, with a common risk understanding and language across the whole organization, which will ensure that the Group is well-equipped and capable of identifying key business risks emanating from the rapidly changing business climate and environment, and producing a more effective and efficient risk management results:
(1) The Group’s overall risk philosophy, risk appetite and risk tolerance have been approved and formalized by management and presented to and approved by the AC;
(2) As part of the development of a risk management manual, Risk Assessment Criteria Matrix (“RACM”) was set-up (based on the Group’s risk appetite and risk tolerance) and approved by the Group management and presented to and approved by the AC. The RACM serves as an important tool and provides the standard parameters for risk identification and assessment applicable throughout the Group; and,
(3) Risks Universe and Risks Registers were created. These are summary lists of all possible risks (classified per category/ sub-category) that the Group could possibly encounter or face in the performance of its operations to achieve its business objectives. The Risk Universe and Risks Registers will standardize the "risk language" to be used across all units, functional departments & subsidiaries and, help Risk Owners in the identification, classification and documentation of risks related to their respective functions and operations.
Promoting Group-wide Risk Awareness
Making risk management a part of and embedding it in the Group’s day-to-day business activities/processes/functions and of everyone’s responsibility is at the forefront of the Group’s ERM objectives. In order to promote group-wide risk awareness and build a stronger risk management culture in the Group, the ERM Unit has and is continuously conducting risk management orientation sessions and workshops for key members of the organization at various levels in order to provide a common and in-depth understanding of the overall concepts of ERM, its implementation and benefits; and provide understanding of the Group’s risk management framework, infrastructure (including methodologies and tools) and processes.
2010 Priorities
In order to sustain the momentum brought about by its initial risk management activities and initiatives, the ERM Unit will continue to focus on emphasizing the importance of prudent risk management and promoting awareness through the continuous conduct of ERM socialization sessions and trainings to key employees within the Group in 2010. Simultaneously, the ERM Unit will also continue the development of a comprehensive Risk Management Manual to be implemented across the Group. This Risk Management Manual will include, among others, risk management policies and procedures, risk assessment criteria matrix, risk universe/ risk registers, and the roles and responsibilities of the management and respective employees in the implementation of ERM.

4 9B U I L D I N G S U S T A I N A B L E G R O W T HINDOFOOD AGRI RESOURCES LTD. ANNUAL REPORT 2009
As part of the implementation across the Group of a better and more effective risk management program, the ERM Unit will also work and coordinate closely with the Internal Audit Department to focus on high level risks, ensure accuracy of risk assessment reports, and check/verify the proper and full implementation of the risk mitigation strategies and controls.
As part of the IA audit plan, IA will perform independent reviews of the risks and controls identified by the ERM to provide reasonable assurance to management and the AC that the key risks and controls have been adequately addressed, monitored and centralised.
Whistle Blowing Policy
In 2009, in line with the Group’s continued improvement in Corporate Governance, a whistle blowing policy and procedures (“Policy”) has been put in place. This Policy provides employees with clearly defined processes through which they may raise their concerns in good faith and in strict confidence with respect to suspected fraud, corruption, dishonest practices or other similar matters which do not comply with the Groups standard operating procedures to the Head of IA, Exco and AC.
The Policy aims to encourage the reporting of such matters in good faith, with the confidence that employees making such reports will be treated fairly and, to the extent possible, protected from reprisal.
The AC reviewed and approved the Policy and was satisfied that arrangements are in place for independent investigation of such matters and for appropriate follow-up actions.
COMMUNICATION WITH SHAREHOLDERS (Principles 14 and 15)
The Company is committed to the regular and timely disclosure of information pertinent to shareholders. Announcements are made on a timely basis, and within the prescribed periods, through the SGXNET as well as through press releases to the relevant media, if necessary.
The Company holds analysts briefings for quarterly and full year results with the presence of the CEO, CFO and senior management to answer relevant questions which the analysts may have.
The Company supports the Code’s principle to encourage the participation of shareholders at the General Meetings. All shareholders are given the opportunity to attend and vote at General Meetings. They can vote in person or by proxy if they are unable to attend the Meetings in person.
The Directors of the Company, as well as the external auditors are in attendance at the General Meetings to address any queries from shareholders.
Dealings in the Company’s Securities
The Group has adopted an Internal Code with regard to dealings in the securities of the Company by its officers. The Company restricts its officers to trade in the securities of the Company while in possession of price-sensitive information and during the period two weeks before the announcement of Group’s quarterly and half yearly financial results and one month before the announcement of Group’s full year financial results.
Directors and employees are expected to observe the insider trading laws at all times even when dealing in securities within permitted trading period.

INDOFOOD AGRI RESOURCES LTD. &ITS SUBSIDIARIESFINANCIAL STATEMENTS
51 Directors’ Report
53 Statement by Directors
54 Independent Auditors’ Report
55 Consolidated Statement of Comprehensive Income
56 Balance Sheets
57 Consolidated Statement of Changes in Equity
58 Consolidated Cash Flow Statement
60 Notes to the Financial Statements

DIRECTORS’ REPORT
The directors are pleased to present their report to the members together with the audited consolidated financial statements of
Indofood Agri Resources Ltd. (the “Company”) and its subsidiaries (collectively the “Group”) and the balance sheet of the Company
for the financial year ended 31 December 2009.
Directors
The directors of the Company in office at the date of this report are:
Lee Kwong Foo Edward
Mark Julian Wakeford
Moleonoto Tjang
Gunadi
Suaimi Suriady
Tjhie Tje Fie
Axton Salim
Lim Hock San
Goh Kian Chee
Hendra Susanto
In accordance with Article 117 of the Company’s Articles of Association, Goh Kian Chee, Hendra Susanto, Axton Salim and Suaimi
Suriady retire and, being eligible, offer themselves for re-election.
Arrangements to enable directors to acquire shares and debentures
Neither at the end of nor at any time during the financial year was the Company a party to any arrangement whose objects are, or one
of whose objects is, to enable the directors of the Company to acquire benefits by means of the acquisition of shares or debentures of
the Company or any other body corporate.
Directors’ interests in shares and debentures
The following director, who held office at the end of the financial year had, according to the register of directors’ shareholdings
required to be kept under section 164 of the Singapore Companies Act, Cap. 50, an interest in shares and share options of the
Company and related corporations (other than wholly-owned subsidiaries) as stated below:
Direct interest Deemed interest
Name of director At beginning
of the yearAt end
of the yearAt beginning
of the yearAt end
of the year
Ordinary shares of the Company
Mark Julian Wakeford 300,000 300,000 200,000 200,000
There was no change in any of the above-mentioned interests between the end of the financial year and 21 January 2010.
Except as disclosed in this report, no director who held office at the end of the financial year had interests in shares, share options,
warrants or debentures of the Company, or of related corporations, either at the beginning of the financial year, or date of appointment
if later, or at the end of the financial year.
5 1B U I L D I N G S U S T A I N A B L E G R O W T HINDOFOOD AGRI RESOURCES LTD. ANNUAL REPORT 2009

DIRECTORS’ REPORT
Directors’ contractual benefits
Except as disclosed in the financial statements, since the end of the previous financial year, no director of the Company has received or
become entitled to receive a benefit by reason of a contract made by the Company or a related corporation with the director, or with
a firm of which the director is a member, or with a company in which the director has a substantial financial interest.
Options
No option to take up unissued shares of the company or its subsidiaries was granted during the year.
There were no shares issued during the year by virtue of the exercise of options to take up unissued shares of the Company or its
subsidiaries whether granted before or during the year.
There were no unissued shares of the Company or its subsidiaries under option as at the end of the year.
Audit Committee
The audit committee performed the functions specified in the Act. The functions performed are detailed in the Report on Corporate
Governance.
Auditors
Ernst & Young LLP have expressed their willingness to accept reappointment as auditors.
On behalf of the Board of Directors,
Mark Julian Wakeford
Director
Moleonoto Tjang
Director
Singapore
8 March 2010
5 2

STATEMENT BY DIRECTORS
We, Mark Julian Wakeford and Moleonoto Tjang, being two of the directors of Indofood Agri Resources Ltd., do hereby state that, in
the opinion of the directors:
(i) the accompanying balance sheets, consolidated statement of comprehensive income, consolidated statement of changes in
equity and consolidated cash flow statement together with notes thereto are drawn up so as to give a true and fair view of the
state of affairs of the Group and of the Company as at 31 December 2009 and the results of the business, changes in equity and
cash flows of the Group for the year ended on that date, and
(ii) at the date of this statement, there are reasonable grounds to believe that the Company will be able to pay its debts as and when
they fall due.
On behalf of the Board of Directors,
Mark Julian Wakeford
Director
Moleonoto Tjang
Director
Singapore
8 March 2010
5 3B U I L D I N G S U S T A I N A B L E G R O W T HINDOFOOD AGRI RESOURCES LTD. ANNUAL REPORT 2009

To the Members of Indofood Agri Resources Ltd.
We have audited the accompanying financial statements of Indofood Agri Resources Ltd. (the “Company”) and its subsidiaries
(collectively the “Group”), set out on pages 55 to 125, which comprise the balance sheets of the Group and the Company as at 31
December 2009, the consolidated statement of changes in equity, the statement of comprehensive income and cash flow statement
of the Group for the year then ended, and a summary of significant accounting policies and other explanatory notes.
Management’s responsibility for the financial statements
Management is responsible for the preparation and fair presentation of these financial statements in accordance with the provisions of
the Singapore Companies Act, Cap. 50 (the “Act”) and Singapore Financial Reporting Standards. This responsibility includes devising
and maintaining a system of internal accounting controls sufficient to provide a reasonable assurance that assets are safeguarded
against loss from unauthorised use or disposition; and transactions are properly authorised and that they are recorded as necessary to
permit the preparation of true and fair profit and loss account and balance sheet and to maintain accountability of assets; selecting and
applying appropriate accounting policies; and making accounting estimates that are reasonable in the circumstances.
Auditors’ responsibility
Our responsibility is to express an opinion on these financial statements based on our audit. We conducted our audit in accordance
with Singapore Standards on Auditing. Those standards require that we comply with ethical requirements and plan and perform the
audit to obtain reasonable assurance whether the financial statements are free from material misstatement.
An audit involves performing procedures to obtain audit evidence about the amounts and disclosures in the financial statements.
The procedures selected depend on the auditor’s judgement, including the assessment of the risks of material misstatement of the
financial statements, whether due to fraud or error. In making those risk assessments, the auditor considers internal control relevant
to the entity’s preparation and fair presentation of the financial statements in order to design audit procedures that are appropriate
in the circumstances, but not for the purpose of expressing an opinion on the effectiveness of the entity’s internal control. An audit
also includes evaluating the appropriateness of accounting policies used and the reasonableness of accounting estimates made by
management, as well as evaluating the overall presentation of the financial statements.
We believe that the audit evidence we have obtained is sufficient and appropriate to provide a basis for our audit opinion.
Opinion
In our opinion,
(i) the consolidated financial statements of the Group and the balance sheet of the Company are properly drawn up in accordance
with the provisions of the Act and Singapore Financial Reporting Standards so as to give a true and fair view of the state of affairs
of the Group and of the Company as at 31 December 2009 and the results, changes in equity and cash flows of the Group for
the year ended on that date; and
(ii) the accounting and other records required by the Act to be kept by the Company and by the subsidiary company incorporated
in Singapore of which we are the auditors have been properly kept in accordance with the provisions of the Act.
Ernst & Young LLP
Public Accountants and
Certified Public Accountants
Singapore
8 March 2010
INDEPENDENT AUDITORS’ REPORTFor the financial year ended 31 December 2009
5 4

Note 2009 2008Rp’ million Rp’ million
Revenue 5 9,040,325 11,840,499Cost of sales 6 (5,814,962) (7,711,395)
Gross profit 3,225,363 4,129,104
Selling and distribution costs (300,989) (383,102)General and administrative expenses (645,915) (659,934)Foreign exchange gains/(losses) 303,984 (228,666)Other operating income 7 128,464 55,187Other operating expenses 8 (69,276) (101,654)Gain/(loss) arising from changes in fair value of biological assets 14 622,570 (947,226)
Profit from operations 9 3,264,201 1,863,709
Impairment of goodwill 17 – (4,833)Financial income 10 66,630 82,411Financial expenses 11 (443,271) (422,212)
Profit before tax 2,887,560 1,519,075Income tax expense 12 (834,298) (452,358)
Net profit/total comprehensive income for the year 2,053,262 1,066,717
Total comprehensive income attributable to:Owners of the parent 1,526,829 795,284Minority interests 526,433 271,433
2,053,262 1,066,717
Earnings per share (in Rupiah) 13- basic 1,061 550- diluted 1,061 550
CONSOLIDATED STATEMENT OF COMPREHENSIVE INCOMEFor the financial year ended 31 December 2009
The accompanying accounting policies and explanatory notes form an integral part of the financial statements.
5 5B U I L D I N G S U S T A I N A B L E G R O W T HINDOFOOD AGRI RESOURCES LTD. ANNUAL REPORT 2009

Group CompanyNote 2009 2008 2009 2008
Rp’ million Rp’ million Rp’ million Rp’ million
Non-current assetsBiological assets 14 9,486,096 8,152,865 – –Property, plant and equipment 15 4,223,457 2,963,688 70,001 74,272Prepaid land premiums and deferred land
rights acquisition costs 16 1,430,347 1,379,286 – –Goodwill 17 3,155,786 2,994,523 – –Claims for tax refund 18 328,844 58,953 – –Deferred tax assets 19 294,327 239,314 – –Investment in subsidiary companies 20 – – 8,487,971 8,487,971Loans to a subsidiary company 21 – – 2,259,501 2,259,501Other non-current assets 22 817,811 709,420 24 863Total non-current assets 19,736,668 16,498,049 10,817,497 10,822,607
Current assetsInventories 23 1,082,557 910,542 – –Trade and other receivables 24 913,458 923,170 17,626 33,790Prepaid taxes 112,779 122,624 – –Cash and cash equivalents 25 1,802,345 2,408,266 183,450 186,243Total current assets 3,911,139 4,364,602 201,076 220,033Total assets 23,647,807 20,862,651 11,018,573 11,042,640
Current liabilitiesTrade and other payables and accruals 26 1,072,802 1,042,469 11,257 15,616Interest-bearing loans and borrowings 27 1,746,464 2,379,649 – –Income tax payable 106,182 403,852 130 130Total current liabilities 2,925,448 3,825,970 11,387 15,746
Non-current liabilitiesInterest-bearing loans and borrowings 27 4,491,213 3,876,936 – –Bonds and Sukuk Ijarah payables 27 721,802 – – –Other payables 28 323,096 239,278 – –Employee benefits liabilities 29 442,960 355,372 – –Deferred tax liabilities 19 1,763,993 1,589,593 – –Total non-current liabilities 7,743,064 6,061,179 – –Total liabilities 10,668,512 9,887,149 11,387 15,746
Net assets 12,979,295 10,975,502 11,007,186 11,026,894
Attributable to owners of the parentShare capital 30 3,584,279 3,584,279 10,912,411 10,912,411Treasury shares 30 (29,283) (29,283) (29,283) (29,283)Reserves 31 5,893,518 4,366,689 124,058 143,766
9,448,514 7,921,685 11,007,186 11,026,894Minority interests 3,530,781 3,053,817 – –
Total equity 12,979,295 10,975,502 11,007,186 11,026,894
BALANCE SHEETSAs at 31 December 2009
The accompanying accounting policies and explanatory notes form an integral part of the financial statements.
5 6
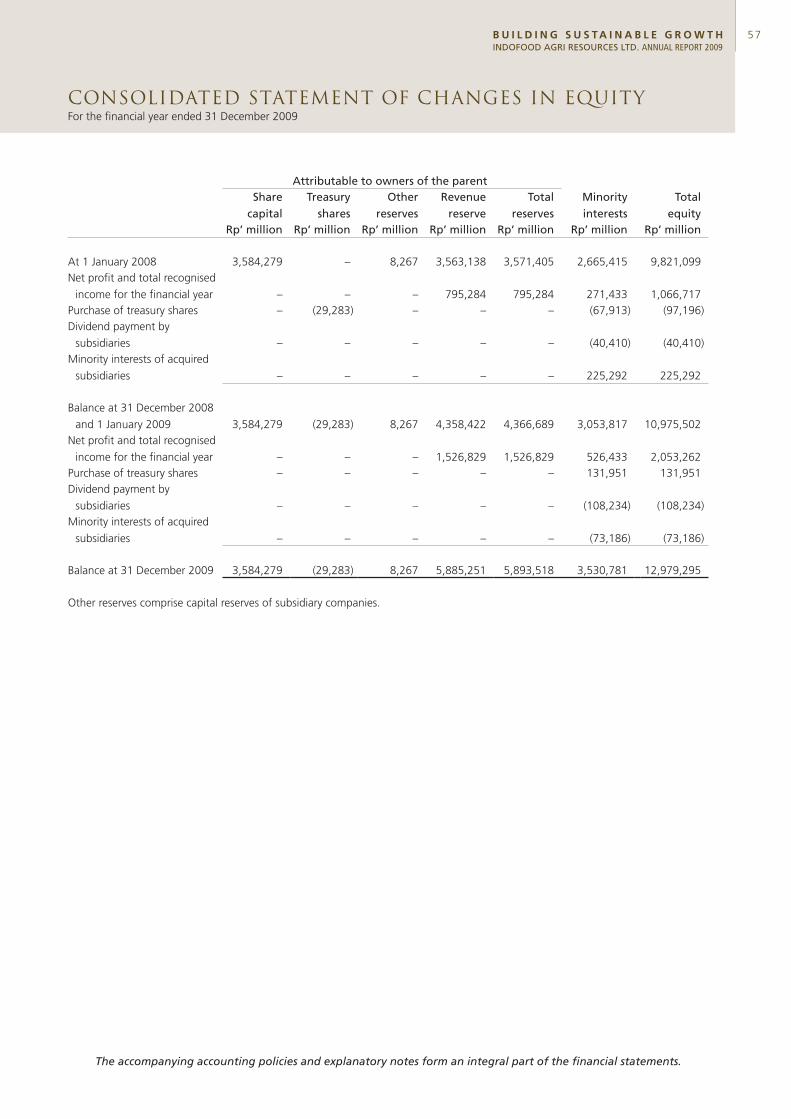
Attributable to owners of the parentShare
capitalTreasury
sharesOther
reservesRevenue reserve
Total reserves
Minorityinterests
Totalequity
Rp’ million Rp’ million Rp’ million Rp’ million Rp’ million Rp’ million Rp’ million
At 1 January 2008 3,584,279 – 8,267 3,563,138 3,571,405 2,665,415 9,821,099Net profit and total recognised
income for the financial year – – – 795,284 795,284 271,433 1,066,717Purchase of treasury shares – (29,283) – – – (67,913) (97,196)Dividend payment by
subsidiaries – – – – – (40,410) (40,410)Minority interests of acquired
subsidiaries – – – – – 225,292 225,292
Balance at 31 December 2008
and 1 January 2009 3,584,279 (29,283) 8,267 4,358,422 4,366,689 3,053,817 10,975,502Net profit and total recognised
income for the financial year – – – 1,526,829 1,526,829 526,433 2,053,262Purchase of treasury shares – – – – – 131,951 131,951Dividend payment by
subsidiaries – – – – – (108,234) (108,234)Minority interests of acquired
subsidiaries – – – – – (73,186) (73,186)
Balance at 31 December 2009 3,584,279 (29,283) 8,267 5,885,251 5,893,518 3,530,781 12,979,295
Other reserves comprise capital reserves of subsidiary companies.
CONSOLIDATED STATEMENT OF CHANGES IN EQUITYFor the financial year ended 31 December 2009
The accompanying accounting policies and explanatory notes form an integral part of the financial statements.
5 7B U I L D I N G S U S T A I N A B L E G R O W T HINDOFOOD AGRI RESOURCES LTD. ANNUAL REPORT 2009

Note 2009 2008Rp’ million Rp’ million
Cash flows from operating activities
Profit before taxation 2,887,560 1,519,075Adjustments:
Depreciation and amortisation 9 343,005 276,781Unrealised foreign exchange (gains)/losses (386,179) 304,780Loss/(gain) on disposal of biological assets 7 5,146 (1,610)(Gain)/loss arising from changes in fair value of plasma receivables 8,33(a) (886) 13,344Provision for uncollectible plasma receivables 8,33(a) 25,269 23,951Write-off of property, plant and equipment 8 1,667 1,468Loss on disposal of property and equipment 8 918 1,972Write-off of biological assets 8,14 – 387(Reversal)/provision for decline in market value of inventories and
obsolescence of inventories 8,23 (10,343) 24,766Loss on write-off of plasma receivables 8,33(a) 26,602 14,451Write-back of doubtful debts 9,24 (165) (2,128)Gains from dilution of shareholding in a subsidiary 7 (56,286) –(Gain)/loss on changes in fair value of biological assets 14 (622,570) 947,226Changes in provision for asset dismantling costs 7,28 3,219 (2,416)Changes in employee benefits liabilities 87,588 62,822Impairment of goodwill 17 – 4,833Financial income 10 (66,630) (82,411)Financial expenses 11 443,271 422,212
Operating cash flow before working capital changes 2,681,186 3,529,503
Changes in working capitalIncrease in other non-current assets (319,290) (12,182)(Increase)/decrease in inventories (161,672) 245,244Decrease/(increase) in trade and other receivables 60,610 (68,788)(Increase)/decrease in advances to suppliers (13,270) 49,994Decrease in prepaid taxes 9,845 45,933Increase in trade and other payables 3,246 84,530Increase/(decrease) in advances from customers 13,334 (27,264)
Cash flows generated from operations 2,273,989 3,846,970
Interest received 67,418 82,411Interest paid (441,092) (407,616)Income tax paid (1,012,558) (988,411)
Net cash flows generated from operating activities 887,757 2,533,354
CONSOLIDATED CASH FLOW STATEMENTFor the financial year ended 31 December 2009
5 8

Note 2009 2008Rp’ million Rp’ million
Cash flows from investing activities
Additions to property, plant and equipment (1,491,313) (858,859)Acquisition of subsidiaries, net of cash acquired 32 (8,432) (109,769)Acquisition of minority interests in subsidiaries 32 (89,464) – Proceeds from investments in repurchase receivables 10,953 140,685Placements in repurchase receivables – (143,701)Additions to biological assets 14 (742,363) (742,052)Increase in advances for purchases of equipment – 3,226Increase in plasma receivables 33(a) (138,407) (253,338)Proceeds from disposal of property and equipment 3,223 916Proceeds from disposal of biological assets 1,381 8,117Additions to prepaid land premiums and deferred land rights acquisition costs 16 (53,378) (31,281)Advances for acquisition of minority interest in subsidiaries 32 – (136,666)Advances for long term investments – (5,082)Advances for projects and purchase of fixed assets (239,807) (35,205)
Net cash flows used in investing activities (2,747,607) (2,163,009)
Cash flows from financing activitiesProceeds from interest-bearing loans and borrowings 4,063,016 3,069,304Repayment of interest-bearing loans and borrowings (3,641,342) (2,771,080)Net proceeds of amounts due to related parties 81,863 19,476Dividend payments by subsidiaries to minority shareholders (108,234) (40,410)Proceeds from dilution of shareholdings in a subsidiary 187,766 – Purchase of treasury shares – (74,806)Net Proceeds from issuance of Bonds and Sukuk Ijarah 721,699 –
Net cash flows generated from financing activities 1,304,768 202,484
Net increase in cash and cash equivalents (555,082) 572,829Effect of changes in exchange rates on cash and cash equivalents (50,839) 133,925Cash and cash equivalents at the beginning of the financial year 2,408,266 1,701,512
Cash and cash equivalents at the end of the financial year 25 1,802,345 2,408,266
CONSOLIDATED CASH FLOW STATEMENTFor the financial year ended 31 December 2009
The accompanying accounting policies and explanatory notes form an integral part of the financial statements.
5 9B U I L D I N G S U S T A I N A B L E G R O W T HINDOFOOD AGRI RESOURCES LTD. ANNUAL REPORT 2009
NOTES TO THE FINANCIAL STATEMENTS31 December 2009
1. General
Indofood Agri Resources Ltd. (the “Company”) is a public limited liability company incorporated and domiciled in Singapore.
With effect from 23 January 2007, the Company changed its name from CityAxis Holdings Limited to Indofood Agri Resources
Ltd.. The registered office and principal place of business of the Company is located at 8 Eu Tong Sen Street, #16-96/97 The
Central, Singapore 059818.
The Group is a vertically-integrated agribusiness group, with its principal activities comprising oil palm seed breeding, cultivation
of oil palm plantations, production and refining of crude palm oil (“CPO”) and crude coconut oil (“CNO”), cultivation of
rubber and sugar canes plantations and marketing and selling these end products. The Group is also involved in managing and
cultivating small portions of cocoa, coconut and tea plantations, and marketing and selling the related products.
PT Indofood Sukses Makmur Tbk (“PT ISM”), incorporated in Indonesia, and First Pacific Company Limited, incorporated in Hong
Kong, are the penultimate and ultimate parent company of the Group, respectively. The immediate holding company is Indofood
Singapore Holdings Pte Ltd, incorporated in Singapore.
2. Basis of presentation of the consolidated financial statements
In January 2007, the Company completed the acquisition of the entire share capital of Indofood Oil & Fats Pte. Ltd. (“IOFPL”),
a company incorporated and domiciled in Singapore pursuant to the sale and purchase agreement dated 23 August 2006. The
purchase consideration of S$392,691,880 was satisfied by the allotment and issue of 9,982,000,000 new shares in the capital
of the Company at S$0.03934 per share.
The acquisition of IOFPL has been accounted for in the consolidated financial statements of the Company as a reverse acquisition,
as described in FRS103-Business Combinations. Hence, for accounting purposes, IOFPL is deemed to be the “acquirer” and the
Company as the “legal parent”.
In the reverse acquisition, the cost of the business combination is deemed to have been incurred by IOFPL in the form of
equity instruments issued to the owners of the Company. Accordingly, the deemed cost of acquisition has been determined at
Rp99.8 billion using the fair value of S$1.25 per share on the 13,500,000 issued consolidated shares of the Company before
the acquisition. The resulting goodwill of Rp76.3 billion, being the difference between the deemed cost of acquisition and fair
value of the Company’s net assets at the reverse acquisition date, has been impaired in full and included in the statement of
comprehensive income in Year 2007 as there are no future economic benefits attached to the goodwill.
The consolidated financial statements of the Company for the year ended 31 December 2009 and 2008 have been prepared and
presented as a continuation of the business of IOFPL and its subsidiary companies. As such:
(a) the assets and liabilities of the IOFPL group have been recognised and measured in the consolidated financial statements
at their pre-combination carrying amounts;
(b) the retained earnings and other equity balances recognised in the consolidated financial statements are the retained
earnings and other equity balances of IOFPL group immediately before the business combination;
(c) the amount recognised as issued equity instruments in the consolidated financial statements has been determined
by adding the deemed cost of the reverse acquisition to the issued equity of IOFPL immediately before the business
combination. However, the equity structure appearing in the consolidated financial statements (i.e. the number and type
of equity instruments issued) is the equity structure of the Company.
6 0

NOTES TO THE FINANCIAL STATEMENTS31 December 2009
3. Summary of significant accounting policies
3.1 Basis of preparation
The consolidated financial statements of the Group and the balance sheet of the Company has been prepared in accordance
with Singapore Financial Reporting Standards (“FRS”).
The financial statements have been prepared on the historical cost basis, except for (a) biological assets and available-for-sale
investments which are stated at fair values; and (b) receivables and payables arising from future commodity contracts transactions
which are determined based on the quoted market prices of the commodities.
The financial statements are presented in Indonesian Rupiah (“Rp”) and all values are rounded to the nearest million (Rp’ million)
except when otherwise indicated.
The accounting policies have been consistently applied by the Company and the Group and are consistent with those used in
the previous financial year, except for the changes stated in Note 3.2.
3.2 Changes in accounting policies
The accounting policies adopted are consistent with those of the previous financial year except for the adoption of standard and
interpretations mandatory for annual financial periods beginning on or after 1 January 2009.
Adoption of these standards and interpretations did not have any effect on the financial performance or position of the Group.
They did however give rise to additional disclosures, including, in some cases, revisions to accounting policies.
The principal effects of these changes are as follows:
FRS 1 Presentation of Financial Statements – Revised Presentation
The revised FRS 1 separates owner and non-owner changes in equity. The statement of changes in equity includes only details
of transactions with owners, with all non-owner changes in equity presented in the statement of other comprehensive income.
In addition, the Standard introduces the statement of comprehensive income which presents income and expense recognised in
the period. This statement may be presented in one single statement or two linked statements. The Group has elected to present
this statement as one single statement.
Amendments to FRS 107 Financial Instruments: Disclosures
The amendments to FRS 107 require additional disclosure about fair value measurement and liquidity risk. Fair value measurements
are to be disclosed by source of inputs using a three level hierarchy for each class of financial instrument. In addition, reconciliation
between the beginning and ending balance for Level 3 fair value measurements is now required, as well as significant transfers
between Level 1 and Level 2 fair value measurements. The amendments also clarify the requirements for liquidity risk disclosures.
The fair value measurement disclosures and liquidity risk disclosures are presented in Note 36 and Note 35(e) to the financial
statements respectively.
FRS 108 Operating Segments
FRS 108 requires disclosure of information about the Group’s operating segments and replaces the requirement to determine
primary and secondary reporting segments of the Group. The Group determined that the reportable operating segments are the
same as the business segments previously identified under FRS 14 Segment Reporting. Additional disclosures about each of the
segments are shown in Note 38, including revised comparative information.
6 1B U I L D I N G S U S T A I N A B L E G R O W T HINDOFOOD AGRI RESOURCES LTD. ANNUAL REPORT 2009

NOTES TO THE FINANCIAL STATEMENTS31 December 2009
3. Summary of significant accounting policies (cont’d)
3.3 Standards issued but not yet effective
The Group has not adopted the following standards and interpretations that have been issued but not yet effective:
Description
Effective forannual periods
beginning on or after
Amendments to FRS 27 Consolidated and Separate Financial Statements 1 July 2009Amendments to FRS 39 Financial Instruments: Recognition and Measurement – Eligible Hedged Item 1 July 2009Revised FRS 103 Business Combinations 1 July 2009Amendments to FRS 105 Non-current Assets Held for Sale and Discontinued Operations 1 July 2009INT FRS 117 Distributions of Non-cash Assets to Owners 1 July 2009Improvements to FRSs issued in 2009: - Amendments to FRS 38 Intangible Assets 1 July 2009- Amendments to FRS 102 Share-based Payment 1 July 2009- Amendments to FRS 108 Operating Segments 1 July 2009- Amendments to INT FRS 109 Reassessment of Embedded Derivatives 1 July 2009- Amendments to INT FRS 116 Hedges of a Net Investment in a Foreign Operation 1 July 2009- Amendments to FRS 1 Presentation of Financial Statements 1 January 2010- Amendments to FRS 7 Statement of Cash Flows 1 January 2010- Amendments to FRS 17 Leases 1 January 2010- Amendments to FRS 36 Impairment of Assets 1 January 2010- FRS 39 Financial Instruments: Recognition and Measurement 1 January 2010- Amendments to FRS 105 Non-current Assets Held for Sale and Discontinued Operations 1 January 2010- Amendments to FRS 108 Operating Segments 1 January 2010
Except for the revised FRS 103 and the amendments to FRS 27, the directors expect that the adoption of the other standards
and interpretations above will have no material impact on the financial statements in the period of initial application. The
nature of the impending changes in accounting policy on adoption of the revised FRS 103 and the amendments to FRS 27
are described below.
Revised FRS 103 Business Combinations and Amendments to FRS 27 Consolidated and Separate Financial Statements
The revised standards are effective for annual periods beginning on or after 1 July 2009. The revised FRS 103 introduces a
number of changes in the accounting for business combinations occurring after 1 July 2009. These changes will impact the
amount of goodwill recognised, the reported results in the period that an acquisition occurs, and future reported results. The
Amendments to FRS 27 require that a change in the ownership interest of a subsidiary (without loss of control) is accounted for
as an equity transaction. Therefore, such transactions will no longer give rise to goodwill, nor will they give rise to a gain or loss.
Furthermore, the amended standard changes the accounting for losses incurred by the subsidiary as well as the loss of control
of a subsidiary. Other consequential amendments were made to FRS 7 Statement of Cash Flows, FRS 12 Income Taxes, FRS 21
The Effects of Changes in Foreign Exchange Rates, FRS 28 Investments in Associates and FRS 31 Interests in Joint Ventures. The
changes from revised FRS 103 and Amendments to FRS 27 will affect future acquisitions or loss of control and transactions with
minority interests. The standards may be early applied. However, the Group does not intend to early adopt.
3.4 Functional and foreign currency
On completion of the reverse acquisition, management has determined the currency of the primary economic environment
in which the Company operates, that is its functional currency, to be Indonesian Rupiah as the Company’s revenue and major
expenses are largely influenced by Indonesian Rupiah. Accordingly, the Company changed its functional currency from Singapore
dollars to Indonesian Rupiah post the reverse acquisition in January 2007. The change in the functional currency did not result in
material impact on the financial position or financial result of the Company on the date of the change.
6 2

NOTES TO THE FINANCIAL STATEMENTS31 December 2009
3. Summary of significant accounting policies (cont’d)
3.4 Functional and foreign currency (cont’d)
Transactions in foreign currencies are measured in the respective functional currencies of the Company and its subsidiaries and
are recorded on initial recognition in the functional currencies at exchange rates approximating those ruling at the transaction
dates. Monetary assets and liabilities denominated in foreign currencies are translated at the rate of exchange ruling at the
balance sheet date. Non-monetary items that are measured in terms of historical cost in a foreign currency are translated using
the exchange rates as at the dates of the initial transactions. Non-monetary items measured at fair value in a foreign currency
are translated using the exchange rates at the date when the fair value was determined.
Exchange differences arising on the settlement of monetary items or on translating monetary items at the balance sheet date
are recognised in the statement of comprehensive income except for exchange differences arising on monetary items that form
part of the Group’s net investment in foreign subsidiaries, which are recognised initially in equity as foreign currency translation
reserve in the consolidated balance sheet and recognised in the consolidated statement of comprehensive income on disposal
of the subsidiary.
The assets and liabilities of foreign operations are translated into Indonesian Rupiah at the rate of exchange ruling at the balance
sheet date and their statement of comprehensive incomes are translated at the weighted average exchange rates for the year.
The exchange differences arising on the translation are taken directly to a separate component of equity as foreign currency
translation reserve. On disposal of a foreign operation, the deferred cumulative amount recognised in equity relating to that
particular foreign operation is recognised in the statement of comprehensive income.
Goodwill and fair value adjustments arising on the acquisition of foreign operations are treated as assets and liabilities of the
foreign operations and are recorded in the functional currency of the foreign operations and translated at the closing rate at the
balance sheet date.
3.5 Basis of consolidation
The consolidated financial statements comprise the financial statements of the Company and its subsidiaries as at the balance
sheet date. The financial statements of the subsidiaries used in the preparation of the consolidated financial statements are
prepared for the same reporting date as the Company. Consistent accounting policies are applied for like transactions and events
in similar circumstances.
All intra-group balances, transactions, income and expenses, and profits and losses resulting from intra-group transactions are
eliminated in full.
Subsidiaries are consolidated from the date of acquisition, being the date on which the Group obtains control, and continue to
be consolidated until the date that such control ceases.
Acquisitions of subsidiaries are accounted for using the purchase method. The cost of an acquisition is measured as the fair
value of the assets given, equity instruments issued and liabilities incurred or assumed at the date of exchange, plus costs
directly attributable to the acquisition. Identifiable assets acquired and liabilities and contingent liabilities assumed in a business
combination are measured initially at their fair values at the acquisition date. Adjustments to those fair values relating to
previously held interests are treated as a revaluation and recognised in equity.
Any excess of the cost of the business combination over the Group’s share in the net fair value of the acquired subsidiary’s
identifiable assets, liabilities and contingent liabilities represents goodwill. The goodwill is accounted for in accordance with the
accounting policy for goodwill stated below.
When the Group acquires a business, embedded derivatives separated from the host contract by the acquiree are not reassessed
on acquisition unless the business combination results in a change in the terms of the contract that significantly modifies the
cash flows that would otherwise be required under the contract.
6 3B U I L D I N G S U S T A I N A B L E G R O W T HINDOFOOD AGRI RESOURCES LTD. ANNUAL REPORT 2009

NOTES TO THE FINANCIAL STATEMENTS31 December 2009
3. Summary of significant accounting policies (cont’d)
3.6 Transaction with minority shareholders
Minority interests represent the portion of profit or loss and net assets in subsidiaries not held by the Group and are presented
separately in the consolidated statement of comprehensive income and within equity in the consolidated balance sheet,
separately from parent shareholders’ equity. Transactions with minority interests are accounted for using the parent entity
extension method. On acquisition of minority interests, the difference between the consideration and the book value of the
share of the net assets acquired is recognised in goodwill. Gain or loss on disposal to minority interests is recognised in the
consolidated statement of comprehensive income.
3.7 Subsidiaries
A subsidiary is an entity over which the Group has the power to govern the financial and operating policies so as to obtain
benefits from its activities. The Group generally has such power when it directly or indirectly, holds more than 50% of the issued
share capital, or controls more than half of the voting power, or controls the composition of the board of directors.
In the Company’s separate financial statements, investments in subsidiaries are accounted for at cost less impairment losses.
3.8 Property, plant and equipment
All items of property, plant and equipment are initially recorded at cost. The cost of an item of property, plant and equipment is
recognised as an asset if, and only if, it is probable that future economic benefits associated with the item will flow to the Group
and the cost of the item can be measured reliably. Subsequent to initial recognition, property, plant and equipment are stated at
cost less accumulated depreciation and any impairment losses. The cost of an asset comprises its purchase price and any directly
attributable costs of bringing the asset to working condition for its intended use. Such cost also includes the initial estimation of
costs of dismantling and removing the item and restoring the sites of plants on which they are located, and the cost of replacing
part of such property, plant and equipment when that cost is incurred.
Depreciation of an asset begins when it is available for use and is computed on a straight-line method over the estimated useful
lives of the asset as follows:
Buildings and improvements – 5 to 25 yearsPlant and machinery – 4 to 20 yearsHeavy equipment and transportation equipment – 3 to 10 yearsFurniture, fixtures and office equipment – 4 to 10 years
The carrying values of property, plant and equipment are reviewed for impairment when events or changes in circumstances
indicate that the carrying value may not be recoverable.
The carrying amount of an item of property, plant and equipment is derecognised upon disposal or when no future economic
benefits are expected from its use or disposal. Any gain or loss arising from the derecognition of the asset is included in the
consolidated statement of comprehensive income in the year the asset is derecognised.
The residual values, useful life and depreciation method are reviewed at each financial period to ensure that the amount, method
and period of depreciation are consistent with previous estimates and the expected pattern of consumption of the future
economic benefits embodied in the items of property, plant and equipment.
The cost of construction-in-progress represents all costs incurred on the construction of the assets. The accumulated costs will
be reclassified to the appropriate property, plant and equipment account when the construction is completed. No depreciation
is provided on construction-in-progress.
Interest on borrowings to finance the construction of property, plant and equipment is capitalised during the period of time that
is required to complete and prepare each asset for its intended use.
6 4

NOTES TO THE FINANCIAL STATEMENTS31 December 2009
3. Summary of significant accounting policies (cont’d)
3.8 Property, plant and equipment (cont’d)
Repair and maintenance costs are taken to the consolidated statement of comprehensive income during the period in which they
are incurred. The cost of major renovation and restoration is included in the carrying amount of the asset when it is probable
that future economic benefits in excess of the originally assessed standard of performance of the existing asset will flow to the
Group, and is depreciated over the remaining useful life of the asset.
Assets under finance lease are recognised at the lower of the present value of the minimum lease payments and the fair value
of the asset.
3.9 Biological assets
Biological assets, which primarily comprise oil palm and rubber plantations, are stated at fair value less estimated point-of-sale
costs. Gain or loss arising on initial recognition of plantations at fair value less estimated point-of-sale costs and from the change
in fair value less estimated point-of-sale costs of plantations at each reporting date are included in the consolidated statement
of comprehensive income for the period in which they arise.
The fair value of the plantations is estimated by reference to independent professional valuations using the discounted cash
flows of the underlying biological assets, mainly oil palm and rubber. The expected cash flows from the whole life cycle of the
oil palm and rubber plantations is determined using the market prices of the estimated yields of the fresh fruit bunches (“FFB”)
and cup lump, respectively, net of maintenance and harvesting costs, and any costs required to bring the oil palm and rubber
plantations to maturity. The estimated yields of the oil palm and rubber plantations are dependent on the age of the oil palm
and rubber trees, the location of the plantations, soil type and infrastructure. The market price of the FFB is largely dependent
on the prevailing market price of the crude palm oil and palm kernel oil.
Oil palm trees have an average life that ranges from 20 to 25 years; with the first 3 to 4 years as immature and the remaining
years as mature.
Rubber trees have an average life that ranges from 20 to 25 years with first 5 to 6 years as immature and the remaining years
as mature.
3.10 Plasma receivables
Plasma receivables represent mainly the accumulated costs to develop plasma plantations which are currently being financed
by banks and self-financed by certain subsidiaries. Upon obtaining financing from the bank, the said advances will be offset
against the corresponding funds received from rural cooperatives unit (Koperasi Unit Desa or the “KUD”). For certain plasma
plantations, the loans obtained from the bank are under the related subsidiaries’ (acting as nucleus companies) credit facility.
When the development of plasma plantation is substantially completed and ready to be transferred or handed-over to plasma
farmers, the corresponding investment credit from the bank is also transferred to the plasma farmers. Gain or loss resulting from
the difference between the carrying value of the plasma receivables and the corresponding investment credit transferred to the
plasma farmers is reflected in the consolidated statement of comprehensive income for the year.
An allowance for uncollectible plasma receivables is also provided based on the excess of accumulated development costs over
the bank or Group’s funding or amounts agreed by the KUD.
6 5B U I L D I N G S U S T A I N A B L E G R O W T HINDOFOOD AGRI RESOURCES LTD. ANNUAL REPORT 2009

NOTES TO THE FINANCIAL STATEMENTS31 December 2009
3. Summary of significant accounting policies (cont’d)
3.11 Intangible assets
(a) Goodwill
Goodwill is initially measured at cost. Following initial recognition, goodwill is measured at cost less accumulated
impairment losses.
For the purpose of impairment testing, goodwill acquired is allocated, from the acquisition date, to each of the Group’s
cash-generating units that are expected to benefit from the synergies of the combination.
The cash-generating unit to which goodwill has been allocated is tested for impairment annually and whenever there is
an indication that the cash-generating unit may be impaired, by comparing the carrying amount of the cash-generating
unit, including the allocated goodwill, with the recoverable amount of the cash-generating unit. Where the recoverable
amount of the cash-generating unit is less than the carrying amount, an impairment loss is recognised in the consolidated
statement of comprehensive income. Impairment losses recognised for goodwill are not reversed in subsequent periods.
Where goodwill forms part of a cash-generating unit and part of the operation within that cash-generating unit is disposed
of, the goodwill associated with the operation disposed of is included in the carrying amount of the operation when
determining the gain or loss on disposal of the operation. Goodwill disposed of in this circumstance is measured based on
the relative fair values of the operations disposed of and the portion of the cash-generating unit retained.
(b) Negative goodwill
Negative goodwill arising on acquisition represents the excess of the acquirer’s interest in the net fair values of the
identifiable assets, liabilities and contingent liabilities over the cost of acquisition. Any negative goodwill arising on
acquisition is reassessed and the negative goodwill in excess of the net fair value of the identifiable assets, liabilities
and contingent liabilities is recognised immediately in the consolidated statement of comprehensive income on the
date of acquisition.
(c) Other intangible assets
Intangible assets acquired separately are measured on initial recognition at cost. The cost of intangible assets acquired in
a business combination is their fair values as at the date of acquisition. Following initial recognition, intangible assets are
carried at cost less any accumulated amortisation and any accumulated impairment losses. The useful lives of intangible
assets are assessed to be either finite or indefinite.
Intangible assets with finite lives are amortised on a straight-line basis over the estimated economic useful lives and
assessed for impairment whenever there is an indication that the intangible asset may be impaired. The amortisation
period and the amortisation method are reviewed at least at each financial year-end. Changes in the expected useful
life or the expected pattern of consumption of future economic benefits embodied in the asset is accounted for by
changing the amortisation period or method, as appropriate, and are treated as changes in accounting estimates. The
amortisation expense on intangible assets with finite lives is recognised in the consolidated statement of comprehensive
income through each line item according to the function.
Intangible assets with indefinite useful lives are tested for impairment annually or more frequently if the events or changes
in circumstances indicate that the carrying value may be impaired either individually or at the cash-generating unit level.
Such intangible assets are not amortised. The useful life of an intangible asset with an indefinite life is reviewed annually
to determine whether the useful life assessment continues to be supportable.
Gains or losses arising from derecognition of an intangible asset are measured as the difference between the net disposal
proceeds and the carrying amount of the asset and are recognised in the consolidated statement of comprehensive
income when the asset is derecognised.
6 6

NOTES TO THE FINANCIAL STATEMENTS31 December 2009
3. Summary of significant accounting policies (cont’d)
3.11 Intangible assets (cont’d)
(d) Research and development costs
Research costs are expensed as incurred.
An intangible asset arising from development expenditure on an individual project is recognised only when the Group
can demonstrate the technical feasibility of completing the intangible asset so that it will be available for use or sale,
its intention to complete and its ability to use or sell the asset, how the asset will generate future economic benefits,
the availability of resources to complete and the ability to measure reliably the expenditure during the development.
The carrying value of development costs is reviewed for impairment annually when the asset is not yet in use or more
frequently when an indication of impairment arises during the reporting year. Upon completion, the development costs is
amortised over the estimated useful life of the related intangible asset and assessed for impairment whenever there is an
indication that the intangible asset may be impaired.
Gain or loss arising from derecognition of an intangible asset is measured as the difference between the net disposal
proceeds and the carrying amount of the asset and is recognised in the consolidated statement of comprehensive income
when the asset is derecognised.
3.12 Impairment of non-financial assets
The Group assesses at each annual reporting period whether there is an indication that an asset may be impaired. If any such
indication exists, or when annual impairment testing for an asset (i.e. an intangible asset with an indefinite useful life, an
intangible asset not yet available for use, or goodwill acquired in a business combination) is required, the Group makes an
estimate of the asset’s recoverable amount.
An asset’s recoverable amount is the higher of an asset’s or cash-generating unit’s fair value less costs to sell and its value in use
and is determined for an individual asset, unless the asset does not generate cash inflows that are largely independent of those
from other assets or groups of assets. In assessing value in use, the estimated future cash flows are discounted to their present
value using a pre-tax discount rate that reflects current market assessments of the time value of money and the risks specific to
the asset. Where the carrying amount of an asset exceeds its recoverable amount, the asset is considered impaired and is written
down to its recoverable amount.
An assessment is made at each annual reporting period as to whether there is any indication that previously recognised
impairment losses recognised for an asset other than goodwill may no longer exist or may have decreased. If such indication
exists, the recoverable amount is estimated. A previously recognised impairment loss for an asset other than goodwill is reversed
only if there has been a change in the estimates used to determine the asset’s recoverable amount since the last impairment
loss was recognised. If that is the case the carrying amount of the asset is increased to its recoverable amount. That increased
amount cannot exceed the carrying amount that would have been determined, net of depreciation, had no impairment loss
been recognised for the asset in prior years. Reversal of an impairment loss is recognised in the consolidated statement of
comprehensive income. After such a reversal, the depreciation charge is adjusted in future periods to allocate the asset’s revised
carrying amount, less any residual value, on a systematic basis over its remaining useful life.
3.13 Financial assets
Financial assets are recognised on the consolidated balance sheet when, and only when, the Group becomes a party to the
contractual provisions of the financial instrument.
When financial assets are recognised initially, they are measured at fair value, plus, in the case of financial assets not at fair value
through profit or loss, directly attributable transaction costs.
6 7B U I L D I N G S U S T A I N A B L E G R O W T HINDOFOOD AGRI RESOURCES LTD. ANNUAL REPORT 2009

NOTES TO THE FINANCIAL STATEMENTS31 December 2009
3. Summary of significant accounting policies (cont’d)
3.13 Financial assets (cont’d)
A financial asset is derecognised where the contractual right to receive cash flows from the asset has expired. On derecognition
of a financial asset in its entirety, the difference between the carrying amount and the sum of the consideration received
and any cumulative gain or loss that had been recognised previously, will be recognised in the consolidated statement of
comprehensive income.
All regular way purchases and sales of financial assets are recognised on the trade date i.e. the date that the Group commits to
purchase the asset. Regular way purchases or sales are purchases or sales of financial assets that require delivery of assets within
the period generally established by regulation or convention in the marketplace concerned.
(a) Financial assets at fair value through profit or loss
Financial assets held for trading are classified as financial assets at fair value through profit or loss. Financial assets held for
trading are derivatives (including separated embedded derivatives) or financial assets acquired principally for the purpose
of selling in the near term.
Subsequent to initial recognition, financial assets at fair value through profit or loss are measured at fair value. Any
gains or losses arising from changes in fair value of the financial assets are recognised in the consolidated statement of
comprehensive income. Net gains or net losses on financial assets at fair value through profit or loss include exchange
differences, interest and dividend income.
(b) Loans and receivables
Financial assets with fixed or determinable payments that are not quoted in an active market are classified as loans
and receivables. Such assets are measured at amortised cost using the effective interest method. Gains and losses are
recognised in the consolidated statement of comprehensive income when the loans and receivables are derecognised or
impaired, as well as through the amortisation process.
3.14 Derivative financial instruments
Future commodity contracts
The Group applies the provisions of FRS 39, “Financial Instruments: Recognition and Measurement”. FRS 39 requires that all of
the following conditions to be met for a hedging relationship to qualify as hedge accounting: (a) at the inception of the hedge
there is formal designation and documentation of the hedging relationship and the Group’s risk management objective and
strategy for undertaking the hedge; (b) the hedge is expected to be highly effective in achieving offsetting changes in fair value
or cash flows attributable to the hedged risk; (c) for cash flow hedges, a forecast transaction that is the subject of the hedge
must be highly probable and must present an exposure to variations in cash flows that could ultimately affect profit or loss; (d)
the effectiveness of the hedge can be reliably measured; and (e) the hedge is assessed on an ongoing basis and determined
actually to have been highly effective throughout the financial reporting periods for which the hedge was designated.
The related receivables and payables arising from the above transaction are presented in the consolidated balance sheet as
regular financial instruments and are carried at fair values based on the quoted market prices of the related commodity.
3.15 Cash and cash equivalents
Cash and cash equivalents comprise cash on hand and in banks, and short term deposits with an original maturity of 3 months
or less at the time of placements and not restricted as to use.
Cash and cash equivalents carried in the consolidated balance sheet are classified and accounted for as loans and receivables
under FRS 39. The accounting policy for this category of financial assets is stated in Note 3.13.
6 8

NOTES TO THE FINANCIAL STATEMENTS31 December 2009
3. Summary of significant accounting policies (cont’d)
3.16 Trade and other receivables
Trade and other receivables are classified and accounted for as loans and receivables under FRS 39. The accounting policy for this
category of financial assets is stated in Note 3.13.
An allowance is made for uncollectible amounts when there is objective evidence that the Group will not be able to collect the
debt. Bad debts are written off when identified. Further details on the accounting policy for impairment of financial assets are
stated in Note 3.17.
3.17 Impairment of financial assets
The Group assesses at each balance sheet date whether there is any objective evidence that a financial asset or group of financial
assets is impaired.
(a) Financial assets carried at amortised cost
If there is objective evidence that an impairment loss on financial assets carried at amortised cost has been incurred, the
amount of the impairment loss is measured as the difference between the asset’s carrying amount and the present value of
estimated future cash flows (excluding future credit losses that have not been incurred) discounted at the financial asset’s
original effective interest rate (that is the effective interest rate computed at initial recognition). The carrying amount of
the asset is reduced either directly or through the use of an allowance account. The amount of the loss is recognised in
the consolidated statement of comprehensive income.
In relation to trade receivables, impairment loss is recognised when there is objective evidence (such as the probability of
insolvency or significant financial difficulties of the debtor) that the Group will not be able to collect all the amounts due
under the original terms of the invoice. The carrying amount of the receivable is reduced through the use of an allowance
account. Impaired debts are derecognised when they are assessed as uncollectible.
If, in a subsequent period, the amount of the impairment loss decreases and the decrease can be related objectively
to an event occurring after the impairment was recognised, the previously recognised impairment loss is reversed. Any
subsequent reversal of an impairment loss is recognised in the consolidated statement of comprehensive income, to the
extent that the carrying value of the asset does not exceed its amortised cost at the reversal date.
(b) Financial assets carried at cost
If there is objective evidence that an impairment loss on financial assets carried at cost has been incurred, the amount of
the loss is measured as the difference between the asset’s carrying amount and the present value of estimated future cash
flows discounted at the current market rate of return for a similar financial asset. Such impairment losses are not reversed
in subsequent periods.
3.18 Inventories
Inventories are stated at the lower of cost and net realisable value. Cost is calculated using weighted-average method.
Cost incurred in bringing each product to its present location and condition is accounted for as follows:
Raw materials, goods in transit, spare parts and
factory supplies
– purchase cost; and
Finished goods and work in progress – cost of direct materials and labour and a proportion of manufacturing
overheads based on normal operating capacity but excluding
borrowing costs.
6 9B U I L D I N G S U S T A I N A B L E G R O W T HINDOFOOD AGRI RESOURCES LTD. ANNUAL REPORT 2009

NOTES TO THE FINANCIAL STATEMENTS31 December 2009
3. Summary of significant accounting policies (cont’d)
3.18 Inventories (cont’d)
Net realisable value is the estimated selling price in the ordinary course of business, less estimated costs of completion and the
estimated costs necessary to make the sale.
3.19 Financial liabilities
Financial liabilities within the scope of FRS 39 are recognised on the balance sheet when, and only when, the Group becomes a
party to the contractual provisions of the financial instrument.
Financial liabilities are recognised initially at fair value, plus, in the case of financial liabilities other than derivatives, directly
attributable transaction costs.
Subsequent to initial recognition, derivatives are measured at fair value. Other financial liabilities (except for financial guarantee)
are measured at amortised cost using the effective interest method.
For financial liabilities other than derivatives, gains and losses are recognised in the consolidated statement of comprehensive
income when the liabilities are derecognised, and through the amortisation process. Any gains or losses arising from changes in
fair value of derivatives are recognised in the consolidated statement of comprehensive income. Net gains or losses on derivatives
include exchange differences.
A financial liability is derecognised when the obligation under the liability is extinguished. When an existing financial
liability is replaced by another from the same lender on substantially different terms, or the terms of an existing liability
are substantially modified, such an exchange or modification is treated as a derecognition of the original liability and
the recognition of a new liability, and the difference in the respective carrying amounts is recognised in the consolidated
statement of comprehensive income.
3.20 Provisions
Provisions are recognised when the Group has a present obligation (legal or constructive) where, as a result of a past event, it
is probable that an outflow of resources embodying economic benefits will be required to settle the obligation and a reliable
estimate can be made of the amount of the obligation.
Provisions are reviewed at each balance sheet date and adjusted to reflect the current best estimate. The provision is released if
it is no longer probable that an outflow of resources embodying economic benefits will be required to settle the obligation.
3.21 Trade and other payables
Liabilities for trade and other amounts payable are initially recognised at fair value and subsequently measured at amortised cost
using the effective interest method.
Gains and losses are recognised in the consolidated statement of comprehensive income when the liabilities are derecognised as
well as through the amortisation process.
3.22 Interest-bearing loans and borrowings
All loans and borrowings are initially recognised at the fair value of the consideration received less directly attributable transaction
costs. After initial recognition, interest-bearing loans and borrowings are subsequently measured at amortised cost using the
effective interest method. Gains and losses are recognised in the consolidated statement of comprehensive income when the
liabilities are derecognised as well as through the amortisation process.
7 0

NOTES TO THE FINANCIAL STATEMENTS31 December 2009
3. Summary of significant accounting policies (cont’d)
3.23 Borrowing costs
Borrowing costs are capitalised if they are directly attributable to the acquisition, construction or production of a qualifying asset.
Capitalisation of borrowing costs commences when the activities to prepare the qualifying asset for its intended use or sale are in
progress and the expenditures and borrowing costs for the qualifying assets are being incurred. Borrowing costs are capitalised
until the assets are ready for their intended use or sale.
3.24 Employee benefits
(a) Defined contribution plans
The Group participates in the national pension schemes as defined by the laws of the countries in which it has
operations. Contributions to national pension schemes are recognised as an expense in the period in which the
related service is performed.
Certain subsidiaries in the Group have defined contribution retirement plans covering all of its qualified permanent
employees. The Group’s contributions to the funds are computed at 10.0% and 7.0% of the basic pensionable
income for staff and non-staff employees, respectively. The related liability arising from the difference between
the cumulative funding since the establishment of the program and the cumulative pension costs charged to the
consolidated statement of comprehensive income during the same period is recognised as employee benefits liabilities
in the consolidated balance sheet.
(b) Defined benefit plans
The Group also provides additional provisions for employee service entitlements in order to meet the minimum benefits
required to be paid to qualified employees, as required under the Indonesian Labour Law No.13/2003 (the “Labour
Law”). The said additional provisions, which are unfunded, are estimated using actuarial calculations based on the report
prepared by an independent firm of actuaries.
Actuarial gains or losses are recognised in the consolidated statement of comprehensive income when the net cumulative
unrecognised actuarial gains or losses at the end of the previous reporting year exceed 10.0% of the defined benefit
obligation at that date. Such gains or losses in excess of the 10.0% corridor are amortised on a straight-line method over
the expected average remaining service years of the covered employees.
Past service cost is recognised as an expense on a straight-line basis over the average period until the benefit becomes
vested. To the extent that the benefit is already vested immediately following the introduction of, or changes to, the
employee benefit program, the Group recognises past service cost immediately.
The related estimated liability for employee benefits is the aggregate of the present value of the defined benefit obligations
at balance sheet date and unrecognised actuarial gains and losses, less unrecognised past service cost.
3.25 Leases
The determination of whether an arrangement is, or contains a lease is based on the substance of the arrangement at inception
date: whether fulfilment of the arrangement is dependent on the use of a specific asset or assets or the arrangement conveys a
right to use the asset. For arrangements entered into prior to 1 January 2005, the date of inception is deemed to be 1 January
2005 in accordance with the transitional requirements of INT FRS 104.
7 1B U I L D I N G S U S T A I N A B L E G R O W T HINDOFOOD AGRI RESOURCES LTD. ANNUAL REPORT 2009

NOTES TO THE FINANCIAL STATEMENTS31 December 2009
3. Summary of significant accounting policies (cont’d)
3.25 Leases (cont’d)
(a) As lessee
Finance leases, which transfer to the Group substantially all the risks and rewards incidental to ownership of the leased
item, are capitalised at the inception of the lease at the fair value of the leased asset or, if lower, at the present value
of the minimum lease payments. Any initial direct costs are also added to the amount capitalised. Lease payments are
apportioned between the finance charges and reduction of the lease liability so as to achieve a constant rate of interest
on the remaining balance of the liability. Finance charges are charged to the consolidated statement of comprehensive
income. Contingent rents, if any, are charged as expenses in the periods in which they are incurred.
Capitalised leased assets are depreciated over the shorter of the estimated useful life of the asset and the lease term, if
there is no reasonable certainty that the Group will obtain ownership by the end of the lease term.
Operating lease payments are recognised as an expense in the consolidated statement of comprehensive income on
a straight-line basis over the lease term. The aggregate benefit of incentives provided by the lessor is recognised as a
reduction of rental expense over the lease term on a straight-line basis.
(b) As lessor
Leases where the Group retains substantially all the risks and rewards of ownership of the asset are classified as operating
leases. Initial direct costs incurred in negotiating an operating lease are added to the carrying amount of the leased asset
and recognised over the lease term on the same bases as rental income. The accounting policy for rental income is set
out in Note 2.26(c).
(c) Prepaid land premiums and land use rights
Prepaid land premiums for land lease payments under operating leases are initially stated at cost and subsequently
recognised as an expense in the consolidated statement of comprehensive incomes on a straight-line basis over the
lease terms.
Land right that has a limited useful life and which represent prepaid land premiums is depreciated in a manner that reflects
the benefits to be derived from it, and is presented as Prepaid Land Premiums and Deferred Land Rights Acquisition Costs
in the consolidated balance sheet. Costs associated with the legal transfer or renewal of land title, such as legal fees, land
survey and re-measurement fees, taxes and other related expenses, are deferred and amortised using the straight-line
method over the legal terms of the related land rights.
3.26 Revenue
Revenue is recognised to the extent that it is probable that the economic benefits will flow to the Group and the revenue can be
reliably measured. The following specific recognition criteria must also be met before revenue is recognised:
(a) Sale of goods
Revenue from sales arising from physical delivery of palm based products, copra-based products, edible oils and other
agricultural products is recognised when significant risks and rewards of ownership of goods are transferred to the buyer,
which generally coincide with their delivery and acceptance.
(b) Interest income
Interest income is recognised using the effective interest method, unless collectability is in doubt.
7 2

NOTES TO THE FINANCIAL STATEMENTS31 December 2009
3. Summary of significant accounting policies (cont’d)
3.26 Revenue (cont’d)
(c) Rental and storage income
Rental and storage income is recognised on a straight-line basis over the lease terms.
(d) Dividend income
Dividend income is recognised when the right to receive payment is established.
3.27 Taxes
(a) Current tax
Current tax assets and liabilities are measured at the amount expected to be recovered from or paid to the taxation
authorities. The tax rates and tax laws used to compute the amount are those that are enacted or substantively enacted
by the balance sheet date.
Current taxes are recognised in the consolidated statement of comprehensive income except to the extent that the tax
relates to items recognised outside profit or loss, either in other comprehensive income or directly in equity.
(b) Deferred tax
Deferred income tax is provided using the liability method on temporary differences at the balance sheet date between
the tax bases of assets and liabilities and their carrying amounts for financial reporting purposes.
Deferred tax liabilities are recognised for all temporary differences, except:
- where the deferred income tax liability arises from the initial recognition of goodwill or of an asset or liability in a
transaction that is not a business combination and, at the time of the transaction, affects neither the accounting
profit nor taxable profit or loss; and
- in respect of taxable temporary differences associated with investments in subsidiaries, associates and interests in
joint ventures, where the timing of the reversal of the temporary differences can be controlled and it is probable
that the temporary differences will not reverse in the foreseeable future.
Deferred income tax assets are recognised for all deductible temporary differences, carry forward of unused tax credits
and unused tax losses, to the extent that it is probable that taxable profit will be available against which the deductible
temporary differences, and the carry forward of unused tax credits and unused tax losses can be utilised except:
- where the deferred income tax asset relating to the deductible temporary difference arises from the initial recognition
of an asset or liability in a transaction that is not a business combination and, at the time of the transaction, affects
neither the accounting profit nor taxable profit or loss; and
- in respect of deductible temporary differences associated with investments in subsidiaries, associates and interests
in joint ventures, deferred income tax assets are recognised only to the extent that it is probable that the temporary
differences will reverse in the foreseeable future and taxable profit will be available against which the temporary
differences can be utilised.
7 3B U I L D I N G S U S T A I N A B L E G R O W T HINDOFOOD AGRI RESOURCES LTD. ANNUAL REPORT 2009

NOTES TO THE FINANCIAL STATEMENTS31 December 2009
3. Summary of significant accounting policies (cont’d)
3.27 Taxes (cont’d)
(b) Deferred tax (cont’d)
The carrying amount of deferred tax assets is reviewed at each balance sheet date and reduced to the extent that it is no
longer probable that sufficient taxable profit will be available to allow all or part of the deferred tax asset to be utilised.
Unrecognised deferred tax assets are reassessed at each balance sheet date and are recognised to the extent that it has
become probable that future taxable profit will allow the deferred tax asset to be utilised.
Deferred tax assets and liabilities are measured at the tax rates that are expected to apply to the year when the asset is
realised or the liability is settled, based on tax rates and tax laws that have been enacted or substantively enacted at the
balance sheet date.
Deferred income tax relating to items recognised outside profit or loss is recognised outside profit or loss. Deferred tax
items are recognised in correlation to the underlying transaction either in other comprehensive income or directly in equity
and deferred tax arising from a business combination is adjusted against goodwill on acquisition.
Deferred income tax assets and deferred income tax liabilities are offset, if a legally enforceable right exists to set off
current tax assets against current income tax liabilities and the deferred income taxes relate to the same taxable entity and
the same taxation.
(c) Sales tax
Revenues, expenses and assets are recognised net of the amount of Value-Added Tax (“VAT”) except:
– where the VAT incurred on a purchase of assets or services is not recoverable from the taxation authority, in which case
the VAT is recognised as part of the cost of acquisition of the asset or as part of the expense item as applicable; and
– receivables and payables that are stated with the amount of VAT included.
The net amount of VAT recoverable from, or payable to, the taxation authority is included as part of receivables or payables
in the consolidated balance sheet.
3.28 Related parties
A party is considered to be related to the Group if it possesses the ability (directly or indirectly) to control or exercise significant
influence over the operating and financial decisions of the Group or vice-versa and/or subject to common control or common
significant influence.
3.29 Segment reporting
For management purposes, the Group is organised into operating segments based on their products and services which are
independently managed by the respective segment managers responsible for the performance of the respective segments under
their charge. The segment managers report directly to the management of the Company who regularly review the segment
results in order to allocate resources to the segments and to assess the segment performance. Additional disclosures on each
of these segments are shown in Note 38, including the factors used to identify the reportable segments and the measurement
basis of segment information.
3.30 Share capital and share issue expenses
Proceeds from issuance of ordinary shares are recognised as share capital in equity. Incremental costs directly attributable to the
issuance of ordinary shares are deducted against share capital.
7 4

NOTES TO THE FINANCIAL STATEMENTS31 December 2009
3. Summary of significant accounting policies (cont’d)
3.31 Treasury shares
When shares recognised as equity are reacquired, the amount of consideration paid is recognised directly in equity. Reacquired
shares are classified as treasury shares and presented as a deduction from total equity. No gain or loss is recognised in the
statement of comprehensive income on the purchase, sale, issue or cancellation of treasury shares.
3.32 Contingencies
A contingent liability or asset is a possible obligation or asset that arises from past events and whose existence will be confirmed
only by the occurrence or non-occurrence of uncertain future event(s) not wholly within the control of the Group.
Contingent liabilities and assets are not recognised on the balance sheet of the Group.
4. Significant accounting estimates and judgements
The preparation of the Group’s financial statements requires management to make judgements, estimates and assumptions
that affect the reported amounts of revenues, expenses, assets and liabilities, and the disclosure of contingent liabilities at the
reporting date. However, uncertainty about these assumptions and estimates could result in outcomes that could require a
material adjustment to the carrying amount of the asset or liability affected in the future.
4.1 Judgements made in applying accounting policies
In the process of applying the Group’s accounting policies, management has made the following judgements, apart from those
involving estimations, which has the most significant effect on the amounts recognised in the financial statements:
(a) Classification of financial assets and financial liabilities
The Group determines the classification of certain of assets and liabilities as financial assets and financial liabilities by
judging if they meet the definition set out in FRS 32. Accordingly, the financial assets and financial liabilities are accounted
for in accordance with the Group’s accounting policies set out in Note 3.13 and Note 3.19 respectively.
(b) Purchase price allocation and goodwill impairment
Purchase accounting requires extensive use of accounting estimates to allocate the purchase price to the fair market values
of the assets and liabilities purchased, including intangible assets and contingent liabilities. Certain business acquisitions
of the Group have resulted in goodwill. Under FRS 103, such goodwill is not amortised and is subject to a periodic
impairment testing. The carrying amount of the Group’s goodwill as at 31 December 2009 is Rp3,155.8 billion (2008:
Rp2,994.5 billion). Further details are disclosed in Note 17.
In determining the fair values of biological assets at the date of business combination, which require the determination of
future cash flows expected to be generated from the continued use and ultimate disposition of such assets, requires the
Group to make estimates and assumptions that can materially affect its consolidated financial information. Future events
could cause the Group to conclude that biological assets are impaired. The preparation of estimated future cash flows
involves significant estimations. While the Group believes that its assumptions are appropriate and reasonable, significant
changes in its assumptions may materially affect its assessment of recoverable values and may lead to impairment charge
in the future.
Impairment review is performed when certain impairment indication is present. In the case of goodwill, such assets are
subject to annual impairment test and whenever there is an indication that such asset may be impaired. Management has
to use its judgement in estimating the recoverable value and determining if there is any indication of impairment.
7 5B U I L D I N G S U S T A I N A B L E G R O W T HINDOFOOD AGRI RESOURCES LTD. ANNUAL REPORT 2009

NOTES TO THE FINANCIAL STATEMENTS31 December 2009
4. Significant accounting estimates and judgements (cont’d)
4.1 Judgements made in applying accounting policies (cont’d)
(c) Allowance for doubtful debts
The Group evaluates specific accounts where it has information that certain customers are unable to meet their financial
obligations. In these cases, the Group uses judgement, based on the best available facts and circumstances, including but
not limited to, the length of its relationship with the customer and the customer’s current credit status based on third party
credit reports and known market factors, to record specific allowance against amount due from such customers to reduce
its receivable to the amount the Group expects to collect. These specific allowances are re-evaluated and adjusted as
additional information received affects the amounts of allowance for doubtful debts. The carrying amount of the Group’s
trade receivables before allowance for doubtful debts as at 31 December 2009 is Rp553.3 billion (2008: Rp568.0 billion).
Further details are disclosed in Note 24.
(d) Allowance for uncollectible plasma receivables
The Group evaluates the excess of accumulated development costs over the bank’s and Group’s funding on the amount
agreed by the plasma farmers. In these cases, the Group uses judgement, based on available facts and circumstances,
to record allowance for uncollectible plasma receivables. These provisions are re-evaluated and adjusted as additional
information received. The net carrying amount of the Group’s plasma receivables as of 31 December 2009 and 2008 is
Rp456.8 billion and Rp359.0 billion, respectively. Further details are disclosed in Note 33(a).
(e) Allowance for unrecoverable advances for purchase of land
The Group evaluates the sufficiency of allowance for advances for purchase of land based on its assessment over the plot
of land rights that the related titles of ownership cannot be transferred to the Group. The net carrying amount of the
Group’s advance for purchase of land as of 31 December 2009 is Rp158.5 billion (2008: Rp181.2 billion).
4.2 Key sources of estimation uncertainty
The key assumptions concerning the future and other key sources of estimation uncertainty at the balance sheet date, that have
a significant risk of causing a material adjustment to the carrying amounts of assets and liabilities within the next financial year
are discussed below.
(a) Pension and employee benefits
The determination of the Group’s obligations and cost for pension and employee benefits liabilities is dependent on its
selection of certain assumptions used by independent actuaries in calculating such amounts. Those assumptions include
among others, discount rates, future annual salary increase, annual employee turn-over rate, disability rate, retirement age
and mortality rate. Actual results that differ from the Group’s assumptions are recognised immediately in the consolidated
statement of comprehensive income as and when they occur. While the Group believes that its assumptions are reasonable
and appropriate, significant differences in the Group’s actual experiences or significant changes in the Group’s assumptions
may materially affect its estimated liabilities for pension and employee benefits and net employee benefits expense. The
carrying amount of the Group’s employee benefits liabilities as at 31 December 2009 is Rp443.0 billion (2008: Rp355.4
billion). Further details are given in Note 29.
7 6

NOTES TO THE FINANCIAL STATEMENTS31 December 2009
4. Significant accounting estimates and judgements (cont’d)
4.2 Key sources of estimation uncertainty (cont’d)
(b) Depreciation of property, plant and equipment
The cost of property, plant and equipment are depreciated on a straight-line basis over their estimated useful lives.
Management estimates the useful lives of these property, plant and equipment to be within 3 to 25 years. These
are common life expectancies applied in the industries where the Group conducts its businesses. Changes in the
expected level of usage and technological development could impact the economic useful lives and the residual values
of these assets, and therefore future depreciation charges could be revised. The net carrying amount of the Group’s
property, plant and equipment as at 31 December 2009 is Rp4,223.5 billion (2008: Rp2,963.7 billion). Further details
are disclosed in Note 15.
(c) Biological assets
The Group carries its oil palm and rubber plantations and other smaller plantations at fair value less estimated point-of-
sale costs, which require extensive use of accounting estimates. Significant components of fair value measurement were
determined using assumptions including average lives of plantations, period of being immature and mature plantations,
yield per hectare and annual discount rates. The amount of changes in fair values would differ if there are changes to
the assumptions used. Any changes in fair values of these plantations would affect the Group’s consolidated statement
of comprehensive income and equity. The carrying amount of the Group’s biological assets as at 31 December 2009 is
Rp9,486.1 billion (2008: Rp8,152.9 billion). Further details are disclosed in Note 14.
(d) Financial instruments
The Group carries certain financial assets and liabilities at fair values, which requires extensive use of accounting estimates.
While significant components of fair value measurement were determined using verifiable objective evidences, the amount
of changes in fair values would differ if the Group utilised a different valuation methodology. Any change in fair values of
these financial assets and liabilities would directly affect the Group’s consolidated statement of comprehensive income.
The carrying amount of net receivables under future commodity contracts carried at fair values as at 31 December 2009 is
Rp104.6 billion (2008: Rp128.6 billion). The carrying amount of net payables under future commodity contracts carried at
fair values as at 31 December 2009 is Rp104.9 billion (2008: Rp124.7 billion). Further details are disclosed in Note 33(b).
(e) Income tax
Significant judgment is involved in determining provision for income tax. There are certain transactions and computation
for which the ultimate tax determination is uncertain during the ordinary course of business. The Group recognises
liabilities for expected income tax issues based on estimates of whether additional income taxes will be due. Where the
final income tax outcome of these matters is different from the amounts that were initially recognised, such differences
will impact the income tax and deferred income tax in the year in which such decision is made by the taxation authority.
The carrying amount of the Group’s tax payables as at 31 December 2009 is Rp106.2 billion (2008: Rp403.9 billion).
(f) Allowance for decline in market value of inventories and obsolescence of inventories
Allowance for decline in market value of inventories and obsolescence of inventories is estimated based on the best
available facts and circumstances, including but not limited to, the inventories’ own physical conditions, their market
selling prices, estimated costs of completion and estimated costs to be incurred for their sales. The provisions are re-
evaluated and adjusted as additional information received affects the amount estimated. The carrying amount of the
Group’s inventories as at 31 December 2009 is Rp1,082.6 billion (2008: Rp910.5 billion). Further details are disclosed in
Note 23.
7 7B U I L D I N G S U S T A I N A B L E G R O W T HINDOFOOD AGRI RESOURCES LTD. ANNUAL REPORT 2009

NOTES TO THE FINANCIAL STATEMENTS31 December 2009
4. Significant accounting estimates and judgements (cont’d)
4.2 Key sources of estimation uncertainty (cont’d)
(g) Deferred tax assets
Deferred tax assets are recognized for all unused tax losses to the extent that it is probable that taxable profit will
be available against which the losses can be utilized. Significant management estimates are required to determine the
amount of deferred tax assets that can be recognized, based upon the likely timing and the level of future taxable profits
together with future tax planning strategies. The carrying amount of the Group’s deferred tax assets as at 31 December
2009 is Rp294.3 billion (2008: Rp239.3 billion).
5. Revenue
Group2009 2008
Rp’ million Rp’ million
Net sales of palm oil based products, edible oils, oil palm seeds and other
agricultural products 9,040,325 11,840,499
6. Cost of sales
Group2009 2008
Rp’ million Rp’ million
Raw materials used 2,839,744 4,672,062Overheads 2,679,137 2,649,413Depreciation and amortisation 307,705 217,496Changes in work-in-process and finished goods inventories (11,624) 172,424
5,814,962 7,711,395
7. Other operating income
GroupNote 2009 2008
Rp’ million Rp’ million
Sundry sales of oil palm seedlings 9,490 16,768Changes in provision for asset dismantling costs 28 (3,219) 2,416(Loss)/gain on disposal of biological assets (5,146) 1,610Gains from dilution of shareholding in a subsidiary 56,286 –Others 71,053 34,393
Total 128,464 55,187
7 8

NOTES TO THE FINANCIAL STATEMENTS31 December 2009
8. Other operating expenses
GroupNote 2009 2008
Rp’ million Rp’ million
Provision for uncollectible plasma receivables 33(a) 25,269 23,951(Gain)/loss arising from changes in fair value of plasma receivables 33(a) (886) 13,344 (Reversal)/provision for decline in market value of inventories and
obsolescence of inventories 23 (10,343) 24,766 Loss on write-off of property, plant and equipment 1,667 1,468 Loss on write-off of biological assets 14 – 387Loss on write-off of plasma receivables 33(a) 26,602 14,451Loss on future commodity contract transactions 1,137 3,158 Loss on disposal of property and equipment 918 1,972 Others 24,912 18,157
69,276 101,654
9. Profit from operations
GroupNote 2009 2008
Rp’ million Rp’ million
(i) The following items have been included in arriving at profit from
operations:
Charging/(crediting):Depreciation and amortisation- Depreciation of property, plant and equipment 15 279,376 225,398- Amortisation of prepaid land premiums and deferred land rights
acquisition costs 16 62,633 50,817- Amortisation of other non-current assets 996 566Non-audit fees to the auditors of the Company – 322Research and development costs 32,118 29,914Operating lease rentals 14,726 17,716Write-back of allowance for doubtful debts 24 (165) (2,128)
(ii) Employee benefits during the financial year included :
- Wages and salaries 707,507 700,946- Provision for employee benefits 29 119,266 109,044- Contribution to defined contribution pension plan 13,016 12,161 - Training and education 21,556 23,964
861,345 846,115
7 9B U I L D I N G S U S T A I N A B L E G R O W T HINDOFOOD AGRI RESOURCES LTD. ANNUAL REPORT 2009

NOTES TO THE FINANCIAL STATEMENTS31 December 2009
10. Financial income
Group2009 2008
Rp’ million Rp’ million
Interest income :- Current accounts and short term deposits 46,384 61,884- Plasma receivables 19,639 10,648- Repurchase receivables 324 7,749- Other receivables from a majority shareholder – 302- Others 283 1,828
Total 66,630 82,411
11. Financial expenses
Group2009 2008
Rp’ million Rp’ million
Interest expense :- Bank loans 418,231 411,199- Bank charges 17,843 10,120- Bonds payable 4,366 –- Finance leases 1,645 596- Others 1,186 297
Total 443,271 422,212
8 0

NOTES TO THE FINANCIAL STATEMENTS31 December 2009
12. Income tax expense
The major components of income tax expense for the years ended 31 December 2009 and 2008 are as follows:
GroupNote 2009 2008
Rp’ million Rp’ million
Income tax in respect of profit for the year:- current income tax 714,634 1,040,002- deferred income tax 101,174 (614,334)
815,808 425,668Underprovision in respect of prior years:- current income tax 255 5,459- deferred income tax 18,235 21,231
Income tax expense recognised in the statement of comprehensive income 834,298 452,358
A reconciliation between the profit before taxation multiplied by the applicable tax rate and the income tax expense is
as follows:
Profit before taxation as per consolidated statement of comprehensive income 2,887,560 1,519,075
Tax expense at the applicable tax rates 800,849 456,084Non-taxable income (119,016) (7,374)Non-deductible expenses 139,078 210,705Effect of tax rate changes 19 (5,103) (233,747)Underprovision in respect of prior years 18,490 26,690
Income tax expense recognised in the statement of comprehensive income 834,298 452,358
Companies in Indonesia and Singapore are generally subject to progressive tax rates up to a maximum of 28% and 17% (2008:
30% and 18%) respectively.
13. Earnings per share
Basic earnings per share amounts are calculated by dividing profit for the year attributable to owners of the parent company by
the weighted average number of ordinary shares outstanding during the year.
The following reflects the profit attributable to owners of the parent company and share data used in the basic and diluted
earnings per share computation:
Group2009 2008
Rp’ million Rp’ million
Profit attributable to owners of the parent company 1,526,829 795,284
No. of shares No. of shares
Weighted average number of ordinary shares 1,438,782,830 1,446,733,515
There were no dilutive potential ordinary shares as at 31 December 2009 and 2008.
8 1B U I L D I N G S U S T A I N A B L E G R O W T HINDOFOOD AGRI RESOURCES LTD. ANNUAL REPORT 2009

NOTES TO THE FINANCIAL STATEMENTS31 December 2009
14. Biological assets
Biological assets primarily comprise oil palm and rubber plantations. The following shows the movement in their carrying value:
GroupNote 2009 2008
Rp’ million Rp’ million
At fair value
At 1 January 8,152,865 8,302,497Additions 742,363 742,052Additions from acquired subsidiaries 32 612 53,530Write-off of biological assets 8 – (387)Disposal of biological assets (6,527) (6,507)Reclassification (to)/from property, plant and equipment and
other non-current assets (25,787) 8,9068,863,526 9,100,091
Gain/(loss) arising from changes in fair value of biological assets 622,570 (947,226)
At 31 December 9,486,096 8,152,865
Mature oil palm trees produce Fresh Fruit Bunches (“FFB”), which are used to produce CPO and Palm Kernel. The fair values of oil
palm plantations are determined by an independent valuer using the discounted future cash flows of the underlying plantations.
The expected future cash flows of the oil palm plantations are determined using the forecast market price of FFB, which is largely
dependent on the projected selling prices of CPO and Palm Kernel Oil (“PKO”) in the market.
Significant assumptions made in determining the fair values of the oil palm plantations are as follows:
(a) oil palm trees have an average life that ranges from 20 to 25 years, with the first 3 to 4 years as immature and the
remaining years as mature;
(b) yield per hectare of oil palm trees is determined by reference to guidelines issued by the Indonesian Oil Palm Research
Institute (“Pusat Penelitian Kelapa Sawit”) in Indonesia, which varies with the average age of oil palm trees, as well as
internal standards and results of internal assessments of other relevant factors;
(c) the discount rate used in 2009 is 19.22% (2008: 19.33%). Such a discount rate represents the asset specific rate for the
Group’s oil palm plantation operations which is applied in the discounted future cash flows calculation; and,
(d) the projected selling price of CPO over the projection period is based on the World Bank forecasts for 2009 valuation
(2008: consensus of reputable independent forecasting service firms for the short-term period and on the studies of
historical actual CPO prices for the last 20 years and World Bank forecasts for the remaining projection period).
Mature rubber trees produce cup lump. The fair values of rubber plantations are determined using the discounted future cash
flows of the underlying plantations. The expected future cash flows of the rubber plantations are determined using the forecast
market price of cup lump which are based on the projected selling price of Rubber Smoke Sheet 1 (“RSS1”).
8 2

NOTES TO THE FINANCIAL STATEMENTS31 December 2009
14. Biological assets (cont’d)
Significant assumptions made in determining the fair values of the rubber plantations are as follows:
(a) rubber trees have an average life that ranges from 20 to 25 years, with the first 5 to 6 years as immature and the remaining
years as mature;
(b) discount rate used in 2009 is 18.59% (2008: 18.21%). Such a discount rate represents the asset specific rate for the Group’s
rubber plantations operations which is applied in the discounted future cash flows calculation; and
(c) the projected selling price of RSS1 over the projected period is based on World Bank forecasts and actual historical selling
prices of the Group.
During 2009, the Group’s oil palm plantations produced approximately 2.6 million tonnes (2008: 2.5 million tonnes) of FFB. The
selling prices per tonne for those FFB ranged between Rp0.6 million to Rp1.6 million (2008: Rp0.5 million to Rp2.0 million).
During 2009, the Group’s rubber plantations produced about 28.3 thousand tonnes (2008: 28.1 thousand tonnes) of cup lump.
The selling prices per tonne ranged between Rp7.0 million to Rp14.5 million (2008: Rp7.0 million to Rp14.3 million).
An analysis for the areas of mature and immature plantations of each group of biological assets is as follows:
2009 2008Mature (Ha) Immature (Ha) Mature (Ha) Immature (Ha)
Oil palm 132,560 61,053 124,169 58,944Rubber 17,263 4,475 17,873 4,537Others 11,643 727 7,044 761
Capitalisation of borrowing costs
During the year ended 31 December 2009, borrowing costs capitalised to biological assets of the Group in the course of
construction amounted to Rp77.2 billion (2008: Rp65.1 billion) based on the specific identification of the related borrowings.
Assets pledged as security
Biological assets with a carrying value of Rp557.2 billion (2008: Rp4,615.9 billion) as at 31 December 2009 were used as
collateral for bank facilities granted to the Group (Note 27).
8 3B U I L D I N G S U S T A I N A B L E G R O W T HINDOFOOD AGRI RESOURCES LTD. ANNUAL REPORT 2009

NOTES TO THE FINANCIAL STATEMENTS31 December 2009
15. Property, plant and equipment
Buildings andimprovements
Plant andmachinery
Heavyequipment andtransportation
equipment
Furniture,fixtures
and officeequipment Total
Rp’ million Rp’ million Rp’ million Rp’ million Rp’ million
Group
CostAt 1 January 2008 1,004,642 1,296,920 313,670 109,006 2,724,238Additions 355,109 411,857 67,686 24,207 858,859Additions from acquired subsidiaries
(Note 32) 159,262 211,983 20,240 2,579 394,064Reclassification 1,251 – – – 1,251Disposals and write-off (10,127) (10,406) (4,905) (3,997) (29,435)
At 31 December 2008 and
1 January 2009 1,510,137 1,910,354 396,691 131,795 3,948,977Additions 243,044 1,158,780 131,081 28,634 1,561,539Reclassification 19,955 (24,731) 794 198 (3,784)Disposals and write-off (3,286) (11,440) (9,106) (3,982) (27,814)
At 31 December 2009 1,769,850 3,032,963 519,460 156,645 5,478,918
Accumulated depreciationAt 1 January 2008 139,855 455,071 132,651 50,824 778,401Depreciation charge for the year 52,259 102,289 54,912 15,938 225,398Reclassification 1,496 2,826 1,281 966 6,569Disposals and write-off (8,012) (9,688) (4,206) (3,173) (25,079)
At 31 December 2008 and
1 January 2009 185,598 550,498 184,638 64,555 985,289Depreciation charge for the year 64,571 129,955 64,958 19,892 279,376Reclassification 3,439 3,796 4,231 1,336 12,802Disposals and write-off (1,440) (10,132) (7,590) (2,844) (22,006)
At 31 December 2009 252,168 674,117 246,237 82,939 1,255,461
Net carrying amountAt 31 December 2008 1,324,539 1,359,856 212,053 67,240 2,963,688
At 31 December 2009 1,517,682 2,358,846 273,223 73,706 4,223,457
8 4

NOTES TO THE FINANCIAL STATEMENTS31 December 2009
15. Property, plant and equipment (cont’d)
Buildings andimprovements
Furniture,fixtures
and officeequipment Total
Rp’ million Rp’ million Rp’ million
Company
CostAt 1 January 2008 193 244 437Additions 74,049 71 74,120
At 31 December 2008 and 1 January 2009 74,242 315 74,557Additions – 21 21Disposals and write-off (193) (32) (225)
At 31 December 2009 74,049 304 74,353
Accumulated depreciationAt 1 January 2008 68 63 131Additions 64 90 154
At 31 December 2008 and 1 January 2009 132 153 285Additions 4,137 103 4,240Disposals and write-off (149) (24) (173)
At 31 December 2009 4,120 232 4,352
Net carrying amountAt 31 December 2008 74,110 162 74,272
At 31 December 2009 69,929 72 70,001
Assets under construction
Property, plant and equipment of the Group at 31 December 2009 include expenditure for building and machinery in the course
of construction amounting to Rp1,626.9 billion (2008: Rp732.8 billion).
Capitalisation of borrowing costs
During the year ended 31 December 2009, borrowing costs capitalised to property, plant and equipment of the Group
in the course of construction amounted to Rp75.0 billion (2008: Rp1.0 billion) based on the specific identification of the
related borrowings.
Assets pledged as security
Property, plant and equipment with a net book value of Rp378.7 billion (2008: Rp1,983.2 billion) are pledged to secure the
borrowings of the Group as at 31 December 2009 (Note 27).
Assets held under finance lease
As of 31 December 2009, the carrying amount of property, plant, and equipment held under finance lease is Rp19.9 billion
(2008: Rp24.5 billion).
8 5B U I L D I N G S U S T A I N A B L E G R O W T HINDOFOOD AGRI RESOURCES LTD. ANNUAL REPORT 2009

NOTES TO THE FINANCIAL STATEMENTS31 December 2009
16. Prepaid land premiums and deferred land right acquisition costs
Note 2009 2008Rp’ million Rp’ million
At 1 January (including current portion) 1,412,741 1,237,383Addition from acquired subsidiaries 32 324 196,273Addition during the year 53,378 31,281Amortisation charge during the year 9 (62,633) (50,817)Transfer from/(to) other assets 69,459 (1,379)Total 1,473,269 1,412,741Less : Current portion (presented as part of
“Trade and other receivables” account 24 (42,922) (33,455)
At 31 December 1,430,347 1,379,286
Group2009 2008
Rp’ million Rp’ million
Amount to be amortised:Not later than one year 42,922 33,455Later than one year but not later than five years 310,913 252,278Later than five years 1,119,434 1,127,008
1,473,269 1,412,741
Prepaid land premiums and deferred land rights acquisition costs are in respect of:
(a) Prepaid land premiums representing the cost of land rights owned by the Group which has limited useful lives/terms
ranging from 12 to 43 years and amortised on a straight-line basis.
(b) Deferred land rights acquisition costs representing the cost associated with the legal transfer or renewal for titles of land
rights. Such costs are being deferred and amortised on a straight-line basis over the legal terms of the related land rights
ranging from 10 to 44 years.
8 6

NOTES TO THE FINANCIAL STATEMENTS31 December 2009
17. Goodwill
GroupNote 2009 2008
Rp’ million Rp’ million
At 1 January 2,994,523 2,957,293Acquisition of new subsidiaries 32 8,319 42,063Acquisition of minority interests in subsidiaries 32 152,944 –Impairment of goodwill – (4,833)
At 31 December 3,155,786 2,994,523
Goodwill arising from business combination was allocated to the following cash-generating units for impairment testing:
Plantation estates of Lonsum 2,909,757 2,909,757Plantation estates of PT GS 8,055 8,055Plantation estates of PT MPI 2,395 2,395Plantation estates of PT SBN 234 234Plantation estates of PT KGP 29,140 29,140Plantation estates of PT CNIS 7,712 7,712Plantation estates of PT LPI 37,230 37,230Plantation estates of PT SAIN 113,936 –Plantation estates of PT RAP 3,388 –Plantation estates of PT JS 1,533 –Plantation estates of PT MISP 34,087 –Plantation estates of PT IBP 8,319 –
Total 3,155,786 2,994,523
No other impairment loss was recognized for the year ended 31 December 2009 as the recoverable amounts of the goodwill
stated above were in excess of their respective carrying values. Goodwill amounting to RpNil (2008: Rp4.8 billion arising from
Lonsum’s acquisition of PT TMP, PT SAS and PT TAS) was impaired in full as there are no future economic benefits attached to
the said goodwill. The summary of impairment testing on the above-mentioned goodwill is as follows:
Except for goodwill allocated to the plantation estates of PT IBP and Lonsum, the recoverable value of the goodwill of all other
plantation estates as at 31 December 2009 was determined based on fair value less costs to sell (“FVLCTS”), using discounted
cash flow method. The recoverable value of the goodwill allocated to the plantation estates of Lonsum had been determined
based on value-in-use calculations. The following key assumptions had been used:
8 7B U I L D I N G S U S T A I N A B L E G R O W T HINDOFOOD AGRI RESOURCES LTD. ANNUAL REPORT 2009

NOTES TO THE FINANCIAL STATEMENTS31 December 2009
17. Goodwill (cont’d)
Cash generating unitsGoodwill as at
31 December 2009Discount rate
(pre-tax)Terminal
growth rateRp’ million
Plantation estates of Lonsum 2,909,757 18.22% 6.50%Plantation estates of PT GS 8,055 18.57% 6.50%Plantation estates of PT MPI 2,395 18.57% 6.50%Plantation estates of PT SBN 234 18.57% 6.50%Plantation estates of PT KGP 29,140 18.57% 6.50%Plantation estates of PT CNIS 7,712 18.57% 6.50%Plantation estates of PT LPI 37,230 17.36% 6.50%Plantation estates of PT SAIN 113,936 18.57% 6.50%Plantation estates of PT RAP 3,388 18.57% 6.50%Plantation estates of PT JS 1,533 18.57% 6.50%Plantation estates of PT MISP 34,087 18.57% 6.50%Plantation estates of PT IBP 8,319 – –
Total 3,155,786
The recoverable value calculation of the above cash generating units (“CGU”) applied a discounted cash flow model using cash
flow projections covering a period of 10 years for plantation estates. The projected price of the CPO is based on World Bank
forecasts. The projected selling price of RSS1 over the projection period is based on World Bank forecasts and actual historical
selling prices of the Group. The projected sugar price is determined based on World Bank forecasts and average retail sales price
of sugar in Indonesia for the past 5 years. The cash flows beyond the projected periods are extrapolated using the estimated
terminal growth rate indicated above. The discount rate applied to the cash flow projections is derived from the weighted
average cost of capital of the respective CGU. The terminal growth rate used does not exceed the long term average growth
rate of the industry and country in which the entities operate.
Changes to the assumptions used by the management to determine the recoverable value, in particular the discount and
terminal growth rate, can have significant impact on the results of the assessment. Management is of the opinion that no
reasonably possible change in any of the key assumptions stated above would cause the carrying amount of the goodwill for
each of the CGU to materially exceed their recoverable value.
18. Claims for tax refund
Claims for tax refund represent: (a) advance tax payments made by each entity within the Group which is creditable against their
respective corporate income tax payable; and (b) tax assessment being appealed to the tax authorities.
8 8

NOTES TO THE FINANCIAL STATEMENTS31 December 2009
19. Deferred taxation
Consolidated balance sheetConsolidated statement of
comprehensive incomeAs at 31 December Year ended 31 December
Note 2009 2008 2009 2008Rp’ million Rp’ million Rp’ million Rp’ million
Deferred tax assetsProperty, plant and equipment (19,356) (14,431) (3,113) 1,222Biological assets 53,847 62,370 (7,114) 4,441Prepaid land premiums and deferred
land rights acquisition costs (3,940) (3,480) (458) (597)Employee benefits liabilities 41,956 33,125 9,370 8,648Allowance for uncollectible plasma
receivables 20,131 13,876 7,007 10,750Long-term loans to employees (1,039) 387 (1,430) 17Deferred gains on sale-and-leaseback
transactions 6 6 – 3Allowance for decline in market value
and obsolescence of inventories 5,062 8,234 (928) 5,596Allowance for doubtful debts 14 14 – –Finance leases (3,465) (2,810) (1,255) (1,754)Allowance for employees’ benefits
expenses 7,161 6,887 1,044 (256)Deferred inter-company profits 38,695 43,684 (346) 23,989Tax loss carry forward 155,367 91,564 73,693 38,983Others (112) (112) – –Net deferred tax assets reported in
the consolidated balance sheet 294,327 239,314
8 9B U I L D I N G S U S T A I N A B L E G R O W T HINDOFOOD AGRI RESOURCES LTD. ANNUAL REPORT 2009

NOTES TO THE FINANCIAL STATEMENTS31 December 2009
19. Deferred taxation (cont’d)
Consolidated balance sheetConsolidated statement of
comprehensive incomeAs at 31 December Year ended 31 December
Note 2009 2008 2009 2008Rp’ million Rp’ million Rp’ million Rp’ million
Deferred tax liabilitiesProperty, plant and equipment (288,108) (296,184) 3,231 (19,290)Biological assets (1,485,943) (1,285,648) (227,087) 247,311Prepaid land premiums and deferred
land rights acquisition costs (113,815) (126,910) 13,588 21,406Plasma receivables 7,897 8,057 (160) (93)Allowance for unrecoverable advance
for purchase of land 11,000 11,000 – –Allowance for decline in market value
and obsolescence of inventories 305 364 (1,968) 2,411Allowance for doubtful accounts (835) 1,228 (46) (639)Finance lease (905) – 276 –Allowance for employees’ benefits
expenses 36,839 40,567 (1,159) 10,562Employee benefits liabilities 67,896 56,647 14,547 9,798Tax loss carry forward 1,306 906 (2,194) (1,668)Others 370 380 (10) (1,484)
Net deferred tax liabilities reported in the consolidated balance sheet (1,763,993) (1,589,593)
Effect of tax rate changes 5,103 233,747
Deferred income tax expense (119,409) 593,103
For purposes of presentation in the consolidated balance sheet, the asset or liability classification of the deferred tax effect of
each of the above temporary differences is determined based on the net deferred tax position (assets or liabilities) on a per
entity basis.
Deferred tax assets and liabilities cover the future tax consequences attributable to differences between the financial and tax
reporting bases of assets and liabilities and the benefits of tax loss carryforwards.
At the balance sheet date, the Group has tax losses of approximately Rp749.0 billion (2008: Rp447.8 billion) that are available
for offset against future taxable profits. The related deferred tax assets of Rp32.0 billion (2008: Rp28.1 billion) attributable to
such tax losses was not recognised as the recoverability was considered not probable.
The effect of tax rate changes is due to the reduction in Indonesia tax rates from 30% in 2008 to 28% in 2009, and 25% for
2010 onwards.
A deferred tax liability of approximately Rp396.3 billion (2008: Rp305.5 billion) that could arise upon the distribution of profits
of certain subsidiary companies has not been provided for as at 31 December 2009 as the distribution of the profits is controlled
and there is currently no intention for the profits to be remitted into Singapore.
9 0

NOTES TO THE FINANCIAL STATEMENTS31 December 2009
20. Investment in subsidiary companies
Company2009 2008
Rp’ million Rp’ million
Unquoted equity shares, at cost 8,487,971 8,487,971
Details of acquisition of subsidiaries are included in Note 32.
The subsidiary companies as at 31 December are:
Name of subsidiariesCountry of
incorporationPercentage of
equity held Principal activities %
2009 2008
Name (Abbreviated name) Denotes
Held by the Company
Indofood Oil & Fats Pte Ltd
(IOFPL)
Singapore 100.00 100.00 Investment holding
PT PP London Sumatra Indonesia Tbk
(Lonsum)
Indonesia 8.03 8.17 Business of breeding, planting, milling
and selling of oil palm products, rubber
and other crops
Held by Indofood Oil & Fats Pte Ltd
PT Salim Ivomas Pratama
(PT SIMP)
Indonesia 90.00 90.00 Ownership of oil palm plantations,
mills and production of cooking oil,
margarine, fats, and other related
products
Held by PT Salim Ivomas Pratama
PT Indoagri Inti Plantation
(PT IIP)
Indonesia 89.10 89.10 Investment holding, management
services and transportation
Silveron Investments Limited
(SIL)
Mauritius 90.00 90.00 Investment holding
PT Kebun Mandiri Sejahtera
(PT KMS)
Indonesia 84.10 84.10 Ownership of rubber and oil palm
plantations
PT Manggala Batama Perdana
(PT MBP) *
Indonesia 90.00 90.00 Non-operating
PT Sarana Inti Pratama
(PT SAIN)
Indonesia 90.00 63.02 Investment, research and management
and technical services, oil palm seed
breeding, and ownership of oil palm
plantations
PT Mentari Subur Abadi
(PT MSA)
Indonesia 54.00 54.00 Investment and ownership of oil palm
plantations
9 1B U I L D I N G S U S T A I N A B L E G R O W T HINDOFOOD AGRI RESOURCES LTD. ANNUAL REPORT 2009

NOTES TO THE FINANCIAL STATEMENTS31 December 2009
20. Investment in subsidiary companies (cont’d)
Name of subsidiariesCountry of
incorporationPercentage of
equity held Principal activities %
2009 2008
Held by PT Salim Ivomas Pratama
PT Mega Citra Perdana
(PT MCP)
Indonesia 54.00 54.00 Investment holding
PT Swadaya Bhakti Negaramas
(PT SBN)
Indonesia 54.00 54.00 Ownership of oil palm plantations
PT Mitra Inti Sejati Plantation
(PT MISP)
Indonesia 90.00 63.00 Ownership of oil palm plantations
and mill
PT PP London Sumatra Indonesia Tbk
(Lonsum)
Indonesia 50.76 51.66 Business of breeding, planting, milling and
selling of oil palm products, rubber and
other crops
PT Lajuperdana Indah
(PT LPI)
Indonesia 54.00 54.00 Ownership of sugar cane plantations and
sugar production factory
PT Cakra Alam Makmur
(PT CAM)
Indonesia 90.00 90.00 Ownership of bulking facilities
PT Hijaupertiwi Indah Plantations
(PT HPIP)
Indonesia 90.00 90.00 Ownership of oil palm plantations
PT Cangkul Bumisubur
(PT CBS)
Indonesia 90.00 90.00 Ownership of oil palm plantations
PT Samudera Sejahtera Pratama
(PT SSP) *
Indonesia 90.00 – Transportation service
Held by PT Indoagri Inti Plantation
PT Gunung Mas Raya
(PT GMR)
Indonesia 88.21 88.21 Ownership of oil palm plantations and mill
PT Indriplant
(PT IP)
Indonesia 88.21 88.21 Ownership of oil palm plantations and mill
PT Serikat Putra
(PT SP)
Indonesia 88.21 88.21 Ownership of oil palm plantations and mill
PT Cibaliung Tunggal Plantations
(PT CTP)
Indonesia 88.21 88.21 Ownership of oil palm plantations
Held by PT Serikat Putra
PT Intimegah Bestari Pertiwi
(PT IBP) *
Indonesia 88.21 – Ownership of oil palm plantations
9 2

NOTES TO THE FINANCIAL STATEMENTS31 December 2009
20. Investment in subsidiary companies (cont’d)
Name of subsidiariesCountry of
incorporationPercentage of
equity held Principal activities %
2009 2008
Held by Silveron Investments Limited
Asian Synergies Limited
(ASL)
British Virgin Islands 90.00 90.00 Investment holding
PT Kebun Ganda Prima
(PT KGP)
Indonesia 89.99 89.99 Ownership of oil palm plantations
Held by Asian Synergies Limited
PT Citranusa Intisawit
(PT CNIS)
Indonesia 89.99 89.99 Ownership of oil palm plantations
and mill
Held by PT Sarana Inti Pratama
PT Riau Agrotama Plantation
(PT RAP)
Indonesia 89.99 63.01 Ownership of oil palm plantations
PT Citra Kalbar Sarana
(PT CKS)
Indonesia 89.99 63.01 Ownership of oil palm plantations
PT Jake Sarana
(PT JS)
Indonesia 89.99 62.96 Ownership of oil palm plantations
Held by PT Mentari Subur Abadi
PT Agro Subur Permai
(PT ASP)
Indonesia 53.74 53.74 Ownership of oil palm plantations
Held by PT Mega Citra Perdana
PT Gunta Samba
(PT GS)
Indonesia 53.99 53.99 Ownership of oil palm plantations
PT Multi Pacific International
(PT MPI)
Indonesia 53.98 53.98 Ownership of oil palm plantations
Held by PT Cangkul Bumisubur
PT Pelangi Inti Pertiwi
(PT PIP)
Indonesia 90.00 90.00 Ownership of oil palm plantations
9 3B U I L D I N G S U S T A I N A B L E G R O W T HINDOFOOD AGRI RESOURCES LTD. ANNUAL REPORT 2009

NOTES TO THE FINANCIAL STATEMENTS31 December 2009
20. Investment in subsidiary companies (cont’d)
Name of subsidiariesCountry of
incorporationPercentage of
equity held Principal activities %
2009 2008
Held by PT PP London Sumatra Indonesia Tbk
PT Multi Agro Kencana Prima
(PT MAKP)
Indonesia 47.03 47.86 Rubber mill and trading
Lonsum Singapore Pte. Ltd.
(LSP)
Singapore 58.79 59.83 Trading and marketing
PT Tani Musi Persada
(PT TMP)
Indonesia 58.74 59.78 Ownership of oil palm plantations
PT Sumatra Agri Sejahtera
(PT SAS)
Indonesia 58.74 59.78 Ownership of oil palm plantations
PT Tani Andalas Sejahtera
(PT TAS)
Indonesia 52.91 53.85 Ownership of oil palm plantations
Held by Lonsum Singapore Pte. Ltd.
Sumatra Bioscience Pte. Ltd.
(SBPL) *
Singapore 58.79 59.83 Trading and marketing
* Unaudited management accounts have been used for the preparation of the consolidated financial statements of
the Group.
Audited by :
Ernst & Young LLP, Singapore
Purwantono, Sarwoko & Sandjaja, Indonesia (member firm of Ernst & Young Global)
Eddy Prakarsa Permana & Siddharta, Indonesia
Hendrawinata Gani & Hidayat, Indonesia (member firm of Grant Thornton International)
Jamaludin, Aria, Sukimto & Rekan (JAS&Rekan)
Saw Meng Tee & Co, Singapore
Dilution of shareholding in a subsidiary
In 2009, the Group’s subsidiary, Lonsum, sold 23,964,000 treasury shares for a net cash proceeds of Rp187.8 billion. As a result,
the Group’s equity interest in Lonsum diluted by 1.04% from 59.83% to 58.79%.
9 4

NOTES TO THE FINANCIAL STATEMENTS31 December 2009
21. Loans to a subsidiary company
Company2009 2008
Rp’ million Rp’ million
Loans 2,259,501 2,259,501
The loans to a subsidiary company are unsecured and interest-free. The amount forms part of the Company’s net investment in
the subsidiary company and is not expected to be settled in the next twelve months.
22. Other non-current assets
Group CompanyNote 2009 2008 2009 2008
Rp’ million Rp’ million Rp’ million Rp’ million
Advances and deposits 263,826 300,896 24 863Loans to employees 19,193 20,366 – –Long-term prepayments 3,528 4,078 – –Long-term receivables 3,091 3,350 – –Plasma receivables 33(a) 456,845 358,993 – –Others 71,328 21,737 – –
Total 817,811 709,420 24 863
Advances and deposits
Advances and deposits mainly relate to utility and rental deposits, advance payments for land and minority interest acquisition,
and advance payments made to suppliers and contractors in relation to the purchases of capital equipment, raw materials
and services.
Loans to employees
The Group provides non-interest bearing loans to officers and employees subject to certain terms and criteria. Such loans, which
are being collected through monthly salary deductions over five years, from the date of the loan, are carried at amortized cost
using effective interest method, with discount rate of 8.98% (2008: 11.73%).
9 5B U I L D I N G S U S T A I N A B L E G R O W T HINDOFOOD AGRI RESOURCES LTD. ANNUAL REPORT 2009

NOTES TO THE FINANCIAL STATEMENTS31 December 2009
23. InventoriesGroup
Note 2009 2008Rp’ million Rp’ million
Balance sheet:Raw materials 321,372 145,750Work in progress 11,510 4,599Finished goods 365,239 330,724Spare parts 384,436 429,469
Total inventories at the lower of cost or net realisable value 1,082,557 910,542
Income statement:(Reversal)/provision for decline in market value of inventories and
obsolescence of inventories recognised as an expense 8 (10,343) 24,766
Inventories of the Group amounting to approximately Rp37.9 billion as at 31 December 2009 (2008: Rp102.2 billion) has been
pledged as security against the bank borrowings of the Group (Note 27).
24. Trade and other receivables
Group CompanyNote 2009 2008 2009 2008
Rp’ million Rp’ million Rp’ million Rp’ million
Trade receivables –Third parties 351,056 474,994 – –Related parties 202,215 92,957 – –Subsidiary companies – – 16,995 19,437
Less: Allowance for doubtful third
party trade receivables (257) (422) – –Other receivables –
Future commodity contracts 33(b) 104,643 128,605 – –Advances to suppliers 160,756 108,755 – –Repurchase transaction – 10,765 – –Loans to employees 7,265 5,857 – –Related parties 2,180 317 – –Prepayments 13,420 13,378 369 284Prepaid land premiums
(current portion) 16 42,922 33,455 – – Claims for tax refund 8,649 26,652 254 14,065 Others 20,609 27,857 8 4
Total trade and other receivables 913,458 923,170 17,626 33,790
Trade receivables are non-interest bearing and are generally on 7 days to 45 days term of payments. They are recognised at their
original invoice amounts which represent their fair values on initial recognition. Receivables from future commodity contracts are
carried at their respective quoted market prices. Future commodity contract transactions are further discussed in Note 33(b).
The Group’s trade receivables amounting to RpNil (2008: Rp3.2 billion) were used as collateral to secure their investment and
export credit facilities.
Trade and non-trade receivables from related parties, and receivables from subsidiary companies are unsecured, interest-free and
are repayable on demand.
9 6

NOTES TO THE FINANCIAL STATEMENTS31 December 2009
24. Trade and other receivables (cont’d)
Trade and other receivables are denominated in the following currencies:
Group Company2009 2008 2009 2008
Rp’ million Rp’ million Rp’ million Rp’ million
Indonesian Rupiah 640,190 483,356 – –US Dollars 267,708 397,634 – –Singapore Dollars 726 40,420 17,626 33,790Euro 4,834 1,757 – –Others – 3 – –
913,458 923,170 17,626 33,790
An analysis of trade receivables that are past due but not impaired:
1 - 30 days 87,124 73,958 – –31 - 60 days 24,600 15,514 – –61 - 90 days 4,479 11,397 – –More than 90 days 38,198 9,070 – –
154,401 109,939 – –
As at 31 December 2009, trade receivables amounting to Rp257 million (2008: Rp422 million) were individually impaired and
fully provided for. Trade receivables that are determined to be impaired at the balance sheet date relate to debtors that are in
financial difficulties and have defaulted on payments.
Movement in allowance for doubtful debts account:
GroupNote 2009 2008
Rp’ million Rp’ million
At 1 January 422 2,500Charge for the year – 50Write-back 9 (165) (2,128)
At 31 December 257 422
Advances to suppliers
Advances to suppliers represent advance payments to suppliers and contractors in relation to the following purchases:
Group2009 2008
Rp’ million Rp’ million
Raw materials 35,498 26,532Factory supplies, spare parts and others 125,258 82,223
160,756 108,755
Advances to suppliers are unsecured, interest-free and obligations of the suppliers are expected to be fulfilled within the next
twelve months.
9 7B U I L D I N G S U S T A I N A B L E G R O W T HINDOFOOD AGRI RESOURCES LTD. ANNUAL REPORT 2009

NOTES TO THE FINANCIAL STATEMENTS31 December 2009
25. Cash and cash equivalents
Group Company2009 2008 2009 2008
Rp’ million Rp’ million Rp’ million Rp’ million
Cash at bank and in hand 738,349 903,835 5,660 3,181Short term deposits 1,063,996 1,504,431 177,790 183,062
Cash and cash equivalents 1,802,345 2,408,266 183,450 186,243
Cash and cash equivalents are denominated in the following currencies:
Indonesian Rupiah 910,529 1,052,421 – –US Dollars 724,363 1,166,783 18,040 32Singapore Dollars 167,453 189,062 165,410 186,211
1,802,345 2,408,266 183,450 186,243
Cash at bank balances earn interest at floating annual interest rates based on daily bank deposit rates. Short term deposits are
made for varying periods ranging from one day to three months, depending on the immediate cash requirements of the Group,
and earn interest at the respective short term deposit rates.
Cash of a subsidiary is used as collateral to secure the term loan and uncommitted account payables financing and uncommitted
revolving credit facilities. As of 31 December 2009, the amount of the said subsidiary’s cash collateralized for the said loans but
not restricted for use was Rp12.5 million (2008: Rp2.7 million).
26. Trade and other payables and accruals
Group CompanyNote 2009 2008 2009 2008
Rp’ million Rp’ million Rp’ million Rp’ million
Trade payables – Third parties 313,212 386,977 – –Related parties 5,521 4,052 – –
Other payables –Third parties 97,118 67,900 4,227 –Future commodity contracts 33(b) 104,943 124,716 – –Advances from customers 92,891 79,557 – –Due to parent company 22,055 1,024 – –Related parties 166 1,188 505 –Due to minority shareholder of a
subsidiary
– 10,500 – –
Accrued operating expenses 395,298 340,762 6,525 15,616Taxes payable 41,598 25,793 – –
1,072,802 1,042,469 11,257 15,616
9 8

NOTES TO THE FINANCIAL STATEMENTS31 December 2009
26. Trade and other payables and accruals (cont’d)
Trade payables are normally settled on 7 days to 60 days credit payment terms. The carrying amounts of the Group’s trade
payables, other payables and accruals approximate their fair values. Payables incurred on future commodity contract transactions
are carried at their respective quoted market prices.
Trade payables to related parties are non-interest bearing, unsecured and normally settled on 14 days to 60 days terms. Payables
to a parent company and minority shareholder of a subsidiary company are unsecured, interest-free and repayable on demand.
Other payables to related parties are unsecured and non-interest bearing.
Advances from customers represent advance payments relating to the sale of finished goods. These advances are trade in nature,
unsecured, interest-free, and the obligations to the customers are expected to be fulfilled within the next twelve months.
Trade and other payables are denominated in the following currencies:
Group Company2009 2008 2009 2008
Rp’ million Rp’ million Rp’ million Rp’ million
Indonesian Rupiah 922,542 822,981 – –US Dollars 135,372 201,719 – –Euro 3,097 1,174 – –Singapore Dollars 11,696 15,787 11,257 15,616Others 95 808 – –
Total payables and accruals 1,072,802 1,042,469 11,257 15,616
27. Interest-bearing loans and borrowings
GroupEffective interest rate (%) Maturities 2009 2008
Rp’ million Rp’ million
Current
Indonesian Rupiah loans
Loans used to acquire majority equity
ownership in Lonsum
10.65 to 15.00
(2008:8.93 to 16.25)
2009 – 590,000
Working capital credit facilities 9.50 to 15.27
(2008:8.94 to 15.11)
2010 1,086,802 734,453
Current maturities of long-term loans and borrowings:Loans used to acquire majority equity
ownership in Lonsum
9.50 to 11.77
(2008:10.21 to 13.24)
2010 130,000 100,000
Investment loans 7.00 to 14.00 2010 46,116 15,959 (2008:8.94 to 15.00)
Obligations under finance lease 5.05 to 18.50
(2008:6.10 to 18.50)
2010 5,854 8,607
Subtotal 1,268,772 1,449,019
9 9B U I L D I N G S U S T A I N A B L E G R O W T HINDOFOOD AGRI RESOURCES LTD. ANNUAL REPORT 2009

NOTES TO THE FINANCIAL STATEMENTS31 December 2009
27. Interest-bearing loans and borrowings (cont’d)
GroupEffective interest rate (%) Maturities 2009 2008
Rp’ million Rp’ million
US Dollar loans
Loans used to acquire majority equity ownership in Lonsum
4.00 to 5.25(2008:3.40 to 7.30)
2009 – 109,500
Working capital credit facilities 1.92 to 2.72(2008:4.00 to 7.50)
2010 – 328,500
Syndicated loan arranged by BCA (“Club Deal”)
6.00 to 7.50(2008:4.98 to 7.61)
2009 – 38,325
Current maturities of long-term loans and borrowings:Loans used to acquire majority
equity ownership in Lonsum1.50 to 3.53
(2008:3.43 to 6.57)2010 197,685 172,553
Uncommitted term loans 2.99 to 4.03 2010 82,250 –Syndicated loan arranged by BCA
(“Club Deal”)6.00 to 7.50
(2008:4.98 to 7.61)2010 – 281,752
Loan to refinance the Club Deal loans
3.97 to 4.23 2010 197,757 –
Subtotal 477,692 930,630
Total current interest- bearing loans and borrowings 1,746,464 2,379,649
Non-currentIndonesian Rupiah loans
Bonds and Sukuk Ijarah Payables Salim Ivomas PratamaBonds I Year 2009 11.95 2014 446,989 –Salim Ivomas PratamaSukuk Ijarah I Year 2009 *) 2014 274,813 –Loans used to acquire majority
equity ownership in Lonsum9.50 to 11.77
(2008:10.21 to 13.24)2010 - 2013 770,000 900,000
Investment and term loans 5.00 to 15.27(2008:4.00 to 14.00)
2010 - 2018 1,938,465 792,319
Obligations under finance lease 5.05 to 18.50(2008:6.05 to 18.50)
2010 - 2012 1,140 6,892
Subtotal 3,431,407 1,699,211
*) - The Sukuk Ijarah has a fixed Sukuk Ijarah return of Rp32.3 billion per annum. For accounting and reporting purposes, the
Sukuk Ijarah is carried and presented in the consolidated balance sheets at amortised cost using effective interest rate of 11.96%
per annum.
1 0 0

NOTES TO THE FINANCIAL STATEMENTS31 December 2009
27. Interest-bearing loans and borrowings (cont’d)
GroupEffective interest rate (%) Maturities 2009 2008
Rp’ million Rp’ million
US Dollar loans
Loans used to acquire majority equity ownership in Lonsum
1.50 to 3.53(2008:3.43 to 6.57)
2010 - 2013 1,147,311 1,568,197
Uncommitted term loans 2.99 to 4.03 2010 - 2018 603,950 –Loan to refinance the Club Deal
loans3.97 to 4.16 2010 - 2012 30,347 –
Syndicated loan arranged by BCA (“Club Deal”)
6.00 to 7.50(2008:4.98 to 7.61)
2010 - 2011 – 609,528
Subtotal 1,781,608 2,177,725
Total non-current interest- bearing loans and borrowings 5,213,015 3,876,936
Total interest-bearing loans and borrowings 6,959,479 6,256,585
Bonds and Sukuk Ijarah Payables
In December 2009, PT SIMP, a subsidiary of the Company issued 5-year Indonesian Rupiah Bonds and Islamic Leased-based
bonds. The details are as follows:
a. Salim Ivomas Pratama I Bonds Year 2009 (“Bonds”) issued on 1 December 2009 with face value of Rp452.0 billion and
will be due within five years on 1 December 2014; and
b. Sukuk Ijarah Salim Ivomas Pratama I Year 2009 (“Sukuk Ijarah”) issued on 1 December 2009 with face value of Rp278.0
billion and will be due within five years on 1 December 2014.
The Bonds and Sukuk Ijarah are not secured by any specific assets of PT SIMP. However all PT SIMP’s assets, except for those
already used to secure liabilities to other creditors, were used to secure on pari-passu basis to the other liabilities, including the
Bonds and Sukuk Ijarah.
Loans Used to Acquire Majority Equity Ownership in Lonsum
These credit facilities were used to refinance the loans used to acquire majority equity ownership in Lonsum, and consist of:
a. several short-term facilities (Rp500.0 billion uncommitted revolving credit facility from PT Bank DBS Indonesia (“DBS”);
and US$10.0 million and Rp90.0 billion multi-currency working capital loans from PT ANZ Panin Bank), which are secured
by corporate guarantees from the Company in proportion to its equity ownership in PT SIMP of 90%; and
b. several long-term facilities (Rp1,000.0 billion investment loan from PT Bank Central Asia Tbk (“BCA”) and US$160.0 million
syndicated loan), which are secured by corporate guarantees from the Company in proportion to its equity ownership in
PT SIMP of 90%.
1 0 1B U I L D I N G S U S T A I N A B L E G R O W T HINDOFOOD AGRI RESOURCES LTD. ANNUAL REPORT 2009

NOTES TO THE FINANCIAL STATEMENTS31 December 2009
27. Interest-bearing loans and borrowings (cont’d)
Term Loan
The unsecured (collateral-free) term loans of US$25.0 million and US$48.0 million were obtained from ING Bank N.V., Singapore
branch and DBS Bank Ltd., Singapore branch (“DBS Singapore”), respectively.
Club Deal Loans
These loans were obtained from a syndication of creditors led by BCA in connection with Lonsum’s loan restructuring in 2006.
These loans are secured by Lonsum’s land and/or non-moveable assets and all machineries that are placed on it, as well as
biological assets, land, buildings, infrastructures and machinery that will be acquired and/or built/developed using the proceeds
from the Tranche B facility. The Club Deal Loans comprise 3 tranches as follows:
a. refinancing facility with a maximum credit limit of US$54.0 million (Tranche A), which is repayable through 10 bi-annual
instalments from February 2007 until August 2011;
b. capital reimbursement facility with a maximum credit limit of US$81.0 million (Tranche B), which is repayable through 8
bi-annual instalments commencing from August 2008 until August 2011; and
c. working capital facility with a maximum credit limit of US$15.0 million (Tranche C), which was due in full on 16 February 2009.
Loans to Refinance the Club Deal Loans
These loans were obtained by Lonsum from Sumitomo Mitsui Banking Corporation, Singapore branch (“SMBC”), DBS Singapore
and CIMB Bank Berhad, Singapore branch to refinance Club Deal loans. These loans are secured by corporate guarantees from
PT SIMP and the Company in proportion to their equity ownerships in Lonsum.
Investment and Term Loans
Included in the investment and term loans are the following:
a. a total of Rp597.4 billion investment loan facilities (2008: Rp392.5 billion) from BCA obtained by PT MISP, PT SBN, PT MSA,
PT ASP, PT GS and PT MPI. The loans are secured by corporate guarantees from PT SIMP; and
b. Rp942.5 billion investment loan facility obtained by PT LPI from PT Bank Rakyat Indonesia (Persero) Tbk (2008: Rp942.5
billion), which is secured by its receivables, inventories, land rights, sugar canes and fixed assets.
Working Capital Credit Facilities
a. The unsecured (collateral-free) working capital loan of Rp1,000.0 billion (2008: Rp1,000.0 billion) was obtained from PT
Bank Mandiri (Persero) Tbk.
b. Included in the working capital credit facilities are the following credit facilities obtained from PT Bank Rabobank
International Indonesia (“Rabobank”):
September 2009; and
maximum credit limits of US$21.0 million, US$8.5 million, US$3.5 million and US$4.0 million, respectively.
1 0 2

NOTES TO THE FINANCIAL STATEMENTS31 December 2009
28. Other payables
GroupNote 2009 2008
Rp’ million Rp’ million
Provision for asset dismantling costs 16,135 12,916Deferred income 302 376Due to related parties 279,911 199,237Others 26,748 26,749
323,096 239,278
The amounts due to related parties are unsecured, interest-free and are not expected to be repaid in the next twelve months.
Provision for asset dismantling costs
Provision for asset dismantling costs represents estimated liabilities for the costs to dismantle, remove and restore the sites of
refinery, fractionation and margarine plants located in Jakarta, Indonesia. Changes in provision for asset dismantling costs are
presented as part of “Other operating income” in the consolidated statement of comprehensive income as shown in Note 7.
The resulting outflows of economic benefits of this provision are expected to take place in 2016.
The movement in provision for asset dismantling costs is:
Balance at 1 January 12,916 15,332Movement for the year 7 3,219 (2,416)
Balance at 31 December 16,135 12,916
29. Employee benefits
The Plantations division and certain subsidiaries of the Group have defined contribution retirement plans covering substantially
all of their qualified permanent employees.
The Group’s contributions to the funds are computed at 10.0% and 7.0% of the basic pensionable income for staff and non-
staff employees, respectively. Total pension cost charged to operations in 2009 is Rp13.0 billion (2008: Rp12.2 billion).
On top of the benefits provided under the above-mentioned defined contribution retirement plans, the Group has also recorded
additional provisions for employee service entitlements in order to meet the minimum benefits required to be paid to the
qualified employees, as required under the Labour Law. The amounts of such additional provisions were determined based
on actuarial computations prepared by an independent firm of actuaries using the “Projected Unit Credit” method. As at 31
December 2009, the balance of the related actuarial liability for employee benefits amounted to Rp443.0 billion (2008: Rp355.4
billion), which is presented as “Employee Benefits Liabilities” in the consolidated balance sheet.
1 0 3B U I L D I N G S U S T A I N A B L E G R O W T HINDOFOOD AGRI RESOURCES LTD. ANNUAL REPORT 2009

NOTES TO THE FINANCIAL STATEMENTS31 December 2009
29. Employee benefits (cont’d)
GroupNote 2009 2008
Rp’ million Rp’ million
Employee benefits liabilities
Present value of employee benefits obligation in addition to the defined
contribution scheme 734,554 483,823Unrecognised net actuarial losses (269,341) (103,616)Unrecognised past service cost (22,253) (24,835)
Net 442,960 355,372
Changes in the present value of the defined benefit obligation are as follows:
Benefit obligation at 1 January 355,372 292,454Current service cost 55,641 41,219Interest cost on benefit obligation 58,098 51,837Amortisation of past service cost 2,581 2,768Net actuarial losses recognised during the year 13,511 13,220Addition from acquired subsidiaries 32 – 96Benefits paid (31,678) (46,222)Gains on curtailments and settlements (10,565) –
Benefit obligation at 31 December 442,960 355,372
Provision for employee benefits
The principal assumptions used in determining post-employment obligations for the Group’s plan are as follows:
Annual discount rate : 11.0% (2008: 12.0%)Future annual salary increase : 10.0% (2008: 9.0%)Retirement age : 55 years (2008: 55 years) Expected annual return on plan assets : 9.0% (2008: 8.0%)
The following table summarise the component of net employee benefits expense recognised in the consolidated statement of
comprehensive income:
GroupNote 2009 2008
Rp’ million Rp’ million
Current service cost 55,641 41,219Interest cost on benefit obligations 58,098 51,837Net actuarial losses recognised during the year 13,511 13,220Amortisation of past service cost 2,581 2,768Gains on curtailments and settlements (10,565) –
Net employee benefit expense 9 119,266 109,044
1 0 4

NOTES TO THE FINANCIAL STATEMENTS31 December 2009
30. Share capital and treasury shares
(a) Share capital
Group2009 2008
No. of shares Rp’ million No. of shares Rp’ million
Balance as at 1 January/ 31 December 1,447,782,830 3,584,279 1,447,782,830 3,584,279
The movement in the share capital of the Company is as follows:
Company2009 2008
No. of shares Rp’ million No. of shares Rp’ million
Balance as at 1 January / 31 December 1,447,782,830 10,912,411 1,447,782,830 10,912,411
The holders of ordinary shares (except treasury shares) are entitled to receive dividends as and when declared by the
Company. Each ordinary share carries one vote per share without restriction. The ordinary share has no par value.
(b) Treasury shares
Group and Company2009 2008
No. of shares Rp’ million No. of shares Rp’ million
Balance as at 1 January 9,000,000 29,283 – –Acquired during the financial year – – 9,000,000 29,283
Balance as at 31 December 9,000,000 29,283 9,000,000 29,283
31. Reserves
Company2009 2008
Rp’ million Rp’ million
Retained earnings/(Accumulated losses) :
Balance at 1 January 143,766 (20,638)(Loss)/profit for the year (19,708) 164,404
Balance at 31 December 124,058 143,766
Movement in the reserves of the Group are shown in the Consolidated Statement of Changes in Equity. There are no dividends
declared, proposed or paid in 2009 and 2008.
1 0 5B U I L D I N G S U S T A I N A B L E G R O W T HINDOFOOD AGRI RESOURCES LTD. ANNUAL REPORT 2009

NOTES TO THE FINANCIAL STATEMENTS31 December 2009
32. Acquisition of subsidiaries and minority interests
(a) Acquisition of PT IBP
On 14 August 2009, PT SSP and PT IIP entered into Conditional Sale and Purchase Agreement with Mr. Agus Sjafrudin
(“AS”) and PT Karyahasta Bhumi Sriwijaya (“KBS”), the respective owners of 150 shares and 100 shares in PT IBP. In
accordance with the said agreement, AS and KBS shall sell their respective shares in PT IBP to PT SP and PT IIP for a total
consideration of Rp8.5 billion.
The said acquisition transaction was completed in October 2009. Accordingly, PT IBP has since become a 100%-owned
subsidiary of the Group.
(b) Acquisition of additional interests in PT SAIN and its subsidiaries
In accordance with the Conditional Sale and Assignment of the Exchangeable Bond Agreement with Lyminton Pte.
Ltd., Singapore (“LMT”) (the “LMT Agreement”), PT SIMP acquired a bond that was exchangeable into 15,499 shares
representing 29.98% of PT SAIN’s total issued share capital, for a cash consideration of US$16.4 million.
The transaction was completed in February 2009. Accordingly, PT SIMP has since increased its equity interest in PT SAIN
from 70.02% to 100%.
(c) Acquisition of additional interests in PT MISP
Pursuant to the Conditional Shares Sale and Purchase Agreement with PT Mulia Abadi Lestari (“MAL”) (the “MAL
Agreement”), PT SIMP and PT IIP acquired from MAL 28,499,999 shares, representing 30% of the total issued share
capital of PT MISP for a total cash consideration of Rp28.5 billion.
The transaction was completed in February 2009. Accordingly, PT SIMP has since increased its equity interest in PT MISP
from 70% to 100%.
1 0 6

NOTES TO THE FINANCIAL STATEMENTS31 December 2009
32. Acquisition of subsidiaries and minority interests (cont’d)
(i) Acquisition of subsidiaries
The fair value of the identifiable assets and liabilities of the acquired subsidiaries at the date of acquisitions were:
Acquisitions in Year 2009 Acquisitions in Year 2008
PT IBPPT LPI,
Hijau Group & PT TSTCarrying value Fair value Carrying value Fair value
Rp’ million Rp’ million Rp’ million Rp’ million
Property, plant and equipment – – 330,512 394,064Biological assets 612 612 56,223 53,530Prepaid land premium and deferred
land rights acquisition costs 324 324 40,769 196,273Deferred tax assets 23 23 19,731 798Inventories – – 4,908 4,908Trade and other receivables 9 9 22,319 22,319Advances and prepayments 1,000 1,000 – –Prepaid taxes – – 18,083 18,083Cash and cash equivalents 68 68 329,528 329,528Other non-current assets 9,000 9,000 48,560 48,560Total identifiable assets 11,036 11,036 870,633 1,068,063
Interest-bearing loans and
borrowings 10,450 10,450 193,568 193,568Deferred tax liabilities – – – 45,351Other non-current liabilities – – 195,065 195,065Trade and other payables 405 405 11,457 11,457Employee benefits liabilities – – 96 96Total identifiable liabilities 10,855 10,855 400,186 445,537
Minority interests – – 168,205 225,292
Net assets 181 302,242 397,234
Goodwill arising from acquisition
(Note 17) 8,319 42,063
Total cost of business combination 8,500 439,297
Cash outflows on acquisition of subsidiaries are as follows:
2009 2008Rp’ million Rp’ million
Cost of business combination 8,500 439,297Less: Net cash of the acquired subsidiaries (68) (329,528)
Total cash outflow 8,432 109,769
1 0 7B U I L D I N G S U S T A I N A B L E G R O W T HINDOFOOD AGRI RESOURCES LTD. ANNUAL REPORT 2009

NOTES TO THE FINANCIAL STATEMENTS31 December 2009
32. Acquisition of subsidiaries and minority interests (cont’d)
(ii) Acquisition of minority interest in PT SAIN and PT MISP
Acquisitions in Year 2009 Acquisitions in Year 2008PT SAIN and PT MISP
Carrying value Fair value Carrying value Fair valueRp’ million Rp’ million Rp’ million Rp’ million
Minority interests 73,186 73,186 – –
Net assets 73,186 – –
Goodwill arising from acquisition
(Note 17) 152,944 –
Total cost of business combination 226,130 –
Cash outflows on acquisition of minority interests in subsidiaries are as follows:
2009 2008Rp’ million Rp’ million
Cost of business combination 226,130 –Less: Advances paid in prior year (136,666) –
Total cash outflow 89,464 –
The aggregate amount of net losses after tax of the subsidiaries acquired since the acquisition dates included in the
Group’s consolidated statement of comprehensive income was Rp0.01 billion (2008: Rp39.6 billion).
It is not practicable to disclose the revenue and profit before taxation of the Group had the acquisitions took place at
the beginning of the years, as the information on fair values of biological assets at the beginning of each year was not
available to management.
33. Commitments and contingencies
(a) Plasma Receivables
The Indonesian government requires oil palm plantation companies to develop new plantations together with the local
small landholders. This form of assistance to local small landholders is generally known as the “Plasma Scheme”. Once
developed, the plasma plantations are transferred to the small landholders who then operate the plasma plantations
under the supervision of the developer. In line with this requirement, certain subsidiary companies of the Group have
commitments to develop plantations under the Plasma Scheme. The funding for the development of the plantations under
the Plasma Scheme is provided by the designated banks and/or by the subsidiary companies. This includes the subsidiary
companies providing corporate guarantees for the loans advanced by the banks.
When the plasma plantations start to mature, the plasma farmers are obliged to sell all their harvests to the subsidiary
companies and a portion of the resulting proceeds will be used to repay the loans from the banks or the subsidiary
companies. In situations where the sales proceeds are insufficient to meet the repayment obligations to the banks, the
subsidiary companies also provide temporary funding to the plasma farmers to develop the plasma plantations and to
repay the instalment and interest payments to the banks. The plasma farmers will repay the temporary funding to the
subsidiary companies once the plantations have positive cash flows.
1 0 8

NOTES TO THE FINANCIAL STATEMENTS31 December 2009
33. Commitments and contingencies (cont’d)
(a) Plasma Receivables (cont’d)
The loans advanced by the banks under the Plasma Scheme are secured by the sales proceeds of FFB of the respective
plasma plantations and corporate guarantees from certain subsidiary companies for a maximum amount of Rp575.1
billion (2008: Rp588.3 billion) as at 31 December 2009.
During the financial year, the Group recorded a write-off of plasma receivables of Rp26.6 billion (2008: Rp14.5 billion)
because the recoverable value is lower than the related development cost. In addition, the Group also recorded an allowance
for uncollectible plasma receivables in its consolidated balance sheet amounting to Rp67.2 billion (2008: Rp42.0 billion)
in 2009. Based on a review of the plasma receivables of each project as at 31 December 2009, management believes that
the above-mentioned allowance for uncollectible plasma receivables is sufficient to cover possible losses arising from the
uncollectible plasma receivables.
The accumulated development costs net of funds received are presented as Plasma receivables in the consolidated balance
sheet and in the Plantations segment. An analysis of the movement in the plasma receivables is as follows:
Note 2009 2008Rp’ million Rp’ million
Balance at 1 January 358,993 207,285Loss on write-off of plasma receivables 8 (26,602) (14,451)Gain/(Loss) arising from changes in fair value of plasma receivables 8 886 (13,344)Provision for uncollectible plasma receivables 8 (25,269) (23,951)Conversion from/(to) plasma farmers and nucleus 10,430 (49,884)Additional net investment 138,407 253,338
Balance at 31 December 22 456,845 358,993
(b) Future commodity contracts transactions
The Group entered into future commodity contracts with several foreign entities, which are primarily intended to hedge
the exposures on risks of losses arising from the fluctuations in prices of the commodities sold by a subsidiary company.
These contracts do not qualify and therefore are not designated as hedges for accounting purposes.
The fair values of the related receivables and payables arising from the future commodity contracts determined based on
the relevant quoted market prices at the balance sheet dates are as follows:
Note 2009 2008Rp’ million Rp’ million
Financial assetsNet receivables 24 104,643 128,605
Financial liabilitiesNet payables 26 104,943 124,716
The contractual amounts to be received from the outstanding contracts as at 31 December 2009 to sell crude coconut oil
amounted to Rp7.3 billion, which will mature within the next 2 months. There were no outstanding future commodity
contracts as at 31 December 2008.
1 0 9B U I L D I N G S U S T A I N A B L E G R O W T HINDOFOOD AGRI RESOURCES LTD. ANNUAL REPORT 2009

NOTES TO THE FINANCIAL STATEMENTS31 December 2009
33. Commitments and contingencies (cont’d)
(c) Operating lease commitments
As Lessee
The Group has entered into commercial leases to lease land and buildings, equipment and transportation equipment. These
non-cancellable operating leases have remaining lease terms from 1 to 3 years. Operating lease payments recognized in
the statement of comprehensive income in 2009 amounted to Rp14.7 billion (2008: Rp17.7 billion).
Future minimum lease payments under non-cancellable operating leases are as follows:
2009 2008Rp’ million Rp’ million
Within one year 6,852 14,134After one year but not more than five years 4,990 4,283
11,842 18,417
As Lessor
The Group has entered into a short-term commercial lease on its storage tanks. Operating lease income recognised in the
consolidated statement of comprehensive income for the financial year ended 31 December 2009 amounted to Rp6.7
billion (2008: Rp8.2 billion).
(d) Contingent liability
The Company has provided corporate guarantees to banks for certain long-term and short-term credit facilities amounting
to Rp4,011.3 billion (2008: Rp3,402.0 billion) obtained by its subsidiary companies.
(e) Sales commitments
As at 31 December 2009, Lonsum has sales commitments to deliver the following products to local and overseas customers
within the next three months:
2009 2008(Tonnes) (Tonnes)
Crude palm oil 23,705 34,778Palm kernel 5,179 2,907Rubber 1,875 2,370Cocoa 60 933
Total 30,819 40,988
1 1 0

NOTES TO THE FINANCIAL STATEMENTS31 December 2009
33. Commitments and contingencies (cont’d)
(f) Commitments for long term investments
(i) Construction of a palm oil mill
In 2009, PT RAP entered into a construction agreement with PT Mindo-Tech, whereby the latter is committed to
construct a palm oil mill with processing capacity of 40 metric tonnes of FFB per hour (which can be increased into
80 metric tonnes of FFB per hour), located at the province of West Kalimantan, for a contract value of Rp31.2 billion
and US$4.7 million. The said palm oil mill is expected to be completed in the fourth quarter of 2010.
(ii) Construction of a sugar refinery plant
PT LPI has a supply agreement with China CAMC Engineering Co. Ltd., whereby the latter is to supply machinery
and equipment for a sugar refinery plant with daily processing capacity of 8,000 metric tonnes of sugar cane
located at the province of South Sumatra for a total contract value of US$84.3 million. PT LPI also entered into a
construction agreement with CAMCE-MPS JO, whereby the latter is to construct and erect a sugar refinery plant
with total contract value of US$33.7 million. The said construction is expected to be completed in the third quarter
of 2010.
(iii) Construction of a CPO refinery plant
PT SIMP’s Cooking Oil and Fats Division engaged with Lipico Technologies Pte. Ltd., Singapore for the supply of
machinery and equipment and construction of a CPO refinery plant with processing capacity of 1,400 metric tonnes
per day for physical refining plant and 720 metric tonnes per day for dry fractionation plant located at Tanjung Priok,
province of Jakarta, with a contract value of SGD13.4 million. The said construction and installation of this CPO
refinery is expected to be completed in the fourth quarter of 2010.
(iv) Commitments to acquire property and equipment
As of 31 December 2009, the Group has several contracts totalling Rp334.6 billion, US$22.1 million and JP¥Nil million
(2008: Rp156.8 billion, US$110.1 million and JP¥15.6 million) (inclusive of the capital expenditures commitments
relating to the construction contracts as disclosed above), to acquire property and equipment.
1 1 1B U I L D I N G S U S T A I N A B L E G R O W T HINDOFOOD AGRI RESOURCES LTD. ANNUAL REPORT 2009

NOTES TO THE FINANCIAL STATEMENTS31 December 2009
34. Related party disclosures
In addition to those related party information provided elsewhere in the relevant notes to the consolidated financial information,
the following are the significant transactions between the Group and related parties (who are not members of the Group) that
took place during the financial year ended 31 December 2009 and 2008 at the terms agreed between the parties:
Nature of transactions Year
AShareholder
(PT ISM)Related
companiesOther related
partiesRp’ million Rp’ million Rp’ million
Sales of goods 2009 1,206,404 1,062,420 –2008 1,352,947 1,056,377 5,091
Purchases of merchandise and packaging 2009 4 20,194 –2008 5 13,282 –
Purchases of services, transportation equipment and spare
parts 2009 – 3 59,6742008 – 4 4,210
Pump services 2009 – – 4,2092008 – – 4,115
Interest income 2009 – – –2008 221 – –
Interest expense 2009 866 – –2008 – – –
Rental 2009 – – 8,6892008 565 – 9,994
Freight expenses 2009 – 41,366 –2008 – 47,242 –
Insurance 2009 – – 8,7802008 – – 8,385
Since 1996, a related party has granted the Group the right to use a parcel of land located at North Jakarta with an aggregate
area of approximately 19,875 square metres under a lease agreement dated 1 June 1996. The Group made a one-time payment
amounting to Rp11.0 billion in 1996 as prepaid rental for the lease period from June 1996 to June 2016 with no requirement
for further rental payment. The Group amortises the prepaid lease rental over 20 years on a straight line basis and the annual
amortisation charge amounts to Rp550.0 million.
1 1 2
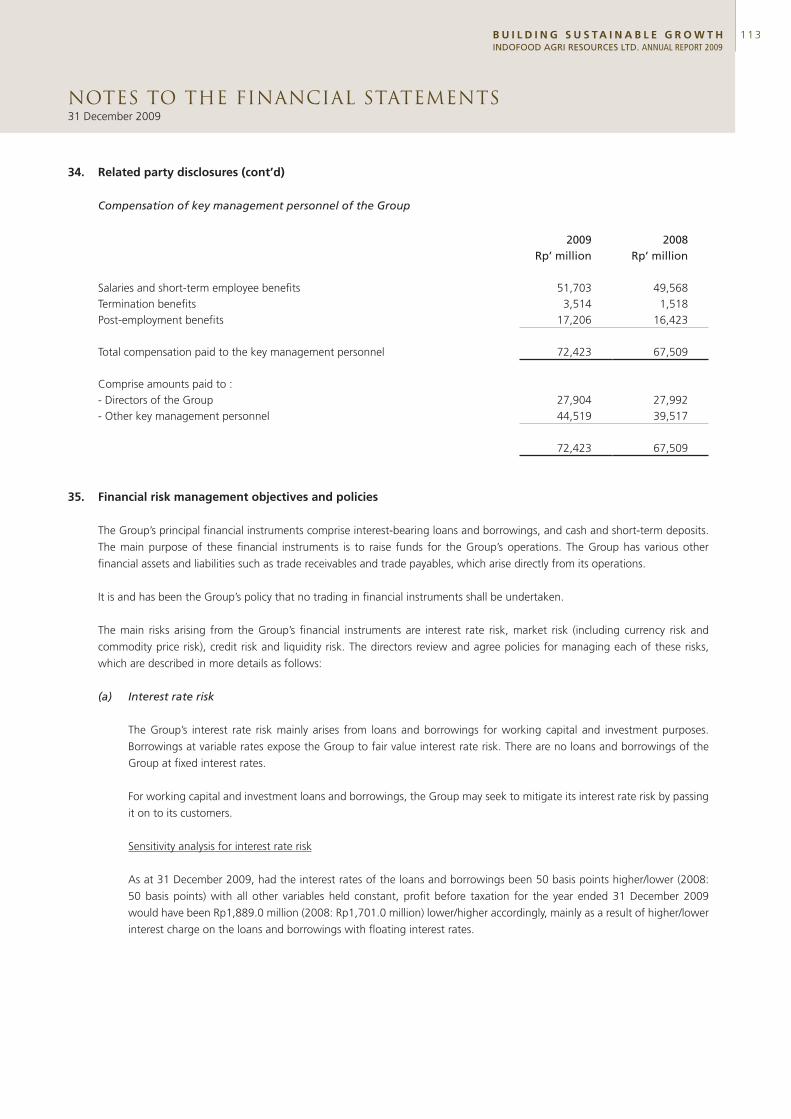
NOTES TO THE FINANCIAL STATEMENTS31 December 2009
34. Related party disclosures (cont’d)
Compensation of key management personnel of the Group
2009 2008Rp’ million Rp’ million
Salaries and short-term employee benefits 51,703 49,568Termination benefits 3,514 1,518Post-employment benefits 17,206 16,423
Total compensation paid to the key management personnel 72,423 67,509
Comprise amounts paid to :- Directors of the Group 27,904 27,992- Other key management personnel 44,519 39,517
72,423 67,509
35. Financial risk management objectives and policies
The Group’s principal financial instruments comprise interest-bearing loans and borrowings, and cash and short-term deposits.
The main purpose of these financial instruments is to raise funds for the Group’s operations. The Group has various other
financial assets and liabilities such as trade receivables and trade payables, which arise directly from its operations.
It is and has been the Group’s policy that no trading in financial instruments shall be undertaken.
The main risks arising from the Group’s financial instruments are interest rate risk, market risk (including currency risk and
commodity price risk), credit risk and liquidity risk. The directors review and agree policies for managing each of these risks,
which are described in more details as follows:
(a) Interest rate risk
The Group’s interest rate risk mainly arises from loans and borrowings for working capital and investment purposes.
Borrowings at variable rates expose the Group to fair value interest rate risk. There are no loans and borrowings of the
Group at fixed interest rates.
For working capital and investment loans and borrowings, the Group may seek to mitigate its interest rate risk by passing
it on to its customers.
Sensitivity analysis for interest rate risk
As at 31 December 2009, had the interest rates of the loans and borrowings been 50 basis points higher/lower (2008:
50 basis points) with all other variables held constant, profit before taxation for the year ended 31 December 2009
would have been Rp1,889.0 million (2008: Rp1,701.0 million) lower/higher accordingly, mainly as a result of higher/lower
interest charge on the loans and borrowings with floating interest rates.
1 1 3B U I L D I N G S U S T A I N A B L E G R O W T HINDOFOOD AGRI RESOURCES LTD. ANNUAL REPORT 2009

NOTES TO THE FINANCIAL STATEMENTS31 December 2009
35. Financial risk management objectives and policies (cont’d)
(b) Foreign currency risk
The Group’s reporting currency is the Indonesian Rupiah. The Group faces foreign exchange risk as its borrowings, export
sales and the costs of certain key purchases which are either denominated in the United States dollars or whose price
is significantly influenced by their benchmark price movements in foreign currencies (mainly US Dollar) as quoted on
international markets. To the extent that the revenue and purchases of the Group are denominated in currencies other
than Indonesian Rupiah, and are not evenly matched in terms of quantum and/or timing, the Group has exposure to
foreign currency risk.
The Group does not have any formal hedging policy for foreign exchange exposure. However, in relation to the matters
discussed in the preceding paragraph, the fluctuations in the exchange rates between Indonesian Rupiah and United
States Dollar provide some degree of natural hedge for the Group’s foreign exchange exposure.
As at 31 December 2009, had the exchange rate of Rupiah against US Dollar depreciated/appreciated by 10% with all
other variables held constant, profit before taxation for the year ended 31 December 2009 would have been Rp148.0
billion (2008: Rp176.6 billion) lower/higher, mainly as a result of foreign exchanges gains/losses on the translation of
cash and cash equivalents, trade receivables, interest-bearing loans and borrowings and trade payables denominated
in US Dollar.
(c) Commodity price risk
The Group is exposed to commodity price risk due to certain factors, such as weather, government policy, level of demand
and supply in the market and the global economic environment. Such exposure mainly arises from its purchase of CPO
where the profit margin on sale of its finished products may be affected if the cost of CPO (which is the main raw material
used in the refinery plants to manufacture cooking oils and fats products) increases and the Group is unable to pass such
cost increases to its customers. In addition, the Group is also subject to fluctuations in the selling price of its manufactured
CNO and the purchase price of copra (being the raw material used in the manufacture of CNO).
The Group’s policy is to minimise the risks arising from the fluctuations in the commodity prices by increasing self-
sufficiency in CPO for the refinery operations (through the purchase of CPO from the Group’s own plantations). To the
extent it is unable to do so, the Group may minimise such risks through forward contracts. As such, it may also be exposed
to commodity price risk as changes in fair value of future commodity contracts are recognised directly in the consolidated
statement of comprehensive income.
At 31 December 2009 and 2008, had the commodity prices been 10% higher/lower with all other variables held constant,
profit before tax in 2009 would have been Rp0.73 billion (2008: Nil) higher/lower, mainly as a result of higher/lower
quoted market prices of the open position future commodity contracts.
(d) Credit risk
The Group is exposed to credit risk arising from the credit granted to its customers. To mitigate this risk, it has policies in
place to ensure that sales of products are made only to creditworthy customers with proven track record or good credit
history. It is the Group’s policy that all customers who wish to trade on credit terms are subject to credit verification
procedures. For export sales, the Group requires cash against the presentation of documents of title. For domestic sales,
the Group may grant its customers credit terms up to 45 days from the issuance of invoice. The Group has policies that limit
the amount of credit exposure to any particular customer, such as, requiring sub-distributors to provide bank guarantees.
In addition, receivable balances are monitored on an ongoing basis to reduce the Group’s exposure to bad debts.
1 1 4

NOTES TO THE FINANCIAL STATEMENTS31 December 2009
35. Financial risk management objectives and policies (cont’d)
(d) Credit risk (cont’d)
When a customer fails to make payment within the credit terms granted, the Group will contact the customer to act on
the overdue receivables. If the customer does not settle the overdue receivable within a reasonable time, the Group will
proceed to commence legal proceedings. Depending on the Group’s assessment, specific provisions may be made if the
debt is deemed uncollectible. To mitigate credit risk, the Group will cease the supply of all products to customers in the
event of late payment and/or default.
The Group has no concentration of credit risk.
(e) Liquidity risk
The Group manages its liquidity profile to be able to finance its capital expenditure and service its maturing debts by
maintaining sufficient cash and marketable securities, and the availability of funding through an adequate amount of
committed credit facilities.
The Group regularly evaluates its projected and actual cash flow information and continuously assesses conditions in
the financial markets for opportunities to pursue fund-raising initiatives. These initiatives may include bank loans and
borrowings and equity market issues.
The table below summarises the maturity profile of the Group’s financial assets and liabilities at the balance sheet date
based on contractual undiscounted repayment obligations:
TotalWithin1 year
Within1 to 5 years
More than5 years
Rp’ million Rp’ million Rp’ million Rp’ million
Group
As at 31 December 2009Financial liabilities:
Non-current interest-bearing loans and
borrowings 6,799,074 – 6,247,744 551,330
Other payables (non-current) 323,096 – 323,096 –Trade and other payables and accruals 1,031,204 1,031,204 – –Current interest-bearing loans and
borrowings 1,848,130 1,848,130 – –
Total undiscounted financial liabilities 10,001,504 2,879,334 6,570,840 551,330
1 1 5B U I L D I N G S U S T A I N A B L E G R O W T HINDOFOOD AGRI RESOURCES LTD. ANNUAL REPORT 2009

NOTES TO THE FINANCIAL STATEMENTS31 December 2009
35. Financial risk management objectives and policies (cont’d)
(e) Liquidity risk (cont’d)
TotalWithin1 year
Within1 to 5 years
More than5 years
Rp’ million Rp’ million Rp’ million Rp’ million
Group
As at 31 December 2008Financial liabilities:
Non-current interest-bearing loans and
borrowings 4,942,837 – 4,706,290 236,547
Other payables (non-current) 239,278 – 239,278 –Trade and other payables and accruals 1,016,676 1,016,676 – –Current interest-bearing loans and
borrowings 2,552,353 2,552,353 – –
Total undiscounted financial liabilities 8,751,144 3,569,029 4,945,568 236,547
Undiscounted loans and borrowings with floating rates had been determined with reference to the applicable rates as at
balance sheet dates.
Company
As at 31 December 2009Financial liabilities:
Trade and other payables and accruals 11,257 11,257 – –
As at 31 December 2008Financial liabilities:
Trade and other payables and accruals 15,616 15,616 – –
The table below shows the contractual expiry by maturity of the Group’s and the Company’s contingent liabilities and
commitments. The maximum amount of the financial guarantee contracts are allocated to the earliest period in which the
guarantee could be called.
TotalWithin1 year
Within1 to 5 years
More than5 years
Rp’ million Rp’ million Rp’ million Rp’ million
As at 31 December 2009GroupFinancial guarantees 5,062,880 1,406,238 3,450,412 206,230
CompanyFinancial guarantees 4,011,279 1,274,511 2,584,488 152,280
1 1 6

NOTES TO THE FINANCIAL STATEMENTS31 December 2009
35. Financial risk management objectives and policies (cont’d)
(e) Liquidity risk (cont’d)
TotalWithin1 year
Within1 to 5 years
More than5 years
Rp’ million Rp’ million Rp’ million Rp’ million
As at 31 December 2008GroupFinancial guarantees 3,794,450 1,172,880 2,437,245 184,325
CompanyFinancial guarantees 3,402,000 1,172,880 2,229,120 –
36. Fair value of financial instruments
Fair value is defined as the amount at which the instrument could be exchanged in a current transaction between knowledgeable
willing parties in an arm’s length transaction, other than in a forced or liquidation sale. Fair values are obtained from quoted
market prices, discounted cash flow models and option pricing models as appropriate.
Financial instruments presented in the consolidated balance sheet are carried at the fair value, otherwise, they are presented at
carrying amounts as either these are reasonable approximation of fair values or their fair values cannot be reliably measured. The
following methods and assumptions are used to estimate the fair value of each class of financial instruments:
(a) Financial instruments carried at fair value or amortised cost
Net receivables and payables arising from future commodity contracts are stated based on their quoted market prices.
Plasma receivables and long-term loans to employees are carried at amortised cost using the effective interest method and
the discount rates used are the current market incremental lending rate for similar types of lending.
Interest bearing Bonds and Sukuk Ijarah payables are carried at amortised cost using the effective interest method.
(b) Financial instruments with carrying amounts that approximate their fair values
The fair value of cash and cash equivalents, current trade and other receivables, current trade and other payables, current
bank loans and accrued expenses approximate their carrying values due to their short-term nature. The carrying amounts of
long-term loans and borrowings with floating interest rates approximate their fair values as they are re-priced frequently.
(c) Financial instruments carried at amounts other than fair values
Investments in other unquoted ordinary shares representing ownership interest of below 20.0% equity ownership are
carried at cost as their fair value cannot be reliably measured.
The non-current loan to a subsidiary company is carried at cost in the Company’s balance sheet as the loan is not expected
to be repaid until the cash flow of the subsidiary company permits. Therefore, it is impractical to determine the fair value
of this loan as the timing of future cash flow cannot be estimated reliably.
1 1 7B U I L D I N G S U S T A I N A B L E G R O W T HINDOFOOD AGRI RESOURCES LTD. ANNUAL REPORT 2009

NOTES TO THE FINANCIAL STATEMENTS31 December 2009
36. Fair value of financial instruments (cont’d)
Set out below is a comparison by category of carrying amounts of all the Group’s and Company’s financial instruments that are
carried in the financial statements:
Classification of financial instruments
The GroupLoans
and receivables
Fair valuethrough profit
and lossLiabilities at
amortised cost
Non-financialassets/
liabilities TotalRp’ million Rp’ million Rp’ million Rp’ million Rp’ million
31 December 2009
AssetsBiological assets – – – 9,486,096 9,486,096Property, plant and equipment – – – 4,223,457 4,223,457Prepaid land premiums and deferred
land rights acquisition costs – – – 1,430,347 1,430,347Goodwill – – – 3,155,786 3,155,786Claims for tax refund – – – 328,844 328,844Deferred tax assets – – – 294,327 294,327Other non-current assets 814,283 – – 3,528 817,811Inventories – – – 1,082,557 1,082,557Trade and other receivables 687,711 – – 225,747 913,458Prepaid taxes – – – 112,779 112,779Cash and cash equivalents 1,802,345 – – – 1,802,345
3,304,339 – – 20,343,468 23,647,807
LiabilitiesTrade and other payables and accruals – – 1,031,204 41,598 1,072,802Interest-bearing loans and borrowings – – 6,959,479 – 6,959,479Income tax payable – – – 106,182 106,182Other payables – – 323,096 – 323,096Employee benefits liabilities – – – 442,960 442,960Deferred tax liabilities – – – 1,763,993 1,763,993
– – 8,313,779 2,354,733 10,668,512
1 1 8

NOTES TO THE FINANCIAL STATEMENTS31 December 2009
36. Fair value of financial instruments (cont’d)
The GroupLoans
and receivables
Fair valuethrough profit
and lossLiabilities at
amortised cost
Non-financialassets/
liabilities TotalRp’ million Rp’ million Rp’ million Rp’ million Rp’ million
31 December 2008
AssetsBiological assets – – – 8,152,865 8,152,865Property, plant and equipment – – – 2,963,688 2,963,688Prepaid land premiums and deferred
land rights acquisition costs – – – 1,379,286 1,379,286Goodwill – – – 2,994,523 2,994,523Claims for tax refund – – – 58,953 58,953Deferred tax assets – – – 239,314 239,314Other non-current assets 705,342 – – 4,078 709,420Inventories – – – 910,542 910,542Trade and other receivables 740,930 – – 182,240 923,170Prepaid taxes – – – 122,624 122,624Cash and cash equivalents 2,408,266 – – – 2,408,266
3,854,538 – – 17,008,113 20,862,651
LiabilitiesTrade and other payables and accruals – – 1,016,676 25,793 1,042,469Interest-bearing loans and borrowings – – 6,256,585 – 6,256,585Income tax payable – – – 403,852 403,852Other payables – – 239,278 – 239,278Employee benefits liabilities – – – 355,372 355,372Deferred tax liabilities – – – 1,589,593 1,589,593
– – 7,512,539 2,374,610 9,887,149
1 1 9B U I L D I N G S U S T A I N A B L E G R O W T HINDOFOOD AGRI RESOURCES LTD. ANNUAL REPORT 2009

NOTES TO THE FINANCIAL STATEMENTS31 December 2009
36. Fair value of financial instruments (cont’d)
The CompanyLoans
and receivables
Fair valuethrough profit
and lossLiabilities at
amortised cost
Non-financialassets/
liabilities TotalRp’ million Rp’ million Rp’ million Rp’ million Rp’ million
31 December 2009
AssetsProperty, plant and equipment – – – 70,001 70,001Investment in subsidiary companies – – – 8,487,971 8,487,971Loan to a subsidiary company 2,259,501 – – – 2,259,501Other non-current assets 24 – – – 24Trade and other receivables 17,003 – – 623 17,626Cash and cash equivalents 183,450 – – – 183,450
2,459,978 – – 8,558,595 11,018,573
LiabilitiesTrade and other payables and accruals – – 11,257 – 11,257Income tax payable – – 130 – 130
– – 11,387 – 11,387
31 December 2008
AssetsProperty, plant and equipment – – – 74,272 74,272Investment in subsidiary companies – – – 8,487,971 8,487,971Loan to a subsidiary company 2,259,501 – – – 2,259,501Other non-current assets 863 – – – 863Trade and other receivables 19,441 – – 14,349 33,790Cash and cash equivalents 186,243 – – – 186,243
2,466,048 – – 8,576,592 11,042,640
LiabilitiesTrade and other payables and accruals – – 15,616 – 15,616Income tax payable – – 130 – 130
– – 15,746 – 15,746
37. Capital management
The primary objective of the Group’s capital management is to ensure that it maintains healthy capital ratios in order to support
its business and maximize shareholder value.
Certain subsidiary companies are required to comply with loan covenants imposed by their lenders, such as maintaining the level
of existing share capital. This externally imposed requirement has been complied with by the relevant subsidiary companies for
the financial year ended 31 December 2009 and 2008. Additionally, certain subsidiary companies in Indonesia are required by
the new Corporate Law, effective from August 2007, to maintain a non-distributable reserve until it reaches 20% of the issued
and paid share capital. This externally imposed capital requirement will be complied by the relevant subsidiary companies by their
next annual general meeting.
1 2 0

NOTES TO THE FINANCIAL STATEMENTS31 December 2009
37. Capital management (cont’d)
The Group manages its capital structure and makes adjustments to it, in light of changes in economic conditions. To maintain or
adjust the capital structure, the Group may adjust the dividend payment to shareholders, return capital to shareholders or issue new
shares. No changes were made in the objectives, policies or processes during the years ended 31 December 2009 and 2008.
The Group monitors capital using gearing ratios, by dividing net debt with total equity. The Group’s policy is to keep the gearing
ratio within the range of gearing ratios of leading companies in similar industry in Indonesia in order to secure access to finance
at a reasonable cost.
2009 2008Rp’ million Rp’ million
Non-current interest-bearing loans and borrowings 5,213,015 3,876,936Current interest-bearing loans and borrowings 1,746,464 2,379,649
6,959,479 6,256,585Less :
Cash and cash equivalents (1,802,345) (2,408,266)
Net debts 5,157,134 3,848,319
Total equity 12,979,295 10,975,502
Gearing ratio 40% 35%
38. Segment information
For management purposes, the Group is organized into business units based on their products and services and has three
reportable operating segments as follows:
Plantations segment
Plantations segment is mainly involved in the development and maintenance of oil palm and rubber plantations and other
business activities relating to palm oil and rubber processing, marketing and selling. This segment is also involved in the
development and maintenance of cocoa, coconut, tea, coffee and integrated sugar cane plantations.
Cooking oil and fats segment
Cooking oil and fats segment produces, markets and sells cooking oil, margarine, fats and other related products.
Commodities segment
Commodities segment engages in the production, marketing and selling of CNO and CPO and their derivative products as well
as trading of CPO and its derivative products.
Management monitors the operating results of its business units separately for the purpose of making decisions about resource
allocation and performance assessment. Segment performance is evaluated based on operating profit or loss and is measured
consistently with operating profit or loss in the consolidated financial statements. However, Group financing (including finance
costs and finance income) and income taxes are managed on a group basis and are not allocated to operating segments.
Transfer prices between business segments are set on an arm’s length basis in a manner similar to transactions with third parties.
Segment revenues, segment expenses and segment results include transfers between business segments. Those transfers are
eliminated for purposes of consolidation.
1 2 1B U I L D I N G S U S T A I N A B L E G R O W T HINDOFOOD AGRI RESOURCES LTD. ANNUAL REPORT 2009

NOTES TO THE FINANCIAL STATEMENTS31 December 2009
38. Segment information (cont’d)
The following table presents revenue and profit and certain asset and liability information regarding the Group’s business segments:
Business segments
PlantationsCooking oil
and fats CommodityOthers/
eliminations TotalRp’ million Rp’ million Rp’ million Rp’ million Rp’ million
Year ended 31 December 2009
RevenueSales to external customers 3,121,227 5,181,265 737,833 – 9,040,325Inter-segment sales 2,925,137 – 110,706 (3,035,843) –
Total sales 6,046,364 5,181,265 848,539 (3,035,843) 9,040,325
Segment results 2,876,769 118,826 (46,759) 11,381 2,960,217
Net finance costs (376,641)Net foreign exchange gain 303,984Profit before taxation 2,887,560Tax expense (834,298)
Profit for the year 2,053,262
Assets and liabilitiesSegment assets 18,918,574 1,966,700 572,160 (1,588,584) 19,868,850Goodwill 3,155,786 – – – 3,155,786Deferred tax assets 294,327Claims for tax refund 328,844
Total assets 23,647,807
Segment liabilities 1,419,426 1,079,944 722,152 (1,382,664) 1,838,858Unallocated liabilities 6,959,479Deferred tax liabilities 1,763,993Income tax payable 106,182
Total liabilities 10,668,512
Other segment informationCapital expenditure 2,231,879 60,386 11,616 21 2,303,902Depreciation and amortisation 286,799 39,077 12,889 4,240 343,005Gain from changes in fair value
of biological assets 622,570 – – – 622,570Loss on write-off of plasma
receivables 26,602 – – – 26,602Provision for employee benefits 99,569 15,855 3,842 – 119,266
1 2 2

NOTES TO THE FINANCIAL STATEMENTS31 December 2009
38. Segment information (cont’d)
Business segments (cont’d)
PlantationsCooking oil
and fats CommodityOthers/
eliminations TotalRp’ million Rp’ million Rp’ million Rp’ million Rp’ million
Year ended 31 December 2008
RevenueSales to external customers 3,751,376 6,545,490 1,543,633 – 11,840,499Inter-segment sales 3,056,216 104 119,167 (3,175,487) –
Total sales 6,807,592 6,545,594 1,662,800 (3,175,487) 11,840,499
Segment results 1,935,183 240,041 50,645 (138,327) 2,087,542
Net finance costs (339,801)Net foreign exchange loss (228,666)Profit before taxation 1,519,075Tax expense (452,358)
Profit for the year 1,066,717
Assets and liabilitiesSegment assets 16,090,370 1,770,674 704,408 (995,591) 17,569,861Goodwill 2,994,523 – – – 2,994,523Deferred tax assets 239,314Claims for tax refund 58,953
Total assets 20,862,651
Segment liabilities 1,244,205 648,381 762,094 (1,017,561) 1,637,119Unallocated liabilities 6,256,585Deferred tax liabilities 1,589,593Income tax payable 403,852
Total liabilities 9,887,149
Other segment informationCapital expenditure 1,466,700 49,761 10,330 74,120 1,600,911Depreciation and amortisation 226,692 36,737 13,198 154 276,781Loss from changes in fair value
of biological assets (947,226) – – – (947,226)Loss on write-off of plasma
receivables 14,451 – – – 14,451Provision for employee benefits 93,092 12,762 3,190 – 109,044
1 2 3B U I L D I N G S U S T A I N A B L E G R O W T HINDOFOOD AGRI RESOURCES LTD. ANNUAL REPORT 2009

NOTES TO THE FINANCIAL STATEMENTS31 December 2009
38. Segment information (cont’d)
Geographical segments
The following table presents sales to customers based on the geographical location of the customers:
Region Revenue Eliminations TotalRp’ million Rp’ million Rp’ million
Year ended 31 December 2009
Indonesia 10,036,785 (3,035,843) 7,000,942Singapore 475,581 – 475,581Netherlands 428,705 – 428,705United States of America 286,013 – 286,013China 236,034 – 236,034Malaysia 139,262 – 139,262India 32,495 – 32,495Spain 37,700 – 37,700Others 403,593 – 403,593
Segment revenue 12,076,168 (3,035,843) 9,040,325
Year ended 31 December 2008
Indonesia 10,926,665 (3,175,487) 7,751,178United States of America 1,026,275 – 1,026,275Singapore 964,973 – 964,973China 562,403 – 562,403Netherlands 450,354 – 450,354India 298,923 – 298,923Spain 142,867 – 142,867Malaysia 22,004 – 22,004Others 621,522 – 621,522
Segment revenue 15,015,986 (3,175,487) 11,840,499
The Group’s capital expenditure and segment assets are primarily incurred and located in Indonesia.
39. Comparative figures
The following accounts in the consolidated financial statements as of 31 December 2008 have been reclassified to conform with
the presentation of accounts in the consolidated financial statements as of 31 December 2009:
2008 2008
As reclassifiedAs previously
reportedRp’ million Rp’ million
Balance sheet:Trade and other receivables 923,170 969,160Other non-current assets 709,420 663,430
NOTES TO THE FINANCIAL STATEMENTS31 December 2009
1 2 4
NOTES TO THE FINANCIAL STATEMENTS31 December 2009
40. Events after balance sheet date
(a) On 12 January 2010, a subsidiary of the Company, Lonsum, made a draw down of US$30.0 million from its loan facility
obtained from SMBC and DBS Singapore.
(b) On 8 March 2010, a 90%-owned subsidiary of the Company, PT SIMP, made a draw down of US$15.0 million from its
working capital facility obtained from SMBC.
41. Authorisation of financial statements for issue
The financial statements for the year ended 31 December 2009 were authorised for issue in accordance with a resolution of the
directors on 8 March 2010.
1 2 5B U I L D I N G S U S T A I N A B L E G R O W T HINDOFOOD AGRI RESOURCES LTD. ANNUAL REPORT 2009

INTERESTED PERSON TRANSACTIONS
1 2 6
Interested person transactions (“IPT’) carried out during the financial year ended 31 December 2009 pursuant to the Shareholders’
Mandate obtained under Chapter 9 of the Listing Manual of the Singapore Exchange Securities Trading Limited by the Group are as
follows:
Aggregate value of all IPTconducted under a shareholders’mandate pursuant to Rule 920
(excluding transactions less thanS$100,000
Name of Interested Person
Rp ’billion
PT ISM Group
2,268.8
61.6
o Principal amount outstanding at end of year –
o Largest loan + interest outstanding during the year 50.5
Salim Group
0.4
21.5
281.1
o Principal amount outstanding in respect of the interest bearing loans
at end of year 453.5
o Maximum loan outstanding (inclusive of principal and interest)
during the year 457.0
in favour of banks in respect of loan facilities extended to certain
subsidiaries, which are associates of Salim Group
o Principal amount outstanding in respect of the bank loan facilities at
end of year872.3
o Maximum loan outstanding (inclusive of principal and interest)
during the year876.3
0.5

ESTATE LOCATION
No Company Estate Name Distric/Kabupaten Province Description
1 Salim Ivomas Pratama Kayangan Rokan Hilir North Riau Oil Palm Estate
Kencana Rokan Hilir North Riau Oil Palm Estate
Sungai Dua Rokan Hilir North Riau Oil Palm Estate
Balam Rokan Hilir North Riau Oil Palm Estate
2 Cibaliung Tunggal Plantation Cibaliung Rokan Hilir North Riau Oil Palm Estate
3 Gunung Mas Raya Sungai Rumbia 1 Rokan Hilir North Riau Oil Palm Estate
Sungai Rumbia 2 Rokan Hilir North Riau Oil Palm Estate
Sungai Bangko 1 Rokan Hilir North Riau Oil Palm Estate
Sungai Bangko 2 Rokan Hilir North Riau Oil Palm Estate
4 Indriplant Napal Indragiri Hulu South Riau Oil Palm Estate
5 Serikat Putra Lubuk Raja Pelalawan South Riau Oil Palm Estate
Bukit Raja Pelalawan South Riau Oil Palm Estate
6 Mentari Subur Abadi Muara Merang Musi Banyuasin South Sumatra Oil Palm Estate
Mangsang Musi Banyuasin South Sumatra Oil Palm Estate
Karang Agung Musi Banyuasin South Sumatra Oil Palm Estate
Hulu Merang Musi Banyuasin South Sumatra Oil Palm Estate
7 Swadaya Bhakti Negaramas Pulai Gading Musi Banyuasin South Sumatra Oil Palm Estate
8 Sarana Inti Pratama Lindai Kampar North Riau Oil Palm Estate
9 Citranusa Intiwsawit Kedukul Sanggau West Kalimantan Oil Palm Estate
10 Kebun Ganda Prima Kembayan Sanggau West Kalimantan Oil Palm Estate
11 Riau Agrotama Plantation Nanga Silat Kapuas Hulu West Kalimantan Oil Palm Estate
12 Citra Kalbar Sarana Sepauk Sintang West Kalimantan Oil Palm Estate
13 Jake Sarana Sekubang Sintang West Kalimantan Oil Palm Estate
14 Agro Subur Permai Manis Kapuas Central Kalimantan Oil Palm Estate
15 Kebun Mandiri Sejahtera Mariango Pasir Utara East Kalimantan Oil Palm Estate
Penajam Pasir Utara East Kalimantan Rubber Estate
16 Gunta Samba Ampanas Kutai Timur East Kalimantan Oil Palm Estate
Pengadan Kutai Timur East Kalimantan Oil Palm Estate
Elang Kutai Timur East Kalimantan Oil Palm Estate
17 Multi Pacific International Peridan Kutai Timur East Kalimantan Oil Palm Estate
Kerayaan Kutai Timur East Kalimantan Oil Palm Estate
Cipta Graha Kutai Timur East Kalimantan Oil Palm Estate
Muara Bulan Kutai Timur East Kalimantan Oil Palm Estate
Baay Kutai Timur East Kalimantan Oil Palm Estate
18 Mitra Inti Sejati Plantation Bengkayang Sambas West Kalimantan Oil Palm Estate
19 Hijau Pertiwi Indah Plantation Lupak Dalam Kapuas Hulu Central Kalimantan Oil Palm Estate
Bunga Tanjung Kapuas Hulu Central Kalimantan Oil Palm Estate
20 Cangkul Bumi Subur Bumi Subur Musi Banyuasin South Sumatra Oil Palm Estate
21 Pelangi Inti Pertiwi Mancang Musi Banyuasin South Sumatra Oil Palm Estate
22 Inti Megah Bestari Pertiwi Sungai Ampalau Musi Banyuasin South Sumatra Oil Palm Estate
1 2 7B U I L D I N G S U S T A I N A B L E G R O W T HINDOFOOD AGRI RESOURCES LTD. ANNUAL REPORT 2009

ESTATE LOCATION
No Company Estate Name Distric/Kabupaten Province Description
23 Lonsum Dolok Batu Bara North Sumatra Oil Palm Estate
Gunung Malayu Asahan North Sumatra Oil Palm Estate
Begerpang Deli Serdang North Sumatra Oil Palm Estate
Sei Merah Deli Serdang North Sumatra Oil Palm Estate
Rambong Sialang Serdang Bedagai North Sumatra Oil Palm Estate
Sibulan Serdang Bedagai North Sumatra Oil Palm & Rubber Estate
Bungara Langkat North Sumatra Oil Palm Estate
Turangie Langkat North Sumatra Oil Palm Estate
Pulo Rambong Langkat North Sumatra Oil Palm Estate
Sei Rumbiya Labuhan Batu North Sumatra Oil Palm & Rubber Estate
Bah Bulian Simalungun North Sumatra Oil Palm Estate
Bah Lias Simalungun North Sumatra Oil Palm, Cocoa & Coconut
Estate
Bukit Hijau Musi Rawas South Sumatra Oil Palm Estate
Belani Elok Musi Rawas South Sumatra Oil Palm Estate
Batu Cemerlang Musi Rawas South Sumatra Oil Palm Estate
Ketapat Bening Musi Rawas South Sumatra Oil Palm Estate
Sei Kepayang Musi Rawas South Sumatra Oil Palm Estate
Gunung Bais Musi Rawas South Sumatra Oil Palm Estate
Riam Indah Musi Rawas South Sumatra Oil Palm Estate
Sei Lakitan Musi Rawas South Sumatra Oil Palm Estate
Sei Gemang Musi Rawas South Sumatra Oil Palm Estate
Terawas Indah Musi Rawas South Sumatra Oil Palm Estate
Tulung Gelam Ogan Komering Ilir South Sumatra Rubber Estate
Kubu Pakaran Ogan Komering Ilir South Sumatra Rubber Estate
Bebah Permata Ogan Komering Ilir South Sumatra Rubber Estate
Tirta Agung Musi Banyuasin South Sumatra Oil Palm Estate
Budi Tirta Musi Banyuasin South Sumatra Oil Palm Estate
Suka Damai Musi Banyuasin South Sumatra Oil Palm Estate
Sei Punjung Musi Banyuasin South Sumatra Oil Palm Estate
Arta Kencana Lahat South Sumatra Oil Palm Estate
Kencana Sari Lahat South Sumatra Oil Palm Estate
Kertasarie Bandung West Java Tea Estate
Treblasala Banyuwangi East Java Cocoa & Coconut Estate
Isuy Makmur Kutai Barat East Kalimantan Oil Palm Estate
Pahu Makmur Kutai Barat East Kalimantan Oil Palm Estate
Balombissie Bulukumba South Sulawesi Rubber Estate
Palang Isang Bulukumba South Sulawesi Rubber Estate
Pungkol Minahasa North Sulawesi Cocoa & Coconut Estate
24 Lajuperdana Indah Komering Sugar Ogan Komering Ulu
Timur
South Sumatra Sugar Cane
1 2 8

Distribution Of Shareholdings
No. ofSize Of Shareholdings Shareholders % No. of Shares* %
1 - 999 406 8.30 118,186 0.011,000 - 10,000 3,614 73.86 17,306,527 1.2010,001 - 1,000,000 853 17.43 40,649,430 2.831,000,001 And Above 20 0.41 1,380,708,687 95.96
Total 4,893 100.00 1,438,782,830 100.00
* Based on total number of issued shares, excluding 9,000,000 shares held in treasury.
Twenty Largest Shareholders
No. Name No. of Shares %**
1 Kim Eng Securities Pte. Ltd. 1,000,591,000 69.542 HSBC (Singapore) Nominees Pte Ltd 115,786,546 8.053 Citibank Nominees Singapore Pte Ltd 73,402,014 5.104 DBS Nominees Pte Ltd 56,130,047 3.905 Raffles Nominees (Pte) Ltd 35,237,688 2.456 DBSN Services Pte Ltd 33,356,779 2.327 United Overseas Bank Nominees Pte Ltd 25,389,510 1.768 DB Nominees (S) Pte Ltd 9,466,116 0.669 UOB KaY Hian Pte Ltd 4,828,900 0.3410 OCBC Securities Private Ltd 4,465,300 0.3111 Royal Bank Of Canada (Asia) Ltd 3,484,000 0.2412 Morgan Stanley Asia ( Singapore) Securities Pte Ltd 2,498,295 0.1713 BNP Paribas Securities Services Singapore Pte Ltd 2,482,915 0.1714 Phillip Securities Pte Ltd 2,394,500 0.1715 DBS Vickers Securities (S) Pte Ltd 2,207,750 0.1516 Macquarie Capital Securities Pte Ltd 1,898,710 0.1317 Merrill Lynch (Singapore) Pte Ltd 1,875,841 0.1318 Amfraser SecuRities Pte. Ltd. 1,858,000 0.1319 CIMB-Gk Securities Pte. Ltd. 1,854,776 0.1320 Teo Chuan Keng Sdn Bhd 1,500,000 0.10
Total 1,380,708,687 95.95
** Percentage is calculated based on total number of issued shares, excluding 9,000,000 shares held in treasury of the Company.
STATISTICS OF SHAREHOLDINGSAs at 15 March 2010
1 2 9B U I L D I N G S U S T A I N A B L E G R O W T HINDOFOOD AGRI RESOURCES LTD. ANNUAL REPORT 2009

STATISTICS OF SHAREHOLDINGSAs at 15 March 2010
List Of Substantial Shareholders’ Interests
Name Of Substantial Shareholder Direct Interest Deemed InterestNumber of
Shares HeldShareholding
% **Number of
Shares HeldShareholding
% **
Indofood Singapore Holdings Pte. Ltd. (“ISHPL”) 998,200,000 69.38 – –PT Indofood Sukses Makmur Tbk (“PT ISM”)(1) – – 998,200,000 69.38Lapu–Lapu Holdings Limited (“Lapu-Lapu”)(2) – – 998,200,000 69.38CAB Holdings Limited (“CAB”)(2) – – 998,200,000 69.38First Pacific Company Limited (“First Pacific”)(3) – – 998,200,000 69.38First Pacific Investments Limited (“FPIL”)(4) 1,125,344 0.08 998,200,000 69.38First Pacific Investments (B.V.I.) Limited (“FPIL BVI”) (4) 882,444 0.06 998,200,000 69.38Salerni International Limited (“Salerni”)(5) – – 1,000,207,788 69.52Anthoni Salim(6) – – 1,000,207,788 69.52
Notes:
** Percentage is calculated based on total number of issued shares, excluding 9,000,000 shares held in treasury, of the Company.
(1) PT ISM is a holding company of ISHPL with an interest of approximately 83.84% of the total number of issued shares in ISHPL.
Accordingly, PT ISM is deemed to be interested in the Shares held by ISHPL.
(2) Lapu-Lapu, together with its associate, CAB, collectively own not less than 20% of the issued share capital of PT ISM. Accordingly,
Lapu-Lapu and CAB are deemed to be interested in the Shares held by ISHPL.
(3) First Pacific owns 100% of the issued share capital of CAB and Lapu-Lapu respectively. Accordingly, First Pacific is deemed to be
interested in the Shares held by ISHPL.
(4) FPIL, together with FPIL BVI, collectively own not less than 20% of the issued share capital of First Pacific. Accordingly, FPIL and
FPIL BVI are deemed to be interested in the Shares held by ISHPL.
(5) Salerni owns more than 50% of the issued share capital of FPIL BVI. Accordingly, Salerni is deemed to be interested in the Shares
held by ISHPL, FPIL and FPIL BVI.
(6) Mr Anthoni Salim owns 100% of the issued share capital of Salerni. Accordingly, Mr Anthoni Salim is deemed interested in the
Shares held by ISHPL, FPIL and FPIL BVI.
PUBLIC FLOAT
Based on the information available to the Company as at 15 March 2010, approximately 30.45% of the issued ordinary shares of the
Company is held by the public. Therefore, the public float requirement under Rule 723 of the Listing Manual issued by the Singapore
Exchange Securities Trading Limited is complied with.
1 3 0

NOTICE IS HEREBY GIVEN that the Annual General Meeting of the Company will be held at Swissôtel Merchant Court Singapore,
Merchant Court Ballroom, Section A, 20 Merchant Road, Singapore 058281 on Thursday, 29 April 2010 at 4.00 p.m., to transact
the following business:
AS ORDINARY BUSINESS
1. To receive and adopt the Directors’ Report and Accounts for the year ended 31 December 2009 and the Auditors’ Report
thereon. [Resolution 1]
2. To approve the Directors’ Fees of S$285,000 (2008: S$285,000) for the year ended 31 December 2009. [Resolution 2]
3. To re-elect the following Directors, who retire under Article 117 of the Company’s Articles of Association:-
a) Mr Goh Kian Chee [Resolution 3a]
b) Mr Hendra Susanto [Resolution 3b]
c) Mr Axton Salim [Resolution 3c]
d) Mr Suaimi Suriady [Resolution 3d]
4. To re-appoint Messrs Ernst & Young LLP as the Company’s Auditors and to authorise the Directors to fix their
remuneration. [Resolution 4]
AS SPECIAL BUSINESS
To consider and, if thought fit, pass the following Resolutions Nos. 5 to 8 as Ordinary Resolutions:
5. That authority be and is hereby given to the directors of the Company to:
(i) (aa) issue shares in the Company (“Shares”) whether by way of rights, bonus or otherwise; and/or
(bb) make or grant offers, agreements or options (collectively, “Instruments”) that might or would require Shares to be
issued during the continuance of this authority or thereafter, including but not limited to the creation and issue of
(as well as adjustments to) warrants, debentures or other instruments convertible into Shares,
at any time and upon such terms and conditions and for such purposes and to such persons as the directors may, in their
absolute discretion, deem fit; and
(ii) issue Shares in pursuance of any Instrument made or granted by the directors while such authority was in force
(notwithstanding that such issue of Shares pursuant to the Instruments may occur after the expiration of the authority
contained in this resolution),
Provided that:
(iii) the aggregate number of the Shares to be issued pursuant to such authority (including the Shares to be issued in pursuance
of Instruments made or granted pursuant to such authority), does not exceed 50% (unless paragraph (v) below applies)
of the total number of issued Shares (as calculated in accordance with paragraph (iv) below), and provided further that
where shareholders of the Company (“Shareholders”) are not given the opportunity to participate in the same on a pro-
rata basis (“non pro-rata basis”), then the Shares to be issued under such circumstances (including the Shares to be issued
in pursuance of Instruments made or granted pursuant to such authority) shall not exceed 20% of the total number of
issued Shares (as calculated in accordance with paragraph (iv) below);
NOTICE OF ANNUAL GENERAL MEETING
1 3 1B U I L D I N G S U S T A I N A B L E G R O W T HINDOFOOD AGRI RESOURCES LTD. ANNUAL REPORT 2009

NOTICE OF ANNUAL GENERAL MEETING
(iv) (subject to such manner of calculation as may be prescribed by the Singapore Exchange Securities Trading Limited (the
“SGX-ST”)) for the purpose of determining the aggregate number of the Shares that may be issued under paragraph (iii)
above, the total number of issued Shares shall be based on the total number of issued Shares of the Company (excluding
treasury shares) at the time such authority was conferred, after adjusting for:
(aa) new Shares arising from the conversion or exercise of any convertible securities;
(bb) new Shares arising from exercising share options or the vesting of share awards which are outstanding or subsisting
at the time such authority was conferred; and
(cc) any subsequent bonus issue, consolidation or subdivision of the Shares;
and, in relation to an Instrument, the number of Shares shall be taken to be that number as would have been issued had
the rights therein been fully exercised or effected on the date of the making or granting of the Instrument;
(v) the 50% limit in paragraph (iii) above may be increased to 100% for issues of Shares and/or Instruments by way of
a renounceable rights issue where Shareholders are given the opportunity to participate in the same on a pro-rata
basis; and
(vi) (unless revoked or varied by the Company in general meeting), the authority so conferred shall continue in force until the
conclusion of the next annual general meeting of the Company or the date by which the next annual general meeting of
the Company is required by law to be held, whichever is the earlier, or in relation to paragraph (v) above, 31 December
2010 or if extended by the SGX-ST (the “Extended Date”), the earliest of the conclusion of the next annual general
meeting of the Company or the date by which the next annual general meeting of the Company is required by law to be
held or the Extended Date. [Resolution 5]
6. That subject to and pursuant to the share issue mandate in Resolution 5 being obtained and in force, authority be and is hereby
given to the directors of the Company to issue Shares on a non pro-rata basis at a discount of not more than 20% to the weighted
average price of the Shares for trades done on the SGX-ST (calculated in the manner as may be prescribed by the SGX-ST), provided
that (unless revoked or varied by the Company in general meeting), the authority so conferred shall continue in force until 31
December 2010 or such later date as may be permitted by the SGX-ST. [Resolution 6]
7. The proposed renewal of the shareholders’ mandate on Interested Persons Transactions
“That approval be and is hereby given, for the purposes of Chapter 9 of the Listing Manual of the SGX-ST, for the Company,
its subsidiaries and associated companies (if any) that are entities at risk (as the term is used in Chapter 9), or any of them, to
enter into any of the transactions falling within the types of Interested Person Transactions set out in the Company’s Addendum
to Shareholders dated 6 April 2010 (being an addendum to the Annual Report of the Company for the financial year ended
31 December 2009) (the “Addendum”) with any party who is of the class of Interested Persons described in the Addendum
provided that such transactions are made at arm’s length, on normal commercial terms and are not prejudicial to the interests of
the Company and its minority Shareholders and in accordance with the review procedures for such Interested Person Transactions
as set out in the Addendum (the “Shareholders’ Mandate”).
That the Shareholders’ Mandate shall, unless revoked or varied by the Company in general meeting, continue in force until the
next annual general meeting of the Company is held or is required by law to be held, whichever is the earlier; and
That the Audit Committee of the Company be and is hereby authorized to take such action as it deems proper in respect of
procedures and/or to modify or implement such procedures as may be necessary to take into consideration any amendment to
Chapter 9 of the Listing Manual of the SGX-ST which may be prescribed by the SGX-ST from time to time; and
That the directors of the Company be and are hereby authorised to complete and do all such acts and things (including executing all
such documents as may be required) as they may consider expedient or necessary or in the interests of the Company to give effect
to the Shareholders’ Mandate and / or this Resolution.” [Resolution 7]
1 3 2

8. The proposed renewal of the Share Purchase Mandate
That:
(a) for the purposes of Sections 76C and 76E of the Companies Act, Chapter 50 (the Companies Act”), the exercise by the
directors of the Company of all the powers of the Company to purchase or otherwise acquire issued and fully paid ordinary
shares in the Company (the “Shares”) not exceeding in aggregate the Prescribed Limit (as hereinafter defined), at such price
or prices as may be determined by the directors of the Company from time to time up to the Maximum Price (as hereinafter
defined), whether by way of:
(i) market purchases (each a “Market Purchase”) on the Singapore Exchange Securities Trading Limited (“SGX-
ST”); and/or
(ii) off-market purchases (each an “Off-Market Purchase”) effected otherwise than on the SGX-ST in accordance
with any equal access scheme(s) as may be determined or formulated by the directors of the Company as they
consider fit, which scheme(s) shall satisfy all the conditions prescribed by the Companies Act,
and otherwise in accordance with all other laws, regulations and listing rules of the SGX-ST as may for the time
being be applicable, be and is hereby authorised and approved generally and unconditionally (the “Share Purchase Mandate”);
(b) unless varied or revoked by the Company in general meeting, the authority conferred on the directors of the Company
pursuant to the Share Purchase Mandate in paragraph (a) of this Resolution may be exercised by the directors of the
Company at any time and from time to time during the period commencing from the date of the passing of this Resolution
and expiring on the earliest of:
(i) the date on which the next annual general meeting of the Company is held; or
(ii) the date by which the next annual general meeting of the Company is required by law to be held; or
(iii) the date on which purchases or acquisitions of Shares are carried out to the full extent mandated;
(c) in this Resolution:
“Prescribed Limit” means, subject to the Companies Act, 10% of the total number of issued Shares of the Company
(excluding any Shares which are held as treasury shares) as at the date of the passing of this Resolution; and
“Maximum Price”, in relation to a Share to be purchased, means an amount (excluding brokerage, stamp duties,
applicable goods and services tax and other related expenses) not exceeding:
(i) in the case of a Market Purchase, 105% of the Average Closing Price (as defined hereinafter); and
(ii) in the case of an Off-Market Purchase, 110% of the Average Closing Price (as defined hereinafter),
where:
“Average Closing Price” means the average of the Closing Market Prices of the Shares over the last five Market
Days on the SGX-ST, on which transactions in the Shares were recorded, immediately preceding the day of the Market
Purchase or, as the case may be, the date of the making of the offer pursuant to the Off-Market Purchase, and deemed
to be adjusted for any corporate action that occurs after such five-Market Day period;
“Closing Market Price” means the last dealt price for a Share transacted through the SGX-ST’s Quest-ST system as
shown in any publication of the SGX-ST or other sources;
NOTICE OF ANNUAL GENERAL MEETING
1 3 3B U I L D I N G S U S T A I N A B L E G R O W T HINDOFOOD AGRI RESOURCES LTD. ANNUAL REPORT 2009

“date of the making of the offer” means the day on which the Company announces its intention to make an offer for
the purchase or acquisition of Shares from shareholders of the Company, stating the purchase price (which shall not be
more than the Maximum Price calculated on the foregoing basis) for each Share and the relevant terms of the equal
access scheme for effecting the Off-Market Purchase; and
“Market Day” means a day on which the SGX-ST is open for trading in securities; and
(d) the directors of the Company be and are hereby authorised to complete and do all such acts and things (including executing
such documents as may be required) as they may consider expedient or necessary to give effect to the transactions
contemplated by this Resolution. [Resolution 8]
9. To transact any other business.
By Order of the Board
MAK MEI YOOK
LEE SIEW JEE, JENNIFER
Company Secretaries
Singapore
Date: 6 April 2010
NOTICE OF ANNUAL GENERAL MEETING
1 3 4

Note:A member is entitled to appoint a proxy to attend and vote in his place. A proxy need not be a Member of the Company. Members
wishing to vote by proxy at the Meeting may use the proxy form enclosed. To be valid, the completed proxy form must be lodged at
the registered office of the Company at 8 Eu Tong Sen Street, #16-96/97 The Central, Singapore 059818 not less than 48 hours before
the time appointed for holding the Meeting.
EXPLANATORY NOTE TO RESOLUTION 3a:Mr Goh Kian Chee is an Independent Director of the Company. He is the Chairman of the Audit Committee and a member of the
Remuneration Committee. He will, upon re-election, continue to serve as the Chairman of the Audit Committee and as a member of
the Remuneration Committee.
EXPLANATORY NOTE TO RESOLUTION 3b:Mr Hendra Susanto is an Independent Director of the Company and is also a member of the Audit Committee and Nominating Committee.
He will, upon re-election, continue to serve as a member of each of the Audit and Nominating Committees.
EXPLANATORY NOTE TO RESOLUTION 3c:Mr Axton Salim is a Non-Executive Director. He will, upon re-election, continue to serve as a member of the Board.
EXPLANATORY NOTE TO RESOLUTION 3d:Mr Suaimi Suriady is an Executive Director and a member of the Executive Committee of the Company. He will, upon re-election,
continue to serve as a member of the Board and of the Executive Committee.
EXPLANATORY NOTES ON SPECIAL BUSINESS TO BE TRANSACTED:The ordinary resolution proposed in item (5) above if passed will empower the directors of the Company from the date of the above
Meeting until the next Annual General Meeting, to issue shares and convertible securities in the Company up to an amount not
exceeding in total 50 per centum of the total number of issued shares in the capital of the Company calculated on the basis set out
in the said resolution. The 50% limit may be increased to 100% for the Company to undertake pro-rata renounceable rights issues of
shares and convertible securities (the “100% renounceable pro-rata rights issue limit”). For issues of shares and convertible securities
other than on a pro rata basis to all Shareholders, the aggregate number of shares and convertible securities to be issued shall not
exceed 20 per centum of the total number of issued shares in the capital of the Company calculated on the basis set out in the said
resolution. This authority will, unless previously revoked or varied at a general meeting, expire at the next Annual General Meeting of
the Company except that the 100% renounceable pro-rata rights issue limit will expire on 31 December 2010 or if extended by the
SGX-ST (the “Extended Date”), the earliest of the conclusion of the next annual general meeting of the Company or the date by which
the next annual general meeting of the Company is required by law to be held or the Extended Date.
Shareholders should note that presently, the controlling shareholders of the Company include First Pacific Company Limited and PT
Indofood Sukses Makmur Tbk, which are listed on the Hong Kong Stock Exchange Limited and the Indonesia Stock Exchange (Bursa
Efek Indonesia), respectively. Prior to any exercise of the authority conferred upon them by the ordinary resolution in item (5) above,
the directors of the Company intend to take into account, inter alia, any approval that may be required from any such controlling
shareholders and/or their respective shareholders and/or from such stock exchanges.
For practical reasons and in order to avoid any violation of the securities legislation applicable in countries other than Singapore, the
offering documents for the issue of shares and Instruments pursuant to such authority may NOT be despatched to Shareholders with
registered addresses outside Singapore as at the applicable books closure date and who have not, by the stipulated period prior to
the book closure date, provided to The Central Depository (Pte) Limited or the Share Registrar, as the case may be, with addresses in
Singapore for the service of notices and documents.
The ordinary resolution proposed in item (6) above if passed will empower the directors of the Company to issue Shares on a non pro-
rata basis at a discount of not more than 20% to the weighted average price of the Shares for trades done on the SGX-ST (calculated
in the manner as may be prescribed by the SGX-ST). Such authority will, unless previously revoked or varied at a general meeting,
expire at the next Annual General Meeting of the Company or on 31 December 2010 (or such later date as may be permitted by the
SGX-ST), whichever is the earlier.
NOTICE OF ANNUAL GENERAL MEETING
1 3 5B U I L D I N G S U S T A I N A B L E G R O W T HINDOFOOD AGRI RESOURCES LTD. ANNUAL REPORT 2009

Shareholders should note that presently, the controlling shareholders of the Company include First Pacific Company Limited and PT
Indofood Sukses Makmur Tbk, which are listed on the Hong Kong Stock Exchange Limited and the Indonesia Stock Exchange (Bursa
Efek Indonesia), respectively. Prior to any exercise of the authority conferred upon them by the ordinary resolution in item (6) above,
the directors of the Company intend to take into account, inter alia, any approval that may be required from any such controlling
shareholders and/or their respective shareholders and/or from such stock exchanges.
The ordinary resolution proposed in item (7) above if passed will empower the directors of the Company to enter into Interested
Person Transactions approved by the Shareholders’ Mandate. Such authority will, unless revoked or varied by the Company in general
meeting, continue in force until the next Annual General Meeting of the Company and Shareholders’ approval will be sought for its
renewal at every Annual General Meeting of the Company.
The ordinary resolution proposed in item (8) above if passed will empower the directors of the Company to make purchases (whether
by way of market purchases or off-market purchases on an equal access scheme) from time to time of up to 10 per centum of the total
number of issued Shares as at the date of the above Meeting at the price up to but not exceeding the Maximum Price (as defined in
the Resolution). The rationale for the Share Purchase Mandate, the source of funds to be used for the Share Purchase Mandate, the
impact of the Share Purchase Mandate on the Company’s financial position, the implications arising as a result of the Share Purchase
Mandate under The Singapore Code on Take-overs and Mergers and on the listing of the Company’s Shares on the SGX-ST, as well as
the number of Shares purchased by the Company in the previous twelve months are set out in the Addendum.
NOTICE OF ANNUAL GENERAL MEETING
1 3 6

1 3 7B U I L D I N G S U S T A I N A B L E G R O W T HINDOFOOD AGRI RESOURCES LTD. ANNUAL REPORT 2009
This page is intentionally left blank.

1 3 8
This page is intentionally left blank.

PROXY FORM
I/We
of
being a *member/members of Indofood Agri Resources Ltd., hereby appoint
Name AddressNRIC/Passport
NumberProportion of
shareholdings (%)
and/or (delete as appropriate)
or failing him/her, the Chairman of the Meeting as my/our proxy/proxies to vote for me/us on my/our behalf at the Annual General
Meeting of the Company to be held on Thursday, 29 April 2010 at 4.00 p.m., and at any adjournment thereof.
The proxy is required to vote as indicated with an "X" on the resolutions set out in the Notice of Meeting and summarised below. If
no specific direction as to voting is given, the proxy/proxies may vote or abstain at his discretion.
No. Resolution For Against
1. To receive and adopt the Directors’ Report and Accounts for the year ended 31 December 2009.
2. To approve the Directors’ Fees of S$285,000 (2008: S$285,000/-) for the year ended 31 December 2009.
3a. To re-elect Mr Goh Kian Chee as Director, who retire under Article 117 of the Company’s Articles of Association.
3b. To re-elect Mr Hendra Susanto as Director, who retire under Article 117 of the Company’s Articles of Association.
3c. To re-elect Mr Axton Salim as Director, who retire under Article 117 of the Company’s Articles of Association.
3d. To re-elect Mr Suaimi Suriady as Director, who retire under Article 117 of the Company’s Articles of Association.
4. To re-appoint Messrs Ernst & Young LLP as the Company’s Auditors and to authorise the Directors to fix their
remuneration.
5. To approve the general mandate for issues of shares.
6. To increase the discount limit for share placements
7. To renew the Shareholders’ Mandate on Interested Person Transactions.
8. To renew the Share Purchase Mandate.
Signed this day of 2010
Signature(s) of Member(s)/Common Seal
INDOFOOD AGRI RESOURCES LTD.(Company Registration No. 200106551G)(Incorporated in the Republic of Singapore)
IMPORTANT
1. For investors who have used their CPF moneys to buy shares of Indofood Agri Resources Ltd.’s shares, this Annual Report is forwarded to them at the request of their CPF Approved Nominees and is sent solely FOR INFORMATION ONLY.
2. This Proxy Form is not valid for use by CPF Investors and shall be ineffective for all intents and purposes if used or purported to be used by them.
3. CPF Investors who wish to vote should contact their CPF Approved Nominees.

Notes:
a) Where a member appoints two proxies, the appointments shall be invalid unless he specifies the proportion (expressed as a
percentage of the whole) of his shareholding to be represented by each proxy.
b) The instrument appointing a proxy shall be in writing under the hand of the appointor or of his attorney duly authorised in
writing or if such appointor is a corporation under its common seal or under the hand of its attorney.
c) An instrument appointing a proxy must be deposited at the registered office of the Company, 8 Eu Tong Sen Street, #16-96/97
The Central, Singapore 059818 not less than 48 hours before the time appointed for holding the meeting.
d) The Company shall be entitled to reject a Proxy Form which is incomplete, improperly completed, illegible or where the true
intentions of the appointor are not ascertainable from the instructions of the appointor specified on the Proxy Form. In addition,
in the case of shares entered in the Depository Register, the Company may reject a Proxy Form if the member, being the
appointor, is not shown to have shares entered against his name in the Depository Register as at 48 hours before the time
appointed for holding the Meeting, as certified by The Central Depository (Pte) Limited to the Company.

This annual report is printed on Enviro Wove, an environmentally friendly paper made up of
100% recycled post-consumer waste. The paper’s production and quality management
system has also been accredited with ISO9001 and ISO14001 certifi cations.

8 Eu Tong Sen Street, #16-96/97 The Central, Singapore 059818Company Reg. No. 200106551G
a subsidiary of:


