Article Bulk De Novo Mitogenome Assembly from Pooled Total DNA Elucidates the Phylogeny of Weevils (Coleoptera: Curculionoidea) Conrad P.D.T. Gillett,* ,1,2 Alex Crampton-Platt, 1,3 Martijn J.T.N. Timmermans, 1,4 Bjarte H. Jordal, 5 Brent C. Emerson, 2,6 and Alfried P. Vogler* ,1,4 1 Department of Life Sciences, Natural History Museum, London, United Kingdom 2 School of Biological Sciences, Centre for Ecology, Evolution and Conservation, University of East Anglia, Norwich, United Kingdom 3 Department of Genetics, Evolution and Environment, University College London, London, United Kingdom 4 Department of Life Sciences, Silwood Park Campus, Imperial College London, Ascot, Berkshire, United Kingdom 5 The Natural History Museum, University Museum of Bergen, Bergen, Norway 6 Island Ecology and Evolution Research Group, Instituto de Productos Naturales y Agrobiologı ´a, La Laguna, Tenerife, Canary Islands, Spain *Corresponding author: E-mail: [email protected], [email protected]. Associate editor: Stephen Wright Abstract Complete mitochondrial genomes have been shown to be reliable markers for phylogeny reconstruction among diverse animal groups. However, the relative difficulty and high cost associated with obtaining de novo full mitogenomes have frequently led to conspicuously low taxon sampling in ensuing studies. Here, we report the successful use of an eco- nomical and accessible method for assembling complete or near-complete mitogenomes through shot-gun next-gener- ation sequencing of a single library made from pooled total DNA extracts of numerous target species. To avoid the use of separate indexed libraries for each specimen, and an associated increase in cost, we incorporate standard polymerase chain reaction-based “bait” sequences to identify the assembled mitogenomes. The method was applied to study the higher level phylogenetic relationships in the weevils (Coleoptera: Curculionoidea), producing 92 newly assembled mitogenomes obtained in a single Illumina MiSeq run. The analysis supported a separate origin of wood-boring behavior by the subfamilies Scolytinae, Platypodinae, and Cossoninae. This finding contradicts morphological hypotheses propos- ing a close relationship between the first two of these but is congruent with previous molecular studies, reinforcing the utility of mitogenomes in phylogeny reconstruction. Our methodology provides a technically simple procedure for generating densely sampled trees from whole mitogenomes and is widely applicable to groups of animals for which bait sequences are the only required prior genome knowledge. Key words: next-generation sequencing, genomics, MiSeq, mitochondria, phylogenetics, wood-boring. Introduction With the advent of high-throughput next-generation se- quencing (NGS) technologies and their ability to generate large amounts of data suitable for genomic assembly, system- atists are increasingly adopting such methods to reconstruct complete mitochondrial genomes (mitogenomes) to infer phylogenies across a diverse range of taxa. Such research has provided compelling insights in studies ranging from the investigation of deep-level metazoan relationships (Osigus et al. 2013) to those within single phyla (e.g., Cnidaria; Kayal et al. 2013), orders (e.g., Primates; Finstermeier et al. 2013), families (e.g., Braconidae wasps; Wei et al. 2010), and genera (e.g., Architeuthis giant squid; Winkelmann et al. 2013). Mitogenomes have an intrinsic suit- ability for phylogenetic analysis due to their unambiguous orthology (Botero-Castro et al. 2013), phylogenetic signal at diverse taxonomic ranks (Bernt et al. 2013), broadly uniform rate of molecular evolution (Papadopoulou et al. 2010), and uniparental inheritance consistent with bifurcating phyloge- netic trees (Curole and Kocher 1999), even if phylogenetic analyses may be confounded by inconsistencies of the coa- lescent history near the species level (Funk and Omland 2003) and by lineage-specific compositional and rate heterogeneity at higher hierarchical levels (Sheffield et al. 2009; Bernt et al. 2013; Cameron 2014). In addition, the fact that mitochondrial DNA (mtDNA) is present in multiple copies per cell, facilitat- ing its amplification and sequencing, has undoubtedly con- tributed to the wide use of mitochondrial markers in phylogeny reconstruction. However, in spite of these advan- tages, complete mitogenome sequencing has been compara- tively labor intensive and costly, resulting in often conspicuously few newly generated mitogenomes per study (e.g., 17 bird mitogenomes in Pacheco et al. [2011], four com- plete Cnidarian mitogenomes in Kayal et al. [2013], and ß The Author 2014. Published by Oxford University Press on behalf of the Society for Molecular Biology and Evolution. This is an Open Access article distributed under the terms of the Creative Commons Attribution License (http://creative commons.org/licenses/by/3.0/), which permits unrestricted reuse, distribution, and reproduction in any medium, provided the original work is properly cited. Open Access Mol. Biol. Evol. 31(8):2223–2237 doi:10.1093/molbev/msu154 Advance Access publication May 6, 2014 2223 at University of East Anglia on July 24, 2014 http://mbe.oxfordjournals.org/ Downloaded from
Transcript
Article
Bulk De Novo Mitogenome Assembly from Pooled Total DNAElucidates the Phylogeny of Weevils (ColeopteraCurculionoidea)Conrad PDT Gillett12 Alex Crampton-Platt13 Martijn JTN Timmermans14 Bjarte H Jordal5
Brent C Emerson26 and Alfried P Vogler14
1Department of Life Sciences Natural History Museum London United Kingdom2School of Biological Sciences Centre for Ecology Evolution and Conservation University of East Anglia Norwich United Kingdom3Department of Genetics Evolution and Environment University College London London United Kingdom4Department of Life Sciences Silwood Park Campus Imperial College London Ascot Berkshire United Kingdom5The Natural History Museum University Museum of Bergen Bergen Norway6Island Ecology and Evolution Research Group Instituto de Productos Naturales y Agrobiologıa La Laguna Tenerife Canary IslandsSpain
Complete mitochondrial genomes have been shown to be reliable markers for phylogeny reconstruction among diverseanimal groups However the relative difficulty and high cost associated with obtaining de novo full mitogenomes havefrequently led to conspicuously low taxon sampling in ensuing studies Here we report the successful use of an eco-nomical and accessible method for assembling complete or near-complete mitogenomes through shot-gun next-gener-ation sequencing of a single library made from pooled total DNA extracts of numerous target species To avoid the use ofseparate indexed libraries for each specimen and an associated increase in cost we incorporate standard polymerasechain reaction-based ldquobaitrdquo sequences to identify the assembled mitogenomes The method was applied to study thehigher level phylogenetic relationships in the weevils (Coleoptera Curculionoidea) producing 92 newly assembledmitogenomes obtained in a single Illumina MiSeq run The analysis supported a separate origin of wood-boring behaviorby the subfamilies Scolytinae Platypodinae and Cossoninae This finding contradicts morphological hypotheses propos-ing a close relationship between the first two of these but is congruent with previous molecular studies reinforcing theutility of mitogenomes in phylogeny reconstruction Our methodology provides a technically simple procedure forgenerating densely sampled trees from whole mitogenomes and is widely applicable to groups of animals for whichbait sequences are the only required prior genome knowledge
Key words next-generation sequencing genomics MiSeq mitochondria phylogenetics wood-boring
IntroductionWith the advent of high-throughput next-generation se-quencing (NGS) technologies and their ability to generatelarge amounts of data suitable for genomic assembly system-atists are increasingly adopting such methods to reconstructcomplete mitochondrial genomes (mitogenomes) to inferphylogenies across a diverse range of taxa Such researchhas provided compelling insights in studies ranging fromthe investigation of deep-level metazoan relationships(Osigus et al 2013) to those within single phyla (egCnidaria Kayal et al 2013) orders (eg PrimatesFinstermeier et al 2013) families (eg Braconidae waspsWei et al 2010) and genera (eg Architeuthis giant squidWinkelmann et al 2013) Mitogenomes have an intrinsic suit-ability for phylogenetic analysis due to their unambiguousorthology (Botero-Castro et al 2013) phylogenetic signal atdiverse taxonomic ranks (Bernt et al 2013) broadly uniform
rate of molecular evolution (Papadopoulou et al 2010) anduniparental inheritance consistent with bifurcating phyloge-netic trees (Curole and Kocher 1999) even if phylogeneticanalyses may be confounded by inconsistencies of the coa-lescent history near the species level (Funk and Omland 2003)and by lineage-specific compositional and rate heterogeneityat higher hierarchical levels (Sheffield et al 2009 Bernt et al2013 Cameron 2014) In addition the fact that mitochondrialDNA (mtDNA) is present in multiple copies per cell facilitat-ing its amplification and sequencing has undoubtedly con-tributed to the wide use of mitochondrial markers inphylogeny reconstruction However in spite of these advan-tages complete mitogenome sequencing has been compara-tively labor intensive and costly resulting in oftenconspicuously few newly generated mitogenomes per study(eg 17 bird mitogenomes in Pacheco et al [2011] four com-plete Cnidarian mitogenomes in Kayal et al [2013] and
The Author 2014 Published by Oxford University Press on behalf of the Society for Molecular Biology and EvolutionThis is an Open Access article distributed under the terms of the Creative Commons Attribution License (httpcreativecommonsorglicensesby30) which permits unrestricted reuse distribution and reproduction in any medium provided theoriginal work is properly cited Open AccessMol Biol Evol 31(8)2223ndash2237 doi101093molbevmsu154 Advance Access publication May 6 2014 2223
at University of E
ast Anglia on July 24 2014
httpmbeoxfordjournalsorg
Dow
nloaded from
1 cockroach and 13 termite mitogenomes in Cameron et al[2012]) Techniques have almost always included either shot-gun sequencing of expensive multiple-indexed libraries(Botero-Castro et al 2013) or a target-enrichment stepsuch as primer walking using standard polymerase chain re-action (PCR) amplification of overlapping fragments (Botero-Castro et al 2013) long-range PCR followed by eithersequencing-primer walking (Roos et al 2007) or shot-gunsequencing (Timmermans et al 2010) and hybrid-captureusing sheared long-range PCR products as ldquobaitsrdquo immobi-lized on magnetic beads (Winkelmann et al 2013) Althoughthese techniques can generate full mitochondrial genomeseach of them has limitations that generally restrain thenumber of taxa or samples that can be incorporated econom-ically within a study
This study aims to address this sampling bottleneck bytesting the possibility of parallel de novo mitogenome assem-bly from a single library of pooled genomic DNA from a bulksample consisting of many species This method has recentlybeen applied to sequencing of environmental samples of ar-thropods from a rainforest canopy (Crampton-Platt ALTimmermans MJTN Gimmel ML Kutty SN Cockerill TDKhen CV Vogler AP unpublished data) Here we apply thistechnique to investigate the higher level phylogeny of an ex-tremely diverse superfamily of insects the weevils(Coleoptera Curculionoidea) Mitogenome sequences inthe Coleoptera have to date been accumulated graduallyfor major lineages including the four suborders mostlyusing Sanger sequencing (Sheffield et al 2008 2009 Ponset al 2010 Song et al 2010 Timmermans et al 2010)These studies consistently encountered difficulties in resolv-ing basal relationships in Coleoptera due to apparent com-positional heterogeneity (Sheffield et al 2009 Song et al 2010)and markedly different rates of molecular evolution (Ponset al 2010) However it is not known whether heterogeneitythat confounds deep-level divergences also affects subcladesfor example at the level of superfamilies and families(Cameron 2014) In addition the effect of different data par-titioning schemes remains to be investigated across taxo-nomic levels (Cameron 2014)
The Curculionoidea are composed of no fewer than 62000described species distributed wherever terrestrial plants grow(Oberprieler et al 2007) The current higher level classificationproposed by Bouchard et al (2011) recognizes nine extantfamilies among which the Curculionidae s str is by far thelargest containing at least 51000 species in 17 subfamilies and292 tribes and subtribes The phylogenetic classification of theweevils was recognized by the eminent beetle taxonomistCrowson (1955) as ldquo probably the largest and most impor-tant problem in the higher classification of Coleoptera rdquoSince that time there have been considerable advances in ourunderstanding of the phylogeny of this group with significantmorphological analyses by Kuschel (1995) and Marvaldi(1997) More recently molecular data have contributed to-ward reconstructing weevil higher level relationships includ-ing studies by McKenna et al (2009) Hundsdoerfer et al(2009) and Jordal et al (2011) which each incorporated be-tween two and six gene markers A recent analysis of 27 weevil
mitogenomes using 12 protein-coding genes (Haran et al2013) supported the paraphyly of Curculionoidea s str ascurrently defined because the subfamily Platypodinae wasrecovered in a distant position in a clade with the familiesDryophthoridae and Brachyceridae that together were sisterto all other Curculionoidea Although undertaken with lim-ited taxon sampling within the Curculionoidea s str (18tribes) this last study also supported the division of thefamily into two large clades One comprising the ldquobroad-nosedrdquo weevils (subfamilies Entiminae Cyclominae andHyperinae) and another containing the remaining subfamilies(except for Platypodinae) In the same study a tRNAAla totRNAArg gene order rearrangement was identified in a clusterof six tRNA genes located between nad3 and nad5 whichappears to be a synapomorphy for the ldquobroad-nosedrdquo weevilsubfamilies further supporting their monophyly This topol-ogy was consistent with that proposed by McKenna et al(2009) who concluded that the initial diversification of wee-vils occurred on gymnosperm plants during the Early to earlyMiddle Jurassic
The Platypodinae is one of several weevil subfamilies thatare specialist wood-borers together with the bark-beetles(Scolytinae) and the subfamily Cossoninae although othersubfamilies also contain xylophagous members (egMolytinae Cryptorhynchinae and Conoderinae) The evolu-tion of wood-boring behavior was investigated in detail byJordal et al (2011) whose analyses incorporated morpholog-ical characters together with molecular data concluding thatboth Scolytinae and Platypodinae are derived lineages withinthe Curculionoidea sensu Oberprieler et al (2007) Howeverseveral important head characters that underpin this relation-ship are likely to be homoplasious and associated with tun-neling habit (Jordal et al 2011) Thompson (1992) identifieddistinct characters of the platypodine eighth abdominal ster-nite and male genitalia which indicated a distant relationshipto Scolytinae and a possible justification for their inclusion ina separate curculionoid family Therefore the question aboutthe polyphyly of wood-boring lineages remains open and thefailure of previous mitogenome studies to recover the platy-podine and scolytine lineages as monophyletic (Haran et al2013) may be due to limited taxon sampling The issue there-fore may only be resolved if Jordal et alrsquos (2011) comprehen-sive taxon sampling of wood-boring lineages could bematched using mitochondrial genomes
Results
Mitogenomic Assembly
Specimens were selected to represent a wide taxonomic cov-erage and included 173 species from six different families ofCurculionoidea and 16 subfamilies and 104 tribes ofCurculionidae They were acquired from various sourcesand in different stages of preservation leading to variableDNA quality as is common in phylogenetic studies that in-volve lineages for which DNA-ready material is difficult toobtain Individual DNA extracts were not characterized ingreat detail but based on bait PCR success they are likelyto differ in the degree of degradation and purity All DNA
2224
Gillett et al doi101093molbevmsu154 MBE at U
niversity of East A
nglia on July 24 2014httpm
beoxfordjournalsorgD
ownloaded from
extracts were included in a single sequencing pool at equi-molar concentrations although for several including aliquotsfrom 31 specimens already extracted for a previous study(Jordal et al 2011) the available amount of DNA fell shortFollowing sequencing with an Illumina MiSeq approximately5 of the reads resembled mitochondrial sequences afterBLAST filtering (from a total of 18341901 paired-end readsobtained in a single MiSeq run) Assemblies constructed withthe Celera and IDBA-UD assemblers resulted in 338 and 336assemblies of more than 1000 bp respectively rising to 361assemblies when combined using Minimus2 Of these 105were more than 10 kb in length and potentially represented(largely) complete mitogenomes The cumulative distributionof the assemblies by sequence length is shown in figure 1whereas figure 2 represents the frequency distribution of as-sembly lengths for each of the Celera IDBA-UD andMinimus2 assemblies The latter produced a shift towardlonger contigs especially for the critical contig length ofmore than 15 kb that corresponds to the full length ofinsect mitogenomes All subsequent analyses were conductedon the Minimus2 assemblies We were able to newly assembleand identify a total of 92 complete or near-complete mito-genomes comprising at least eight genes including 75 (43 ofall pooled samples) containing the full complement of 15genes a further 15 (87 of pooled samples) containingmore than or equal to 12 genes (supplementary table S1Supplementary Material online) and two assemblies contain-ing eight and nine genes respectively Those falling short of afull-gene complement were mainly lacking the ribosomalRNA (rRNA) genes in particular rrnS which was the leastcommon gene present in only 56 of the assemblies whereasnad6 and cytB were present in all 92 assemblies A majority of86 assemblies contained a portion of the noncoding controlregion whose exact length is difficult to ascertain because ofreduced sequence complexity due to the presence of re-peated regions The mean estimated length of the controlregion was 1190 bp whereas in those 33 mitogenomes thatcould be circularized the length varied between
approximately 200ndash2780 bp (supplementary table S1Supplementary Material online)
Identification of Mitogenomic Assemblies Using ldquoBaitrdquoSequences
From the set of 361 partial and complete contigs obtainedwith Minimus2 a total of 163 cox1 (529ndash1560 bp) 154 cytB(218ndash1147 bp) and 162 rrnL (211ndash1340 bp) gene sequenceswere extracted Sequences from each gene were grouped intolibraries and used as queries in a BLAST search against eachcorresponding bait sequence reference library The latter wascomposed of all successful PCR-based sequences from the 173original DNA extractions and included 84 cox1-50 115 cox1-30132 cytB and 107 rrnL sequences (fig 3) All samples used inthe bulk sequencing were represented by at least one bait (36samples) whereas 42 57 and 36 samples were represented bytwo three and four bait sequences respectively Matchingthese bait sequences to the 92 long mitogenomic assemblies16 assemblies showed a match to one bait 30 assembliesmatched two baits 32 assemblies matched three baits and14 assemblies matched all four baits Four of the completeand near-complete mitogenomes contained sequences fromtwo nonoverlapping assemblies that each matched at leastone bait from the same specimen Out of the remaining 81weevil samples there were 37 instances where baits hit a shortcontig that was not included in the collection of near-com-plete or complete mitogenome assemblies but in 44 in-stances the baits did not hit any of the assembled contigsAdditionally one divergent assembly was rejected because itwas found to match Coleoptera other than weevils in thereference database possibly present in the sample due to acontamination Supplementary table S2 SupplementaryMaterial online summarizes the bait-matching identificationresults by bait for each pooled sample with matching contigsgiven by their unique number and with reasons for identifi-cation failures listed Overall the different baits contributedfairly equally to the final identifications with 56 of all cox1-30
baits leading to a successful identification 53 of cytB 50 ofrrnL and 45 of cox1-50 Proportions of total number of baitsbait hits and hits leading to assembly identifications by geneare illustrated in figure 3 A further 50 short contigs (1025ndash6437 bp mean 2472 bp) matched single baits but were notincorporated in the analyses because they contained only amaximum of four complete protein-coding or rRNA geneseach Their inclusion would have considerably increased theamount of missing data in the matrix
The total number of reads making up each of the 92mitogenomes (which were made up of 96 separate contigs)was used to calculate the sequencing depth (fig 4) The ma-jority of sequences showed a 10ndash50 coverage that generallyresulted in contigs of 15ndash20 kb Coverage reached over 200in a few cases but this did not appear to closely correlate withcontig length For example two contigs of high coverage wereless than 5 kb in length and corresponded to two noncontig-uous fragments from the same species (Dryocoetes autogra-phus) linked by multiple baits obtained from a singlespecimen In addition read coverage was not closely
0
5000
10000
15000
20000
25000
Asse
mbl
y le
ngth
(bp)
Cumulave number of assemblies
IDBA-UD
Celera
Minimus2
FIG 1 Cumulative distribution of assembly lengths from the CeleraIDBA-UD and the combined Minimus2-generated assemblies
2225
Phylogeny of Weevils (Coleoptera Curculionoidea) doi101093molbevmsu154 MBE at U
niversity of East A
nglia on July 24 2014httpm
beoxfordjournalsorgD
ownloaded from
correlated with the initial DNA concentration in the sequenc-ing pool Most samples were present at 10 ng yet their cov-erage varied by more than an order of magnitude whereascoverage for samples present at a concentration up to 4lower varied over the same range (fig 4) Twenty-one of the31 nonassayed genomic samples resulted in assemblies ofmore than or equal to eight genes (of which 17 assembliescontained all 15 genes) We found no taxonomic correlate
FIG 2 Frequency distribution of assembly lengths from the Celera IDBA-UD and the combined Minimus2-generated assemblies
0
5000
10000
15000
20000
25000
0 50 100 150 200 250 300
Con
g le
ngth
Coverage
0
25
5
75
10
1 10 100 1000
ng g
DNA
Coverage
A
B
FIG 4 Mean sequencing coverage versus (A) assembly (contig) length(bp) and (B) approximate mass of genomic DNA in the sample pool foridentified mitogenomic assemblies Thirty-one samples that were notassayed for DNA concentration are shown at bottom of graph B
0
20
40
60
80
100
120
140
cox1 5 cox1 3 cytB rrnL
Total baits
Total bait hits
Bait hits leading to idenficaon
FIG 3 Relative proportions by gene of total ldquobaitrdquo sequences availableldquobaitrdquo sequences with matching ldquohitsrdquo to the assembled genes andmatching hits that contributed to a successful mitogenome identifica-tion following a BLAST search
2226
Gillett et al doi101093molbevmsu154 MBE at U
niversity of East A
nglia on July 24 2014httpm
beoxfordjournalsorgD
ownloaded from
with sequencing or assembly failure because representativesof all six pooled families and 13 of the 16 included subfamiliesof Curculionidae resulted in long assemblies (the three miss-ing subfamilies were represented only by a total of five speci-mens) Specimen size is also unlikely to be the dominantlimiting factor in determining sequencing success becausemany of the small-sized (~2ndash5 mm) Scolytinae producedfull assemblies
Phylogenetic Analyses
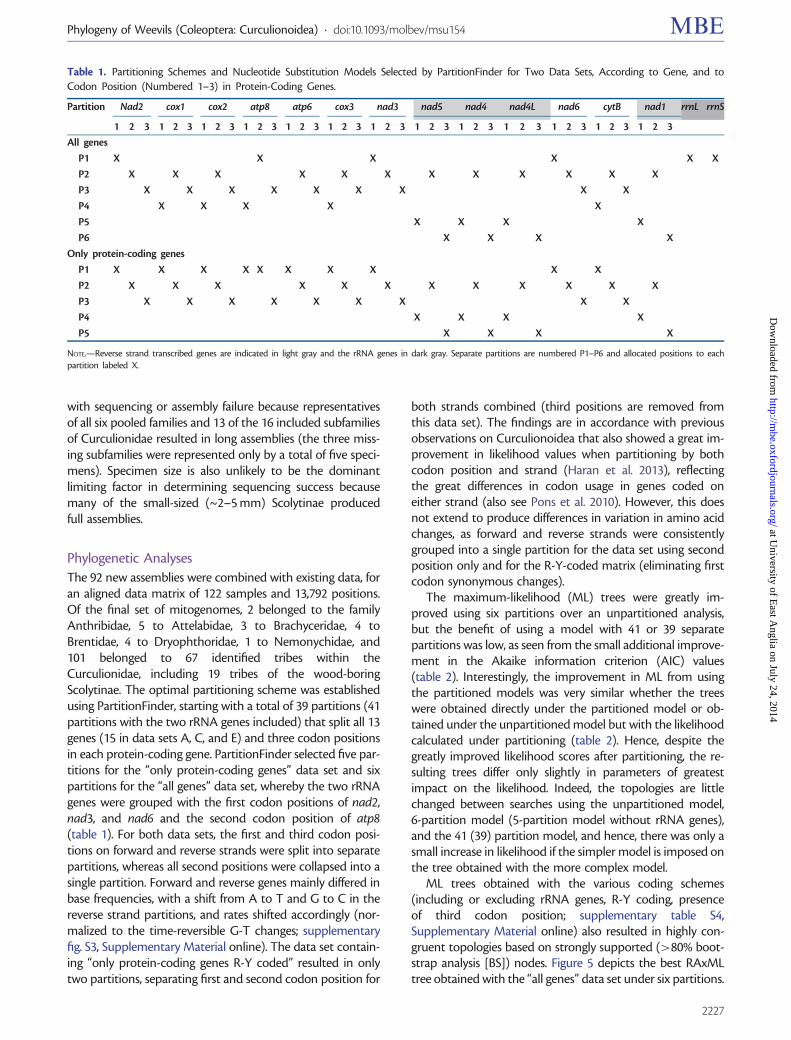
The 92 new assemblies were combined with existing data foran aligned data matrix of 122 samples and 13792 positionsOf the final set of mitogenomes 2 belonged to the familyAnthribidae 5 to Attelabidae 3 to Brachyceridae 4 toBrentidae 4 to Dryophthoridae 1 to Nemonychidae and101 belonged to 67 identified tribes within theCurculionidae including 19 tribes of the wood-boringScolytinae The optimal partitioning scheme was establishedusing PartitionFinder starting with a total of 39 partitions (41partitions with the two rRNA genes included) that split all 13genes (15 in data sets A C and E) and three codon positionsin each protein-coding gene PartitionFinder selected five par-titions for the ldquoonly protein-coding genesrdquo data set and sixpartitions for the ldquoall genesrdquo data set whereby the two rRNAgenes were grouped with the first codon positions of nad2nad3 and nad6 and the second codon position of atp8(table 1) For both data sets the first and third codon posi-tions on forward and reverse strands were split into separatepartitions whereas all second positions were collapsed into asingle partition Forward and reverse genes mainly differed inbase frequencies with a shift from A to T and G to C in thereverse strand partitions and rates shifted accordingly (nor-malized to the time-reversible G-T changes supplementaryfig S3 Supplementary Material online) The data set contain-ing ldquoonly protein-coding genes R-Y codedrdquo resulted in onlytwo partitions separating first and second codon position for
both strands combined (third positions are removed fromthis data set) The findings are in accordance with previousobservations on Curculionoidea that also showed a great im-provement in likelihood values when partitioning by bothcodon position and strand (Haran et al 2013) reflectingthe great differences in codon usage in genes coded oneither strand (also see Pons et al 2010) However this doesnot extend to produce differences in variation in amino acidchanges as forward and reverse strands were consistentlygrouped into a single partition for the data set using secondposition only and for the R-Y-coded matrix (eliminating firstcodon synonymous changes)
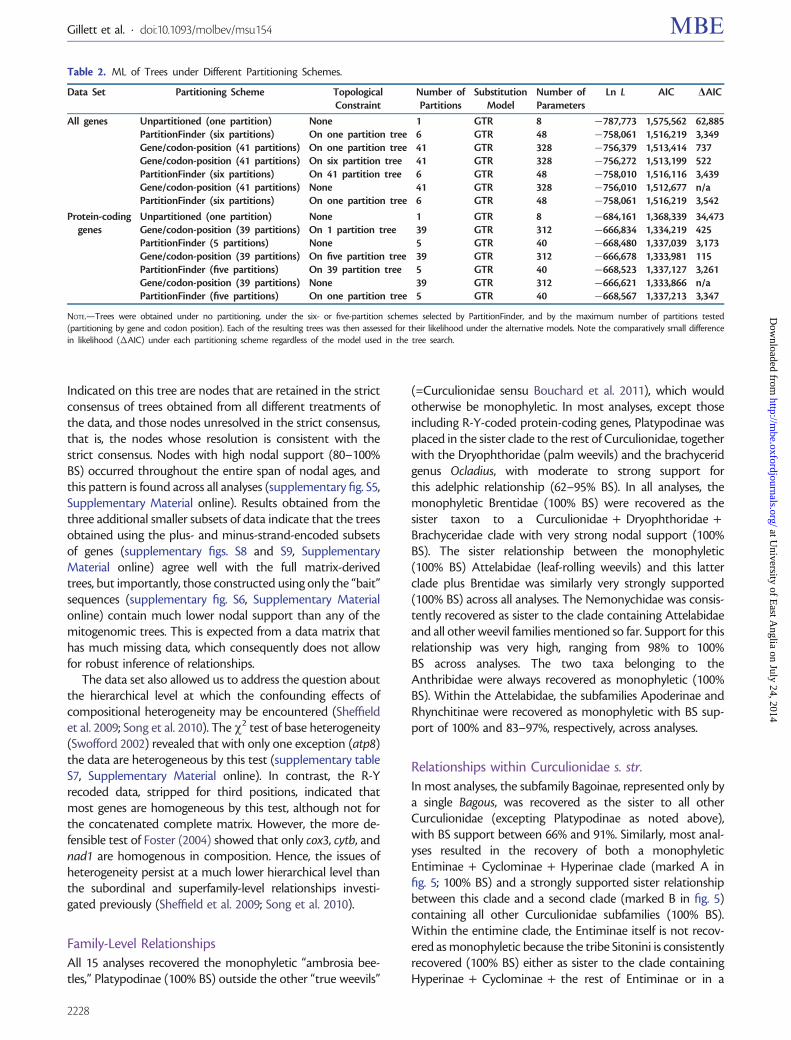
The maximum-likelihood (ML) trees were greatly im-proved using six partitions over an unpartitioned analysisbut the benefit of using a model with 41 or 39 separatepartitions was low as seen from the small additional improve-ment in the Akaike information criterion (AIC) values(table 2) Interestingly the improvement in ML from usingthe partitioned models was very similar whether the treeswere obtained directly under the partitioned model or ob-tained under the unpartitioned model but with the likelihoodcalculated under partitioning (table 2) Hence despite thegreatly improved likelihood scores after partitioning the re-sulting trees differ only slightly in parameters of greatestimpact on the likelihood Indeed the topologies are littlechanged between searches using the unpartitioned model6-partition model (5-partition model without rRNA genes)and the 41 (39) partition model and hence there was only asmall increase in likelihood if the simpler model is imposed onthe tree obtained with the more complex model
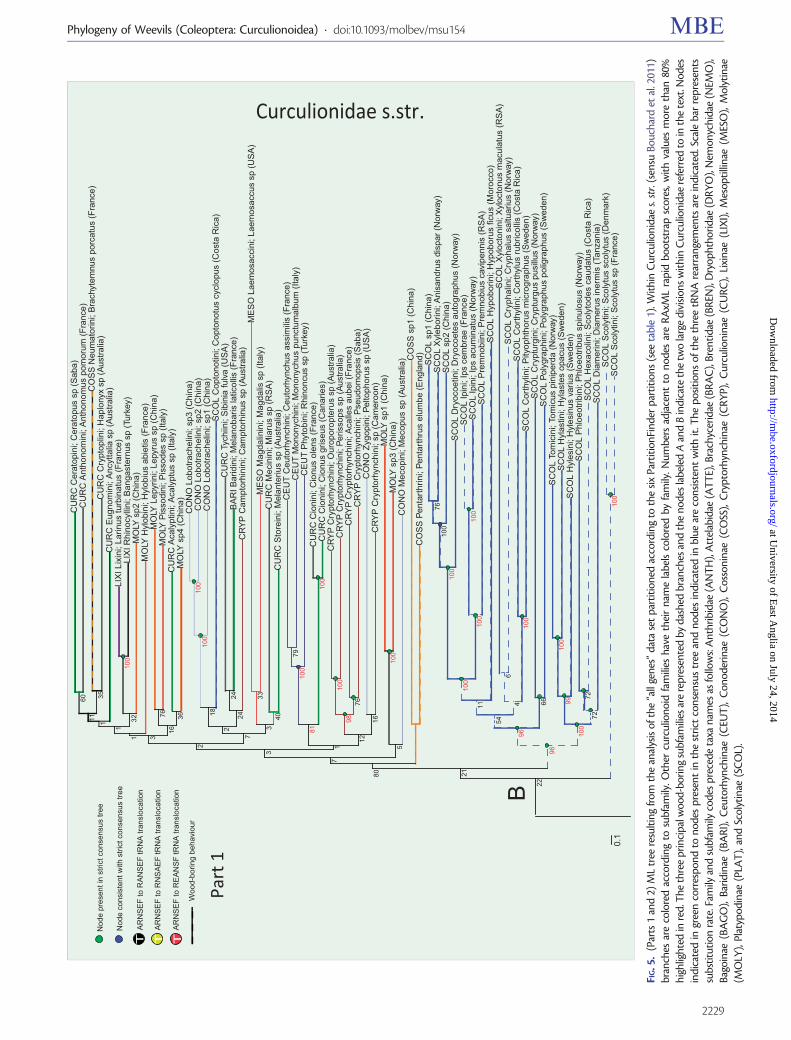
ML trees obtained with the various coding schemes(including or excluding rRNA genes R-Y coding presenceof third codon position supplementary table S4Supplementary Material online) also resulted in highly con-gruent topologies based on strongly supported (gt80 boot-strap analysis [BS]) nodes Figure 5 depicts the best RAxMLtree obtained with the ldquoall genesrdquo data set under six partitions
Table 1 Partitioning Schemes and Nucleotide Substitution Models Selected by PartitionFinder for Two Data Sets According to Gene and toCodon Position (Numbered 1ndash3) in Protein-Coding Genes
NOTEmdashReverse strand transcribed genes are indicated in light gray and the rRNA genes in dark gray Separate partitions are numbered P1ndashP6 and allocated positions to eachpartition labeled X
2227
Phylogeny of Weevils (Coleoptera Curculionoidea) doi101093molbevmsu154 MBE at U
niversity of East A
nglia on July 24 2014httpm
beoxfordjournalsorgD
ownloaded from
Indicated on this tree are nodes that are retained in the strictconsensus of trees obtained from all different treatments ofthe data and those nodes unresolved in the strict consensusthat is the nodes whose resolution is consistent with thestrict consensus Nodes with high nodal support (80ndash100BS) occurred throughout the entire span of nodal ages andthis pattern is found across all analyses (supplementary fig S5Supplementary Material online) Results obtained from thethree additional smaller subsets of data indicate that the treesobtained using the plus- and minus-strand-encoded subsetsof genes (supplementary figs S8 and S9 SupplementaryMaterial online) agree well with the full matrix-derivedtrees but importantly those constructed using only the ldquobaitrdquosequences (supplementary fig S6 Supplementary Materialonline) contain much lower nodal support than any of themitogenomic trees This is expected from a data matrix thathas much missing data which consequently does not allowfor robust inference of relationships
The data set also allowed us to address the question aboutthe hierarchical level at which the confounding effects ofcompositional heterogeneity may be encountered (Sheffieldet al 2009 Song et al 2010) The w2 test of base heterogeneity(Swofford 2002) revealed that with only one exception (atp8)the data are heterogeneous by this test (supplementary tableS7 Supplementary Material online) In contrast the R-Yrecoded data stripped for third positions indicated thatmost genes are homogeneous by this test although not forthe concatenated complete matrix However the more de-fensible test of Foster (2004) showed that only cox3 cytb andnad1 are homogenous in composition Hence the issues ofheterogeneity persist at a much lower hierarchical level thanthe subordinal and superfamily-level relationships investi-gated previously (Sheffield et al 2009 Song et al 2010)
Family-Level Relationships
All 15 analyses recovered the monophyletic ldquoambrosia bee-tlesrdquo Platypodinae (100 BS) outside the other ldquotrue weevilsrdquo
(=Curculionidae sensu Bouchard et al 2011) which wouldotherwise be monophyletic In most analyses except thoseincluding R-Y-coded protein-coding genes Platypodinae wasplaced in the sister clade to the rest of Curculionidae togetherwith the Dryophthoridae (palm weevils) and the brachyceridgenus Ocladius with moderate to strong support forthis adelphic relationship (62ndash95 BS) In all analyses themonophyletic Brentidae (100 BS) were recovered as thesister taxon to a Curculionidae + Dryophthoridae +Brachyceridae clade with very strong nodal support (100BS) The sister relationship between the monophyletic(100 BS) Attelabidae (leaf-rolling weevils) and this latterclade plus Brentidae was similarly very strongly supported(100 BS) across all analyses The Nemonychidae was consis-tently recovered as sister to the clade containing Attelabidaeand all other weevil families mentioned so far Support for thisrelationship was very high ranging from 98 to 100BS across analyses The two taxa belonging to theAnthribidae were always recovered as monophyletic (100BS) Within the Attelabidae the subfamilies Apoderinae andRhynchitinae were recovered as monophyletic with BS sup-port of 100 and 83ndash97 respectively across analyses
Relationships within Curculionidae s str
In most analyses the subfamily Bagoinae represented only bya single Bagous was recovered as the sister to all otherCurculionidae (excepting Platypodinae as noted above)with BS support between 66 and 91 Similarly most anal-yses resulted in the recovery of both a monophyleticEntiminae + Cyclominae + Hyperinae clade (marked A infig 5 100 BS) and a strongly supported sister relationshipbetween this clade and a second clade (marked B in fig 5)containing all other Curculionidae subfamilies (100 BS)Within the entimine clade the Entiminae itself is not recov-ered as monophyletic because the tribe Sitonini is consistentlyrecovered (100 BS) either as sister to the clade containingHyperinae + Cyclominae + the rest of Entiminae or in a
Table 2 ML of Trees under Different Partitioning Schemes
Data Set Partitioning Scheme TopologicalConstraint
Number ofPartitions
SubstitutionModel
Number ofParameters
Ln L AIC AIC
All genes Unpartitioned (one partition) None 1 GTR 8 787773 1575562 62885PartitionFinder (six partitions) On one partition tree 6 GTR 48 758061 1516219 3349Genecodon-position (41 partitions) On one partition tree 41 GTR 328 756379 1513414 737Genecodon-position (41 partitions) On six partition tree 41 GTR 328 756272 1513199 522PartitionFinder (six partitions) On 41 partition tree 6 GTR 48 758010 1516116 3439Genecodon-position (41 partitions) None 41 GTR 328 756010 1512677 naPartitionFinder (six partitions) On one partition tree 6 GTR 48 758061 1516219 3542
Protein-codinggenes
Unpartitioned (one partition) None 1 GTR 8 684161 1368339 34473Genecodon-position (39 partitions) On 1 partition tree 39 GTR 312 666834 1334219 425PartitionFinder (5 partitions) None 5 GTR 40 668480 1337039 3173Genecodon-position (39 partitions) On five partition tree 39 GTR 312 666678 1333981 115PartitionFinder (five partitions) On 39 partition tree 5 GTR 40 668523 1337127 3261Genecodon-position (39 partitions) None 39 GTR 312 666621 1333866 naPartitionFinder (five partitions) On one partition tree 5 GTR 40 668567 1337213 3347
NOTEmdashTrees were obtained under no partitioning under the six- or five-partition schemes selected by PartitionFinder and by the maximum number of partitions tested(partitioning by gene and codon position) Each of the resulting trees was then assessed for their likelihood under the alternative models Note the comparatively small differencein likelihood (AIC) under each partitioning scheme regardless of the model used in the tree search
2228
Gillett et al doi101093molbevmsu154 MBE at U
niversity of East A
nglia on July 24 2014httpm
beoxfordjournalsorgD
ownloaded from
01
SC
OL
Sco
lytin
i S
coly
tus
sp (F
ranc
e)S
CO
L S
coly
tini
Sco
lytu
s sc
olyt
us (D
enm
ark)
SC
OL
Dia
mer
ini
Dia
mer
us in
erm
is (T
anza
nia)
SC
OL
Hex
acol
ini
Sco
lyto
des
caud
atus
(Cos
ta R
ica)
SC
OL
Phl
oeot
ribin
i P
hloe
otrib
us s
pinu
losu
s (N
orw
ay)
SC
OL
Hyl
esin
i H
yles
inus
var
ius
(Sw
eden
)S
CO
L H
ylas
tini
Hyl
aste
s op
acus
(Sw
eden
)S
CO
L To
mic
ini
Tom
icus
pin
iper
da (N
orw
ay)
SC
OL
Poly
grap
hini
Pol
ygra
phus
pol
igra
phus
(Sw
eden
)S
CO
L C
rypt
urgi
ni C
rypt
urgu
s pu
sillu
s (N
orw
ay)
SC
OL
Cor
thyl
ini
Pity
opht
horu
s m
icro
grap
hus
(Sw
eden
)S
CO
L C
orth
ylin
i C
orth
ylus
rubr
icol
lis (C
osta
Ric
a)S
CO
L C
ryph
alin
i C
ryph
alus
sal
tuar
ius
(Nor
way
)S
CO
L X
yloc
toni
ni X
yloc
tonu
s m
acul
atus
(RS
A)
SC
OL
Hyp
obor
ini
Hyp
obor
us fi
cus
(Mor
occo
)S
CO
L P
rem
nobi
ini
Pre
mno
bius
cav
ipen
nis
(RS
A)
SC
OL
Ipin
i Ip
s ac
umin
atus
(Nor
way
)S
CO
L Ip
ini
Ips
cem
brae
(Fra
nce)
SC
OL
Dry
ocoe
tini
Dry
ocoe
tes
auto
grap
hus
(Nor
way
)S
CO
L sp
2 (C
hina
)S
CO
L X
yleb
orin
i A
nisa
ndru
s di
spar
(Nor
way
)S
CO
L sp
1 (C
hina
)C
OS
S P
enta
rthrin
i Pe
ntar
thru
s el
umbe
(Eng
land
)CO
SS
sp1
(Chi
na)
CO
NO
Mec
opin
i M
ecop
us s
p (A
ustra
lia)
MO
LY s
p3 (C
hina
)M
OLY
sp1
(Chi
na)
CR
YP
Cry
ptor
hync
hini
sp
(Cam
eroo
n)C
ON
O Z
ygop
ini
Pelto
phor
us s
p (U
SA
)C
RY
P C
rypt
orhy
nchi
ni P
seud
omop
sis
(Sab
a)C
RY
P C
rypt
orhy
nchi
ni A
calle
s au
bei (
Fran
ce)
CR
YP
Cry
ptor
hync
hini
Per
isso
ps s
p (A
ustra
lia)
CR
YP
Cry
ptor
hync
hini
Our
opor
opte
rus
sp (A
ustra
lia)
CU
RC
Cio
nini
Cio
nus
gris
eus
(Can
arie
s)C
UR
C C
ioni
ni C
ionu
s ol
ens
(Fra
nce)
CE
UT
Phy
tobi
ni R
hino
ncus
sp
(Tur
key)
CE
UT
Mon
onyc
hini
Mon
onyc
hus
punc
tum
albu
m (I
taly
)C
EU
T C
euto
rhyn
chin
i C
euto
rhyn
chus
ass
imili
s (F
ranc
e)C
UR
C S
tore
ini
Mel
ante
rius
sp (A
ustra
lia)
CU
RC
Mec
inin
i M
iaru
s sp
(RS
A)
ME
SO
Mag
dalin
ini
Mag
dalis
sp
(Ital
y)M
ES
O L
aem
osac
cini
Lae
mos
accu
s sp
(US
A)
CR
YP
Cam
ptor
hini
ni C
ampt
orhi
nus
sp (A
ustra
lia)
BA
RI B
arid
ini
Mel
anob
aris
latic
ollis
(Fra
nce)
CU
RC
Tyc
hiin
i S
ibin
ia fu
lva
(US
A)
SC
OL
Cop
tono
tini
Cop
tono
tus
cycl
opus
(Cos
ta R
ica)
CO
NO
Lob
otra
chel
ini
sp1
(Chi
na)
CO
NO
Lob
otra
chel
ini
sp2
(Chi
na)
CO
NO
Lob
otra
chel
ini
sp3
(Chi
na)
MO
LY s
p4 (C
hina
)C
UR
C A
caly
ptin
i A
caly
ptus
sp
(Ital
y)M
OLY
Pis
sodi
ni P
isso
des
sp (I
taly
)M
OLY
Lep
yrin
i Le
pyru
s sp
(Chi
na)
MO
LY H
ylob
ini
Hyl
obiu
s ab
ietis
(Fra
nce)
MO
LY s
p2 (C
hina
)LI
XI R
hino
cylli
ni B
anga
ster
nus
sp (T
urke
y)LI
XI L
ixin
i La
rinus
turb
inat
us (F
ranc
e)C
UR
C E
ugno
min
i A
ncyt
talia
sp
(Aus
tralia
)C
UR
C C
rypt
oplin
i H
aplo
nyx
sp (A
ustra
lia)
CO
SS
Neu
mat
orin
i B
rach
ytem
nus
porc
atus
(Fra
nce)
CU
RC
Ant
hono
min
i A
ntho
nom
us p
omor
um (F
ranc
e)C
UR
C C
erat
opin
i C
erat
opus
sp
(Sab
a)
22
2180
7
3
2
31
1
11160 35
3210
0
1676 36
7
2
1810
010
0
2424
333
40
1
8110
079
100
12
9810
0
76
16
510
0
96
96
54
11
100
100
100
76
100
100
46
100
66
100
9910
0
7272
100
Curculionidae sstr
B
TA
RN
SE
F to
RA
NS
EF
tRN
A tr
ansl
ocat
ion
Nod
e pr
esen
t in
stric
t con
sens
us tr
ee
Nod
e co
nsis
tent
with
stri
ct c
onse
nsus
tree
Woo
d-bo
ring
beha
viou
r
AR
NS
EF
to R
NS
AE
F tR
NA
tran
sloc
atio
n
AR
NS
EF
to R
EA
NS
F tR
NA
tran
sloc
atio
n
T T
Part
1
FIG
5
(Par
ts1
and
2)M
Ltr
eere
sult
ing
from
the
anal
ysis
ofth
eldquoa
llge
nesrdquo
data
set
par
titi
oned
acco
rdin
gto
the
six
Part
itio
nFi
nde
rp
arti
tion
s(s
eeta
ble
1)W
ithi
nC
urcu
lion
idae
sst
r(s
ensu
Bouc
hard
etal
201
1)br
anch
esar
eco
lore
dac
cord
ing
tosu
bfam
ilyO
ther
curc
ulio
noi
dfa
mili
esha
veth
eir
nam
ela
bels
colo
red
byfa
mily
Num
bers
adja
cen
tto
nod
esar
eR
AxM
Lra
pid
boot
stra
psc
ores
wit
hva
lues
mor
eth
an80
hi
ghlig
hted
inre
dT
heth
ree
pri
nci
pal
woo
d-bo
rin
gsu
bfam
ilies
are
rep
rese
nte
dby
dash
edbr
anch
esan
dth
en
odes
labe
led
Aan
dB
indi
cate
the
two
larg
edi
visi
ons
wit
hin
Cur
culio
nid
aere
ferr
edto
inth
ete
xtN
odes
indi
cate
din
gree
nco
rres
pon
dto
nod
esp
rese
nt
inth
est
rict
con
sen
sus
tree
and
nod
esin
dica
ted
inbl
uear
eco
nsi
sten
tw
ith
itT
hep
osit
ion
sof
the
thre
etR
NA
rear
ran
gem
ents
are
indi
cate
dSc
ale
bar
rep
rese
nts
subs
titu
tion
rate
Fam
ilyan
dsu
bfam
ilyco
des
pre
cede
taxa
nam
esas
follo
ws
An
thri
bida
e(A
NT
H)
Att
elab
idae
(AT
TE)
Bra
chyc
erid
ae(B
RA
C)
Bren
tida
e(B
REN
)D
ryop
htho
ridae
(DR
YO
)N
emon
ychi
dae
(NEM
O)
Bago
inae
(BA
GO
)Ba
ridi
nae
(BA
RI)
C
euto
rhyn
chin
ae(C
EUT
)C
onod
erin
ae(C
ON
O)
Cos
son
inae
(CO
SS)
Cry
pto
rhyn
chin
ae(C
RY
P)
Cur
culio
nin
ae(C
UR
C)
Lixi
nae
(LIX
I)
Mes
opti
llin
ae(M
ESO
)M
olyt
inae
(MO
LY)
Plat
ypod
inae
(PLA
T)
and
Scol
ytin
ae(S
CO
L)
2229
Phylogeny of Weevils (Coleoptera Curculionoidea) doi101093molbevmsu154 MBE at U
niversity of East A
nglia on July 24 2014httpm
beoxfordjournalsorgD
ownloaded from
CE
RA
MB
YC
IDA
E
Ano
plop
hora
gla
brip
enni
sC
HR
YS
OM
ELI
DA
E
Crio
ceris
duo
deci
mpu
ncta
taA
NTH
Ant
hrib
inae
Pla
tyst
omos
alb
inus
(Fra
nce)
AN
TH s
p1 (C
hina
)N
EM
O C
imbe
ridin
ae D
oydi
rhyn
chus
aus
triac
us (F
ranc
e)AT
TE R
hync
hitin
ae B
yctis
cus
popu
li (F
ranc
e)AT
TE R
hync
hitin
ae D
epor
aus
betu
lae
(Eng
land
)AT
TE A
ttela
bina
e s
p (C
hina
)AT
TE A
pode
rinae
sp
(Chi
na)
ATTE
Apo
derin
ae A
pode
rus
cory
li (F
ranc
e)B
RE
N s
p1 (C
hina
)B
RE
N A
pion
inae
Rho
pala
pion
long
irost
re (F
ranc
e)B
RE
N N
anop
hyin
ae N
anop
hyes
sp
(Tur
key)
BR
EN
Nan
ophy
inae
Nan
ophy
es m
arm
orat
us (F
ranc
e)B
RAC
Erir
hirin
ini
Ech
inoc
nem
is s
p (A
ustra
lia)
BR
AC B
rach
ycer
inae
Bra
chyc
erus
mur
icat
us (F
ranc
e)B
RAC
Ocl
adiin
ae O
clad
ius
sp (R
SA
)D
RYO
Rhy
ncho
phor
inae
Cos
mop
olite
s so
rdid
us (C
hina
)D
RYO
sp1
(Chi
na)
DR
YO R
hync
hoph
orin
ae S
itoph
ilus
gran
ariu
s (F
ranc
e)D
RYO
Orth
ogna
thin
ae R
hino
stom
us b
arbi
rost
ris (B
eliz
e)P
LAT
Tess
eroc
erin
i D
iapu
s un
ispi
neus
(PN
G)
PLA
T P
laty
podi
ni P
laty
pus
cylin
dric
us (F
ranc
e)B
AGO
Bag
oina
e B
agou
s sp
(Eng
land
)H
YP
E H
yper
ini
Hyp
era
post
ica
(Fra
nce)
EN
TI S
itoni
ni S
itona
line
atus
(Fra
nce)
CY
CL
Dic
hotra
chel
ini
Dic
hotra
chel
us m
anue
li (It
aly)
CY
CL
Rhy
thirr
inin
i R
hyth
irrin
us s
p (R
SA
)C
YC
L R
hyth
irrin
ini
Cis
olea
sp
(Aus
tralia
)C
YC
L A
terp
ini
Rha
dino
som
us s
p (A
ustra
lia)
CY
CL
Ate
rpin
i Pe
lolo
rhin
us s
p (A
ustra
lia)
EN
TI T
ropi
phor
ini
Lept
opiu
s sp
(Aus
tralia
)E
NTI
Tro
piph
orin
i C
atas
arcu
s sp
(Aus
tralia
)E
NTI
Nau
pact
ini
Lito
styl
us p
uden
s (S
aba)
EN
TI N
aupa
ctin
i N
aupa
ctus
xan
thog
raph
us (R
SA
)E
NTI
Oph
ryas
tini
Oph
ryas
tes
sp (U
SA
)E
NTI
Geo
nem
ini
Lach
nopu
s cu
rvip
es (S
aba)
EN
TI G
eone
min
i B
aryn
otus
obs
curu
s (F
ranc
e)E
NTI
Psa
llidi
ini
Psa
llidi
um s
p (T
urke
y)E
NTI
Cra
topi
ni C
rato
pus
sum
ptuo
sus
(La
Reu
nion
)E
NTI
Tan
ymec
ini
Geo
tragu
s sp
(Chi
na)
EN
TI s
p4 (C
hina
)E
NTI
sp2
(Chi
na)
EN
TI s
p1 (C
hina
)E
NTI
Oos
omin
i B
aria
nus
sp (J
uan
de N
ova)
EN
TI s
p3 (C
hina
)E
NTI
Bra
chyd
erin
i S
troph
osom
a sp
(Eng
land
)E
NTI
Bra
chyd
erin
i S
troph
osom
a m
elan
ogra
mm
um (F
ranc
e)E
NTI
Bra
chyd
erin
i B
rach
yder
es ru
gatu
s (C
anar
ies)
EN
TI s
p5 (C
hina
)E
NTI
Lap
aroc
erin
i La
paro
ceru
s fre
yi (C
anar
ies)
EN
TI P
olyd
rusi
ni P
olyd
rusu
s m
argi
natu
s (F
ranc
e)E
NTI
Pol
ydru
sini
Lio
phlo
eus
tess
ulat
us (F
ranc
e)E
NTI
Tra
chyp
hloe
ini
Trac
hyph
loeu
s sp
(Eng
land
)E
NTI
Myo
rhin
ini
sp (R
SA
)E
NTI
Tro
piph
orin
i Tr
opip
horu
s be
rtolin
i (Ita
ly)
EN
TI O
tiorh
ynch
ini
Otio
rhyn
chus
rugo
sost
riatu
s (F
ranc
e)E
NTI
Otio
rhyn
chin
i O
tiorh
ynch
us s
p (E
ngla
nd)
EN
TI O
tiorh
ynch
ini
Otio
rhyn
chus
glo
bulu
s (It
aly)
28
99
100
100
6
4
90
70
100
100
44
4978
28
1810
010
050
36 995
54
40
2410
082
73
100
62
39
613
100
6 21
9610
0
95
4147
55
53
45
34
4210
010
0
100
100
5
100
9310
0
100
100
100
97
100
640
1
Curculionidae sstr
A
Other families
PLA
T P
laty
podi
ni P
laty
pus
sp (E
ngla
nd)
T
TT T
Part
2
TA
RN
SE
F to
RA
NS
EF
tRN
A tr
ansl
ocat
ion
Nod
e pr
esen
t in
stric
t con
sens
us tr
ee
Nod
e co
nsis
tent
with
stri
ct c
onse
nsus
tree
Woo
d-bo
ring
beha
viou
r
AR
NS
EF
to R
NS
AE
F tR
NA
tran
sloc
atio
n
AR
NS
EF
to R
EA
NS
F tR
NA
tran
sloc
atio
n
T T
FIG
5
Con
tin
ued
2230
Gillett et al doi101093molbevmsu154 MBE at U
niversity of East A
nglia on July 24 2014httpm
beoxfordjournalsorgD
ownloaded from
sister clade also containing the Hyperinae (with generallyweak nodal support for this relationship) Three entiminetribes are consistently recovered as monophyletic withstrong nodal support the Otiorhynchini (100 BS)Brachyderini (100 BS) and the Naupactini (100 BS) Thetribe Tropiphorini is apparently paraphyletic because a well-supported clade (95 BS) containing two monophyleticAustralian members (Catasarcus and Leptopius) is itselfsister to the Naupactini with strong support (96 BS) andis only distantly related to the other Tropiphorini species inthe data set (Tropiphorus) which is sister to theOtiorhynchini with strong nodal support (100 BS) AllEntiminae (except Sitona) are marked by an ARNSEF toRANSEF rearrangement in the tRNA cluster discovered inearlier studies (Song et al 2010 Haran et al 2013) and cor-roborated here (fig 5) One taxon Dichotrachelus manueliclassified in Cyclominae by Alonso-Zarazaga and Lyal (1999)also possesses this same rearrangement whereas the remain-ing Cyclominae taxa possess the common gene orderARNSEF Sitona and Hypera were characterized by uniqueRNSAEF and REANSF gene orders respectively first observedby Haran et al (2013) and hypothesized to constitute aninitial step in the evolution of the derived gene order of theEntiminae Here Hypera + Sitona form a clade that is sisterto all others in clade A whereas the Cyclominae (minusDichotrachelus) not represented in Haran et al (2013) andexhibiting the ancestral gene order occupy the next node assister to the remaining Entiminae characterized by the derivedgene order This demonstrates that the gene order changes inHypera and Sitona are independent of those in Entiminae
Within the second main curculionid clade the scolytinetaxon Coptonotus (Coptonotini) is never recovered togetherwith the bulk of the scolytines which except for Scolytini(monophyletic with 100 BS) are consistently recovered ina clade with moderate to high support values of 66ndash100The scolytine tribes Corthylini and Ipini are always recoveredas monophyletic (100 BS support) within this The followinghigher level taxa from the second main Curculionidae cladeare recovered as monophyletic across all analyses (BS sup-ports follow taxon name) Ceutorhynchinae (100) Lixinae(100) Conoderinae Lobotrachelini (100) andCurculioninae Cionini (100) The Cryptorhynchini appearsto be paraphyletic owing to the presence of a sample(Cryptorhynchini sp from Cameroon) falling outside thewell-supported clade (98 BS) comprising all four othergenera analyzed
Discussion
Contig Formation from Pooled Total DNASequencing
Our results provide a clear demonstration of economic effi-cient and reliable sequencing assembly and identification oflarge numbers of mitogenomes from a pool of total DNA ofnumerous samples without any enrichment or PCR amplifi-cation We obtained a complete or near-complete set of pro-tein-coding genes for well over 50 of all samples attemptedOther recent papers attempting to generate full
mitochondrial genomes from total DNA either generated aseparate library for each taxon (Williams et al 2014) or pooledonly a small number of distantly related taxa (Rubinstein et al2013) We have been able to employ the resulting sequencedata to reconstruct a higher level phylogeny of the superfam-ily Curculionoidea that is highly congruent with recent mo-lecular phylogenies and provides additional evidence for theconvergent evolution of specialized wood-boring behaviorand morphology in weevils The method has been exploredpreviously for the analysis of bulk insect samples from a forestcanopy (Crampton-Platt AL Timmermans MJTN GimmelML Kutty SN Cockerill TD Khen CV Vogler AP unpublisheddata) applied to nearly 500 individuals from more than 200species They found that the assembly of mitogenomes frombulk samples is hampered by substantial differences in DNAconcentration for species in the pool due to variation in bothbody size and number of specimens representing a species Inaddition intraspecific variation was found to cause difficultieswith assembly due to polymorphisms mirroring the well-known problem with genome assembly from heterozygotes(eg Langley et al 2011) The design of this study was ex-pected to avoid these problems by normalizing the DNAconcentration in the pool and by selecting a single individualper species However we find that there is no close correlationof sequencing depth and assembly success (fig 4) in accor-dance with Crampton-Platt AL Timmermans MJTN GimmelML Kutty SN Cockerill TD Khen CV and Vogler AP (unpub-lished data) Our study excludes the presence of intraspecificvariation but indicates that there is a sequencing depth atwhich assemblers no longer operate optimally possibly due tothe larger numbers of individual sequencing errors contrib-uted by overlapping reads
A concern of pooled assemblies is the formation of chi-meras by the miss-assembly of different mitogenomes Thepotential for this is expected to increase if closely relatedsamples that may not differ in conserved regions of the mito-genomes are included in the pool The prevalence of chimeraswas tested using 77 taxa for which multiple baits were avail-able In many cases these tests involved both the cytb or rrnLand the two fragments of the cox1 gene that map to distantpositions in the mitogenome We did not observe a singlecase of chimera formation In addition the tree topology gaveno reason to suggest chimeras because of the monophyly ofthe smaller families of Curculionoidea whereas chimera for-mation would also have produced great differences in thelength of terminal branches which were not observed
Phylogenetic Analysis from Densely SampledMitogenomes
Together with existing mitogenome sequences a total of 120terminals were included in the phylogenetic analysis As mito-genome data sets increase with the numbers of taxa neededfor dense sampling this may produce problems with treesearches and model choice Specifically the most complexmodels such as the amino acid-based CAT model used byTimmermans et al (2010) that was required for resolving thedeep-level relationships within the Coleoptera are not
2231
Phylogeny of Weevils (Coleoptera Curculionoidea) doi101093molbevmsu154 MBE at U
niversity of East A
nglia on July 24 2014httpm
beoxfordjournalsorgD
ownloaded from
practical when the number of taxa becomes larger This raisesthe question of what is the value of using complex modelsHaran et al (2013) have shown that likelihood trees of weevilscan be substantially improved under model partitioning ac-cording to 1) codon position and 2) forward versus reversestrand the latter presumably due to the well-established dif-ferences in codon usage on either strand We conducted aformal analysis to test whether this partitioning scheme bystrand and codon captures the most important aspects of thenucleotide variation using the PartitionFinder software start-ing from 41 potential partitions of each codon position withineach gene This could be reduced to the codon positions forall genes on either strands similar to Haran et al (2013) butmaintaining a single partition for the second codon positionon either strand while adding a separate partition for therRNA genes not included in that study The use of these sixpartitions over the full set of 41 partitions led only to a smallreduction in likelihood whereas the unpartitioned modelswere substantially worse (table 2)
A general difficulty for comparing models is that compar-isons are only possible for a single topology but searchesunder different partitions favor different topologies Wetherefore used the optimal trees obtained under no partition-ing and the 6- and 41-partition schemes to assess likelihoodsof the alternative partitioning schemes on those three topol-ogies The likelihoods on all trees for the three models werealmost identical (table 2) indicating that tree topology is nota major deciding factor for the best model Taken at facevalue the 41 partition wins out over the 6 partition schemein all three analyses but the likelihood gain is minor As like-lihood values become very large with the use of numerouswhole mitogenomes AIC values may not be an appropriateapproach to avoid overparameterization unless they are nor-malized for the total likelihood values (Castoe et al 2005) Wetherefore believe the 6-partition scheme is fully adequate Inaddition the practicalities of tree searches on increasinglylarge data sets from full mitogenomes as generated withthe proposed methodology also strongly argue for parameterreduction
Trees obtained from analysis of full mitogenomes were themost robust but those obtained using the subsets of protein-coding genes resulted in good topological approximations tothem (supplementary figs S8 and S9 Supplementary Materialonline) suggesting that phylogenetic signal is largely uniformacross genes and is strengthened with additional data Thiscan be seen by the recovery of certain monophyletic groupssuch as the Cyclominae only possible with the full matrixHowever trees constructed from the ldquobaitrdquo sequences alonewere the least robust due to both the reduced informationcontent (comparable to the reverse strand genes) and toconsiderable missing data
Implications for the Systematics of Weevils
The close relationship linking Platypodinae withDryophthoridae as sister to the Curculionidae s str hasbeen demonstrated multiple times (Marvaldi 1997McKenna et al 2009 Haran et al 2013) and indicates that
the family Curculionidae as presently classified is paraphy-letic The simplified classification system proposed byOberprieler et al (2007) recognizing a broaderCurculionidae also containing the presently definedBrachyceridae and Dryophthoridae as respective subfamilies(sensu Alonso-Zarazaga and Lyal 1999) would be consistentwith our family-level results Our results strongly support therelationships among the curculionoid families at the base ofthe tree which are consistent with most previous molecularanalyses with the exception of the placement ofNemonychidae This family has previously been suggestedto be split off at the most basal node (eg McKenna et al2009) as opposed to Anthribidae in our results but our sam-pling lacks two of the ldquoprimitiverdquo weevil families (Belidae andCaridae) prohibiting a definitive conclusion Our resultsare also consistent with the previously suggested hypothe-sis that the Brentidae are the sister family to all the ldquotrueweevilsrdquo Curculionidae if we include Brachyceridae andDryophthoridae in the latter
A previously described deep split within the true weevilswas confirmed by our substantially increased samplingOne strongly supported clade contains theEntiminae + Cyclominae + Hyperinae and represents themonophyletic and diverse ldquobroad-nosedrdquo weevils so namedbecause of their relatively short and blunt rostrumsRearrangements within the cluster of six tRNA genes are re-stricted to this clade even with our increased taxon coveragefurther supporting its distinctiveness The cyclomine genusDichotrachelus containing the same RANSEF rearrangementas all other Entiminae (except Sitona) in our analysis has beentreated as belonging to the Entiminae by some authors(Meregalli and Osella 2007) on morphological groundsCombined with the low nodal support for its inclusion in amonophyletic Cyclominae (lt50 BS) our tRNA rearrange-ment data are consistent with this opinion The second cladecontaining all other curculionoid subfamilies with the excep-tion of Bagoinae which is placed outside of the two mainclades is much less satisfactorily resolved with only two of itsconstituent subfamilies (Lixinae and Ceutorhynchinae) beingmonophyletic It contains a number of very large subfamiliesincluding the Curculioninae Molytinae BaridinaeCryptorhynchinae and Conoderinae whose relationshipsremain obscure due to a lack of strong nodal supportAlthough the recovery of two tribes within this group beingmonophyletic (Lobotrachelini and Cionini) is encouraging tofurther investigate the confusing topology of this clade sig-nificantly more representative taxon sampling will be re-quired Indeed limitations in taxon sampling are often citedas potentially limiting factors in higher level phylogenetics(Franz and Engel 2010) and this is certainly an importantconsideration in such a large group as the Curculionoidea
An interesting finding is that strong nodal support spansthe full depth of the tree and differing taxonomic ranks (fam-ilies subfamilies and tribes supplementary fig S5Supplementary Material online) This pattern was seen inanalyses of all data sets and under all partitioning modelsA potential criticism of mitochondrial sequence data is thatdue to accelerated evolutionary rates saturation of sites may
2232
Gillett et al doi101093molbevmsu154 MBE at U
niversity of East A
nglia on July 24 2014httpm
beoxfordjournalsorgD
ownloaded from
obscure or distort phylogenetic signal at deeper nodes(Talavera and Vila 2011) It is clear from our data that atleast at the intrasuperfamily level in weevils this is not nec-essarily the case with phylogenetic signal being evenly distrib-uted across the estimated 170 My diversification history ofthe weevils (McKenna et al 2009)
Evolution of Wood-Boring Behavior
The wood-boring weevil subfamilies are highly adapted toexcavate galleries either subcortically or in woody tissueand feed on ligneous matter directly or cultivate symbioticfungi in the tunnels as a food source and for this reasonmany are widespread pests of forestry (Oberprieler et al2007) The taxon density of the current analysis nearlymatched the extensive sampling of the wood-boring groupsby Jordal et al (2011) a study that is the basis for suggestingtheir close affinity However in contrast to Jordal et al (2011)our results support the conclusions of Haran et al (2013) andMcKenna et al (2009) indicating that wood-boring lineagesare clearly not monophyletic with Platypodinae consistentlyretrieved as closely related to the Dryophthoridae (andBrachyceridae) in a clade sister to all other Curculionidaesensu Bouchard et al (2011) Although our analyses recoveredneither the Scolytinae nor the Cossoninae as monophyleticand they were never recovered as sister taxa or nested withinthe same clade we cannot confidently conclude as to therelationship between them because only a series of weaklysupported nodes separate the cossonine taxa and Coptonotusfrom the rest of the Scolytinae The latter genus is interestingfor consistently not being recovered in our analyses within thegenerally well-supported Scolytinae clade (exceptingScolytini) Based on morphological characters Coptonotushas been considered to be a transitional taxon betweenPlatypodinae and other Curculionidae (Jordal et al 2011) oralternatively as an intermediate form between Cossoninaeand Scolytinae (Thompson 1992) while also containing mor-phological characters linking it with Cossoninae Thompson(1992) has suggested a close relationship betweenCoptonotini and the scolytine tribe Hylastini based on struc-tures of the aedeagus However our results argue against thisbecause the Hylastini sample (Hylastes opacus) was retrievedwith strong support as the sister of Tomicini and this cladeitself was strongly supported as sister to the Hylesini withinthe main Scolytinae clade
ConclusionsWe have demonstrated the relative ease of efficiently andeconomically obtaining a large number of mitogenomeDNA sequences from a pooled mixture of DNA extractswithout the need for enrichment or species-specific taggingprior to genome pooling Mitogenome sequences are confi-dently identified to specimen with a limited amount of priormtDNA sequence data for each sample and exhibit no errorwith regard to these bait sequences Our mtDNA genomedata yield phylogenetic relationships that are highly congru-ent with prior expectations and provide phylogenetic signalwith robustly supported nodes across a broad range of lineage
divergence times and taxon diversity from family level togeneric level which are consistent across different data par-titioning schemes
It is evident that the efficiency of our approach will be afunction of the relative concentration of mitochondrial tonuclear DNA within a focal group The average coleopterangenome size is estimated to be approximately 065 Gb plusmn 005(httpwwwgenomesizecom last accessed May 10 2014)Under the assumption that the copy number of mtDNAgenomes does not differ substantially across organisms ourapproach should be of broad utility within insect phyloge-netics where mean nuclear genome size is estimated to be122 Gb plusmn 005 However it may be less efficient for taxa withlarger average nuclear genome sizes (eg crustaceans meannuclear genome size = ~445 Gb plusmn 045) A further consider-ation for the implementation of our approach is taxon sam-pling and the mitogenomic assembly pipeline Our samplingfor the higher level taxonomic relationships within theCurculionoidea provides little challenge for the pipeline asmtDNA genomes sampled from different genera exhibit highDNA sequence divergence Genome divergence facilitatesgenome reassembly from a mixed pool of genome fragmentsand the pipeline efficiency will eventually be compromised asmtDNA genome relatedness increases Our data suggest thatthis limit lies somewhere below an uncorrected divergence of10 for cox1 and cytB that characterizes the two species ofCionus (C olens and C griseus) included in our sampling Toascertain genome relatedness thresholds for the reassemblypipeline simulation analyses can be employed However it isimportant to point out that as NGS technology and readlengths improve relatedness thresholds will also becomemore favorable
Materials and Methods
Taxon Sampling DNA Extraction and Quantification
Throughout this study the most recent higher level classifi-cation of Curculionoidea proposed by Bouchard et al (2011)is adhered to whereas the assignment of genera to higher taxafollows the catalog of Alonso-Zarazaga and Lyal (1999) DNAwas extracted from each ethanol-preserved specimen individ-ually using DNeasy blood and tissue extraction kits (Qiagen)The concentration of double-stranded DNA (dsDNA) in mostextractions (139 of 173) was assayed on a Qubit fluorometerusing a dsDNA high-sensitivity kit (Invitrogen)
ldquoBaitrdquo Sequence PCR
Standard PCR reactions to amplify four different fragments ofmtDNA (cox1 50 ldquobarcode regionrdquo cox1 30 region rrnL andcytb) were undertaken for each of the 173 samples Primersand reaction conditions are listed in supplementary table S10Supplementary Material online PCR products were firstcleaned with a size-exclusion filter (Merck Millipore) andthen Sanger sequenced the resulting bait sequences weresubsequently employed to identify mitogenomic assembliesin the manner detailed below
2233
Phylogeny of Weevils (Coleoptera Curculionoidea) doi101093molbevmsu154 MBE at U
niversity of East A
nglia on July 24 2014httpm
beoxfordjournalsorgD
ownloaded from
Sample Pooling and Sequencing
To minimize the effects of DNA concentration on assemblysuccess across all samples approximately equimolar quanti-ties of genomic DNA from each of the samples were pooledaiming for 10 ng of dsDNA per sample resulting in a DNApool of approximately 15mg This calculation did not con-sider 31 samples which were not quantified because of limitedsample volume For each of these a fixed volume of either 5 or8ml was added to the pool Based on the findings ofCrampton-Platt AL Timmermans MJTN Gimmel ML KuttySN Cockerill TD Khen CV and Vogler AP (unpublished data)where longer insert size was found to result in longer mito-chondrial contigs a TruSeq library was prepared from thepool aiming for an insert size of 800 bp Quantification ofthe final library indicated that the average insert size was790 bp and this was sequenced on a single Illumina MiSeqrun (500-cycle 250 bp paired-end reads version 2 reagent kit)
Mitogenomic Assembly Pipeline
The bioinformatics assembly pipeline used in this study wasdeveloped by Crampton-Platt AL Timmermans MJTNGimmel ML Kutty SN Cockerill TD Khen CV and VoglerAP (unpublished data) and is followed here with minor mod-ifications A list of the software required (most freely available)is given in table 3 and a schematic overview of the principalsteps is presented in figure 6 In brief the raw data weretrimmed of adapters using Trimmomatic (Bolger et al2014) and putative mitochondrial reads were identified in aBLAST search (Altschul et al 1990) against a custom referencedatabase of 258 Coleoptera mitogenomes (E = 1e5 no re-striction in length overlap) (Timmermans MJTN Barton CDodsworth S Haran J Ahrens D Foster PG Bocak L andVogler AP unpublished data) The extracted mtDNA readswere subjected to whole-genome shot-gun assembly usingCelera Assembler (Myers et al 2000) and IDBA-UD (Penget al 2012) and the resulting contigs were filtered again formtDNA hits against the Coleoptera reference library for
sequences of more than 1000 bp overlap at E = 1e5 Bothassemblies were merged using Minimus2 (Sommer et al2007) to combine overlapping sequences from both assem-blers into longer scaffolds
To investigate the relationship between the number ofgenerated sequencing reads and assembly success all readswere mapped onto the obtained contigs using Geneious al-lowing for 2 mismatches a maximum gap size of 3 bp andrequiring a minimum overlap of 100 bp Annotations of eachassembly were conducted by first mapping tRNA genes withCOVE (Eddy and Durbin 1994) after which the intervening
Table 3 List of Software Used for the De Novo Assembly and Analysis of Mitogenomes with their Main Function and Source URL
ldquoAPErdquo package in R Phylogenetic analysis httpape-packageirdfr
aAll URLs were last accessed on May 10 2014
DNA extracon
lsquoBaitrsquo PCR(cox1 cytB rrnL)
Sanger sequencing
Idenfied lsquobaitsrsquo
dsDNA concentraon assay
Equimolar sample pooling
NGS
Mitogenome Assembly
BLAST for mtDNA
Gene annotaon
BLAST idenficaonof mitogenomes
with lsquobaitsrsquo
Phylogeny reconstrucon
FIG 6 Schematic flowchart of the principal steps for the bulk de novoassembly of mitogenomes and identification with PCR-amplified ldquobaitrdquosequences
2234
Gillett et al doi101093molbevmsu154 MBE at U
niversity of East A
nglia on July 24 2014httpm
beoxfordjournalsorgD
ownloaded from
protein and rRNA coding genes were extracted withFeatureExtract 12 (Wernersson 2005) To identify thesegenes the resulting sequences were mapped to theTribolium castaneum mitogenome (GenBank accessionnumber NC_003081) using Geneious and were afterward ex-ported by gene into separate FASTA files Sequences of lessthan one-third of total gene length were discarded
Identification of Mitogenomic Assemblies Using ldquoBaitrdquoSequences
To identify the mitogenomic assemblies by association withtheir respective originating specimen BLAST searches wereconducted for each bait sequence reference against all corre-sponding gene sequences extracted from the mitogenomeassemblies (separately for cox1-50 and 30 regions cytB andrrnL) Only hits with 100 pairwise identity and more than100 bp overlap were considered a successful identificationWhere multiple bait sequences from a single specimenwere available each bait was checked to have hit the samelong assembly unequivocally to test for possible chimeras Ifbaits from a single specimen matched multiple nonoverlap-ping assemblies they presumably correspond to the sameincompletely assembled mitogenome These assemblieswere combined and retained if they included eight or moregenes in total Once mitogenomic assemblies were identifiedthe tRNA gene order in the cluster of six tRNA genes locatedbetween nad3 and nad5 was visually recorded
Sequence Alignment and Data Set Concatenation
The sequences for the genes nad5 nad4 nad4L and nad1which are transcribed on the reverse strand of the mitochon-drial genome were reverse complemented prior to alignmentTwenty-eight additional curculionoid mitogenome sequenceswere obtained from GenBank (primarily those generated byHaran et al [2013] supplementary table S1 SupplementaryMaterial online) to maximize taxon sampling Two membersof Chrysomeloidea were included as outgroups followingHaran et al (2013) The combined sequences from each ofthe separated 13 protein-coding and two rRNA genes wereindividually aligned using the MAFFT 70 online server underthe FFT-NS-I slow iterative refinement strategy (Katoh et al2002) Alignments were thereafter checked manually inGeneious for quality and to ensure that protein-codinggenes were in the correct reading frame Genes were conca-tenated together to make six different data matrices as fol-lows All genes (A) only protein-coding genes (B) all geneswith third codon positions removed from protein-codinggenes (C) protein-coding genes only with third codon posi-tions removed (D) all genes with third codon positions re-moved from protein-coding genes and first codon positionsR-Y coded (E) and only protein-coding genes with thirdcodon positions removed and first codon positions R-Ycoded (F)
Phylogenetic Analyses
Each of the six data sets was analyzed under the ML optimal-ity criterion using RAxML 766 (Stamatakis 2006) run on the
CIPRES web-based server (Miller et al 2010) To assess nodalsupport a rapid BS with 1000 iterations was run in parallelwith tree-building The data sets were each analyzed bothpartitioned by gene and unpartitioned (ie a single partition)Additionally three of the data sets (A B and E) were firsttested using PartitionFinder (Lanfear et al 2012) to objectivelyselect the best-fitting partitioning scheme and model of mo-lecular evolution for each alignment This was performedusing the Bayesian Information Criterion from an initialpartitioning of each of the three codon positions for eachamino acid-coding sequence and each rRNA gene beingseparate partitions The resulting ML trees were made ultra-metric using the chronos function of the APE package in R(Paradis et al 2004) which uses penalized likelihood to fit achronogram to a phylogenetic tree (Paradis 2013) To obtaina measure of the suitability of the mitogenomic data torobustly support relationships across different nodal ages(putative taxonomic ranks) we investigated the distributionof nodal support across trees by calculating the branch lengthfrom the root for each node using a custom R script andplotting this against its respective RAxML BS support Wealso constructed a strict consensus tree from the 15 MLtrees to visualize the distribution of consistent nodesacross all our analyses We performed additional RAxML anal-yses on data sets A and B partitioned by gene and separatecodon positions for each protein-coding gene (41 and 39partitions respectively) and various RAxML analyseson these two data sets with different combinations ofpartitioning schemes and topological constraints assummarized in table 2 in order to calculate the AIC as ameans for preferred model selection (Posada and Buckley2004)
To investigate how successfully subsets of the full-datamatrix were able to reconstruct the phylogeny we also ana-lyzed (using RAxML with data partitioned by gene and byPartitionFinder-derived partitions) three additional data setscomposed of 1) only the reverse-transcribed protein-codinggenes (nad5 nad4 nad4L and nad1) 2) the remaining nineforward-transcribed protein-coding genes and 3) only theavailable ldquobaitrdquo sequences The latter analysis was undertakento ascertain whether there is any benefit in assembling themitogenomes for phylogeny reconstruction over the PCRsequences alone
Compositional heterogeneity was assessed on theprotein-coding genes using the w2 statistics (Swofford 2002)The resulting P value is the probability that the data are ho-mogeneous and is considered significant when less than 5This test suffers from a high probability of Type II error be-cause the test assumes independence of the data which theyare not We therefore also used the test of Foster (2004)which uses simulations based on the ML tree model anddata size to generate a valid null distribution of a w2 valuefrom the original data The ML tree for the concatenated datawas used in all cases when assessing heterogeneity in eachgene with any missing taxa pruned off Model parametersand branch lengths were reoptimized under a GTR + Gmodel
2235
Phylogeny of Weevils (Coleoptera Curculionoidea) doi101093molbevmsu154 MBE at U
niversity of East A
nglia on July 24 2014httpm
beoxfordjournalsorgD
ownloaded from
Supplementary MaterialSupplementary tables S1 S2 S4 S7 and S10 and figures S3 S5S6 S8 and S9 are available at Molecular Biology and Evolutiononline (httpwwwmbeoxfordjournalsorg)
Acknowledgments
The authors are indebted to the following individuals whohave lent or donated weevil specimens used in this studyMax Barclay Roberto Caldara Christiana Faria MichaelGillett Levent Gultekin James Kitson Christopher LyalMassimo Meregalli Rolf Oberprieler Charles OrsquoBrienPedro Oromı Li Ren and Clive Turner They also thankPeter Foster (NHM) for his analytical assistance and twoanonymous reviewers for their constructive commentsThis work was supported by a Natural EnvironmentResearch Council CASE PhD studentship (NEG01194X1)to CPDTG the University of East Anglia and the NaturalHistory Museum the NHM Biodiversity Initiative theLeverhulme Trust (F00696P) and a NERC PostdoctoralFellowship (NEI0215781) to MJTNT
ReferencesAlonso-Zarazaga MA Lyal CHC 1999 A world catalogue of families and
genera of Curculionoidea (Insecta Coleoptera) (excepting Scolytidaeand Platypodidae) Barcelona Entomopraxis
Altschul SF Gish W Miller W Myers EW Lipman DJ 1990 Basic localalignment search tool J Mol Biol 215403ndash410
Bolger AM Lohse M Usadel B 2014 Trimmomatic a flexible trimmerfor Illumina sequence data Bioinformatics Advance Access pub-lished April 12014 doi 101093bioinformaticsbtu170
Botero-Castro F Tilak MK Justy F Catzeflis F Delsuc F Douzery EJP2013 Next-generation sequencing and phylogenetic signal of com-plete mitochondrial genomes for resolving the evolutionary historyof leaf-nosed bats (Phyllostomidae) Mol Phylogenet Evol 69728ndash739
Bouchard P Bousquet Y Davies AE Alonso-Zarazaga MA Lawrence JFLyal CHC Newton AF Reid CAM Schmitt M Slipinski SA et al2011 Family-group names in Coleoptera (Insecta) Zookeys 881ndash972
Bernt M Bleidorn C Braband A Dambach J Donath A Fritzsch GGolombek A Hadrys H Juhling F Meusemann K et al 2013 Acomprehensive analysis of bilateran mitochondrial genomes andphylogeny Mol Phylogenet Evol 69352ndash364
Cameron SL 2014 Insect mitochondrial genomics implications for evo-lution and phylogeny Annu Rev Entomol 5995ndash117
Cameron SL Lo N Bourguignon T Svenson GJ Evans TA 2012 Amitochondrial genome phylogeny of termites (BlattodeaTermitoidae) robust support for interfamilial relationships and mo-lecular synapomorphies define major clades Mol Phylogenet Evol 65163ndash173
Castoe TA Sasa MM Parkinson C 2005 Modeling nucleotide evolutionat the mesoscale the phylogeny of the neotropical pitvipers of thePorthidium group (Viperidae Crotalinae) Mol Phylogenet Evol 37881ndash898
Crowson RA 1955 The natural classification of the families ofColeoptera London Nathaniel Lloyd amp Co
Franz NM Engel MS 2010 Can higher-level phylogenies of weevils ex-plain their evolutionary success A critical review Syst Entomol 35597ndash606
Funk DJ Omland KE 2003 Species-level paraphyly and polyphyly fre-quency causes and consequences with insights from animal mito-chondrial DNA Annu Rev Ecol Evol Syst 34397ndash423
Haran J Timmermans MJTN Vogler AP 2013 Mitogenome se-quences stabilize the phylogenetics of weevils (Curculionoidea)and establish the monophyly of larval ectophagy Mol PhylogenetEvol 67156ndash166
Hundsdoerfer AK Rheinheimer J Wink M 2009 Towards the phylogenyof the Curculionoidea (Coleoptera) reconstructions from mito-chondrial and nuclear ribosomal DNA sequences Zool Anz 2489ndash31
Jordal BH Sequeira AS Cognato AI 2011 The age and phylogeny ofwood boring weevils and the origin of subsociality Mol PhylogenetEvol 59708ndash724
Katoh K Misawa K Kuma K Miyata T 2002 MAFFT a novel methodfor rapid multiple sequence alignment based on fast Fourier trans-form Nucleic Acids Res 303059ndash3066
Kayal E Roure B Philippe H Collins AG Lavrov DV 2013 Cnidarianphylogenetic relationships as revealed by mitogenomics BMC EvolBiol 135
Kuschel G 1995 A phylogenetic classification of Curculionoideato families and subfamilies Mem Entomol Soc Washington 145ndash33
Lanfear R Calcott B Ho SYW Guindon S 2012 PartitionFinder com-bined selection of partitioning schemes and substitution models forphylogenetic analyses Mol Biol Evol 291695ndash1701
Langley CH Crepeau M Cerdeno C Corbett-Detig R Stevens K 2011Circumventing heterozygosity sequencing the amplified genome ofa single haploid Drosophila melanogaster embryo Genetics 188239ndash246
Marvaldi AE 1997 Higher level phylogeny of Curculionidae (Coleoptera Curculionoidea) based mainly on larval characters with special ref-erence to broad-nosed weevils Cladistics 13285ndash312
McKenna DD Sequeira AS Marvaldi AE Farrell BD 2009 Temporal lagsand overlap in the diversification of weevils and flowering plantsProc Natl Acad Sci U S A 1067083ndash7088
Meregalli M Osella G 2007 Dichotrachelus kahleni sp n a new weevilspecies from the Carnian Alps north-eastern Italy (ColeopteraCurculionidae Entiminae) Deut Entomol Z 54169ndash177
Miller MA Pfeiffer W Schwartz T 2010 Creating the CIPRES ScienceGateway for inference of large phylogenetic trees In Proceedings ofthe Gateway Computing Environments Workshop (GCE) 2010 Nov14 New Orleans (LA) IEEE p 1ndash8
Myers EW Sutton CG Delcher AL Dew IM Fasulo DP Flanigan MJKravitz SA Mobarry CM Reinert KH Remington KA et al 2000 Awhole-genome assembly of Drosophila Science 2872196ndash2204
Osigus H-J Eitel M Bernt M Donath A Schierwater B 2013 Mitoge-nomics at the base of Metazoa Mol Phylogenet Evol 69339ndash351
Pacheco MA Battistuzzi FU Lentino M Aguilar RF Kumar S EscalanteAA 2011 Evolution of modern birds revealed by mitogenomicstiming the radiation and origin of major orders Mol Biol Evol 281927ndash1942
Papadopoulou A Anastasiou I Vogler AP 2010 Revisiting the insectmitochondrial molecular clock the mid-Aegean trench calibrationMol Biol Evol 271659ndash1672
Paradis E 2013 Molecular dating of phylogenies by likelihood methodsa comparison of models and a new information criterion MolPhylogenet Evol 67436ndash444
Paradis E Claude J Strimmer K 2004 APE analyses of phylogenetics andevolution in R language Bioinformatics 20289ndash290
Peng Y Leung HCM Yiu SM Chin FYL 2012 IBDA-UD a de novoassembler for single-cell and metagenomic sequencing data wothhighly uneven depth Bioinformatics 281420ndash1428
2236
Gillett et al doi101093molbevmsu154 MBE at U
niversity of East A
nglia on July 24 2014httpm
beoxfordjournalsorgD
ownloaded from
Pons J Ribera I Bertranpetit J Balke M 2010 Nucleotide substitutionrates for the full set of mitochondrial protein-coding genes inColeoptera Mol Phylogenet Evol 56796ndash807
Posada D Buckley T 2004 Model selection and model averaging inphylogenetics advantages of Akaike information criterion andBayesian approaches over likelihood ratio tests Syst Biol 53793ndash808
Roos J Aggarwal RK Janke A 2007 Extended mitogenomic phylogeneticanalyses yield new insight into crocodylian evolution and their sur-vival of the Cretaceous-Tertiary boundary Mol Phylogenet Evol 45663ndash673
Rubinstein ND Feldstein T Shenkar N Botero-Castro F Griggio FMastrototaro F Delsuc F Douzery EJP Gissi C Huchon D 2013Deep sequencing of mixed total DNA without barcodes allows ef-ficient assembly of highly plastic Ascidian mitochondrial genomesGenome Biol Evol 51185ndash1199
Sheffield NC Song H Cameron SL Whiting MF 2008 A comparativeanalysis of mitochondrial genomes in Coleoptera (ArthropodaInsecta) and genome descriptions of six new beetles Mol BiolEvol 252499ndash2509
Sheffield NC Song H Cameron SL Whiting MF 2009 Nonstationaryevolution and compositional heterogeneity in beetle mitochondrialphylogenetics Syst Biol 58381ndash394
Sommer DD Delcher AL Salzberg SL Pop M 2007 Minimus a fastlightweight genome assembler BMC Bioinformatics 864
Song HJ Sheffield NC Cameron SL Miller KB Whiting MF 2010 Whenphylogenetic assumptions are violated base compositional hetero-geneity and among-site rate variation in beetle mitochondrial phy-logenomics Syst Entomol 35429ndash448
Stamatakis A 2006 RAxML-VI-HPC maximum likelihood-based phylo-genetic analyses with thousands of taxa and mixed modelsBioinformatics 222688ndash2690
Swofford DL 2002 PAUP phylogenetic analysis using parsimony(and other methods) Version 4 Sunderland (MA) SinauerAssociates
Talavera G Vila R 2011 What is the phylogenetic signal limitfrom mitogenomes The reconciliation between mitochondrialand nuclear data in the Insecta class phylogeny BMC Evol Biol 11315
Thompson RT 1992 Observations on the morphology and classificationof weevils (Coleoptera Curculionoidea) with a key to major groups JNat Hist 26835ndash891
Timmermans MJTN Dodsworth S Culverwell CL Bocak L Ahrens DLittlewood DTJ Pons J Vogler AP 2010 Why barcode High-throughput multiplex sequencing of mitochondrial genomes formolecular systematics Nucleic Acids Res 381ndash14
Wei S-j Shi M Sharkey MJ van Achterberg C Chen X-X 2010Comparative mitogenomics of Braconidae (InsectaHymenoptera) and the phylogenetic utility of mitochondrial ge-nomes with special reference to holometabolous insects BMCGenomics 11371
Wernersson R 2005 FeatureExtractmdashextraction of sequence annotationmade easy Nucleic Acids Res 33W567ndashW569
Williams S Foster PG Littlewood DTJ 2014 The complete mitochon-drial genome of a turbinid vetigastropod from MiSeq Illumina se-quencing of genomic DNA and steps towards a resolved gastropodphylogeny Gene 53338ndash47
Winkelmann I Campos PF Strugnell J Cherel Y Smith PJKubodera T Allcock L Kampmann M-L Schroeder H GuerraA et al 2013 Mitochondrial genome diversity and populationstructure of the giant squid Architeuthis genetics sheds newlight on one of the most enigmatic marine species Proc R SocB 2801759
2237
Phylogeny of Weevils (Coleoptera Curculionoidea) doi101093molbevmsu154 MBE at U
niversity of East A
nglia on July 24 2014httpm
beoxfordjournalsorgD
ownloaded from
1 cockroach and 13 termite mitogenomes in Cameron et al[2012]) Techniques have almost always included either shot-gun sequencing of expensive multiple-indexed libraries(Botero-Castro et al 2013) or a target-enrichment stepsuch as primer walking using standard polymerase chain re-action (PCR) amplification of overlapping fragments (Botero-Castro et al 2013) long-range PCR followed by eithersequencing-primer walking (Roos et al 2007) or shot-gunsequencing (Timmermans et al 2010) and hybrid-captureusing sheared long-range PCR products as ldquobaitsrdquo immobi-lized on magnetic beads (Winkelmann et al 2013) Althoughthese techniques can generate full mitochondrial genomeseach of them has limitations that generally restrain thenumber of taxa or samples that can be incorporated econom-ically within a study
This study aims to address this sampling bottleneck bytesting the possibility of parallel de novo mitogenome assem-bly from a single library of pooled genomic DNA from a bulksample consisting of many species This method has recentlybeen applied to sequencing of environmental samples of ar-thropods from a rainforest canopy (Crampton-Platt ALTimmermans MJTN Gimmel ML Kutty SN Cockerill TDKhen CV Vogler AP unpublished data) Here we apply thistechnique to investigate the higher level phylogeny of an ex-tremely diverse superfamily of insects the weevils(Coleoptera Curculionoidea) Mitogenome sequences inthe Coleoptera have to date been accumulated graduallyfor major lineages including the four suborders mostlyusing Sanger sequencing (Sheffield et al 2008 2009 Ponset al 2010 Song et al 2010 Timmermans et al 2010)These studies consistently encountered difficulties in resolv-ing basal relationships in Coleoptera due to apparent com-positional heterogeneity (Sheffield et al 2009 Song et al 2010)and markedly different rates of molecular evolution (Ponset al 2010) However it is not known whether heterogeneitythat confounds deep-level divergences also affects subcladesfor example at the level of superfamilies and families(Cameron 2014) In addition the effect of different data par-titioning schemes remains to be investigated across taxo-nomic levels (Cameron 2014)
The Curculionoidea are composed of no fewer than 62000described species distributed wherever terrestrial plants grow(Oberprieler et al 2007) The current higher level classificationproposed by Bouchard et al (2011) recognizes nine extantfamilies among which the Curculionidae s str is by far thelargest containing at least 51000 species in 17 subfamilies and292 tribes and subtribes The phylogenetic classification of theweevils was recognized by the eminent beetle taxonomistCrowson (1955) as ldquo probably the largest and most impor-tant problem in the higher classification of Coleoptera rdquoSince that time there have been considerable advances in ourunderstanding of the phylogeny of this group with significantmorphological analyses by Kuschel (1995) and Marvaldi(1997) More recently molecular data have contributed to-ward reconstructing weevil higher level relationships includ-ing studies by McKenna et al (2009) Hundsdoerfer et al(2009) and Jordal et al (2011) which each incorporated be-tween two and six gene markers A recent analysis of 27 weevil
mitogenomes using 12 protein-coding genes (Haran et al2013) supported the paraphyly of Curculionoidea s str ascurrently defined because the subfamily Platypodinae wasrecovered in a distant position in a clade with the familiesDryophthoridae and Brachyceridae that together were sisterto all other Curculionoidea Although undertaken with lim-ited taxon sampling within the Curculionoidea s str (18tribes) this last study also supported the division of thefamily into two large clades One comprising the ldquobroad-nosedrdquo weevils (subfamilies Entiminae Cyclominae andHyperinae) and another containing the remaining subfamilies(except for Platypodinae) In the same study a tRNAAla totRNAArg gene order rearrangement was identified in a clusterof six tRNA genes located between nad3 and nad5 whichappears to be a synapomorphy for the ldquobroad-nosedrdquo weevilsubfamilies further supporting their monophyly This topol-ogy was consistent with that proposed by McKenna et al(2009) who concluded that the initial diversification of wee-vils occurred on gymnosperm plants during the Early to earlyMiddle Jurassic
The Platypodinae is one of several weevil subfamilies thatare specialist wood-borers together with the bark-beetles(Scolytinae) and the subfamily Cossoninae although othersubfamilies also contain xylophagous members (egMolytinae Cryptorhynchinae and Conoderinae) The evolu-tion of wood-boring behavior was investigated in detail byJordal et al (2011) whose analyses incorporated morpholog-ical characters together with molecular data concluding thatboth Scolytinae and Platypodinae are derived lineages withinthe Curculionoidea sensu Oberprieler et al (2007) Howeverseveral important head characters that underpin this relation-ship are likely to be homoplasious and associated with tun-neling habit (Jordal et al 2011) Thompson (1992) identifieddistinct characters of the platypodine eighth abdominal ster-nite and male genitalia which indicated a distant relationshipto Scolytinae and a possible justification for their inclusion ina separate curculionoid family Therefore the question aboutthe polyphyly of wood-boring lineages remains open and thefailure of previous mitogenome studies to recover the platy-podine and scolytine lineages as monophyletic (Haran et al2013) may be due to limited taxon sampling The issue there-fore may only be resolved if Jordal et alrsquos (2011) comprehen-sive taxon sampling of wood-boring lineages could bematched using mitochondrial genomes
Results
Mitogenomic Assembly
Specimens were selected to represent a wide taxonomic cov-erage and included 173 species from six different families ofCurculionoidea and 16 subfamilies and 104 tribes ofCurculionidae They were acquired from various sourcesand in different stages of preservation leading to variableDNA quality as is common in phylogenetic studies that in-volve lineages for which DNA-ready material is difficult toobtain Individual DNA extracts were not characterized ingreat detail but based on bait PCR success they are likelyto differ in the degree of degradation and purity All DNA
2224
Gillett et al doi101093molbevmsu154 MBE at U
niversity of East A
nglia on July 24 2014httpm
beoxfordjournalsorgD
ownloaded from
extracts were included in a single sequencing pool at equi-molar concentrations although for several including aliquotsfrom 31 specimens already extracted for a previous study(Jordal et al 2011) the available amount of DNA fell shortFollowing sequencing with an Illumina MiSeq approximately5 of the reads resembled mitochondrial sequences afterBLAST filtering (from a total of 18341901 paired-end readsobtained in a single MiSeq run) Assemblies constructed withthe Celera and IDBA-UD assemblers resulted in 338 and 336assemblies of more than 1000 bp respectively rising to 361assemblies when combined using Minimus2 Of these 105were more than 10 kb in length and potentially represented(largely) complete mitogenomes The cumulative distributionof the assemblies by sequence length is shown in figure 1whereas figure 2 represents the frequency distribution of as-sembly lengths for each of the Celera IDBA-UD andMinimus2 assemblies The latter produced a shift towardlonger contigs especially for the critical contig length ofmore than 15 kb that corresponds to the full length ofinsect mitogenomes All subsequent analyses were conductedon the Minimus2 assemblies We were able to newly assembleand identify a total of 92 complete or near-complete mito-genomes comprising at least eight genes including 75 (43 ofall pooled samples) containing the full complement of 15genes a further 15 (87 of pooled samples) containingmore than or equal to 12 genes (supplementary table S1Supplementary Material online) and two assemblies contain-ing eight and nine genes respectively Those falling short of afull-gene complement were mainly lacking the ribosomalRNA (rRNA) genes in particular rrnS which was the leastcommon gene present in only 56 of the assemblies whereasnad6 and cytB were present in all 92 assemblies A majority of86 assemblies contained a portion of the noncoding controlregion whose exact length is difficult to ascertain because ofreduced sequence complexity due to the presence of re-peated regions The mean estimated length of the controlregion was 1190 bp whereas in those 33 mitogenomes thatcould be circularized the length varied between
approximately 200ndash2780 bp (supplementary table S1Supplementary Material online)
Identification of Mitogenomic Assemblies Using ldquoBaitrdquoSequences
From the set of 361 partial and complete contigs obtainedwith Minimus2 a total of 163 cox1 (529ndash1560 bp) 154 cytB(218ndash1147 bp) and 162 rrnL (211ndash1340 bp) gene sequenceswere extracted Sequences from each gene were grouped intolibraries and used as queries in a BLAST search against eachcorresponding bait sequence reference library The latter wascomposed of all successful PCR-based sequences from the 173original DNA extractions and included 84 cox1-50 115 cox1-30132 cytB and 107 rrnL sequences (fig 3) All samples used inthe bulk sequencing were represented by at least one bait (36samples) whereas 42 57 and 36 samples were represented bytwo three and four bait sequences respectively Matchingthese bait sequences to the 92 long mitogenomic assemblies16 assemblies showed a match to one bait 30 assembliesmatched two baits 32 assemblies matched three baits and14 assemblies matched all four baits Four of the completeand near-complete mitogenomes contained sequences fromtwo nonoverlapping assemblies that each matched at leastone bait from the same specimen Out of the remaining 81weevil samples there were 37 instances where baits hit a shortcontig that was not included in the collection of near-com-plete or complete mitogenome assemblies but in 44 in-stances the baits did not hit any of the assembled contigsAdditionally one divergent assembly was rejected because itwas found to match Coleoptera other than weevils in thereference database possibly present in the sample due to acontamination Supplementary table S2 SupplementaryMaterial online summarizes the bait-matching identificationresults by bait for each pooled sample with matching contigsgiven by their unique number and with reasons for identifi-cation failures listed Overall the different baits contributedfairly equally to the final identifications with 56 of all cox1-30
baits leading to a successful identification 53 of cytB 50 ofrrnL and 45 of cox1-50 Proportions of total number of baitsbait hits and hits leading to assembly identifications by geneare illustrated in figure 3 A further 50 short contigs (1025ndash6437 bp mean 2472 bp) matched single baits but were notincorporated in the analyses because they contained only amaximum of four complete protein-coding or rRNA geneseach Their inclusion would have considerably increased theamount of missing data in the matrix
The total number of reads making up each of the 92mitogenomes (which were made up of 96 separate contigs)was used to calculate the sequencing depth (fig 4) The ma-jority of sequences showed a 10ndash50 coverage that generallyresulted in contigs of 15ndash20 kb Coverage reached over 200in a few cases but this did not appear to closely correlate withcontig length For example two contigs of high coverage wereless than 5 kb in length and corresponded to two noncontig-uous fragments from the same species (Dryocoetes autogra-phus) linked by multiple baits obtained from a singlespecimen In addition read coverage was not closely
0
5000
10000
15000
20000
25000
Asse
mbl
y le
ngth
(bp)
Cumulave number of assemblies
IDBA-UD
Celera
Minimus2
FIG 1 Cumulative distribution of assembly lengths from the CeleraIDBA-UD and the combined Minimus2-generated assemblies
2225
Phylogeny of Weevils (Coleoptera Curculionoidea) doi101093molbevmsu154 MBE at U
niversity of East A
nglia on July 24 2014httpm
beoxfordjournalsorgD
ownloaded from
correlated with the initial DNA concentration in the sequenc-ing pool Most samples were present at 10 ng yet their cov-erage varied by more than an order of magnitude whereascoverage for samples present at a concentration up to 4lower varied over the same range (fig 4) Twenty-one of the31 nonassayed genomic samples resulted in assemblies ofmore than or equal to eight genes (of which 17 assembliescontained all 15 genes) We found no taxonomic correlate
FIG 2 Frequency distribution of assembly lengths from the Celera IDBA-UD and the combined Minimus2-generated assemblies
0
5000
10000
15000
20000
25000
0 50 100 150 200 250 300
Con
g le
ngth
Coverage
0
25
5
75
10
1 10 100 1000
ng g
DNA
Coverage
A
B
FIG 4 Mean sequencing coverage versus (A) assembly (contig) length(bp) and (B) approximate mass of genomic DNA in the sample pool foridentified mitogenomic assemblies Thirty-one samples that were notassayed for DNA concentration are shown at bottom of graph B
0
20
40
60
80
100
120
140
cox1 5 cox1 3 cytB rrnL
Total baits
Total bait hits
Bait hits leading to idenficaon
FIG 3 Relative proportions by gene of total ldquobaitrdquo sequences availableldquobaitrdquo sequences with matching ldquohitsrdquo to the assembled genes andmatching hits that contributed to a successful mitogenome identifica-tion following a BLAST search
2226
Gillett et al doi101093molbevmsu154 MBE at U
niversity of East A
nglia on July 24 2014httpm
beoxfordjournalsorgD
ownloaded from
with sequencing or assembly failure because representativesof all six pooled families and 13 of the 16 included subfamiliesof Curculionidae resulted in long assemblies (the three miss-ing subfamilies were represented only by a total of five speci-mens) Specimen size is also unlikely to be the dominantlimiting factor in determining sequencing success becausemany of the small-sized (~2ndash5 mm) Scolytinae producedfull assemblies
Phylogenetic Analyses
The 92 new assemblies were combined with existing data foran aligned data matrix of 122 samples and 13792 positionsOf the final set of mitogenomes 2 belonged to the familyAnthribidae 5 to Attelabidae 3 to Brachyceridae 4 toBrentidae 4 to Dryophthoridae 1 to Nemonychidae and101 belonged to 67 identified tribes within theCurculionidae including 19 tribes of the wood-boringScolytinae The optimal partitioning scheme was establishedusing PartitionFinder starting with a total of 39 partitions (41partitions with the two rRNA genes included) that split all 13genes (15 in data sets A C and E) and three codon positionsin each protein-coding gene PartitionFinder selected five par-titions for the ldquoonly protein-coding genesrdquo data set and sixpartitions for the ldquoall genesrdquo data set whereby the two rRNAgenes were grouped with the first codon positions of nad2nad3 and nad6 and the second codon position of atp8(table 1) For both data sets the first and third codon posi-tions on forward and reverse strands were split into separatepartitions whereas all second positions were collapsed into asingle partition Forward and reverse genes mainly differed inbase frequencies with a shift from A to T and G to C in thereverse strand partitions and rates shifted accordingly (nor-malized to the time-reversible G-T changes supplementaryfig S3 Supplementary Material online) The data set contain-ing ldquoonly protein-coding genes R-Y codedrdquo resulted in onlytwo partitions separating first and second codon position for
both strands combined (third positions are removed fromthis data set) The findings are in accordance with previousobservations on Curculionoidea that also showed a great im-provement in likelihood values when partitioning by bothcodon position and strand (Haran et al 2013) reflectingthe great differences in codon usage in genes coded oneither strand (also see Pons et al 2010) However this doesnot extend to produce differences in variation in amino acidchanges as forward and reverse strands were consistentlygrouped into a single partition for the data set using secondposition only and for the R-Y-coded matrix (eliminating firstcodon synonymous changes)
The maximum-likelihood (ML) trees were greatly im-proved using six partitions over an unpartitioned analysisbut the benefit of using a model with 41 or 39 separatepartitions was low as seen from the small additional improve-ment in the Akaike information criterion (AIC) values(table 2) Interestingly the improvement in ML from usingthe partitioned models was very similar whether the treeswere obtained directly under the partitioned model or ob-tained under the unpartitioned model but with the likelihoodcalculated under partitioning (table 2) Hence despite thegreatly improved likelihood scores after partitioning the re-sulting trees differ only slightly in parameters of greatestimpact on the likelihood Indeed the topologies are littlechanged between searches using the unpartitioned model6-partition model (5-partition model without rRNA genes)and the 41 (39) partition model and hence there was only asmall increase in likelihood if the simpler model is imposed onthe tree obtained with the more complex model
ML trees obtained with the various coding schemes(including or excluding rRNA genes R-Y coding presenceof third codon position supplementary table S4Supplementary Material online) also resulted in highly con-gruent topologies based on strongly supported (gt80 boot-strap analysis [BS]) nodes Figure 5 depicts the best RAxMLtree obtained with the ldquoall genesrdquo data set under six partitions
Table 1 Partitioning Schemes and Nucleotide Substitution Models Selected by PartitionFinder for Two Data Sets According to Gene and toCodon Position (Numbered 1ndash3) in Protein-Coding Genes
NOTEmdashReverse strand transcribed genes are indicated in light gray and the rRNA genes in dark gray Separate partitions are numbered P1ndashP6 and allocated positions to eachpartition labeled X
2227
Phylogeny of Weevils (Coleoptera Curculionoidea) doi101093molbevmsu154 MBE at U
niversity of East A
nglia on July 24 2014httpm
beoxfordjournalsorgD
ownloaded from
Indicated on this tree are nodes that are retained in the strictconsensus of trees obtained from all different treatments ofthe data and those nodes unresolved in the strict consensusthat is the nodes whose resolution is consistent with thestrict consensus Nodes with high nodal support (80ndash100BS) occurred throughout the entire span of nodal ages andthis pattern is found across all analyses (supplementary fig S5Supplementary Material online) Results obtained from thethree additional smaller subsets of data indicate that the treesobtained using the plus- and minus-strand-encoded subsetsof genes (supplementary figs S8 and S9 SupplementaryMaterial online) agree well with the full matrix-derivedtrees but importantly those constructed using only the ldquobaitrdquosequences (supplementary fig S6 Supplementary Materialonline) contain much lower nodal support than any of themitogenomic trees This is expected from a data matrix thathas much missing data which consequently does not allowfor robust inference of relationships
The data set also allowed us to address the question aboutthe hierarchical level at which the confounding effects ofcompositional heterogeneity may be encountered (Sheffieldet al 2009 Song et al 2010) The w2 test of base heterogeneity(Swofford 2002) revealed that with only one exception (atp8)the data are heterogeneous by this test (supplementary tableS7 Supplementary Material online) In contrast the R-Yrecoded data stripped for third positions indicated thatmost genes are homogeneous by this test although not forthe concatenated complete matrix However the more de-fensible test of Foster (2004) showed that only cox3 cytb andnad1 are homogenous in composition Hence the issues ofheterogeneity persist at a much lower hierarchical level thanthe subordinal and superfamily-level relationships investi-gated previously (Sheffield et al 2009 Song et al 2010)
Family-Level Relationships
All 15 analyses recovered the monophyletic ldquoambrosia bee-tlesrdquo Platypodinae (100 BS) outside the other ldquotrue weevilsrdquo
(=Curculionidae sensu Bouchard et al 2011) which wouldotherwise be monophyletic In most analyses except thoseincluding R-Y-coded protein-coding genes Platypodinae wasplaced in the sister clade to the rest of Curculionidae togetherwith the Dryophthoridae (palm weevils) and the brachyceridgenus Ocladius with moderate to strong support forthis adelphic relationship (62ndash95 BS) In all analyses themonophyletic Brentidae (100 BS) were recovered as thesister taxon to a Curculionidae + Dryophthoridae +Brachyceridae clade with very strong nodal support (100BS) The sister relationship between the monophyletic(100 BS) Attelabidae (leaf-rolling weevils) and this latterclade plus Brentidae was similarly very strongly supported(100 BS) across all analyses The Nemonychidae was consis-tently recovered as sister to the clade containing Attelabidaeand all other weevil families mentioned so far Support for thisrelationship was very high ranging from 98 to 100BS across analyses The two taxa belonging to theAnthribidae were always recovered as monophyletic (100BS) Within the Attelabidae the subfamilies Apoderinae andRhynchitinae were recovered as monophyletic with BS sup-port of 100 and 83ndash97 respectively across analyses
Relationships within Curculionidae s str
In most analyses the subfamily Bagoinae represented only bya single Bagous was recovered as the sister to all otherCurculionidae (excepting Platypodinae as noted above)with BS support between 66 and 91 Similarly most anal-yses resulted in the recovery of both a monophyleticEntiminae + Cyclominae + Hyperinae clade (marked A infig 5 100 BS) and a strongly supported sister relationshipbetween this clade and a second clade (marked B in fig 5)containing all other Curculionidae subfamilies (100 BS)Within the entimine clade the Entiminae itself is not recov-ered as monophyletic because the tribe Sitonini is consistentlyrecovered (100 BS) either as sister to the clade containingHyperinae + Cyclominae + the rest of Entiminae or in a
Table 2 ML of Trees under Different Partitioning Schemes
Data Set Partitioning Scheme TopologicalConstraint
Number ofPartitions
SubstitutionModel
Number ofParameters
Ln L AIC AIC
All genes Unpartitioned (one partition) None 1 GTR 8 787773 1575562 62885PartitionFinder (six partitions) On one partition tree 6 GTR 48 758061 1516219 3349Genecodon-position (41 partitions) On one partition tree 41 GTR 328 756379 1513414 737Genecodon-position (41 partitions) On six partition tree 41 GTR 328 756272 1513199 522PartitionFinder (six partitions) On 41 partition tree 6 GTR 48 758010 1516116 3439Genecodon-position (41 partitions) None 41 GTR 328 756010 1512677 naPartitionFinder (six partitions) On one partition tree 6 GTR 48 758061 1516219 3542
Protein-codinggenes
Unpartitioned (one partition) None 1 GTR 8 684161 1368339 34473Genecodon-position (39 partitions) On 1 partition tree 39 GTR 312 666834 1334219 425PartitionFinder (5 partitions) None 5 GTR 40 668480 1337039 3173Genecodon-position (39 partitions) On five partition tree 39 GTR 312 666678 1333981 115PartitionFinder (five partitions) On 39 partition tree 5 GTR 40 668523 1337127 3261Genecodon-position (39 partitions) None 39 GTR 312 666621 1333866 naPartitionFinder (five partitions) On one partition tree 5 GTR 40 668567 1337213 3347
NOTEmdashTrees were obtained under no partitioning under the six- or five-partition schemes selected by PartitionFinder and by the maximum number of partitions tested(partitioning by gene and codon position) Each of the resulting trees was then assessed for their likelihood under the alternative models Note the comparatively small differencein likelihood (AIC) under each partitioning scheme regardless of the model used in the tree search
2228
Gillett et al doi101093molbevmsu154 MBE at U
niversity of East A
nglia on July 24 2014httpm
beoxfordjournalsorgD
ownloaded from
01
SC
OL
Sco
lytin
i S
coly
tus
sp (F
ranc
e)S
CO
L S
coly
tini
Sco
lytu
s sc
olyt
us (D
enm
ark)
SC
OL
Dia
mer
ini
Dia
mer
us in
erm
is (T
anza
nia)
SC
OL
Hex
acol
ini
Sco
lyto
des
caud
atus
(Cos
ta R
ica)
SC
OL
Phl
oeot
ribin
i P
hloe
otrib
us s
pinu
losu
s (N
orw
ay)
SC
OL
Hyl
esin
i H
yles
inus
var
ius
(Sw
eden
)S
CO
L H
ylas
tini
Hyl
aste
s op
acus
(Sw
eden
)S
CO
L To
mic
ini
Tom
icus
pin
iper
da (N
orw
ay)
SC
OL
Poly
grap
hini
Pol
ygra
phus
pol
igra
phus
(Sw
eden
)S
CO
L C
rypt
urgi
ni C
rypt
urgu
s pu
sillu
s (N
orw
ay)
SC
OL
Cor
thyl
ini
Pity
opht
horu
s m
icro
grap
hus
(Sw
eden
)S
CO
L C
orth
ylin
i C
orth
ylus
rubr
icol
lis (C
osta
Ric
a)S
CO
L C
ryph
alin
i C
ryph
alus
sal
tuar
ius
(Nor
way
)S
CO
L X
yloc
toni
ni X
yloc
tonu
s m
acul
atus
(RS
A)
SC
OL
Hyp
obor
ini
Hyp
obor
us fi
cus
(Mor
occo
)S
CO
L P
rem
nobi
ini
Pre
mno
bius
cav
ipen
nis
(RS
A)
SC
OL
Ipin
i Ip
s ac
umin
atus
(Nor
way
)S
CO
L Ip
ini
Ips
cem
brae
(Fra
nce)
SC
OL
Dry
ocoe
tini
Dry
ocoe
tes
auto
grap
hus
(Nor
way
)S
CO
L sp
2 (C
hina
)S
CO
L X
yleb
orin
i A
nisa
ndru
s di
spar
(Nor
way
)S
CO
L sp
1 (C
hina
)C
OS
S P
enta
rthrin
i Pe
ntar
thru
s el
umbe
(Eng
land
)CO
SS
sp1
(Chi
na)
CO
NO
Mec
opin
i M
ecop
us s
p (A
ustra
lia)
MO
LY s
p3 (C
hina
)M
OLY
sp1
(Chi
na)
CR
YP
Cry
ptor
hync
hini
sp
(Cam
eroo
n)C
ON
O Z
ygop
ini
Pelto
phor
us s
p (U
SA
)C
RY
P C
rypt
orhy
nchi
ni P
seud
omop
sis
(Sab
a)C
RY
P C
rypt
orhy
nchi
ni A
calle
s au
bei (
Fran
ce)
CR
YP
Cry
ptor
hync
hini
Per
isso
ps s
p (A
ustra
lia)
CR
YP
Cry
ptor
hync
hini
Our
opor
opte
rus
sp (A
ustra
lia)
CU
RC
Cio
nini
Cio
nus
gris
eus
(Can
arie
s)C
UR
C C
ioni
ni C
ionu
s ol
ens
(Fra
nce)
CE
UT
Phy
tobi
ni R
hino
ncus
sp
(Tur
key)
CE
UT
Mon
onyc
hini
Mon
onyc
hus
punc
tum
albu
m (I
taly
)C
EU
T C
euto
rhyn
chin
i C
euto
rhyn
chus
ass
imili
s (F
ranc
e)C
UR
C S
tore
ini
Mel
ante
rius
sp (A
ustra
lia)
CU
RC
Mec
inin
i M
iaru
s sp
(RS
A)
ME
SO
Mag
dalin
ini
Mag
dalis
sp
(Ital
y)M
ES
O L
aem
osac
cini
Lae
mos
accu
s sp
(US
A)
CR
YP
Cam
ptor
hini
ni C
ampt
orhi
nus
sp (A
ustra
lia)
BA
RI B
arid
ini
Mel
anob
aris
latic
ollis
(Fra
nce)
CU
RC
Tyc
hiin
i S
ibin
ia fu
lva
(US
A)
SC
OL
Cop
tono
tini
Cop
tono
tus
cycl
opus
(Cos
ta R
ica)
CO
NO
Lob
otra
chel
ini
sp1
(Chi
na)
CO
NO
Lob
otra
chel
ini
sp2
(Chi
na)
CO
NO
Lob
otra
chel
ini
sp3
(Chi
na)
MO
LY s
p4 (C
hina
)C
UR
C A
caly
ptin
i A
caly
ptus
sp
(Ital
y)M
OLY
Pis
sodi
ni P
isso
des
sp (I
taly
)M
OLY
Lep
yrin
i Le
pyru
s sp
(Chi
na)
MO
LY H
ylob
ini
Hyl
obiu
s ab
ietis
(Fra
nce)
MO
LY s
p2 (C
hina
)LI
XI R
hino
cylli
ni B
anga
ster
nus
sp (T
urke
y)LI
XI L
ixin
i La
rinus
turb
inat
us (F
ranc
e)C
UR
C E
ugno
min
i A
ncyt
talia
sp
(Aus
tralia
)C
UR
C C
rypt
oplin
i H
aplo
nyx
sp (A
ustra
lia)
CO
SS
Neu
mat
orin
i B
rach
ytem
nus
porc
atus
(Fra
nce)
CU
RC
Ant
hono
min
i A
ntho
nom
us p
omor
um (F
ranc
e)C
UR
C C
erat
opin
i C
erat
opus
sp
(Sab
a)
22
2180
7
3
2
31
1
11160 35
3210
0
1676 36
7
2
1810
010
0
2424
333
40
1
8110
079
100
12
9810
0
76
16
510
0
96
96
54
11
100
100
100
76
100
100
46
100
66
100
9910
0
7272
100
Curculionidae sstr
B
TA
RN
SE
F to
RA
NS
EF
tRN
A tr
ansl
ocat
ion
Nod
e pr
esen
t in
stric
t con
sens
us tr
ee
Nod
e co
nsis
tent
with
stri
ct c
onse
nsus
tree
Woo
d-bo
ring
beha
viou
r
AR
NS
EF
to R
NS
AE
F tR
NA
tran
sloc
atio
n
AR
NS
EF
to R
EA
NS
F tR
NA
tran
sloc
atio
n
T T
Part
1
FIG
5
(Par
ts1
and
2)M
Ltr
eere
sult
ing
from
the
anal
ysis
ofth
eldquoa
llge
nesrdquo
data
set
par
titi
oned
acco
rdin
gto
the
six
Part
itio
nFi
nde
rp
arti
tion
s(s
eeta
ble
1)W
ithi
nC
urcu
lion
idae
sst
r(s
ensu
Bouc
hard
etal
201
1)br
anch
esar
eco
lore
dac
cord
ing
tosu
bfam
ilyO
ther
curc
ulio
noi
dfa
mili
esha
veth
eir
nam
ela
bels
colo
red
byfa
mily
Num
bers
adja
cen
tto
nod
esar
eR
AxM
Lra
pid
boot
stra
psc
ores
wit
hva
lues
mor
eth
an80
hi
ghlig
hted
inre
dT
heth
ree
pri
nci
pal
woo
d-bo
rin
gsu
bfam
ilies
are
rep
rese
nte
dby
dash
edbr
anch
esan
dth
en
odes
labe
led
Aan
dB
indi
cate
the
two
larg
edi
visi
ons
wit
hin
Cur
culio
nid
aere
ferr
edto
inth
ete
xtN
odes
indi
cate
din
gree
nco
rres
pon
dto
nod
esp
rese
nt
inth
est
rict
con
sen
sus
tree
and
nod
esin
dica
ted
inbl
uear
eco
nsi
sten
tw
ith
itT
hep
osit
ion
sof
the
thre
etR
NA
rear
ran
gem
ents
are
indi
cate
dSc
ale
bar
rep
rese
nts
subs
titu
tion
rate
Fam
ilyan
dsu
bfam
ilyco
des
pre
cede
taxa
nam
esas
follo
ws
An
thri
bida
e(A
NT
H)
Att
elab
idae
(AT
TE)
Bra
chyc
erid
ae(B
RA
C)
Bren
tida
e(B
REN
)D
ryop
htho
ridae
(DR
YO
)N
emon
ychi
dae
(NEM
O)
Bago
inae
(BA
GO
)Ba
ridi
nae
(BA
RI)
C
euto
rhyn
chin
ae(C
EUT
)C
onod
erin
ae(C
ON
O)
Cos
son
inae
(CO
SS)
Cry
pto
rhyn
chin
ae(C
RY
P)
Cur
culio
nin
ae(C
UR
C)
Lixi
nae
(LIX
I)
Mes
opti
llin
ae(M
ESO
)M
olyt
inae
(MO
LY)
Plat
ypod
inae
(PLA
T)
and
Scol
ytin
ae(S
CO
L)
2229
Phylogeny of Weevils (Coleoptera Curculionoidea) doi101093molbevmsu154 MBE at U
niversity of East A
nglia on July 24 2014httpm
beoxfordjournalsorgD
ownloaded from
CE
RA
MB
YC
IDA
E
Ano
plop
hora
gla
brip
enni
sC
HR
YS
OM
ELI
DA
E
Crio
ceris
duo
deci
mpu
ncta
taA
NTH
Ant
hrib
inae
Pla
tyst
omos
alb
inus
(Fra
nce)
AN
TH s
p1 (C
hina
)N
EM
O C
imbe
ridin
ae D
oydi
rhyn
chus
aus
triac
us (F
ranc
e)AT
TE R
hync
hitin
ae B
yctis
cus
popu
li (F
ranc
e)AT
TE R
hync
hitin
ae D
epor
aus
betu
lae
(Eng
land
)AT
TE A
ttela
bina
e s
p (C
hina
)AT
TE A
pode
rinae
sp
(Chi
na)
ATTE
Apo
derin
ae A
pode
rus
cory
li (F
ranc
e)B
RE
N s
p1 (C
hina
)B
RE
N A
pion
inae
Rho
pala
pion
long
irost
re (F
ranc
e)B
RE
N N
anop
hyin
ae N
anop
hyes
sp
(Tur
key)
BR
EN
Nan
ophy
inae
Nan
ophy
es m
arm
orat
us (F
ranc
e)B
RAC
Erir
hirin
ini
Ech
inoc
nem
is s
p (A
ustra
lia)
BR
AC B
rach
ycer
inae
Bra
chyc
erus
mur
icat
us (F
ranc
e)B
RAC
Ocl
adiin
ae O
clad
ius
sp (R
SA
)D
RYO
Rhy
ncho
phor
inae
Cos
mop
olite
s so
rdid
us (C
hina
)D
RYO
sp1
(Chi
na)
DR
YO R
hync
hoph
orin
ae S
itoph
ilus
gran
ariu
s (F
ranc
e)D
RYO
Orth
ogna
thin
ae R
hino
stom
us b
arbi
rost
ris (B
eliz
e)P
LAT
Tess
eroc
erin
i D
iapu
s un
ispi
neus
(PN
G)
PLA
T P
laty
podi
ni P
laty
pus
cylin
dric
us (F
ranc
e)B
AGO
Bag
oina
e B
agou
s sp
(Eng
land
)H
YP
E H
yper
ini
Hyp
era
post
ica
(Fra
nce)
EN
TI S
itoni
ni S
itona
line
atus
(Fra
nce)
CY
CL
Dic
hotra
chel
ini
Dic
hotra
chel
us m
anue
li (It
aly)
CY
CL
Rhy
thirr
inin
i R
hyth
irrin
us s
p (R
SA
)C
YC
L R
hyth
irrin
ini
Cis
olea
sp
(Aus
tralia
)C
YC
L A
terp
ini
Rha
dino
som
us s
p (A
ustra
lia)
CY
CL
Ate
rpin
i Pe
lolo
rhin
us s
p (A
ustra
lia)
EN
TI T
ropi
phor
ini
Lept
opiu
s sp
(Aus
tralia
)E
NTI
Tro
piph
orin
i C
atas
arcu
s sp
(Aus
tralia
)E
NTI
Nau
pact
ini
Lito
styl
us p
uden
s (S
aba)
EN
TI N
aupa
ctin
i N
aupa
ctus
xan
thog
raph
us (R
SA
)E
NTI
Oph
ryas
tini
Oph
ryas
tes
sp (U
SA
)E
NTI
Geo
nem
ini
Lach
nopu
s cu
rvip
es (S
aba)
EN
TI G
eone
min
i B
aryn
otus
obs
curu
s (F
ranc
e)E
NTI
Psa
llidi
ini
Psa
llidi
um s
p (T
urke
y)E
NTI
Cra
topi
ni C
rato
pus
sum
ptuo
sus
(La
Reu
nion
)E
NTI
Tan
ymec
ini
Geo
tragu
s sp
(Chi
na)
EN
TI s
p4 (C
hina
)E
NTI
sp2
(Chi
na)
EN
TI s
p1 (C
hina
)E
NTI
Oos
omin
i B
aria
nus
sp (J
uan
de N
ova)
EN
TI s
p3 (C
hina
)E
NTI
Bra
chyd
erin
i S
troph
osom
a sp
(Eng
land
)E
NTI
Bra
chyd
erin
i S
troph
osom
a m
elan
ogra
mm
um (F
ranc
e)E
NTI
Bra
chyd
erin
i B
rach
yder
es ru
gatu
s (C
anar
ies)
EN
TI s
p5 (C
hina
)E
NTI
Lap
aroc
erin
i La
paro
ceru
s fre
yi (C
anar
ies)
EN
TI P
olyd
rusi
ni P
olyd
rusu
s m
argi
natu
s (F
ranc
e)E
NTI
Pol
ydru
sini
Lio
phlo
eus
tess
ulat
us (F
ranc
e)E
NTI
Tra
chyp
hloe
ini
Trac
hyph
loeu
s sp
(Eng
land
)E
NTI
Myo
rhin
ini
sp (R
SA
)E
NTI
Tro
piph
orin
i Tr
opip
horu
s be
rtolin
i (Ita
ly)
EN
TI O
tiorh
ynch
ini
Otio
rhyn
chus
rugo
sost
riatu
s (F
ranc
e)E
NTI
Otio
rhyn
chin
i O
tiorh
ynch
us s
p (E
ngla
nd)
EN
TI O
tiorh
ynch
ini
Otio
rhyn
chus
glo
bulu
s (It
aly)
28
99
100
100
6
4
90
70
100
100
44
4978
28
1810
010
050
36 995
54
40
2410
082
73
100
62
39
613
100
6 21
9610
0
95
4147
55
53
45
34
4210
010
0
100
100
5
100
9310
0
100
100
100
97
100
640
1
Curculionidae sstr
A
Other families
PLA
T P
laty
podi
ni P
laty
pus
sp (E
ngla
nd)
T
TT T
Part
2
TA
RN
SE
F to
RA
NS
EF
tRN
A tr
ansl
ocat
ion
Nod
e pr
esen
t in
stric
t con
sens
us tr
ee
Nod
e co
nsis
tent
with
stri
ct c
onse
nsus
tree
Woo
d-bo
ring
beha
viou
r
AR
NS
EF
to R
NS
AE
F tR
NA
tran
sloc
atio
n
AR
NS
EF
to R
EA
NS
F tR
NA
tran
sloc
atio
n
T T
FIG
5
Con
tin
ued
2230
Gillett et al doi101093molbevmsu154 MBE at U
niversity of East A
nglia on July 24 2014httpm
beoxfordjournalsorgD
ownloaded from
sister clade also containing the Hyperinae (with generallyweak nodal support for this relationship) Three entiminetribes are consistently recovered as monophyletic withstrong nodal support the Otiorhynchini (100 BS)Brachyderini (100 BS) and the Naupactini (100 BS) Thetribe Tropiphorini is apparently paraphyletic because a well-supported clade (95 BS) containing two monophyleticAustralian members (Catasarcus and Leptopius) is itselfsister to the Naupactini with strong support (96 BS) andis only distantly related to the other Tropiphorini species inthe data set (Tropiphorus) which is sister to theOtiorhynchini with strong nodal support (100 BS) AllEntiminae (except Sitona) are marked by an ARNSEF toRANSEF rearrangement in the tRNA cluster discovered inearlier studies (Song et al 2010 Haran et al 2013) and cor-roborated here (fig 5) One taxon Dichotrachelus manueliclassified in Cyclominae by Alonso-Zarazaga and Lyal (1999)also possesses this same rearrangement whereas the remain-ing Cyclominae taxa possess the common gene orderARNSEF Sitona and Hypera were characterized by uniqueRNSAEF and REANSF gene orders respectively first observedby Haran et al (2013) and hypothesized to constitute aninitial step in the evolution of the derived gene order of theEntiminae Here Hypera + Sitona form a clade that is sisterto all others in clade A whereas the Cyclominae (minusDichotrachelus) not represented in Haran et al (2013) andexhibiting the ancestral gene order occupy the next node assister to the remaining Entiminae characterized by the derivedgene order This demonstrates that the gene order changes inHypera and Sitona are independent of those in Entiminae
Within the second main curculionid clade the scolytinetaxon Coptonotus (Coptonotini) is never recovered togetherwith the bulk of the scolytines which except for Scolytini(monophyletic with 100 BS) are consistently recovered ina clade with moderate to high support values of 66ndash100The scolytine tribes Corthylini and Ipini are always recoveredas monophyletic (100 BS support) within this The followinghigher level taxa from the second main Curculionidae cladeare recovered as monophyletic across all analyses (BS sup-ports follow taxon name) Ceutorhynchinae (100) Lixinae(100) Conoderinae Lobotrachelini (100) andCurculioninae Cionini (100) The Cryptorhynchini appearsto be paraphyletic owing to the presence of a sample(Cryptorhynchini sp from Cameroon) falling outside thewell-supported clade (98 BS) comprising all four othergenera analyzed
Discussion
Contig Formation from Pooled Total DNASequencing
Our results provide a clear demonstration of economic effi-cient and reliable sequencing assembly and identification oflarge numbers of mitogenomes from a pool of total DNA ofnumerous samples without any enrichment or PCR amplifi-cation We obtained a complete or near-complete set of pro-tein-coding genes for well over 50 of all samples attemptedOther recent papers attempting to generate full
mitochondrial genomes from total DNA either generated aseparate library for each taxon (Williams et al 2014) or pooledonly a small number of distantly related taxa (Rubinstein et al2013) We have been able to employ the resulting sequencedata to reconstruct a higher level phylogeny of the superfam-ily Curculionoidea that is highly congruent with recent mo-lecular phylogenies and provides additional evidence for theconvergent evolution of specialized wood-boring behaviorand morphology in weevils The method has been exploredpreviously for the analysis of bulk insect samples from a forestcanopy (Crampton-Platt AL Timmermans MJTN GimmelML Kutty SN Cockerill TD Khen CV Vogler AP unpublisheddata) applied to nearly 500 individuals from more than 200species They found that the assembly of mitogenomes frombulk samples is hampered by substantial differences in DNAconcentration for species in the pool due to variation in bothbody size and number of specimens representing a species Inaddition intraspecific variation was found to cause difficultieswith assembly due to polymorphisms mirroring the well-known problem with genome assembly from heterozygotes(eg Langley et al 2011) The design of this study was ex-pected to avoid these problems by normalizing the DNAconcentration in the pool and by selecting a single individualper species However we find that there is no close correlationof sequencing depth and assembly success (fig 4) in accor-dance with Crampton-Platt AL Timmermans MJTN GimmelML Kutty SN Cockerill TD Khen CV and Vogler AP (unpub-lished data) Our study excludes the presence of intraspecificvariation but indicates that there is a sequencing depth atwhich assemblers no longer operate optimally possibly due tothe larger numbers of individual sequencing errors contrib-uted by overlapping reads
A concern of pooled assemblies is the formation of chi-meras by the miss-assembly of different mitogenomes Thepotential for this is expected to increase if closely relatedsamples that may not differ in conserved regions of the mito-genomes are included in the pool The prevalence of chimeraswas tested using 77 taxa for which multiple baits were avail-able In many cases these tests involved both the cytb or rrnLand the two fragments of the cox1 gene that map to distantpositions in the mitogenome We did not observe a singlecase of chimera formation In addition the tree topology gaveno reason to suggest chimeras because of the monophyly ofthe smaller families of Curculionoidea whereas chimera for-mation would also have produced great differences in thelength of terminal branches which were not observed
Phylogenetic Analysis from Densely SampledMitogenomes
Together with existing mitogenome sequences a total of 120terminals were included in the phylogenetic analysis As mito-genome data sets increase with the numbers of taxa neededfor dense sampling this may produce problems with treesearches and model choice Specifically the most complexmodels such as the amino acid-based CAT model used byTimmermans et al (2010) that was required for resolving thedeep-level relationships within the Coleoptera are not
2231
Phylogeny of Weevils (Coleoptera Curculionoidea) doi101093molbevmsu154 MBE at U
niversity of East A
nglia on July 24 2014httpm
beoxfordjournalsorgD
ownloaded from
practical when the number of taxa becomes larger This raisesthe question of what is the value of using complex modelsHaran et al (2013) have shown that likelihood trees of weevilscan be substantially improved under model partitioning ac-cording to 1) codon position and 2) forward versus reversestrand the latter presumably due to the well-established dif-ferences in codon usage on either strand We conducted aformal analysis to test whether this partitioning scheme bystrand and codon captures the most important aspects of thenucleotide variation using the PartitionFinder software start-ing from 41 potential partitions of each codon position withineach gene This could be reduced to the codon positions forall genes on either strands similar to Haran et al (2013) butmaintaining a single partition for the second codon positionon either strand while adding a separate partition for therRNA genes not included in that study The use of these sixpartitions over the full set of 41 partitions led only to a smallreduction in likelihood whereas the unpartitioned modelswere substantially worse (table 2)
A general difficulty for comparing models is that compar-isons are only possible for a single topology but searchesunder different partitions favor different topologies Wetherefore used the optimal trees obtained under no partition-ing and the 6- and 41-partition schemes to assess likelihoodsof the alternative partitioning schemes on those three topol-ogies The likelihoods on all trees for the three models werealmost identical (table 2) indicating that tree topology is nota major deciding factor for the best model Taken at facevalue the 41 partition wins out over the 6 partition schemein all three analyses but the likelihood gain is minor As like-lihood values become very large with the use of numerouswhole mitogenomes AIC values may not be an appropriateapproach to avoid overparameterization unless they are nor-malized for the total likelihood values (Castoe et al 2005) Wetherefore believe the 6-partition scheme is fully adequate Inaddition the practicalities of tree searches on increasinglylarge data sets from full mitogenomes as generated withthe proposed methodology also strongly argue for parameterreduction
Trees obtained from analysis of full mitogenomes were themost robust but those obtained using the subsets of protein-coding genes resulted in good topological approximations tothem (supplementary figs S8 and S9 Supplementary Materialonline) suggesting that phylogenetic signal is largely uniformacross genes and is strengthened with additional data Thiscan be seen by the recovery of certain monophyletic groupssuch as the Cyclominae only possible with the full matrixHowever trees constructed from the ldquobaitrdquo sequences alonewere the least robust due to both the reduced informationcontent (comparable to the reverse strand genes) and toconsiderable missing data
Implications for the Systematics of Weevils
The close relationship linking Platypodinae withDryophthoridae as sister to the Curculionidae s str hasbeen demonstrated multiple times (Marvaldi 1997McKenna et al 2009 Haran et al 2013) and indicates that
the family Curculionidae as presently classified is paraphy-letic The simplified classification system proposed byOberprieler et al (2007) recognizing a broaderCurculionidae also containing the presently definedBrachyceridae and Dryophthoridae as respective subfamilies(sensu Alonso-Zarazaga and Lyal 1999) would be consistentwith our family-level results Our results strongly support therelationships among the curculionoid families at the base ofthe tree which are consistent with most previous molecularanalyses with the exception of the placement ofNemonychidae This family has previously been suggestedto be split off at the most basal node (eg McKenna et al2009) as opposed to Anthribidae in our results but our sam-pling lacks two of the ldquoprimitiverdquo weevil families (Belidae andCaridae) prohibiting a definitive conclusion Our resultsare also consistent with the previously suggested hypothe-sis that the Brentidae are the sister family to all the ldquotrueweevilsrdquo Curculionidae if we include Brachyceridae andDryophthoridae in the latter
A previously described deep split within the true weevilswas confirmed by our substantially increased samplingOne strongly supported clade contains theEntiminae + Cyclominae + Hyperinae and represents themonophyletic and diverse ldquobroad-nosedrdquo weevils so namedbecause of their relatively short and blunt rostrumsRearrangements within the cluster of six tRNA genes are re-stricted to this clade even with our increased taxon coveragefurther supporting its distinctiveness The cyclomine genusDichotrachelus containing the same RANSEF rearrangementas all other Entiminae (except Sitona) in our analysis has beentreated as belonging to the Entiminae by some authors(Meregalli and Osella 2007) on morphological groundsCombined with the low nodal support for its inclusion in amonophyletic Cyclominae (lt50 BS) our tRNA rearrange-ment data are consistent with this opinion The second cladecontaining all other curculionoid subfamilies with the excep-tion of Bagoinae which is placed outside of the two mainclades is much less satisfactorily resolved with only two of itsconstituent subfamilies (Lixinae and Ceutorhynchinae) beingmonophyletic It contains a number of very large subfamiliesincluding the Curculioninae Molytinae BaridinaeCryptorhynchinae and Conoderinae whose relationshipsremain obscure due to a lack of strong nodal supportAlthough the recovery of two tribes within this group beingmonophyletic (Lobotrachelini and Cionini) is encouraging tofurther investigate the confusing topology of this clade sig-nificantly more representative taxon sampling will be re-quired Indeed limitations in taxon sampling are often citedas potentially limiting factors in higher level phylogenetics(Franz and Engel 2010) and this is certainly an importantconsideration in such a large group as the Curculionoidea
An interesting finding is that strong nodal support spansthe full depth of the tree and differing taxonomic ranks (fam-ilies subfamilies and tribes supplementary fig S5Supplementary Material online) This pattern was seen inanalyses of all data sets and under all partitioning modelsA potential criticism of mitochondrial sequence data is thatdue to accelerated evolutionary rates saturation of sites may
2232
Gillett et al doi101093molbevmsu154 MBE at U
niversity of East A
nglia on July 24 2014httpm
beoxfordjournalsorgD
ownloaded from
obscure or distort phylogenetic signal at deeper nodes(Talavera and Vila 2011) It is clear from our data that atleast at the intrasuperfamily level in weevils this is not nec-essarily the case with phylogenetic signal being evenly distrib-uted across the estimated 170 My diversification history ofthe weevils (McKenna et al 2009)
Evolution of Wood-Boring Behavior
The wood-boring weevil subfamilies are highly adapted toexcavate galleries either subcortically or in woody tissueand feed on ligneous matter directly or cultivate symbioticfungi in the tunnels as a food source and for this reasonmany are widespread pests of forestry (Oberprieler et al2007) The taxon density of the current analysis nearlymatched the extensive sampling of the wood-boring groupsby Jordal et al (2011) a study that is the basis for suggestingtheir close affinity However in contrast to Jordal et al (2011)our results support the conclusions of Haran et al (2013) andMcKenna et al (2009) indicating that wood-boring lineagesare clearly not monophyletic with Platypodinae consistentlyretrieved as closely related to the Dryophthoridae (andBrachyceridae) in a clade sister to all other Curculionidaesensu Bouchard et al (2011) Although our analyses recoveredneither the Scolytinae nor the Cossoninae as monophyleticand they were never recovered as sister taxa or nested withinthe same clade we cannot confidently conclude as to therelationship between them because only a series of weaklysupported nodes separate the cossonine taxa and Coptonotusfrom the rest of the Scolytinae The latter genus is interestingfor consistently not being recovered in our analyses within thegenerally well-supported Scolytinae clade (exceptingScolytini) Based on morphological characters Coptonotushas been considered to be a transitional taxon betweenPlatypodinae and other Curculionidae (Jordal et al 2011) oralternatively as an intermediate form between Cossoninaeand Scolytinae (Thompson 1992) while also containing mor-phological characters linking it with Cossoninae Thompson(1992) has suggested a close relationship betweenCoptonotini and the scolytine tribe Hylastini based on struc-tures of the aedeagus However our results argue against thisbecause the Hylastini sample (Hylastes opacus) was retrievedwith strong support as the sister of Tomicini and this cladeitself was strongly supported as sister to the Hylesini withinthe main Scolytinae clade
ConclusionsWe have demonstrated the relative ease of efficiently andeconomically obtaining a large number of mitogenomeDNA sequences from a pooled mixture of DNA extractswithout the need for enrichment or species-specific taggingprior to genome pooling Mitogenome sequences are confi-dently identified to specimen with a limited amount of priormtDNA sequence data for each sample and exhibit no errorwith regard to these bait sequences Our mtDNA genomedata yield phylogenetic relationships that are highly congru-ent with prior expectations and provide phylogenetic signalwith robustly supported nodes across a broad range of lineage
divergence times and taxon diversity from family level togeneric level which are consistent across different data par-titioning schemes
It is evident that the efficiency of our approach will be afunction of the relative concentration of mitochondrial tonuclear DNA within a focal group The average coleopterangenome size is estimated to be approximately 065 Gb plusmn 005(httpwwwgenomesizecom last accessed May 10 2014)Under the assumption that the copy number of mtDNAgenomes does not differ substantially across organisms ourapproach should be of broad utility within insect phyloge-netics where mean nuclear genome size is estimated to be122 Gb plusmn 005 However it may be less efficient for taxa withlarger average nuclear genome sizes (eg crustaceans meannuclear genome size = ~445 Gb plusmn 045) A further consider-ation for the implementation of our approach is taxon sam-pling and the mitogenomic assembly pipeline Our samplingfor the higher level taxonomic relationships within theCurculionoidea provides little challenge for the pipeline asmtDNA genomes sampled from different genera exhibit highDNA sequence divergence Genome divergence facilitatesgenome reassembly from a mixed pool of genome fragmentsand the pipeline efficiency will eventually be compromised asmtDNA genome relatedness increases Our data suggest thatthis limit lies somewhere below an uncorrected divergence of10 for cox1 and cytB that characterizes the two species ofCionus (C olens and C griseus) included in our sampling Toascertain genome relatedness thresholds for the reassemblypipeline simulation analyses can be employed However it isimportant to point out that as NGS technology and readlengths improve relatedness thresholds will also becomemore favorable
Materials and Methods
Taxon Sampling DNA Extraction and Quantification
Throughout this study the most recent higher level classifi-cation of Curculionoidea proposed by Bouchard et al (2011)is adhered to whereas the assignment of genera to higher taxafollows the catalog of Alonso-Zarazaga and Lyal (1999) DNAwas extracted from each ethanol-preserved specimen individ-ually using DNeasy blood and tissue extraction kits (Qiagen)The concentration of double-stranded DNA (dsDNA) in mostextractions (139 of 173) was assayed on a Qubit fluorometerusing a dsDNA high-sensitivity kit (Invitrogen)
ldquoBaitrdquo Sequence PCR
Standard PCR reactions to amplify four different fragments ofmtDNA (cox1 50 ldquobarcode regionrdquo cox1 30 region rrnL andcytb) were undertaken for each of the 173 samples Primersand reaction conditions are listed in supplementary table S10Supplementary Material online PCR products were firstcleaned with a size-exclusion filter (Merck Millipore) andthen Sanger sequenced the resulting bait sequences weresubsequently employed to identify mitogenomic assembliesin the manner detailed below
2233
Phylogeny of Weevils (Coleoptera Curculionoidea) doi101093molbevmsu154 MBE at U
niversity of East A
nglia on July 24 2014httpm
beoxfordjournalsorgD
ownloaded from
Sample Pooling and Sequencing
To minimize the effects of DNA concentration on assemblysuccess across all samples approximately equimolar quanti-ties of genomic DNA from each of the samples were pooledaiming for 10 ng of dsDNA per sample resulting in a DNApool of approximately 15mg This calculation did not con-sider 31 samples which were not quantified because of limitedsample volume For each of these a fixed volume of either 5 or8ml was added to the pool Based on the findings ofCrampton-Platt AL Timmermans MJTN Gimmel ML KuttySN Cockerill TD Khen CV and Vogler AP (unpublished data)where longer insert size was found to result in longer mito-chondrial contigs a TruSeq library was prepared from thepool aiming for an insert size of 800 bp Quantification ofthe final library indicated that the average insert size was790 bp and this was sequenced on a single Illumina MiSeqrun (500-cycle 250 bp paired-end reads version 2 reagent kit)
Mitogenomic Assembly Pipeline
The bioinformatics assembly pipeline used in this study wasdeveloped by Crampton-Platt AL Timmermans MJTNGimmel ML Kutty SN Cockerill TD Khen CV and VoglerAP (unpublished data) and is followed here with minor mod-ifications A list of the software required (most freely available)is given in table 3 and a schematic overview of the principalsteps is presented in figure 6 In brief the raw data weretrimmed of adapters using Trimmomatic (Bolger et al2014) and putative mitochondrial reads were identified in aBLAST search (Altschul et al 1990) against a custom referencedatabase of 258 Coleoptera mitogenomes (E = 1e5 no re-striction in length overlap) (Timmermans MJTN Barton CDodsworth S Haran J Ahrens D Foster PG Bocak L andVogler AP unpublished data) The extracted mtDNA readswere subjected to whole-genome shot-gun assembly usingCelera Assembler (Myers et al 2000) and IDBA-UD (Penget al 2012) and the resulting contigs were filtered again formtDNA hits against the Coleoptera reference library for
sequences of more than 1000 bp overlap at E = 1e5 Bothassemblies were merged using Minimus2 (Sommer et al2007) to combine overlapping sequences from both assem-blers into longer scaffolds
To investigate the relationship between the number ofgenerated sequencing reads and assembly success all readswere mapped onto the obtained contigs using Geneious al-lowing for 2 mismatches a maximum gap size of 3 bp andrequiring a minimum overlap of 100 bp Annotations of eachassembly were conducted by first mapping tRNA genes withCOVE (Eddy and Durbin 1994) after which the intervening
Table 3 List of Software Used for the De Novo Assembly and Analysis of Mitogenomes with their Main Function and Source URL
ldquoAPErdquo package in R Phylogenetic analysis httpape-packageirdfr
aAll URLs were last accessed on May 10 2014
DNA extracon
lsquoBaitrsquo PCR(cox1 cytB rrnL)
Sanger sequencing
Idenfied lsquobaitsrsquo
dsDNA concentraon assay
Equimolar sample pooling
NGS
Mitogenome Assembly
BLAST for mtDNA
Gene annotaon
BLAST idenficaonof mitogenomes
with lsquobaitsrsquo
Phylogeny reconstrucon
FIG 6 Schematic flowchart of the principal steps for the bulk de novoassembly of mitogenomes and identification with PCR-amplified ldquobaitrdquosequences
2234
Gillett et al doi101093molbevmsu154 MBE at U
niversity of East A
nglia on July 24 2014httpm
beoxfordjournalsorgD
ownloaded from
protein and rRNA coding genes were extracted withFeatureExtract 12 (Wernersson 2005) To identify thesegenes the resulting sequences were mapped to theTribolium castaneum mitogenome (GenBank accessionnumber NC_003081) using Geneious and were afterward ex-ported by gene into separate FASTA files Sequences of lessthan one-third of total gene length were discarded
Identification of Mitogenomic Assemblies Using ldquoBaitrdquoSequences
To identify the mitogenomic assemblies by association withtheir respective originating specimen BLAST searches wereconducted for each bait sequence reference against all corre-sponding gene sequences extracted from the mitogenomeassemblies (separately for cox1-50 and 30 regions cytB andrrnL) Only hits with 100 pairwise identity and more than100 bp overlap were considered a successful identificationWhere multiple bait sequences from a single specimenwere available each bait was checked to have hit the samelong assembly unequivocally to test for possible chimeras Ifbaits from a single specimen matched multiple nonoverlap-ping assemblies they presumably correspond to the sameincompletely assembled mitogenome These assemblieswere combined and retained if they included eight or moregenes in total Once mitogenomic assemblies were identifiedthe tRNA gene order in the cluster of six tRNA genes locatedbetween nad3 and nad5 was visually recorded
Sequence Alignment and Data Set Concatenation
The sequences for the genes nad5 nad4 nad4L and nad1which are transcribed on the reverse strand of the mitochon-drial genome were reverse complemented prior to alignmentTwenty-eight additional curculionoid mitogenome sequenceswere obtained from GenBank (primarily those generated byHaran et al [2013] supplementary table S1 SupplementaryMaterial online) to maximize taxon sampling Two membersof Chrysomeloidea were included as outgroups followingHaran et al (2013) The combined sequences from each ofthe separated 13 protein-coding and two rRNA genes wereindividually aligned using the MAFFT 70 online server underthe FFT-NS-I slow iterative refinement strategy (Katoh et al2002) Alignments were thereafter checked manually inGeneious for quality and to ensure that protein-codinggenes were in the correct reading frame Genes were conca-tenated together to make six different data matrices as fol-lows All genes (A) only protein-coding genes (B) all geneswith third codon positions removed from protein-codinggenes (C) protein-coding genes only with third codon posi-tions removed (D) all genes with third codon positions re-moved from protein-coding genes and first codon positionsR-Y coded (E) and only protein-coding genes with thirdcodon positions removed and first codon positions R-Ycoded (F)
Phylogenetic Analyses
Each of the six data sets was analyzed under the ML optimal-ity criterion using RAxML 766 (Stamatakis 2006) run on the
CIPRES web-based server (Miller et al 2010) To assess nodalsupport a rapid BS with 1000 iterations was run in parallelwith tree-building The data sets were each analyzed bothpartitioned by gene and unpartitioned (ie a single partition)Additionally three of the data sets (A B and E) were firsttested using PartitionFinder (Lanfear et al 2012) to objectivelyselect the best-fitting partitioning scheme and model of mo-lecular evolution for each alignment This was performedusing the Bayesian Information Criterion from an initialpartitioning of each of the three codon positions for eachamino acid-coding sequence and each rRNA gene beingseparate partitions The resulting ML trees were made ultra-metric using the chronos function of the APE package in R(Paradis et al 2004) which uses penalized likelihood to fit achronogram to a phylogenetic tree (Paradis 2013) To obtaina measure of the suitability of the mitogenomic data torobustly support relationships across different nodal ages(putative taxonomic ranks) we investigated the distributionof nodal support across trees by calculating the branch lengthfrom the root for each node using a custom R script andplotting this against its respective RAxML BS support Wealso constructed a strict consensus tree from the 15 MLtrees to visualize the distribution of consistent nodesacross all our analyses We performed additional RAxML anal-yses on data sets A and B partitioned by gene and separatecodon positions for each protein-coding gene (41 and 39partitions respectively) and various RAxML analyseson these two data sets with different combinations ofpartitioning schemes and topological constraints assummarized in table 2 in order to calculate the AIC as ameans for preferred model selection (Posada and Buckley2004)
To investigate how successfully subsets of the full-datamatrix were able to reconstruct the phylogeny we also ana-lyzed (using RAxML with data partitioned by gene and byPartitionFinder-derived partitions) three additional data setscomposed of 1) only the reverse-transcribed protein-codinggenes (nad5 nad4 nad4L and nad1) 2) the remaining nineforward-transcribed protein-coding genes and 3) only theavailable ldquobaitrdquo sequences The latter analysis was undertakento ascertain whether there is any benefit in assembling themitogenomes for phylogeny reconstruction over the PCRsequences alone
Compositional heterogeneity was assessed on theprotein-coding genes using the w2 statistics (Swofford 2002)The resulting P value is the probability that the data are ho-mogeneous and is considered significant when less than 5This test suffers from a high probability of Type II error be-cause the test assumes independence of the data which theyare not We therefore also used the test of Foster (2004)which uses simulations based on the ML tree model anddata size to generate a valid null distribution of a w2 valuefrom the original data The ML tree for the concatenated datawas used in all cases when assessing heterogeneity in eachgene with any missing taxa pruned off Model parametersand branch lengths were reoptimized under a GTR + Gmodel
2235
Phylogeny of Weevils (Coleoptera Curculionoidea) doi101093molbevmsu154 MBE at U
niversity of East A
nglia on July 24 2014httpm
beoxfordjournalsorgD
ownloaded from
Supplementary MaterialSupplementary tables S1 S2 S4 S7 and S10 and figures S3 S5S6 S8 and S9 are available at Molecular Biology and Evolutiononline (httpwwwmbeoxfordjournalsorg)
Acknowledgments
The authors are indebted to the following individuals whohave lent or donated weevil specimens used in this studyMax Barclay Roberto Caldara Christiana Faria MichaelGillett Levent Gultekin James Kitson Christopher LyalMassimo Meregalli Rolf Oberprieler Charles OrsquoBrienPedro Oromı Li Ren and Clive Turner They also thankPeter Foster (NHM) for his analytical assistance and twoanonymous reviewers for their constructive commentsThis work was supported by a Natural EnvironmentResearch Council CASE PhD studentship (NEG01194X1)to CPDTG the University of East Anglia and the NaturalHistory Museum the NHM Biodiversity Initiative theLeverhulme Trust (F00696P) and a NERC PostdoctoralFellowship (NEI0215781) to MJTNT
ReferencesAlonso-Zarazaga MA Lyal CHC 1999 A world catalogue of families and
genera of Curculionoidea (Insecta Coleoptera) (excepting Scolytidaeand Platypodidae) Barcelona Entomopraxis
Altschul SF Gish W Miller W Myers EW Lipman DJ 1990 Basic localalignment search tool J Mol Biol 215403ndash410
Bolger AM Lohse M Usadel B 2014 Trimmomatic a flexible trimmerfor Illumina sequence data Bioinformatics Advance Access pub-lished April 12014 doi 101093bioinformaticsbtu170
Botero-Castro F Tilak MK Justy F Catzeflis F Delsuc F Douzery EJP2013 Next-generation sequencing and phylogenetic signal of com-plete mitochondrial genomes for resolving the evolutionary historyof leaf-nosed bats (Phyllostomidae) Mol Phylogenet Evol 69728ndash739
Bouchard P Bousquet Y Davies AE Alonso-Zarazaga MA Lawrence JFLyal CHC Newton AF Reid CAM Schmitt M Slipinski SA et al2011 Family-group names in Coleoptera (Insecta) Zookeys 881ndash972
Bernt M Bleidorn C Braband A Dambach J Donath A Fritzsch GGolombek A Hadrys H Juhling F Meusemann K et al 2013 Acomprehensive analysis of bilateran mitochondrial genomes andphylogeny Mol Phylogenet Evol 69352ndash364
Cameron SL 2014 Insect mitochondrial genomics implications for evo-lution and phylogeny Annu Rev Entomol 5995ndash117
Cameron SL Lo N Bourguignon T Svenson GJ Evans TA 2012 Amitochondrial genome phylogeny of termites (BlattodeaTermitoidae) robust support for interfamilial relationships and mo-lecular synapomorphies define major clades Mol Phylogenet Evol 65163ndash173
Castoe TA Sasa MM Parkinson C 2005 Modeling nucleotide evolutionat the mesoscale the phylogeny of the neotropical pitvipers of thePorthidium group (Viperidae Crotalinae) Mol Phylogenet Evol 37881ndash898
Crowson RA 1955 The natural classification of the families ofColeoptera London Nathaniel Lloyd amp Co
Franz NM Engel MS 2010 Can higher-level phylogenies of weevils ex-plain their evolutionary success A critical review Syst Entomol 35597ndash606
Funk DJ Omland KE 2003 Species-level paraphyly and polyphyly fre-quency causes and consequences with insights from animal mito-chondrial DNA Annu Rev Ecol Evol Syst 34397ndash423
Haran J Timmermans MJTN Vogler AP 2013 Mitogenome se-quences stabilize the phylogenetics of weevils (Curculionoidea)and establish the monophyly of larval ectophagy Mol PhylogenetEvol 67156ndash166
Hundsdoerfer AK Rheinheimer J Wink M 2009 Towards the phylogenyof the Curculionoidea (Coleoptera) reconstructions from mito-chondrial and nuclear ribosomal DNA sequences Zool Anz 2489ndash31
Jordal BH Sequeira AS Cognato AI 2011 The age and phylogeny ofwood boring weevils and the origin of subsociality Mol PhylogenetEvol 59708ndash724
Katoh K Misawa K Kuma K Miyata T 2002 MAFFT a novel methodfor rapid multiple sequence alignment based on fast Fourier trans-form Nucleic Acids Res 303059ndash3066
Kayal E Roure B Philippe H Collins AG Lavrov DV 2013 Cnidarianphylogenetic relationships as revealed by mitogenomics BMC EvolBiol 135
Kuschel G 1995 A phylogenetic classification of Curculionoideato families and subfamilies Mem Entomol Soc Washington 145ndash33
Lanfear R Calcott B Ho SYW Guindon S 2012 PartitionFinder com-bined selection of partitioning schemes and substitution models forphylogenetic analyses Mol Biol Evol 291695ndash1701
Langley CH Crepeau M Cerdeno C Corbett-Detig R Stevens K 2011Circumventing heterozygosity sequencing the amplified genome ofa single haploid Drosophila melanogaster embryo Genetics 188239ndash246
Marvaldi AE 1997 Higher level phylogeny of Curculionidae (Coleoptera Curculionoidea) based mainly on larval characters with special ref-erence to broad-nosed weevils Cladistics 13285ndash312
McKenna DD Sequeira AS Marvaldi AE Farrell BD 2009 Temporal lagsand overlap in the diversification of weevils and flowering plantsProc Natl Acad Sci U S A 1067083ndash7088
Meregalli M Osella G 2007 Dichotrachelus kahleni sp n a new weevilspecies from the Carnian Alps north-eastern Italy (ColeopteraCurculionidae Entiminae) Deut Entomol Z 54169ndash177
Miller MA Pfeiffer W Schwartz T 2010 Creating the CIPRES ScienceGateway for inference of large phylogenetic trees In Proceedings ofthe Gateway Computing Environments Workshop (GCE) 2010 Nov14 New Orleans (LA) IEEE p 1ndash8
Myers EW Sutton CG Delcher AL Dew IM Fasulo DP Flanigan MJKravitz SA Mobarry CM Reinert KH Remington KA et al 2000 Awhole-genome assembly of Drosophila Science 2872196ndash2204
Osigus H-J Eitel M Bernt M Donath A Schierwater B 2013 Mitoge-nomics at the base of Metazoa Mol Phylogenet Evol 69339ndash351
Pacheco MA Battistuzzi FU Lentino M Aguilar RF Kumar S EscalanteAA 2011 Evolution of modern birds revealed by mitogenomicstiming the radiation and origin of major orders Mol Biol Evol 281927ndash1942
Papadopoulou A Anastasiou I Vogler AP 2010 Revisiting the insectmitochondrial molecular clock the mid-Aegean trench calibrationMol Biol Evol 271659ndash1672
Paradis E 2013 Molecular dating of phylogenies by likelihood methodsa comparison of models and a new information criterion MolPhylogenet Evol 67436ndash444
Paradis E Claude J Strimmer K 2004 APE analyses of phylogenetics andevolution in R language Bioinformatics 20289ndash290
Peng Y Leung HCM Yiu SM Chin FYL 2012 IBDA-UD a de novoassembler for single-cell and metagenomic sequencing data wothhighly uneven depth Bioinformatics 281420ndash1428
2236
Gillett et al doi101093molbevmsu154 MBE at U
niversity of East A
nglia on July 24 2014httpm
beoxfordjournalsorgD
ownloaded from
Pons J Ribera I Bertranpetit J Balke M 2010 Nucleotide substitutionrates for the full set of mitochondrial protein-coding genes inColeoptera Mol Phylogenet Evol 56796ndash807
Posada D Buckley T 2004 Model selection and model averaging inphylogenetics advantages of Akaike information criterion andBayesian approaches over likelihood ratio tests Syst Biol 53793ndash808
Roos J Aggarwal RK Janke A 2007 Extended mitogenomic phylogeneticanalyses yield new insight into crocodylian evolution and their sur-vival of the Cretaceous-Tertiary boundary Mol Phylogenet Evol 45663ndash673
Rubinstein ND Feldstein T Shenkar N Botero-Castro F Griggio FMastrototaro F Delsuc F Douzery EJP Gissi C Huchon D 2013Deep sequencing of mixed total DNA without barcodes allows ef-ficient assembly of highly plastic Ascidian mitochondrial genomesGenome Biol Evol 51185ndash1199
Sheffield NC Song H Cameron SL Whiting MF 2008 A comparativeanalysis of mitochondrial genomes in Coleoptera (ArthropodaInsecta) and genome descriptions of six new beetles Mol BiolEvol 252499ndash2509
Sheffield NC Song H Cameron SL Whiting MF 2009 Nonstationaryevolution and compositional heterogeneity in beetle mitochondrialphylogenetics Syst Biol 58381ndash394
Sommer DD Delcher AL Salzberg SL Pop M 2007 Minimus a fastlightweight genome assembler BMC Bioinformatics 864
Song HJ Sheffield NC Cameron SL Miller KB Whiting MF 2010 Whenphylogenetic assumptions are violated base compositional hetero-geneity and among-site rate variation in beetle mitochondrial phy-logenomics Syst Entomol 35429ndash448
Stamatakis A 2006 RAxML-VI-HPC maximum likelihood-based phylo-genetic analyses with thousands of taxa and mixed modelsBioinformatics 222688ndash2690
Swofford DL 2002 PAUP phylogenetic analysis using parsimony(and other methods) Version 4 Sunderland (MA) SinauerAssociates
Talavera G Vila R 2011 What is the phylogenetic signal limitfrom mitogenomes The reconciliation between mitochondrialand nuclear data in the Insecta class phylogeny BMC Evol Biol 11315
Thompson RT 1992 Observations on the morphology and classificationof weevils (Coleoptera Curculionoidea) with a key to major groups JNat Hist 26835ndash891
Timmermans MJTN Dodsworth S Culverwell CL Bocak L Ahrens DLittlewood DTJ Pons J Vogler AP 2010 Why barcode High-throughput multiplex sequencing of mitochondrial genomes formolecular systematics Nucleic Acids Res 381ndash14
Wei S-j Shi M Sharkey MJ van Achterberg C Chen X-X 2010Comparative mitogenomics of Braconidae (InsectaHymenoptera) and the phylogenetic utility of mitochondrial ge-nomes with special reference to holometabolous insects BMCGenomics 11371
Wernersson R 2005 FeatureExtractmdashextraction of sequence annotationmade easy Nucleic Acids Res 33W567ndashW569
Williams S Foster PG Littlewood DTJ 2014 The complete mitochon-drial genome of a turbinid vetigastropod from MiSeq Illumina se-quencing of genomic DNA and steps towards a resolved gastropodphylogeny Gene 53338ndash47
Winkelmann I Campos PF Strugnell J Cherel Y Smith PJKubodera T Allcock L Kampmann M-L Schroeder H GuerraA et al 2013 Mitochondrial genome diversity and populationstructure of the giant squid Architeuthis genetics sheds newlight on one of the most enigmatic marine species Proc R SocB 2801759
2237
Phylogeny of Weevils (Coleoptera Curculionoidea) doi101093molbevmsu154 MBE at U
niversity of East A
nglia on July 24 2014httpm
beoxfordjournalsorgD
ownloaded from
Pons J Ribera I Bertranpetit J Balke M 2010 Nucleotide substitutionrates for the full set of mitochondrial protein-coding genes inColeoptera Mol Phylogenet Evol 56796ndash807
Posada D Buckley T 2004 Model selection and model averaging inphylogenetics advantages of Akaike information criterion andBayesian approaches over likelihood ratio tests Syst Biol 53793ndash808
Roos J Aggarwal RK Janke A 2007 Extended mitogenomic phylogeneticanalyses yield new insight into crocodylian evolution and their sur-vival of the Cretaceous-Tertiary boundary Mol Phylogenet Evol 45663ndash673
Rubinstein ND Feldstein T Shenkar N Botero-Castro F Griggio FMastrototaro F Delsuc F Douzery EJP Gissi C Huchon D 2013Deep sequencing of mixed total DNA without barcodes allows ef-ficient assembly of highly plastic Ascidian mitochondrial genomesGenome Biol Evol 51185ndash1199
Sheffield NC Song H Cameron SL Whiting MF 2008 A comparativeanalysis of mitochondrial genomes in Coleoptera (ArthropodaInsecta) and genome descriptions of six new beetles Mol BiolEvol 252499ndash2509
Sheffield NC Song H Cameron SL Whiting MF 2009 Nonstationaryevolution and compositional heterogeneity in beetle mitochondrialphylogenetics Syst Biol 58381ndash394
Sommer DD Delcher AL Salzberg SL Pop M 2007 Minimus a fastlightweight genome assembler BMC Bioinformatics 864
Song HJ Sheffield NC Cameron SL Miller KB Whiting MF 2010 Whenphylogenetic assumptions are violated base compositional hetero-geneity and among-site rate variation in beetle mitochondrial phy-logenomics Syst Entomol 35429ndash448
Stamatakis A 2006 RAxML-VI-HPC maximum likelihood-based phylo-genetic analyses with thousands of taxa and mixed modelsBioinformatics 222688ndash2690
Swofford DL 2002 PAUP phylogenetic analysis using parsimony(and other methods) Version 4 Sunderland (MA) SinauerAssociates
Talavera G Vila R 2011 What is the phylogenetic signal limitfrom mitogenomes The reconciliation between mitochondrialand nuclear data in the Insecta class phylogeny BMC Evol Biol 11315
Thompson RT 1992 Observations on the morphology and classificationof weevils (Coleoptera Curculionoidea) with a key to major groups JNat Hist 26835ndash891
Timmermans MJTN Dodsworth S Culverwell CL Bocak L Ahrens DLittlewood DTJ Pons J Vogler AP 2010 Why barcode High-throughput multiplex sequencing of mitochondrial genomes formolecular systematics Nucleic Acids Res 381ndash14
Wei S-j Shi M Sharkey MJ van Achterberg C Chen X-X 2010Comparative mitogenomics of Braconidae (InsectaHymenoptera) and the phylogenetic utility of mitochondrial ge-nomes with special reference to holometabolous insects BMCGenomics 11371
Wernersson R 2005 FeatureExtractmdashextraction of sequence annotationmade easy Nucleic Acids Res 33W567ndashW569
Williams S Foster PG Littlewood DTJ 2014 The complete mitochon-drial genome of a turbinid vetigastropod from MiSeq Illumina se-quencing of genomic DNA and steps towards a resolved gastropodphylogeny Gene 53338ndash47
Winkelmann I Campos PF Strugnell J Cherel Y Smith PJKubodera T Allcock L Kampmann M-L Schroeder H GuerraA et al 2013 Mitochondrial genome diversity and populationstructure of the giant squid Architeuthis genetics sheds newlight on one of the most enigmatic marine species Proc R SocB 2801759
2237
Phylogeny of Weevils (Coleoptera Curculionoidea) doi101093molbevmsu154 MBE at U