94


Bulletin of Romanian Chemical Engineering Society, Vol 3, No 2, 2016 ISSN 2360-4697
1
Contents
Gabriela Muntianu, Ana Maria Georgescu, Ileana Denisa Nistor, Gheorghiţa Jinescu, Ammonia adsorption kinetics on clay particles in fluidized……………...2
Mihai Cernat, Oana Cristina Pârvulescu, Tănase Dobre, Ioana Maior, Optimization of volatile organic compounds removal by packed-bed absorption………..……12
Tănase Dobre, Oana Cristina Pârvulescu, Diana Matei, On the convective drying of gypsum boards………………………………………………………………...29
Sanziana Radulescu, Loredana I. Negoiţă, Practices for reducing exhaust flue gas temperature in refinery furnaces. Case study……………………………………41
Cristian Pătrăşcioiu, Cao Minh Ahn, Trends into the propylene – propane distillation simulation using unisim design simulator……………………..….…48
Maria Popa, Studies on the germination change of plants after decontamination of soils that are polluted with crude oil………………………………………….…57
Gabriela Stan, New waste management solutions from mining industry……..….64
Gabriela Stan, Minimizing the impact upon the environment by processing the sludge from waste water treatment plants of domestic wastewaters…………….69
Casen Panaitescu, Increasing the degree of treatment for COD and BOD using AQUA MICROPAN PE type microorganisms in combination with activated sludge…………………………………………………………………………….74 Casen Panaitescu, Gabriela Stan, The implementation of the coagulation– flocculation process in the leachate treatment from ecological landfills……..…81
Personalities in Chemical and Biochemical Engineering: Professor Gheorghe Maria – teacher and scientist…………………………………………………....88

Bulletin of Romanian Chemical Engineering Society, Vol 3, No 2, 2016 ISSN 2360-4697
2
AMMONIA ADSORPTION KINETICS ON CLAY PARTICLES IN FLUIDIZED BED
Gabriela MUNTIANU1*, Ana Maria GEORGESCU1, Ileana Denisa NISTOR1, Gheorghiţa JINESCU2
1 University “Vasile Alecsandri” of Bacău, Chemical and Food Engineering Department, 157 Mărășești street, Bacău, 600115, Romania, 2 University Politehnica of Bucharest, Chemical and Biochemical Engineering Department, 1-7 Polizu Gh. Street, 011061, Bucharest, Romania
Abstract The aim of this paper is to use the commercial clay particles in ammonia adsorption in
fluidized bed. The commercial clays were characterized and then used in adsorption processes in different conditions. Three characterization analyses were performed: X-ray diffraction for mineralogical composition determination, laser diffraction for the particle size and average diameter determination and thermo gravimetric analysis for the thermal behavior of the clays. To intensify the adsorption process, fluidized bed was used at different fluidization degree for improving the gas-particles contact. Mixing the clay particles leads to a higher surface contact with the ammonia. The experimental researchers conclude that the commercial clays are good adsorbents for ammonia.
Key words: commercial clay, fluidization degree, ammonia, adsorption capacity
1. Introduction
Clay minerals are natural materials, bentonite being the commercial one [1]. Clays can be used as adsorbents, catalysts, auxiliary materials in many domains: construction, food industry, pharmaceutical and cosmetic industry, ceramic industry, chemicals [2]. If the clay contains Na- ions in majority at surface, the clay is named sodium bentonite [3] and if the majority is Ca2+ ions, the clay is named calcium bentonite [4, 5]. The clays can be structurally modified by different methods: alkaline activation, acid activation, pillaring processes with cations [1, 2, 6].
In this study the clay particles are used as adsorbents for ammonia in the fluidized bed. The fluidized bed is used to intensify the mass transfer due to dynamic conditions. Adsorbent particles are maintained in suspension by the gaseous pollutant (ammonia) and mixing the particles in the bed leads to a higher surface contact with ammonia [3]. Figure 1 presents the gas-particles contact in *Corresponding author: [email protected]

Gabriela Muntianu, Ana Maria Georgescu, Ileana Denisa Nistor, Gheorghita Jinescu
3
fluidized bed. The fluidized bed takes place when a gas flow is injected in the particle layer. The behavior of the particles depends on the gas velocity.
Fig. 1. Gas-particles contact in fluidized bed
The adsorption processes have to be characterized by a homogeneous and uniform distribution of the particles in the bed. The gas bubbles appear in bed, it will incorporate the particles and mass transfer is affected at the higher gas velocity. Therefore, the knowledge of the dynamic parameters is extremely important to create optimum conditions for adsorption processes. The adsorbent used in fluidized bed will exhibit its surface contact with the gas. Thus, the adsorbed molecules will be able to migrate in the particle through the pores [3, 7].
2. Experimental
Materials
Three commercial clays were studied: sodium bentonite (NaB-com), calcium bentonite (CaB-com) and pillared bentonite with aluminum cations (PILC-com). The provider and technical characteristics of bentonite are shown in Table 1.
Table 1. Technical characteristics of the materials used
Materials Provider Technical characteristics*
Color pH Humidity (%) NaB-com Alfa-Aesar yellow 7 11.4 CaB-com Bentonita S.A. yellow-white 6.5-7.5 Max. 6 PILC-com Sigma-Aldrich white 4-5 4-8
* Values are extracted from technical data sheet of provider
Characterization methods
The commercial clays were characterized through X-ray diffraction with a Siemens D5000 diffractometer (Cu-Kα).
The average diameter and the particle size of the commercial clays were performed using a laser particle size Ankersmid analyzer. Samples were carried out by wet immersion (in water) at concentration of 3 mg·mL-1. The operating

Ammonia adsorption kinetics on clay particles in fluidized bed
4
temperature was 230C, the frequency of optocoupler was 200 Hz and the speed rotation, 12000 rpm. The measuring level is 0.1 to 300 μm.
Thermogravimetric analyses were performed with a Mettler Toledo device TGA/SDTA 851. The commercial clays were precisely weighted and heated from 250C to 9000C, with an increasing temperature rate of 100C min-1, under a nitrogen atmosphere at a flow rate of 40 mL ∙ min-1.
Preparation of the adsorbent layer
The absorbent layer used in the adsorption processes is formed from NaB-com, CaB-com or PILC-com. NaB-com and CaB-com adsorbents are clay pellets with very pulverulent characteristics; PILC-com has the same characteristics as the others, but it does not swell in water. In order to obtain high particle size with mechanical resistance in fluidization, the clays NaB-com and CaB-com are agglomerated with distilled water (mass ratio 1:3), dried at 1100C for 42 hours and then ground [8].
Therefore, the PILC-com needs a binder. PILC-com and CaB-com (the binder) are mixed (mass ratio 1:1), agglomerated, dried and ground. The physical properties of the obtained material are modified and therefore the clay is denoted PILC-ads. Before to start the experiment, the adsorbent particles were dried at a temperature of 1200C, for at least 8 hours, to remove any traces of volatile compounds or water molecules, and then cooled to ambient temperature.
Determination of physical properties of adsorbents
Average bulk densities ( p ) of the used adsorbents have been determined
by volumetric mass method: the dried particles are weighted ( pm ) and placed into
graduated cylinder with known volume of volatile substance – cyclohexane ( 1V ). It is necessary to remove as possible the bubbles and to read the new particle volume ( 2V ). The average density is calculated by the equation:
12 VV
mpp (1)
Specific surface area ( spS ) was calculated by Brunauer Emmett and Teller
(BET) technique using a Beckman Coulter SA 3100 and the average diameter
( pd ) of the adsorbents was determined by particles sieving with a device type Retsch Fisher AS 200.
The preparation of the samples for BET analysis and the determination of the sizes distribution into granulometric classes have been described in previous publication [7].
Gabriela Muntianu, Ana Maria Georgescu, Ileana Denisa Nistor, Gheorghita Jinescu
5
Adsorption principle and experimental setup
The study of adsorption capacity of a gaseous pollutant (ammonia) on the three commercial types of clays has been carried out in the same laboratory pilot plant used in previous publications [3, 7]. The experimental research methodology consists in contacting of ammonia (99,95% purity) with commercial clay particles up to saturation in fluidized bed.
The ammonia is the gaseous pollutant found in mixture with air. Before the adsorption experiments starting is to achieve an initial concentration (C0=constant). At certain time intervals, the samples with ammonia were taken out of the adsorption column and the final concentration were determined (C). The kinetic of ammonia adsorption takes place until the final concentration will be approximately equal to the initial concentration. The adsorption capacity is calculated in the saturation conditions [7, 9, 10] - the bed particles are saturated in ammonia. The concentration in ammonia is quantitatively determined by the micro-gas chromatograph Agilent 3000A MicroGC [11].
3. Results and discussions
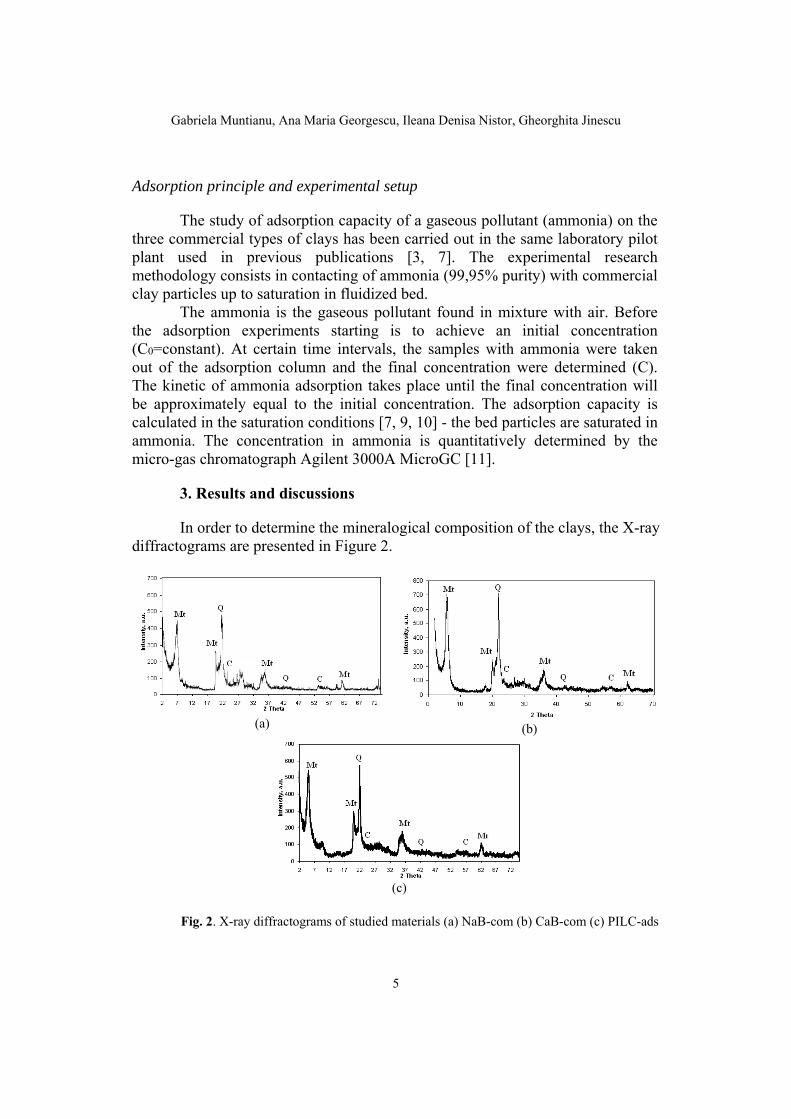
In order to determine the mineralogical composition of the clays, the X-ray diffractograms are presented in Figure 2.
(a)
(b)
(c)
Fig. 2. X-ray diffractograms of studied materials (a) NaB-com (b) CaB-com (c) PILC-ads

Ammonia adsorption kinetics on clay particles in fluidized bed
6
This analysis confirmed that all analyzed clays are constituted by montmorillonite (Mt), cristobalite (C) and quartz (Q). The Mt is the pure clay and the rest are considered impurities.
Table 2 presents the statistic data obtained from granulometric analysis.
Table 2. Statistical data obtained from granulometric analysis
NaB-com Average diameter:
Value (μm)
STD (μm)
Conf. (%)
Size:
D10 (μm)
D50 (μm)
D90 (μm)
Mode (μm)
Length, D[1,0] 24.76 23.64 45.65 Number 10.89 17.43 40.03 10.30 Length weighted, D[2,1]
47.32 47.08 44.00 Length 12.68 27.54 124.48 13.87
Area, D[2,0] 34.23 Area weighted, D[3,2]
94.16 63.59 60.95 Area 19.22 81.06 195.84 200.00
Volume, D[3,0] 47.96 Volume weighted, D[4,3]
137.10 56.78 83.85 Volume 48.95 152.42 200.59 200.00
CaB-com Length, D[1,0] 21.14 13.12 75.49 Number 10.89 16.24 38.25 12.68 Length weighted, D[2,1]
29.28 18.91 73.59 Length 12.08 22.19 57.87 12.68
Area, D[2,0] 24.88 Area weighted, D[3,2]
41.49 23.57 79.58 Area 15.05 37.06 75.71 63.22
Volume, D[3,0] 29.51 Volume weighted, D[4,3]
54.88 25.18 88.39 Volume 21.60 51.33 96.53 100.69
PILC-ads Length, D[1,0] 20.57 13.39 75.69 Number 10.89 16.24 35.87 11.49 Length weighted, D[2,1]
29.28 21.30 70.35 Length 12.08 21.60 57.87 11.49
Area, D[2,0] 24.54 Area weighted, D[3,2]
44.78 28.69 76.43 Area 15.05 37.06 89.39 87.01
Volume, D[3,0] 29.99 Volume weighted, D[4,3]
63.16 30.21 88.77 Volume 22.79 60.25 105.45 87.01
Gabriela Muntianu, Ana Maria Georgescu, Ileana Denisa Nistor, Gheorghita Jinescu
7
The average diameter values are determined according to: length, length weighted, area, area weighted, volume and volume weighted of the clay particles. The particle size values are determined according to: the number of particles, length, surface area and volume.
In the case of NaB-com material, the average diameter depending on length is 24.76 μm (medium value); 23.64 μm is the standard deviation (STD) and 45.65% the confidence level (Conf.). Repeating the same analysis, the following results are obtained: 10% of the particles shows a particles size under 10.89 μm (D10), 50% of the particles shows a particles size under 17.43μm (D50) and 90% of the particles shows a particles size under 40.03 μm (D90).
This analysis demonstrates that the particles are very pulverulent and cannot be used in this form in adsorption process; unless these particles will be agglomerated with known amounts of distilled water, dried and ground.
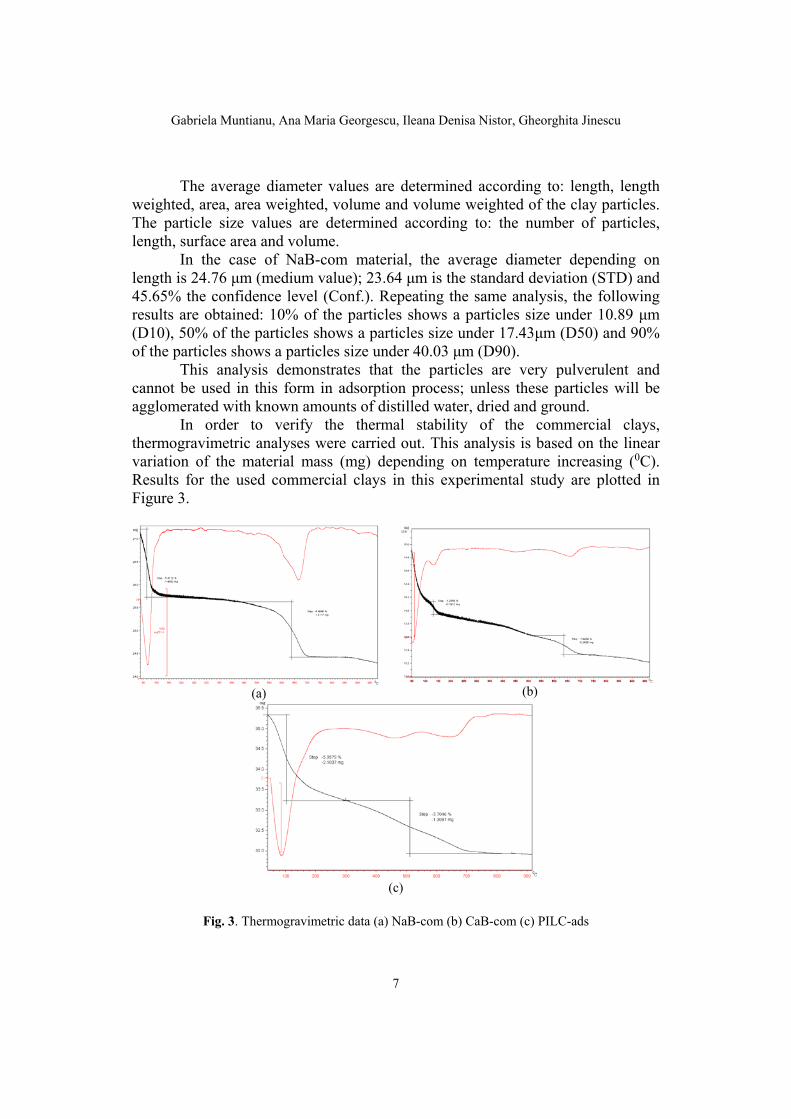
In order to verify the thermal stability of the commercial clays, thermogravimetric analyses were carried out. This analysis is based on the linear variation of the material mass (mg) depending on temperature increasing (0C). Results for the used commercial clays in this experimental study are plotted in Figure 3.
(a)
(b)
(c)
Fig. 3. Thermogravimetric data (a) NaB-com (b) CaB-com (c) PILC-ads
Ammonia adsorption kinetics on clay particles in fluidized bed
8
The used materials present the similar behavior with the same profile concerning the mass loss with increasing the temperature. The curves show a thermal degradation in two steps. Changes that occur in the structure of these materials are reversible to a temperature of 4000C when the interlamellar water is removing. At temperatures above 6000C, the structure of the clay is irreversibly changed, and at temperatures of 8500C the entirely clay passes to other stages.
Table 3 presents the physical properties (average bulk density - p ,
specific surface area - spS , average diameter - pd ) of used clays in the
adsorption study. Table 3.
Physical properties of the used materials in adsorption
Clay particles Physical properties
p (kg·m-3) spS (m2·g-1) pd (10-3, m)
NaB-com 1200 16,88 1,5 CaB-com 1700 46,52
PILC-ads 1015 225
Adsorption kinetics
Adsorption tests were performed in fluidized bed. For fluidized bed the minimum fluidization velocity (Umf) was determined experimentally. The minimum fluidization velocity was determined by observation of clay particles movement in the bed in different conditions.
Taking into account the physical properties of the particles (Table 3), the minimum fluidization velocity, depending on the height of the layer (L0) and the fluidization degree (Z), was determined. The results are presented in Table 4.
Table 4.
Minimum fluidization velocity of the commercial clays
Clay particles L0 (∙ 10-2 m) Z (-) Umf (m∙s-1)
NaB-com 5
1 0.46 1.1 0.51
10 1.1 0.56
CaB-com 5
1 0.50 1.1 0.55
10 1.1 0.60
PILC-ads 5 1 0.28
1.1 0.31 Ammonia adsorption capacity (qads) represents the maximum amount of
ammonia which the particles layer can adsorb, and is expressed in mmol of gas/gram of clay [7].

Gabriela Muntianu, Ana Maria Georgescu, Ileana Denisa Nistor, Gheorghita Jinescu
9
1. Influence of the type of commercial clay in fluidized bed
Ammonia adsorption was carried out in two ways: - when, the fluidization degree is 1, the minimum fluidization velocity
corresponds with the gas velocity (Umf=Ug), incipient fluidization takes place. The bed is in expanded state, the clay particles begin to fluidize with a slightly vibration without gas bubbles.
- when, the fluidization degree is 1.1 (Umf<Ug), the fluidization of the particles with small gas bubbles is developed.
The contact of ammonia with the clay particles is carried out very fast. The adsorption is performed on the surface of the adsorbent. Adsorption processes is the consequence of the field force existing on the clay surface for the ammonia molecules.
The clays have special spaces for the retention of ammonia. The influence of the type of commercial clay on ammonia adsorption capacity is shown in Figure 4. The highest adsorption capacity is represented by PILC-ads of 1.24 mmol ∙ g-1 at Z=1 and 1.26 mmol ∙ g-1 at Z=1.1.
The NaB-com and CaB-com clays at fluidization degree equal to 1, the adsorption capacity is 0.60 mmol ∙ g-1 and 0.96 mmol ∙ g-1; and at fluidization degree of 1.1 the obtained results are: 0.43 mmol ∙ g-1 and 0.73 mmol ∙ g-1.
The best gas-particle contact was obtained at Z=1 because the particles are in a controlled fluidization and the gas covers the entire surface of the particle.
(a) (b)
Fig. 4. Ammonia adsorption kinetics for the commercial clays with md p3105,1 and
mL 20 105 (a) Z=1 (b) Z=1.1
In the case of Z=1.1, gas bubbles are produced and the adsorption capacity
is affected.
Ammonia adsorption kinetics on clay particles in fluidized bed
10
2. Influence of the quantity of commercial clays
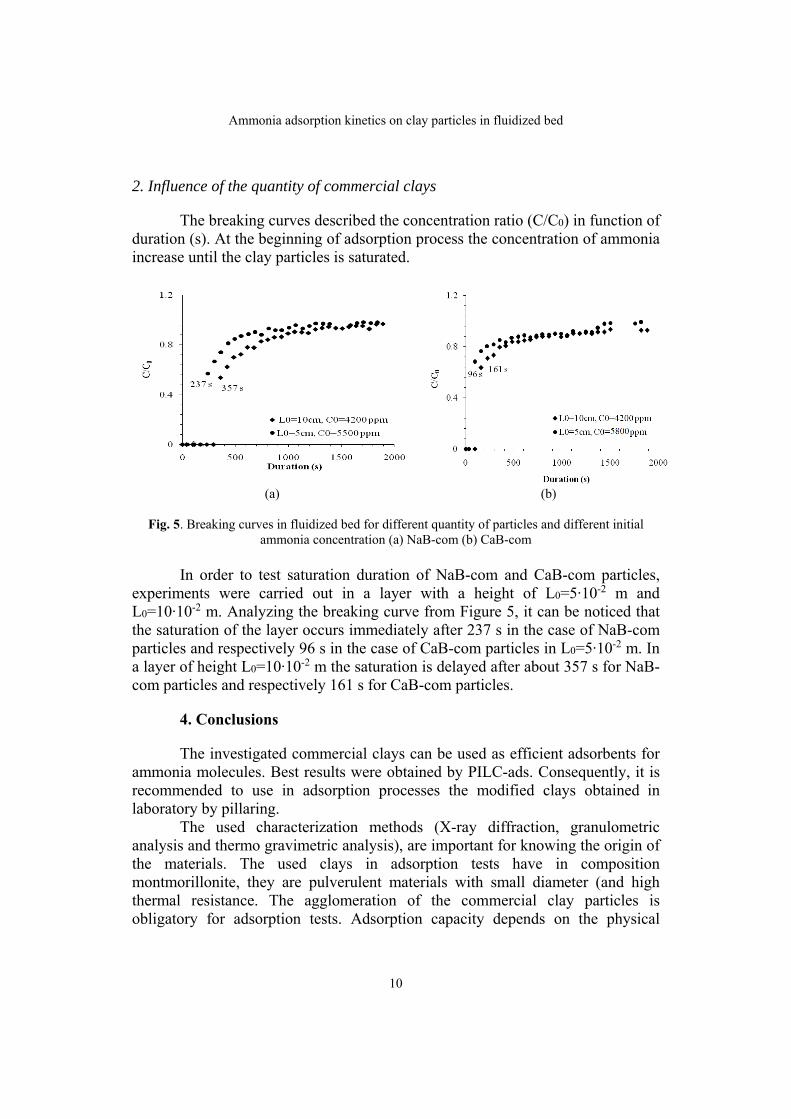
The breaking curves described the concentration ratio (C/C0) in function of duration (s). At the beginning of adsorption process the concentration of ammonia increase until the clay particles is saturated.
(a) (b)
Fig. 5. Breaking curves in fluidized bed for different quantity of particles and different initial ammonia concentration (a) NaB-com (b) CaB-com
In order to test saturation duration of NaB-com and CaB-com particles,
experiments were carried out in a layer with a height of L0=5∙10-2 m and L0=10∙10-2 m. Analyzing the breaking curve from Figure 5, it can be noticed that the saturation of the layer occurs immediately after 237 s in the case of NaB-com particles and respectively 96 s in the case of CaB-com particles in L0=5∙10-2 m. In a layer of height L0=10∙10-2 m the saturation is delayed after about 357 s for NaB-com particles and respectively 161 s for CaB-com particles.
4. Conclusions
The investigated commercial clays can be used as efficient adsorbents for ammonia molecules. Best results were obtained by PILC-ads. Consequently, it is recommended to use in adsorption processes the modified clays obtained in laboratory by pillaring.
The used characterization methods (X-ray diffraction, granulometric analysis and thermo gravimetric analysis), are important for knowing the origin of the materials. The used clays in adsorption tests have in composition montmorillonite, they are pulverulent materials with small diameter (and high thermal resistance. The agglomeration of the commercial clay particles is obligatory for adsorption tests. Adsorption capacity depends on the physical

Gabriela Muntianu, Ana Maria Georgescu, Ileana Denisa Nistor, Gheorghita Jinescu
11
properties of the particles. Therefore, it is necessary to know the average bulk density, the specific surface area and the average diameter.
To obtain high efficiency of absorption in a fluidized bed regime is necessary to use heights layer of particles (L0<10∙10-2 m) to avoid the saturation immediately. Authors have in attention to use in the future work the magnetic field for stabilizing the adsorption bed. In this case, a multilayer bed consisting from a mixture of clays and magnetic particles will be prepared.
Acknowledgement: The authors thank to Prof. Gholamreza Djelveh for the realization of experiments at pilot plant from Clermont Université, ENSCCF, France.
REFERENCES
[1] Platon N., Siminiceanu I., Nistor I.D., Silion M., Jinescu C., Harrouna M., Azzouz A., Catalytic Wet Oxidation of Phenol with Hydrogen Peroxide over Modified Clay Minerals, Rev. Chim., 64, no. 12, 1459-1464, 2013.
[2] Georgescu A.M., Brabie G., Nistor I.D., Penot C., Nardou F., Synthesis and Characterization of Cr-pillared Clay: Modeling using Factorial Design Methodology, Journal of Porous Materials, 22, Iss. 4, 1009-1019, 2015.
[3] Muntianu G., Ursu A.V., Jinescu C., Djelveh G., Nistor I.D., Jinescu G., Intensification of Ammonia Adsorption Kinetics using Al-Pillared Clay Particles in a Co-axial Magnetic Fluidized Bed, Rev. Chim., 66, no. 3, 295-298, 2015.
[4] Ursu A.V., Jinescu G., Gros F., Nistor I.D., Miron N.D., Lisa G., Silion M., Djelveh G., Azzouz A., Thermal and Chemical Stability of Romanian Bentonite, Journal of Thermal Analysis and Calorimetry, vol. 106, Iss. 3, 965-971, 2011.
[5] Georgescu A.M., Muntianu G., Nistor I.D., Nardou F., Modeling and Optimization of Pillared Process Using Experimental Design Procedure, Ponte Journal, Vol. 72, no. 7, 226-231, 2016.
[6] Volzone C., Retention of Pollutant Gases: Comparison Between Clay Minerals and their Modified Products, Applied Clay Science, Vol. 36, Iss. 1-3, 191-196, 2007.
[7] Muntianu G., Platon N., Mardaru A., Nistor I.D., Miron N.D., Jinescu G., Use of Modified Clays Obtained by Pillaring in Gas Purification, U.P.B. Sci. Bull, Vol. 77, Iss. 3, 151-164, 2015.
[8] Ursu A.V., Gros F., Nistor I.D., Djelveh G., Characterization and Utilization of Commercial Clay for Ammonia Adsorption. Influence of Operating Parameters on Gas Retaining, Rev. Chim., 59, no. 10, 1067-1072, 2008.
[9] Rodrigues C.C., Deovaldo de Moraes Jr., Seleude W. Da Nobrega, Marcio G. Barboza, Ammonia Adsorption in a Fixed Bed of Activated Carbon, Bioresource Technology, 98, Iss. 4, 886-891, 2007.
[10] Arus V.A., Pîrvulescu O. C., Jinescu C., Nistor I. D., Mathematical Modeling of the Retention Process of Lactic Acid on Anionic Clay Particles Using Mechanical Mixing for Process Intensification, Rev. Chim., 62, no. 12, 1180-1184, 2011.
[11] Muntianu G., Cercetari Privind Utilizarea Nanomaterialelor pe Baza de Argila in Depoluarea Intensiva a Gazelor, Teza de doctorat, UPB, 2014.

Bulletin of Romanian Chemical Engineering Society, Vol. 3, No 2, 2016 ISSN 2360-4697
13
OPTIMIZATION OF VOLATILE ORGANIC COMPOUNDS REMOVAL BY PACKED-BED ABSORPTION
Mihai Marian CERNAT1, Oana Cristina PÂRVULESCU1, Tănase DOBRE1, Ioana MAIOR2
1Department of Chemical and Biochemical Engineering, University POLITEHNICA of Bucharest, 1-7 Polizu Street, 011061, Bucharest, Romania
2Department of Inorganic Chemistry, Physical Chemistry and Electrochemistry, University POLITEHNICA of Bucharest, 1-7 Polizu Street, 011061, Bucharest, Romania
Abstract Total annual cost of packed-bed absorption columns should be estimated in order to avoid uneconomic intensive operation. A case study on modelling of acetone absorption from air into clean water using a counter-current packed-bed column was considered. The influence of air mass flux (0.7-2.2 kg/(m2∙s)) on the total annual cost was theoretically studied under the following conditions: 1.2 m3/s volumetric gas flow rate, 21 °C temperature, 1 atm pressure, 95% separation efficiency, 0.03 inlet acetone mole fraction in the gas phase and 25×25×3 mm metallic Raschig rings. A mathematical model and an algorithm for determining the optimum gas mass flux leading to a minimum total annual cost were presented. The lowest total costs, i.e., 4745-4759 EUR/year, were obtained for values of gas mass flux in the range 1.20-1.56 kg/(m2∙s).
Keywords: Absorption, Acetone, Modelling, Packed-bed column, Volatile organic compound
1. Introduction
Volatile organic compounds (VOCs) are precursors of photochemical oxidants, contributors to photochemical smog and stratospheric ozone layer depletion and some of them are very hazardous for human and environment, even at very low concentration. Therefore, the control of their emissions in the air is an imperative task. Destructive (e.g., thermal and catalytic oxidation, bio-filtration) or recuperative (e.g., adsorption, absorption, condensation, membrane separation) abatement techniques have been intensively studied and applied [1].
Corresponding author. Email address: [email protected] (O.C. Pârvulescu)
Optimization of volatile organic compounds removal by packed-bed absorption
14
Gas-liquid absorption in counter-current packed-bed columns is a simple and effective regenerative technique which is widely used to transfer VOCs from a gas phase into a liquid absorbent [2-9]. Absorption performances, commonly expressed in terms of VOC separation efficiency and overall mass transfer kinetics, mainly depend on type and concentration of VOC species in the feed gas, absorbent type, gas and liquid flow rates, process temperature and pressure [2, 5-8]. Absorption efficiency generally increases with an increase in liquid flow rate and a decrease in gas flow rate, whereas overall mass transfer is enhanced at higher values of gas and liquid flow rates [5-7].
To avoid uneconomic intensive operation of packed-bed absorption columns, the total annual cost in terms of payback and operating costs should be estimated. Payback costs commonly refer to those of column and packing, whereas operating costs consider the power necessary to pump the gas and liquid phases [10]. Total annual cost depends on various variables, e.g., column material and dimensions, packing type, material and dimensions, absorbent type, gas and liquid flow rates, annual depreciation rate, absorption efficiency, process temperature and pressure [10, 11].
The influence of air mass flux on the total annual cost of a counter-current packed-bed column was theoretically studied in this paper. A mathematical model and an algorithm for estimating the optimum gas mass flux leading to a maximum total annual cost were presented for acetone absorption from an air stream into clean water flowing through metallic Raschig rings.
2. Modelling of packed-bed absorption
Overview
A counter-current packed-bed absorption column (Fig. 1) was considered, where the gas and liquid flow rates were expressed as molar flow rates of inert fluid (G and L) and the concentrations of VOC species as molar ratios (Y and X).
The simplifying assumptions of the model were as follows: - steady state; - transfer of VOC species from gas into liquid phase; - counter-current plug flow of liquid and gas phase; - negligible absorbent vaporization (constant inert liquid flow rate); - negligible gas solubility in the liquid (constant inert gas flow rate); - linear interphase equilibrium relationship (Henry’s law) between the molar
ratios of VOC species in the gas and liquid phase, i.e.: XmY XY
(1) - isothermal and isobaric conditions.

Mihai Marian Cernat, Oana Cristina Pârvulescu, Tănase Dobre, and Ioana Maior
15
Fig. 1. Counter-current packed bed absorption column
Any packed column used in a phase transfer uses a specific ratio between
the molar flow rates of inert phases, i.e., R=L/G, determined by the separation degree that needs to be achieved. For low values of Y and X molar ratios, the dependency between R and mass rate ratio (qg/ql) is defined by Eq. (2), where qg and ql (kg/(m2·s)) are mass fluxes of gas and liquid phases and Mg and Ml (kg/kmol) their molar masses.
l
g
g
l
M
M
q
q
G
LR (2)
In order to determine the optimum gas mass flux (qg,optim) leading to a minimum total annual cost, the total volumetric mass transfer coefficient (KYV) and wetted column pressure drop (∆pwet) of the gas phase were expressed according to Eqs. (3) and (4).
nl
mglgYV qAqqqK , (3)
HBqqp bggwet (4)
Total volumetric mass transfer coefficient can be expressed depending only on gas mass flux using Eq. (5) obtained by substituting Eq. (2) into Eq. (3).
n
g
lnmg
n
g
lg
mggYV M
MRAq
M
MRqAqqK
(5)

Optimization of volatile organic compounds removal by packed-bed absorption
16
Total annual cost (Ctot) corresponding to the absorption column shown in Fig. 2 consists of packed column payback cost (Cpayback) and operating costs related to pumping gas and liquid (Cgp and Clp). This total cost can be calculated using Eqs. (6)-(9), where r is the annual depreciation rate (%), α the cost of column material (EUR), β the cost of unit volume of packing (EUR/m3), Vpack the packing volume (m3), PEE the cost of electric energy (EUR/(kW·hr)), Z the number of hours worked in an year (hr/year), Np the pump power (kW) and ηp the pump efficiency (%).
gtotglpggpgpayback
YVlpYVwetgpYVpaybacktot
qCqCqCqC
KCKpCKCC
, (6)
packgpayback Vr
qC 100
(7)
gp
gpEEggp
NZPqC
(8)
lp
lpEEglp
NZPqC
(9)
Case study
Total annual cost corresponding to acetone absorption from an air stream into water using a counter-current packed-bed column was minimized obtaining an optimum gas mass flux (qg,optim). In order to solve this optimization problem, the following data were considered:
- packing: metallic Raschig rings (25×25×3 mm; void fraction: ε=0.74 m3/m3; specific surface area: σ=204 m2/m3);
- inlet volumetric flow rate of gas phase: GVN+1=1.2 m3/s; - temperature: t=21 °C; - pressure: p=1 atm; - VOC separation efficiency: φ=95%; - inlet VOC mole fraction in the gas phase: yN+1=0.03; - inlet VOC mole fraction in the liquid phase: x0=0; - VOC diffusion coefficients in the gas and liquid phase: Dg=1.1×10⁻⁵ m2/s
and Dl=1.1×10⁻⁹ m2/s [12]; - equilibrium line slope: mXY=1.4 [8]; - gas and liquid physical properties summarized in Table 1 [12].
Mihai Marian Cernat, Oana Cristina Pârvulescu, Tănase Dobre, and Ioana Maior
17
Table 1 Physical properties of gas and liquid phase at t=21 °C and p=1 atm
No. Name Symbol Value
Unit Gas phase Liquid phase
1 Density ρ 1.2 998 kg/m3 2 Dynamic viscosity η 1.8×10⁻⁵ 0.98×10⁻³ kg/(m·s) 3 Molar mass M 29 18 kg/kmol
- pressure drop in the wetted packed column, ∆pwet (N/m2), was estimated
according to Eqs. (10)-(14) [13, 14]:
225.0225.01
unwet
wet
p
p (10)
2.08.1
g
l
l
g
l
g
q
q
(11)
3
2
8
ggunwet
Hwp (12)
34.2Re
133
g
(13)
g
gg
q
4
Re (14)
- partial mass transfer coefficient in the gas film, kg (m/s), was calculated based on Eqs. (14)-(18), whereas partial mass transfer coefficient in the liquid film, kl (m/s), was determined using Eqs. (19)-(23):
e
ggg d
DShk (15)
33.0655.0Re407.0 ggg ScSh (16)
gg
g
gD
Sc
(17)
4
ed (18)
l
DShk ll
l (19)
5.055.0Re01.0 lll ScSh (20)
l
ll
q
4
Re (21)
Optimization of volatile organic compounds removal by packed-bed absorption
18
ll
ll D
Sc
(22)
3/1
2
2
gl
l
l
(23)
- for low values of Y and X, partial mass transfer coefficients in the gas and liquid films, kY and kX (kmol/(m2·s)), were calculated as follows:
gg
gY kTR
pCkk
101325 (24)
ll
lX k
Mk
(25)
- column material cost, α (EUR), was estimated based on empirical equation (26), where Cmat =1.7 for stainless [10]:
44.0675.0
50
213.14696.583
pHCD mat (26)
- cost of unit volume of packing: β=1300 EUR/m3 - annual depreciation rate: r=10% - cost of electric energy: PEE=0.07 EUR/(kW·hr) - number of hours worked in an year: Z=7200 hr/year - gas pump efficiency: ηgp=70% - liquid pump efficiency: ηlp=60%
Algorithm for solving the optimization case
(a) Determination of molar ratios, flow rates and mean driving force for absorption column
(a1) Calculate the inlet molar flow rate of gas phase, GN+1 (kmol/s):
TR
pGG
gVNN
10132511 (27)
(a2) Calculate the molar flow rate of inert gas, G (kmol/s): )1( 11 NN yGG (28)
(a3) Calculate the inlet VOC mole ratio, YN+1:
1
11 1
N
NN y
yY (29)
(a4) Calculate the outlet molar ratio of VOC species in the gas phase, Y1, depending on separation efficiency, φ, and species inlet molar ratio in the gas phase, YN+1:

Mihai Marian Cernat, Oana Cristina Pârvulescu, Tănase Dobre, and Ioana Maior
19
11 1001
NYY
(30)
(a5) Calculate the molar flow rate of VOC species transferred from gas to liquid phase, nVOC (kmol/s):
11 YYGn NVOC (31)
(a6) Calculate the minimum molar flow rate of inert liquid, Lmin (kmol/s):
XY
N
VOCmin
m
Yn
L1
(32)
(a7) Select the operation molar flow rate of inert liquid, L (kmol/s):
minLL 5.1 (33)
(a8) Determine the ratio between the molar flow rates of inert phases, R:
G
L
G
LR min5.1
(34)
(a9) Calculate the outlet molar ratio of VOC species in the liquid phase, XN:
R
YYYY
L
GX N
NN11
11
(35)
(a10) Calculate the mean driving force of absorption process, ∆Ym:
1
1
11
lnY
XmY
YXmYY
NXYN
NXYNm (36)
(b) Determination of pressure drop over the wetted packed column (b1) Select some values of gas superficial velocity, wg,i (m/s), where
i=0,1..S (b2) Calculate the values of gas mass flux, qg,i (kg/(m2·s)):
gigig wq ,, (37)
(b3) Calculate the values of unwetted column pressure drop for the unit height of absorption column, ∆punwet,1,i (N/m2), using Eq. (38) obtained by substituting H=1 m in Eq. (12):
3
2,
,1, 8
gigiunwet
wp (38)
(b4) Estimate characteristic parameters b and B of Eq. (39) depending on previously calculated values of gas pressure drop and mass flux:
bigiunwet Bqp ,,1, (39)
(b5) Calculate the values of liquid mass flux, ql,j (kg/(m2·s)), where j=0,1..S, using Eq. (2)
Optimization of volatile organic compounds removal by packed-bed absorption
20
(b6) Calculate the values of coefficient Bi,j defined by Eq. (40), where the values of Фi,j were estimated by Eq. (11) depending on mass fluxes of both phases (qg,i and ql,j) as well as their densities and dynamic viscosities:
225.0,, 225.01 jiji BB (40)
(b7) Determine the mean of Bi,j values:
2
0 0,
S
B
B
S
i
S
jji
m
(41)
(b8) Calculate the values of wetted column pressure drop for the unit height of absorption column, ∆pwet,1,i (N/m2):
bigmiwet qBp ,,1, (42)
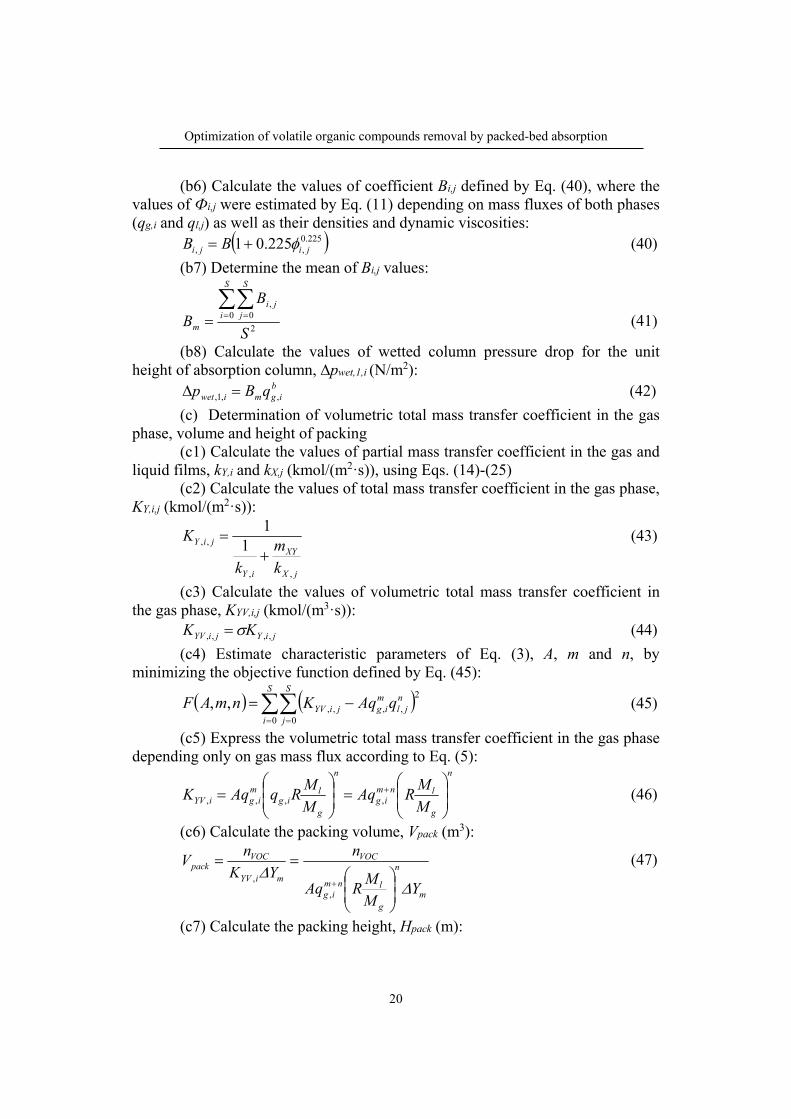
(c) Determination of volumetric total mass transfer coefficient in the gas phase, volume and height of packing
(c1) Calculate the values of partial mass transfer coefficient in the gas and liquid films, kY,i and kX,j (kmol/(m2·s)), using Eqs. (14)-(25)
(c2) Calculate the values of total mass transfer coefficient in the gas phase, KY,i,j (kmol/(m2·s)):
jX
XY
iY
jiY
k
m
k
K
,,
,, 11
(43)
(c3) Calculate the values of volumetric total mass transfer coefficient in the gas phase, KYV,i,j (kmol/(m3·s)):
jiYjiYV KK ,,,, (44)
(c4) Estimate characteristic parameters of Eq. (3), A, m and n, by minimizing the objective function defined by Eq. (45):
S
i
S
j
njl
migjiYV qAqKnmAF
0 0
2
,,,,,, (45)
(c5) Express the volumetric total mass transfer coefficient in the gas phase depending only on gas mass flux according to Eq. (5):
n
g
lnmig
n
g
lig
migiYV M
MRAq
M
MRqAqK
,,,, (46)
(c6) Calculate the packing volume, Vpack (m3):
m
n
g
lnmig
VOC
miYV
VOCpack
YM
MRAq
n
YK
nV
,
,
(47)
(c7) Calculate the packing height, Hpack (m):
Mihai Marian Cernat, Oana Cristina Pârvulescu, Tănase Dobre, and Ioana Maior
21
m
n
g
lnmig
VOCpackpack
YM
MRAq
n
DD
VH
,
22
44 (48)
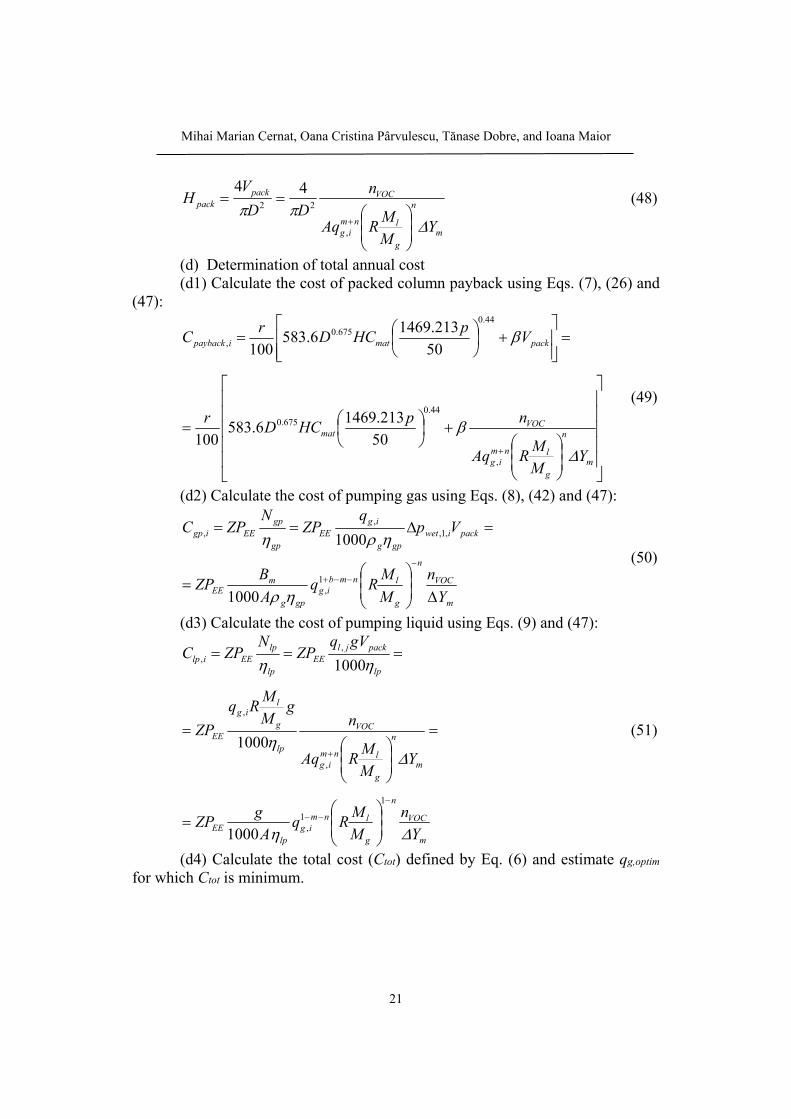
(d) Determination of total annual cost (d1) Calculate the cost of packed column payback using Eqs. (7), (26) and
(47):
m
n
g
lnmig
VOCmat
packmatipayback
YM
MRAq
npHCD
r
Vp
HCDr
C
,
44.0675.0
44.0675.0
,
50
213.14696.583
100
50
213.14696.583
100
(49)
(d2) Calculate the cost of pumping gas using Eqs. (8), (42) and (47):
m
VOC
n
g
lnmbig
gpg
mEE
packiwetgpg
igEE
gp
gpEEigp
Y
n
M
MRq
A
BZP
Vpq
ZPN
ZPC
1,
,1,,
,
1000
1000
(50)
(d3) Calculate the cost of pumping liquid using Eqs. (9) and (47):
m
VOC
n
g
lnmig
lpEE
m
n
g
lnmig
VOC
lp
g
lig
EE
lp
packjlEE
lp
lpEEilp
Y
n
M
MRq
A
gZP
YM
MRAq
ng
M
MRq
ZP
gVqZP
NZPC
1
1,
,
,
,,
1000
1000
1000
(51)
(d4) Calculate the total cost (Ctot) defined by Eq. (6) and estimate qg,optim for which Ctot is minimum.

Optimization of volatile organic compounds removal by packed-bed absorption
22
3. Results and discussion
(a) Determination of molar ratios, flow rates and mean driving force for absorption column
Characteristic parameters of Eqs. (27)-(36), obtained based on mass balance over the absorption column, are summarized in Table 2.
Table 2
Characteristic parameters of Eqs. (27)-(36)
GN+1 G nVOC×103 Lmin L R YN+1 Y1×103
XN ΔYm×103
(kmol/s) -
0.05 0.048 1.418 0.064 0.077 1.596 0.031 1.546 0.018 2.997
(b) Determination of pressure drop over the wetted packed column A usual domain for the gas superficial velocities was chosen, i.e., wg=0.7-
2.2 m/s. Gas mass flux, qg, was determined by Eq. (37), liquid mass flux, ql, by Eq. (2) and unwetted column pressure drop for the unit height of absorption column, ∆punwet,1, by Eq. (38). Characteristic b and B parameters of Eq. (39), i.e., ∆punwet,1=Bqg
b, estimated based on data represented in Fig. 2, were as follows: b=1.9964 and B=123.35. A mean value Bm=131.708 was obtained for the wetted column based on Eqs. (40) and (41) and wetted column pressure drop for the unit height of absorption column, ∆pwet,1, was calculated using Eq. (42). The values of wg, qg, ql, ∆punwet,1 and ∆pwet,1 are presented in Table 3. As expected, an increase in gas velocity resulted in an increase in mass fluxes and pressure drops.
(c) Determination of total volumetric mass transfer coefficient in the gas phase, volume and height of packing
Partial mass transfer coefficients in the gas film, kg and kY, were determined by Eqs. (14)-(18) and (24), partial mass transfer coefficients in the liquid film, kl and kX, by Eqs. (19)-(23) and (25), whereas total mass transfer coefficient in the gas phase, KY, was obtained by Eq. (43) and total volumetric mass transfer coefficient in the gas phase, KYV, by Eq. (44). Characteristic parameters of Eq. (3), i.e., A=0.189, m=0.061 and n=0.368, were estimated by minimizing the objective function defined by Eq. (45). Packing volume and height, Vpack and Hpack, were calculated using Eqs. (47) and (48) depending on A, m and n. Results summarized in Table 4 highlight an increase in Reynolds numbers, partial mass transfer coefficients, packing height as well as a decrease in packing volume with an increase in gas mass flux.

Mihai Marian Cernat, Oana Cristina Pârvulescu, Tănase Dobre, and Ioana Maior
23
Δp unwet,1 = 123.35q g1.9964
R2 = 1
0
200
400
600
800
1000
0 0.5 1 1.5 2 2.5 3
q g (kg/(m2·s))
Δp u
nw
et,1
(N/m
2 )
Fig. 2. Pressure drop over the unwetted column vs. gas mass flux
Table 3 Gas superficial velocity, mass fluxes and pressure drop over unwetted and wetted column
wg qg ql Δpunwet,1 Δpwet,1
m/s kg/(m2·s) N/m2
0.7 0.84 0.832 87.122 92.992
1.0 1.20 1.189 177.471 189.533
1.3 1.56 1.545 299.626 320.005
1.6 1.92 1.902 453.587 484.374
1.9 2.28 2.259 639.355 682.615
2.2 2.64 2.615 856.929 914.706 Table 4
Reynolds numbers, partial mass transfer coefficients, packing volume and height depending on gas mass flux
qg Reg×10-4 Rel kg kl×105
kY×103 kX×103 Vpack Hpack
kg/(m2·s) - m/s kmol/(m2·s) m3 m
0.84 0.092 16.647 0.067 3.027 2.798 1.678 2.704 1.577
1.20 0.131 23.790 0.085 3.683 3.545 2.042 2.321 1.934
1.56 1.699 30.912 0.102 4.254 4.218 2.359 2.074 2.247
1.92 2.092 38.055 0.117 4.769 4.841 2.644 1.898 2.53
2.28 2.484 45.198 0.131 5.242 5.425 2.907 1.763 2.791
2.64 2.876 52.321 0.144 5.682 5.979 3.15 1.655 3.035

Optimization of volatile organic compounds removal by packed-bed absorption
24
(d) Determination of total annual cost The cost of packed column payback, Cpayback, was determined by Eq. (49),
whereas the costs of pumping gas and liquid, Cgp and Clp, by Eqs. (50) and (51), respectively. Total annual cost, Ctot, was obtained by Eq. (6) as a sum of payback and pumping costs. Results presented in Table 5 and Fig. 3 emphasize an increase in pumping gas cost and a decrease in payback cost with an increase in gas mass flux as well as very low values of pumping liquid cost. The lowest total annual costs, i.e., Ctot=4745-4759 EUR/year, are achieved for qg,optim=1.20-1.56 kg/(m2·s), corresponding to wg,optim=1-1.3 m/s.
Table 5
Payback, pumping and total annual costs depending on gas mass flux
qg Cpayback Cgp Clp Ctot
kg/(m2·s) EUR/year
0.84 4924 148 28 5100
1.20 4355 370 34 4759
1.56 3980 725 40 4745
1.92 3706 1235 45 4986
2.28 3493 1920 49 5462
2.64 3322 2798 54 6174
0
1000
2000
3000
4000
5000
6000
7000
0 0.5 1 1.5 2 2.5 3
q g (kg/(m2·s))
Cos
t (E
UR
/yea
r)
Fig. 3. Payback (♦), pumping gas (■), pumping liquid(▲) and total (×) annual costs vs. gas mass
flux

Mihai Marian Cernat, Oana Cristina Pârvulescu, Tănase Dobre, and Ioana Maior
25
4. Conclusions
To avoid uneconomic intensive operation, the total annual cost of packed-bed absorption columns should be estimated. The total cost depends on various parameters including gas flow rate, VOC type and initial concentration, absorbent type, column material and dimensions, packing type, material and dimensions, absorption efficiency, annual depreciation rate, process temperature and pressure.
A theoretical study on the modelling of acetone absorption from air into water using a counter-current packed-bed column was presented. The influence of air mass flux (0.7-2.2 kg/(m2·s)) on the total annual cost was studied under the following conditions: 1.2 m3/s inlet volumetric gas flow rate, 0.03 inlet acetone mole fraction in the gas phase, clean absorbent, stainless column, 25×25×3 mm metallic Raschig rings, 95% separation efficiency, 10% annual depreciation rate, 21 °C temperature and 1 atm pressure.
An algorithm for determining the optimum gas mass flux leading to a minimum total annual cost was described. Pressure drop over the unwetted and wetted column, partial mass transfer coefficients, packing height and pumping gas cost increased as well as packing volume and payback cost decreased with an increase in gas mass flux. The lowest total annual costs (4745-4759 EUR/year) were achieved for gas mass fluxes of 1.20-1.56 kg/(m2·s), corresponding to gas superficial velocities of 1-1.3 m/s. The model could be applied for counter-current packed-bed absorption of any VOC species from a gas stream into any absorbent under various operating conditions and using different packing types, materials and dimensions.
Nomenclature C molar gas concentration, kmol/m3 Cp pumping annual cost, EUR/year Cpayback payback annual cost, EUR/year Ctot total annual cost, EUR/year de equivalent diameter of packing, m D column diameter, m Dg/l diffusion coefficient of VOC species in the gas/liquid phase, m2/s G molar flow rate of inert gas, kmol/s GN+1 inlet molar flow rate of gas phase, kmol/s GVN+1 inlet volumetric flow rate of gas phase, m3/s H column height, m Hpack packing height, m kg/l partial mass transfer coefficient of VOC species in the gas/liquid film (in units
corresponding to molar concentration), m/ s kY/X partial mass transfer coefficient of VOC species in the gas/liquid film (in units
corresponding to molar ratio), kmol/(m2·s) KY total mass transfer coefficient of VOC species in the gas phase (in units corresponding to
molar ratio), kmol/(m2·s) KYV total volumetric mass transfer coefficient of VOC species in the gas phase, kmol/(m3·s)

Optimization of volatile organic compounds removal by packed-bed absorption
26
l characteristic length in Shl, m L molar flow rate of inert liquid, kmol/s mXY slope of interphase equilibrium line (referring to molar ratios) M molar mass, kg/kmol nVOC molar flow rate of VOC species transferred from gas to liquid phase, kmol/s Np pump power, kW p pressure, atm PEE electric energy cost, EUR/(kW·h) q mass flux, kg/(m2∙s) R specific ratio between the molar flow rates of inert phases, R=L/G Rg universal gas constant, Rg=8314 J/(kmol·K) r annual depreciation rate, % t temperature, °C T temperature, K Vpack packing volume, m3 w superficial velocity, m/s
x molar fraction of VOC species in the liquid phase
X molar ratio of VOC species in the liquid phase y molar fraction of VOC species in the gas phase
Y molar ratio of VOC species in the gas phase
Z number of operating hours, hr/year
Dimensionless numbers Re Reynolds number Sc Schmidt number Sh Sherwood number
Greek letters α cost of column material, EUR β cost of unit volume of packing, EUR/m3
Δp pressure drop, N/m2 ΔYm mean driving force of absorption process ε void fraction, m3/m3
ζ resistance coefficient η dynamic viscosity, kg/(m·s) ηp pump efficiency, % ρ density, kg/m3
σ specific surface area, m2/m3
φ separation efficiency of VOC species, % Φ characteristic factor of two-phase flow
Subscripts e equivalent g relative to gas l relative to liquid m mean min minimum
Mihai Marian Cernat, Oana Cristina Pârvulescu, Tănase Dobre, and Ioana Maior
27
N relative to liquid outlet N+1 relative to gas inlet pack relative to packing unwet relative to unwet column wet relative to wet column 0 relative to liquid inlet 1 relative to gas outlet
Superscripts * relative to equilibrium
REFERENCES
[1] Khan, F I., Ghosal, A. K., Removal of volatile organic compounds from polluted air, Journal of Loss Prevention in the Process Industries, 13, (2000), 527–545.
[2] Dumont, E., Darracq, G., Couvert, A., Couriol, C., Amrane, A., Thomas, D., Andrès, Y., Le Cloirec, P., VOC absorption in a countercurrent packed-bed column using water/silicone oil mixtures: Influence of silicone oil volume fraction, Chemical Engineering Journal, 168, (2011), 241–248.
[3] Dumont, E., Darracq, G., Couvert, A., Couriol, C., Amrane, A., Thomas, D., Andrès, Y., Le Cloirec, P., Hydrophobic VOC absorption in two-phase partitioning bioreactors; influence of silicone oil volume fraction on absorber diameter, Chemical Engineering Science, 71, (2012), 146–152.
[4] Heymes, F., Manno-Demoustier, P., Charbit, F., Fanlo, J.L., Moulin, P., A new efficient absorption liquid to treat exhaust air loaded with toluene, Chemical Engineering Journal, 115, (2006), 225–231.
[5] Lin, C.C., Wei, T.Y., Hsu, S.K., Liu, W.T., Performance of a pilot-scale cross-flow rotating packed bed in removing VOCs from waste gas streams, Separation and Purification Technology, 52, (2006), 274–279.
[6] Marki, E., Lenti, B., Vatai, Gy., Bekassy-Molnar, E., Clean technology for acetone absorption and recovery, Separation and Purification Technology, 22-23, (2001), 377-382.
[7] Monnier, H., Falk, L., Lapicque, F., Hadjoudj, R., Roizard, C., Intensification of G/L absorption in microstructured falling film. Application to the treatment of chlorinated VOC’s – part I: Comparison between structured and microstructured packings in absorption devices, Chemical Engineering Science, 65, (2010), 6425–6434.
[8] Rahbar, M.S., Kaghazchi, T., Modeling of packed absorption tower for volatile organic compounds emission control, International Journal of Environmental Science and Technology, 2, (2005), 207–215.
[9] Wu, H., Feng, T.C., Chung, T.W., Studies of VOCs removed from packed-bed absorber by experimental design methodology and analysis of variance, Chemical Engineering Journal, 157, (2010), 1–17.
[10] Brunazzi, E., Nardini, G., Paglianti, A., An economical criterion for packed absorption column design, Chemical and Biochemical Engineering Quarterly, 15, (2002), 199–206.
[11] Parkinson, G. Ondrey, G., Packing towers, Chemical Engineering, 106, (1999), 39–42. [12] Ion, V.A., Pârvulescu, O.C., Dobre, T., Gas-liquid absorption of volatile organic compounds
from gas streams in a packed-bed column: Modelling and simulation, Bulletin of Romanian Chemical Engineering Society, 1 (2), (2014), 70–86.

Optimization of volatile organic compounds removal by packed-bed absorption
28
[13] Jacimovic, B.M., Genic, S.B., Andric, P.I., Experimental research of two phase pressure drop in packed columns for gas-liquid operations, Scientific Bulletin of the Politehnica University of Timisoara, Transactions on Mechanics Special Issue, (2004), 489–494.
[14] Kafarov, V., Fundamentals of Mass Transfer, MIR Publishers, Moscow, 1985.

Bulletin of Romanian Chemical Engineering Society, Vol 3, No 2, 2016 ISSN 2360-4697
29
ON THE CONVECTIVE DRYING OF GYPSUM BOARDS
Tănase DOBRE, Oana Cristina PÂRVULESCU, Diana MATEI
Department of Chemical and Biochemical Engineering, University POLITEHNICA of Bucharest, 1-7 Polizu Street, 011061, Bucharest, Romania
Abstract A mathematical model for convective drying of gypsum boards on a conveyor belt was developed. The model was based on coupled moisture and heat balance equations, assuming a moving-front diffusion of moisture vapour through a stagnant gas layer at pore level. Pore tortuosity, board porosity and gas boundary layer thickness were selected as adjustable parameters and were fitted from experimental data. Simulations were conducted at various values of air temperature, air relative humidity and conveyor belt velocity. The mass transfer through the air boundary layer on the board surface had a significant effect on the drying dynamics.
Keywords: Drying, Gypsum board, Modelling, Vapour diffusion
1. Introduction
The convective drying of porous media has a major role in many industrial applications, including production/processing of building materials (e.g., concrete, bricks, gypsum boards), food, pharmaceuticals, wood or paper [1–6]. The modelling is a useful tool in designing, operating and optimizing the drying process. The drying curves, expressed as U(τ) vs. τ, dU(τ)/dτ vs. τ or dU(τ)/dτ vs. U(τ), where U is the moisture content and τ the time, can be predicted by empirical, semi-empirical or theoretical models.
Table 1 contains some widely used semi-empirical relationships expressing the dynamics of material moisture ratio, MR = (U(τ) - Ue)/(U0 - Ue) vs. τ, where Ue and U0 are the equilibrium and initial material moisture content, respectively. They combine both theory and experimental data and are generally derived from the simplification of Fick’s second law. These semi-empirical correlations are typical for the drying of thin-layer materials at a high air flow rate. Under these conditions, the air exhibits an infinitesimal change of its humidity and temperature, consequently an isothermal drying at the air
Corresponding author. Email address: [email protected] (O.C. Pârvulescu)

On the convective drying of gypsum boards
30
temperature can be assumed. Characteristic coefficients (a, b, k, k1 and n) of thin-layer drying models summarized in Table 1 are constant for a given drying temperature. The model coefficients are commonly determined on the basis of experimental data by minimizing the coefficient of determination (R2), reduced chi-square (χ2) or root mean square error (RMSE).
Table 1 Semi-empirical thin-layer drying models
No. Name Expression References 1 Lewis (Newton) MR = exp(-kτ) [7–12] 2 Henderson and Pabis MR = aexp(-kτ) [7,8,11–13] 3 Logarithmic MR = aexp(-kτ) + b [7,8,11,12,14,15] 4 Two-term MR = aexp(-kτ) + bexp(-k1τ) [7,11,12,14,16] 5 Two-term exponential MR = aexp(-kτ) + (1-a)exp(-kaτ) [7,11,12] 6 Verma et al. MR = aexp(-kτ) + (1-a)exp(-k1τ) [7,11,17] 7 Page MR = exp(-kτn) [7–9,11,12,14,18] 8 Modified Page MR = exp[-(kτ)n] [7,8,11,12,19] 9 Midilli et al. MR = aexp(-kτn) + bτ [7,11,20] Continuum or discrete (pore-network) theoretical models have been
extensively developed to describe the drying of porous media [21–23]. Continuum models include mass, heat and momentum balance equations in continuum porous structures [5,6,21,24−28]. These models contain some parameters (e.g., effective diffusivity of moisture vapour, interphase mass and heat transfer coefficients), which are estimated by different methods and can determine uncertain predictions.
Discrete pore-network models, where the porous structure is represented by a lattice of pores interconnected by throats, offer a better understanding of the mechanism process but need a high computational effort [22,23,29,30]. In this approach the gas is the continuous phase, whereas the liquid splits up into many clusters. The competition between viscous forces and capillary pumping determines a liquid displacement in the liquid-filled regions.
This paper presents a continuum model for convective drying of gypsum boards where the mass transfer at the pore level occurs by moving-front diffusion of moisture vapour through a stagnant gas layer.
2. Modelling of convective drying process
The present model refers to the moisture removal from large (> 20 µm) tortuous pores of a gypsum board (Fig. 1). Physical model corresponding to air drying at pore level is depicted in Fig. 2. Model simplifying assumptions are as follows: (i) the board (d thickness, l width and L length) contains identical pores which are completely moisture filled (Fig. 2a); (ii) a tortuous pore (dp diameter

Tănase Dobre, Oana Cristina Pârvulescu, Diana Matei
31
and lp length) is open at both ends (Fig. 2a, b) and its tortuosity (ξ) is defined by Eq. (1); (iii) mass transfer at the pore level occurs by moving-front diffusion of moisture vapour through a stagnant air layer; (iv) the moisture refers to water.
Fig. 1. Gypsum board dried using an air stream
d
lp (1)
Fig. 2. Physical model of air drying at pore level:
(a) completely filled tortuous pore (τ = 0), (b) partially filled tortuous pore (τ > 0), (c) moisture vaporization from a stretched pore
Neglecting the gas-side mass transfer resistance, the momentary flux of water vapour (A), NA (kmoleA/m2 s), is expressed according to the diffusion through a stagnant gas (B) layer by Eq. (2) and the pore water loss by Eq. (3), where C (kmole/m3) is the air molar concentration, DA (m2/s) the diffusion coefficient of water vapour in the air, yA,sat (kmoleA/kmole) the mole fraction of water vapour in equilibrium with the liquid water in pores, yA∞ (kmoleA/kmole) the mole fraction of water vapour in the wet air surrounding the board, yBm (kmoleB/kmole) the logarithmic mean air mole fraction, zτ (m) the momentary diffusion path length, MA (kgA/kmoleA) the water molar mass and ρAl (kgA/m3
A) the liquid water density [31]. Schematic representations in Fig. 2 highlight that 0 ≤ zτ ≤ ξlg, where lg = d/2 is the geometric length corresponding to the vapour diffusion. Initial and boundary conditions associated to Eqs. (2) and (3) are given
d
y
x
Air flow, w∞
pore solid Velocity distribution

On the convective drying of gypsum boards
32
by Eqs. (4) and (5). Considering low values of yA,sat and yA∞, a constant value of yBm may be assumed.
sat,AAAsat,ABm
AA yy
dyy
yz
CDzN ,
2z0 ,
(2)
d
dz
MdM
zd
d
dzN
A
Al
p
A
Alp
A
4
42
2
(3)
0)0( ,0zz ,0 0 AN (4)
02
,2
z
dN
dA
(5)
The momentary diffusion path length, zτ, is given by Eq. (6) obtained by coupling Eqs. (2) and (3), separating variables and integrating.
2
z0 , 0, 2 d
yy,y
yyMCDz sat,AA
AlBm
Asat,AAA
(6)
Eq. (7) expressing the dynamics of water flux, NA(τ), was obtained by substituting Eq. (6) into Eq. (2). It is observed a linear dependence between NA and τ-0.5.
sat,AA
ABm
Asat,AAlAA yy,
My
yyCDN
0, 2
(7)
Considering the gas-side mass transfer resistance, the momentary flux of water vapour can be expressed according to Eq. (8), where kc (m/s) is the mass transfer coefficient in the gas boundary layer.
satAA
cAlBm
AsatAAA
A
Bm
AsatAA yy
Cky
yyMCD
CD
y
yyN ,
,
, 0, ,12
(8)
The flow rate of liquid vaporized from an infinitesimal board volume with dx length, nA (kmoleA/s), can be determined using Eq. (9), where the pore number corresponding to the infinitesimal volume, np, is given by Eq. (10) depending on board width, l, board porosity, ε, and mean pore diameter, dp. By substituting Eqs. (8) and (10) into Eq. (9), Eq. (11) expressing the dynamics of water flow rate vaporized from the infinitesimal board volume was obtained.
A
ppA N
dnn
42
2
(9)
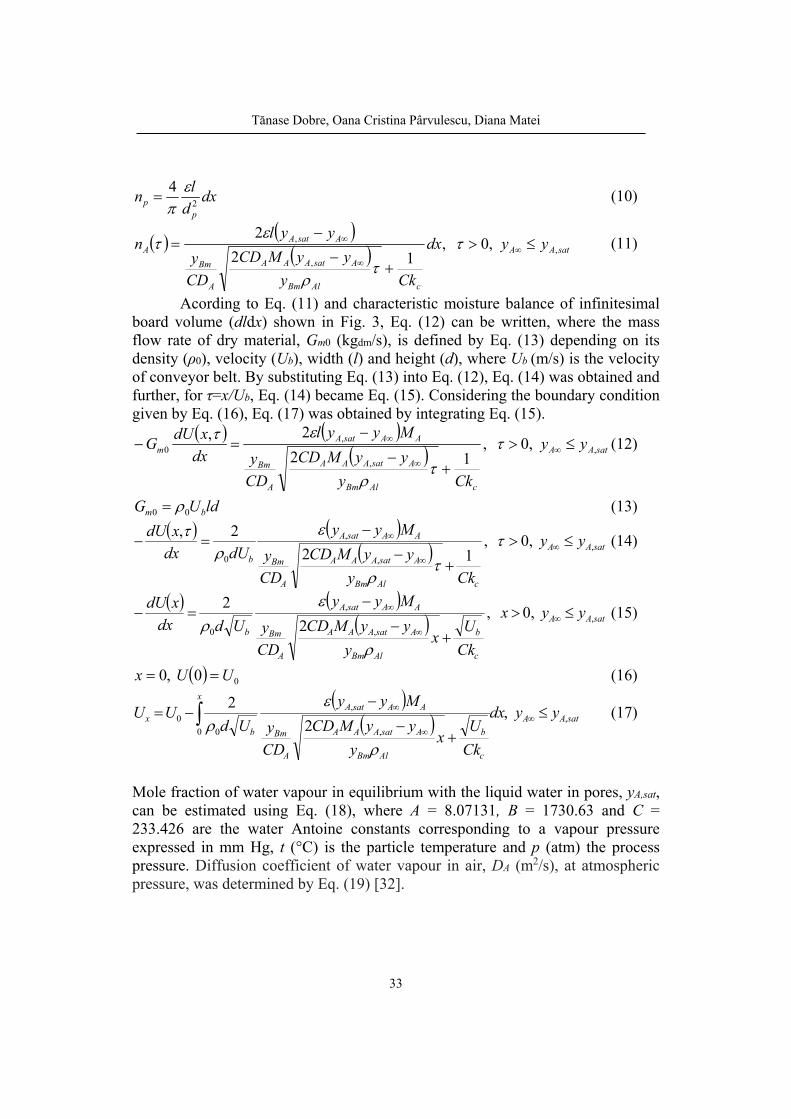
Tănase Dobre, Oana Cristina Pârvulescu, Diana Matei
33
dxd
ln
pp 2
4
(10)
satAA
cAlBm
AsatAAA
A
Bm
AsatAA yydx
Cky
yyMCD
CD
y
yyln ,
,
, 0, ,12
2
(11)
Acording to Eq. (11) and characteristic moisture balance of infinitesimal board volume (dldx) shown in Fig. 3, Eq. (12) can be written, where the mass flow rate of dry material, Gm0 (kgdm/s), is defined by Eq. (13) depending on its density (ρ0), velocity (Ub), width (l) and height (d), where Ub (m/s) is the velocity of conveyor belt. By substituting Eq. (13) into Eq. (12), Eq. (14) was obtained and further, for τ=x/Ub, Eq. (14) became Eq. (15). Considering the boundary condition given by Eq. (16), Eq. (17) was obtained by integrating Eq. (15).
satAA
cAlBm
AsatAAA
A
Bm
AAsatAm yy
Cky
yyMCD
CD
y
Myyl
dx
xdUG ,
,
,0 0, ,
12
2,
(12)
ldUG bm 00 (13)
satAA
cAlBm
AsatAAA
A
Bm
AAsatA
b
yy
Cky
yyMCD
CD
y
Myy
dUdx
xdU,
,
,
0
0, ,12
2,
(14)
satAA
c
b
AlBm
AsatAAA
A
Bm
AAsatA
b
yyx
Ck
Ux
y
yyMCD
CD
y
Myy
Uddx
xdU,
,
,
0
0, ,2
2
(15)
00 ,0 UUx (16)
satAA
x
c
b
AlBm
AsatAAA
A
Bm
AAsatA
b
x yydx
Ck
Ux
y
yyMCD
CD
y
Myy
UdUU ,
0 ,
,
0
0 ,2
2
(17)
Mole fraction of water vapour in equilibrium with the liquid water in pores, yA,sat, can be estimated using Eq. (18), where A = 8.07131, B = 1730.63 and C = 233.426 are the water Antoine constants corresponding to a vapour pressure expressed in mm Hg, t (°C) is the particle temperature and p (atm) the process pressure. Diffusion coefficient of water vapour in air, DA (m2/s), at atmospheric pressure, was determined by Eq. (19) [32].
On the convective drying of gypsum boards
34
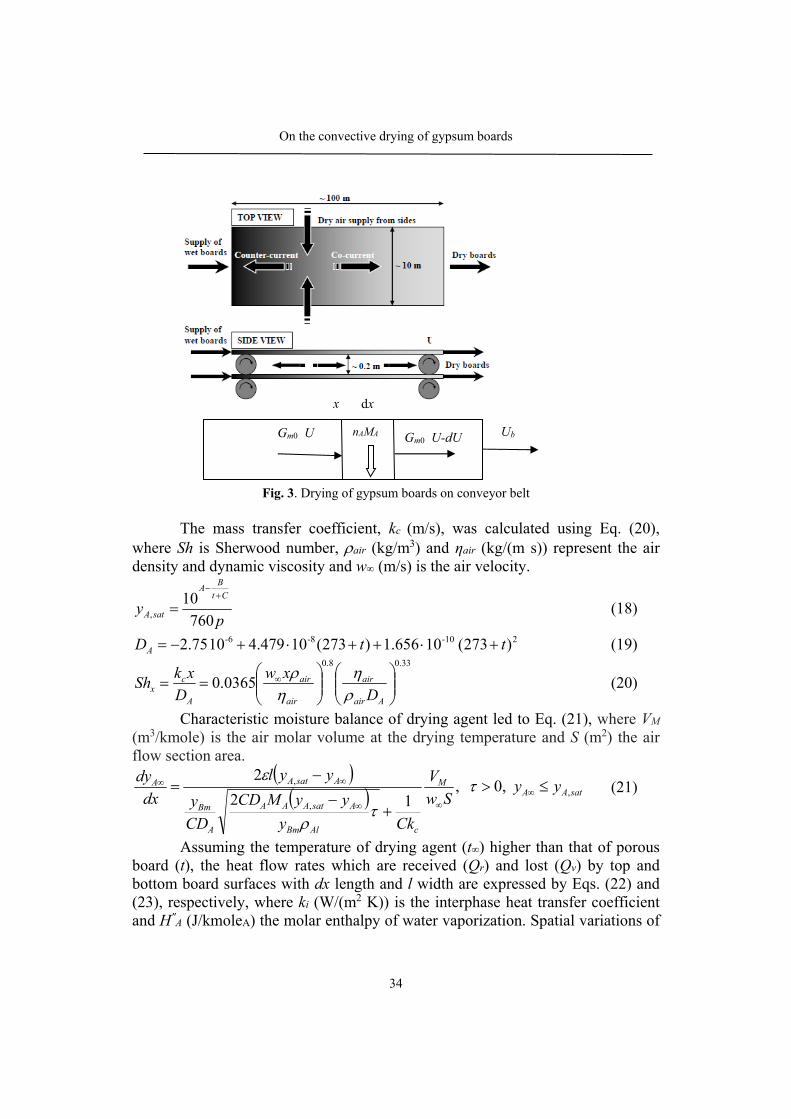
Fig. 3. Drying of gypsum boards on conveyor belt
The mass transfer coefficient, kc (m/s), was calculated using Eq. (20),
where Sh is Sherwood number, air (kg/m3) and ηair (kg/(m s)) represent the air density and dynamic viscosity and w∞ (m/s) is the air velocity.
py
Ct
BA
satA 760
10,
(18)
2 -10-8-6 )273(10 656.1)273(10 479.410 75.2 ttDA (19) 33.08.0
0365.0
Aair
air
air
air
A
cx D
xw
D
xkSh
(20)
Characteristic moisture balance of drying agent led to Eq. (21), where VM (m3/kmole) is the air molar volume at the drying temperature and S (m2) the air flow section area.
satAA
M
cAlBm
AsatAAA
A
Bm
AsatAA yySw
V
Cky
yyMCD
CD
y
yyl
dx
dy,
,
, 0, ,12
2
(21)
Assuming the temperature of drying agent (t∞) higher than that of porous
board (t), the heat flow rates which are received (Qr) and lost (Qv) by top and bottom board surfaces with dx length and l width are expressed by Eqs. (22) and (23), respectively, where ki (W/(m2 K)) is the interphase heat transfer coefficient and H″
A (J/kmoleA) the molar enthalpy of water vaporization. Spatial variations of
Gm0 U Gm0 U-dU nAMA Ub
dx x

Tănase Dobre, Oana Cristina Pârvulescu, Diana Matei
35
air and board temperatures are given by Eqs. (24) and (25), where cp,air (J/(kg K)) is the air specific heat, cp (J/(kg K)) the board specific heat, (kg/m3) the board density and fr and fv are defined by Eqs. (26) and (27).
ldxttkQ ir )( (22)
dx
Cky
yyMCD
CD
y
HyylHnQ
cAlBm
AsatAAA
A
Bm
AAsatAAAv
12
2
,
'',''
(23)
airpair
rv
cSw
ff
dx
dt
,
(24)
pb
vr
cldU
ff
dx
dt
(25)
lttkf ir )( (26)
cAlBm
AsatAAA
A
Bm
AAsatAv
Cky
yyMCD
CD
y
Hyylf
12
2
,
'',
(27)
3. Experimental
An experimental study was conducted in order to fit the adjustable model parameters, i.e., pore tortuosity, board porosity and gas boundary layer thickness. Circular boards of 9 mm thickness were prepared using a gypsum/water mass ratio of 2/1. Prepared samples hardened resulting in a porous solid structure consisting of interconnected crystals of calcium sulphate dihydrate (CaSO4·1/2H2O+3/2H2O→CaSO4·2H2O). Gypsum board drying dynamics were measured by an OHAUS MB45 AM thermobalance. Air temperature, t (°C), and relative humidity, RH, were determined by an EL-USB-TC-LCD data logger. The dependency between yA∞ and yA,sat was estimated by Eq. (28). All tests were performed at atmospheric pressure (p = 1 atm).
RHyy satAA , (28)
4. Results and discussions
Experimental measurements of gypsum board drying presented in Figs. 4-6 highlight the following aspects: (i) drying curves at 60 °C and 80 °C shown in Fig. 4 are similar, whereas those corresponding to drying at 100 °C exhibit a different trend; (ii) according to plots depicted in Figs. 5 and 6, the drying at a temperature of 100 °C is characterized by three processes, i.e., surface water

On the convective drying of gypsum boards
36
evaporation, pore water evaporation and calcium sulphate dihydrate dehydration (appears for U < 0.18 kgA/kgdm), whereas at 80 °C only the surface (dominant for U > 0.25 kgA/kgdm) and pore (dominant for U < 0.25 kgA/kgdm) water evaporation are present. Accordingly, for convective drying at 80 °C, the process occurs with a constant evaporation flux for U (0.25-0.35) kgA/kgdm, whereas the drying takes place under variable flux for U < 0.25 kgA/kgdm. Moisture content of gypsum board dried in the thermobalance was determined by Eq. (29), where zg (m) represents the thickness of gas boundary layer.
25.00, )(
)(
0.35 25.0,)(
1,0
1
01,0
0
1
UUz
dyy
dy
MCDU
UUUyydyz
MCDU
U
AsatABm
AA
AsatABmg
AA
(29)
Fig. 4. Experimental dynamics of moisture content, U (kgA/kgdm), for gypsum board
(RH = 0.4, d = 9 mm)
Fig. 5. Experimental dynamics of drying rate, dU/dτ (kgA/(kgdm s)), for gypsum board
(RH = 0.4, d = 9 mm)

Tănase Dobre, Oana Cristina Pârvulescu, Diana Matei
37
Fig. 6. Drying rate, dU/dτ (kgA/(kgdm s)), vs. moisture content, U (kgA/kgdm), for gypsum board
dried in thermobalance (RH = 0.4, d = 9 mm)
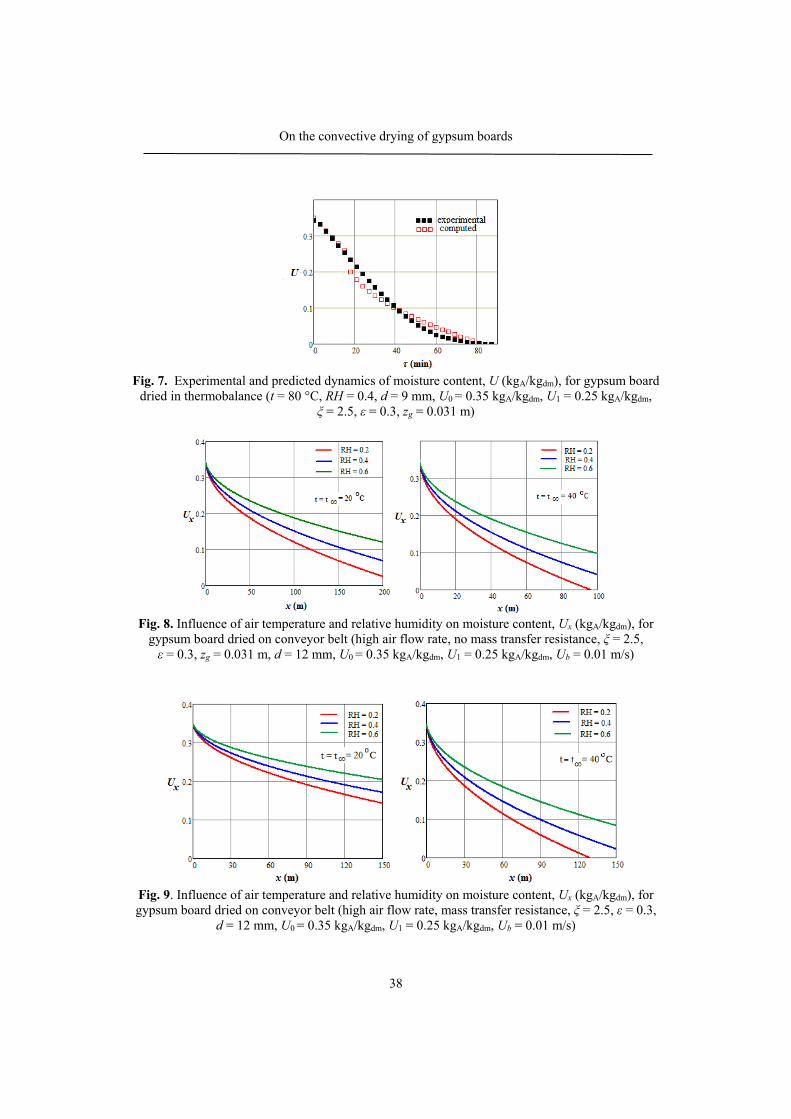
Adjustable parameters of the model were fitted according to the following algorithm [32]: (i) the value of U1 was determined from experimental drying curve dU(τ)/dτ vs. U(τ); (ii) values of zg, ε and ξ were proposed; (iii) an optimal value of zg was obtained from experimental drying curve U(τ) vs. τ and Eq. (29) for U1 ≤ U(τ) ≤ U0; (iv) optimal values of ε and ξ were determined from experimental data and Eqs. (6) and (29) for 0 < U(τ) < U1. Predicted data with parameters fitted based on the procedure presented are shown in Fig. 7 for board convective drying at 80 °C. A reasonable agreement between experimental and predicted results is observed (root mean squared errors less than 0.01).
These values of process parameters will be further used to simulate the convective drying of gypsum boards on the conveyor belt shown in Fig. 3. Simulated results presented in Figs. 8-10 highlight the following aspects: (i) the drying is more rapid for high values of air temperature and low values of air relative humidity and conveyor belt velocity; (ii) air temperature controls exponentially the driving force of the process and there are significant differences between the drying at 20 °C and that at 40 °C; (iii) air relative humidity has a linear influence on the driving force of the process; (iv) for any change of air temperature or relative humidity, the process can be easy controlled by adjusting the conveyor belt velocity. The importance of mass transfer through the air boundary layer formed on the gypsum board surface is revealed by the curves depicted in Figs. 8 and 9.
On the convective drying of gypsum boards
38
Fig. 7. Experimental and predicted dynamics of moisture content, U (kgA/kgdm), for gypsum board
dried in thermobalance (t = 80 °C, RH = 0.4, d = 9 mm, U0 = 0.35 kgA/kgdm, U1 = 0.25 kgA/kgdm, ξ = 2.5, ε = 0.3, zg = 0.031 m)
Fig. 8. Influence of air temperature and relative humidity on moisture content, Ux (kgA/kgdm), for
gypsum board dried on conveyor belt (high air flow rate, no mass transfer resistance, ξ = 2.5, ε = 0.3, zg = 0.031 m, d = 12 mm, U0 = 0.35 kgA/kgdm, U1 = 0.25 kgA/kgdm, Ub = 0.01 m/s)
Fig. 9. Influence of air temperature and relative humidity on moisture content, Ux (kgA/kgdm), for gypsum board dried on conveyor belt (high air flow rate, mass transfer resistance, ξ = 2.5, ε = 0.3,
d = 12 mm, U0 = 0.35 kgA/kgdm, U1 = 0.25 kgA/kgdm, Ub = 0.01 m/s)
Tănase Dobre, Oana Cristina Pârvulescu, Diana Matei
39
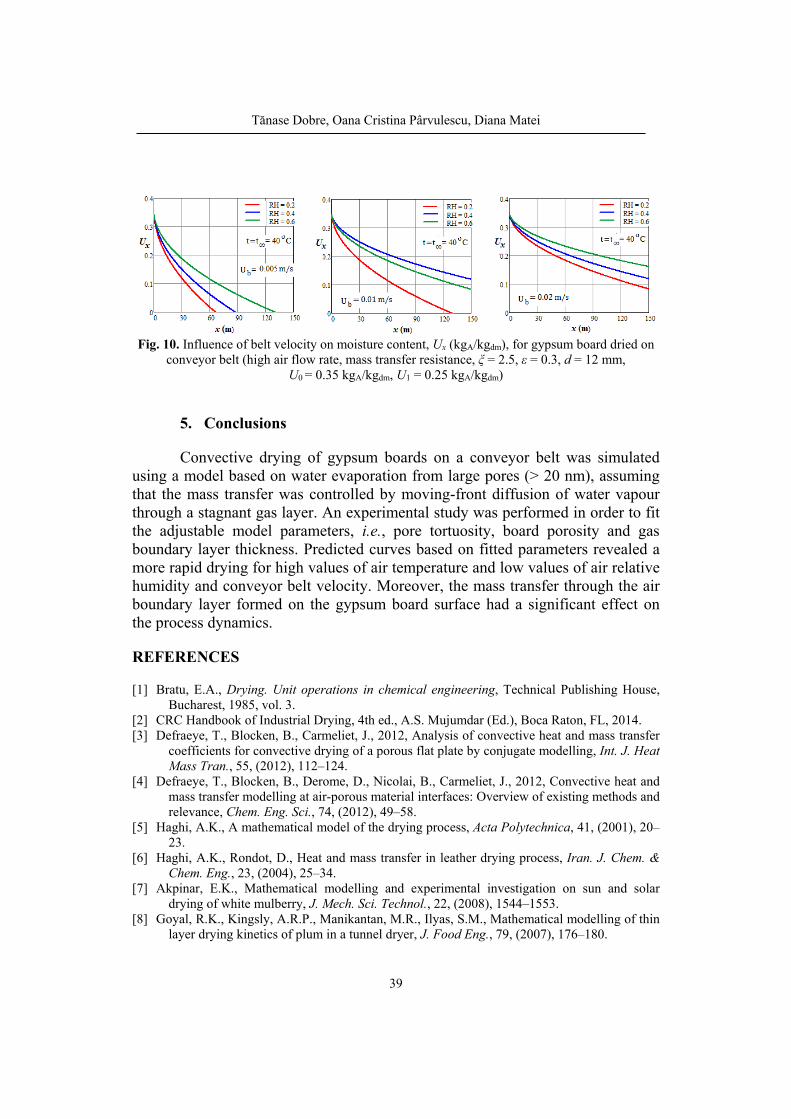
Fig. 10. Influence of belt velocity on moisture content, Ux (kgA/kgdm), for gypsum board dried on
conveyor belt (high air flow rate, mass transfer resistance, ξ = 2.5, ε = 0.3, d = 12 mm, U0 = 0.35 kgA/kgdm, U1 = 0.25 kgA/kgdm)
5. Conclusions
Convective drying of gypsum boards on a conveyor belt was simulated using a model based on water evaporation from large pores (> 20 nm), assuming that the mass transfer was controlled by moving-front diffusion of water vapour through a stagnant gas layer. An experimental study was performed in order to fit the adjustable model parameters, i.e., pore tortuosity, board porosity and gas boundary layer thickness. Predicted curves based on fitted parameters revealed a more rapid drying for high values of air temperature and low values of air relative humidity and conveyor belt velocity. Moreover, the mass transfer through the air boundary layer formed on the gypsum board surface had a significant effect on the process dynamics.
REFERENCES
[1] Bratu, E.A., Drying. Unit operations in chemical engineering, Technical Publishing House, Bucharest, 1985, vol. 3.
[2] CRC Handbook of Industrial Drying, 4th ed., A.S. Mujumdar (Ed.), Boca Raton, FL, 2014. [3] Defraeye, T., Blocken, B., Carmeliet, J., 2012, Analysis of convective heat and mass transfer
coefficients for convective drying of a porous flat plate by conjugate modelling, Int. J. Heat Mass Tran., 55, (2012), 112–124.
[4] Defraeye, T., Blocken, B., Derome, D., Nicolai, B., Carmeliet, J., 2012, Convective heat and mass transfer modelling at air-porous material interfaces: Overview of existing methods and relevance, Chem. Eng. Sci., 74, (2012), 49–58.
[5] Haghi, A.K., A mathematical model of the drying process, Acta Polytechnica, 41, (2001), 20–23.
[6] Haghi, A.K., Rondot, D., Heat and mass transfer in leather drying process, Iran. J. Chem. & Chem. Eng., 23, (2004), 25–34.
[7] Akpinar, E.K., Mathematical modelling and experimental investigation on sun and solar drying of white mulberry, J. Mech. Sci. Technol., 22, (2008), 1544–1553.
[8] Goyal, R.K., Kingsly, A.R.P., Manikantan, M.R., Ilyas, S.M., Mathematical modelling of thin layer drying kinetics of plum in a tunnel dryer, J. Food Eng., 79, (2007), 176–180.

On the convective drying of gypsum boards
40
[9] Kaleemullah, S., Kailappan, R., Modelling of thin-layer drying kinetics of red chillies, J. Food Eng., 76, (2006), 531–537.
[10] Lewis, W.K., The rate of drying of solid materials, J. Ind. Eng., 13, (1921), 427–443. [12] Yaldiz, O., Ertekin, C., Uzun, H.I., Mathematical modelling of thin layer solar drying of
Sultana grapes, Energy, 26, (2001), 457–465. [13] Henderson, S.M., Pabis, S., Grain drying theory. II. Temperature effects on drying
coefficients, J. Agric. Eng. Res., 6, (1961), 169–174. [14] Tarigan, E., Prateepchaikul, G., Yamsaengsung, R., Sirichote, A., Tekasakul, P., Drying
characteristics of unshelled kernels of candle nuts, J. Food Eng., 79, (2007), 828–833. [15] Togrul, I.T., Pehlivan, D., Mathematical modeling of solar drying of apricots in thin layers, J.
Food Eng., 55, (2002), 209–216. [16] Henderson, S.M., Progress in developing the thin layer drying equation, Transactions of the
ASAE, 17, (1974), 1167–1172. [17] Verma, L.R., Bucklin, R.A., Endan, J.B., Wratten, F.T., Effects of drying air parameters on
rice drying models, Transactions of the ASAE, 28, (1985), 296–301. [18] Page, G.E., Factors influencing the maximum rates of air drying shelled corn in thin layers,
M.S. thesis, Purdue University, Purdue, USA, 1949. [19] Overhults, D.G., White, G.M., Hamilton, H.E., Ross, I.J., Drying soybeans with heated air,
Transactions Am. Soc. Agric. Engineers, 16, (1973), 112–113. [20] Midilli, A., Kucuk, H., Yapar, Z., A new model for single layer drying of some vegetables,
Drying Technol., 20, (2002), 1503–1513. [21] Sahimi, M., Flow and transport in porous media and fractured rock: From classical methods
to modern approaches, 2nd ed., Wiley, Weinheim, Germany, 2011. [22] Surasani, V.K., Metzger, T., Tsotsas, E., Influence of heating mode on drying behavior of
capillary porous media: Pore scale modeling, Chem. Eng. Sci., 63, (2008), 5218–5228. [23] Yiotis, A.G., Tsimpanogiannis, I.N., Stubos, A.K., Yortsos, Y.C., Pore-network study of the
characteristic periods in the drying of porous materials, J. Colloid Interface Sci., 297, (2006), 738–748.
[24] Aubin, A., Ansart, R., Hemati, M., Lasuye, T., Branly, M., Modeling and simulation of drying operations in PVC powder production line: Experimental and theoretical study of drying kinetics on particle scale, Powder Technol., 255, (2014), 120–133.
[25] Souza, G.F.M.V., Miranda, R.F., Lobato, F.S., Barrozo, M.A.S., Simultaneous heat and mass transfer in a fixed bed dryer, Appl. Therm. Eng., 90, (2015), 38–44.
[26] Stakić, M, Numerical study on hygroscopic capillary-porous material drying in a packed bed, Therm. Sci., 4, (2000), 89–100.
[27] Stakić, M., Stefanović, P., Cvetinović, D. Škobalj, P., Convective drying of particulate solids – Packed vs. fluid bed operation, Int. J. Heat Mass Tran., 59, (2013), 66–74.
[28] Stakić, M., Tsotsas, E., Model-based analysis of convective grain drying processes, Drying Technol., 23, (2005), 1895–1908.
[29] Taleghani, S.T., Dadvar, M., Two dimensional pore network modelling and simulation of non-isothermal drying by the inclusion of viscous effects, Int. J. Multiphas. Flow, 62, (2014), 37–44.
[30] Wu, R., Kharaghani, A., Tsotsas, E., Capillary valve effect during slow drying of porous media, Int. J. Heat Mass Tran., 94, (2016), 81–86.
[31] Dobre, T., Pârvulescu, O.C, Stoica-Guzun, A., Stroescu, M., Jipa, I., Al Janabi, A.A., Heat and mass transfer in fixed bed drying of non-deformable porous particles, Int. J. Heat Mass Tran., 103, (2016), 478–485.
[32] Dobre, T. Sanchez Marcano, J., Chemical engineering – Modelling, simulation and similitude, 2nd ed., Wiley, Weinheim, Germany, 2007.
Bulletin of Romanian Chemical Engineering Society, Vol 3, No 2, 2016 ISSN 2360-4697
41
PRACTICES FOR REDUCING EXHAUST FLUE GAS TEMPERATURE IN REFINERY FURNACES. CASE STUDY
Sînziana RĂDULESCU, Loredana I. NEGOIŢĂ
Petroleum Processing and Environmental Engineering Department, Petroleum-Gas University of Ploiesti, 39, Bucuresti Avenue, Ploiesti,
Romania
Abstract The paper presents a case study of two systems to reduce the exhaust gas
temperature in a furnace from a hydrofiner unit. The first variant proposes to optimise the real thermal balance and supplementary thermal flow recovery to furnace for a secondary fluid heating from unit and the second variant propose renouncing to air preheating and revamping the furnace with a heat recovery for steam. The actual version of the operating furnace was simulated with PRO/II process simulation program. Malfunctioning with a high real flow rate air makes to decrease the evacuated flue gases temperature and this fact increase the furnace efficiency. The thermal balance and technological analyse to furnace were performed. Their aim was to estimate the thermal values and the heat transfer coefficients with which the furnace works now. Both proposal systems are compared and determined the advantages and disadvantages of choosing one or another variant. There are set out the technological and economical arguments.
Key words: Furnace, combustion, flue gases, heat recovery
1. Introduction
In petroleum refineries, a large quantity of hot flue gases is generated from furnaces as waste heat. If some of this waste heat could be recovered, a considerable amount of fuel could be saved. The practice of how to recover this heat depends in part on the exhaust temperature of the hot flue gases and the economics involved. Once with flue gas evacuation occur the largest heat losses in furnaces with the loss of flue gas enthalpy. The high exit temperature of flue gases means that a major part of the energy used in the process is simply wasted.
Corresponding author: E-mail address: [email protected]
Practices for reducing exhaust flue gas temperature in refinery furnaces. Case study
42
A common practice to lower flue gas enthalpy is preheating combustion air with hot flue gases (waste gases exhausted). The preheating the combustion air offers the most effective way to increase furnaces efficiency, but not the only. Heat recovery from furnace exhausted flue gas in order to produce steam and preheating process fluids as oil fractions or petroleum products with hot flue gases are other practices [1 – 5].
The paper presents a case study of two systems to reduce the exhaust gas temperature in a furnace from a hydrofiner unit. An oil fraction is heated and vaporized in furnace, by taking over heat from flue gases resulting from combustion of a fuel gases. The furnace is vertical cylindrical type, and the fuel gas used is a refinery mixture of gases and sulphur - free. It is equipped with air preheater, placed in the convection section, overhead the feedstock coils and before the evacuation of combustion gases via a chimney. The preheater provides the preheating combustion air with the exhaust flue gases.
Analysing flue gases, the excess air coefficient was calculated. The value of excess air coefficient is 1.6 and it is very high by comparing with specified values of literature using fuel gases.
This paper has two main objectives: one is to realise the thermal balance on the furnace in actual operation, and the other is to realise the optimized thermal balance on analyzed furnace. Also, the influence of air preheating on combustion process is highlighted.
2. Case study
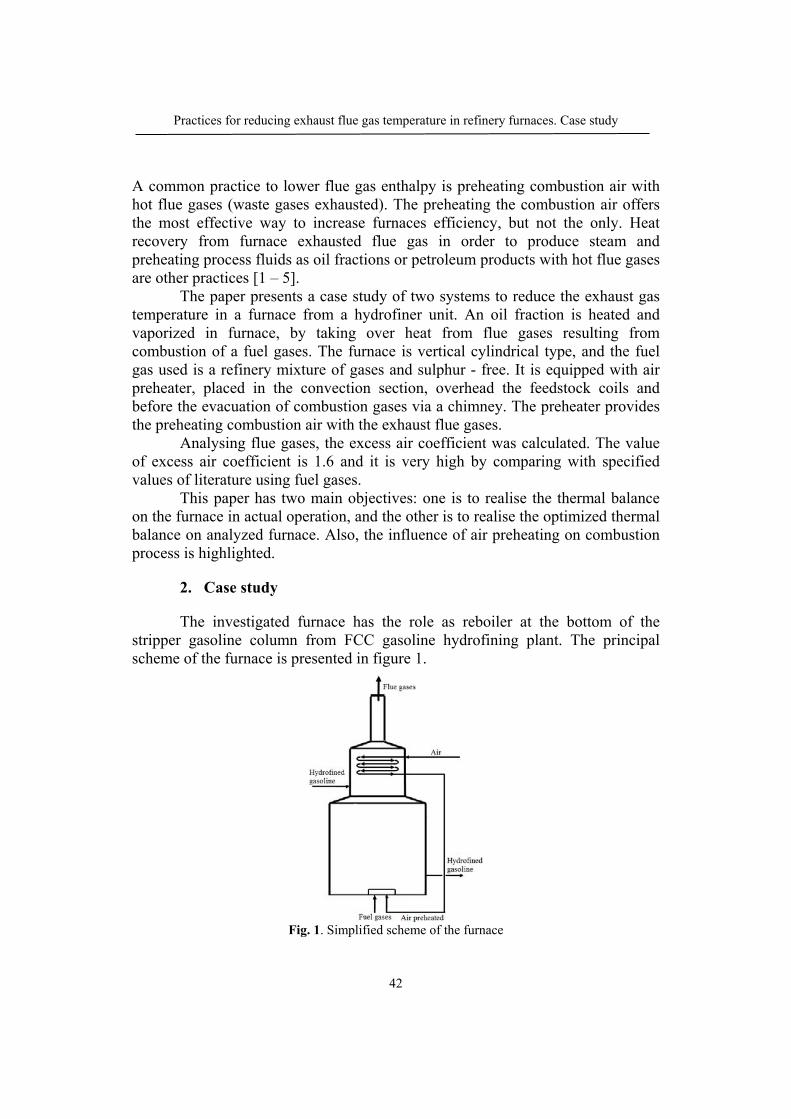
The investigated furnace has the role as reboiler at the bottom of the stripper gasoline column from FCC gasoline hydrofining plant. The principal scheme of the furnace is presented in figure 1.
Fig. 1. Simplified scheme of the furnace
Sînziana Rădulescu, Loredana Irena Negoiţă
43
The flue gases stream is formed in combustion process, through the rapid oxidation reactions of hydrocarbons from fuel with atmospheric oxygen. Between radiation section and convection section the threshold temperature of the flue gases stream is 385 ºC. The flue gases stream transfers its heat to hydrofined gasoline circulating downward through serpentines of the convection and radiation sections, and to air circulating through serpentines of the air preheater placed above the convection section. The air enters in preheater at 15 ᵒC and 1 bar and exits at 220 ᵒC. After crossing ascending through radiation and convection sections, the temperature of exhaust flue gases stream is 190 ᵒC.
In the radiation section most of the useful heat is transferred through the radiation mechanism from flue gases and refractory walls and less through convection mechanism. The remained useful heat is transferred in convection section through radiation and convection mechanisms from flue gases and refractory walls. Table 1 show the parameters values used for the achievement of global heat balance.
Table 1 Data parameters values
Parameter Value Units
Hydrofined gasoline flow rate 239 m3/h
Inlet hydrofined gasoline temperature in furnace 210 oC
Outlet hydrofined gasoline temperature at furnace 224 oC
Inlet hydrofined gasoline pressure in furnace 15 bar
Outlet hydrofined gasoline pressure at furnace 13.5 bar
The fuel gases flow rate 540 Nm3/h
Fuel gases temperature 90 oC
Fuel gases pressure 1.57 bar
Air temperature 15 oC
Air preheat temperature 220 oC
Inlet air pressure into preheater 1 bar
Calorific power fuel gases 42521 kJ/kg
Threshold temperature of the flue gases 385 oC
Exit temperature of flue gases (at the chimney) 190 oC
Global heat balance The global heat balance equation is:
lQfgQuQdevQ (1)
where: Qdev - the developed heat flow to fuel combustion, Qu - the transferred useful heat flow to hydrofined gasoline, Qfg - the lost heat flow with exhaust flue

Practices for reducing exhaust flue gas temperature in refinery furnaces. Case study
44
gases (at the chimney), Ql – the lost heat flow through the walls of the furnace (kJ/h).
The developed heat flow is calculated from:
air
iB
ii
HBdev
Q (2)
where: B - fuel gases flow rate (kg/h), Hi - the calorific power of gaseous fuel, iB - the enthalpy of fuel gases at the inlet temperature in furnace, iair - the enthalpy of air at the inlet temperature in preheater (kJ/kg).
The transferred useful heat flow to hydrofined gasoline can be calculated with the following relation:
i
gasi_o
gasi
gasm
uQ (3)
where: mgas - the hydrofined gasoline flow rate (kg/h), igasi - the enthalpy of
hydrofined gasoline at the inlet temperature in furnace, ogasi - the enthalpy of
hydrofined gasoline at the outlet temperature in furnace (kJ/kg). The lost heat flow with exhaust flue gases can be calculated with the
following relation: tcfgi fgmfgQ (4)
where mfg is exhaust flue gases mass flow rate (kg/h) and tcfgi represents the
enthalpy of the exhaust flue gases (kJ/kg). If a reduction of the exhaust flue gas temperature is desired for the same
values of Qdev, Qu and Qp in the furnace it is obtained a supplementary heat flow (Qfgs). In this case the global heat balance equation can be written as:
lQ
fgsQQuQdevQ req
fg (5)
where reqfgexQ the lost heat flow with exhaust flue gases at required temperature
(kg/h).
reqfg
ifg
mreqfgQ (6)
where reqfg
i is enthalpy of exhaust flue gases at required temperature (kJ/kg).

Sînziana Rădulescu, Loredana Irena Negoiţă
45
The thermal efficiency The thermal efficiency of furnace can be calculated with the following relation:
%,devQuQ
100 (7)
3. Results and discussions
As noted above, the combustion takes place with an excess air coefficient of 1.6 in the actual operation of the furnace. The practice has shown that the fuel gases combustion in furnace is optimal for excess air coefficient ranges values between 1.05 and 1.2 [1]. Therefore, was performed the optimized heat balance for an excess air coefficient of 1.1 and an exhaust flue gases temperature of 150ᵒC, less than that measured in the actual operation of the furnace.
After the computing of the thermal balance on the furnace in actual operation, there was performed an optimization of thermal balance by proposing two variants for optimization:
1. The use an excess air values in accordance with the literature and a lower exhaust flue gas temperature. In this variant, there are calculated the supplemental heat flow which can be recovered.
2. In second variant, there are calculated the heat flow which can be recovered if there is no combustion air preheating.
The classic calculation model with relations described above and PRO/II® process simulation software was used for the actual variant and two optimized variants of thermal balance. The results obtained with the classical model and PRO/II® there are comparable.
The calculated values for the heat flows involved in actual and optimized global heat balance of the furnace are shown in table 2.
Table 2 The values of the heat flows
Heat flow
Global heat balance
Actual Optimized
Variant 1 Variant 2
The developed heat flow to fuel combustion, kW 4585
The transferred useful heat flow to hydrofined gasoline, kW 3509
The lost heat flow with exhaust flue gases, kW 1041 337
The lost heat flow with exhaust flue gases, % 22.7 7.4
The lost heat flow through the walls of the furnace, kW 35.6
The lost heat flow through the walls of the furnace, % 0.8
Supplementary heat flow, kW - 243 500
Practices for reducing exhaust flue gas temperature in refinery furnaces. Case study
46
As a result of actual thermal balance analysis it could be noted: Online oxygen analyzers for flue gas indicate 7.8 % oxygen content;
with this flue gas oxygen content an excess air coefficient of 1.6 was calculated, that is higher than the recommended values in literature [1];
The threshold temperature of 385oC and the flame temperature of 1660oC (computed) highlights that too large excess air dilutes both flame temperature and temperature in the firebox of furnace; so, flue gases temperatures in the ascending course of furnace are lower compared to flue gases temperatures when the excess air is lower;
The preheat air flow rate is not measured, so can not make a comparison with the air flow rate resulting from the flue gas analysis;
A part of the excess oxygen may come from the introduction of false air in the furnace, through leaks;
Preheating the combustion air increases flame temperature and efficiency of the combustion process.
The results obtained for first optimized variant of the thermal balance obtained in PRO/II® are the following:
The threshold temperature increased to 460oC, and the outlet hydrofined gasoline temperature at furnace is 224oC;
The supplemental heat flow is 243 kW; The supplemental heat flow can be recovered in a secondary stream
from plant or it can be used to obtain low pressure steam (for example: ~ 600 kg/h steam, 4 bar).
The results obtained for the last one version optimized variant of the thermal balance, also obtained in PRO/II®, are the following:
The threshold temperature can not grow more than 425oC for same outlet hydrofined gasoline temperature at furnace;
The recovered heat flow is 500 kW (for example: 750 kg/h steam, 4 bar).
The thermal efficiency of furnace in the actual operation is 76,5 % and by reducing the excess of air with 10 % and the exhaust flue gases temperature to 150ᵒC the thermal efficiency increases at 87,4 %. If the furnace would operate in actual conditions but with an excess air coefficient of 1.1, the exhaust flue gases temperature would be 270ᵒC, higher than the current temperature.
6. Conclusions
This paper has two main objectives. One is to realise the thermal balance on the furnace from a gasoline hydrofiner unit in actual operation, and the other is to realise the optimized thermal balance on analyzed furnace. Comparing simulation results obtained for two variants of optimized heat balance, it can be concluded:

Sînziana Rădulescu, Loredana Irena Negoiţă
47
The preheat air contributes to a better combustion process, so in the industry the furnaces equipped with preheater are preferred;
A higher excess air coefficient decreases flue gases temperature in furnace, therefore this caused the threshold and exhaust flue gas temperatures to decrease;
If the flue gases temperature in the firebox decreases, then the heat flow transferred in furnace and the outlet temperature of hydrofined gasoline will decrease;
We recommend first variant of optimized thermal balance, because it can increase slightly the outlet temperature of hydrofined gasoline, and additionally, it can recover a supplemental heat flux in the furnace;
The first variant has technological advantages by increasing the outlet temperature of hydrofined gasoline and supplemental heat flow recovery, and more than that, can be make economic investment by implementing a heat recovery device in the furnace.
REFERENCES
[1] Dobrinescu, D., Bovey F.A., Winslow, M. C., Procese de transfer termic şi utilaje specifice, Editura Didactică şi Pedagogică, Bucureşti 1983.
[2] Atreya, A., A Novel Method of Waste Heat Recovery from High Temperature Furnaces, ACEEE Summer Study on Energy Efficiency in Industry, 6-10-6-18, 2007, Available at http://pauthoring.energytaxincentives.org/files/proceedings/2007/data/papers/67_6_063.pdf.
[3] Andrews, J., Jelley, N., Jelley, N. A., Energy Science: Principles, Technologies, and Impacts, Oxford University Press, United Kingdom 2013.
[4] Masoumi, M. E., Izakmehri, Z., Improving of Refinery Furnaces Efficiency Using Mathematical Modeling, International Journal of Modeling and Optimization, 1(1), (2011), 74-79.
[5] von Gersum, S., Adler, W., Bender, W., Energy-efficient furnace heating – Regenerative heat recovery with flat flame burners, Heat Processing, 2, (2011), 170-173.
Bulletin of Romanian Chemical Engineering Society, Vol 3, Nr 2, 2016 ISSN 2360-4697
48
TRENDS INTO THE PROPYLENE – PROPANE DISTILLATION SIMULATION USING UNISIM DESIGN
SIMULATOR
Cristian PĂTRĂŞCIOIU, CAO MINH AHN
Petroleum – Gas University of Ploiesti, Control, Computer & Electronic Department, 39 Bucuresti Avenue, Ploiesti, Romania
Abstract The propylene – propene distillation process is an important source to make the
poly-propylene and the plastics. The distillation process is known but in same time the process is very complex. The distributed and the multivariable character represent two important characteristics of this process. The distillation columns with the thermal pump are structural different with the classical distillation process. The authors have studied the possibility of the simulation of the distillation column with thermal pump. The simulation diagram design expects three steps: the emulation of the distillation column using the mathematical absorption model; the setting of the absorption model specifications to the distillation column requirements; the simulation diagram completion with thermal pump equipment.
Key words: distillation, absorption, simulation, Unisim Design
1. Introduction
The propylene – propene distillation process is the main source to make poly-propylene and plastic materials. The distillation process is very known and very studied. In same time, the process has a high complexity, the distributed and multivariable character represent its two main characteristics. Many studies refer to the classical process, respectively the industrial process characterized by a distillation column, condenser and reboiler [1, 2]. Another distillation process is represented by the distillation column with thermal pump [3, 4].
To process sensibility study and to quality control systems design and testing, distillation process simulation is necessary. The most important simulation programs are HYSYS with commercial product Unisim Design [5] and PRO II [6]. The simulators analyze has generated the next classification:
simulators only for steady state (PRO II) and general simulators used for steady state and dynamic simulation (Unisim Design),
Corresponding author: Email address: [email protected]
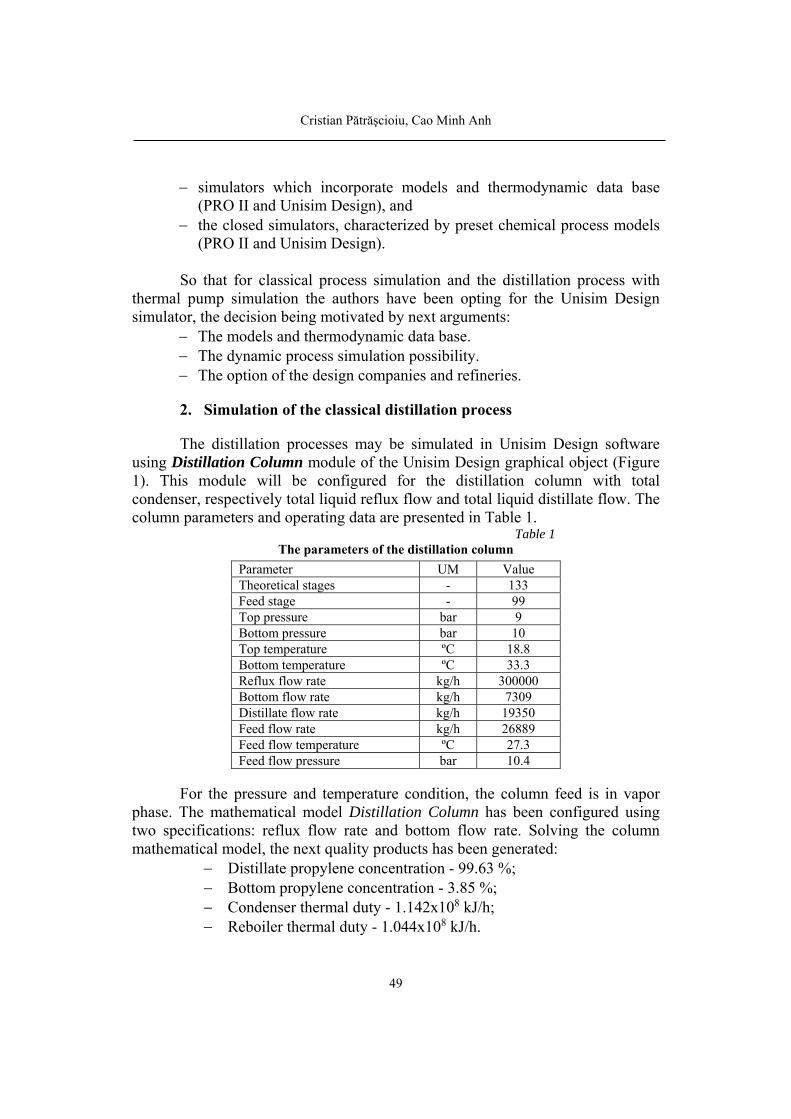
Cristian Pătrăşcioiu, Cao Minh Anh
49
simulators which incorporate models and thermodynamic data base (PRO II and Unisim Design), and
the closed simulators, characterized by preset chemical process models (PRO II and Unisim Design).
So that for classical process simulation and the distillation process with
thermal pump simulation the authors have been opting for the Unisim Design simulator, the decision being motivated by next arguments:
The models and thermodynamic data base. The dynamic process simulation possibility. The option of the design companies and refineries.
2. Simulation of the classical distillation process
The distillation processes may be simulated in Unisim Design software using Distillation Column module of the Unisim Design graphical object (Figure 1). This module will be configured for the distillation column with total condenser, respectively total liquid reflux flow and total liquid distillate flow. The column parameters and operating data are presented in Table 1. Table 1
The parameters of the distillation column
Parameter UM Value Theoretical stages - 133 Feed stage - 99 Top pressure bar 9 Bottom pressure bar 10 Top temperature ºC 18.8 Bottom temperature ºC 33.3 Reflux flow rate kg/h 300000 Bottom flow rate kg/h 7309 Distillate flow rate kg/h 19350 Feed flow rate kg/h 26889 Feed flow temperature ºC 27.3 Feed flow pressure bar 10.4
For the pressure and temperature condition, the column feed is in vapor
phase. The mathematical model Distillation Column has been configured using two specifications: reflux flow rate and bottom flow rate. Solving the column mathematical model, the next quality products has been generated:
Distillate propylene concentration - 99.63 %; Bottom propylene concentration - 3.85 %; Condenser thermal duty - 1.142x10⁸ kJ/h; Reboiler thermal duty - 1.044x10⁸ kJ/h.

Trends into the propylene – propane distillation simulation using Unisim Design simulator
50
This results have been used to show the statically characteristics of the distributed distillation column system. From the five characteristics, the temperature profile is presented.
Fig.1. Configuration window of the Distillation Column module
Fig. 2. Temperature profile of the distillation colum
Comparing the obtained simulation results with the product quality
specifications ( %.xiD 699 and %.xi
B 144 ), it could be considered that the process model is validated.

Cristian Pătrăşcioiu, Cao Minh Anh
51
3. Simulation of the distillation column with the thermal pump
The authors have studied the possibility of the simulation of the distillation column with thermal pump. The simulation diagram design expects three steps:
the emulation of the distillation column using the mathematical absorption model;
the setting of the absorption model specifications to the distillation column requirements;
the simulation diagram completion with thermal pump equipment [4].
3.1. The structure of the distillation column with the thermal pump The classically distillation column are different versus the distillation
column with thermal pump. Figure 3 presents the structure of this distillation column [3, 7]. The column condenser is eliminated and the top column vapors being compressed with a compressor. This compressed vapors are used as thermal fluid into reboiler column. The vapors are condensed using a pressure valve. The mix liquid and vapors obtained is collected in reflux vessel. From this vessel the reflux flow and the distillate flow is collected. The bottom column remains unchanged versus the classical distillation column.
Fig. 3. The new distillation column structure.
. 3.2. Simulation of the distillation column using absorption model The authors have studied the possibility to change the distillation
mathematical model with the absorption mathematical model [8]. The first

Trends into the propylene – propane distillation simulation using Unisim Design simulator
52
author’s research has been published in [4]. In this paper there are presented the author’s new results. The Unisim simulation diagram contains an absorption column model (Reboiler Absorber) with reboiler. For the configuration of the Reboiled Absorber (RA) module the same parameters as the classical distillation column model data are used. The main specifications of the simulation diagram are:
a) The reflux flow of the Reboiled Absorber model is characterized by temperature, 15.5 ºC, pressure, 900 kPa, flow rate, 299944 kg/h and composition, 0.9945 propylene molar fraction.
b) The Reboiled Absorber module has a single specification, the flow rate of bottom product, 7300 kg/h.
c) The Condens flow has two specifications, the vaporized fraction (0 for liquid phase) and temperature, 15.6 ºC.
d) The Reflux 1 flow is configured only with flow rate, 299944 kg/h. The simulation diagram uses the Recycle function to equilibrate the
calculated (Reflux 1 flow) and imposed (Reflux flow) values of the reflux composition.
Fig. 4. The simulation of the Reboiler Absorption diagram
The simulation diagram has been tested in same conditions as well as tests with the classical distillation column. In Table 2 there are presented comparative results between the Distillation Column (DC) diagram and the (RA). Because the

Cristian Pătrăşcioiu, Cao Minh Anh
53
obtained results are similar, the substitute of the Distillation Column model with RA model is possible. Table 2
Comparative results between the Distillation Column (DC) simulation diagram and the
Reboiler Absorption (RA) diagram
Feed [kg/h]
Vapors flow rate 510 [kg/h]
Reboiler thermal duty 810 [kJ/h]
Propylene distillate concentration
Propylene bottom concentration
DC RA DC RA DC RA DC RA 25000 3.176 3.177 1.047 1.047 0.9978 0.9964 0.0757 0.0734 25500 3.182 3.182 1.046 1.047 0.9973 0.9964 0.0569 0.0557 25750 3.185 3.184 1.046 1.046 0.9971 0.9964 0.0477 0.0468 26000 3.188 3.187 1.046 1.046 0.9968 0.9963 0.0386 0.0380 26250 3.190 3.190 1.045 1.045 0.9965 0.9963 0.0297 0.0297 26500 3.192 3.192 1.046 1.046 0.9960 0.9963 0.0222 0.0227 26750 3.195 3.194 1.045 1.046 0.9953 0.9962 0.0142 0.0258 26889 3.196 3.196 1.045 1.047 0.9947 0.9962 0.0107 0.0128 27139 3.199 3.197 1.045 1.046 0.9931 0.9961 0.0056 0.0100 27389 3.200 3.200 1.046 1.045 0.9910 0.9960 0.0037 0.0063 27639 3.203 3.202 1.045 1.046 0.9881 0.9959 0.0027 0.0045 27889 3.206 3.204 1.045 1.046 0.9853 0.9957 0.0023 0.0033
3.3 Setting of the absorption model specifications to the distillation
column requirements
The differences between the results obtained by these mathematical models are generated by the different specification of the reflux composition. The authors have been developed a special technique offered by Unisim Design. So, there has been used two mathematical models, respectively Distillation Column and Reboiler Absorption in the same simulation diagram. The Distillation Column module generates the reflux composition. A special function permits the export of the concentration values of the reflux flow from the Distillation Column module into Reboiler Absorption module. The configuration of this function, Optimizer Spreadsheet, needs to define the next steps:
a) Connections. This function defines the data source, respectively the variables defined into the B1 and B2 cells (propylene and propane concentration in the Reflux flow of the distillation column) and the destination data, respectively the variables defined into B3 and B4 cells (propylene and propane concentration in the Reflux1 flow of the absorption column) (Figure 5).
b) Formulas. This function is used to define the relationship between the destination and source variables (Figure 6).
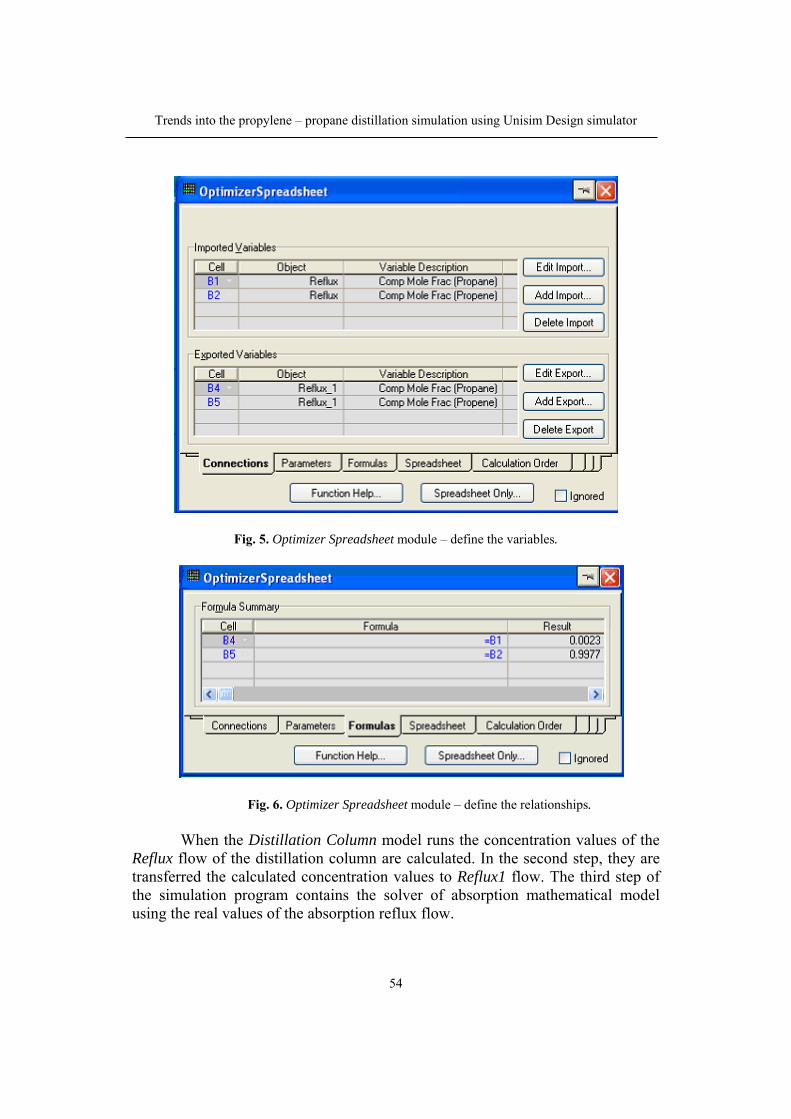
Trends into the propylene – propane distillation simulation using Unisim Design simulator
54
Fig. 5. Optimizer Spreadsheet module – define the variables.
Fig. 6. Optimizer Spreadsheet module – define the relationships. When the Distillation Column model runs the concentration values of the
Reflux flow of the distillation column are calculated. In the second step, they are transferred the calculated concentration values to Reflux1 flow. The third step of the simulation program contains the solver of absorption mathematical model using the real values of the absorption reflux flow.
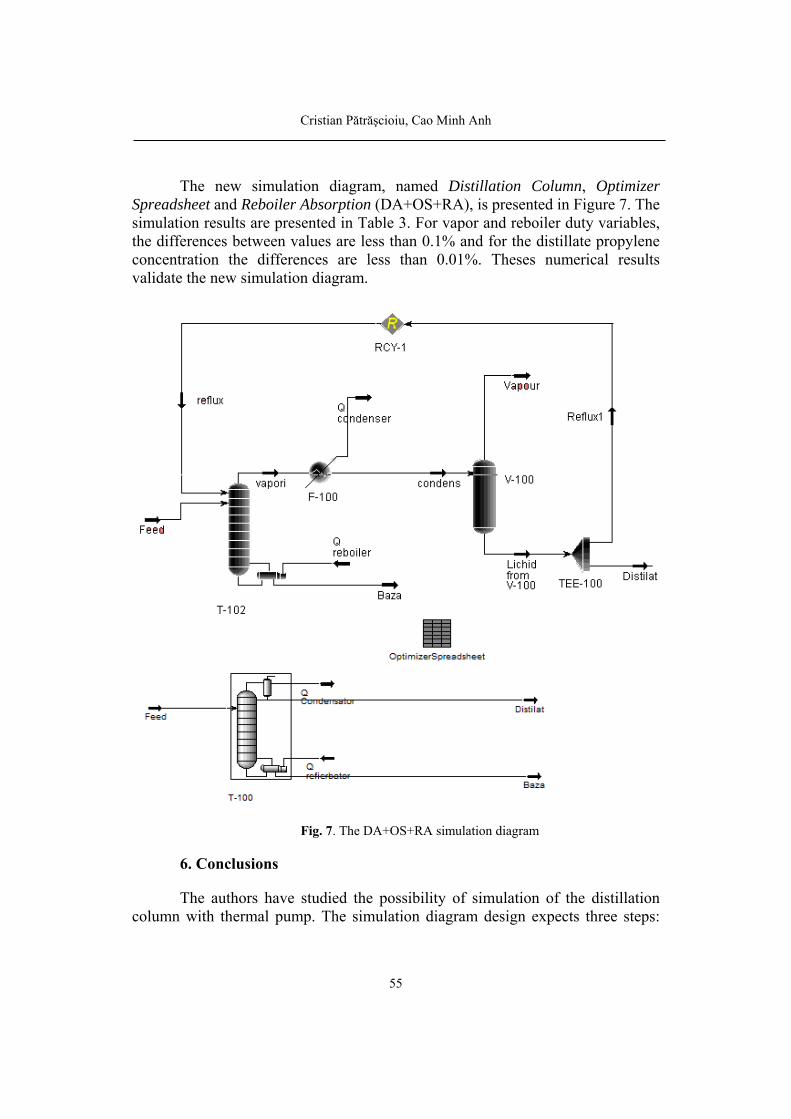
Cristian Pătrăşcioiu, Cao Minh Anh
55
The new simulation diagram, named Distillation Column, Optimizer Spreadsheet and Reboiler Absorption (DA+OS+RA), is presented in Figure 7. The simulation results are presented in Table 3. For vapor and reboiler duty variables, the differences between values are less than 0.1% and for the distillate propylene concentration the differences are less than 0.01%. Theses numerical results validate the new simulation diagram.
Fig. 7. The DA+OS+RA simulation diagram
6. Conclusions
The authors have studied the possibility of simulation of the distillation column with thermal pump. The simulation diagram design expects three steps:
Trends into the propylene – propane distillation simulation using Unisim Design simulator
56
the emulation of the distillation column using the mathematical absorption model; the setting of the absorption model specifications to the distillation column requirements; the simulation diagram completion with thermal pump equipment.
The distillation column has been simulated using the absorption model with the Reboiled Absorber module. A special attention has been accorded to implement the Recycle function to assure the concordance between the composition of the reflux flow (imposed by user) and the calculated composition of the outlet flow of the reflux vessel. The simulation diagram has been tested in same conditions as well as tests with the classical distillation column. The differences between the results obtained by these mathematical models are generated by the different specification of the reflux composition. The authors have been developed a special technique offered by Unisim Design. So, there has used two mathematical models, respectively Distillation Column and Reboiler Absorption in same simulation diagram. The Distillation Column module generates the reflux composition. A special function permits the export of the concentration values of the reflux flow form the Distillation Column module into Reboiler Absorption module. The new simulations have validated the proposed simulation diagram.
REFERENCES
[1] Patrascioiu, C., Cao Minh Anh, Popescu, M., Control of propylene - propane distillation process using Unisim Design, 19th International Conference on System Theory, Control and Computing, October 14 - 16, 2015, Cheile Gradistei - Fundata Resort, Romania, 747 – 752.
[2] Patrascioiu, C., Paraschiv, N., Anh Cao Minh, Popescu, M., Robust Control of Industrial Propylene-Propane Fractionation Process, Computer Aided Chemical Engineering, 37, (2015), 1745-1750.
[3] Sneider, D. F., Heat Integration Complicates Heat Pump Troubleshooting, Stratus Engineering, Don Sneider, 2001.
[4] Patrascioiu, C., Modelling and Simulation of the Freezing Systems and Heat Pumps Using Unisim® Design, International Journal of Chemical, Molecular, Nuclear, Materials and Metallurgical Engineering, 10(5), (2016), 514-519.
[5] *** Process Modelling using UniSim Design, Student Guide 4526, Honeywell, 2009. [6] http://iom.invensys.com/AP/Pages/SimSci_ProcessEngSuite_PROII.aspx [7] Taboada, R., Ferreira. C. I., Compression Resorption Cycles in Distillation Columns,
International Refrigeration and Air Conditioning, Conference at Purdue, Paper 912, July 14-17, 2008.
[8] *** NGL Fractionation Train, © 2003 AspenTech, EA1031.31.05.

Bulletin of Romanian Chemical Engineering Society, Vol 3, No 2, 2016 ISSN 2360-4697
57
STUDIES ON THE GERMINATION CHANGE OF PLANTS AFTER DECONTAMINATION OF SOILS
THAT ARE POLLUTED WITH CRUDE OIL
Maria POPA
Petroleum-Gas University of Ploieşti, 39 Bucureşti Avenue, Ploieşti, Romania,
Abstract
This paper is part of a comprehensive study on soil pollution with liquid petroleum products. It is known that soil affect plants through its physical characteristics, chemical (nutrients content, pH) and biological. The coordinator of an action of a compliant ground contaminated with petroleum products must bear in mind when choosing and implementing a remediation technologies four determinants: the final remediation degree desired or required, duration of the remediation actions, the total cost required to conduct routine cleaning, side effects produced during the implementation of pollution control technologies and their application. Remediation technologies of soil contaminated with petroleum products do not respond optimally while the four factors listed. This paper aims to emphasize the germination of plants after a polluted soil sample was decontaminated by an extraction method, successive extraction with solvents. The soil sample was polluted with 5% crude oil. The soil sample was characterized by capillarity, establishing maximum height for water and for crude oil, permeability for water and for crude oil and granulometry. Knowing the average permeability can be determined and the corresponding retention capacity for water and for crude oil. Restoration potential for germination and soil analysed to determine the presence of nutrients required before and after remediation. Nitrogen, phosphorus and potassium nutrients were analysed. Key words: soil polluted, nutrients, successive extraction, germination, oil products
1. Introduction
Soils and groundwater remediation technologies vary a lot, starting from the principles they are based on and the way in which they are realized practically. There is a constant preoccupation for research all around the world regarding the remediation for soils polluted with diverse petroleum products. Concerns are mainly aimed at thermal and biological ways of remediation [1-7]. This paper brings up remediation method by successive extractions with solvents. This is part of a large study that highlights on the one hand the physical properties
Email address: [email protected]
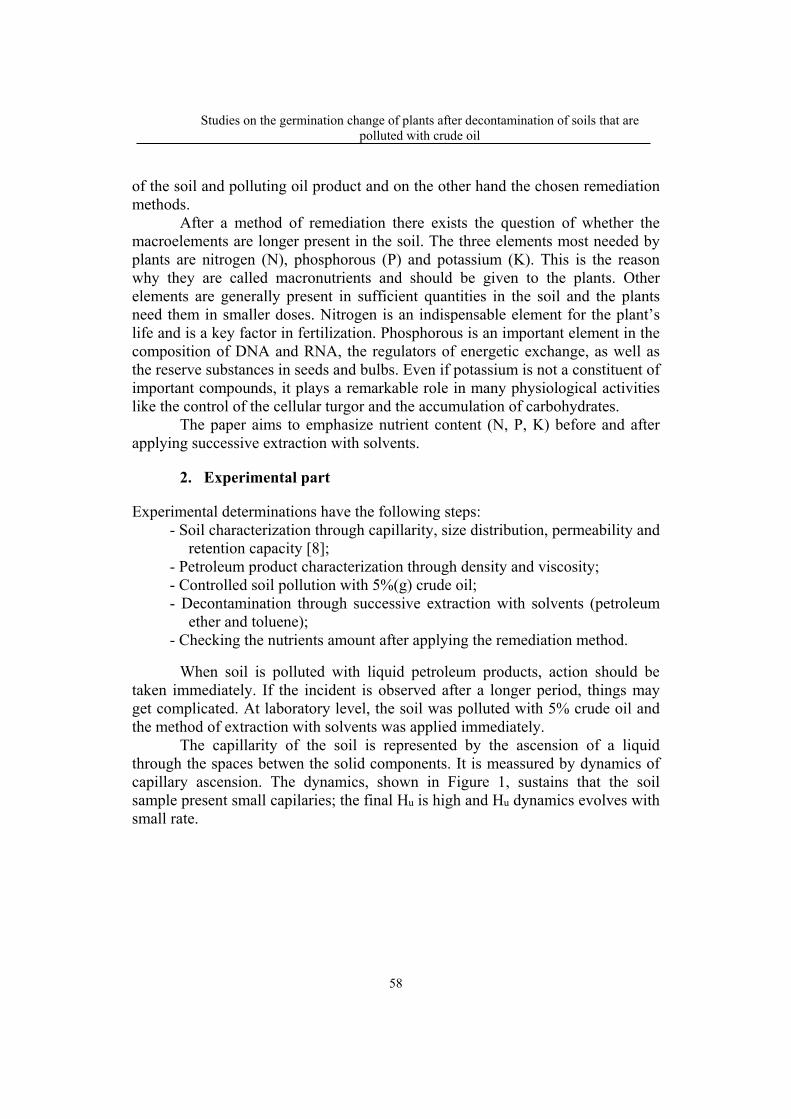
Studies on the germination change of plants after decontamination of soils that are polluted with crude oil
58
of the soil and polluting oil product and on the other hand the chosen remediation methods. After a method of remediation there exists the question of whether the macroelements are longer present in the soil. The three elements most needed by plants are nitrogen (N), phosphorous (P) and potassium (K). This is the reason why they are called macronutrients and should be given to the plants. Other elements are generally present in sufficient quantities in the soil and the plants need them in smaller doses. Nitrogen is an indispensable element for the plant’s life and is a key factor in fertilization. Phosphorous is an important element in the composition of DNA and RNA, the regulators of energetic exchange, as well as the reserve substances in seeds and bulbs. Even if potassium is not a constituent of important compounds, it plays a remarkable role in many physiological activities like the control of the cellular turgor and the accumulation of carbohydrates. The paper aims to emphasize nutrient content (N, P, K) before and after applying successive extraction with solvents.
2. Experimental part
Experimental determinations have the following steps: - Soil characterization through capillarity, size distribution, permeability and
retention capacity [8]; - Petroleum product characterization through density and viscosity; - Controlled soil pollution with 5%(g) crude oil; - Decontamination through successive extraction with solvents (petroleum
ether and toluene); - Checking the nutrients amount after applying the remediation method.
When soil is polluted with liquid petroleum products, action should be taken immediately. If the incident is observed after a longer period, things may get complicated. At laboratory level, the soil was polluted with 5% crude oil and the method of extraction with solvents was applied immediately. The capillarity of the soil is represented by the ascension of a liquid through the spaces betwen the solid components. It is meassured by dynamics of capillary ascension. The dynamics, shown in Figure 1, sustains that the soil sample present small capilaries; the final Hu is high and Hu dynamics evolves with small rate.

Maria Popa
59
Fig.1. Dynamics of height of capillary ascension
The soil permeability is its property to allow the flowing of a liquid through its structure. The liquid volume was checked from 15 to 15 minutes [8]. Experimental data are presented in Table 1.
Table 1
The permeability and retention capacity of the clean soil analysed
1 2
1. Soil type A
2. Liquid Water Crude oil
3. m0,g 368,2 320
4 Hlayer,cm 12,5 10
5. Dlayer,cm 4 4
6. Vlayer,cm3 157 103,2
7. V15, cm3 36 7
8. V30, cm3 81 11
9. V45, cm3 116 14
10. V60, cm3 151 18
11. mf,g 448 357,2
12. P15,cm3/h 144 28
13. P30,cm3/h 162 22
14. P45,cm3/h 154,67 18,67
15. P60,cm3/h 151 18
16. Pm, cm3/h 145,42 21,67
17. CR,kg/m3soil 508,28 360,5
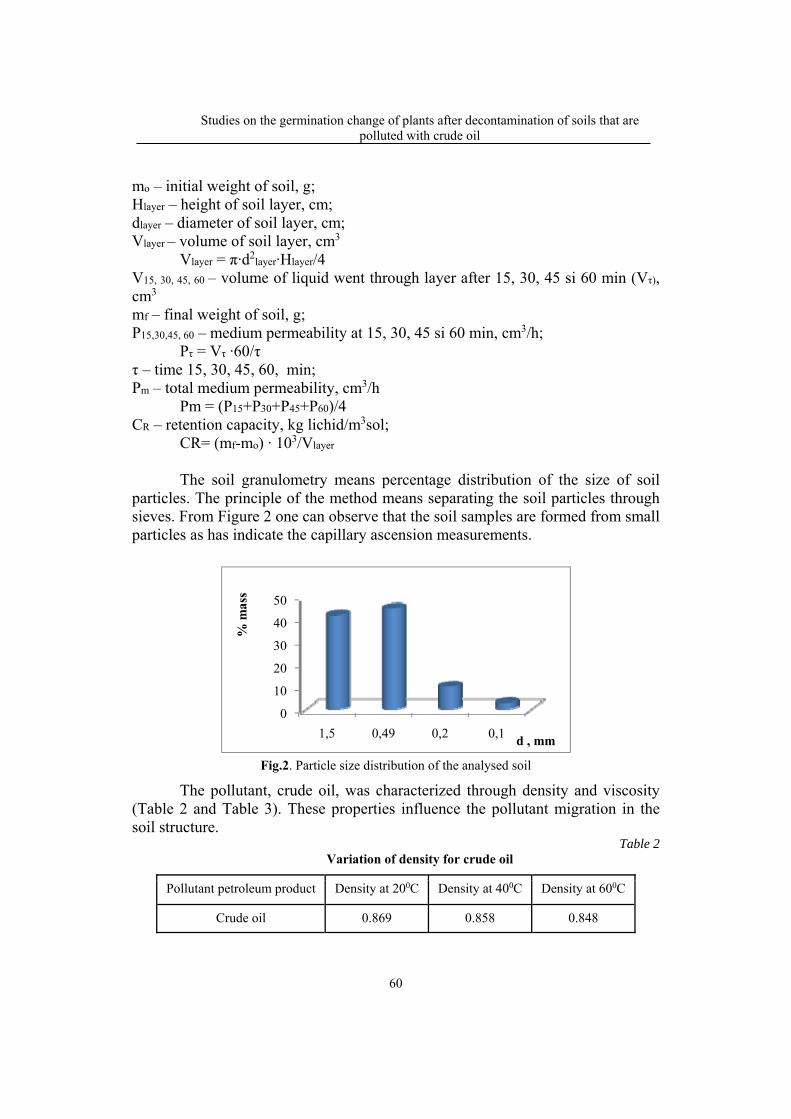
Studies on the germination change of plants after decontamination of soils that are polluted with crude oil
60
mo – initial weight of soil, g; Hlayer – height of soil layer, cm; dlayer – diameter of soil layer, cm; Vlayer – volume of soil layer, cm3 Vlayer = π∙d2
layer∙Hlayer/4 V15, 30, 45, 60 – volume of liquid went through layer after 15, 30, 45 si 60 min (Vτ), cm3 mf – final weight of soil, g; P15,30,45, 60 – medium permeability at 15, 30, 45 si 60 min, cm3/h; Pτ = Vτ ∙60/τ τ – time 15, 30, 45, 60, min; Pm – total medium permeability, cm3/h Pm = (P15+P30+P45+P60)/4 CR – retention capacity, kg lichid/m3sol; CR= (mf-mo) ∙ 103/Vlayer
The soil granulometry means percentage distribution of the size of soil particles. The principle of the method means separating the soil particles through sieves. From Figure 2 one can observe that the soil samples are formed from small particles as has indicate the capillary ascension measurements.
0
10
20
30
40
50
1,5 0,49 0,2 0,1
% m
ass
d , mm
Fig.2. Particle size distribution of the analysed soil
The pollutant, crude oil, was characterized through density and viscosity (Table 2 and Table 3). These properties influence the pollutant migration in the soil structure.
Table 2 Variation of density for crude oil
Pollutant petroleum product Density at 200C Density at 400C Density at 600C
Crude oil 0.869 0.858 0.848

Maria Popa
61
Table 3
Crude oil viscosity at various temperatures
Petrolem product Crude Oil Working
temperature, 0C 20 40 60
Flowing time, sec 120 90 81,5 Constant of
aparratus, sec 57
Viscosity (0E) 2,11 1,58 1,43 The soil sample contaminated with crude oil was subject to solid-liquid
extraction in Soxhlet apparatus. For extraction petroleum ether and toluene were used as solvents. Working conditions and results are presented in table 4.
Compared to 5% initial concentration of pollutant, the difference (5-4,42=0,58%) can be explained by encapsulating the heavy parts of crude oil in the solid components. It is possible the total extraction if a third solved is used.
Table 4 Results obtained from the extraction process
No. Size Clean sample
Polluted sample
1. quantity of soil, g 20 22
2. quantity extract with petroleum ether, g
0,01 0,6
3. quantity extract with toluene, g 0,016 0,4
4. total quantity extract, g 0,026 1
5. % mass extract 0,13 4,55
6. % crude oil recovered - 4,55-0,13=4,42
Subjecting the polluted soil extraction in laboratory, it was also checked the nutrient amount before and after applying this method. The results were obtained with a laboratory kit and are presented in figure 3-4.

Studies on the germination change of plants after decontamination of soils that are polluted with crude oil
62
Fig. 3. Nutrient content before extraction
Fig. 4. Nutrient content after extraction
It is observed that usually the nutrient amount (nitrogen, phosphorus and
potassium) is the presented one; after being treated at heat with several solvents, the nitrogen amount is higher, the potassium amount is unchanged and the phosphorus amount is higher.
3. Conclusions
As it was mentioned initially, the nature of the analysed soiled influences the way of action of the pollutant which most of the time is discharged by mistake. The physical properties of the pollutant as important as well. The migration of the pollutant through the soil structure depends on those properties. It was chosen a medium concentration of pollutant (5%) close to a real situation. Action was taken right after the controlled pollution that took place in the laboratory. When choosing a remediation method, this must satisfy several conditions, but never at the same time. Extraction method through solvents is not very advantageous from economic point of view. The nutrients amount in the treated soil remain the same or even has a low increase. This aspect reveals that by applying the solvent extraction, germination potential will not be affected. For future research there will be taken into account
Maria Popa
63
the study not only on another type of soil, but also on increases in the concentration of the pollutant.
REFERENCES
[1] Boros, M.N., Micle, V. Study on the application of phytoremediation of contaminated industrial sites, Land Reclamation, Earth Observation Surveying, Environmental Engineering (Bucharest), III, (2014), 99-106.
[2] Pavel, L.V., Gavrilescu, M. Overview of ExSitu Decontamination Techniques for Soil Cleanup, Environmental Engineering and Management Journal, 7(6), (2010), 815-834.
[3] Popa, M, Negoiţă, L., Rădulescu, S. Techniques for Remediation of Soils Contaminated with Liquid Petroleum Products for Ecological Reconstruction, Buletinul UPG, Seria Tehnica, LXII (3A), (2010), 70.
[4] Popa, M. Comparative studies on remediation techniques in laboratory of soils contaminated with oil products, Land Reclamation, Earth Observation & Surveying, Environmental Engineering, (Bucharest), III, (2014), 13-16.
[5] Popa, M. Laboratory studies on the simulation of accidental pollution of soils, Land Reclamation, Earth Observation & Surveying, Environmental Engineering, (Bucharest), IV, (2015), 116-119.
[6] Shirdam, R., Zand, A.D., Bidhendi, G.N., Mehrdadi, N. Phytoremediation of hydrocarbon contaminated soils with emphasis on the effect of petroleum hydrocarbons on the growth of plant species, Phytoprotection, 89(1), (2008), 21-29.
[7] Yi, Y.M., Park, S., Munster, C., Kim, G., Sung, K. Changes in Ecological Properties of Petroleum Oil-Contaminated Soil After Low-Temperature. Thermal Desorption Treatment, Water, Air & Soil Pollution, 227, (2016), 108.
[8] Patrascu, C., Negoita, L., Popa, M., Depoluarea solurilor contaminate cu produse petroliere, Lucrări de laborator, Editura UPG – Ploieşti, 2008, ISBN 978-973-719-243-1.

Bulletin of Romanian Chemical Engineering Society, Vol 3, No 2, 2016 ISSN 2360-4697
64
NEW WASTE MANAGEMENT SOLUTIONS FROM MINING INDUSTRY
Gabriela STAN
Petroleum-Gas University of Ploieşti, 39, Bucuresti Avenue, Ploiesti, Romania
Abstract Waste from the extractive/mining industry is important both because of the amount and due to its high degree of contamination. However, considering all of this, the current study proposes the implementation of a new software, on the basis of the values of the physico-chemical environmental factors measured and monitored in landfills from the oil extraction industry. This, based on the collected data, could select the storage/processing processes proper to waste so that it can later be used in agriculture. Through the results presented, the advantages of using these new software solutions are:
updating databases, measures to improve collection methods, storage and data validation;
quantitative status update on streams and categories, quantities of hazardous waste; updating the categories of collected waste; including the results of the pilot and of full scale projects in the measures and actions
proposed in continuing future planning; including conclusions and recommendations of pre-feasibility studies, promoting investments in the treatment of certain categories of waste (such as machinery
used for obtaining compost of the biodegradable fraction) will lead to their elimination and the adaptation of operators for their collection and delivery;
the need for equipment, maintenance and spare parts for the collection, treatment and disposal infrastructure of waste, will lead to the founding of local industrial and/or commercial entities, most likely SME (Small and Medium Enterprises).
Key words: waste management, mining industry.
1. Introduction
The oil extraction industry generates waste that can lead to the soil's and groundwaters' infestation. Treating infested soil may be a solution but is not generally available because of the difficulty of in situ processing. It is therefore necessary to establish a system of waste management for the extractive industry that will lead to finding optimal solutions in terms of money and technology. Using information systems in waste management is a solution for reducing the environmental impact by controlling both the amount of waste and by finding the best solutions for its processing [1-5].
Email address: [email protected]

Gabriela Stan
65
This paper proposes the use of a software that allows controlling the quantity and quality of waste, and directing them to further processing in order to reduce the environmental impact.
2. Materials and methods
The analyzed waste was stored in a waste warehouse of the extractive industry located in the area of Prahova County.
The application used had the following components: • identifying and assessing the quantity and quality of waste; • carrying out a waste management program, according to HG 856/2002,
updated in 2014. Figure 1 shows the flow chart of the waste management application in the
extractive industry.
Fig. 1. The flow chart of the waste management application in the extractive industry After entering the waste’s quantity and quality in the program, a hierarchy
is established. The application then chooses the objective function that represents the processing solution for the waste depending on its features. It should be mentioned that the program has a database containing all machining processes available depending on the characteristics of the waste.
In order to assess the environmental impact based on the data entered we define the matrix of environmental issues with its characteristic elements (gravity, quantity, frequency regulation, stakeholders), automatically calculating the score for each environmental aspect [6-12].
3. Results and discussions
Figures 2 and 3 show the waste quantities and its classification according to its quality.

New waste management solutions from mining industry
66
Fig. 2. The waste quantities for 12 month
Fig. 3.Waste quality according with generated operation
Analyzing the presented data, we can observe that in two summer months, June and July, the amount of waste taken from the extractive industry was higher than in the winter months of January and February. Thus in January and February an amount of waste of 12 tones was collected, compared to 68 tons in June and July.
Their quality varied as follows: - Hydrocarbon content was within the range of the maximum 1500 mg/L
in the month of July.
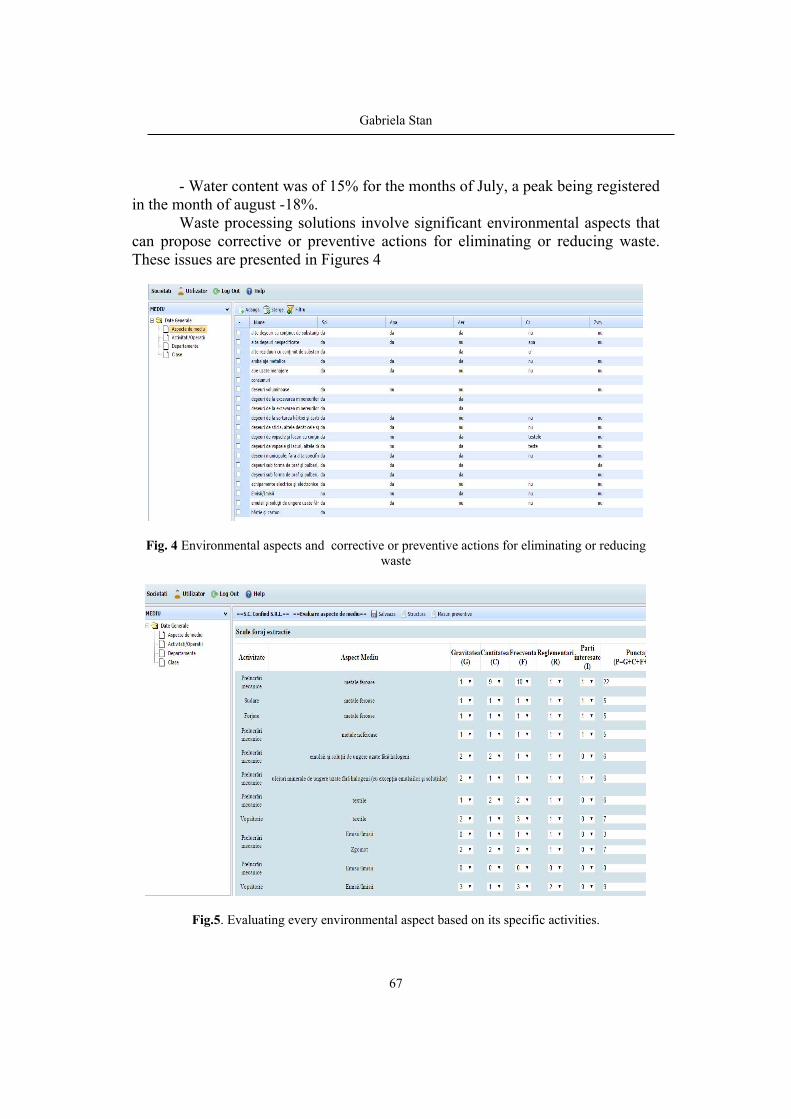
Gabriela Stan
67
- Water content was of 15% for the months of July, a peak being registered in the month of august -18%.
Waste processing solutions involve significant environmental aspects that can propose corrective or preventive actions for eliminating or reducing waste. These issues are presented in Figures 4
Fig. 4 Environmental aspects and corrective or preventive actions for eliminating or reducing waste
Fig.5. Evaluating every environmental aspect based on its specific activities.

New waste management solutions from mining industry
68
In its final stage, the application automatically generates a report on the waste's storage, its amounts, capitalized amounts and treated amounts.
4. Conclusions
Using this application, we can build an actual database but also, we can update databases on wastes engender in the extractive industry.
The results are included in pilot projects that develop waste treatment processes, and manage to plan treatment steps according to their quality. Thus waste treatment plants can be implemented to effectively reduce the impact on the environment.
The Environmental Impact Assessment (EIA) carried out this way, may influence not only the area of improving environmental conditions in the context of sustainable development, but also the economic activity of the respective area. Another major advantage of the software developed is that it can reduce monitoring costs, in compliance with the legislation in force. REFERENCES
[1] ***API Spec. Q1/ ISO TS 2900. Specification for Quality Management System Requirements for Manufacturing Organization for the Petroleum, Petrochemical and Natural Gas Industry, 9th Ed, 2013.
[2] ***CalRecovery, Inc., Conversion Factor Study - In-Vehicle and In-Place Waste Densities, prepared for California Integrated Waste Management Board, USA, March 1992.
[3] ***CalRecovery, Inc., Criterio de Diseño - Planta de Selección y Recuperación de Subproductos de los Residuos Sólidos Municipales, prepared for Mexico City, Mexico, December 1992.
[4] Panaitescu, C., Onutu, I., Monitoring the quality of the sludge resulted from domestic wastewater treatment plants and the identification of risk factors, Environmental Engineering and Management Journal, 12(2), (2013), 351-358.
[5] Panaitescu, C., Bucuroiu, R., Study on the composition of municipal waste in urban areas of Prahova county , Environmental Engineering and Management Journal, 13(7), (2014), 1567-1571.
[6] ***CalRecovery, Inc., Handbook of Solid Waste Properties, Governmental Advisory Associates, Inc., New York, New York, USA, 1993.
[7] ***CalRecovery, Inc., Metro Manila Solid Waste Management Study - Waste Stream Characterization, prepared for Ad Hoc Committee, Republic of the Philippines, May 1982.
[8] ***CalRecovery, Inc., Solid Waste Management Options in American Samoa, prepared for National Renewable Energy Laboratory, March 1994.
[9] ***Earth Sciences Resources Institute, Model Builder for ArcView GIS Spatial Analyst 2. Available at: http://www.esri.com, 2000.
[10] ***Environment Protection Agency. EPA Guidelines for Environmental management of landfill facilities (municipal solid waste and commercial and industrial general waste), Environment Protection Authority, 2007.
[11] ***Ghana Statistical Service, Population and Housing Census Draft Report: Accra, 2010. [12] ***Ghana Statistical Service, Housing and Population Census Report. Accra, Ghana, 2002.

Bulletin of Romanian Chemical Engineering Society, Vol 3, No 2, 2016 ISSN 2360-4697
69
MINIMIZING THE IMPACT UPON THE ENVIRONMENT BY PROCESSING THE SLUDGE FROM WASTE WATER
TREATMENT PLANTS OF DOMESTIC WASTEWATERS
Gabriela STAN
Petroleum-Gas University of Ploieşti, 39, Bucuresti Avenue, Ploiesti, Romania
Abstract By introducing running water in households, the flow of domestic wastewater will undergo a quantum leap of about 5-6 times, which in the absence of a proper system of collection, evacuation and treatment of such water, will generate pollution in the soil, subsoil and air with water contaminants or by the decomposition of organic substances contained in these waters. This can cause epidemics of infectious diseases and unsanitary areas, which would degrade the living environment of the residents of said town. Also, only the centralized collection and disposal of these waters into the environment would help to increase pollutant content of this body of water above the permissible limits. In the operation of a wastewater treatment plant one should consider eliminating the occurrence of accidental pollution and/or minimizing the impact on the environment. This paper proposes a study of the refurbishment of a wastewater treatment plant. Thus the line of the sludge has been modified by the processing of the excess stabilized sludge, by mechanical dehydrating it with an automatic stainless steel installation. In order to ensure the necessary conditions for the use of this sludge in agriculture after it exits the mechanical dehydration plant, it was mixed with lime powder in a screw conveyor. The mixture is then subjected to exothermic reactions to 80ºC, ensuring the sludge’s/mud’s sanitization or any pathogenic microorganism or parasite eggs. The paper presents comparative experimental data before and after the introduction of sludge processing. Key words: wastewater, treatment, sludge processing.
1. Introduction
Within biological aerobic processes many contaminants are degraded and treated and very concentrated residues do not appear in another form (sludge). The organic compounds are generally oxidized in the presence of carbon dioxide and water and ammonia nitrogen which is further removed by oxidation (nitrification) in nitrate [1-6]. A biological nitrification is often chosen for treating domestic and industrial effluents, although relatively high concentrations of ammonia nitrogen in the leachate require specifically designed processes. In conclusion, each aerobic treatment process is designed to be able to perform the following processes: denitrification of organic compounds, ammonia nitrogen nitrification, total or partial denitrification of nitrates. Sludge’s result in the process of wastewater
Email address: [email protected]
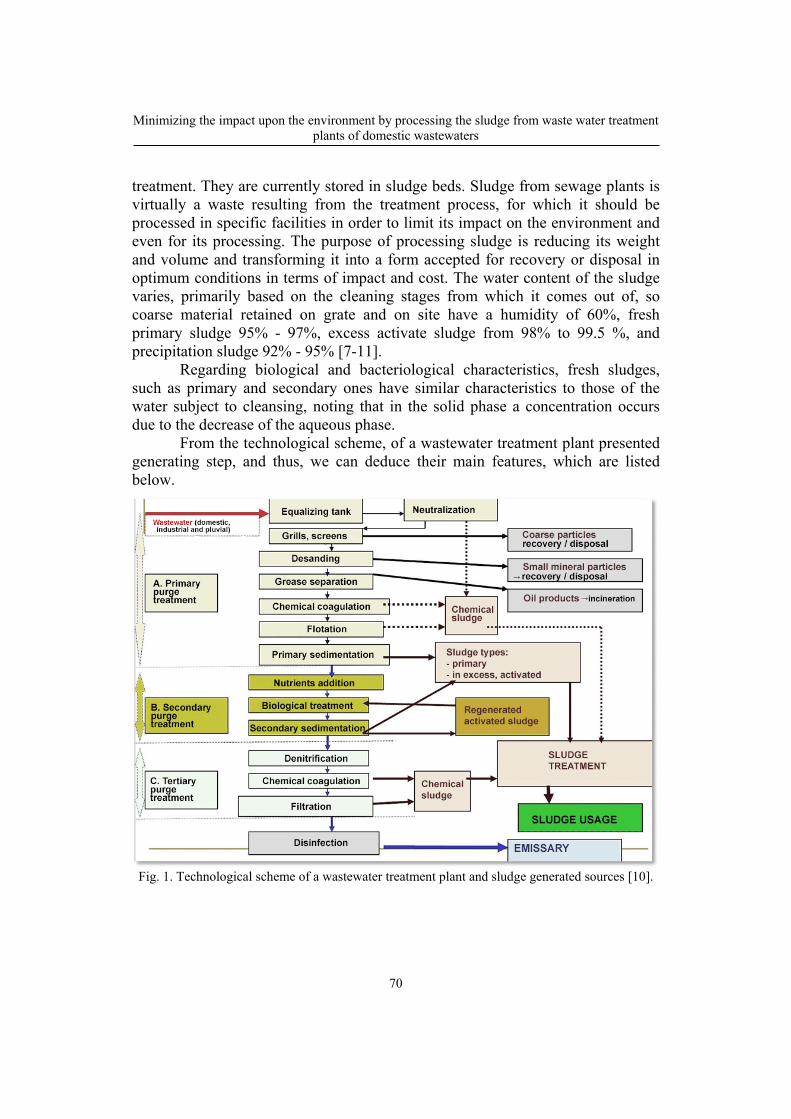
Minimizing the impact upon the environment by processing the sludge from waste water treatment plants of domestic wastewaters
70
treatment. They are currently stored in sludge beds. Sludge from sewage plants is virtually a waste resulting from the treatment process, for which it should be processed in specific facilities in order to limit its impact on the environment and even for its processing. The purpose of processing sludge is reducing its weight and volume and transforming it into a form accepted for recovery or disposal in optimum conditions in terms of impact and cost. The water content of the sludge varies, primarily based on the cleaning stages from which it comes out of, so coarse material retained on grate and on site have a humidity of 60%, fresh primary sludge 95% - 97%, excess activate sludge from 98% to 99.5 %, and precipitation sludge 92% - 95% [7-11].
Regarding biological and bacteriological characteristics, fresh sludges, such as primary and secondary ones have similar characteristics to those of the water subject to cleansing, noting that in the solid phase a concentration occurs due to the decrease of the aqueous phase.
From the technological scheme, of a wastewater treatment plant presented generating step, and thus, we can deduce their main features, which are listed below.
Fig. 1. Technological scheme of a wastewater treatment plant and sludge generated sources [10].

Gabriela Stan
71
2. Experimental
Our study was based on a laboratory installation consisting of a reactor in which we prepared a mixture of sludge and lime. On leaving the reactor, the sludge was passed through a system equipped with a screw conveyor that led to its dehydration. After the drying process, the sludge was placed in a reactor at a temperature of 80 ° C in order to stabilize / hygiene it.
Microscopic analyses were performed and were based on the determination of pathogens. Ten samples of sludge were collected. Ten grams of sludge were weighed of each sample. Two types of samples were prepared:
- The first type was mixed with 100 ml of distilled water. - The second type has undergone the treatment process described above. The steps of the microscopic examination are presented in Table 1. The
microscope used is a Motic Trinocular Microscope. The eyepiece used increases the immage by 40 times and is blue. Through the Motic Educator interface we can capture the preparations, active sludge blade-slide preparation footage while viewing it under the microscope.
Tabel 1.
The steps of the microscopic examination
EXAMINATION Description
Work bed - Preparing the work bed; - Washing with detergents, disinfecting with alcohol and sterilizing the working instruments (loop, blades) in the gas burner; - Using hand washing solutions and antiseptic solutions;
Decanted sludge Decanted sludge;
Filtered samples Sample filtering; Used reagents Preparing reagents
Sludge blades Displaying biological material on the sterilized blade;
Blades with set sludge
Drying the blade in gas burner, without the temperature exceeding more than 40ºC. Without additional measures, this temperature can be checked by touching the blade with the palm. The temperature must be easy bearable on touch.
Colored preparations
- By following the procedure we obtain the following preparations: - The preparation on the left: Gram coloration; - The preparation on the right: Coloration with Fennel Fuxin.
Experimental data obtained from this study was compared with that of
industrial practice in which the sludge line contained only mud dehydration bedding.

Minimizing the impact upon the environment by processing the sludge from waste water treatment plants of domestic wastewaters
72
3. Results and discussions
Microscopic examination of the sludge from the point of view of the influence of the dehydration/drying process and the temperature was performed by comparison with the microscope catches obtained from the sludge collected without being subjected to the treatment process. The results are presented in Table 2.
Tabel 2.
Results of rising temperature
Untreated sludge Sludge subjected to the treatment process Biomass with various areas, particularly consisting of flocculants in training, not very well defined and slightly unstable.
Biomass that compared to the initial sludge has several well-developed areas with an expansion trend.
The sludge which has not been subjected to the treatment process shows higher flocculants. Treating the sludge resulted in a biomass with various areas, particularly composed of flocculants not very well defined, much more stable.
The analyzed and stabilized sludge with the help of the treatment can be used with high efficiency in agriculture.
4. Conclusions
The stabilization of the sludge performed in this study, had the aim of reducing the fermenting capacity of the sludge, namely the organic hydrophilic components (which include biological sludge surplus and primary sedimentation sludge’s, in which the content of volatile organic materials can reach 90% of the dry matter). The sludge dewatering process aims at reducing the water content of the sludge to lower the costs and volumes handled, necessary for advanced processing or for final disposal.
Depending on the technology applied for the wastewater treatment and on the future sludge treatment processes applied, we obtain a certain degree of dehydration. The thermal treatment process of the sludge at 80 C leads to the lack of malodor during conditioning, the sterilization of organic sludge and to a saving of chemical treatment agents. The results obtained from microscopic studies have shown the importance of stabilizing sludge treatment processes and reducing the impact on the environment by increasing the possibility of its use in agriculture. REFERENCES
[1] Cristea, S., Bolocan, I., Bombos, D., Bombos, M., Vasilievici, G., Juganaru, T., Chivu, R., Panaitescu, C. Hydrogenolysis of sunflower oil over Co-Mo catalyst, Revista de Chimie, 66(8), (2015), 1177-1180.

Gabriela Stan
73
[2] Cristescu, M., Stimularea sondelor. Aplicaţii, Editura Universităţii Petrol - Gaze din Ploieşti, 2007, 44-86.
[3] Bucuroiu, R., Petrescu, M. G., Study on oil wastewater treatment with polymeric reagents, Scientific Study & Research - Chemistry & Chemical Engineering, Biotechnology, Food Industry, 17(1), (2016), 55-62.
[4] Strǎtulǎ, C., Panaitescu, C., Lungu, A., Pana, A., Unele consideraţii privind eliminarea avansatǎ a epiclorhidrinei din 1,2-dicloropropan prin fracţionare, Revista de Chimie, 56(6), (2005), 677-681.
[5] Panaitescu, C., New Method to Separate Ethylenediamine from Water-Ethylenediamine Mixture, Revista de Chimie, 67(2), (2016), 349-352.
[6] Panaitescu, C., Jinescu, C., Mares, A.M., Study on Ethylenediamine Removal from Textile Industry Wastewater, Revista de Chimie, 67(5), (2016), 925-928.
[7] Salager, J. L., Phase inversion and emulsion inversion on the basics of catastrophe theory, in Encyclopedia of Emulsion Technology, Vol. 3, Becher, P. (Ed.), Marcel Dekker, New York, 1983, pp. 79– 134.
[8] Panaitescu, C., Stoica, E.M., Enhancing of COD Treatment in the Physico-chemical Stage of Refinery Wastewater Treatment Plants, Revista de Chimie, 66(5), (2015), 728-731.
[9] Van Benschoten J.E., Edzwald J.K., Chemical aspects of coagulation using aluminium salts. II. Coagulation of humic substances using aluminium and poly(aluminum chloride), Water Research, 24, (1990), 1527-1535.
[10] Davies, A.G., Smith, P.J., Comprehensive Organometallic Chemistry: The Synthesis, Reactions and Structures of Organometallic Compounds (Editors: Wilkinson, G., Stone, F.G.A., Abel, E.W.), Pergamon Press, Oxford, 1982, 519;
[11] Buzoianu, A.D., Panaitescu, C., Bombos, M., Stoica, M. E., Study on Efficiency Increasing of Biological Stage by Sequential Operating of Aeration Reactors, Revista de Chimie, 67(5), (2016), 962-966.

Bulletin of Romanian Chemical Engineering Society, Vol 3, No 2, 2016 ISSN 2360-4697
74
INCREASING THE DEGREE OF TREATMENT FOR COD AND BOD USING AQUA PE TYPE MICROORGANISMS IN
COMBINATION WITH ACTIVATED SLUDGE
Caşen PANAITESCU
Petroleum-Gas University of Ploieşti, 39, Bucuresti Avenue, Ploiesti, Romania
Abstract Industrial wastewater treatment is necessary for two main reasons: to limit the amount of wastewater discharged uncontrolled in the receiver's water and to reduce the impact on the environment, reuse of treated water. In this study, industrial wastewater with a COD (Chemical Oxygen Demand) content over 600 mg/L and BOD (Biochemical Oxygen Demand) over 300 mg/L was monitored, and increasing the degree of treatment by mixing activated sludge with selected microorganisms was considered. For this AQUA MICROPAN PE type microorganisms were used. AQUA PE type microorganisms protect the environment, widely reduce ammonia dissolved in water, COD, phosphates and BOD. In this way we were interested in increasing the degree of purification of the biological level by increasing the activity (dynamics) of microorganisms. The activity of the biomass formed in the laboratory was observed for 12 weeks. After the addition of microorganisms, aeration was achieved throughout experiments until dissolved oxygen concentration reached a value of 4 ppm. After the study's completion we noticed a decline in BOD and COD values as follows: COD dropped from 520 mg/L to 115 mg/L; BOD dropped from 320 mg/L to 18 mg/L. The decrease of these values means a correct treatment and an increase in the degree of purification. To estimate the change over time in the number of individuals composing the population studied we turned to determine the dynamics of the population of microorganisms. Following the experiment conducted in the laboratory, we demonstrated that treatment with AQUA PE microorganisms can be effective and can increase the degree of treatment in combination with activated sludge/mud. It can be successfully applied in treatment plants of industrial wastewater. Key words: COD, BOD, AQUA MICROPAN PE microorganisms.
1. Introduction
In the industrial practice for wastewater treatment it has been proven that enzymatic hydrolysis of organic compounds made by microorganisms of the activated sludge is more is more effective compared to the same process, but operated under anoxic or anaerobic conditions. In conclusion, aerobic treatment of wastewaters is critical for efficiently removing the organic pollutant. In the past 10 years, a particular interest emerged in what regards enzymatic activity in wastewater treatment, and the premise that feeds this research is that the approach
Email address: [email protected]

Casen Panaitescu
75
in terms of enzymatic activity will significantly contribute to the understanding of the biochemical factors responsible for discovering the extent to which wastewater and sludge could be treated [1-5]. Active sludge floc formation is a extremely high necessity and it is manifested in the gravitational clarifier/decanter [6-10].
The feature that underlies the formation of agglomerates is the glicocalix. The glicocalix is a material composed of polysaccharides, proteins and cellulose fibers, which by a disordered structure, similar to the one of a felt, gives bacteria, more specifically its outer membrane, the quality to anchor on supports, both inert as well as alive ones. [1]
Biomass systems in suspension are based on the growth of microorganisms which are distributed freely in the bioreactor's volume. The advantage of the biomass systems in suspension manifests itself in a better interaction between the two phases: liquid (wastewater) and solid (microorganisms) that facilitate the transfer process. Another advantage is the case in which it may be controled the sludge's age in such systems. The disadvantage is that it uses large volumes with direct consequences for the space of the treatment plant [11-14].
This paper proposes treating wastewaters with activated sludge mixed with AQUA MICROPAN PE type microorganisms. This procedure is applied to increase the characteristics of the biomass, namely activated sludge [15].
2. Materials and methods
Routine microscopic analysis of biological systems can provide information not available otherwise. The bioactivators used were AQUA MICROPAN PE. The microscopic observation of AQUA MICROPAN PE type microorganisms mixed with activated sludge, means the biomass study through the number, diversity and bacteria species [1]. The device used was OPTIKA with USB and HDMI (1080p) camera with premium performances.
Each of the treatment process is decisively influenced by the microbial populations that metabolize contaminants. A well designed process should increase biomass under proper conditions. The biomass is mixed with the leachate, with oxygen, with nutrients if necessary; the process is operated at a suitable temperature and pH.
In aerobic conditions, organic compounds are the carbon and energy source (heterotrophic growth) [1]:
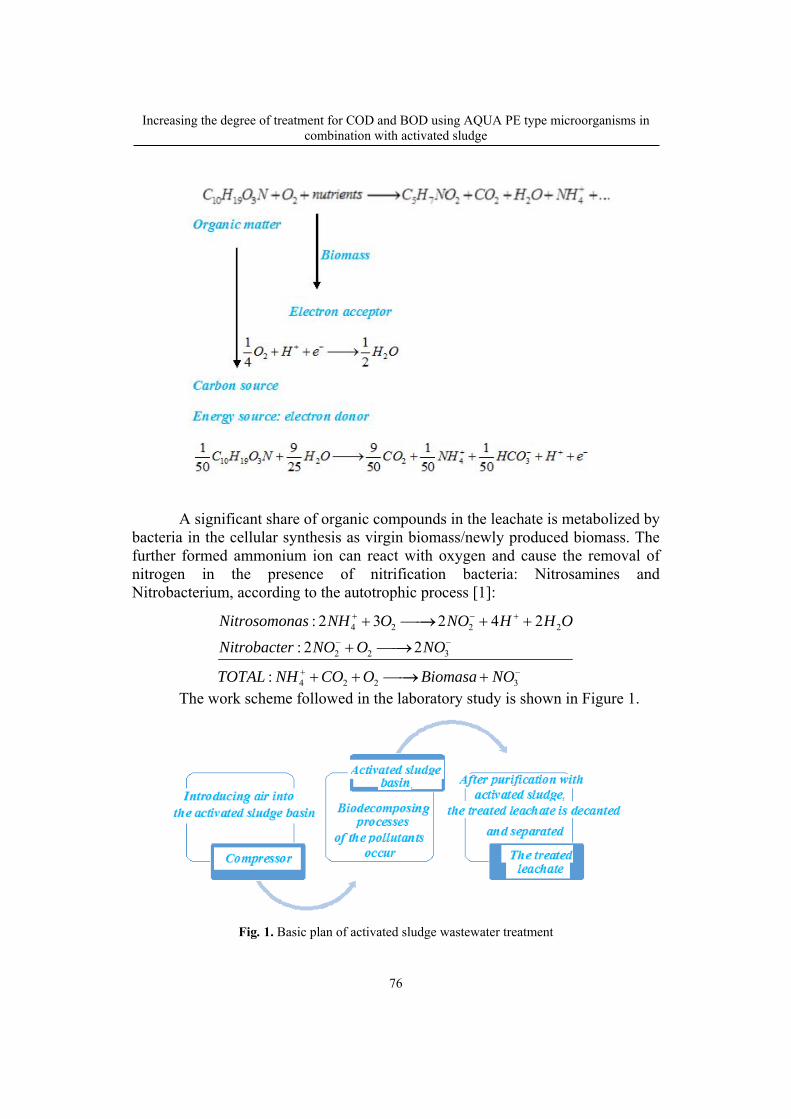
Increasing the degree of treatment for COD and BOD using AQUA PE type microorganisms in combination with activated sludge
76
A significant share of organic compounds in the leachate is metabolized by bacteria in the cellular synthesis as virgin biomass/newly produced biomass. The further formed ammonium ion can react with oxygen and cause the removal of nitrogen in the presence of nitrification bacteria: Nitrosamines and Nitrobacterium, according to the autotrophic process [1]:
4 2 2 2
2 2 3
4 2 2 3
: 2 3 2 4 2
: 2 2
:
Nitrosomonas NH O NO H H O
Nitrobacter NO O NO
TOTAL NH CO O Biomasa NO
The work scheme followed in the laboratory study is shown in Figure 1.
Fig. 1. Basic plan of activated sludge wastewater treatment

Casen Panaitescu
77
3. Results and discussions
The intensity of the microbial activity is a very important indicator in the treatment with activated sludge which can be increased by adding bioactivators, as demonstrated by the microscopic analysis performed.
Two microscopic examinations were done before adding bioactivators, every two days, in order to observe the variation in biomass. We avoided stirring the sludge because we did not want to increase the degree of turbulence of the sludge, nor did we want to fragment the flocs. The features of the biomass consisting of activated sludge and AQUA MICROPAN PE type microorganisms are shown in Figure 2.
Fig. 2. The microorganisms under a microscope observation
: A. Activated sludge, B. The activated sludge mixed with AQUA MICROPAN PE microorganisms
AQUA MICROPAN PE product consists of biological activating enzymes
and microorganisms which recommended it as bioactivator for biological treatment processes.
Its efficiency is proven in improving and accelerating mineralization and stabilization processes of decomposition of organic matter and in reducing the concentration of dissolved ammonia. It can also be used as a measure to prevent the development of eutrophication caused by nitrogen-based compounds and phosphorus, thus, also improving the transparency of the water.
Considering the fact that it is in the form of a powder, this bioactivator can be distributed on the surface of the water or even mixed with the water, and for its use in the aeration tanks it may be added in the influent or in the sludge.
Analyzing the obtained results, we can observe that the presence of AQUA MICROPAN PE type microorganisms leads to process intensification, and the flocs formed are more active and more stable.
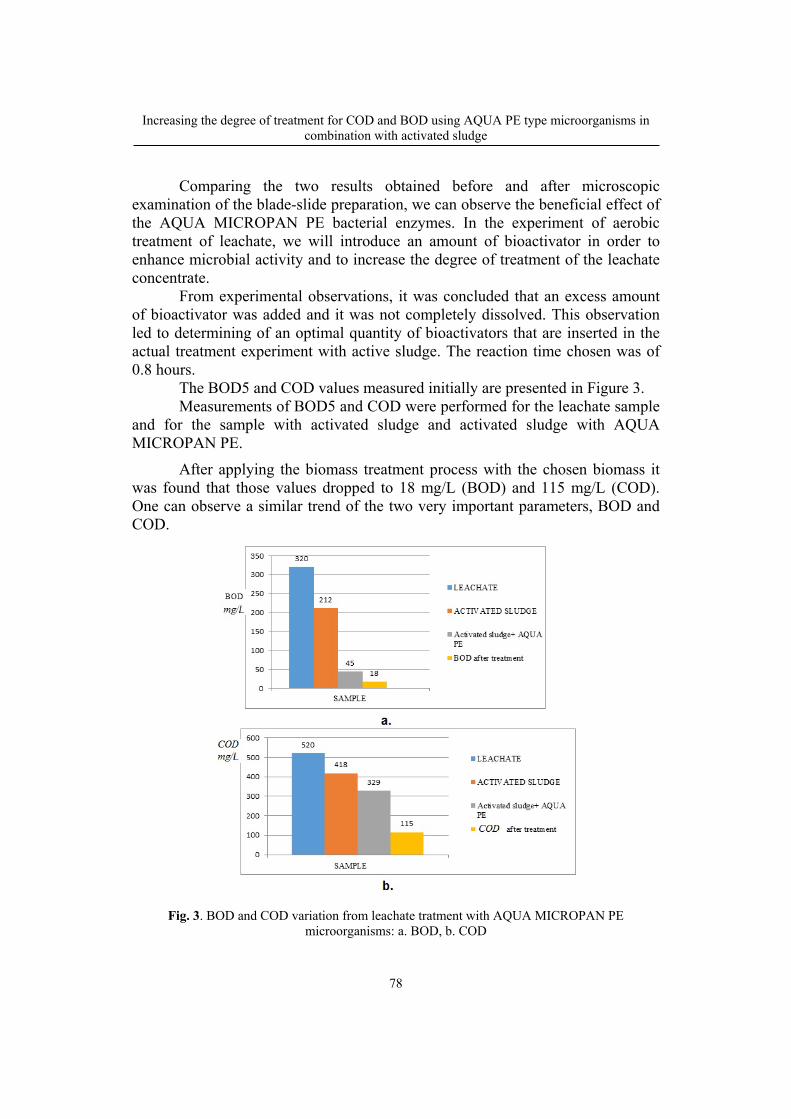
Increasing the degree of treatment for COD and BOD using AQUA PE type microorganisms in combination with activated sludge
78
Comparing the two results obtained before and after microscopic examination of the blade-slide preparation, we can observe the beneficial effect of the AQUA MICROPAN PE bacterial enzymes. In the experiment of aerobic treatment of leachate, we will introduce an amount of bioactivator in order to enhance microbial activity and to increase the degree of treatment of the leachate concentrate.
From experimental observations, it was concluded that an excess amount of bioactivator was added and it was not completely dissolved. This observation led to determining of an optimal quantity of bioactivators that are inserted in the actual treatment experiment with active sludge. The reaction time chosen was of 0.8 hours.
The BOD5 and COD values measured initially are presented in Figure 3. Measurements of BOD5 and COD were performed for the leachate sample
and for the sample with activated sludge and activated sludge with AQUA MICROPAN PE.
After applying the biomass treatment process with the chosen biomass it was found that those values dropped to 18 mg/L (BOD) and 115 mg/L (COD). One can observe a similar trend of the two very important parameters, BOD and COD.
Fig. 3. BOD and COD variation from leachate tratment with AQUA MICROPAN PE
microorganisms: a. BOD, b. COD

Casen Panaitescu
79
4. Conclusions
The application of the treatment process with biomass consisting of activated sludge and addition of microorganisms, really means choosing a specific treatment process for a specific wastewater. The product shows a high effectiveness in reducing the concentration of ammonia dissolved in water, BOD5, in reducing phosphates and in maintaining the microbial balance. It also acts against pathogens and parasites, but it also positively affects the work of protozoa.
The present study reveals that AQUA MICROPAN PE type microorganisms can represent a solution both for the regeneration of activated sludge and also for reducing the load of wastewater.
To intensify the treatment, the activated sludge was mixed with bioactivators such as AQUA MICROPAN PE. Their influence on microbial activity was observed microscopically by increasing the floc sludge and their stability through the blade-slide technique. The process proved to be highly efficient leading to a decrease of quality indicators under the maximum accepted level.
REFERENCES
[1] El Dabari, M., Some problems connected with a landfill lachate as a result of industrial activities, Universitatea Tehnica „Gheorghe Asachi, Iasi, 2003.
[2] Panaitescu, C., Onutu, I., Monitoring the quality of the sludge resulted from domestic wastewater treatment plants and the identification of risk factors, Environmental Engineering and Management Journal, 12(2), (2013), 351-358.
[3] Panaitescu, C., Bucuroiu, R., Study on the composition of municipal waste in urban areas of Prahova county, Environmental Engineering and Management Journal, 13(7), (2014), 1567-1571.
[4] Mansi, R., Rajni, H., Meenakshi, N., Review on anaerobic treatment of municipal solid waste with leachate – Degradation MSW, International Journal of Plant, Animals and Environmental Sciences, 4(4), (2014), 110-117.
[5] Hamidreza, K., Utilizing Methane Generated in Anaerobic Leachate Treatment as Renewable Energy, Journal of Clean Energy Technologies, 3(6), (2015), 443 – 447.
[6] Matteo, C., Carbon Mass Balance in the first phase of semi-aerobic-anaerobic-aerated Landfill Model – Master Thesis, Pag.45 – 47, Second Cycle Degree in Environmental Engineering, ICEA Department, 2014.
[7] Hernández-Berriel, M. C., Mañón-Salas, M. C, Buenrostro-Delgado, O., Sánchez-Yáñez, J.M., Márquez-Benavides, L., Landfill leachate recirculation. Part I: Solid waste degradation and biogas production, Environmental Engineering and Management Journal, 13(10), (2014), 2687 – 2695.
[8] Kevin, J., Anaerobic digestion from the laboratory to the field: An experimental study into the scalability of anaerobic digestion – Master Thesis, Pag. 23 – 27, Department of Technology and Environmental Design, 2014.
Increasing the degree of treatment for COD and BOD using AQUA PE type microorganisms in combination with activated sludge
80
[9] Wan Azlina Wan Abkarim Ghani, Azni, I., Preliminary study on biogas production municipal solid waste leachate, Journal of Engineering Science and Technology, 4(4), (2009), 374 – 380.
[10] EBA European Biogas Association, Slow Energy Europe, Biogas Power Opportunities Report, pg. 45, 2014.
[11] Canadian Biogas Institute, Canadian Biogas Study – Benefits to the Economy, Environment and Energy, pg. 10 – 13, 2013.
[12] Suman G., Syed E. H., Anaerobic digestion of landfill leachate: A modified approach, International Journal of Microbiology and Immunology Research, 2(7), (2013), 056-063.
[13] Krewer, D., Moona, N., Adsorption of Organic Pollutants in Peat and Carbon Filters: A Pilot Study of Landfill Leachates – Master Thesis, pg. 34 – 45, Department of Civil and Environmental Engineering, Chalmers University of Technology, 2012.
[14] Griffin, P. L., Anaerobic digestion of organic wastes: The impact of operating conditions on hydrolysis efficiency and microbial community composition – Master Thesis, pg. 38 – 46, Department of Civil and Environmental Engineering, 2012.
[15] Patel, N., Biogas Production from Different Waste Materials in India, The International Journal of Science & Technoledge, 6(2), (2014), 105 – 109.

Bulletin of Romanian Chemical Engineering Society, Vol 3, No 2, 2016 ISSN 2360-4697
81
THE IMPLEMENTATION OF THE COAGULATION– FLOCCULATION PROCESS IN THE LEACHATE TREATMENT FROM ECOLOGICAL LANDFILLS
Caşen PANAITESCU, Gabriela STAN
Petroleum-Gas University of Ploieşti, 39, Bucuresti Avenue, Ploiesti, Romania
Abstract The application of the coagulation-flocculation process in the treatment of leachate is not a normal process, because its load with pollutants is very high and the solution is not uniformly ionized. Coagulation-flocculation applies especially to surface waters or wastewaters (when their recirculation is desired) and does not apply to groundwaters, which have a very low content of colloids. Variants were tested in the current study in which polyelectrolyte type coagulants and flocculants were mixed, so that removing material type suspended pollutants and organic matter was made by agglomeration of colloids in floaters - larger and heavier units. Turbidity occurred and it was reduced through the process of coagulation - flocculation. The experimental study conducted was based on the concept of operational research, namely:
Stating the issue (Problem Formulation); Testing of the model, solution and influence parameters; Obtaining the optimal solution; Applying the solution’s results in experimental studies.
The discovered solution treatment was applied in leachate treatment plants; the results being presented in the current study. It has been demonstrated that the transition from the laboratory scale to the industrial scale was successful, and the environmental impact has been significantly reduced through the advanced treatment of the leachate. Key words: coagulation, flocculation, leachate, parameters.
1. Introduction
Leachate is a liquid waste generated during the warehousing activities of solid waste to landfill by: ingress/percolation of rainwater into/through the warehouse's body, separating contained water in the stored wastes and decomposition of biodegradable stored in the land field wastes [1-3]. The leachate impacts the environment by the amount of leachate generated even after the waste landfill is closed, and can continue for another 30 to 50 years, but also due to its highly complex composition. It may show a high concentrations of organic matter, ammonia nitrogen, heavy metals, inorganic salts, organochlorine
Corresponding author Email address: [email protected]

The implementation of the coagulation– flocculation process in the leachate treatment from ecological landfills
82
compounds. [4, 5] Physico-chemical leachate treatment requires the removal of a significant quantity of pollutants listed above.
In practice, leachate treatment includes certain steps, the first one consisting of primary treatment by settling solids removal. During the main phase, the bulk of the organic contaminants and nitrogen should be removed. The final purification step is designed to wash away organic material (usually inert COD (chemical oxygen demand), phosphorus in excess and toxic substances whose concentrations do not fall within the discharge limits. The leachate treatment methods may include a conventional treatment or a separate treatment based on the uploading amount and also by the wastewater treatment capacity [6-10].
The leachate treatment measures must fulfill the quality standards established by competent authorities. Taking into consideration that the characteristics of leachate has a spatial and a temporal variation [11, 12].
This paper proposes the application of a physico-chemical treatment process of the leachate. This process is actually a step of pre-treatment, so the leachate can be cleaned obtaining high yields after applying treatment.
2. Materials and methods
2.1. pH determination
In order to determine the pH, we used a portable WTW pH 330i pH meter that can measure both the pH of the solution, and the temperature at which the measurement is carried out. The measuring range is presented in Table 1.
Table 1.
Measurement domain
pH -2.00 … +16.00 pH
mV -1999 … +1999 mV
Temperature -5.0 … +105.0 °C
2.2. Determination of Chemical Oxygen Demand (COD)
For determining the Chemical Oxygen Demand, we used a DR 2800 Hach Lange spectrophotometer device. Its specifications are shown in Table 2.
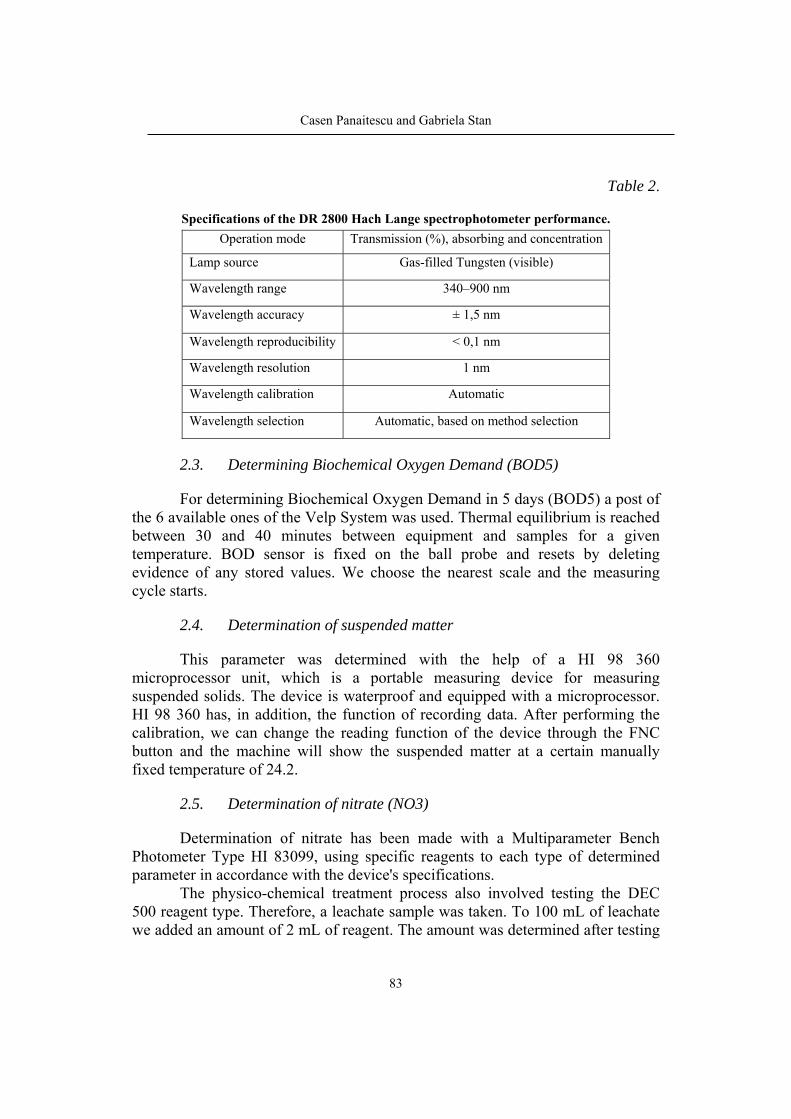
Casen Panaitescu and Gabriela Stan
83
Table 2.
Specifications of the DR 2800 Hach Lange spectrophotometer performance.
Operation mode Transmission (%), absorbing and concentration
Lamp source Gas-filled Tungsten (visible)
Wavelength range 340–900 nm
Wavelength accuracy ± 1,5 nm
Wavelength reproducibility < 0,1 nm
Wavelength resolution 1 nm
Wavelength calibration Automatic
Wavelength selection Automatic, based on method selection
2.3. Determining Biochemical Oxygen Demand (BOD5)
For determining Biochemical Oxygen Demand in 5 days (BOD5) a post of the 6 available ones of the Velp System was used. Thermal equilibrium is reached between 30 and 40 minutes between equipment and samples for a given temperature. BOD sensor is fixed on the ball probe and resets by deleting evidence of any stored values. We choose the nearest scale and the measuring cycle starts.
2.4. Determination of suspended matter
This parameter was determined with the help of a HI 98 360 microprocessor unit, which is a portable measuring device for measuring suspended solids. The device is waterproof and equipped with a microprocessor. HI 98 360 has, in addition, the function of recording data. After performing the calibration, we can change the reading function of the device through the FNC button and the machine will show the suspended matter at a certain manually fixed temperature of 24.2.
2.5. Determination of nitrate (NO3)
Determination of nitrate has been made with a Multiparameter Bench Photometer Type HI 83099, using specific reagents to each type of determined parameter in accordance with the device's specifications.
The physico-chemical treatment process also involved testing the DEC 500 reagent type. Therefore, a leachate sample was taken. To 100 mL of leachate we added an amount of 2 mL of reagent. The amount was determined after testing

The implementation of the coagulation– flocculation process in the leachate treatment from ecological landfills
84
several variants using the Jar-Test method. It was noted that for this quantity the number of flocculants obtained after applying the physical-chemical treatment process is the most stable.
3. Results and discussions
The initial analysis of physical-chemical leachate is presented below in Table 3.
Tabel 3. The initial analysis of physical-chemical leachate
Parameter Value, mg/L
pH 7,73
CCO-Cr 970 CBO5 610
Suspended matter 1510
Nitrates (NO3-) 0,00
The analyzes performed after applying the physical-chemical treatment
process led to the results shown in Figures 1-3.
Fig. 1. COD and pH variation
Fig 2. Suspended matter and BOD variation

Casen Panaitescu and Gabriela Stan
85
Fig. 3. Nitrates variation
The efficiency of the sewage treatment is expressed by the treatment grades which are calculated based on the initial concentration denoted by Ci and the final concentration after treatment denoted by Cf, and is determined as follows [2]:
100,%i f
i
C CGE
C
(1)
Following the performed analysis, we can determine the following degrees of treatment:
- COD degree of treatment:
920 123100 100 86,63%
920CCO Cri CCO Crf
CCO Cr CCO CrCCO Cri
C CGE GE
C
(2)
- BOD5 degree of treatment:
5 5
5 5
5
610 23100 100 96, 23%
610CBO i CBO f
CBO CBOCBO i
C CGE GE
C
(3)
- Degree of treatment for suspended solids:
1510 33100 100 97,81%
1510MSi MSf
MS MSMSi
C CGE GE
C
(4)
The implementation of the coagulation– flocculation process in the leachate treatment from ecological landfills
86
4. Conclusions
The purpose of this laboratory analysis of samples of leachate is to obtain the necessary data required for determining the treatment method. Choosing a treatment and disposal method of pollutants is closely linked to the characteristics of the leachate, the pollutants' concentrations in the leachate.
A similar trend can be observed for the two very important parameters, BOD5 and COD, which lower alongside with the evolution of the leachate's formation, even reaching in the final stages of degradation at a ratio of BOD5/COD below 0.1, a generally accepted indicator as low biodegradability phase of a highly toxic leachate.
The pH shows clearly established and widely available values, so that it is related to the formation of acetic acid which leads to an initial decrease of the pH, but as the acetic acid is consumed by the bacteria, the pH undergoes an increase. Nitrate concentration is dependent on the oxidation process - a reduction of ammonia in various stages of decomposition, tending finally to a close by zero concentration, concentration observed in sample number 2.
Most parameters determined can be divided in the methane formation phase because most parameters have values falling within the ranges of methane variation.
The pH value of 7.73 is one of the generally accepted indicators that can be used to determine the phase of formation. The concentration of BOD5 of 610 mg/L is in the range of 500-1000 mg/L and the concentration of COD of 920 mg/L is situated in the range of 580-976 mg/L. These are strong arguments for framing the leachate sample during the methane formation phase.
REFERENCES
[1] Strǎtulǎ, C., Panaitescu, C., Lungu, A., Pana, A. Unele consideraţii privind eliminarea avansatǎ a epiclorhidrinei din 1,2-dicloropropan prin fracţionare, Revista de Chimie, 56(6), (2005), 677-681.
[2] Panaitescu, C., New Method to Separate Ethylenediamine from Water-Ethylenediamine Mixture, Revista de Chimie, 67(2), (2016), 349-352.
[3] Salager, J. L., Phase inversion and emulsion inversion on the basics of catastrophe theory, in Encyclopedia of Emulsion Technology, Vol. 3, Becher, P. (Ed.), Marcel Dekker, New York, 1983, pp. 79– 134.
[4] Griffin, W. C., Classification of surface active agents by “HLB”, J. Soc. Cosmet. Chem., 1, (1949), 311–326.
[5] Bancroft, W. D., The theory of emulsification V, J. Phys. Chem., 17, (1913), 501–519. [6] Bancroft, W. D., The theory of emulsification VI, J. Phys. Chem., 19, (1915), 275–309. [7] Becher, P., HLB – A survey, in Surfactants in Solution, Vol. 3, Mittal, K. L., (Ed.), Plenum,
New York, 1984, 1925–1946. [8] Panaitescu, C., Bombos, D., Vasilievici, G., Bombos, M., Reduction of hexavalent chromium
by metallic iron nanoparticle, Materiale Plastice, 52(4), (2015), 427-432.

Casen Panaitescu and Gabriela Stan
87
[9] Bombos, M., Panaitescu, C., Juganaru, T., Bombos, D., Buzoianu, A.D., Water Denitrification by Hydrogenation over Ru-Sn Catalyst, Revista de Chimie, 67(6), (2016), 1172-1175.
[10] Nasr-El-Din, H., Hawkins, B., Green, K., Viscosity Behavior of Alkaline, Surfactant, Polyacrylamide Solutions Used for Enhanced Oil Recovery. Paper SPE 21028 presented at the International Symposium on Oilfield Chemistry, Anaheim, California, 20–22 February.
[11] Panaitescu, C., Bombos, M., Buzoianu, A.D., Bombos, D., Vasilievici, G., Imidazoline Type Dispersant for Aqueous Dolomite Suspension, Revista de Chimie, 67(4), (2016), 760-763.
[12] Ahmad, A.L., Wong, S.S., Teng, T.T., Zuhairi, A., Optimization of coagulation–flocculation process for pulp and paper mill effluent by response surface methodological analysis, Journal of Hazardous Materials, 145, (2007), 162-168.
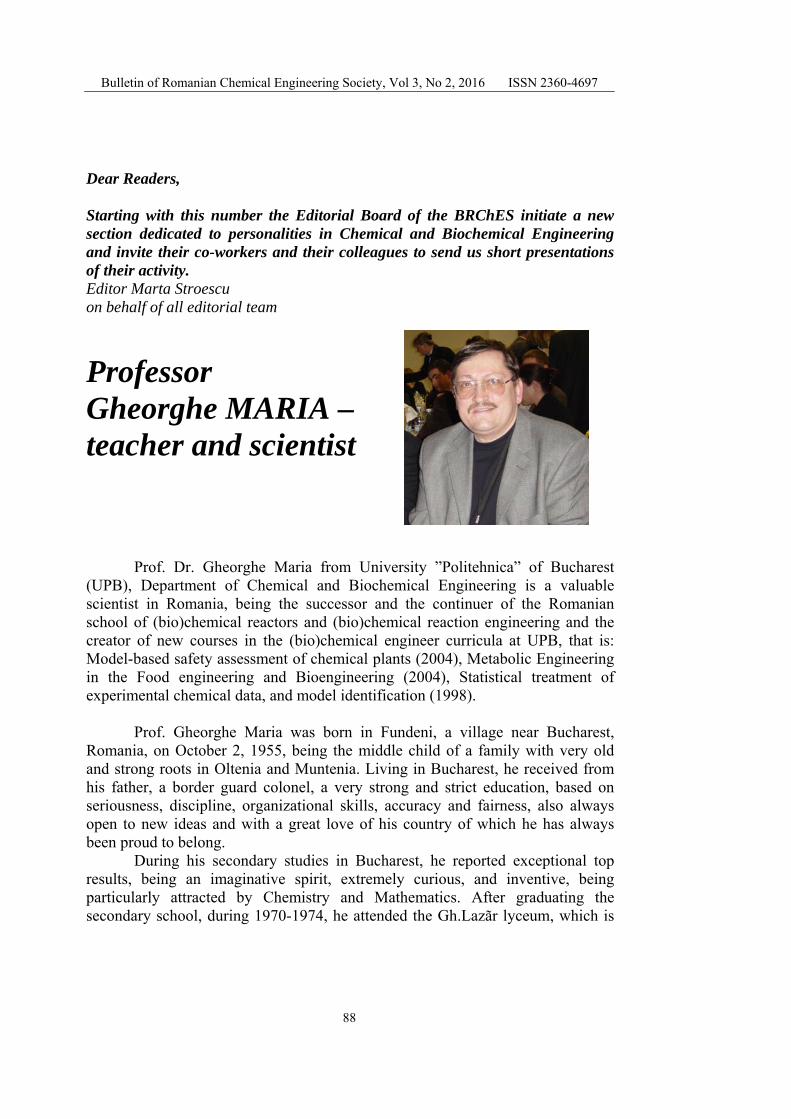
Bulletin of Romanian Chemical Engineering Society, Vol 3, No 2, 2016 ISSN 2360-4697
88
Dear Readers, Starting with this number the Editorial Board of the BRChES initiate a new section dedicated to personalities in Chemical and Biochemical Engineering and invite their co-workers and their colleagues to send us short presentations of their activity. Editor Marta Stroescu on behalf of all editorial team
Professor Gheorghe MARIA – teacher and scientist
Prof. Dr. Gheorghe Maria from University ”Politehnica” of Bucharest (UPB), Department of Chemical and Biochemical Engineering is a valuable scientist in Romania, being the successor and the continuer of the Romanian school of (bio)chemical reactors and (bio)chemical reaction engineering and the creator of new courses in the (bio)chemical engineer curricula at UPB, that is: Model-based safety assessment of chemical plants (2004), Metabolic Engineering in the Food engineering and Bioengineering (2004), Statistical treatment of experimental chemical data, and model identification (1998).
Prof. Gheorghe Maria was born in Fundeni, a village near Bucharest,
Romania, on October 2, 1955, being the middle child of a family with very old and strong roots in Oltenia and Muntenia. Living in Bucharest, he received from his father, a border guard colonel, a very strong and strict education, based on seriousness, discipline, organizational skills, accuracy and fairness, also always open to new ideas and with a great love of his country of which he has always been proud to belong.
During his secondary studies in Bucharest, he reported exceptional top results, being an imaginative spirit, extremely curious, and inventive, being particularly attracted by Chemistry and Mathematics. After graduating the secondary school, during 1970-1974, he attended the Gh.Lazãr lyceum, which is

Diana Manuela Ene
89
one of the top high-schools in Bucharest, in a class specialised on Chemistry and Maths of the late prof. Mariana Andrei, who knew to channel his talent towards a rigorous study of chemistry. He quickly became noted for his original mathematical approach to solving many chemical problems. He participated to a large number of high-school competitions (so-called national Olympics) in Chemistry and Maths, winning several awards and mentions. He also was a fervent collaborator of <Revista de Fizica si Chimie> for high-school students, where he proposed problems to be solved, and published his first paper of his life: G.C. Maria, Antiferromagnetism of magnetite, Revista de Fizica si Chimie B, 11(1), 6 (1974).
Consequently, in 1974 he was selected in the Romanian team to participate to the European Olympics of Chemistry (11 participating countries, including Russia, Germany, Sweden, etc.), where he won the 1st prize (1974) by presenting original and imaginative solutions to several difficult chemical/chemical engineering problems. Being impressed by his success, the writer Eugen Seceleanu, dedicated to him one chapter in his book; “Evenimente mari, evenimente mici”, Eminescu Publ., Bucharest, 1982, pp. 126-130. On 1974 he was admitted to study chemical engineering (Industrial Chemistry Faculty) at University Politehnica of Bucharest (UPB), major in Organic Chemistry and Chemical Engineering that was particularly attracted. Later, this attraction will be materialized in a large number of innovative published studies on modelling metabolic processes in living cells, and also optimization of enzymatic reactors and bioreactors.
During his university studies, he attended the courses of famous professors, such as Organic Chemistry with Prof. Ecaterina Ciorănescu-Neniţescu, Chemical Reaction Engineering with Prof. Raul Mihail, Chemical Process Optimization with Prof. Octavian Smigelschi, Transport Phenomena with Prof. Octavian Floarea. He graduated the UPB on 1979 as valedictorian. Then, he began his career as an in-stage plant engineer (obligatory internship) of 3-years (1979-1982) with several state chemical companies in Bucharest, i.e. Cosmetics Miraj, Chimica Dudesti.
During his university studies, he began to work and published several chemical engineering studies under the supervision of Prof. Raul Mihail and Prof. Octavian Smigelschi, being particularly attracted by the statistical estimation theory, numerical optimization rules, modelling the (bio)chemical process kinetics. In the year 1981 he started his PhD studies under the supervision of Prof. Raul Mihail, with the theme „Parameter Estimation of Chemical Process Models, by approaching a large number of case studies on modelling chemical process kinetics. In the year 1982 he joined ICECHIM - Chemical & Biochemical Energetics Institute Bucharest, (Bio)Catalysis Group, being in charge with modelling the kinetics of a large number of catalytic processes, and with the

Professor Gheorghe Maria – teacher and scientist
90
technological design of the industrial pilot plant at Brazi-Ploiesti Petrochemical work/Refinery. Here are to be noticed their studies on modelling and plant design of methanol conversion to olefins MTO or gasoline MTG on zeolite/silica catalysts. Following these studies, he published in top chemical engineering journals (I&EC-Research, USA; Chemical Engineering Science, Elsevier), and he realized the design and scale-up of the MTG plant at Brazi-Ploiesti Petrochemical work. In 1985 he awards the Prize “N. Teclu” of the Romanian Academy. The developed kinetic models for the MTO and MTG processes reported more than 149 citations on Google Scholar.
In 1986 he co-authored in Computers and Chemical Engineering, a novel numerical procedure, i.e. MMA - a numerical method of structured optimization using an iterative adaptive random search for solving nonlinear programming problems. The method can detect the global extremum for multimodal nonlinear objective functions, convex or nonconvex, in the presence of complex constraints (Mihail, R., Maria, G., A Modified Matyas Algorithm MMA for Random Process Optimization, Computers & Chemical Engineering 10, 539-544, 1986). Later, Prof. Maria extended the MMA (MMAMI) for solving mixed-integer nonlinear programming problems MINLP (Maria, G., ARS combination with an evolutionary algorithm for solving MINLP optimization problems, In: Modelling, Identification and Control, M.H. Hamza (Ed.), IASTED/ACTA Press, Anaheim (CA), 2003, p. 112-118). Later he donated the right to use these routines to several universities: Univ. des Saarlandes; TU Karlsruhe (Germany), and Tianjin Inst. Ind. Biotechnology (China). In 1987 he finalized his PhD studies and got the PhD degree at UPB.
In 1990 he joined UPB as a lecturer. With perseverance, conscientiousness, hardworking, and a tireless investigator and creative spirit he promoted all the university ranks until full professor in UPB on 1999.
Following the socio-political transformations of Romania after the collapse of communism in 1990, he chose to develop over the next two decades a large number of international collaborative works during stages abroad at various universities in EU, Canada, USA, and China.
On 1992 he chose to follow an invitation and he has gone to Switzerland for working as Assistant Professor at ETH Zürich in the group of the late Prof. David W.T. Rippin of Process System Engineering (Chemical Engineering Department). Here he was involved in teaching and research activities in the (bio)chemical engineering field, and he participated to important research projects. For instance, he developed and published novel kinetic models for catalytic processes used for the chemical storage of hydrogen by hydrogenation/dehydrogenation of some aromatic hydrocarbons. He was also involved in developing safety analysis of some industrial chemical reactors (i.e.

Diana Manuela Ene
91
the catalytic aceto-acetylation of pyrrole with diketene at CIBA-NOVARTIS, Basel).
At ETH Prof. Maria developed KINEXP, an expert system for the identification and estimation of a kinetic model for a given (bio)chemical process of known experimental kinetic curves by using a databank that includes similar kinetic models and case studies, and by using a combination of direct and indirect methods to solve the nonlinear programming problem (Maria, G., Rippin, D.W.T., Computers & Chemical Engineering 19, S709-S714, 1995; Maria, G., Rippin, D.W.T., Computers & Chemical Engineering 20, S587-S592, 1996), with more than 42 citations. He also proposed the MIP – an integral direct method for estimating the (bio)chemical process kinetic models using a transfer of information rule from kinetic data-banks, and also an original statistical test for analysis of parameter significance of a nonlinear regression model, by detecting the significant parameters (and redundant part of the model).
In 1997 he returned to Romania becoming Associate Professor and then full Professor (1999) at UPB, by teaching several courses in chemical engineering at BSc or MSc level, such as: (Bio)Chemical reaction engineering, Statistical treatment of (bio)chemical data and process modelling, Metabolic engineering. His research interests concern the fields of (bio)chemical reactor and process kinetic modelling, biochemical engineering and bioinformatics, risk analysis of chemical plants, modelling of cell metabolic processes, gene expression and regulatory circuits in living cells, and the drug release kinetics.
His involvement and publications in such research topics are coming from his vivid and very creative spirit, and tireless search in the vast domain of modelling, design, and optimization of (bio)chemical processes. Thus, many of his publications are coming from his participation over the past 25 years to various international projects, making short research stages/visiting ships at ETH Zürich (3-months in 1997, SNSF fellow on environmental risk analysis), University des Saarlandes (3-months in 1999, DAAD fellow on modelling complex enzymatic kinetics), TU Erlangen (3-months in 2000, modelling catalytic membrane reactors), Texas A&M University (College Station, 2002-2003, NIH fellow on modelling gene expression and gene regulatory networks, synthetic biology), TU Braunschweig (2006) and TU Hamburg (3-months on 2009, DFG and DAAD fellows on simulating bacteria resistance to environmental pollutants), Tianjin Institute of Industrial Biotechnology (2-months in 2010, in-silico searching for gene knockout strategies for E. coli cells, synthetic biology).
He presented more than 25 Invited Lectures at various Universities in EU, Canada, USA (among them: Princeton University, Texas A&M University, EPFL Lausanne, Queen’s University Kingston Canada, BASF Ludwigshafen).

Professor Gheorghe Maria – teacher and scientist
92
In 2008 he became a PhD supervisor at UPB in the (bio)chemical engineering area, with 4 PhD thesis finalized, and 4 PhD-s thesis in progress.
The results of his scientific studies have been published in more than 120 papers in esteemed international ISI journals. At UPB Prof. Maria was the promoter of several courses, by writing the attached teaching manuals for safety analysis of chemical plants; statistical treatment of data; modelling metabolic processes in living cells aiming to design modified microorganisms of industrial use; modelling the drug release from functionalized supports. Prof. Maria was the first in Romania who promoted at UPB applications and projects of high complexity level, consistent with those developed in EU, referring to themes in the border areas of chemical and biochemical engineering, related to molecular biology, genetic and metabolic engineering, simulation of cellular processes, synthetic biology and systems biology, being an expert on these topics for various EU or national research programs.
In any type of activity with students, Prof. Maria managed to mobilize them to participate in research topics of great novelty at national and European level, transmitting to them the passion for science, seriousness and education of the "well done job", the joy to participate through continuous self-improvement and getting results published in top international journals.
Being a strong personality, marked by dedication, and initiative, Prof. Maria was actively involved in educational and research activities in Romania, being part to PhD analysis committees, also a member of the CNATCDU (2010-2012), and participating at chemical engineering conferences in the country (Iasi, Timisoara, Cluj).
While Prof. Raul Mihail (1920-1985) was the creator of the Romanian school of (bio)chemical reactors, by publishing the first course of "Chemical Reactors" (1971) in the country (and third in the world), Prof. Maria was one of its continuers making a bridge over years with the modern school of chemical reactors at the UPB, by developing and promoting it through projects, publications, and applications in academia and chemical industry. Here, it is to notice publication of some valuable monographs: Maria, G., Chemical Process Quantitative Risk Analysis and Modelling of Accident Consequences, Printech Publ., Bucharest, 2007 (630 pag.), ISBN 978-973-718-667-6; Maria, G., Statistical data analysis and correlations. Distributions and estimators, Printech Publ, Bucharest, 2008 (550 pag.), ISBN 978-973-718-886-1; Maria, G., Luta, I., Kinetic models for the in-silico design of functionakized mesoporous supports for the controlled release of biological active principles, Printech Publ., Bucharest, 2015 (476 pag.), ISBN 978-606-23-0443-0. Prof. Maria authored 9 books and teaching books, 5 book chapters, more than 120 papers in peer reviewed ISI international journals and university’s journals, and 71 in international conference proceedings, with more than 925
Diana Manuela Ene
93
citations (h-index 17 and i10 index 30 in Google Schoolar). According to the Romanian ranking system, he reported high scores signing NP=88 ISI papers as principal author, with a cumulative impact factor of FIC= 129.44. He is a reviewer for many (bio)chemical engineering journals (19), and a member in the scientific/editorial board of Chem. & Biochemical Eng. Q. (Zagreb), Revista de Chimie (Bucharest), The Scientific Bulletin of University POLITEHNICA of Bucharest, Bulletin of Romanian Chemical Engineering Society, ECOTERRA Journal of Environmental Research and Protection (edited by Romanian Society of Environmental Sciences and Engineering, Cluj-Napoca Romania). During his participation to scientific conferences, he co-chaired 13 national and international conferences. The total devotion to the school of Prof. Maria, even at the cost of his health, his strong sense of responsibility, self-exigency, team spirit and involvement, brought to Prof. Maria respect and recognition from the colleagues from the Department of Chemical and Biochemical Engineering, being appreciated as a balancing factor, but also as a dynamic element in the perpetual renewal of the Department and its adaptation to the requirements of a modern European education and performance.
For me, it was a privilege to work with Prof. Maria, even for a short period of time, being one of his PhD students. Thus, I had the occasion to discover that behind the outstanding scientist there is an encyclopaedic personality. As a scientist he teaches you how to quest for challenges and focus on novelties. Thanks to him I got involved with the fascinating area of modelling the kinetics of very complex multi-enzymatic systems, one of his major and worldwide recognized research areas. More information on his personal website: https://sites.google.com/site/gheorghemariasite/
PhD. Eng. Ene Diana Manuela BIOTEHNOS S.A. Bucuresti (Otopeni)
Former PhD student of prof. Maria Gheorghe


