109


Bulletin of Romanian Chemical Engineering Society, Vol. 5, No. 1, 2018 ISSN 2360-4697
1
Contents
Alma-Valentina BROȘTEANU, Ionuț BANU, Grigore BOZGA, Recent progresses in ethanol conversion to 1,3-butadiene………………………………..2
Diana Maria MATEI, Costin Sorin BÎLDEA, Design and plantwide control of di-n butyl ether (DNBE) production process ……………………………………….28
Maria HARJA, Lăcrămiara RUSU, Gabriela CIOBANU, Modelling and simulation of carbon monoxide oxidation reactor at low temperature,…………39
Tănase DOBRE, Marta STROESCU, Anicuța STOICA-GUZUN and Iuliana Mihaela JIPA, Liquid-liquid extraction coupled with solvent recycling by distillation –modelling and scale-up of the continuous process ………………..48
Cristian Eugen RĂDUCANU, Oana Cristina PÂRVULESCU, Tănase DOBRE, Iuliana DUMITRU, Florentina DRĂGUȘIN, Air drying of aromatic plants coupled with recovery of volatile compounds…………………………………...58
Alexandru Ioan ATOMI, Gabriel Dan SUDITU, Adrian Cătălin PUIŢEL, Mircea Teodor NECHITA, Experimental study on TiO2 promoted photo-degradation of methylene blue………………………………………………………………….. 68
Ioana-Alina CIOBOTARU, Oana-Claudia CIOBOTEA BARBU, Anca COJOCARU, Ioana MAIOR, Florin-Mihai BENGA, Danut-Ionel VAIREANU, Electrochemical studies on reinforced BTSE coatings deposited on anodized aluminium………………………………………………………………………..75
Alexandru BOSCORNEA, Tănase DOBRE, Oana Cristina PÂRVULESCU, Cristian Eugen RĂDUCANU, Kinetics of copper etching with ammonium persulfate…………………………………………………………………………83
Gheorghe MARIA, Methanol to hydrocarbons – a Romanian project of high success……………………………………………………………………………91

Bulletin of Romanian Chemical Engineering Society, Vol. 5, No. 1, 2018 ISSN 2360-4697
2
RECENT PROGRESSES IN ETHANOL CONVERSION TO
1, 3-BUTADIENE
Alma-Valentina BROȘTEANU, Ionuț BANU, Grigore BOZGA
Department of Chemical and Biochemical Engineering, University POLITEHNICA of Bucharest,1-7 Polizu Street, 011061, Bucharest, Romania
Abstract In the last decades, there is a growing interest of academic and industrial research to
discover catalysts and technologies able to substitute petroleum derivatives with products derived from renewable resources. 1,3-butadiene, an important industrial monomer, presently obtained from petroleum fractions, is one of the hydrocarbons which can be obtained alternatively from biomass-derived feedstock. The aim of this work is to review the recent progresses in the synthesis of 1,3-butadiene from ethanol. The catalysts proposed and tested for this process are compared in terms of activity, selectivity and resistance to deactivation. There are also presented the main results of the few published studies investigating the process kinetics on different catalysts, process thermodynamics as well as recommendations for catalytic reactor design. Key words: 1,3-butadiene, ethanol, catalyst, kinetics
1. Introduction
1,3-Butadiene (1,3-BD) is an important hydrocarbon, used essentially as a monomer in the production of the synthetic rubber. Currently, it is obtained by dehydrogenation of n-butane and n-butenes derived from petroleum fractions and as a byproduct of ethylene (steam cracking) plants. The 1,3-BD to ethylene relative selectivity of steam cracking plants is depending on the feedstock, ranging from 0.02 kg 1,3-BD/kg ethylene for ethane cracking to 0.26 kg 1,3-BD/kg ethylene for gas oil cracking [1].
An alternative technology for 1,3-BD synthesis is using ethanol as raw material (ethanol to butadiene process/ ETB). The reaction was discovered by the Russian chemist Ipatiev in 1903, passing ethanol vapors at 550-600 oC over Al powder. Further, finding more adequate catalysts, the ETB process was developed at commercial technology level, by the Russians Ostromyslensky and Lebedev. Ostromyslensky (1915) developed an ETB technology based on the ethanol reaction with acetaldehyde, catalyzed by alumina or clays at 450 oC, obtaining 1,3-BD yields around 18 %. Lebedev (1929) discovered an ETB process permitting the direct ethanol conversion to 1,3-BD, over a mixture of zinc oxide Corresponding author: E-mail address: [email protected]

Recent progresses in ethanol conversion to 1,3-butadiene
3
and alumina at 400 oC, at same yields of 18 %. Further Lebedev and his group developed new catalysts for ETB process, not disclosed by author (later on identified to be a mixture of magnesia and silica promoted by small concentrations of different elements), permitting higher yields and selectivity [1, 2,3]. Based on the results of Ostromislensky and Lebedev there were developed ETB industrially proven technologies practiced from 1920 untill the decade 1960s. The direct ethanol conversion (one-step) process developed by Lebedev, was applied commercially in Soviet Union. A two-step ethanol conversion process, using tantalum oxide-silica catalysts, based on the Ostromislensky discovery, was developed and commercialized in USA. However, both processes became economically uncompetitive after the 1960s because of the development of new synthesis technologies based on petroleum derivatives [4]. In the las period, the interest for ETB process renewed, due to the exhausting of fossil resources and the effort in the direction of CO2 emission limitations. This trend is also encouraged by the continuous increase of ethanol production and its renewable feedstock feature [5]. The biggest world ethanol producer is USA, accounting for 57 % of global production in 2015 (~56000 mega liters/ML) and envisaging to produce 164000 ML by 2022 [6]. The main international producers of ethanol and their level of production in 2015 are presented in figure 1.
Fig. 1. The main world ethanol producers in 2015 [6]
As already mentioned, there are patented two technologies for 1,3-BD
production from ethanol, a one-step and a two-step process respectively. Both of them are based on vapor phase transformation in presence of metal-oxide mixtures as catalysts.
In the two-step process the ethanol is firstly dehydrogenated to acetaldehyde and further, in a second step, the acetaldehyde reacts with ethanol leading to 1,3-BD. The two reaction steps are performed in different equipment, so that the operating conditions can be selected to maximize the performances of each step [7].

Alma-Valentina Broșteanu, Ionuț Banu, Grigore Bozga
4
In the one-step process, the ethanol transformation to 1,3-BD takes place in a single reactor. The advantage is a lower investment cost for the plant, but the operation is less flexible, as the operating conditions are identical for all the reactions involved in the ethanol transformation to 1,3-BD.
2. Transformation mechanisms for direct conversion of ethanol to butadiene
The overall reaction of butadiene synthesis from ethanol is described by the equation: 2C2H5OH C4H6 + 2H2O + H2 (1)
The conversion of ethanol to butadiene occurs in a multi-step chemical process, consisting of consecutive-parallel reactions, still incompletely known. This complex transformation involves the utilization of a bifunctional catalyst, able to promote the dehydration and dehydrogenation reactions. Besides the main 1,3-BD product, in the conversion process are resulting an important number of secondary products, with selectivity depending on the particular catalyst composition and working conditions: diethyl ether, ethylene, acetaldehyde, ethyl acetate, acetone, butanol, propylene, propane, pentene, hexene etc. [8].
In what follows there are presented the main chemical mechanisms proposed to explain the ethanol transformation to 1,3-BD. Note that these are not explaining the secondary products formation. Details regarding this subject are given by Makshina et al. [1].
Kagan Mechanism. A largely accepted mechanism for direct conversion of ethanol to 1,3-BD synthesis was firstly formulated by Kagan et al. and developed by Niiyama et al. [9], Bhattacharyya and Sanyal [10] and Natta and Rigamonti [11]. The main steps of this mechanism are presented in figure 2-a. In this scheme, the greatest debate was related to the transformation of 2-butenal (crotonaldehyde) to 2-butenol. The largest accepted hypothesis is assuming the intermolecular hydrogen transfer between the molecules of ethanol and 2-butenal, following a so-called Meerwein–Ponndorf–Verley–Oppenauer (MPVO) mechanism, involving the participation of acid and basic sites of the catalyst. The occurrence of crotonaldehyde reduction by ethanol (MPVO step), related to the presence of Lewis acid sites, was argued by using thermodynamic calculations [1,12]. The kinetic controlling step, in the overall scheme presented in figure 2-a, seems to depend on the concentrations of acid and basic sites concentrations in the MgO-SiO2 catalyst. Bhattacharyya and Sanyal [10] and Kvisle et al. [13] hypothesized that the controlling step is the aldol condensation. However, over basic catalysts with poor redox properties, ethanol dehydrogenation to acetaldehyde is supposed to be the controlling step [9, 14]. Other theory stipulates

Recent progresses in ethanol conversion to 1,3-butadiene
5
that, in the case of catalysts featuring Lewis acidity, the slowest controlling step should be the MPVO reaction step [14]. Jones et al. [15] are concluding, based on own experimental data on MgO-SiO2 (1:1), that the controlling step is depending also on temperature. On the domain 300-400 oC the acetaldehyde condensation is controlling the overall kinetics, whereas at higher temperature the slowest step is expected to be ethanol dehydrogenation.
Fig 2. Reaction pathway for the formation of butadiene from ethanol: a-The Kagan Mechanism [16]; b- The Fripiat’s Prins Mechanism [16]; c- The Cavani Mechanism [14].
Other mechanisms proposed for ethanol conversion to 1,3-BD. Even if the
mechanism previously presented is largely accepted, there were formulated also other reaction mechanisms. One of these is the mechanism whose structure is given in figure 2-b (Firip Prins mechanism).This involves, in a first stage, both dehydration and dehydrogenation reactions of ethanol, producing ethylene and acetaldehyde. Further, >C=O group reacts with the proton of a Brønsted acid center, transforming into a hydroxylated carbocation, able to open the double bond of ethylene. The resulting 3-buten-2-ol (CH3-CH(OH)-CH=CH2) is then dehydrated to yield 1,3-BD [1, 16]. The thermodynamic calculations confirmed that the reactions involved in the Firip Prins mechanism are energetically possible, but they are less favorable as compared with those of Kagan mechanism [1,12].
Alma-Valentina Broșteanu, Ionuț Banu, Grigore Bozga
6
Another mechanism proposed for ethanol conversion to 1,3-BD is described in the scheme of figure 2-c (Cavani mechanism). Besides the ethanol dissociate into acetaldehyde and hydrogen, this mechanism is assuming the formation of carbanionic species by proton abstraction, stabilized on Mg cations. This carbanion act as the main intermediate for the formation of the various products that are generated during the ethanol to 1,3-BD conversion. If attacked by the carbanion, a neighboring adsorbed acetaldehyde molecule are transformed in crotyl alcohol, which further is dehydrated into 1,3-BD; if attacked by the carbanion, an adsorbed ethanol molecule is forming 1‐butanol, which can be dehydrated into 1‐butene. In the absence of neighboring molecule, the remaining hydroxy group of the carbanion would dissociate, resulting ethylene. Further details are given in the references [1,16].
3. Catalysts
The main objective of the majority of published studies, regarding the ethanol conversion to butadiene, is to identify new catalysts having superior activity and selectivity. In this aim, there are investigated the influences of the composition and synthesis method of different materials on their catalytic performances and are searched for chemical species (promoters/dopants), improving these performances. In the next section are presented the most important doped and un-doped catalysts proposed, by different authors, for the ethanol transformation to 1,3-BD.
3.1 Catalysts and technologies for the one step conversion of ethanol to 1,3-BD
The first catalyst for one step process, a mixture of zinc oxide and alumina, was developed and patented in the early 1930 by Sergei Lebedev, who developed the process bearing his name. One decade later, Natta and Rigamonti (1947a, 1947b) identified that the best catalyst for one-step process is a mixture of silica and magnesia. The authors are claiming that „with silica-magnesia catalyst prepared with particular precautions, in order to prevent the salification of the two components, yields of 60% on the theoretical were achieved”.
Indeed, the published studies show that, till now, the most active and selective catalysts for this reaction are still based on MgO/SiO2, even if has passed almost one century, since it was discovered. MgO offers the basic sites and has catalytic activity in the aldol condensation and dehydrogenation steps, whereas SiO2 offers the acidic sites and is catalyzing the dehydration reactions. The published studies evidenced also that the MgO/SiO2 catalyst performances are critically dependent on the composition and the preparation method. Several

Recent progresses in ethanol conversion to 1,3-butadiene
7
studies led to the conclusion that a Mg/Si ratio higher than or equal to unity provide high catalytic activity of the MgO/SiO2 mixture, permitting to obtain 1,3-BD yields up to 42 % [1,8,9,13,17,18].
The usual methods for multicomponent catalysts preparation are the incipient impregnation, mechanical mixing, co-precipitation and wet kneading [8,19]. A comparison of performances for catalysts prepared by different methods is published by Kvisle et al. [13]. The authors found that the performance of the catalyst prepared by wet-kneading of the MgO and SiO2 is totally superior to that of the catalyst prepared by mechanical mixing of the components. They concluded that SiO2 is an essential component of the bifunctional catalyst and furthermore that is appearing an interaction leading to a synergic effect of MgO and SiO2, when these are combined by wet-kneading. The superiority of the wet-kneading preparation method was also evidenced in the study published by Ohnishi et al. [17].
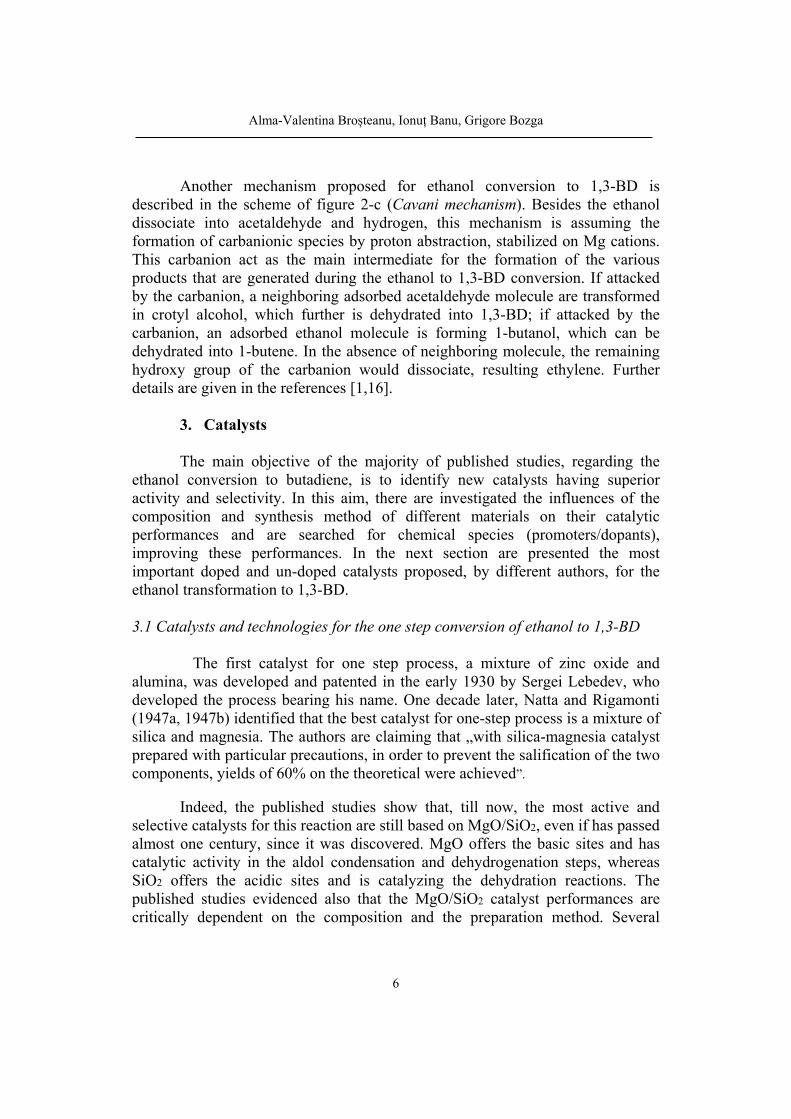
In Table 1 are presented the performances of a series of catalysts containing MgO and SiO2, in different proportions, prepared by different methods, in the transformation of ethanol to 1,3-BD. For bifunctional catalyst preparation there were used two methods, the co-precipitation and wet kneading where was found that, for the wet kneading preparation, the selectivity of 1,3-BD formation increases with the mole fraction of MgO, a result which is presumably related to MgO's ability to dehydrogenate ethanol [18,20]. However, a minimum amount of SiO2 proved to be essential, as it may favor the dispersion of the metals and is catalyzing the dehydration steps in the mechanism.
Da Ross et al. [20], carried out experiments on catalysts with the MgO-SiO2 molar ratios of 50:50 and 95:5, prepared by co-precipitation method. For the catalyst MgO-SiO2 (50:50), the average ethanol conversion ranged from 4.7%, at 300 °C, to 93.8%, at 450 °C. For catalyst MgO-SiO2 (95:5), the average ethanol conversion ranged from 6.2%, at 300 °C, to 83.0 %, at 450 °C and a different product distribution was obtained. In this case, the amounts of produced ethylene were significantly smaller, when compared to the previous catalyst, although the amounts of 1,3-BD were similar. As expected, higher 1,3-BD, acetaldehyde and ethylene molar fractions were observed with the increasing reaction temperature for both catalysts.
An extensive study of ethanol conversion to 1,3-BD over MgO-SiO2
catalyst was reported by Kvisle et al [13]. Two catalyst were prepared and tested, having the Mg/Si molar ratios of 0.83 and 0.63 respectively. Working at 350 oC and WHSV below 0.1 h-1, with pure ethanol, the authors obtained 1,3-BD yield values up to 16 % at ethanol conversions of maximum 60 %. Notable improvements of yield were obtained by addition of acetaldehyde or gaseous oxygen to the ethanol feed. The best result (yield 33 % at a global conversion of 48 %) was obtained by feeding a mixture ethanol-acetaldehyde (4:1, vol).
Alma-Valentina Broșteanu, Ionuț Banu, Grigore Bozga
8
Table 1
Overview of catalysts performance over magnesia–silica
Entry Catalyst T (°C)
X (%)
WHSV
1,3-BD Selectivity (%)
1,3-BD yield (%)
1,3-BD productivity (gBDgcat
-1h-1)
Ref.
1. MgO-SiO2 (2:3 weight)
430 83.7 0.14 41.1 34.4 - Natta et al. [11]
2. MgO-SiO2 (3:1 mol)
380 54 - 62 33 - Niiyama et al. [9]
3. MgO-SiO2(** (1:1 mol)
350 50 5.7 84 42 - Ohnishi et al. [17]
4. MgO-SiO2 (0.83:1 mol)
350 53 0.032 30 16 - Kvisle et al. [13]
5. MgO-SiO2 (* (0.83:1 mol)
350 48 0.032 68 33 - Kvisle et al. [13]
6. MgO-SiO2 (15:5)
440 71 0.3 53 37 0.06 Makshina et al. [18]
7. MgO-SiO2 (50:50)
350 50 0.15 84 42 0.04 Makshina et al. [18]
8. MgO-SiO2 (50:50)
300 6.7 0.8 9.2 1.53 - Da Ros et al. [15]
9. MgO-SiO2 (50:50)
450 97.4 0.8 5.9 9.35 - Da Ros et al. [15]
10. MgO-SiO2 (95:5)
300 8.4 0.8 - 0.42 - Da Ros et al. [15]
11. MgO-SiO2 (95:5)
450 84.5 0.8 - 20.58 - Da Ros et al. [15]
*) Feed ethanol+acetaldehyde (20% vol); **) Feed of ethanol and nitrogen at 1 bar (1.6 % mol ethanol)
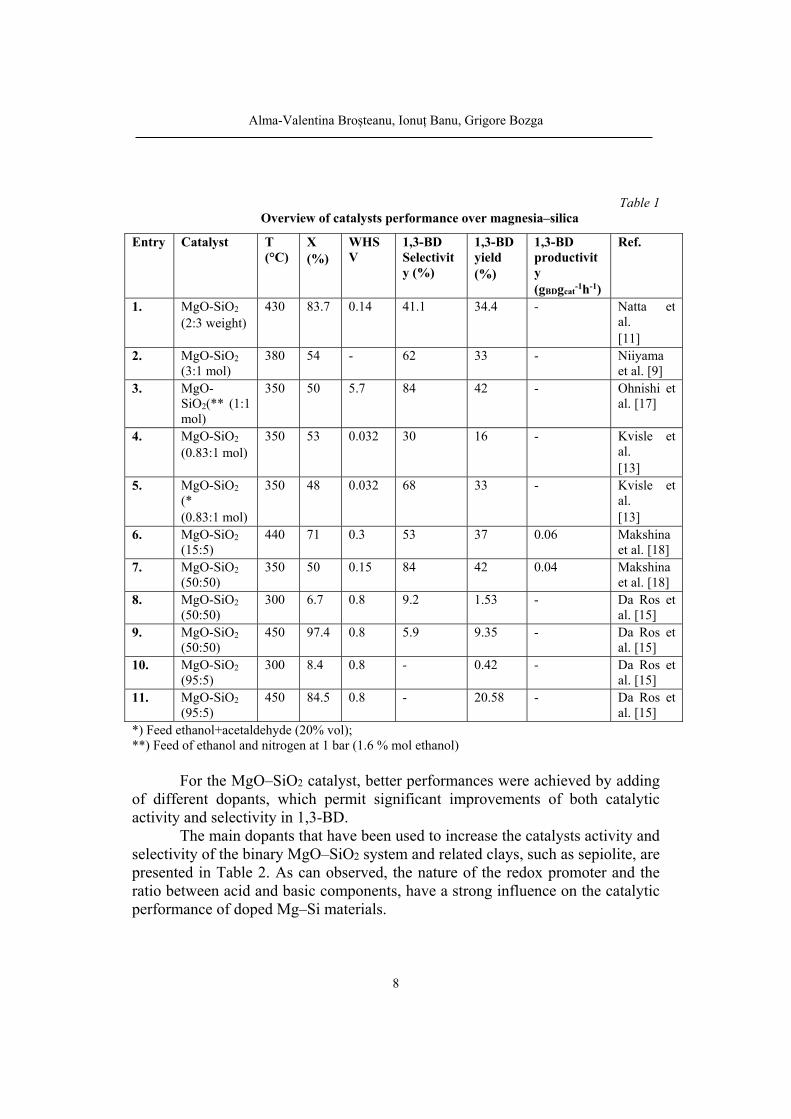
For the MgO–SiO2 catalyst, better performances were achieved by adding
of different dopants, which permit significant improvements of both catalytic activity and selectivity in 1,3-BD.
The main dopants that have been used to increase the catalysts activity and selectivity of the binary MgO–SiO2 system and related clays, such as sepiolite, are presented in Table 2. As can observed, the nature of the redox promoter and the ratio between acid and basic components, have a strong influence on the catalytic performance of doped Mg–Si materials.
Recent progresses in ethanol conversion to 1,3-butadiene
9
Table 2 Overview of catalysts performances over doped magnesia–silica and other catalytic systems
Entry Catalyst T (°C)
X (%)
WHSV BD ( %)
BD ( %)
pBD (gBD/ gcat/h)
Ref.
1. ZnO-Al2O3 (40wt% ZnO)
425 94.38 1.5 59.1 55.8 0.49 Bhattacharyya et al. [23]
2. MgO-Al2O3 (20 wt % MgO)
425 - 1.5 - 47.8 0.42 Bhattacharyya et al. [23]
3. MgO-SiO2-0.1%K2O
350 - - - 70 - Ohnishi et al. [17]
4. MgO/SiO2-0.1%Na2O
350 - - - 87 - Ohnishi et al. [17]
5. CuOx-MgO-SiO2
400 86.3 0,73 53 44.3 0.20 Makshina et al. [18]
6. Zn-MgO-SiO2
400 98.7 0.42 46 45.4 0.19 Makshina et al. [18]
7. CoOx-MgO-SiO2
350 58 - 60 34.9 0.04 Makshina et al. [18]
8. ZnOx-MgO-SiO2
350 65.2 - 54 35.5 0.15 Makshina et al. [18]
9. 2%Cr2O3-59%MgO-39%SiO2
400 68 0.15 56 38 0.08 Makshina et al. [18]
10. Ag/MgO-SiO2 (Ag/Si=0.05, Mg/Si=2)
400 91.8 - 54 49.2 0.2 Makshina et al. [18]
11. Ag/MgO-SiO2 (Ag/Si=0.01, Mg/Si=2)
350 97.1 58 56.3 0.06 Makshina et al. [18]
12. AgOx-MgO-SiO2
350 97.1 0,73 6 56.3 0.06 Makshina et al. [18]
13. 1Ag-10ZrO2-3CeO2-500SiO2
325 41 0.3 - 81 - Ordomskiy et al. [24]
14. Mg/sapiolites 300 - - - 33.4 - Ezinkwo et al. [5]
15. 1% Ag/MgO-SiO2
480 84 1.2 50.0 42 0.29 Janssens et al. [25]
16. 1% Cu/MgO-SiO2
425 74 1.1 100 74 0.84 Angelici et al. [26]

Alma-Valentina Broșteanu, Ionuț Banu, Grigore Bozga
10
17. 34.1MgO- 63.6 SiO2- 1.4ZnO-0.4Na2O2-0.1CaO-0.3Al2O3-0.1B2O3
400 43.2 - 49.1 21.21 - Makshina et al. [1]
18. 2% ZrO2/SiO2
320 45.4 1.8 69.4 31.6 0.33 Han et al. [27]
19. HM-Hf/SiO2 360 99 0.64 69.5 68.8 0.26 Baerdemaeker et al. [28]
20. MgO-SiO2-Na2O(Mg/Si=1)
400 98.7 - 45.4 - - Sekiguci et al. [29]
21. 5%CuO MgO/SiO2
(2/1)
350 - - - 58.2 - [Sekiguchi2015]
22. 1.5% Zr-1%Zn/MgO-SiO2
375 40 0.62 76.0 30.4 0.13 Da Ros et al. [20]
23. 3% Au/MgO-SiO2
300 45 1.1 60.0 27 0.14 Shylesh et al. [4]
24. 1.2- K/ZrZn/MgO-SiO2
375 44 0.31 57.8 37.2 0.07 Da Ros et al. [20]
25. 2000 ppm Na/Zn1Zr10On
350 54.4 6.2 27.9 15.2 0.49 Baylon et al. [30]
26. ZrZn/MgO-SiO2
375 32 0.62 44.6 41.4 0.17 Da Ros et al. [20]
27. 3% Ta/BEA 350 58.9 0.8 73.2 43.1 0.2 Kyriienko et al. [31]
28. AgTaSiBEA 325 82.9 0.5 62.2 51.9 - Kyriienko et al. [32]
29. Cs2O-1ZnO-5ZrO2/SiO2
400 97.7 1 55.8 55 0.32 Patil et al. [22]
30. CuTaSiBEA 325 87.9 0.5 72.6 63.8 - Kyriienko et al. [32]
BD - 1,3-BD selectivity (2 moles C4H6/moles ethanol transformed) ; BD - 1,3-BD yield (2 moles C4H6/moles ethanol in the feed); pBD - 1,3-BD productivity (gBDgcat
-1h-1) *) Catalyst composition (mole)
Considering the performance parameters such as 1,3-BD selectivity, 1,3-
BD yield, 1.3-BD concentration in the product stream and 1,3-BD productivity, the catalysts containing silver, copper oxide, zinc oxide as promoters appear to be the best option for ethanol conversion to 1,3-BD [21]. The addition of Zr and Zn

Recent progresses in ethanol conversion to 1,3-butadiene
11
also increased the selectivity to 1,3-BD, by catalyzing the aldol and dehydrogenation steps in the mechanism. Recently Patil et al. [22] have evidenced a cooperative effect of ZnO-ZrO2 oxides deposited over silica and promoted with Cs, in the increase considerably the conversion of ethanol into butadiene. They have obtained 1,3-BD selectivity around 40% and an 1,3-BD yield close to 55% emphasizing that Cs is the most promising promoter of all alkali metal oxides they tested.
Systematic and extensive investigations of the, catalytic performances for a great number of metallic oxides in binary and ternary mixtures were also reported by Bhattacharyya [23]. The best results, obtained on ZnO-Al2O3 mixture are presented in table 2. In two recently published studies [19] Tretyakov and his research group are reporting investigations of ETB process over the same ZnO-Al2O3 catalyst (composition not specified), in presence of H2O2 as initiator. Reporting a 1,3-BD yield of 24.5 % at a selectivity of 55 %, the authors claim a better stability to deactivation (120 h in presence of initiator, as compared with 48 h in absence of initiator).
In conclusion, among the catalysts tested for one-step conversion of ethanol to 1,3-BD, the most interesting results were obtained using Al2O3/ZnO and MgO/SiO2, either as such or doped with different metals or metal oxides. The magnesia and zinc oxide offer the catalytic sites for dehydrogenation reactions, whereas silica and alumina provide acidic sites for the dehydration steps of the process. The studies presented above shown that the catalysts selectivity for Lebedev one-step process ranges between 50 and 80 %, the higher values being obtained at low ethanol conversions and relatively low ethanol concentrations. A low ethanol conversion should not be very inconveniently, as ethanol separation of reaction products is relatively easy and furthermore, some of products recycling is beneficial for butadiene yield. Another important performance parameter of catalysts is the butadiene productivity. The maximum reported values are 400 gBD /(h Lcatalyst). However, the majority of investigated catalysts provide productivities under 100 gBD /(h Lcatalyst) [1]. As a roughly rule, Makshina et al. [1] are recommended to use catalysts insuring productivities of minimum 0.15 g 1,3-BD/(gcat h), at 1,3-BD concentrations in the product stream, higher than 10000 ppm vol (1 % vol).
3.2 Catalysts and technologies for the two-step conversion of ethanol to 1,3-BD
In two-step process, the ethanol dehydrogenation is decoupled of acetaldehyde condensation and the reactions of C4 products yielding 1,3-BD, the two process stages taking place in different reactors. Corson et al. [33] claimed the superiority of the two-step industrial process setup in USA, as compared with the one-step Lebedev process implemented in USSR. According to authors, extensive laboratory investigations in the referred period,

Alma-Valentina Broșteanu, Ionuț Banu, Grigore Bozga
12
shown that the maximum yield in one step technology was 56 % achieved at temperatures up to 425 oC. In comparison, in the two-step process were obtained yields of 64 %, at a lower temperature of 350 oC. It is also shown that the on-stream time (time between two successive regenerations) was 12 hours for the one-step catalyst, as compared with 120 hours for the two-step catalyst. 3.2.1 Ethanol dehydrogenation to acetaldehyde
The ethanol dehydrogenation is usually performed over Cu based catalysts. Franckaerts and Froment [34] used CuO with 5 wt % CoO and 1 wt % Cr2O3 precipitated on asbestos, whereas Peloso et al. [35] used a catalyst having the composition (wt) CuO 41.2 %, Cr2O3 33.4 %, SiO2 9.3 %, Na2O 3.3 %, binder 12.8 %; in two investigations focused on the process kinetics.
Tesser et al. [36] investigated the ethanol conversion to acetaldehyde by oxidative dehydrogenation, on a V2O5/TiO2-SiO2 catalyst. Working at 160 oC and 194.6 g catalyst/(mol ethanol h), in presence of Helium the authors obtained acetaldehyde yields of ~ 88% for 99.6% ethanol conversion. Interestingly, in presence of water (1:1 molar ratio in the feed) at 160 oC and 97.3 g catalyst/(mol ethanol h), the authors are reporting acetaldehyde yields of 78.5 % at 81 % ethanol conversion. Morales et al. [37] prepared and tested Cu nanoparticles highly dispersed on graphitic supports or reduced graphene oxide, which featured superior activities in ethanol dehydrogenation, as compared with the classical Cu/SiO2. Chang et al. [38] used as support for copper a rice husk ash, claiming to obtain a catalyst for ethanol dehydrogenation with superior activity and more resistant to deactivation, as compared with Cu/SiO2.
A second category of studies investigated the ethanol conversion to acetaldehyde in presence of oxygen, the so called oxidative dehydrogenation (ODH). The oxidative dehydrogenation has two advantages: (i) possibility to ensure the heat consumed in the ethanol dehydrogenation reaction by an exothermal oxidation reaction (auto-thermal operation); (ii) elimination of the chemical equilibrium limitation specific for the dehydrogenation reaction; iii) diminution of the catalyst deactivation by cocking. One of the catalysts proved to have good activity in this process is V2O5 supported on SiO2. Quaranta et al. [39] found that the performance of the V2O5/SiO2 is significantly improved by coating the silica with a monolayer of titania (TiO2). In a following study [40] the same authors investigated the interactions between SiO2 and TiO2, explaining the superior activity and selectivity of V2O5/TiO2-SiO2, as compared with V2O5/SiO2 catalyst. They emphasized that the characteristics of the TiO2 deposition onto SiO2 surface and the load of TiO2, are the main factors influencing the V2O5/TiO2-SiO2 catalyst performances. By applying suitable catalyst preparation methods and reaction conditions the authors obtained acetaldehyde yields of 72 %, among

Recent progresses in ethanol conversion to 1,3-butadiene
13
the highest reported in this category of studies. Santacesaria et al. [41] and Cozzolino et al. [42] also investigated the influences of the method of vanadium deposition on the TiO2-SiO2 support and of the vanadium concentration respectively, on the catalyst performances. There are reported acetaldehyde selectivity values of 79 % and 70 %, for ethanol conversion of 54 % and 76% respectively. The same group of research [36] studied the mechanism and kinetics of the ethanol ODH over the same class of catalysts. The authors are underlying that the surface reaction mechanism does not involve the lattice oxygen, due to relatively low reaction temperature (up to 190 oC). Cicmanec et al. [43] investigated the ethanol oxidation process in presence of a VOx/SiO2 catalyst, obtaining a selectivity of ~ 90 % for an ethanol conversion of 50 % (300 oC; feed C2H5OH/O2/He = 5/2.5/92.5). Another catalyst tested for ODH of ethanol is obtained by using MgO as a support for vanadium oxides (VMgO). Gomez et al. [44] obtained ethanol conversions up to 94.8 %, with acetaldehyde selectivity values of minimum 90 % Tsuruya et al. [45] demonstrated the catalytic activity for ODH of ethanol, of the Y(Na) zeolite modified, by partial Na+ ion exchange, with Co2+ and Cu2+ respectively. Both metals provide interesting catalytic activity, slightly superior for Cu(II)NaY (reported acetaldehyde yields up to 80 %, with total selectivity, at temperatures of maximum 350 oC). Parlitz et al. [46] investigated the catalytic performances of Cr/SiO2 for the same process. The study is focused on the influences of support pretreatment and Cr concentration on the catalytic performances in ethanol oxidation to acetaldehyde, addressing also elements of surface reaction mechanism. A bimetallic Au-Ir nanoparticles catalyst, also displayed enhanced activity in ethanol oxidation to acetaldehyde, outperforming their monometallic counterparts [47, 48]. Redina et al. [49] prepared an Au-Cu/SiO2 catalyst and demonstrated experimentally high activity and selectivity for ODH of ethanol. The catalyst with the composition 0.2%Au-0.2%Cu/Al2O3 insured practically total selectivity at total ethanol conversion. However, due to the fast deactivation of this catalyst, the authors are recommending a catalyst composition 0.8%Au-0.8%Cu/SiO2 (100 % selectivity at 80 % conversion), more resistant to metal sintering [49]. Du et al. [50] are reporting outstanding catalytic performances in ODH of ethanol, for Au/CuSiO3 nanotubes (98 % acetaldehyde selectivity at 93 % conversion at 250 oC and 100 L/(gcat h)). These are explained mainly by a high specific surface area and a synergy between Au and Cu particle on the catalyst surface. The mechanism of ODH of ethanol on Au was investigated also by Gong and Mullins [51]. Castillo et al. [52] found also that a mixture of Fe2(Mo04)3 and α-SbO4 (mixed mechanically) has good catalytic performances for ethanol conversion to acetaldehyde by partial oxidation. The best results reported corresponding to an
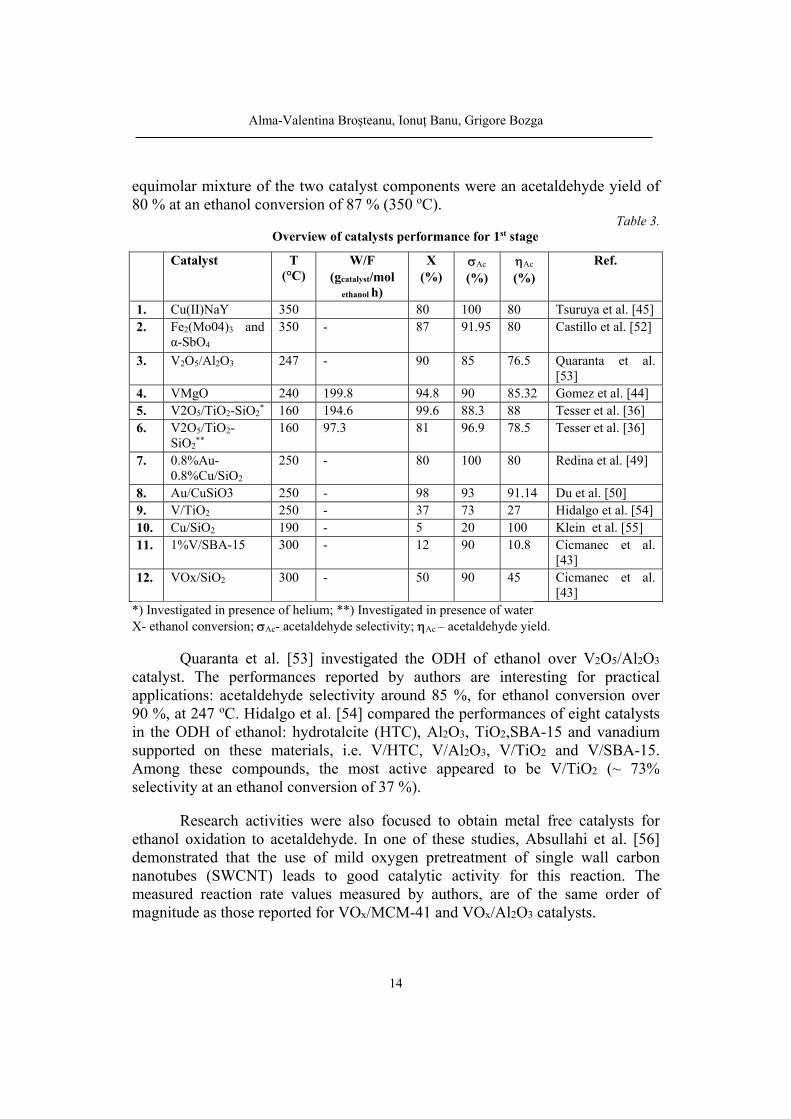
Alma-Valentina Broșteanu, Ionuț Banu, Grigore Bozga
14
equimolar mixture of the two catalyst components were an acetaldehyde yield of 80 % at an ethanol conversion of 87 % (350 oC).
Table 3. Overview of catalysts performance for 1st stage
Catalyst T (°C)
W/F (gcatalyst/mol
ethanol h)
X (%)
Ac (%)
Ac
(%) Ref.
1. Cu(II)NaY 350 80 100 80 Tsuruya et al. [45] 2. Fe2(Mo04)3 and
α-SbO4 350 - 87 91.95 80 Castillo et al. [52]
3. V2O5/Al2O3 247 - 90 85 76.5 Quaranta et al.
[53] 4. VMgO 240 199.8 94.8 90 85.32 Gomez et al. [44] 5. V2O5/TiO2-SiO2
* 160 194.6 99.6 88.3 88 Tesser et al. [36] 6. V2O5/TiO2-
SiO2**
160 97.3 81 96.9 78.5 Tesser et al. [36]
7. 0.8%Au-0.8%Cu/SiO2
250 - 80 100 80 Redina et al. [49]
8. Au/CuSiO3 250 - 98 93 91.14 Du et al. [50] 9. V/TiO2 250 - 37 73 27 Hidalgo et al. [54] 10. Cu/SiO2 190 - 5 20 100 Klein et al. [55] 11. 1%V/SBA-15 300 - 12 90 10.8 Cicmanec et al.
[43] 12. VOx/SiO2 300 - 50 90 45 Cicmanec et al.
[43] *) Investigated in presence of helium; **) Investigated in presence of water X- ethanol conversion; Ac- acetaldehyde selectivity; Ac – acetaldehyde yield.
Quaranta et al. [53] investigated the ODH of ethanol over V2O5/Al2O3 catalyst. The performances reported by authors are interesting for practical applications: acetaldehyde selectivity around 85 %, for ethanol conversion over 90 %, at 247 oC. Hidalgo et al. [54] compared the performances of eight catalysts in the ODH of ethanol: hydrotalcite (HTC), Al2O3, TiO2,SBA-15 and vanadium supported on these materials, i.e. V/HTC, V/Al2O3, V/TiO2 and V/SBA-15. Among these compounds, the most active appeared to be V/TiO2 (~ 73% selectivity at an ethanol conversion of 37 %).
Research activities were also focused to obtain metal free catalysts for ethanol oxidation to acetaldehyde. In one of these studies, Absullahi et al. [56] demonstrated that the use of mild oxygen pretreatment of single wall carbon nanotubes (SWCNT) leads to good catalytic activity for this reaction. The measured reaction rate values measured by authors, are of the same order of magnitude as those reported for VOx/MCM-41 and VOx/Al2O3 catalysts.

Recent progresses in ethanol conversion to 1,3-butadiene
15
Klein A., Keisers, Palkovits [55] compared the performances of Cu and Ag supported on silica, as catalysts for ethanol dehydrogenation. The most appropriate was found to be Cu/SiO2, due to its superior stability and higher activity (20% acetaldehyde yield with 100% selectivity, at relatively low temperatures of 190 °C). 3.2.2. The conversion of ethanol and acetaldehyde to 1,3-BD
In the two-step process, the reaction between ethanol and acetaldehyde,
representing the second step, is the most important, because its performance is directly influencing the 1,3-BD yield. Toussaint et al. [57] reported among the first extensive investigations of the conversion of ethanol - acetaldehyde mixture to 1,3-BD, testing the performances of silica supported Ta, Zr and Nb oxides in this transformation. The best results (selectivity to BD up to 67% at 27.3 % conversion) were obtained on the Ta2O5 (2 wt%)/SiO2 catalyst, working at 365 oC, ethanol/acetaldehyde molar ratio of 3 and liquid hourly space velocity of 0.58 h-1(volume of liquid feed/(catalyst volume h)). These results were confirmed by the study of Corson et al. [58]. An important research was conducted by Corson et al. [33], regarding the screening of an important number of metallic and non-metallic oxides. The authors have evidenced the superior activity of tantala-silica and zirconia-silica in the second stage of the two-step process.
In the period after 1960, in the effort to discover more performant catalysts, an important number of studies investigated the 1,3-BD synthesis from ethanol and acetaldehyde, over the same catalysts tested for the Lebedev one step process, based on the observation that the performance of the one-step technology increases by adding acetaldehyde to the ethanol feed [13,59].
One of the catalysts which are used for this transformation is tantala-promoted silica catalyst (2% Ta2O5-98% SiO2). Chae et al. [60] have synthetized tantalum oxide supported on ordered mesoporous silica (SBA-15, KIT-6 and MCM-41) and test them as catalysts for the synthesis of 1,3-BD from ethanol and acetaldehyde. The best yield was around 37 % at approx. 80 % selectivity (see Table 3). Han et al. [27] investigated the performances of ZrO2/SiO2 catalyst in the ethanol - acetaldehyde mixture transformation to 1,3-BD. The authors optimized, by experimental trials, the ZrO2 concentration, feed molar ratio, temperature and WHSV values. The best result was achieved at 320 oC, 2wt% ZrO2, ethanol/acetaldehyde molar ratio 3.5 and a WHSV of 1.8h-1. (1,3-BD selectivity 69.7% at 45.4 % total conversion).
Klein A et al. [55] synthesized different catalysts supported by a zeolite -280, having slightly modified composition, by impregnation with basic materials

Alma-Valentina Broșteanu, Ionuț Banu, Grigore Bozga
16
such as MgO and ZnO and ion exchange by alkaline and earth alkaline metals, in order to diminish its acidity. Among these catalysts, MgO\K--280 provided the highest 1,3-butadiene selectivity (72 %). However, the maximum yield of 33 % was obtained over a ZnO doped MgO\K--280 catalyst. Other catalysts used for the second stage were prepared by using different zeolites (β280 structure of β-zeolite, mesoporous LTA zeolite) as metal supports. These evidenced that by introducing mesoporosity in zeolites it is improved the catalytic activity in 1,3-butadiene synthesis from ethanol/acetaldehyde mixture [63].
Table 4. Overview of catalysts performance for 2nd stage
Catalyst T
(°C) X
(%) BD (%)
BD
(%) Ref.
1. Ta2O5/SiO2 (2wt% Ta2O5)
365 67 27.3 18.3 Toussaint et al. [57]
2. Ag/ZrO2-CeO2-SiO2 (1:10:3:500 mol)
325 44 78 34.32 Ivanova et al. [61]
3. Ta/SBA-15 350
46.9 79.8 37.43 Chae et al. [60] 4. Ta/KIT-6 38.2 78.5 29.98 Chae et al. [60] 5. Ta/MMS 40.7 77.9 31.71 Chae et al. [60] 6. ZrO2/SiO2
(2 wt% ZrO2) 320 45.4 69.7 31.64 Han et al. [27]
7. ZnO-MgO\H-β280 300 49 66 33 Klein et al. [55] 8. Nb/SiBEA
(0.7 wt% Nb) 350 42.8 55.1 23.6
Kyriienko et al. [62] 9. Nb/SiBEA
(2.0 wt% Nb) 325 22.1 70.6
15.6
10. Ta/SiBEA (3.0 wt% Ta)
350 58.9 73.1 43.1 Kyriienko et al. [62]
325 30.7 90.3 27.7
BD - 1,3-BD selectivity (2 x nr. moles C4H6/moles ethanol transformed) ; BD - 1,3-BD yield (2 x nr. moles C4H6/moles ethanol in the feed).
Kyriienko et al. [62] studied the catalytic activity of Nb supported on SiBEA zeolite (0.7 wt% and 2 wt% Nb) in the 1,3-BD synthesis form ethanol-acetaldehyde mixture. Working at 350 oC, WHSV of 0.8 h-1, feed ratio ethanol/acetaldehyde of 2.7, 4 h on-stream time, the best 1,3-BD yield reported (23.6 %) was obtained on Nb0.7SiBEA (42.8 % conversion and 55.1 % selectivity). Nevertheless, in the same operating conditions, a higher 1,3-BD selectivity was obtained over Nb2.0 SiBEA catalyst at 598 K (70.6 %), but at a much lower conversion (22.1 %). The same research group [62] reported better results for a Ta(3 wt%)/SiBEA catalyst. Working at WHSV=0.79 h-1, and feed ethanol/acetaldehyde molar ratios (EtOH/AA) between 2.2 and 3.2, on-stream

Recent progresses in ethanol conversion to 1,3-butadiene
17
time of 4 h, there were obtained 1,3-BD yields up to 43.1 % at EtOH/AA =3.2 and 1,3-BD selectivity values up to 90.3 % at EtOH/AA=2.7 (see Table 4).
4. Process Kinetics
The kinetic data are among the main elements used in the chemical reactor design. In spite of its importance, the number of published studies investigating the processes of ethanol conversion to 1,3-BD is very scarce. For the one-step process we identified only a kinetic model, published in the paper of Ezinkwo et al. [5] and polynomial correlations for the main process parameters proposed by Da Ros et al. [20]. However, for the two-step process we identified published kinetic models only for the first stage of ethanol dehydrogenation. One step process
In Table 5 are presented the main stoichiometric routes hypothesized, the rate expressions and kinetic parameters of the kinetic model proposed by Ezinkwo et al. [5] for a ZnO/γ-Al2O3 catalyst.
In the rate expressions given in Table 5 are involved are the molar percents of ethanol (X), 1,3-BD (X1), butylene (X2), ethylene (X3) and acetaldehyde (X4) and butanal (X5). The parameters appearing in the rate expressions have the values b1=500, b2=100 and b3= 550. Considering the numerical values of activation energies, these appears to be defined in J/mol (not specified in the paper). Also, in the expression of reaction rate r4, apparently it should be used X5 (instead of X3 appearing in the paper).
A thorough experimental study of the one step process was published by Da Ros et al. [20], over K2O:ZrO2:ZnO/MgO-SiO2 catalyst. Based on the experimental results the authors developed polynomial correlations defining the dependencies in respect with temperature and space velocity (WHSV), of the ethanol conversion (X) and of the selectivity of the conversion in the main products: ethylene (Sethene), diethylether (SDEE), acetaldehyde (SAcH), butylene (SButene) and 1,3-B (SBD) (see Table 6). In these polynomials conversion and selectivity values are in percent.
x1 and x2 represent the normalized values of the temperature and WHSV respectively, calculated from the relations:
c c1 2
T-T WHSV- WHSV= ; =
ΔT ΔWHSVx x (2)
Tc=350 oC; WHSVc=0.93 h-1; T=25 oC; WHSV=0

Alma-Valentina Broșteanu, Ionuț Banu, Grigore Bozga
18
Table 5 Kinetic parameters of reactions [5]
Nr. crt
Reaction Rate expression (ri) [ki in s-1]
1. 2 5 2 4 2C H OH C H H O 1
11 4
k Xr
b X ;
21060016
1 4.86 10 RTk e
2. 2 5 2 4 2C H OH C H O H 3
22 4
k Xr
b X ;
190503
3 2.30 10 RTk e
3. 2 4 2 4 4 6 2C H O C H C H H O 5 3
32
k Xr
b ;
136502
5 1.26 10 RTk e
4. 2 4 2 4 4 8C H O C H C H O 8 5
43
k Xr
b ;
130702
8 2.29 10 RTk e
5. 2 2 4 2 4 6 22C H O H C H H O 12 4
52
k Xr
b ;
68903
12 3.76 10 RTk e
6. 2 4 4 82C H C H 213 3
61 4
k Xr
b X ;
106502
13 3.06 10 RTk e
7. 4 8 4 6 2C H C H H 15 2
71 4
k Xr
b X ;
49750038
15 2.90 10 RTk e
Table 6
Polynomial correlation proposed by Da Ros et al. [20]
1 226.68 6.02 3.68X x x (3) 2
1 2 16.44 1.72 0.26 0.29 ( 14 /15)EtheneS x x x (4) 2
1 12.85 0.15 0.02 ( 12 /15)DEES x x (5)
2 1 227.47 4.30 1.65AcHS x x x (6)
2 1 253.92 3.08 0.91BDS x x x (7) 2
1 2 26.04 1.05 1.04 0.11 ( 12 /15)ButeneS x x x (8)
Two-step Process Even though the two-step process was implemented at industrial scale and
was proved as feasible, it is very poorly characterized from kinetic point of view. Practically, we identified kinetic models published in the open literature, only for the first step, that of ethanol conversion to acetaldehyde. There are only few published kinetic studies of ethanol dehydrogenation.

Recent progresses in ethanol conversion to 1,3-butadiene
19
Kinetic models for the ethanol dehydrogenation The main reaction is described by the stoichiometric equation:
3 2 2 3
( ) ( ) ( )
CH CH OH H CH CHO
A R S
(9)
Franckaerts et al. [34] investigated the kinetics of gas phase ethanol dehydrogenation over a catalyst having the composition in the unreduced state, 94 wt % CuO with 5 wt % CoO and 1 wt % Cr2O3. Another kinetic study of ethanol dehydrogenation to acetaldehyde was carried out by Peloso et al. [35], over an unsupported Cu-Cr catalyst having the composition (wt %): CuO 41.2%, Cr2O3
33.4%, SiO2.9.3%, Na2O 3.3%, binder 12.8%. The rate expressions and kinetic constants of the models proposed in the two studies are presented in Table 7.
Table 7
Kinetics for ethanol dehydrogenation [34, 35]
Franckaerst and Froment Peloso
2(1 )
SA A R
eA
A A R R S S
pk K p p
KR
K p K p K p
2(1 )
R SA
eA
A A RS S
p pk p
KR
K p K p
16310ln 16.25k
RT
7086.2ln 13.65k
T
5890ln 6.40AK
RT
636.9ln 0.251AK
T
11070ln 9.40RK
RT ,
592.7ln 1.26R SK
T
6850ln 7.18SK
RT
6189.1ln 11.82eK
T
[k]= mole h-1 gcat-1; [Ke]=bar; [Kj]=bar-1,
j=A,R,S [k]= mole h-1bar-1kgcat
-1; [Ke]=bar; [KA]=[KR,S]=bar-1
Tesser et al. [36] investigated the kinetics of ethanol ODH over a
V2O5/TiO2-SiO2 catalyst. The basic reactions considered in the kinetic model formulated by authors are given in Table 8, along with the corresponding expressions of reaction rates. The mathematical form of the reaction rate expressions was found similar to the one that is obtained from the classical Mars and van Krevelen mechanism. For the oxidation reactions, the kinetic expressions

Alma-Valentina Broșteanu, Ionuț Banu, Grigore Bozga
20
involve the rate of the active site reoxidation (koxPO21/2 ), which is the same in all
cases. For the last two reactions presented in Table 8, were adopted simpler rate expressions, considering that their contributions to the global transformation of ethanol are less important.
Table 8. Reaction rate for the considered reactions [5]
Reaction Rate expression k=Aexp(-Ea/RT) lnA(*
Ea
(kcal/mol) C2H5OH +1/2 O2 CH3CHO +H2O
2
1 1
1 1/ 2
1 11 / ( )
ox O
k Pr
k P k P
12.61 10.9
CH3CHO + ½ O2 CH3COOH
2
2 2
2 1/ 2
2 21 / ( )
ox O
k Pr
k P k P
27.04 35.2
CH3COOH + 2O2 2CO2 + 2H2O
2
3 3
3 1/ 2
3 31 / ( )
ox O
k Pr
k P k P
44.56 47.1
2 C2H5OH + CH3CHO ↔ CH3CH(OCH2CH3)2 +H2O 4 4 2
r k P 5.46 7.5
2C2H6O C2H5O-C2H5 +H2O 2
5 5 1r k P 48.64 47.0
Catalytic site reoxidation 2
1 2/ox ox Or k P 10.47 11.7
*)- The units of A are not specified by authors. Apparently, they should be selected so to obtain reaction rate units of mole/(gcat h). The working pressure is also unspecified, but seems to be the atmospheric one (1 bar).
Other kinetic studies of ethanol ODH process over different catalysts were published by Parlitz et al. [46], Tsuruya et al. [45], Tilaart et al. [64], Gomez et al. [44], Keuler and Lorenzen [65].
5. Process thermodynamics
The enthalpy variation for vapor phase ethanol conversion to butadiene (equation (1)) at 350 oC, calculated by Hess and Kirchhoff laws, with data from Reid et al. [66], is 68.05 kJ/mole. This means that the reaction is thermodynamically possible only over a minimum temperature. The thermodynamic feasibility of ethanol conversion to 1,3-BD and the most favorable temperature window have been assessed by Angelici et al. [12], by calculating the temperature dependence of Gibbs free energy variation, G, in the global reaction (1). The results, presented in figure 3 (taken from Fig. 7 of the paper of Angelici et al. [12], is evidencing that the transformation becomes

Recent progresses in ethanol conversion to 1,3-butadiene
21
spontaneous at temperatures higher than 423 K (150 oC). However, the working temperatures, depending on the catalyst performances, are generally higher due to kinetic reasons, but limited, usually by selectivity reasons. The temperature interval for the majority of published studies is between 573 and 723 K (300 - 450 oC).
The values of Gibbs free energy of the reactions involved in the transformation schemes, defining different mechanisms proposed to explain the ethanol conversion to butadiene, allow also, supplementary arguments for the most probable mechanism. Results of such calculations were published by Natta and Rigamonti [67,68], Bhattacharyya and Sanyal [10] and Angelici et al. [12].
Fig 3. The temperature dependence of Gibbs free energy variation, G, in the global reaction (1)
[12].
In the Table 9 are given the values of Gibbs free energy and enthalpy variations calculated by Bhattacharyya and Sanyal [10], for the reactions involved in the Kagan mechanism (figure. 1a). These results are evidencing that the acetaldehyde aldolic condensation (second reaction), is thermodynamically unfavorable, but can be compensated for by the subsequent dehydration reaction forming crotonaldehyde, which is highly exergonic (large negative variations of G).
Similar thermodynamic calculations of the mechanisms presented in figure
1, largely analyzed by Angelici et al. [12], evidenced that the most probable mechanism is that presented in figure 1a (Kagan mechanism). Nevertheless, it is worth to point out that some of the thermodynamic data, for the organic intermediates involved in these calculations, were obtained by estimation methods, these inducing some degree of uncertainty of analyses results.

Alma-Valentina Broșteanu, Ionuț Banu, Grigore Bozga
22
Table 9 Calculate thermodynamic data
Reactions (Gaseous phase)
ΔG(kcal/g mol) at
temperature (K)
Kp at temperature (K) 298ΔH
(kcal /
g mol)
298 653 733 298 653 733
2 5 3 21.C H OH CH CHO H - -1.1 -3 - 2.39 7.81 +12.1
3 2
3 2
2.CH CHO HCH CHO
CH CHOHCH CHO
+2.6 +12.8
+14.3 21.12 10
-55.21 10
-55.27 10
-6.0
3 2
3 2
3.CH CHOHCH CHO
CH CH CHCHO H O
+1.0 -20.9
-23.5 5.6 71.028 10
71.042 10
+9.2
3 2 5
2 2
3 2
4.CH CH CHCHO C H OH
CH CH CH CH
CH CHO H O
1.7 -7.3 -9.3 25.6 10
22.8 10 26.07 10
+9.0
3 2
2 2 2
5.CH CH CHCHO H
CH CH CH CH H O
- -5.0 -5.0 - 20.52 10
20.31 10 -4.2
6. Reactors
As known, the performances of a technology are strongly dependent on the
reactor design and operation. In spite of its practical interest, the number of published studies treating the design and operation of the catalytic reactors for ethanol conversion to butadiene is very scarce. This is probably due to the poor knowledge of catalytic process kinetics. However, the subject is addressed in the published studies considering the catalyst performances or plant operation. In the first industrialized processes, it seems that there were used fixed bed reactors, periodically submitted to catalyst regeneration, in both Ostromyslensky two step technology implemented in USA and Lebedev one step technology, practiced in USSR. Nevertheless, the information regarding the design and operation data of Lebedev technology is practically lacking. The majority of laboratory studies and catalyst developments were performed on fixed bed tubular only few being conducted in fluidized bed reactors. Considering the particularity of the chemical transformation (involving several consecutive-parallel reactions), the recommended reactor types are firstly the fluidized bed, advantageous due to the presence of back-mixing, easiness of heat supply and temperature control as well as catalyst bed refreshing [1,3].
Recent progresses in ethanol conversion to 1,3-butadiene
23
7. Conclusions
The butadiene synthesis from ethanol presents importance from both economic and environmental points of view and allows its production from renewable resources. Even if there are two technologies successfully implemented at industrial scale, based on the Lebedev one-step and Ostromyslensky two-step methods, the interest of researchers and industry for this production route is renewed, looking for new catalysts, more active and selective and more resistant to deactivation factors.
The reviewed works evidenced that the majority of published studies are focused on the ethanol conversion to 1,3-BD by the one-step process. Curiously, the best 1,3-BD yields, obtained in the laboratory scale reactors were also reported for the one-step (Lebedev) process. Apparently, the best result appears to be that of Ohnishi (1985), who reported an 87 % yield for direct ethanol conversion to 1,3-BD, over a MgO/SiO2(1:1) catalyst promoted with Na2O (0.1%) at 623 K. In spite of its maturity, the kinetics of this process is poorly known. New studies are needed for better characterization of process kinetics over the most active catalysts, including deactivation phenomenon. Also, engineering studies are necessary for optimization of reactor selection, design and operation, as well as plant structure design and product separation.
REFERENCES
[1] Makshina E., Dusselier M., Pierre J., Sels B.F, Review of Old Chemistry and New Catalytic Advances in the On-Purpose Synthesis of Butadiene, Chemical Society Reviews, 43, (2014), 7917-7953.
[2] Bhattacharyya S. K., Ganguly N. D., One-step catalytic conversion of ethanol to butadiene in the fixed bed. I. Single-oxide catalysts, Journal of Applied Chemistry, 12, (1962-a), 97-104.
[3] Bhattacharyya S. K., Avasthi B.N., One-step catalytic conversion of ethanol to butadiene in a fluidized bed, Industrial & Engineering Chemistry Process Design and Development, 2, (1963), 45-51.
[4] Shylesh S., Gokhale A. A., Scown C. D. et al., From Sugars to Wheels: The Conversion of Ethanol to 1,3-Butadiene over Metal-Promoted Magnesia-Silicate Catalysts, ChemSusChem, 9, (2016), 1462-1472.
[5] Ezinkwo G.O., Tretjakov V. F., Talyshinky R.M. et al., Creation of a continuous process for bio-ethanol to butadiene conversion via the use of a process initiator, CatalysisComunications, 43,(2013), 207-212.
[6] AECOM , Efficient Costs of New Entrant Ethanol Producers, Dec. (2016) (https://www.ipart.nsw.gov.au/files/sharedassets/website/shared-files/pricing-reviews-section-12a-publications-review-of-a-maximum-price-for-wholesale-ethanol/consultant-report-aecom-efficient-costs-of-new-entrant-ethanol-producers.pdf)
Alma-Valentina Broșteanu, Ionuț Banu, Grigore Bozga
24
[7] Burla J., Fehnel R., Terpeluk Ph. L.P.,Two-Step production of 1,3-Butadiene from ethanol, https://pdfs.semanticscholar.org/ef33/bbd6e284451e5d847b4c59e3136413bbab03.pdf accessed at 14.11.2017
[8] Jones M.D, Catalytic transformation of ethanol into 1,3-butadiene, Chemistry Central Journal,53 (2014), 8-53.
[9] Niiyama H., Morii S., Echigoya E., Butadiene Formation from Ethanol over Silica_magnesia Catalysts, Bulletin of the chemical Society of Japan, 45 (1972), 655-659.
[10] Bhattacharyya S. K., Sanyal S.K.., Kinetic study on the mechanism of the catalytic conversion of ethanol to butadiene, Journal of Catalysis, 7, (1967), 152-158.
[11]Natta G., Rigamonti R., Sintesi del butadiene da alcool etilico., Considerazioni termodinamiche e comportamento specifico dei catalizzatori, La Chimica e l’Industria, 29, 1947a,195-200.
[12] Angelici C., Weckhuysen B.M., Bruijinincx C.A., Chemocatalytic Conversion of Ethanol into Butadiene and Other Bulk Chemicals, ChemSusChem, 6, (2013), 1595-1614.
[13] Kvisle S., Aguero A., Sneeden R.P.A, Transformation of Ethanol into 1,3-Butadiene over Magnesium Oxide/Silica Catalysts, Applied Catalysis, 43, (1988), 117-131.
[14] Pomalaza G., Capron M., Ordomsky V., Dumeignil F., Recent Brekthroughs in the Conversion of Ethanol to Butadiene, Catalysts, 6, (2016),203-238.
[15] Da Ros S., Jones M.D., Mattia D. et al., Microkinetic analysis of ethanol to 1,3-butadiene reactions over MgO-SiO2 catalysts based on characterization of experimental fluctuations, Chemical Engineering Journal, 308, (2016), 988-1000.
[16] Taifan W.E., Bucko T., Baltrusaitis J., Catalytic conversion of ethanol to 1,3-butadiene on MgO: A comprehensive mechanism elucidation using DFT calculations, Journal of Catalysis, 346, (2017), 78-91.
[17] Ohnishi R., Akimoto T., Tanabeb K., Pronounced Catalytic Activity and Selectivity of MgO-SiO2-Na2O for Synthesis of Buta-1,3-diene from Ethanol , Journal of the Chemical Society, Chemical Communications, (1985), 1613-1614.
[18] Makshina E.V., Janssens W., Sels B.F., Jacobs P.A., Catalytic study of the conversion of ethanol into 1,3-butadiene, Catalysis Today, 198, (2012), 338-344.
[19] Ezinkwo G.O., Tretyakov V. F.., Aliyu A., Fundamental Issues of Catalytic Conversion of Bio-Ethanol into Butadiene, ChemBioEng, 1, (2014), 194-203.
[20] Da Ros S., Jones M.D., Mattia D., Modelling the effects of reaction temperature and flow rate on the conversion of ethanol to 1,3-butadiene, Applied Catalysis A:General, 530, (2016), 37-47.
[21] Sushkevich V.L., Ivanova I.I, Taarningc E., Ethanol conversion into butadiene over Zr-containing molecular sieves doped with silver, Green Chemistry, 17, (2015), 36-49.
[22] Patil P.T, Liu D., Liu Y, et al., Improving 1,3-butadiene yield by Cs promotion in ethanol conversion, Elsevier, 543, (2017), 67-74.
[23] Bhattacharyya S. K., Ganguly N. D., One-step catalytic conversion of ethanol to butadiene in the fixed bed II. Binary and ternary-oxide catalysts, Journal of Applied Chemistry, 12, (1962-b), 105-110.
[24] Ordomskiy V. V., Sushkevich V. L., Ivanova I. I., One-step method for butadiene production, US20130123554 (2013).
[25] Janssens W., Makshina E. V., Vanelderen P. et al., Ternary Ag/MgO-SiO2 Catalysts for the Coversion of Ethanol into Butadiene, ChemSus Chem, 1, (2014).
[26] Angelici C., Velthoen M. E. Z., Weckhuysen B. M., et al., Effect of Preparation Method and CuO Promotion in the Conversion of Ethanol into 1,3-Butadiene over SiO2–MgO Catalysts, ChemSusChem, 7, (2014), 2505-2515.
Recent progresses in ethanol conversion to 1,3-butadiene
25
[27] Han Z.,Li X.,Zhang M.,Liu Z.,Gao M., Sol-gel synthesis of ZrO2-SiO2 catalysts for the transformation of bioethanol and acetaldehyde into 1,3-butadiene, RSC Advances, 5, (2015), 103982-103988
[28] De Baerdemaeker T, Feyen M, Mueller U. et al., Bimetallic Zn and Hf on silica catalysts for the conversion of ethanol to 1,3-butadiene, ACS Catalysis, 5, (2015), 3393-3397.
[29] Sekiguchi Y., Akiyama S., Urakawa W. et al., One-step cataytic conversion of ethanol into 1,3-butadiene using zinc-containing talc , Catalysis Communication, 68, (2015), 20-24.
[30] Baylon R. A.L., Sun J., Wang Y., Conversion of ethanol 1,3-butadiene over Na doped ZnxZryOz mixed metal oxides, Catalysis Today, 259, (2016), 446-452.
[31] Kyriienko P. I., Larina O.V., Soloviev S. O. et al., High selectivity of TaSiBEA zeolite catalysts in 1,3-butadiene production from ethanol and acetaldehyde mixture, Catalysis Communications, 77, (2016) 123-126.
[32] Kyriienko P.I., Larina O.V., Soloviev O.S. et al., Ethanol Conversion into 1,3-Butadiene by Lebedev Method over MTaSiBEA Zeolites (M= Ag, Cu, Zn), ACS Sustainable Chemistry Engineering, 5, (2017),2075-2083.
[33] Corson B.B, Jones H.E, Welling C.E, et al., Butadiene from ethyl alcohol, catalysis in the one-and two-step processes, Industrial and engineering Chemistry,42 (1950), 359-373.
[34] Frankaerst J. and Froment G.F, Kinetic study of the dehydrogenation of ethanol, Chemical Engineering Science, 19, (1964), 807-818.
[35] Peloso A., Moresi M., Mustachi C., Sorraco B., Kinetic of the Dehydrogenation of Ethanol to Acetaldehyde on Unsupported Catalysts, The Canadian Journal of Chemical Engineering, 57, (1979), 178-185.
[36] Tesser R., Maradei V., Di Serio M., Santacesaria E., Kinetics of the Oxidative Dehydrogenation of Ethanol to Acetaldehyde on V2O5/TiO2-SiO2 Catalysts Prepared by Grafting, Industrial & Engineering Chemistry Research, 43, (2004), 1623-1633.
[37] Morales M.V., Asedegbega-Nieto E., Bachiller-Baeza B., et al., Bioethanol dehydrogenation over copper supported on functionalized grapheme materials and a high surface are graphite, Carbon, 102, (2016), 426-436.
[38] Chang F.W., Yang H.C., Roselin L.S., Kuo W.Y., Ethanol dehydrogenation over copper catalysts on rice husk ash prepared by ion exchange, Appied Catalysis A, 304, (2006), 30-39.
[39] Quaranta N.E., Cortes Corberan V., Fierro J.L.G., High Performance of Vanadia Catalysts Supported on TiO2 coated Silica for Selective Oxidation of Ethanol, Studies in Surface Science and Catalysis, 72, (1992), 147-154.
[40] Quaranta N. E., Soria, J., Cortes Corberan V., Fierro J. L. G., Selective Oxidation of Ethanol to Acetaldehyde on V2O5/TiO2/SiO2 catalysts, Journal of Catalysis, 171, (1997), 1-13.
[41] Santacesaria E., Sorrentino A., Tesser R., Di Serio M., Ruggiero A., Oxidative dehydrogenation of ethanol on V2O5/TiO2-SiO2 catalysts obtained by grafting vanadium and titanium alkoxides on silica, Journal of Molecular Catalysis A: Chemical, 204-205, (2003), 617-627.
[42] Cozzolino M., Tesser R., Serio M. Di. Et al., Methanol and Ethanol Oxidative Dehydrogenation (ODH) to the corresponding aldehydes on vanadium-based catalysts, DGMK-Conference “Oxidation and Functionalization:Classical and Alternative Routes and Sources“, Milan, (2005).
[43] Cicmanec P., Raabova K., Hidalgo J.M. et al., Conversion of ethanol to acetaldehyde over VOX-SiO2 catalysts: the effects of support texture and vanadium speciation, Reaction Kinetics, Mechanisms and Catalysis, 121, (2017), 353-369.
[44] Gomez M. F., Arrua L. A., Abello M. C., Kinetic Study of Partial Oxidation of Ethanol over VMgO Catalyst, Industrial and Engineering Chemistry Research, 36, (1997), 3468-3472.
[45] Tsuruya, S., Tsukamoto, M., Watanabe, M., Masai, M., Ethanol oxidation over Y-type zeolite ion-exchanged with copper(II) and cobalt(II) ions, Journal of Catalysis, 93, (1985), 303-311.

Alma-Valentina Broșteanu, Ionuț Banu, Grigore Bozga
26
[46] Parlitz B., Hanke W., Fricke R., Richter M., Roost U., Ohlmann G., Studies on catalytically active surface compounds. XV. The catalytic oxidation of ethanol on Cr/SiO2 catalysts and some relations to the structure. Journal of Catalysis, 94, (1985), 24-36.
[47] Guan Y., Hensen E. J.M., Selective oxidation of ethanol to acetaldehyde by Au-Ir catalysts, Journal of Catalysis, 305, (2013), 135–145.
[48] Sun D., Arai S., Duan H., Yamada Y., Sato S., Vapor-phase dehydration of C4 unsaturated alcohols to 1,3-butadiene, Applied Catalysis A:General, 531, (2017), 21-28.
[49] Redina E. A., Greish A., Mishin I.V. et al., Selective oxidation of ethanol to acetaldehyde over Au–Cu catalysts prepared by a redox method, Catalysis Today, 241, (2015), 246–254.
[50] Du X., Fu N., Zhang S., Chen C.,Wang D., Li Y., Au/CuSiO3 nanotubes: High-performance robust catalysts for selective oxidation of ethanol to acetaldehyde, Nano Research, 9(9), (2016), 2681–2686.
[51] Gong J., Buddie Mullins C., Selective Oxidation of Ethanol to Acetaldehyde on Gold, Journal of the American Chemical Society, 130 (49), (2008), 16458–16459.
[52] Castillo R., Awasarkar P. A., Papadopoulou Ch., Acosta D., Ruiz P., Creation of new selective sites by spillover oxygen in the oxidation of ethanol, in Cortes Corberan V., Vic Bellon S. (Editors), New Developments in Selective Oxidation II, , Proc. of II World Congress & IV European Workshop Meeting, Benalmadena,, Elsevier Science, (1994), 795-802..
[53] Quaranta, N. E., Martino R., Gambaro L., Thomas H., Selective Dehydrogenation of Ethanol over Vanadium Oxide Catalyst, in Cortes Corberan V., Vic Bellon S. (Editors), New Developments in Selective Oxidation II, , Proc. of II World Congress & IV European Workshop Meeting, Benalmadena,, Elsevier Science, (1994), 811-818.
[54] Hidalgo J.M., Tisler Z., Kubicka D., Raabova K., Bulanek R., (V)/Hydrotalcite, (V)/Al2O3, (V)/TiO2 and (V)/SBA-15 catalysts for the partial oxidation of ethanol to acetaldehyde, Journal of Molecular Catalysis A: Chemical, 420,(2016), 178–189.
[55] Klein A., Keisers K., Palkovits R., Formation of 1,3-butadiene from ethanol in a two-step process using modified zeolite- catalysts, Applied Catalysis A: General, 514, (2016),192–202.
[56] Abdullahi I., Davis T. J., Yun D.M., Herrera J.E., Partial oxidation of ethanol to acetaldehyde over surface-modified single-walled carbon nanotubes, Applied Catalysis A: General, 469, (2014), 8-17.
[57] Toussaint W.J., Dunn J.T., Jackson D.R., Production of Butadiene from Alcohol, Industrial and Engineering Chemistry, 39, (1947), 120-125.
[58] Corson B. B., Stahey E. E., Jones H. E. et al., Butadiene from ethyl alcohol, Industrial & Engineering Chemistry, 41, (1949), 1012-1017.
[59] Niiyama H., Morii S., Echigoya E., Butadiene Formation from Ethanol over Silica_magnesia Catalysts, Bulletin of the chemical Society of Japan, 45, (1972), 655-659.
[60] Chae H.J. Kim T.W, Moon Y.K. et al., Butadiene production from bioethanol and acetaldehyde over tantalum oxide-supported ordered mesoporous silica catalysts, Applied Catalysis B:Enviromental, 150-151, (2014), 596-604.
[61] Ivanova I. I., Sushkevich V. L., Ordomskiy V. V., One-step method for butadiene production, WO Patent 2012015340-A1, (2012).
[62] Kyriienko P.I., Larina O.V., Popovich N.O., Soloviev S.O., Millot Y., Dzwigaj S., Effect of the niobium state on the properties of NbSiBEA as bifunctional catalysts for gas- and liquid-phase tandem processes, Journal of Molecular Catalysis A: Chemical, 424, (2016_a), 27–36.
[63] Klein A., Palkovits R., Influence of structural parameters on the conversion of ethanol into 1,3-butadiene using mesoporous zeolits, Catalysis Communications, 91, (2017), 72-75.

Recent progresses in ethanol conversion to 1,3-butadiene
27
[64] Tillaart van den J. A. A., Kuster B. F. M., Marin G. B. M. M., Oxidative dehydrogenation of aqueous ethanol on a carbon supported platinum catalyst, Applied Catalysis A, General, 120(1), (1994), 127-145.
[65] Keuler J. N., Lorenzen L., Comparing and Modeling the Dehydrogenation of Ethanol in a Plug-Flow Reactor and a Pd-Ag Membrane Reactor, Industrial & Engineering Chemistry Research, 41, (2002), 1960-1966.
[66] Reid R., Prausnitz J., Poling B., The Properties of Gases & Liquids, 4 ed., McGraw Hill, (1987), 667-671.
[67] Natta G., Rigamonti R., Sintesi del butadiene da alcool etilico. Considerazioni termodinamiche e comportamento specifico dei catalizzatori, La Chimica e l’Industria, 29, (1947a),195-200.
[68] Natta G., Rigamonti R., Studio roentgenografico e chimico dei catalizzatori usati per la produzione del butadiene dall.alcool, La Chimica e l’Industria, 29, (1947b),239-243.

Bulletin of Romanian Chemical Engineering Society, Vol 5, No. 1, 2018 ISSN 2360-4697
28
DESIGN AND PLANTWIDE CONTROL OF DI-n BUTYL ETHER (DNBE) PRODUCTION PROCESS
Diana Maria MATEI, Costin Sorin BÎLDEA1
University Politehnica of Bucharest, Department of Chemical and Biochemical Engineering, 1-7 Polizu street, 011061, Bucharest, Romania
Abstract The aim of this paper is to present a process and control system design for di-n-butyl ether
(DNBE) process, obtained by the etherification reaction of two molecules of butanol. The dehydration of 1-butanol to yield DNBE is catalyzed by thermally stable resins, such as Amberlyst-70 which has high activity and selectivity at temperatures up to 190°C. In this purpose, a process was investigated for a plant capacity of 37.8 ktpy: a reaction-separation-recycle (R-S-R). The static performance of the plant was studied in Aspen Plus and the controllability was assessed by dynamic simulation performed in Aspen Dynamics for different perturbations. Also, economic considerations were performed in Aspen Economics.
Key words: DNBE, Second generation biofuels, Biofuels, Reaction-Separation-Recycle system, Plantwide Control
1. Introduction
Petroleum is an essential source for the production of fuels used in internal engines. During the last twenty years European regulations have become increasingly stringent in terms of emissions standards [1], quality of fuels [2] and the mandatory use of biofuels, setting a 10% minimum target for the share of biofuels in transport petrol and diesel consumption by 2020 [3].
Concerning Diesel quality and vehicles emissions, environmental regulations imposed over the past decades led to an active search for cleaner and more efficient fuels [4]. A valuable alternative to meet the requirements mentioned above without modification of existing diesel engines is to include of oxygenates to diesel reformulation. An important number of different oxygenates (various alcohols, esters and ethers) have been considered as Diesel fuel components [4]. Among them, DNBE (di-n-butyl ether) is an important candidate, mainly because it can be produced, via bio-butanol, from regenerable raw
1 Corresponding author, Email address: [email protected]

Design and plantwide control of di-n Butyl Ether (DNBE) production process
29
materials such as ligno-cellulosic biomass, energy crops, forest refuse or residue from agriculture, [4, 5].
DNBE has a high cetane number (100), moderate boiling point (415.6 K) and volumetric energy comparable to that of petroleum fuels [4]. Therefore, DNBE provides satisfactory engine power without modification of existing diesel engines. [6]
DNBE can be obtained by the etherification reaction of butanol, using various acid catalysts. The literature reports the feasibility of this reaction at laboratory scale [4, 5]. However, studies concerning the feasibility of an industrial scale process are missing. The goal of this paper is to partially fill this gap.
2. Process description and simulation results
The unit design was performed having as a base the “Onion diagram” for chemical processes. The diagram consists of five parts: Reaction, Separation, Recycle, Heat Recovery and Utilities.
DNBE is obtained through bimolecular dehydration of 1-butanol over AMBERLYST 70. The reaction of dehydration of 1-butanol is only slightly exothermic and it can be performed in an adiabatic plug-flow reactor. Because the reaction is equilibrium limited, it not possible to have complete reactant conversion unless a Reaction-Separation-Recycle process is used, as illustrated by the flowsheet presented in Figure 1.
Fig. 1. Heat integrated process flowsheet of DNBE plant

Diana Maria Matei, Costin Sorin Bîldea
30
After the reaction is performed, the effluent of the reactor is sent to the first distillation column (COL-1). This column has the role of removing water from the mix 1-butanol – water – DNBE. The vapor distillate of COL-1 is condensed and sent to a liquid-liquid separation. After the separation, the stream containing 1-butanol and water is flashed in V-2 flash vessel, while the organic phase is sent as reflux to the distillation column. The products resulted from the flash process are Water and Butanol-Water mixture. The Water stream is a final product which should be treated in a special unit for removing the organic impurities, and the remaining Butanol-Water mixture is recycled. The bottom product of COL-1 is a mixture of DNBE and 1-butanol which is sent to a second distillation column, COL-2. This has the role of obtaining the pure product DNBE in the bottom of the column. Reaction section
The etherification process of n-butanol was often reported to be catalyzed by H-Beta, Nafion NR50 and AMBERLYST 70 [4, 5].
Considering that AMBERLYST 70 is used as a catalyst, the reaction kinetics can be well described by the LHHW mechanism, leading to the following kinetic equation [6]:
2 2 2
1
22 1
DNBE H OBuOH BuOH
eq
w H On
DNBEBuOH DNBE
BuOH
KK
r k KK
K
(1)
1 1exp A
ref
Ek A
R T T
(2)
1 1exp j j
jref
S HK
R R T T
(3)
37exp 3.2eqK
T
(4)
1 1expDNBE A
BuOH ref
K EA
K R T T
(5)
1 2
1 1expW w w
ref
K K KT T
(6)

Design and plantwide control of di-n Butyl Ether (DNBE) production process
31
where: = Freundlich constant;
j = activity of compound j;
BuOH = butanol; DNBE = di-n-buthyl ether;
AE = activation energy;
k = forward rate constant of DNBE formation reaction;
eqK = equilibrium constant of DNBE formation reaction;
k = rate constant;
jK =adsorption equilibrium constant of species j;
wK = water correction factor;
1wK = first parameter of the water correction factor;
2wK = second parameter of the water correction factor;
n= number of additional active sites participating in the surface reaction;
jH =adsorption enthalpy of species j;
jS = adsorption entropy of species j;
R= Ideal gas constant.
The kinetic parameters are presented in Table 1, where n is the number of additional active sites 0, 1 or 2 that participate in the surface reaction [4]. In this work the values of parameters used were considered the ones presented in Table 1 for n = 0.
Table 1 Modified kinetic models for surface reaction assuming negligible the amount of free active
sites and the adsorption of Water [6]
n 0 1 2
A 25.4±1.1 24.9±1.0 24.7±1.0 EA (kJ/mol) 121.7±1.8 122.2±1.9 122.6±2.0
SDNBE - SBuOH (J/mol/K) -9.6±1.7 -7.2±0.9 -6.3±0.7
DNBE - HBuOH , (kJ/mol) 61.2±12.9 42.6±7.5 36.1±5.4
Kw1 -0.08±0.03 -0.20±0.03 -0.29±0.02 Kw2 73.3±180.4 233.1±184.6 364.2±178.6 Kα 563.2±42.4 499.4±31.5 471.8±26.2
Due to the fact that in reactor’s feed the composition includes water, the
single phase (liquid) is hard to be maintained at a low pressure. In order to assure the liquid phase through all length of the reactor, the pressure of 15 bar is chosen.

Diana Maria Matei, Costin Sorin Bîldea
32
The choice was made based on multiple running in Aspen Plus® V10. Data specification for R-1 is presented in Table 2.
Table 2 Design specification of reactor R1
Inlet temperature, °C 180 Pressure, bar 15 Cross sectional flow area, m2 0.125 Length, m 6
Separation section
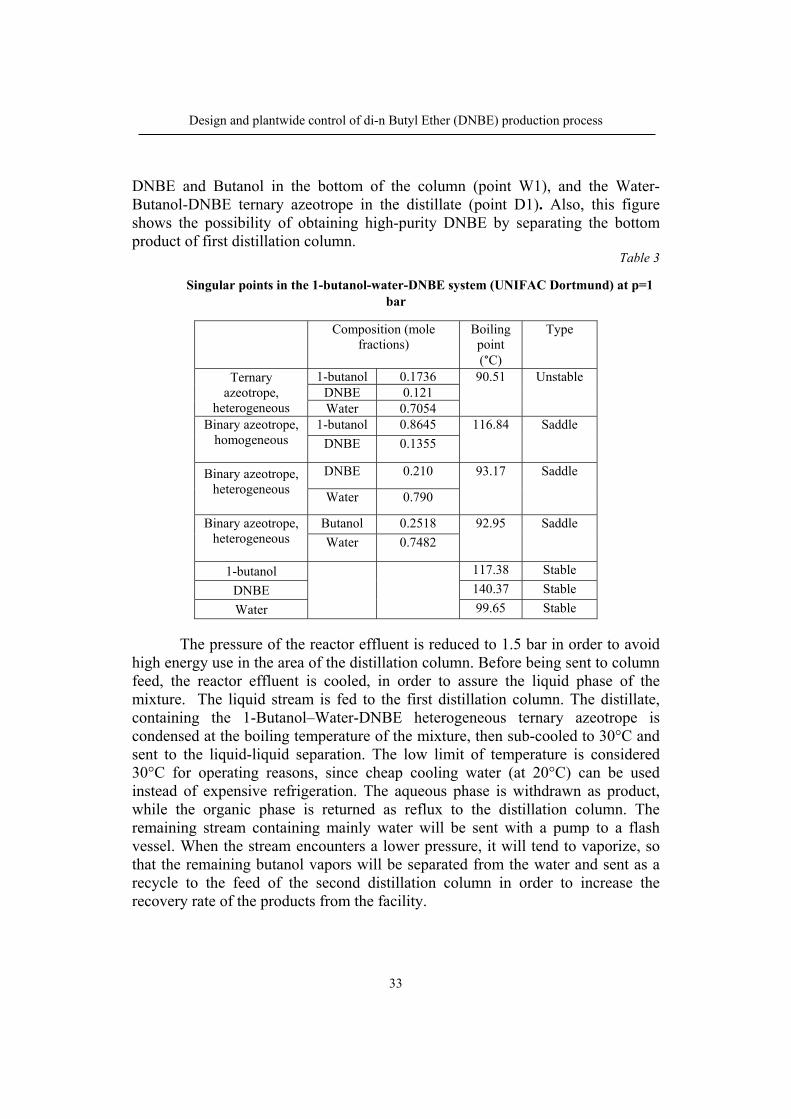
In order to design the separation section, phase equilibria of the reactor effluent (1-butanol – DNBE - Water) was analyzed. The ternary diagram for the system at 1 bar is presented in Figure 2. It can be seen that the system presents several azeotropes. The temperatures and compositions of all azeotrope mixtures are presented in Table 3, together with the boiling points of pure components.
Fig. 2. Ternary diagram for the mixture Butanol-Water-DNBE (1bar) Figure 2 shows that typical reactor effluent composition (point F1) is
placed in the lower-left distillation region. The pattern of RCM reveals the possibility to separate, in a first distillation column a mixture composed from
Design and plantwide control of di-n Butyl Ether (DNBE) production process
33
DNBE and Butanol in the bottom of the column (point W1), and the Water-Butanol-DNBE ternary azeotrope in the distillate (point D1). Also, this figure shows the possibility of obtaining high-purity DNBE by separating the bottom product of first distillation column.
Table 3
Singular points in the 1-butanol-water-DNBE system (UNIFAC Dortmund) at p=1 bar
Composition (mole fractions)
Boiling point (°C)
Type
Ternary azeotrope,
heterogeneous
1-butanol 0.1736 90.51 Unstable DNBE 0.121 Water 0.7054
Binary azeotrope, homogeneous
1-butanol 0.8645 116.84 Saddle
DNBE 0.1355
Binary azeotrope, heterogeneous
DNBE 0.210 93.17 Saddle
Water 0.790
Binary azeotrope, heterogeneous
Butanol 0.2518 92.95 Saddle
Water 0.7482
1-butanol 117.38 Stable
DNBE 140.37 Stable
Water 99.65 Stable
The pressure of the reactor effluent is reduced to 1.5 bar in order to avoid
high energy use in the area of the distillation column. Before being sent to column feed, the reactor effluent is cooled, in order to assure the liquid phase of the mixture. The liquid stream is fed to the first distillation column. The distillate, containing the 1-Butanol–Water-DNBE heterogeneous ternary azeotrope is condensed at the boiling temperature of the mixture, then sub-cooled to 30°C and sent to the liquid-liquid separation. The low limit of temperature is considered 30°C for operating reasons, since cheap cooling water (at 20°C) can be used instead of expensive refrigeration. The aqueous phase is withdrawn as product, while the organic phase is returned as reflux to the distillation column. The remaining stream containing mainly water will be sent with a pump to a flash vessel. When the stream encounters a lower pressure, it will tend to vaporize, so that the remaining butanol vapors will be separated from the water and sent as a recycle to the feed of the second distillation column in order to increase the recovery rate of the products from the facility.

Diana Maria Matei, Costin Sorin Bîldea
34
The performance of the columns is presented figures 3-4 via compositions profiles for vapors and liquid phase on each stage.
Fig. 3. Vapor (left) and Liquid (right) composition profiles in Col-1
Fig. 4. Vapor (left) and liquid (right) composition profiles in Col-2 The geometries for each column can be observed in Table 4.
Table 4 Design specification of distillation columns COL-1, COL-2
COL-1 COL-2 Number of trays 25 28Feed tray 12 20Reflux rate, kmol/h 142.1 260.9Distilate:Feed Ratio 0.45 0.8Diameter, m 2 2.43Reboiler duty, kW 2198 3815Condenser duty, kW 2283.4 3849
Recycle Usually, a recycle has a major impact on the overall savings, both in terms
of product and energy recovery, and in terms of maintaining system stability. In our case, two recycle were considered: the first column distillate mixture

Design and plantwide control of di-n Butyl Ether (DNBE) production process
35
consisting of Butanol and Water and the second column distillate, unreacted butanol.
3. Process dynamics and control
In order to set the plant throughput, a flow controller fixes the flow rate of fresh 1-butanol (stream 1, Figure 5). Consequently, stream 3 (the mix of recycled and fresh butanol) is used to control the level in the buffer vessel MIX-1.
The next equipment is H-2 preheater, whose duty should be manipulated in order to maintain the inlet temperature of 180°C in the R-1 reactor.
Generally, control design of a distillation column includes control on sump level, pressure and a temperature on the stripping section by means of bottoms flow, vapor distillate flow and reboiler duty. It is important to mention that these control structures (i.e. the pairing of the controlled and manipulated variables) are standard and widely used in industry [8].
Fig. 5. Process schematic and dynamic control of DNBE proposed R-S-R process
To have a better picture of the dynamic of the proposed process, a dynamic simulation was built in Aspen Plus Dynamics®. Before switching simulation performed in Aspen Plus to Aspen Plus Dynamics®, the size of the vessels should be provided. Thus, a residence time of 10 minutes was considered, value which is in line with the rules of thumb accepted industrially (5-20 min) and mentioned in numerous references [7]. The controllers were chosen to be PI [8]. To set the reset time of the pressure and temperature control loops, a first order open-loop model was assumed and the reset time of the PI controllers was chosen

Diana Maria Matei, Costin Sorin Bîldea
36
equal with the estimated process time constant (20 min). For the level controls, due to the fact that tight control is not important, the reset time was chosen to be 60 min,. The concentration controller on the product stream was tuned by finding the ultimate gain and period of oscillations by the ATV method, followed by Cohen-Coon settings. This more elaborate tuning method is necessary due to significant delays introduced by the concentration measurement. Details about the control loops and controller tuning are presented in Table 5.
Table 5
Controller tuning parameters for the plant wide control of a DNBE plant (R-S-R)
Controller PV, value & range OP, value & range KC, %/%
Ti, min
COL-1 PC Pressure=1 bar
0…2 bar Vapor distillate=149.9 kmol/h 0…290 kmol/h
20 12
TC Stage 12 temperature=114.3 100…140°C
Reboiler duty=2.06 MMkcal/h 0…3.92 MMkcal/hr
1 20
LC Level organic phase=0.58m 0….1.25m
Reflux=7860 kg/hr 0….15026 kg/h
10 60
LC Level aqueous phase=0.625m 0…1.25m
Water product=737.4 kg/h 0….1502.6 kg/h
10 60
LC Level sump=1.675m 0…3.35m
Bottoms product=18444.5 kg/h 0…32849 kg/h
10 60
COL-2 PC Pressure=1bar
0...2bar Condenser duty=-3.53MMkcal/h -6.61…0 MMkcal/h
20 12
LC Level distillate=1.5 m 0…3 m
Distillate flowrate=13909.4 kg/h 0…23774 kg/h
10 60
TC Distillate temperature=117.87°C 100…140°C
Reflux flowrate=15741 kg/h 0…31483 kg/h
1 20
CC BOH Impurities in DNBE=2000ppm 0…4000ppm
Set point temperature to next TC=123.05°C 100…140°C
0.0197 6.7
TC Bottoms product temperature=123.05°C 100…140°C
Reboiler’s duty=3.49 MMkcal/h
1 20
LC Sump level=2.25m 0…4.5m
Bottoms product=4535kg/h 0…9075kg/h
10 60
The simulation starts from steady state. At time t=2h, the plant inlet flow
rate is increased by 10%, from 70 kmol/h to 77 kmol/h. As more reactant is fed to the plant, the production rate increases from 34 kmol/h to 37.8 kmol/h in about 8

Design and plantwide control of di-n Butyl Ether (DNBE) production process
37
hours. The purities of DNBE and water products remain practically unchanged as it can be seen from Figures 6 - 8. This perturbation led to several changes over the entire plant, for example: with increasing molar feed flow, DNBE production has increased; energy consumption on heaters and coolers, including reboilers and condensers, have undergone changes and recirculated quantities have increased. The most noticeable changes were observed in the E5 reboiler (duty varies from 3.4 up to 6 Gcal/h) and the C2 condenser (duty varies from -3.5 up to -6 Gkcal/h). A similar variation was noticed when the second perturbation was applied: the decreasing of plant throughput by 10%.
Fig. 6. Dynamic results for DNBE final product in terms of mass fraction, molar fraction and mass flow for a disturbance of +10% in plant’s throughput (left) and for -10% (right)
Fig. 7. Dynamic results for DNBE and Water in terms of molar flow for a disturbance of
+10% in plant’s throughput (left) and for -10% (right)
Fig. 8. Dynamic results for Water product in terms of mass fraction, molar fraction and mass flow for a disturbance of +10% in plant’s throughput (left) and for -10% (right)

Diana Maria Matei, Costin Sorin Bîldea
38
3. Economic Evaluation
The economic evaluation was performed with Aspen Plus Economics® V10. The results are presented in Table 6.
Table 6 Economic evaluation of the proposed R-S-R process plant, Aspen Plus Economics
Total Capital Cost [USD] 6,790,590
Total Operating Cost [USD/Year] 3,797,320
Total Utilities Cost [USD/Year] 2,261,130
Desired Rate of Return [Percent/'Year] 20
P.O. Period [Year] 3
Equipment Cost [USD] 827,200
Total Installed Cost [USD] 2,302,400
4. Conclusions
In this work, a conventional Reaction – Separation - Recycle process for di-n-butyl ether production was investigated. Simulations in Aspen Plus® were performed both in static and dynamic mode. The process involves conventional equipment. It shows attractive economic indicator and is easily controllable.
REFERENCES
[1] Regulation (EC) No 715/2007 of the European Parliament and of the Council. [2] Directive 2009/30/EC of the European Parliament and of the Council. [3] Directive 2009/29/EC of the European Parliament and of the Council. [4] Pérez-Maciá, M.A., R. Bringué, M. Iborra, J. Tejero, and F. Cunill, Kinetic study of
dehydration of 1-butanol to di-n-butyl ether over Amberlyst 70, AiChE Journal, 60, (2016), 180-194.
[5] Pérez-Maciá, M.A., R. Bringué, M. Iborra, J. Tejero, and F. Cunill. Thermodynamic equilibrium for the dehydration of 1-butanol to di-n-butyl ether, Chemical Engineering Research and Design, 102, (2015), 186-195.
[6] Kerschgens B., L Cai L., Pitsch H., Heuser B., Pischininger S., Di-n-buthylether, n-octanol and n-octane as fuel candidates dor diesel engine combustion, Combustion and Flame, 163, (2016), 66-78.
[7] Bildea C.S., Gyorgy R., Sanchez-Ramirez E., Quiroz-Ramirez J. J., Segovia-Hernandez J.G., Kiss A.A., Optimal design and plantwide control of novel processes for di-n-penthyl ether production, J Chem Technol Biotechnol, 90, (2015), 992-1001.
[8] Chen D., Seborg D.E., PI/PID Controller Design Based on Direct Synthesis and Disturbance Rejection, Ind. Eng. Chem. Res., 41, (2002), 4807-4822.

Bulletin of Romanian Chemical Engineering Society, Vol 5, No. 1, 2018 ISSN 2360-4697
39
MODELLING AND SIMULATION OF CARBON MONOXIDE OXIDATION REACTOR AT LOW TEMPERATURE
Maria HARJA1, Lăcrămiara RUSU2, Gabriela CIOBANU1
1 “Gheorghe Asachi” Technical University of Iasi, Faculty of Chemical Engineering and Environmental Protection, Bd. D. Mangeron 73, Iasi, Romania
2 ”Vasile Alecsandri” University, Faculty of Engineering, CTPA, Calea Marasesti 157, Bacau, Romania
Abstract The objective of this investigation is a better understanding of oxidation processes in a
catalytic reactor. The plug flow model (MRDT) and two-parameter bidimensional dispersion model (MDB) was tested for establish the best model. The transient operation of catalytic reactor was simulated using a two-dimensional model, which allowed to systematically evaluating the effects of flow distributions, and of radially varying catalytic activity profiles on reactor performance. Considering the plug flow model, simulation data demonstrated that the temperatures and conversion increase with increase of reactor length. In the case of two-parameter bidimensional dispersion model the conversion isn’t affected by reactor radius, which varied significantly with length of reactor. The obtained results from MRDT simulation model are strongly different from real values so that these cannot be used both for designing and for reactor run analysis. The presented results demonstrate that two-parameter bidimensional dispersion model must be considered in comprehensive carbon monoxide oxidation reactor at low temperature.
Keywords: carbon monoxide, plug flow model, bidimensional model,
1. Introduction
The mathematical modelling of heterogenic chemical reactors is an important stage, in design, optimisation, and in operation both on the scientific and rigorously base. For catalyst reactors (fix-bed), two types of models can be established: pseudo-homogeneous and heterogeneous. In the first case the fixed bed of catalyst may be considered as a single-phase [1-2]. Therefore, the balance equations may be written relative to an infinitesimal element of volume, considering only single phase [3, 4]. In the heterogeneous models, it should take into account different concentration in the fluid and in the catalyst bed. In this
Corresponding author: E-mail address: [email protected]

Maria Harja, Lăcrămiara Rusu, Gabriela Ciobanu
40
case the balance equations should be separately written for each distinctive phase [5-8]. In the case of rate controlling reaction step, the internal and external mass and heat transfer processes occur at high rates, so pseudo-homogeneous models perfectly characterise the phenomena from real reactors: concentrations and temperatures have the same values both in the fluid phase and in the catalyst bed [1, 7, 9-11]. The fundamental criterion for the elaboration of pseudo-homogeneous models is represented by the flow rate model of the mass reaction. On the base of this criterion for the fixed-bed reactors the following models should be used: plug flow model and two-parameter bidimensional dispersion model [12-20].
The effectiveness of mathematical modelling of reactors, in the complex catalytic process is determined this paper. New data for modelling and optimisation of carbon monoxide oxidation reactor are now missing. Consequently, we intend to work up the two types of models (plug flow model and two-parameter bidimensional dispersion model) and simulating the reactor for carbon monoxide oxidation at low temperature.
2. Mathematical modelling
2.1. The Plug Flow Model In this model a plane profile of rates, temperatures and concentrations in any section of reactor is proposed. We shall admit a temperature radial gradient only in the proximity of the wall. The plug model allows axial temperature and concentration gradient. Under these circumstances, the plug flow model consists of [1-11, 21-23]: - Mass balance:
d
dz
r M
GxF TCO CO CO
COCO
10 1 , (1)
- Heat balance:
a) nonisothermal and nonadiabatic process
dT
dzr H
K T T
D
M
GCF TCO R T
T at
R
g
pCO
g
021
4, (2a)
b) adiabatic process
dT
dz
r H M
GCF T
CO R T g
pCO
g
0
2
1, (2b)
Modelling and simulation of carbon monoxide oxidation reactor at low temperature
41
- Momentum balance
dP
dzf
u
gdm
g g
p
22
(3)
- Kinetic rate equation of the conversion process. From a great number of kinetic equations presented in literature, equation (4) valid for CO+H2O+CO2 mixture in gaseous phase [24] was chosen:
22
2
120471841
1500exp102 5
HCOOHCp
OHCO
CO PPPP
PPRT
r
(4)
- the equilibrium constant, Kp, from Ref. [14]:
3112751 10461.7105426.2101588.53.224.2203lg TTTTK p (5)
- the heat of reaction (-RHT), from Ref. [12]:
36230 1046466.0106125.159.09.10145 TTTHTR (6)
The equations for specific heat capacities of the compounds and of the
reacting mass had the form: [11, 12, 25]: 24101470595.00105168.0833.31 TTC
COP
493623 10239028.010657928.0106588634.026589.0820.812
TTTTCCOP
4103623 10521937.0101232853.0101031357.00389144.00067.242
TTTTCHP
352 106152747.00123.0160299.8942.18392
TTTCOHP
493623 1015282.010361952.0103102063.01138057.06387.14
2TTTTC
NP
3522 1026519.0103083155.022148.1697.1234
TTTCCHP
483522 10150782.010274757.010184782.0544919.00908.81 TTTTCArP
C x CP A Pig i i
(7)
The simulating of the low temperature reactor on the basis of MRDT has been made using the Mathcad software. 2.2. The two-parameters bidimensional dispersion model In the case of relatively large diameter reactors when chemical reactions have significant thermal effect, admissions of a plane profile for rates, temperatures and concentrations significantly simplify the reality, and determined

Maria Harja, Lăcrămiara Rusu, Gabriela Ciobanu
42
the high error. The exclusion of the radial gradients may lead to significant errors due to the high sensitivity of the reaction, when referring to temperatures and concentrations. In the case bidimensional dispersion model, four parameters (eL, eR, DeL, DeR) or two parameters (eR, DeR) bidimensional dispersion models are used to evaluate temperatures and concentrations in any point of the catalyst bed. In the relatively high beds the mass and heat axial dispersion could be neglected when compared with the convective flow. In this paper we proposed to elaborate bidimensional dispersion model, on the base of simplified hypotheses [1, 2, 4-8, 10, 26-30]:
the reactor is at steady state; the fluid rate is constant in every cross-section and is equal to mean value; the fixed bed is a quasi-homogeneous single-phase medium, so that mass
and heat radial transfer could be described by a quasi-homogeneous model heaving DeR and eR as effective parameters;
the mass and heat radial diffusivities DeR and eR, are constant; the radial heat convection is negligible; the mass and heat axial dispersion is also negligible (DeL =0 and eL=0); the reactor runs in adiabatic thermal process.
In these circumstances, the two-parameter bidimensional mathematical model is:
CO eR g CO CO CO g
Pz
D
G r r r
r
GCg
2
2
1 10 (8)
and
T
z
M
GC
T
r r
T
r
r H
GCeR g
P
CO R T
Pg g
2
2
01 10
(9)
With the following initial and boundary conditions: z r R C C T T T TCO CO 0 0 0
00 10 20, , , , , , ...
z rr
T
rCO 0 0 0 0, : ,
(10)
z r Rr
T
rCO 0 0 0, : ,
In order to calculate the values of rCO, Kp, (-RHT) Eqs. (4, 5, 6) were
used. For reacting mass specific features calculation, delineated by g, g, g the following equations were used:
Modelling and simulation of carbon monoxide oxidation reactor at low temperature
43
g A Ai i i
xT
P
P
273
0
(11)
g
A Ai
A C
A A Ci
x M T
x M T
i i i Ai
i i Ai
(12)
g
A A Ai
A Ai
x M
x M
i i i
i i
1 3
1 3
/
/ (13)
CPg was calculated using Eq. (7). The Yagi and Kunii equation has been employed in order to calculate radial effective thermal conductivity [28]:
eR eRp
R
P pd
D
C Gdg
02
0137
1 46
. (14)
The radial effective diffusivity was calculated using equation [16]:
Peu d
D
d
DR
g p
eR
p
R
11 1 19 4
2
. (15)
The simulation of the mathematical model Eqs. (8-15) had been carried out using the Mathcad 7.0 [1]. Stability and convergence conditions have led to the following values of the integration steps: r = 0.10 m and z = 0.10 m.
3. Results and discussion
The numerical values used for the simulation of carbon monoxide reactor were provided by an ammonia installation. The date used in this study are:
initial composition x0
CO = 0.01805, x0CO2 = 0.1019, x0
H2O = 0.3382, x0N2 = 0.1339
x0CH4 = 0.002, x0
Ar = 0.0017, C0CO = 0.0244 kg mole m-3
T0 = 439 K, DR = 3.4 m, P = 29.5 atm, dp = 0.00646 m, G = 0.15948 Kmol m-2 s-1, u0
g = 0.20587 m s-1, = 0.7 [1] The inlet temperature distribution T00= 493K, T10 = 491K, T20 = 389K,
The results of the model’s simulation for plug flow model are show in Fig 1 and Fig 2 (MRDT - plug flow model).
Considering the plug flow model, simulation data demonstrated that the temperature and conversion increases with increase of reactor length.

Maria Harja, Lăcrămiara Rusu, Gabriela Ciobanu
44
Fig. 1 The temperature profile along the reactor, T = T(z), for plug flow model
Fig. 2 The CO - conversion profile along the reactor, co = CO(z), for plug flow model
For MDB - two parameters bidimensional dispersion model, the results are show in Fig. 3 and Fig. 4.

Modelling and simulation of carbon monoxide oxidation reactor at low temperature
45
Fig. 3 The variation of temperature profiles with reactor radius (for different reactor
length) The temperature values decrease with increase of reactor radius and with
length of catalytic reactor.
Fig. 4 The CO - conversion variation with the reactor radius for different locations of
reactor length, CO =CO(z, r) From Fig. 4 it can observe that the conversion isn’t affected of reactor radius. That varied significantly with length of reactor.
Maria Harja, Lăcrămiara Rusu, Gabriela Ciobanu
46
4. Conclusions
The results obtained from MRDT simulation model, are strongly different from real values so that these cannot be used both for designing and for reactor run analysis (at h = 0.1 m, CO = 0.95324); For designing the MDB model have to be used. The kinetic equation is established for the real type of low temperature catalyst. In the case of using Van Herwijnen kinetic equation, smaller lengths were obtained. (CO = 0.875 la H = 1.8 m). Notation Cp specific heat, kJ kg-1 mole K-1 De coefficient of the effective diffusivity, m2 s-1 DR reactor diameter, m Dp equivalent diameter of the catalyst particles, m fm friction factor g gravitational acceleration, m s-2 G flow rate of the gas phase, kg m-2s-1 k reaction rate constant Kp thermodynamic equilibrium constant KT overall heat transfer coefficient, W m-2 K-1 P pressure, Pa r radius, m ri local mass generation rate of component i, kg mole i m-3 catalyst s-1 R reactor radius, m T temperature, K ug gas velocity, m s-1 xi mole fraction of component i x0
CO mass fraction of carbon monoxide z (h) length, m -RHT standard heat of reaction, kJ kg-1 mole porosity of the bed efficiency factor of catalyst Conversion degree thermal conductivity, kJ m-1 s-1 K-1 e effective thermal conductivity coefficient, kJ m-1 s-1 K-1 viscosity, pa s density, kg m3 L axial R radial
Modelling and simulation of carbon monoxide oxidation reactor at low temperature
47
REFERENCES [1] Petrescu S., Harja M., Reactoare chimice pentru sisteme eterogene, Casa de Editură Venus,
Iaşi, 2006. [2] Bozga G., Munteanu O., Reactoare chimice, vol. II Reactoare eterogene, Ed. Tehnică,
Bucureşti, 2001. [3] Mihail R., Munteanu O., Reactoare chimice, Ed. Did. şi Ped., Bucureşti, 1983. [4] Mihail R., Modelarea reactoarelor Chimice, Ed. Tehnica, Bucuresti, 1977 [5] Zhou J., Blomberg S., Gustafson J., Lundgren E., Zetterberg J., Visualization of Gas
Distribution in a Model AP-XPS Reactor by PLIF: CO Oxidation over a Pd (100) Catalyst. Catalysts, 7(1), (2017), 29.
[6] Sedmak G., Hočevar S., Levec J., Kinetics of selective CO oxidation in excess of H2 over the nanostructured Cu0.1Ce0.9O2− catalyst. Journal of Catalysis, 213(2), (2003), 135-150.
[7] Nauman E. B., Chemical Reactor Design, Optimization, and Scale-up. Real tubular reactors in turbulent flow, Chapter (McGraw-Hill Professional, 2002).
[8] Manasilp A., Gulari E., Selective CO oxidation over Pt/alumina catalysts for fuel cell applications. Applied Catalysis B: Environmental, 37(1), (2002), 17-25.
[9] Kim M., Bertram M., Pollmann M., von Oertzen A., Mikhailov A. S., Rotermund H.H., Ertl G., Controlling chemical turbulence by global delayed feedback: pattern formation in catalytic CO oxidation on Pt (110). Science, 292(5520), (2001), 1357-1360.
[10] Kim T. J., Yetter R. A., Dryer F. L. New results on moist CO oxidation: high pressure, high temperature experiments and comprehensive kinetic modeling. In Symposium on combustion, 25(1), (1994), 759-766).
[11] Porru G., Aragonese C., Baratti R., Servida A. Monitoring of a CO oxidation reactor through a grey model- based EKF observer. Chemical engineering science, 55(2), (2000), 331-338.
[12] Grigoriu I., Reactoare chimice în strat fix şi fluidizat, vol. I, Ed. Asachi, Iaşi, 1997. [13] Ouyang X., Besser R.S., Effect of reactor heat transfer limitations on CO preferential
oxidation. Journal of Power Sources, 141 (2005), 39–46. [14] Ivaniciuc M., Contribuţii la modelarea proceselor D-R L-G, PhD Thesis, 1999. [15] Harja M, Tataru-Farmus Ramona Elena, Modelarea şi proiectarea reactoarelor chimice -
Îndrumar de laborator, Editura Performantica, Iaşi, 2012, 126p. [16] Harja M., Modelarea si proiectarea reactoarelor chimice, 2, 2017, http://www.ch.tuiasi.ro/cv/ic/harjamaria/ [17] Handbook of Heterogeneous Catalysis: Online, (Eds.: G. Ertl, H. Knözinger, F. Schüth, J.
Weitkamp), Wiley-VCH, Weinheim, 2008. [18] Meerson O., Sitja G., Henry C. R., Low temperature and low pressure CO oxidation on gold
clusters supported on MgO(100). The European Physical Journal D - Atomic, Molecular, Optical and Plasma Physics, 34(1–3), (2005), 119–124.
[19] Hickman, D. A., Schmidt, L. D. Production of syngas by direct catalytic oxidation of methane. Science-New York Then Washington, 259, (1993), 343-343.
[20] Luyben W. L. Chemical Reactor Design and Control, 419 pages, Wiley, 2007. [21] Avci A. K., Trimm D. L., Önsan Z. İ. Heterogeneous reactor modeling for simulation of
catalytic oxidation and steam reforming of methane. Chemical Engineering Science, 56(2), (2001), 641-649.
[22] Rase H. F., Chemical Reactor Design for Process Plant, 2, John Wiley & Sons, New York, 1977.
[23] Carlsson P.A., Skoglundh M., Thormählen P., Andersson B., Low-temperature CO oxidation over a Pt/Al2O3 monolith catalyst investigated by step-response experiments and
Maria Harja, Lăcrămiara Rusu, Gabriela Ciobanu
48
simulations, Topics in Catalysis, 2004, 30, 1–4 375–381 [24] van Herwijnen T., Jong W.A., Kinetics and mechanism of the CO shift on CuZnO: 1.
Kinetics of the forward and reverse CO shift reactions. Journal of Catalysis, 63(1), (1980), 83-93.
[25] Hayes R. E., Kolaczkowski S.T. Mass and heat transfer effects in catalytic monolith reactors. Chemical Engineering Science, 49(21), (1994), 3587-3599.
[26] Barrio V. L., Schaub G., Rohde M., Rabe S., Vogel F., Cambra J. F., Güemez M. B. Reactor modeling to simulate catalytic partial oxidation and steam reforming of methane. Comparison of temperature profiles and strategies for hot spot minimization. International Journal of Hydrogen Energy, 32(10), (2007), 1421-1428.
[27] Deutschmann O., Schmidt L. D. Modeling the partial oxidation of methane in a short‐contact‐time reactor. AIChE Journal, 44(11), (1998), 2465-2477.
[28] Froment F.G., Bishoff B. K., Chemical Reactor Analysis and Design, John Wiley&Sons, New York, 1979.
[29] Daneshvar K., Dadi R. K., Luss D., Balakotaiah V., Kang S. B., Kalamaras C. M., Epling W. S. Experimental and modeling study of CO and hydrocarbons light-off on various Pt-Pd/γ-Al 2 O 3 diesel oxidation catalysts. Chemical Engineering Journal, 323, (2017), 347-360.
[30] Hill G. CH. Jr., An Introduction to Chemical Engineering Kinetics and Reactor Design, John Wiley &Sons, New York, 1979.

Bulletin of Romanian Chemical Engineering Society, Vol. 5, No. 1, 2018 ISSN 2360-4697
49
LIQUID-LIQUID EXTRACTION COUPLED WITH SOLVENT RECYCLING BY DISTILLATION –MODELLING AND
SCALE-UP OF THE CONTINUOUS PROCESS
Tănase DOBRE, Marta STROESCU, Anicuța STOICA-GUZUN and Iuliana Mihaela JIPA
Department of Chemical and Biochemical Engineering, University Politehnica of Bucharest, 1-7 Polizu Street, Bucharest, Romania
Abstract In many countries food grade acetic acid must come from biological origin
(fermentation). While vinegar production requires short startup period and lower capital investment, a cost-effective concentration and purification of the bio-based acetic acid is still a challenge. This study is following earlier investigations on extraction – separation coupled processes. The main objective is to identify, by means of mathematical simulations andbased on obtained experimental data,the most important parameters to implementa proper start-up strategy for the continuous distillation column. In this manner, scale-up of the continuous recovery process of acetic acid can be conducted and analysed. Thus, it was fund that optimum start-up strategy involves continuous operation of the distillation column only after steady state achievement by means of solvent recycling. Key words: start-up optimization, scale-up, acetic acid, mathematical modelling
1. Introduction
Continuous distillation, as advanced operation applied for the separation of homogenous liquid mixtures where there is a difference in volatilities of the components, could be coupled with liquid-liquid extraction to allow solvent recycling, if one of the following requirements is covered: (a) The components of the solvent mixture are lighter (have higher value of volatility) than the obtained solute, in which case the recycled solvent is separated as column distillate while the solute will result as bottom product; (b) The components of the solvent mixture are all less volatile than the extracted solute, in which case the recycled solvent is separated as bottom product and the solute as distillate.
It is also important, due to energy efficiency considerations, for all components of the solvent mixture to have the latent heat of vaporization much lower than the main components of the extraction medium.
Corresponding author; E-mail address: [email protected] (Iuliana Mihaela Jipa)

Tănase Dobre, Marta Stroescu, Anicuța Stoica-Guzun and Iuliana Mihaela Jipa
50
Many researchers investigated and characterized different cases of start-up for the continuous distillation columnsof an integrated system comprised of two or three columns, or systems where the distillation column is coupled with reactors or other separators [1 – 5].
The operation of large capacity distillation columns when coupled with an extraction column is influenced by numerous factors: type of solvent (through distribution coefficients and diffusion coefficients in liquids), solvent flow, solute concentration in aqueous (feed) solution, geometry and construction of the extraction column (solvent droplets dimensions, droplets ascension time). But, what is most important, there is no set of general rules applicable in the start-up strategy [6].
A major impediment in the development of possible procedures for the start-up (when the distillation column is the central equipment) is the lack of detailed dynamic models (with known parameters) that could allow process simulation [7].
In our study, as in a previous reported work [8] we used diethyl ether, and diethyl ether- hexane mixtures (2:1 and 1:2 v/v) as extraction solvents. The optimal extraction – distillation start-up procedure was determined through the following steps: (1) Experimental investigation using different solvents and different solvent flows; (2) Development of the mathematical model of the overall process; (3) Model validation using the experimental data; (4) Process simulation using validated mathematical model and identification of the main parameters influencing the column start-up; (5) scale-up of the continuous process.
2. Experimental and theoretical approach
Commercial vinegar, containing 90 g/L acetic was used (considered as fermentation broth). The organic (solvent) phase was diethyl ether and mixture of diethyl ether and hexane (Mixture I - 2:1 and Mixture II - 1:2 v/v). Acetic acid concentration was determined by titration with NaOH 0.1N.
The experiments were conducted in a laboratory experimental setup, similar in characteristics and operation with the one presented in the reported study [8] where the simple distillation column was replaced with a batch rectifier, as schematically represented in Fig. 1.
For the stripping section (stripping column), model equations are as described previously [8]. In the development of mathematical model, the following assumptions have been made for the rectifier:
- Perfect mixing in the column reboiler and reflux collector; - Rectifier separation performance is characterised by a constant number
of trays in both sections;

Liquid-liquid extraction coupled with solvent recycling by continuous distillation – process modelling and scale-up
51
- Due to high reflux rate the composition in liquid / vapour phase is determined using Fenske equation;
- Vapour and liquid flows in both columns are constant (in accordance with applied reflux ration);
- Working pressure in the condenser is atmospheric (low pressure drop for packing).
Fig. 1. Experimental setup for acetic acid separation
1 – extraction column;2 – organic phase in the extraction column, 3 – condenser; 4 – reflux collector; 5 – feed of the distillation column; 6 – packing bed rectifying
section; 7 – packing bed stripping section; 8 – reboiler of the rectifier;9 – thermometers; 10. recycling pump; 𝑉 , 𝑉 , 𝑉 , 𝑉 – working volumes, 𝑐 , 𝑐 – solute mass concentrations,
𝑥 , , 𝑦 , , 𝑦 , – solvent molar fractions in liquid and vapour
Model equations The equations for the extraction column are presented in previous work
[8]. The mathematical model is completed with the equations for the rectifier, written according to the assumption given above:

Tănase Dobre, Marta Stroescu, Anicuța Stoica-Guzun and Iuliana Mihaela Jipa
52
- Fenske equation for molar fraction of the light component in the reboiler:
𝑥 , (1)
- Equation for vapour composition rising from reboiler (considering operation at equilibrium):
y , ,
, 2
- Balance equation for the light component (the extraction solvent) for the reboilerand its initial condition:
x , y , 3
τ 0, x 0.999 4 - Fenske equation for the reboiler, overall:
y ,
,
,,
,
5
- Differential mass balance eq. for the solute in the reflux collector with the associated initial condition:
𝑟 1 𝐺 1 𝑦 , 𝑟 1 𝑐 6
τ 0, c 0 7
3. Results and discussions
Experimental results indicated, as expected, that in this case also, increasing solvent flow increases extraction yield, which recommends operation with higher solvents flows to shorten process duration. Furthermore, an increased process efficiency when comparing extraction - rectifying(batch distillation) with extraction– simple pseudo-continuous distillation was obtained. For comparison, in the same conditions, 0.15 g acetic acid / mL solvent can be separated using batch distillation, while only 0.09 g acetic acid / mL solvent were separated when simple pseudo-continuous distillation was implemented.
Solving the mathematical model To solve the mathematical model developed for the case of liquid – liquid
extraction coupled with batch distillation for the recovery of extraction solvent, some parameters were determined, as follows:
- Acetic acid diffusion coefficients characterising the transfer to solvents droplets were estimated using Wilke and Chang empirical correlation [9];

Liquid-liquid extraction coupled with solvent recycling by continuous distillation – process modelling and scale-up
53
- Mass transfer coefficient (acetic acid transfer from aq. medium to droplets) was estimated using criteria correlations (here 𝑆ℎ 20.47 𝑅𝑒 . 𝑆𝑐 . );
- Ascending time and droplets dimensions were determined experimentally by visual observations;
- Solvent – solute relative volatility was determined considering ideal mixture (given vapour pressures ratio at a temperature above solvent boiling point);
- Partition coefficients for the extraction as reported in previous study [8]. Synthetically, all parameters used in solving the mathematical model are
presented in Table 1. Table 1.
Mass transfer and operational parameters used for simulations
No Parameter, m.u. Value
Diethyl ether
Mixture I
Mixture II
1. Dispersed phase flow, mL/min 10; 20
2. Aq. phase (fermentation broth) volume in the extraction column, L
2
3. Disperse phase volume in the reboiler, L 0,45
4. Initial concentration of acetic acid in the extraction column, g/L
90
5. Mass transfer coefficient in the extraction column, m/s
10-5 2,5.10-6 3,5.10-6
6. Partition coefficient in the extraction column 2,3 1 0,6
7. Diffusion coefficient in the extraction column, m2/s 7.10-10 5,1.10-10 6,5.10-10
8. Drop radius (min – max), mm 0,3 – 1,8 9. Drops ascending time in the extraction time, s 4
Comparison between model prediction and experimental data shows a
good agreement between theoretical and experimental curves (Fig. 2). This indicates that the proposed mathematical model can be used for process scale-up.
Scale up for the continuous process The mathematical model can be adapted and used to simulate continuous
acetic acid separation in the coupled process, which means continuous feed of fermentation broth to the extraction column, continuous solvent recycling and continuous heavy fraction removal from the distillation column bottom.
For example, the variation of acetic acid concentration in the extraction column and in the distillation column bottom can be estimated for different operational parameters as presented in Table 2 and Fig. 3.

Tănase Dobre, Marta Stroescu, Anicuța Stoica-Guzun and Iuliana Mihaela Jipa
54
Fig. 2.Experimental (bullets) and calculated (lines)acetic acid concentration vs. time
(solvent flow rate A) 20 mL/min, B) 10 mL/min)
Table 2. Operational parameters used for simulations of continuous extraction – distillation process
No Parameter, m.u. Value
1. Solvent recycle flow, L/min 2 2. Acetic acid aq. sol. flow (extraction column feed), L/min 1; 2; 3 3. Acetic acid conc. in the extraction column feed, g/L 90 4. Feed flow of the distillation column, L/min 1/10; 2/10; 3/10 5. Aq. sol. volume in the extraction column, L 200 6. Disperse phase volume in the distillation column bottom, L 45
Fig. 3. Acetic acid concentration A) in the bottom of the continuous distillation column and B) in
the extraction column, using Mixture I for different feeding flows of the extraction column
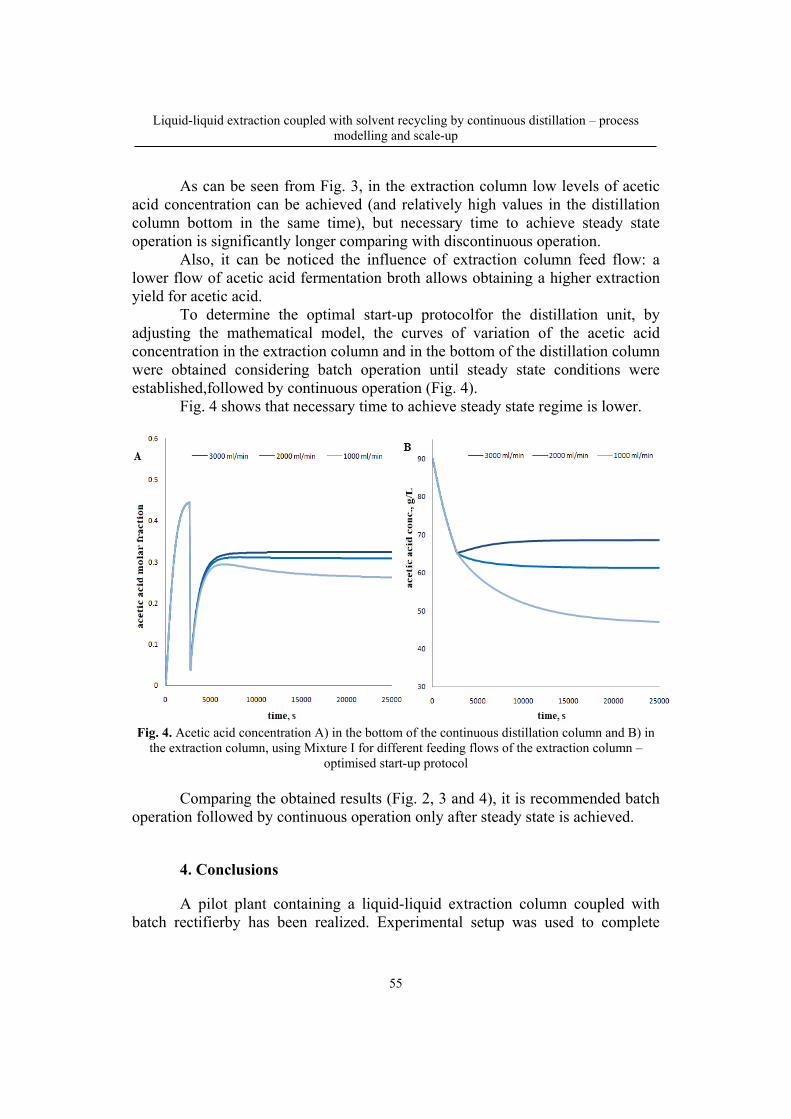
Liquid-liquid extraction coupled with solvent recycling by continuous distillation – process modelling and scale-up
55
As can be seen from Fig. 3, in the extraction column low levels of acetic acid concentration can be achieved (and relatively high values in the distillation column bottom in the same time), but necessary time to achieve steady state operation is significantly longer comparing with discontinuous operation.
Also, it can be noticed the influence of extraction column feed flow: a lower flow of acetic acid fermentation broth allows obtaining a higher extraction yield for acetic acid.
To determine the optimal start-up protocolfor the distillation unit, by adjusting the mathematical model, the curves of variation of the acetic acid concentration in the extraction column and in the bottom of the distillation column were obtained considering batch operation until steady state conditions were established,followed by continuous operation (Fig. 4).
Fig. 4 shows that necessary time to achieve steady state regime is lower.
Fig. 4. Acetic acid concentration A) in the bottom of the continuous distillation column and B) in
the extraction column, using Mixture I for different feeding flows of the extraction column – optimised start-up protocol
Comparing the obtained results (Fig. 2, 3 and 4), it is recommended batch
operation followed by continuous operation only after steady state is achieved.
4. Conclusions
A pilot plant containing a liquid-liquid extraction column coupled with batch rectifierby has been realized. Experimental setup was used to complete

Tănase Dobre, Marta Stroescu, Anicuța Stoica-Guzun and Iuliana Mihaela Jipa
56
ancomparative study for acetic acid separation from fermentation broth. Experimental data shows that coupling acid extraction with solvent recovery and recycling by batch distillation allows obtaining highly concentrate acetic acid solutions even using the concentrated fermentation broth (as resulted in the industrial fermentation process).
As expected, extraction with ethyl acetate as pure solvent is faster and apparently more efficient, but due to process intensification allowed when a rectifier is used, even the extraction with diethyl ether and hexane mixtures proved to be very efficient. Regardless the type of solvent increasing solvent flow rate has a positive effect on the extraction process.
The mathematical model that describes the overall process was developed. Comparison between model prediction and experimental data had shown very good agreement between theoretical and experimental curves, which allowed continuous process simulation and start-up. An optimum strategy for the start-up of the continuous distillation process was obtained. SYMBOLS
1aC acetic acid concentration in the extraction column (aqueous phase) (g/L)
oiC acetic acid concentration in organic phase, in storage zone “i” (g/L)
vG solvent volumetric flow rate (m3/s)
Mi molecular weight (g/mol) Ne number of theoretical stages (trays) for the distillation column Re Reynolds number r current radius (m) Sc Schmidt number Sh Sherwood number
1aV volume of the extraction column (acetic acid solution volume) (m3)
oiV volume of storage zone “i” (organic phase volume) (m3)
x mole fraction in the liquid phase y mole fraction in the vapor phase
Greek Symbol
α volatility coefficient (Fenske equation) ρls solvent mean density (kg m-3) current time (s)
as drop ascending time (s)
Subscripts
a acetic acid s solvent

Liquid-liquid extraction coupled with solvent recycling by continuous distillation – process modelling and scale-up
57
1 refers to the extraction zone (extraction column) 2 refers to the rectifier reboiler 3 refers to the rectifier collector (reflux)
REFERENCES
[1] Varbanov, P., Klein, A., Repke, J.U., Wozny, G., Minimising the startup duration for mass- and heat-integrated two-column distillation systems: A conceptual approach, Chemical Engineering & Processing: Process Intensification, 47(9-10), (2008), 1456-1469.
[2]Wang L., Pu, L., Wozny, G., Wang, S., A start-up model for simulation of batch distillation starting from a cold state, Computers Chemical Engineering, 27, (2003), 1485–1487.
[3]Yazdi, H., Bahar, M., Koggersbol, A., Jorgensen, S.B., Knowledge-based control structuring of a distillation plant start-up, Control Engineering Practice, 3(3), (1995), 423-430.
[4]Fabro, J.A., Arruda, L.V.R., Neves, F.Jr., Startup of a distillation column using intelligent control techniques, Computers and Chemical Engineering, 30, (2005), 309–320.
[5]Ruiz, C.A., Cameron, I.T., Gani, R., A generalized dynamic model for distillation columns III—Study of start-up operations, Computer Chemical Engineering, 12, (1998), 1–14.
[6] Wozny G., Li P., Optimization and experimental verification of startup policies for distillation columns, Computers Chemical Engineering, 28, (2004), 253–265.
[7] Neves F.Jr., Aguilar-Martin J., Heterogeneous control and qualitative supervision, application to a distillation column, Engineering Applications of Artificial Intelligence, 13, (2000), 179–198.
[8] Jipa I., Dobre, T., Stroescu, M., Stoica, A., Acetic acid extraction from fermentation broth Experimental and modelling studies, Revista de Chimie, 60(10), (2009), 1084–1089.
[9] Floarea, O., Dima, R., Procese de transfer de masa şi utilaje specifice, Ed. Didactică şi Pedagogică, Bucuresti 1984.

Bulletin of Romanian Chemical Engineering Society, Vol 5, No. 1, 2018 ISSN 2360-4697
58
AIR DRYING OF AROMATIC PLANTS COUPLED WITH
RECOVERY OF VOLATILE COMPOUNDS
Cristian Eugen RĂDUCANU, Oana Cristina PÂRVULESCU, Tănase DOBRE,
Iuliana DUMITRU, Florentina DRĂGUȘIN
Dept. of Chemical and Biochemical Engineering, Faculty of Applied Chemistry
and Materials Science, University POLITEHNICA of Bucharest, 1-7 Gh. Polizu
Street, 011061, Bucharest, Romania
Abstract
The content of essential oil components of aromatic plants diminishes at temperatures
over 30 °C. Accordingly, in order to minimize the loss of volatile compounds, plant drying is
usually performed at temperatures below 50-60 °C. Aspects related to air convective drying (50
°C) of fixed-bed jasmine flowers coupled with recovery of volatile compounds from the effluent of
drying column by fixed-bed adsorption (30 °C) onto activated carbon were presented in this
paper. The performances of drying and adsorption processes were measured and predicted at
different values of air superficial velocity (0.12-0.30 m/s). Activated carbon adsorption capacity
was up to 0.2 kg/kgAC, whereas drying and adsorption rates were up to 0.0065 kg/(kgwm∙min) and
0.0035 kg/(kgAC∙min), respectively.
Key words: air drying, activated carbon, adsorption, aromatic plants, jasmine,
polynomial regression
1. Introduction
Aromatic and medicinal plants contain essential oils and other substances
which are valuable compounds in food, perfumes, cosmetics, nutraceuticals, and
pharmaceuticals [1-3]. Post-harvest processing of plants can have a significant
effect on the quantity and quality of these bioactive ingredients [3].
The drying is a main operation in the post-harvest technology. Aromatic
and medicinal plants are usually dried up to a final moisture content of 8-15% at
which the microbial spoilage is highly minimized [3,4]. Air convective drying is
the most used method, but it can severely affect the composition of vegetal
material and its organoleptic properties [1,3-7]. The quality of dried plants mainly
depends on dryer type and drying conditions in terms of temperature, duration, air
relative humidity and flow rate [1,3-9]. Temperatures below 50-60 °C are
Corresponding author; E-mail: [email protected]
Air drying of aromatic plants coupled with recovery of volatile compounds
59
commonly used to minimize the loss of volatile compounds [1,3,5-7]. The content
of essential oil components diminishes at temperatures over 30 °C [9].
Jasmine (Jasminum officinale) is an aromatic plant which grows in Asia,
Africa, and some parts of Europe [10,11]. Its flowers are widely used to prepare
an essential oil and jasmine tea [11,12]. Jasmine flowers contain many volatile
compounds, including farnesene, linalool, nerolidol, indole, benzyl alcohol,
benzyl acetate, benzyl benzoate, hexenyl benzoate, jasmine lactone, jasmone [11-
14]. These compounds have medicinal benefits and are important ingredients in
perfumes, cosmetics, flavorings, and food [10-13]. Studies reported in the related
literature have highlighted many pharmacological uses of jasmine flowers and
their derivatives, e.g., central nervous system depressant, uterine tonic,
aphrodisiac, sedative, anesthetic, astringent, antimicrobial [10-13].
This paper aimed at studying the air convective drying of fixed-bed
jasmine flowers coupled with recovery of volatile compounds from the effluent of
drying column by fixed-bed adsorption onto activated carbon (AC). The
performances of drying and adsorption depending on process factors were
predicted under various operating conditions.
2. Experimental
2.1. Materials
Jasmine flowers were used as vegetal material for drying process and AC
(Chemviron Carbon, Belgium) as an adsorbent for adsorption process. Heated air
was employed as a drying agent.
2.2. Procedure
2.2.1. Air drying of fixed-bed vegetal material coupled with the adsorption
of volatile compounds onto fixed-bed AC
Coupled processes of air drying of vegetal material and adsorption of
volatile compounds were conducted in an experimental setup shown in Fig. 1.
Fixed-bed drying and adsorption processes were performed in the glass columns
(1) and (2), respectively, 3.5 cm internal diameter and 50 cm height.
Vegetal material (3) was chopped and further packed into the drying
column (1). AC (4) was dried at 130 °C for 2 h and then loaded into adsorption
column (2). Air provided by an air generator (5), which was powered by an
autotransformer (6), was further heated by an electrical heater (7) powered by an
autotransformer (8), and heated air entered the bottom of drying column (1). The

Cristian Răducanu, Oana-Cristina Pârvulescu, Iuliana Dumitru, Florentina Drăgușin, Tănase Dobre
60
mixture of air and volatiles exiting the drying column (1) entered the adsorption
column (2) and up-flowed through the fixed-bed AC.
Air flow rate was measured by a flow-meter (9). Humidity, temperature,
and dew point above the both fixed beds were continuously measured by two data
loggers (10). Drying and adsorption processes were monitored in terms of mass
variation using a software program and two analytical balances (11) connected to
computers (12).
Known variables of fixed-bed drying and adsorption processes were as
follows: mwm,0=50 g the initial mass of wet vegetal material, twm=50 °C the mean
temperature of fixed-bed vegetal material, mAC,0=40 g the initial mass of AC
particles, tAC=30 °C the mean temperature of fixed-bed AC, and dAC=4 mm the
mean diameter of AC particle. The air superficial velocity, w=0.12-0.30 m/s, was
selected as independent variable (factor), whereas the moisture content of fixed-
bed vegetal material, u (kg/kgwm), and mass ratio of volatile compounds adsorbed
onto AC, X (kg/kgAC), were the dependent variables (responses).
1000------
800-----
600------
400------
200-
ºC
Gfdgdsfg
Sdhgfasdgv
sdfgvsdvasjg
Gfdgdsfg
Sdhgfasdgv
sdfgvsdvasjg
1
11
6
11
10
4
7
2
59
3
8
10
1212
Fig. 1. Experimental setup for fixed-bed drying and adsorption: (1) drying column; (2) adsorption
column; (3) vegetal material; (4) activated carbon; (5) air generator; (6), (8) autotransformers;
(7) air heater; (9) flow-meter; (10) data logger; (11) analytical balance; (12) computer.

Air drying of aromatic plants coupled with recovery of volatile compounds
61
2.2.2. Air drying of thin-layer vegetal material
Air drying of thin-layer vegetal material was performed using an OHAUS
MB23 moisture analyzer (OHAUS, NJ, USA) connected to a computer (Fig. 2).
The temperature of thin layer, t=50-120 °C, was selected as independent variable
(factor), whereas the moisture content of thin-layer vegetal material, utl (kg/kgwm),
was the dependent variable (response).
Fig. 2. Experimental setup for air drying of thin-layer vegetal material.
3. Results and discussions
3.1. Air drying of thin-layer vegetal material
Experimental values of moisture content, utl (kg/kgwm), vs. time, τ (min),
for thin-layer drying of jasmine flowers at 4 levels of drying temperature (t=50,
75, 100, 120 °C) are presented in Fig. 3a. It is noticed a faster drying at larger
levels of operating temperature. Experimental data were processed by polynomial
regression resulting in Eq. (1). Predicted data of moisture content depending on
time and temperature (Eq. (1)), which are shown in Fig. 3b, are in a good
agreement with the experimental results. Experimental data and predicted values
(by Eq. (2)) of drying rate, -dutl/dτ (kg/(kgwm∙min)), vs. time for thin-layer drying
of jasmine flowers at different levels of drying temperature (t=50-120 °C) are
presented in Fig. 4.

Cristian Răducanu, Oana-Cristina Pârvulescu, Iuliana Dumitru, Florentina Drăgușin, Tănase Dobre
62
Fig. 3. Moisture content, utl (kg/kgwm), vs. time for thin-layer drying of jasmine flowers at different
values of drying temperature: (a) experimental; (b) predicted (Eq. 1)).
42976
32864
22743
263
264
10231.110793.110029.6
10486.610485.910192.3
10402.910472.110162.5
10853.310188.1044.0
10518.610703.9574.0,
tt
tt
tt
tt
tttutl
(1)
32976
22864
2743
263
10231.110793.110029.64
10486.610485.910192.33
10402.910472.110162.52
10853.310188.1044.0,
tt
tt
tt
ttd
tdutl
(2)
Fig. 4. Drying rate, -dutl/dτ (kg/(kgwm∙min)), vs. time for thin-layer drying of jasmine flowers at
different values of drying temperature: (a) experimental; (b) predicted (Eq. 2)).

Air drying of aromatic plants coupled with recovery of volatile compounds
63
3.2. Air drying of fixed-bed vegetal material coupled with the adsorption
of volatile compounds onto fixed-bed AC
Experimental values of moisture content, u (kg/kgwm), vs. time, τ (min), for
air drying of fixed-bed jasmine flowers at 3 levels of air superficial velocity
(w=0.12, 0.18, 0.24 m/s) are presented in Fig. 5a. It is observed a faster drying at
larger levels of air superficial velocity. Experimental data were processed by
polynomial regression resulting in Eq. (3). Predicted data of moisture content
depending on time and air superficial velocity (Eq. (3)), which are shown in Fig.
5b, are consistent with the experimental results. Predicted values by Eq. (4) of
drying rate, -du/dτ (kg/(kgwm∙min)), vs. time for thin layer drying of jasmine
flowers at different levels of air superficial velocity (w=0.12-0.24 m/s) are
presented in Fig. 6.
Fig. 5. Bed moisture content, u (kg/kgwm), vs. time for fixed-bed drying of jasmine flowers at
different values of air superficial velocity: (a) experimental; (b) predicted (Eq. (3)).
42889
32567
22344
23
2
1003.210012.110263.1
10081.110125.51027.6
10765.110559.810.033.1
096.0043.010089.6
128.1434.0809.0,
ww
ww
ww
ww
wwwu
(3)

Cristian Răducanu, Oana-Cristina Pârvulescu, Iuliana Dumitru, Florentina Drăgușin, Tănase Dobre
64
32889
22567
2344
23
1003.210012.110263.14
10081.110125.51027.63
10765.110559.810.033.12
096.0043.010089.6,
ww
ww
ww
wwd
wdu
(4)
Fig. 6. Predicted values (Eq. (4)) of drying rate, -du/dτ (kg/(kgwm∙min)), vs. time for fixed-bed
drying of jasmine flowers at different values of air superficial velocity.
Experimental values of mass ratio of volatile compounds adsorbed onto
AC, X (kg/kgAC), vs. time, τ (min), for fixed-bed adsorption at 3 levels of air
superficial velocity (w=0.12, 0.18, 0.24 m/s) through fixed-bed jasmine flowers
are presented in Fig. 7a. Experimental data were processed by polynomial
regression resulting in Eq. (5). Predicted data of mass ratio depending on time and
air superficial velocity (Eq. (5)), which are shown in Fig. 7b, are consistent with
the experimental results. Predicted values by Eq. (6) of adsorption rate, dX/dτ
(kg/(kgAC∙min)), vs. time for fixed-bed adsorption of volatile compounds onto AC
at different levels of air superficial velocity (w=0.12-0.24 m/s) through fixed-bed
jasmine flowers are presented in Fig. 8.

Air drying of aromatic plants coupled with recovery of volatile compounds
65
Fig. 7. Mass ratio of VC adsorbed onto AC, X (kg/kgAC), vs. time for fixed-bed adsorption at
different values of air superficial velocity: (a) experimental; (b) predicted (Eq. (5)).
42889
32566
22334
23
2
1003.210012.110263.1
10768.110708.810071.1
10602.210304.110657.1
137.0068.010719.9
761.1636.0052.0,
ww
ww
ww
ww
wwwX
(5)
32889
22566
2334
23
1003.210012.110263.14
10768.110708.810071.13
10602.210304.110657.12
137.0068.010719.9,
ww
ww
ww
wwd
wdX
(6)
Fig. 8. Predicted values (Eq. (6)) of adsorption rate of VC onto AC,
dX/dτ (kg/(kgAC∙min)), vs. time at different values of air superficial velocity.

Cristian Răducanu, Oana-Cristina Pârvulescu, Iuliana Dumitru, Florentina Drăgușin, Tănase Dobre
66
3. Conclusions
Coupled processes of air drying of fixed-bed jasmine flowers and recovery
of volatile compounds by fixed-bed adsorption onto activated carbon were studied
in a bench scale setup. Mean values of drying and adsorption processes were 50
and 30 °C, respectively. Moisture mass fraction of fixed-bed vegetal material, u
(kg/kgwm), and mass ratio of volatile compounds adsorbed onto activated carbon,
X (up to 0.2 kg/kgAC), were measured at different values of air superficial velocity
(w=0.12-0.30 m/s). Drying and adsorption rates were up to 0.0065 kg/(kgwm∙min)
and 0.0035 kg/(kgAC∙min), respectively.
Air drying of thin-layer jasmine flowers was performed in a moisure
analyzer. Moisture content of thin layer, utl (kg/kgwm), was measured at various
levels of drying temperature (t=50-120 °C). Drying rates of jasmine flowers were
up to 0.055 kg/(kgwm∙min) and increase with an increase in the process
temperature. The performances of drying and adsorption processes were predicted
under different operating conditions.
REFERENCES
[1] Lima-Corrêa, R.A.B., dos Santos Andrade, M., da Silva, M.F.G.F., Freire, J.T., do Carmo
Ferreira, M., Thin-layer and vibrofluidized drying of basil leaves (Ocimum basilicum L.):
Analysis of drying homogeneity and influence of drying conditions on the composition of
essential oil and leaf colour, Journal of Applied Research on Medicinal and Aromatic
Plants, 7, (2017), 54-63.
[2] Lubbe, A., Verpoorte, R., Cultivation of medicinal and aromatic plants for specialty industrial
materials, Industrial Crops and Products, 34, (2011),785-801.
[3] Rocha R.P., Melo E.C., Radünz L.L., Influence of drying process on the quality of medicinal
plants: A review, Journal of Medicinal Plants Research, 5(33), (2011), 7076-7084.
[4] Hossain, M.B., Barry-Ryan, C., Martin-Diana, A.B., Brunton, N.P., Effect of drying method on
the antioxidant capacity of six Lamiaceae herbs, Food Chemistry, 123(1), (2010), 85-91.
[5] Antal T., Figiel A., Kerekes B., Sikolya L. 2011, Effect of drying methods on the quality of the
essential oil of spearmint leaves (Mentha spicata L.), Drying Technology, 29(15), (2011),
1836-1844.
[6] Müller, J., Convective drying of medicinal, aromatic and spice plants: A review, Stewart
Postharvest Review, 3(4), (2007), 1-6.
[7] Rubinskienė M., Viškelis P., Dambrauskienė E., Viškelis J., Karklelienė R., Effect of drying
methods on the chemical composition and colour of peppermint (Mentha × piperita L.)
leaves, Zemdirbyste-Agriculture, 102(2), (2015), 223-228.
[8] Dobre, T., Pârvulescu, O.C., Stoica-Guzun, A., Stroescu, M., Jipa, I., Al Janabi, A.A.A., Heat
and mass transfer in fixed bed drying of non-deformable porous particles, International
Journal of Heat and Mass Transfer, 103, (2016), 478-485.
[9] Yadegari M., Amirfakhriyan Z., Mohammadkhani A., The effects of different drying methods
on essential oil content and composition and marketing of Lippia citriodora Kunth, Journal
of Applied Science and Agriculture, 8(5), (2013), 624-628.

Air drying of aromatic plants coupled with recovery of volatile compounds
67
[10] Hussain M., Bakhsh, H., Aziz, A., Majeed, A., Khan, I.A., Mujeeb, A., Farooq, U.,
Comparative In vitro study of antimicrobial activities of flower and whole plant of
Jasminum officinale against some human pathogenic microbes, Journal of Pharmacy and
Alternative Medicine, 2(4), (2013), 33-43.
[11] Mohamad Khidzir, K., Cheng, S.F., Chuah, C.H., Interspecies variation of chemical
constituents and antioxidant capacity of extracts from Jasminum sambac and Jasminum
multiflorum grown in Malaysia, Industrial Crops and Products, 74, (2015), 635-641.
[12] Yu Y., Lyu S., Chen D, Lin Y., Chen J., Chen G., Ye N., Volatiles emitted at different
flowering stages of Jasminum sambac and expression of genes related to α-farnesene
biosynthesis, Molecules, 22, (2017), 546.
[13] Al-Khazraji, S.M., Evaluation of antibacterial activity of Jasminum Officinale, IOSR Journal
of Pharmacy and Biological Sciences, 10(1), (2015), 121-124.
[14] Pragadheesh V.S., Chanotiya C.S., Rastogi S., Shasany A.K., Scent from Jasminum
grandiflorum flowers: Investigation of the change in linalool enantiomers at various
developmental stages using chemical and molecular methods, Phytochemistry, 140, (2017),
83-94.

Bulletin of Romanian Chemical Engineering Society, Vol 5, No. 1, 2018 ISSN 2360-4697
68
EXPERIMENTAL STUDY ON TIO2 PROMOTED PHOTO-DEGRADATION OF METHYLENE BLUE
Alexandru Ioan ATOMI1, Gabriel Dan SUDITU1, Adrian Cătălin PUIŢEL2
Mircea Teodor NECHITA1
Technical University of “Gheorghe Asachi” Iasi, Faculty of Chemical Engineering and Environmental Protection
“Cristofor Simionescu”, 1Department of Chemical Engineering,
2Department of Natural and Synthetic Polymers
Abstract The goal of this work was to illustrate that regardless to its origin (preparation methods)
regardless to its particle size (nano or not) and to its crystalline form (the anatase – rutile ratio) the TiO2 is a photochemically active compound. In order to establish the most favourable working conditions for the chosen material an experimental design methodology was applied, involving the response surface optimization method. Methylene blue was selected as model compound for this experimental study and three variables were considered during the optimization process: initial TiO2 concentration [TiO2], initial methylene blue concentration [MB] and UV irradiation time [t]. Key words: TiO2, methylene blue, photodegradation, experimental design
1. Introduction
Titanium (IV) dioxide (TiO2) also known as titania is generally acknowledged as photocatalyst and as one of the foundation stones of photochemistry [1]. Currently, powders and nanopowders of titania prepared by various methods are successfully employed in a wide range of photochemical reactions [2]. Due to its particular characteristics a certain type of TiO2 known as Degussa P25 attracted a lot of attention and turn out to be, for many authors, the reference point for titania photocatalytic activity [3-5]. Degussa’s P25 remarkable activity is attributed either to its high content of anatase [6] or to the synergetic effect of the anatase-rutile mixture [7, 8]. The debate related with the ratio between the anatase and rutile content of titania and the role played by each of
Corresponding author: E-mail address: [email protected] (Mircea Teodor Nechita)

Experimental Study On TiO2 Promoted Photo-Degradation Of Methylene Blue
69
these crystalline forms of titania as photocatalysts in photochemical reactions is far from being over [3, 7, 9].
In spite of this scientific debate, some creative commercial concepts exploiting the photocatalytic activity of TiO2-based materials are flourishing nowadays: “self-cleaning pavements”, “smog-eating concrete”, “anti-fogging glass”, “hygienic coatings” and so on [1, 10, 11] and large scale application of TiO2-based materials are spreading across the world, especially in construction and building materials [12-18].
Therefore, considering the increasing demand on TiO2 powders as construction material with photochemical properties, this work aims to draw attention to other commercial type of titania apart from Degussa P25, less trendy, less expensive - therefore more appropriate for large scale applications (e. g. photocatalytic pavements) and to provide evidence of its capacity to act as a photocatalyst. Since the methylene blue degradation in water is used as a standard for determination of surface photocatalytic activity [19, 20] - methylene blue was selected as model compound for this experimental study.
2. Experimental
Reagents Common commercial TiO2 powder supplied at FCC purity grade by
Mayam (M-1319) was used as such during this study. Methylene blue (Fluka) and bidistilled water were used to prepare the dye solutions.
Equipments and methods The UV light was obtained from a Biocomp UV-lamp with wavelength of
253,7± 0.8 nm. The concentration changes of MB, determined by the absorbance of the solution at 665 nm (Fig. 1), was evaluated with a JASCO V-550 UV-Vis spectrophotometer.
The performances of TiO2 were characterized by measuring the rate of methylene blue degradation under UV irradiation. In order to avoid settling and to ensure a constant exposure of the mixture the slurry was stirred constantly during all the experiments. MB concentration was calculated from an absorbance versus concentration calibration curve (Fig. 2).
The efficiency of MB photochemical degradation η, (%) was calculated using the following equation:
0
0
MB MBη (%) 100
MB
(1)
where 0MB and MB are the concentrations of methylene blue (mg/L) at the
time t 0 and at the time t t, (s) .
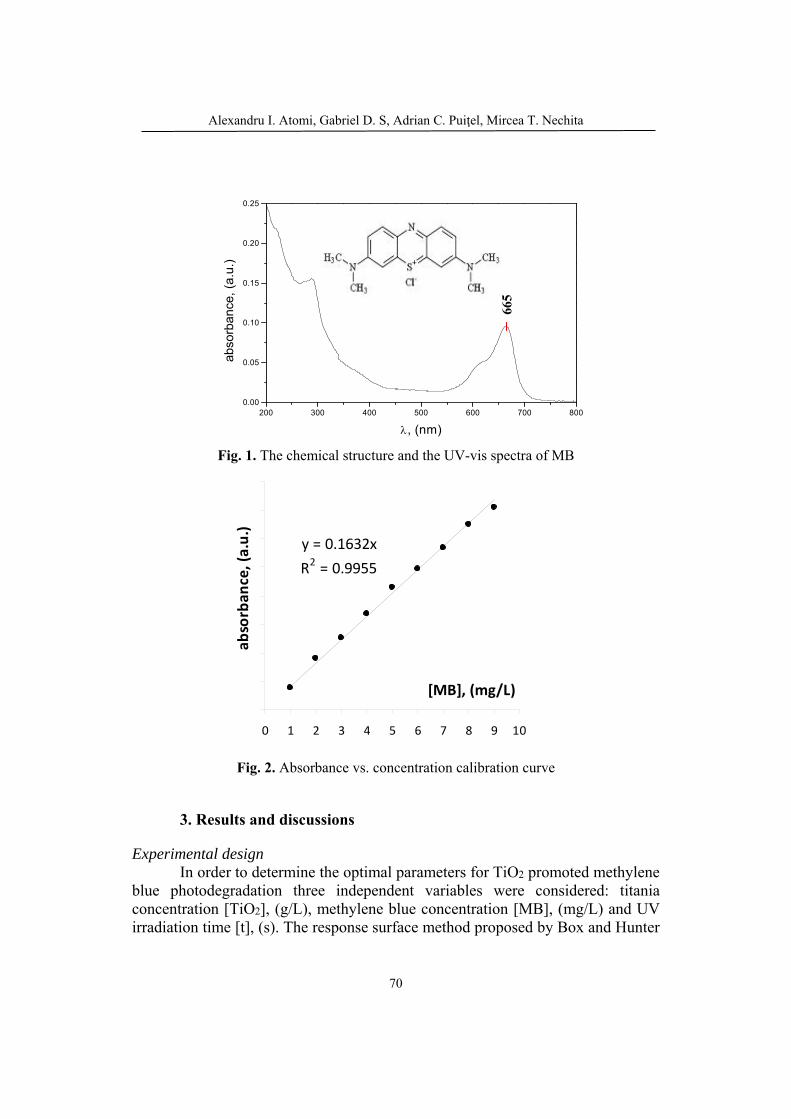
Alexandru I. Atomi, Gabriel D. S, Adrian C. Puiţel, Mircea T. Nechita
70
Fig. 1. The chemical structure and the UV-vis spectra of MB
y = 0.1632x
R2 = 0.9955
0 1 2 3 4 5 6 7 8 9 10
[MB], (mg/L)
absorbance, (a.u.)
Fig. 2. Absorbance vs. concentration calibration curve
3. Results and discussions
Experimental design In order to determine the optimal parameters for TiO2 promoted methylene blue photodegradation three independent variables were considered: titania concentration [TiO2], (g/L), methylene blue concentration [MB], (mg/L) and UV irradiation time [t], (s). The response surface method proposed by Box and Hunter
200 300 400 500 600 700 8000.00
0.05
0.10
0.15
0.20
0.25
665
ab
sorb
an
ce,
(a.u
.)
, (nm)
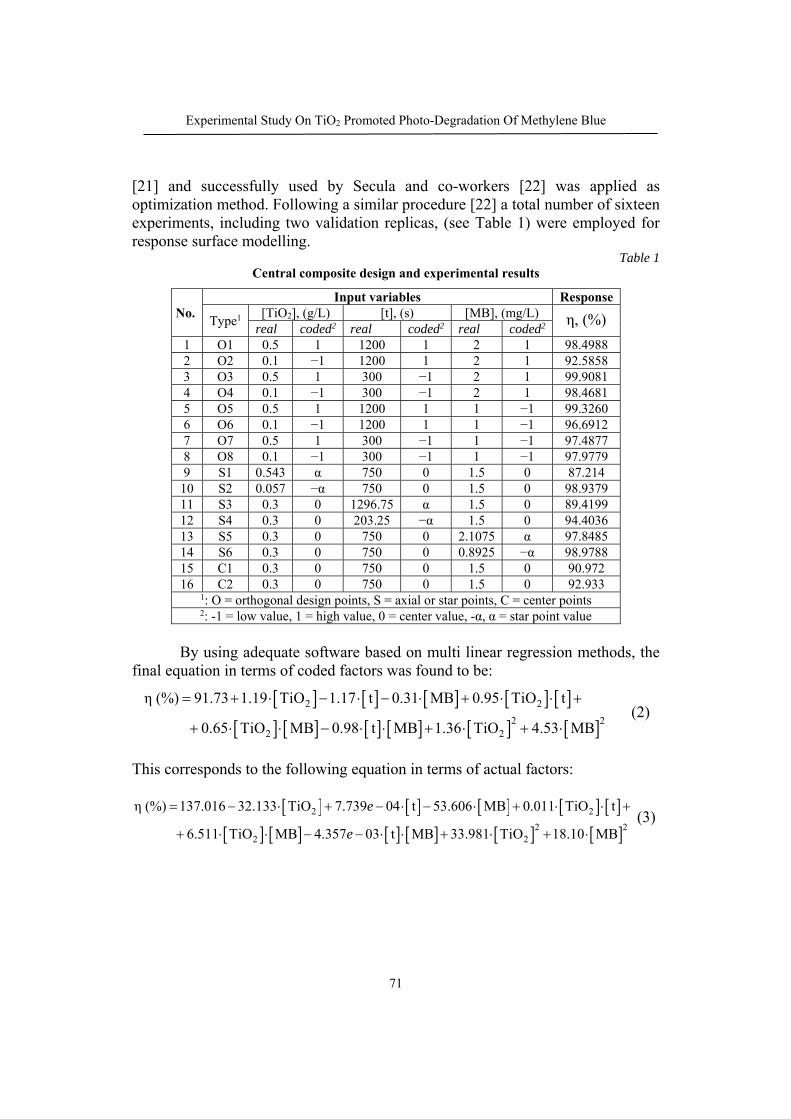
Experimental Study On TiO2 Promoted Photo-Degradation Of Methylene Blue
71
[21] and successfully used by Secula and co-workers [22] was applied as optimization method. Following a similar procedure [22] a total number of sixteen experiments, including two validation replicas, (see Table 1) were employed for response surface modelling.
Table 1 Central composite design and experimental results
No. Input variables Response
Type1 [TiO2], (g/L) [t], (s) [MB], (mg/L) η, (%) real coded2 real coded2 real coded2
1 O1 0.5 1 1200 1 2 1 98.4988 2 O2 0.1 −1 1200 1 2 1 92.5858 3 O3 0.5 1 300 −1 2 1 99.9081 4 O4 0.1 −1 300 −1 2 1 98.4681 5 O5 0.5 1 1200 1 1 −1 99.3260 6 O6 0.1 −1 1200 1 1 −1 96.6912 7 O7 0.5 1 300 −1 1 −1 97.4877 8 O8 0.1 −1 300 −1 1 −1 97.9779 9 S1 0.543 α 750 0 1.5 0 87.214
10 S2 0.057 −α 750 0 1.5 0 98.9379 11 S3 0.3 0 1296.75 α 1.5 0 89.4199 12 S4 0.3 0 203.25 −α 1.5 0 94.4036 13 S5 0.3 0 750 0 2.1075 α 97.8485 14 S6 0.3 0 750 0 0.8925 −α 98.9788 15 C1 0.3 0 750 0 1.5 0 90.972 16 C2 0.3 0 750 0 1.5 0 92.933
1: O = orthogonal design points, S = axial or star points, C = center points 2: -1 = low value, 1 = high value, 0 = center value, -α, α = star point value
By using adequate software based on multi linear regression methods, the
final equation in terms of coded factors was found to be:
2 2
2 22 2
η (%) 91.73 1.19 TiO 1.17 t 0.31 MB 0.95 TiO t
0.65 TiO MB 0.98 t MB 1.36 TiO 4.53 MB
(2)
This corresponds to the following equation in terms of actual factors:
2 2
2 22 2
η (%) 137.016 32.133 TiO 7.739 04 t 53.606 MB 0.011 TiO t
6.511 TiO MB 4.357 03 t MB 33.981 TiO 18.10 MB
e
e
(3)

Alexandru I. Atomi, Gabriel D. S, Adrian C. Puiţel, Mircea T. Nechita
72
Fig. 3. The response surface plot at [t] = 750 (s)
Fig. 4. The contour-line plot at [t] = 750 (s)

Experimental Study On TiO2 Promoted Photo-Degradation Of Methylene Blue
73
The response surface plot and the contour-line plot of the predicted MB degradation efficiency as a function of initial concentrations of titania, the initial concentration of methylene blue and UV irradiation time are presented in Fig. 3 and Fig. 4.
According to this method the optimal values (theoretically) of the considered variables are: [TiO2] = 0.48 (g/L), [MB] = 2 (mg/L) and [t] = 308.76 (s) that leads to 99.934 % efficiency. Three independent experiments were performed in order to check the validity of the method. The best outcome from the efficiency point of view was 99.778 %.
6. Conclusions
The performances of a commercial variety of titania powder was experimentally investigated towards photochemical degradation of methylene blue. Three variables were particularly surveyed during the experiments: the initial titania concentration [TiO2], the initial methylene blue concentration [MB] and the UV irradiation time [t]. By using the response surface method, the optimum values of these three parameters were identified, as follows: [TiO2] = 0.48 [g/L], [MB] = 2 [mg/L] and [t] = 308.76 [s].
The results are promising and the subsequent studies will be focused on the kinetics of MB degradation, degradation mechanism and influence of other parameters such temperature, pH, particles (pores) size of TiO2.
REFERENCES
[1] Hashimoto K., Irie H., Fujishima A., TiO2 Photocatalysis: A Historical Overview and Future
Prospects. Japanese Journal of Applied Physiscs, 44(12), (2005), 8269-8285. [2] Nakata K., Fujishima A., TiO2 photocatalysis: Design and applications, Journal of
Photochemistry and Photobiology C: Photochemistry Reviews, 13, (2012), 169-89. [3] Ohtani B., Preparing Articles on Photocatalysis—Beyond the Illusions, Misconceptions, and
Speculation, Chemistry Letters,3(3), (2008), 217-229. [4] Sudhir S.A., Ranjit R. H., Uttamrao P.M., Bina N.W., Dinesh P.A., Suresh B.W., Preparation,
characterization and photocatalytic activity of TiO2 towards methylene blue degradation. Materials Science and Engineering B, 168, (2010), 90-94.
[5] Randorn C., Wongnawa S., Boonsin P., Bleaching of Methylene Blue by Hydrated Titanium Dioxide, Science Asia, 30, (2004), 149-56.
[6] Lakshmi S., Renganathan R., Fujita S., Study on TiO2-mediated photocatalytic degradation of methylene blue, Journal of Photochemistry and Photobiology A: Chemistry, 88, (1995), 163-67.
[7] Ohtani B., Photocatalysis A to Z—What we know and what we do not know in a scientific sense, Journal of Photochemistry and Photobiology C: Photochemistry Reviews, 11, (2010), 157-178.

Alexandru I. Atomi, Gabriel D. S, Adrian C. Puiţel, Mircea T. Nechita
74
[8] Hurum C.D., Agrios G.A., Gray A. K., Rajh T., Thurnauer C. M., Explaining the Enhanced Photocatalytic Activity of Degussa P25 Mixed-Phase TiO2 Using EPR, Journal of Physical Chemistry B, 107, (2003), 4545-4549.
[9] Luttrell T., Halpegamage S., Tao J., Kramer A., Sutter E., Batzill M., Why is anatase a better photocatalyst than rutile? - Model studies on epitaxial TiO2 films, Scientific Reports, 4 (2014), 4043.
[10] Ohama Y., van Gemert D., Application of Titanium Dioxide Photocatalysis to Construction Materials, Springer, 2011.
[11] Smits M., Chan C. K., Tytgat T., Craeye B., Costarramone N., Lacombe S., Lenaerts S., Photocatalytic degradation of soot deposition: Self-cleaning effect on titanium dioxide coated cementitious materials, Chemical Engineering Journal, 222, (2013), 411-418.
[12] Diamanti M.V., Del Curto B., Ormellese M., Pedeferri M.P., Photocatalytic and self-cleaning activity of colored mortars containing TiO2, Construction and Building Materials 46, (2013), 167-174.
[13] Berto A. M., Ceramic tiles: Above and beyond traditional applications, Journal of the European Ceramic Society, 27, (2007), 1607–1613.
[14] Pinho L., Elhaddad F., Facio S. D., Mosquera J. M., A novel TiO2–SiO2 nanocomposite converts a very friable stone into a self-cleaning building material, Applied Surface Science, 275, (2013), 389–396.
[15] Chen M., Chu J.-W., NOx photocatalytic degradation on active concrete road surface d from experiment to real-scale application, Journal of Cleaner Production, 19, (2011), 1266-1272.
[16] Hassan M. M., Dylla H., Mohammad N. L., Rupnow T., Evaluation of the durability of titanium dioxide photocatalyst coating for concrete pavement, Construction and Building Materials, 24, (2010), 1456–1461.
[17] Graziani L, Quagliarini E., Bondioli F., D’Orazio M., Durability of self-cleaning TiO2 coatings on fired clay brick façades: Effects of UV exposure and wet & dry cycles, Building and Environment, 71, (2014), 193-203.
[18] Ballari M.M., Brouwers H.J.H., Full scale demonstration of air-purifying pavement, Journal of Hazardous Materials, 254– 255, (2013), 406– 414.
[19] Mills A., Hill C., Robertson P.K.J., Overview of the current ISO tests for photocatalytic materials, Journal of Photochemistry and Photobiology A: Chemistry, 237, (2012), 7-23.
[20] ISO10678:2010, Fine ceramics (advanced ceramics, advanced technical ceramics) - Determination of photocatalytic activity of surfaces in an aqueous medium by degradation of methylene blue, 2010.
[21] Box G. E. P., Hunter J. S., Multi-Factor Experimental Designs for Exploring Response Surfaces, The Annals of Mathematical Statistics, 28(1), (1957), 195-241.
[22] Secula M.S., Suditu G.D., Poulios I., Cojocaru C., Cretescu I., Response surface optimization of the photocatalytic decolorization of a simulated dyestuff effluent, Chemical Engineering Journal, 141, (2008), 18-26.
Bulletin of Romanian Chemical Engineering Society, Vol. 5, No 1, 2018 ISSN 2360-4697
75
ELECTROCHEMICAL STUDIES ON REINFORCED BTSE COATINGS DEPOSITED ON ANODIZED ALUMINIUM
Ioana-Alina CIOBOTARU, Oana-Claudia CIOBOTEA BARBU, Anca COJOCARU, Ioana MAIOR, Florin-Mihai BENGA1
and Danut-Ionel VAIREANU
University Politehnica of Bucharest, Faculty of Applied Chemistry and Materials Science, Depart. of Inorganic Chemistry, Physical Chemistry and Electrochemistry, 1-7 Polizu Street, 011061, Bucharest, Romania
Abstract. This paper discusses the properties of the 5% BTSE films reinforced with cerium sulphate,
deposited on a pre-treated aluminium substrate. The pre-treatment applied to the aluminium substrate prior to the silane film deposition consists of an anodisation process performed in acidic media. In order to determine the substrate properties and the anticorrosive properties of the reinforced 5% BTSE films, one has employed several techniques such as scanning electron microscopy, electrochemical impedance spectroscopy and potentiodynamic polarization.
Key words: reinforced BTSE films, SEM, EIS, potentiodynamic polarization
1. Introduction
This paper presents a method for the improvement of BTSE films deposited on aluminium substrate, consisting in the pre-treatment of the substrate and reinforcement of silane films.
The improvement of protective properties of silane films is usually obtained by adding various materials and additives with corrosion inhibiting properties such as silica particles, titanium, titanium dioxide, silicon carbide and cerium-based compounds [1- 8].
In addition to the use of the above mentioned particles, issues regarding the substrate pre-treatment, the deposition time, and films curing regime should be given proper consideration [9 - 11].
One of the methods used for aluminium substrate pre-treatment consists of modifying the deposition surface by anodisation, thus contributing to the improvement of silane film adhesion to the metallic substrate. One may control the pores array and form, thus improving the films adhesion to the metallic substrate used as deposition substrate [8].
1 Corresponding author: Email address: [email protected]
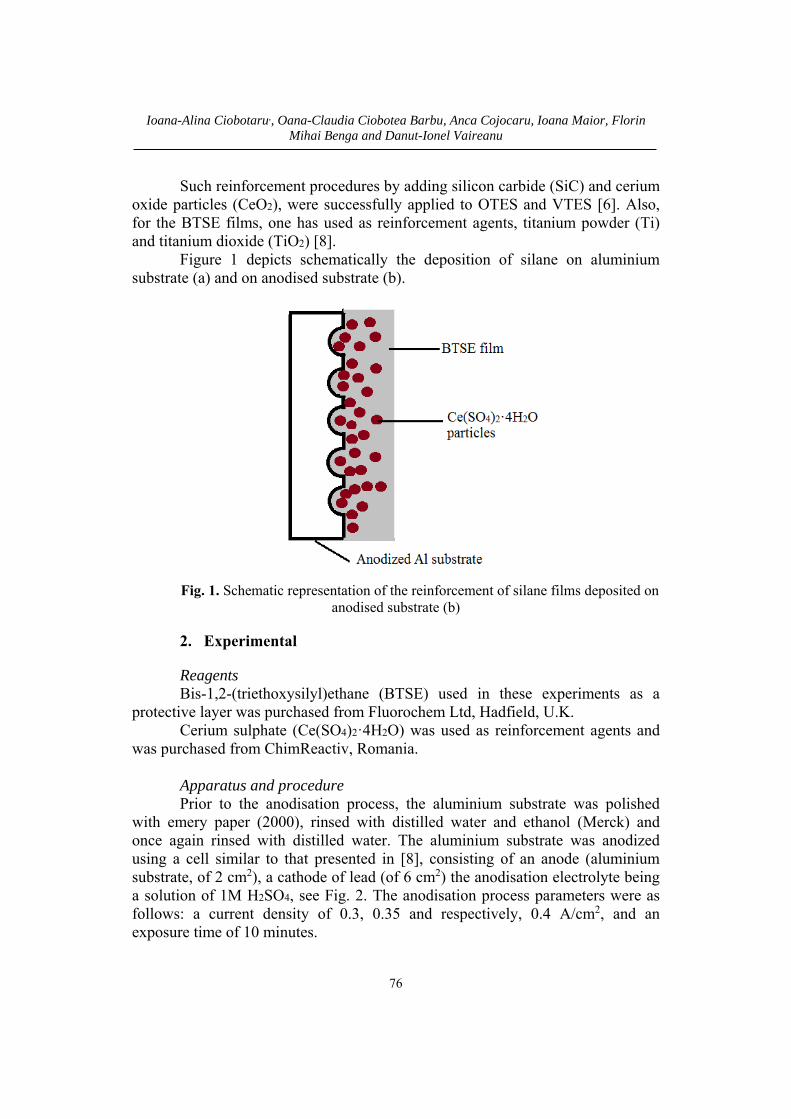
Ioana-Alina Ciobotaru,, Oana-Claudia Ciobotea Barbu, Anca Cojocaru, Ioana Maior, Florin Mihai Benga and Danut-Ionel Vaireanu
76
Such reinforcement procedures by adding silicon carbide (SiC) and cerium oxide particles (CeO2), were successfully applied to OTES and VTES [6]. Also, for the BTSE films, one has used as reinforcement agents, titanium powder (Ti) and titanium dioxide (TiO2) [8].
Figure 1 depicts schematically the deposition of silane on aluminium substrate (a) and on anodised substrate (b).
Fig. 1. Schematic representation of the reinforcement of silane films deposited on
anodised substrate (b)
2. Experimental
Reagents Bis-1,2-(triethoxysilyl)ethane (BTSE) used in these experiments as a
protective layer was purchased from Fluorochem Ltd, Hadfield, U.K. Cerium sulphate (Ce(SO4)2ꞏ4H2O) was used as reinforcement agents and
was purchased from ChimReactiv, Romania.
Apparatus and procedure Prior to the anodisation process, the aluminium substrate was polished
with emery paper (2000), rinsed with distilled water and ethanol (Merck) and once again rinsed with distilled water. The aluminium substrate was anodized using a cell similar to that presented in [8], consisting of an anode (aluminium substrate, of 2 cm2), a cathode of lead (of 6 cm2) the anodisation electrolyte being a solution of 1M H2SO4, see Fig. 2. The anodisation process parameters were as follows: a current density of 0.3, 0.35 and respectively, 0.4 A/cm2, and an exposure time of 10 minutes.

Electrochemical studies on reinforced BTSE coatings deposited on anodized aluminium
77
Fig. 2. The electrochemical cell used for the anodisation of the aluminium substrate 1. Container with electrolyte solution; 2. Aluminium substrate; 3. Lead electrode;
4. Variable resistance; 5. CC generator; 6. Voltmeter; 7. Ammeter.
The deposition silane solution consisted of a 5% BTSE solution in a 50:50 (v:v) mixture of ethanol (Merck) and distilled water and a Ce(SO4)2ꞏ4H2O load of 1g/L. The film deposition was performed at the optimum hydrolysis time of the 5% BTSE solution, this value being determined using the optimisation procedure largely described in [12]. In order to avoid the sedimentation of suspended particles, the deposition suspension was kept in equilibrium using a 40 KHz Condel 3106 ultrasound bath.
The deposited films were subjected to a curing treatment for 24 hours, at room temperature.
Scanning electron microscopy was performed with a Carl Zeiss Merlin Gemini II microscope with an Oxford Instruments X-Max EDS detector. The parameters of the SEM analysis were: analysis time 2 minutes, energy of the electron beam 5-15kV, current on sample, Iprobe, 1nA, and the working distance between the column and sample varied between 8.2 and 8.7mm.
For the electrochemical characterisation of the deposited films, a standard three electrode electrochemical cell was employed, consisting of a saturated Ag/AgCl electrode (reference electrode, Radiometer Analytical), a 5 cm2 platinum mesh (counterelectrode, Radiometer Analytical), a working electrode of coated aluminium and a 3.5% NaCl electrolyte solution (Sigma Aldrich).
The electrochemical impedance spectroscopy was performed using a 10 mV sinusoidal potential perturbation overimposed on to the free potential, the scanning frequency upper limit being 100 kHz and the lower limit 100 mHz, the acquisition rate being of 10 measurements/decade.
The potentiodynamic polarisation tests were performed by scanning the potential between the potential window (vs. sat Ag/AgCl electrode) located between -1V and 0.5V, with a scan rate of 10 mV/minute.
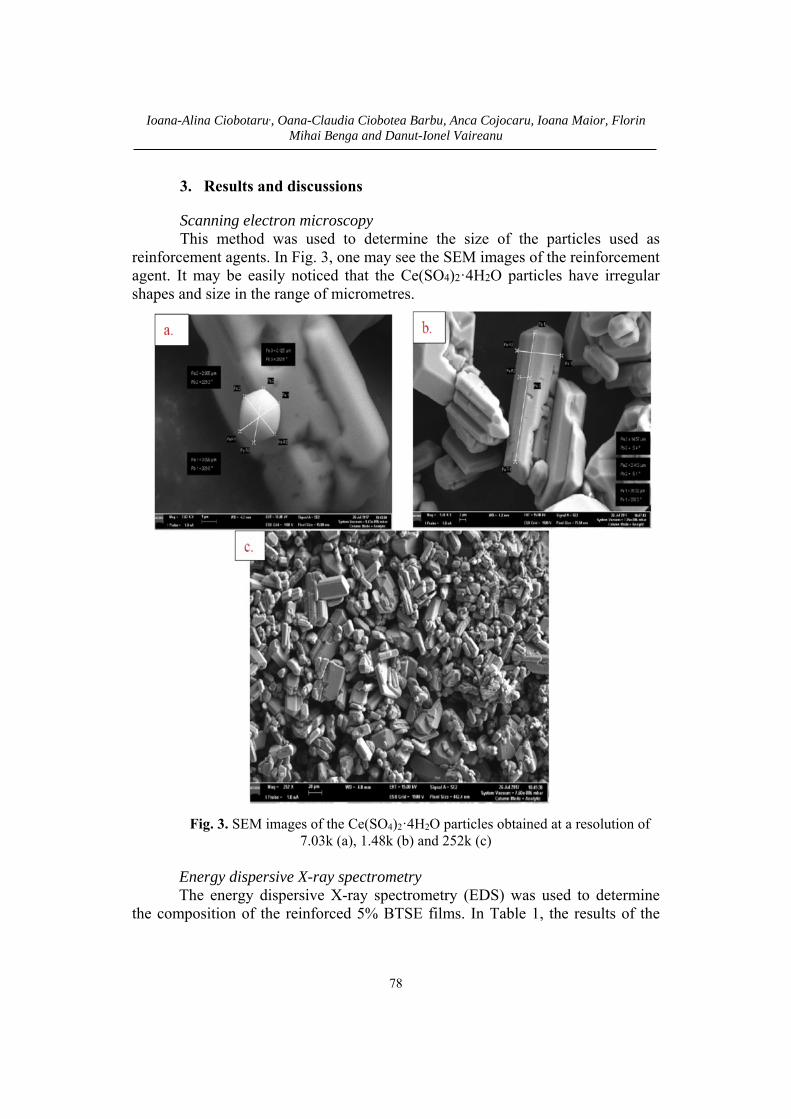
Ioana-Alina Ciobotaru,, Oana-Claudia Ciobotea Barbu, Anca Cojocaru, Ioana Maior, Florin Mihai Benga and Danut-Ionel Vaireanu
78
3. Results and discussions
Scanning electron microscopy This method was used to determine the size of the particles used as
reinforcement agents. In Fig. 3, one may see the SEM images of the reinforcement agent. It may be easily noticed that the Ce(SO4)2ꞏ4H2O particles have irregular shapes and size in the range of micrometres.
Fig. 3. SEM images of the Ce(SO4)2ꞏ4H2O particles obtained at a resolution of
7.03k (a), 1.48k (b) and 252k (c) Energy dispersive X-ray spectrometry The energy dispersive X-ray spectrometry (EDS) was used to determine
the composition of the reinforced 5% BTSE films. In Table 1, the results of the

Electrochemical studies on reinforced BTSE coatings deposited on anodized aluminium
79
EDS are shown. One may see that the composition of the reinforced films is quite similar for the analysed samples and that the content of Ce is found only in traces.
Table 1
The composition of the 5% BTSE films reinforced with Ce(SO4)2ꞏ4H2O particles
Anodisation parameters
Composition of the films, (%w) O Al Si S Ce
i=0.3A/cm2, t=10min 49 44 2 5 traces i=0.35A/cm2, t=10min 49 44 2 5 traces i=0.4A/cm2, t=10min 49 43 3 5 traces
One may see that the composition of the substrate has changed after the
anodisation process, consisting in a decreased content in aluminium and an increased one in oxygen comparing to the untreated substrate (81.83% Al, 15.24% C) [12].
Electrochemical impedance spectroscopy In Fig. 4, one may see the Nyquist representations of the 5% BTSE films
reinforced with Ce(SO4)2ꞏ4H2O and deposited on anodised aluminium substrate.
0 50 100 150 200 250 3000
100
200
300
BTSE 5%+Ce(SO4)
2ꞏ4H
2O_t=10min_i=0.3A/cm2(1)
BTSE 5%+Ce(SO4)
2ꞏ4H
2O_t=10min_i=0.35A/cm2(2)
BTSE 5%+Ce(SO4)
2ꞏ4H
2O_t=10min_i=0.4A/cm2(3)
-Zi (
koh
mꞏc
m2 )
Zr (kohmꞏcm2)
0,00 0,05 0,10 0,15 0,20 0,250,00
0,05
0,10
0,15
0,20
0,25
-Zi (
koh
mꞏc
m2 )
Zr (kohmꞏcm2)
Fig. 4. Nyquist plots of the 5% BTSE films reinforced with Ce(SO4)2ꞏ4H2O and
deposited on anodised aluminium substrate, for 10 minutes at a current density of: (1). i=0.3A/cm2, (2). i=0.35A/cm2, (3). i=0.35A/cm2

Ioana-Alina Ciobotaru,, Oana-Claudia Ciobotea Barbu, Anca Cojocaru, Ioana Maior, Florin Mihai Benga and Danut-Ionel Vaireanu
80
In Table 2 are shown the EIS results of the 5% BTSE films reinforced with
Ce(SO4)2ꞏ4H2O and deposited on anodised aluminium substrate. One may compare the value of the polarisation resistance (196.1 kohmꞏcm2) of the 5% BTSE film deposited onto an aluminium substrate and cured at room temperature, that was published in a previous study [12] with the values of the polarization resistance obtained for the reinforced BTSE films. One may see that the pre-treatment of the surface by anodisation and the reinforcement of the films lead to an increase, up to 10 times, in the polarisation resistance of the obtained films, meaning that the reinforced BTSE films deposited on an anodized substrate have higher anticorrosive properties than the ones without reinforcement and deposited on aluminium substrate. In order to validate the EIS experimental data, one has applied the model described in [13]. This model involves the computing of the validation coefficient (kVD) using the Pearson coefficient (rcritic) computed for α=0.05. The values of the determination coefficient (R2), associated to the regression equations for each Nyquist plot, of the Pearson coefficient and that of the validation coefficient are shown in Table 2. The computed values of the validation coefficient are between 0.689 and 0.731, values that validate the experimental determinations.
Table 2
The values of the polarisation resistance and capacitance of the 5% BTSE films reinforced with Ce(SO4)2ꞏ4H2O particles
Anodisation parameters Rp, kohmꞏcm2
C, nF/cm2
No of points
R2 rcritic kVD
i=0.3A/cm2, t=10min 1987 400.4 57 0.920 0.261 0.728 i=0.35A/cm2, t=10min 1855 135.5 52 0.773 0.273 0.689 i=0.4A/cm2, t=10min 1336 1191.0 60 0.892 0.254 0.731
Potentiodynamic polarisation In Fig. 5, are presented the Tafel plots of the 5% BTSE films reinforced
with Ce(SO4)2ꞏ4H2O and deposited on anodised aluminium substrate. The pre-treatment of the aluminium substrate by anodisation and the
reinforcement of the BTSE films have improved the anticorrosive properties of the BTSE films. The potentiodynamic polarisation is a destructive technique that offers information about the corrosion resistance of the deposited films, through parameters such as corrosion rate and corrosion current density. The obtained films have better anticorrosive properties if the corrosion rate and corrosion current density have low values. From Table 3, one may see that the values of the corrosion rate are of nm/year, while the values of the corrosion current density are of nA/cm2, values that indicate good barrier properties.
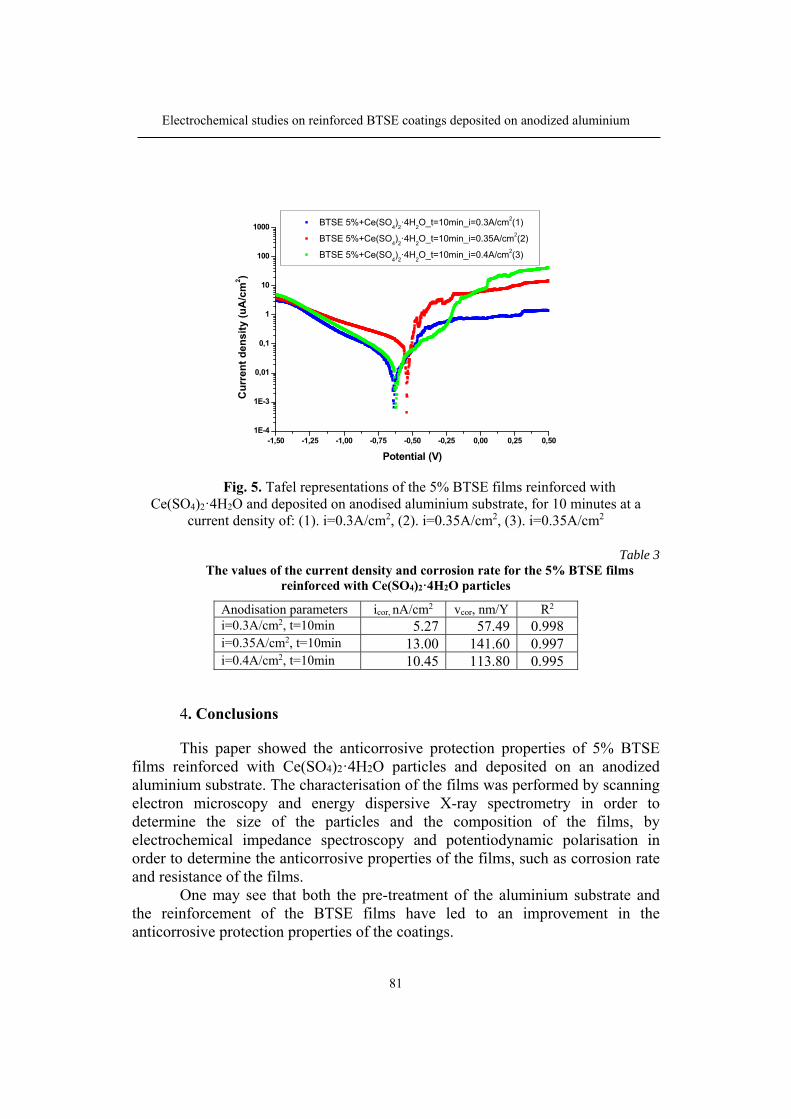
Electrochemical studies on reinforced BTSE coatings deposited on anodized aluminium
81
-1,50 -1,25 -1,00 -0,75 -0,50 -0,25 0,00 0,25 0,501E-4
1E-3
0,01
0,1
1
10
100
1000 BTSE 5%+Ce(SO4)2ꞏ4H
2O_t=10min_i=0.3A/cm2(1)
BTSE 5%+Ce(SO4)2ꞏ4H
2O_t=10min_i=0.35A/cm2(2)
BTSE 5%+Ce(SO4)2ꞏ4H
2O_t=10min_i=0.4A/cm2(3)
Cu
rren
t d
ensi
ty (
uA
/cm
2)
Potential (V)
Fig. 5. Tafel representations of the 5% BTSE films reinforced with
Ce(SO4)2ꞏ4H2O and deposited on anodised aluminium substrate, for 10 minutes at a current density of: (1). i=0.3A/cm2, (2). i=0.35A/cm2, (3). i=0.35A/cm2
Table 3
The values of the current density and corrosion rate for the 5% BTSE films reinforced with Ce(SO4)2ꞏ4H2O particles
Anodisation parameters icor, nA/cm2 vcor, nm/Y R2
i=0.3A/cm2, t=10min 5.27 57.49 0.998 i=0.35A/cm2, t=10min 13.00 141.60 0.997 i=0.4A/cm2, t=10min 10.45 113.80 0.995
4. Conclusions
This paper showed the anticorrosive protection properties of 5% BTSE films reinforced with Ce(SO4)2ꞏ4H2O particles and deposited on an anodized aluminium substrate. The characterisation of the films was performed by scanning electron microscopy and energy dispersive X-ray spectrometry in order to determine the size of the particles and the composition of the films, by electrochemical impedance spectroscopy and potentiodynamic polarisation in order to determine the anticorrosive properties of the films, such as corrosion rate and resistance of the films.
One may see that both the pre-treatment of the aluminium substrate and the reinforcement of the BTSE films have led to an improvement in the anticorrosive protection properties of the coatings.

Ioana-Alina Ciobotaru,, Oana-Claudia Ciobotea Barbu, Anca Cojocaru, Ioana Maior, Florin Mihai Benga and Danut-Ionel Vaireanu
82
Acknowledgements
Special thanks go to Mr. Corneliu Andrei for providing the logistic support and to Mrs. Mariana Andrei for supplying the necessary reagents. Miss Oana Claudia Ciobotea-Barbu and Mr. Florin-Mihai Benga are financially supported by the Ministry of National Education of Romania. The SEM analysis was performed at MICROCOSMOS Laboratory from Geological Institute of Romania.
REFERENCES
[1]. Liu L., Hu J-M., Zhang J-. Cao C-N., Improving the formation and protective properties of silane films by the combined use of electrodeposition and nanoparticles incorporation, Electrochimica Acta, 52, 2006, pp. 538-545;
[2]. Montemor M.F., Ferreira M.G.S., Analytical characterization of silane films modified with cerium activated nanoparticles and its relation with the corrosion protection of galvanised steel substrates, Progress in Organic Coating, 62, 2008, pp. 330-337;
[3]. Trabelsi W., Cecilio P., Ferreira M.G.S., Montemor M.F., Electrochemical assessment of the self-healing properties of Ce-doped silane solutions for the pre-treatment of galvnised steel substrates, Progress in Organic Coatings, 54, 2005, pp. 276-284.
[4]. Montemor M.F., Pinto R., Ferreira M.G.S., Chemical composition and corrosion protection of silane films with CeO2 nanoparticles, Electrochimica Acta, 54, 2009, pp. 5179-5189;
[5]. Chen S., Cai Y., Zhuang C., Yu M., Song X., Zhang Y., Electrochemical behaviour and corrosion protection performance of bis-[triethoxysilylpropyl]tetrasulfidesilane films modified with TiO2 sol on 304 stainless steel, Applied Surface Science, 331, 2015, pp. 315-326;
[6]. Maior I., Ciobotaru I.-A., Căprărescu S., Cojocaru A., Vaireanu D.-I., Electrochemical studies on modified organo-silanes composite coating for aluminium corrosion inhibition, Studia Universitatis Babes-Bolyai Chemia, LX, 2015, pp. 87-98;
[7]. Suegama P.H., De Melo H.G., Recco A.A.C., Tschiptschin A.P., Aoki I.V., Corrosion behaviour of carbon steel protected with single and bi-layer of silane films filled with silica nanoparticles, Surface and Coatings Technology, 202, 2008, pp. 2850-2858;
[8]. Ciobotaru I.A., Ciobotea-Barbu O.C., Benga F.M, Vaireanu D.I. Characterisation of reinforced BTSE films deposited on anodized aluminium substrate, Revista de Chimie, 69, 2018, In press;
[9]. van Ooij W.J., Zhu D., Stacy M., Seth A., Mugada T., Gandhi J., Puomi P., Corrosion protection properties of organofunctional silanes: An overview, Tsinghua Science and Technology, 10, 2005, pp. 639-664;
[10]. Hu J-M., Liu L., Zhang J-. Cao C-N., Electrodeposition of silane films on aluminium alloys for corrosion protection, Progress in Organic Coating, vol. 58, 2007, pp. 265-271;
[11]. Ciobotaru I.A., Maior I., Vaireanu D.I., Cojocaru A., Caprarescu S., Ciobotaru I.E., The determination of the optimum hydrolysis time for silane films deposition, Applied Surface Science, 371, 2016, pp. 275-280;
[12]. Ciobotaru I.A., Ciobotea-Barbu O.C., Vaireanu D.I., Ciobotaru I.E., The influence of the curing temperature on the properties of some silane films, Revista de Chimie, 68, 7, 2017, pp. 1413-1418;
[13]. Ciobotaru I.A., Vaireanu D.I., Considerations regarding a novel coefficient for electrochemical impedance spectroscopy data validation, Bulletin of Romanian Chemical Engineering Society, 1, 2, 2014, pp. 123-134.

Bulletin of Romanian Chemical Engineering Society, Vol 5, No 1, 2018 ISSN 2360-4697
83
KINETICS OF COPPER ETCHING WITH AMMONIUM PERSULFATE
Alexandru BOSCORNEA, Tănase DOBRE, Oana Cristina PÂRVULESCU, Cristian Eugen RĂDUCANU
Department of Chemical and Biochemical Engineering, Faculty of Applied Chemistry and Materials Science, University Politehnica of Bucharest, 1-7 Gh.
Polizu Street, 011061, Bucharest, Romania
Abstract Copper etching represents an important application in processing of printed circuit
boards for computers or other electronic devices. This paper has aimed at determining the etching rate of copper in the presence of ammonium persulfate and sulfuric acid. Correlations between the copper flux and process factors in terms of ammonium persulfate concentration, sulfuric acid concentration, and temperature of etching solution were established by a theoretical study as well as by a 23 statistical model based on the experimental data. These correlations could be used to control the etching process with ammonium persulfate and sulfuric acid solutions.
Key words: ammonium persulfate, copper etching, etching flux, 23 factorial experiment, modelling
1. Introduction
The etching represents the removal of material from the surface of a solid, usually performed by a chemical route. Before developing the computer technology and high density electronic devices, the etching was limited to the application of an acid solution to a metal, e.g., in the manufacture of audevelopment, which began since the middle of the last century, chemical engraving has been embedded in the technological processes of electronic industry, including printed circuit boards (PCBs) and components manufactured using metal oxide substrate (MOS) technology [2]. In order to highlight the role of etching in manufacturing of electronics, a schema of subtractive fabrication of a double-sided PCB with through-hole metallization is shown in Fig. 1. In this case the copper etching is the last stage of PCB fabrication and the control of etching flux, defined as copper mass removed from the unit of surface in the unit of time, is essential for obtaining a suitable product [3].
Corresponding author: E-mail address: [email protected]
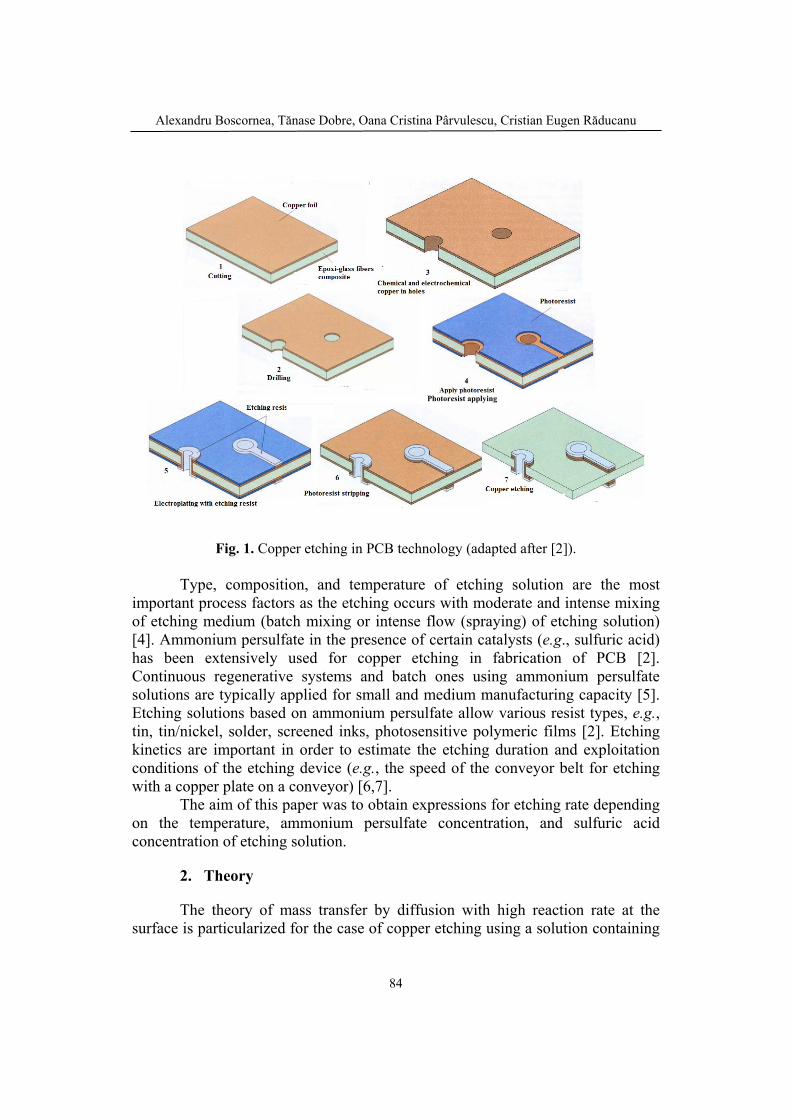
Alexandru Boscornea, Tănase Dobre, Oana Cristina Pârvulescu, Cristian Eugen Răducanu
84
Fig. 1. Copper etching in PCB technology (adapted after [2]).
Type, composition, and temperature of etching solution are the most
important process factors as the etching occurs with moderate and intense mixing of etching medium (batch mixing or intense flow (spraying) of etching solution) [4]. Ammonium persulfate in the presence of certain catalysts (e.g., sulfuric acid) has been extensively used for copper etching in fabrication of PCB [2]. Continuous regenerative systems and batch ones using ammonium persulfate solutions are typically applied for small and medium manufacturing capacity [5]. Etching solutions based on ammonium persulfate allow various resist types, e.g., tin, tin/nickel, solder, screened inks, photosensitive polymeric films [2]. Etching kinetics are important in order to estimate the etching duration and exploitation conditions of the etching device (e.g., the speed of the conveyor belt for etching with a copper plate on a conveyor) [6,7].
The aim of this paper was to obtain expressions for etching rate depending on the temperature, ammonium persulfate concentration, and sulfuric acid concentration of etching solution.
2. Theory
The theory of mass transfer by diffusion with high reaction rate at the surface is particularized for the case of copper etching using a solution containing
Photoresist applying

Kinetics of copper etching with ammonium persulfate
85
ammonium persulfate (A) and sulfuric acid (B). Reactions (1)-(4) in the bulk solution and reactions (5) and (6) at etching surface were considered. Summing up the reactions (1)-(6), the global reaction (7) was obtained, where ammonium persulfate (A) reacts with Cu resulting in copper sulfate (C) and ammonium sulfate (D). It is observed that the sulfuric acid (B) is a catalyst in the etching process.
(NH4)2S2O8 ↔ 2NH4+ + S2O8
-2 (1) S2O8
-2 + H2SO4 → H2SO5 +SO4-2 + SO3 (2)
SO3 + H2O → H2SO4 (3) H2SO5 → H2SO4 + O● (4) Cu + O● → CuO (5) CuO + H2SO4 → CuSO4 + H2O (6) (NH4)2S2O8 + Cu → (NH4)2SO4 + CuSO4 (7)
According to this mechanism, species flow rates and concentrations are presented in Fig. 2. For a small surface of copper plate and a large volume of etching solution, values of bulk copper sulfate concentration (CC∞) can be considered zero.
Fig. 2. Species flow rates (N) and concentrations (c) for copper etching with ammonium persulfate (subscripts: (A) ammonium persulfate, (B) sulfuric acid, (C) copper sulfate, (s)
surface, (∞) bulk; (zf) thickness of boundary layer).
Copper sulfate flux, NC (kg/(m2ꞏs)), can be determined by Eq. (8), where cl (kg/m3) is mass concentration of etching solution, DC (m2/s) diffusion coefficient of copper sulfate, and ωC mass fraction of copper sulfate. Expressions (9) and (10), established according to global reaction (7) and data depicted in Fig. 2, were
NA
NB
NB
NC
cA∞
cAs
cCs
cC∞
zf
z

Alexandru Boscornea, Tănase Dobre, Oana Cristina Pârvulescu, Cristian Eugen Răducanu
86
substituted into Eq. (8) resulting in differential equation (11) and its integration based on boundary conditions (12) and (13) led to Eq. (14). Assuming ωC∞=0 (corresponding to a small surface of copper plate and a large volume of etching solution), Eq. (14) became Eq. (15). Substituting Eq. (16), expressing the series development of ln(1-ωCs), into Eq. (14), and considering only the first term of the series, Eq. (17) was obtained, where cCs (kg/m3) is the mass concentration of copper sulfate at etching surface.
Taking into account Eqs. (17)-(20), copper etching flux, NCu (kg/(m2ꞏs)), is given by Eq. (21), where t (C) is the etching temperature, α0, β (1/K), γ (m3/kg), and DC0 (m2/s) are constants, MC and MCu (kg/kmole) represent the molar masses of copper sulphate and copper, respectively. It is observed that NCu depends on cA∞, cA∞t, cA∞cB∞, and cA∞cB∞t. Values of unknown parameters in Eq. (21) can be determined by an experimental study of etching process.
)( DCBACC
ClC NNNNdz
dDcN
(8)
DCA NNN (9)
0BN (10)
dz
dDcN C
C
ClC
1 (11)
CsCz :0 (12)
CCfzz : (13)
C
Cs
f
ClC z
DcN
1
1ln (14)
Csf
ClC z
DcN 1ln (15)
.............432
1ln432
CsCsCsCsCs
(16)
Csf
CCs
f
ClC c
z
D
z
DcN (17)
ACs cc (18)
Bc 0 (19)
)1(0 tDD CC (20)
)( 000 tcccctccMz
MDN BABAAA
Cf
CuCCu (21)

Kinetics of copper etching with ammonium persulfate
87
3. Experimental
The process of copper etching with a solution of ammonium persulfate (Merck, Germany) in the presence of sulfuric acid (Merck, Germany) was studied using the setup shown in Fig. 3. Experimental runs (1-11 in Table 1) were conducted according to a 23 experimental plan, where the temperature (t), ammonium persulfate concentration (cA), and sulfuric acid concentration (cB) were selected as process factors. Dimensionless factors are given by Eqs. (22)-(24), where tcp=30 °C, cA,cp=112.5 kg/m3, and cB,cp=11.25 kg/m3 are centre-points. Natural and dimensionless factors are summarized in Table 1. Measurement principle consisted in determining the mass loss of a copper sample (high purity flat plate) in a time interval (∆τ). Experimental copper flux, NCu (kg/(m2ꞏs)), was determined by Eq. (25), where mτ and mτ+∆τ (kg) are the sample masses at time τ and τ+∆τ (s), respectively, and S=0.0024 m2 is the sample surface area.
Fig. 3. Basic principle of experimental setup for characterization of copper
etching with ammonium persulfate solution.
10
301
tx (22)
5.37
5.1122
Ac
x (23)

Alexandru Boscornea, Tănase Dobre, Oana Cristina Pârvulescu, Cristian Eugen Răducanu
88
75.3
25.113
Bc
x (24)
S
mmNCu (25)
For each experimental run specified in Table 1, 10 successive
measurements of copper sample mass were performed (every 6 min for 1 h) and copper flux (NCu), was determined for each measurement. Values of NCu determined by Eq. (25) for experimental run 7 in Table 1 (t=40 °C, cA=150 kg/m3, and cB=7.5 kg/m3) are listed in Table 2.
Table 1 Natural and dimensionless factors for copper etching with ammonium persulfate solution
Run t
(°C) cA
(kg/m3) cB
(kg/m3) x1 x2 x3
1 20 75 7.5 -1 -1 -1 2 20 75 15 -1 -1 1 3 20 150 7.5 -1 1 -1 4 20 150 15 -1 1 1 5 40 75 7.5 1 -1 -1 6 40 75 15 1 -1 1 7 40 150 7.5 1 1 -1 8 40 150 15 1 1 1 9 30 112.5 11.25 0 0 0
10 30 112.5 11.25 0 0 0 11 30 112.5 11.25 0 0 0
Table 2
Values of sample mass and copper flux for experimental run 7 in Table 1
Run t
(°C) cA
(kg/m3) cB
(kg/m3) No.
τ (min)
mτ (g)
mτ+∆τ (g)
NCu (kg/(m2ꞏs))
7 40 150 7.5
1 6 2.501 2.435 7.64E-05 2 12 2.435 2.243 2.22E-04 3 18 2.243 2.042 2.33E-04 4 24 2.042 1.870 1.99E-04 5 30 1.870 1.677 2.23E-04 6 36 1.677 1.514 1.89E-04 7 42 1.514 1.382 1.53E-04 8 48 1.382 1.240 1.64E-04 9 54 1.240 1.111 1.49E-04
10 60 1.111 0.993 1.37E-04
4. Results and discussions
Experimental dynamics of cooper flux (NCu) for each run specified in Table 1 are presented in Fig. 4. A mean value of cooper flux (NCu,,m) as well as
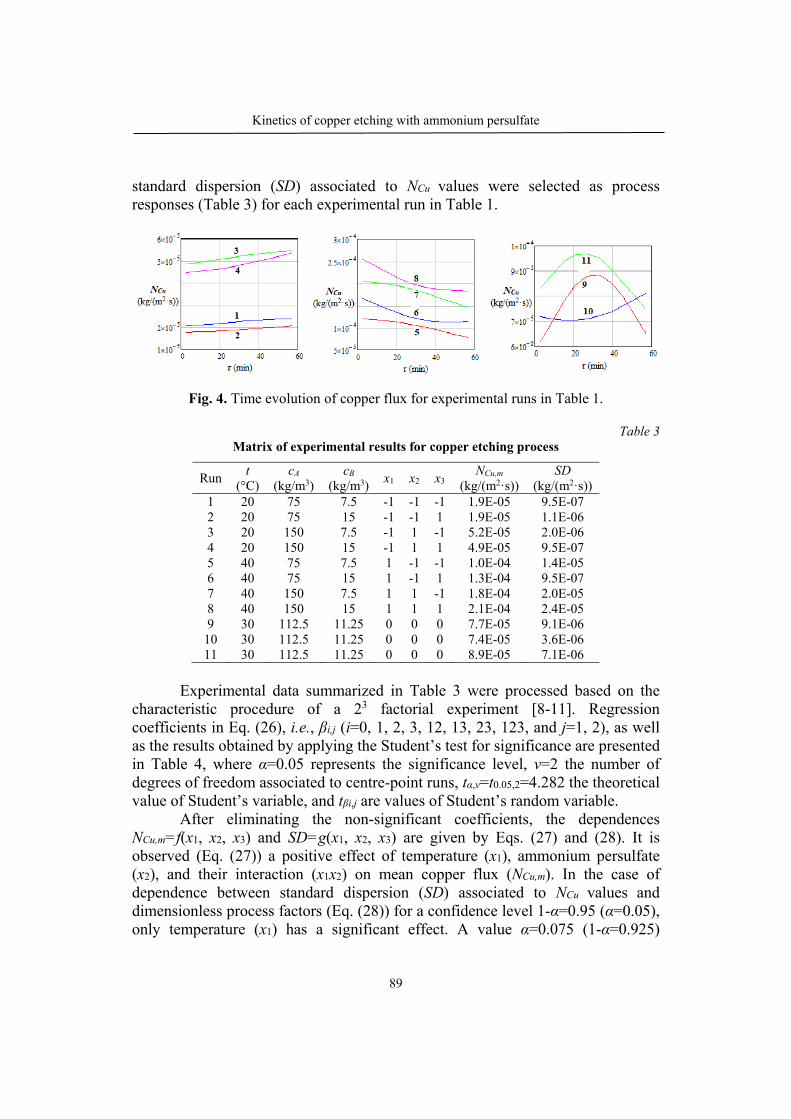
Kinetics of copper etching with ammonium persulfate
89
standard dispersion (SD) associated to NCu values were selected as process responses (Table 3) for each experimental run in Table 1.
Fig. 4. Time evolution of copper flux for experimental runs in Table 1.
Table 3 Matrix of experimental results for copper etching process
Run t
(°C) cA
(kg/m3) cB
(kg/m3) x1 x2 x3
NCu,m (kg/(m2ꞏs))
SD (kg/(m2ꞏs))
1 20 75 7.5 -1 -1 -1 1.9E-05 9.5E-07 2 20 75 15 -1 -1 1 1.9E-05 1.1E-06 3 20 150 7.5 -1 1 -1 5.2E-05 2.0E-06 4 20 150 15 -1 1 1 4.9E-05 9.5E-07 5 40 75 7.5 1 -1 -1 1.0E-04 1.4E-05 6 40 75 15 1 -1 1 1.3E-04 9.5E-07 7 40 150 7.5 1 1 -1 1.8E-04 2.0E-05 8 40 150 15 1 1 1 2.1E-04 2.4E-05 9 30 112.5 11.25 0 0 0 7.7E-05 9.1E-06
10 30 112.5 11.25 0 0 0 7.4E-05 3.6E-06 11 30 112.5 11.25 0 0 0 8.9E-05 7.1E-06
Experimental data summarized in Table 3 were processed based on the characteristic procedure of a 23 factorial experiment [8-11]. Regression coefficients in Eq. (26), i.e., βi,j (i=0, 1, 2, 3, 12, 13, 23, 123, and j=1, 2), as well as the results obtained by applying the Student’s test for significance are presented in Table 4, where α=0.05 represents the significance level, ν=2 the number of degrees of freedom associated to centre-point runs, tα,ν=t0.05,2=4.282 the theoretical value of Student’s variable, and tβi,j are values of Student’s random variable.
After eliminating the non-significant coefficients, the dependences NCu,m=f(x1, x2, x3) and SD=g(x1, x2, x3) are given by Eqs. (27) and (28). It is observed (Eq. (27)) a positive effect of temperature (x1), ammonium persulfate (x2), and their interaction (x1x2) on mean copper flux (NCu,m). In the case of dependence between standard dispersion (SD) associated to NCu values and dimensionless process factors (Eq. (28)) for a confidence level 1-α=0.95 (α=0.05), only temperature (x1) has a significant effect. A value α=0.075 (1-α=0.925)

Alexandru Boscornea, Tănase Dobre, Oana Cristina Pârvulescu, Cristian Eugen Răducanu
90
determines a theoretical value of Student’s variable t0.075,2=3.437 and then the ammonium persulfate concentration (x2) as well as x1x2 interaction can be taken into account in Eq. (28) (see data in Table 4). Moreover, x1, x2, and x1x2 interaction have a positive effect on SD. Regression equations obtained by processing the experimental data could be useful for controlling the copper etching process.
321,12332,2331,1321,123,32,21,1,0 xxxxxxxxxxxxy jjjjjjjjj (26)
21-5
2-5
1-55
, 10172.110228.210035.610499.9 xxxxN mCu (27)
1-66 10797.610087.8 xSD (28)
Table 4
Regression coefficients and results obtained by applying the Student’s test
i NCu,m=f(x1, x2, x3) SD=g(x1, x2, x3)
βi,1 tβi,1 t0.05,2 Significance βi,2 tβi,2 t0.05,2 Significance 0 9.499×10⁻⁵ 34.72
4.282
S 8.087×10⁻⁶ 8.087
4.282
S 1 6.035×10⁻⁵ 22.06 S 6.797×10⁻⁶ 6.820 S 2 2.228×10⁻⁵ 9.973 S 3.784×10⁻⁶ 3.798 N 3 6.172×10⁻⁶ 2.256 N -1.21×10⁻⁶ 1.214 N
12 1.172×10⁻⁵ 4.284 S 3.356×10⁻⁶ 3.569 N 13 7.033×10⁻⁶ 2.564 N -0.981×10⁻⁶ 0.985 N 23 -4.641×10⁻⁷ 0.177 N 2.031×10⁻⁶ 2.037 N 123 3.776×10⁻⁷ 0.138 N 2.338×10⁻⁶ 2.347 N
Confidence level: 1-α=0.95, (S) significant, (N) non-significant
5. Conclusions
Copper foil etching with ammonium persulfate in the presence of sulfuric acid as a catalyst has been theoretically and experimentally studied. A correlation between the copper flux and process factors, i.e., ammonium persulfate concentration, sulfuric acid concentration, and temperature of etching solution, was determined by a theoretical analysis of etching process with a solution of ammonium persulfate and sulfuric acid. An experimental study based on a 23
factorial plan was conducted in order to establish regression equations between the process factors and its responses evaluated as mean copper flux and standard dispersion of copper flux values. Positive effects of temperature (t), ammonium persulfate concentration (cA), and their interaction (tcA) on process responses were revealed. Relationships characterizing the kinetics of copper etching process can be used to control the etching machines for PCBs.

Kinetics of copper etching with ammonium persulfate
91
REFERENCES
[1] Ammonds C.C., Photoengraving: Principles and Practice, Pitman Publishing, 1966. [2] Coombs C.F. Jr. (Ed), Printed Circuit Handbook, 6th Edition, McGraw Hill, 2008. [3] Dobre T., Floarea O., Elements of Engineering of Surface Treatment by Chemical Methods,
Chapter 3: Chemical Etching of Substrates, Matrix Rom, 1998. [4] Cakir, O., Copper etching with cupric chloride and regeneration of waste etchant, J. Mater.
Process. Technol., 175(1-3), (2006), 63-68. [5] Caropreso F.E., Hogya B.J., Radimer K.J., Process of Etching Metal with Ammonium
Persulfate with Recovery and Recycling, US399090 A Patent, 1968. [6] Williams K.R., Muller R.S., Etch rates for micromachining processing (I), J.
Microelectromech. Syst., 5, (1996), 256-269. [7] Williams K.R., Gupta K., Wasilik, M., Etch rates for micromachining processing (II), J.
Microelectromech. Syst., 12(6), (2003), 761-777. [8] Cioroiu D.R., Pârvulescu O.C., Koncsag C.I., Dobre T., Răducanu C., Rheological
characterization of algal suspensions for bioethanol processing, Rev. Chim. (Bucharest), 68(10), (2017), 2311-2316.
[9] Dobre T., Sanchez Marcano, J., Chemical Engineering: Modelling, Simulation and Similitude, Chapter 5: Statistical Models, Wiley VCH, 2007.
[10] Ion V.A., Pârvulescu O.C., Dobre T., Volatile organic compounds adsorption onto neat and hybrid cellulose, Appl. Surf. Sci., 335, (2015), 137-146.
[11] Orbeci C., Pârvulescu O.C., Acceleanu E., Dobre T., Effects of process factors on carbon dioxide reforming of methane over Ni/SBA-15 catalyst, Rev. Chim. (Bucharest), 68(10), (2017), 2325-2328.

Bulletin of Romanian Chemical Engineering Society, Vol 5, No. 1, 2018 ISSN 2360-4697
91
METHANOL TO HYDROCARBONS – A ROMANIAN PROJECT OF HIGH SUCCESS
Gheorghe MARIA1
Department of Chemical and Biochemical Engineering, Faculty of Applied Chemistry and Materials Science, University Politehnica of Bucharest, 1-7 Gh. Polizu Street,
011061, Bucharest, Romania
Abstract The aim of this paper is to review some significant Romanian achievements in the
field of catalytic processes related to methanol to hydrocarbons (MTO-MTG). The MTO-MTG project was a complex scientific and industrial project that involved a significant number of specialists in the chemistry area (scientific researchers, chemists, process analysis engineers, chemical engineers working in math modelling, engineering calculations, model-based plant design, and others) from several institutions including UPB. The project lasted for a decade and a half (1980-1995) and was completed with the design, scale-up, construction, put into operation (1985), and optimal semi-automatic operation of an industrial pilot plant (including a complex catalytic fluidized-bed reactor-regenerator system) at the Petrochemical Works Brazi (Ploiesti, Romania). Several other catalytic processes related to the MTO/MTG have also been tested by using the same pilot plant, such as: I) methanol conversion to BTX hydrocarbons (aromatics), ii) ethylbenzene (EB) alkylation with ethene to get higher aromatics, iii) ethanol conversion to olefins (EtOH), iv) C4 olefins alkylation with methanol (OA), v) MTG catalyst deactivation kinetics.
Keywords: methanol to olefins; methanol to gasoline; industrial pilot plant; model-based industrial plant design; math modelling; catalytic process scale-up. Abbreviations
BTX benzene, toluene, xylene MTH methanol to hydrocarbons EB ethylbenzene MTG methanol to gasoline EtOH ethanol conversion to olefins MTO methanol to olefins FBR fluidized-bed reactor OA C4 olefins alkylation with methanol
IECB Chemical and Biochemical Institute Bucharest (part of ICECHIM )
PWB Petrochemical Works Brazi (Ploiesti, Romania).
IITPIC Inst. Technological Engineering and Design for Chemical Industry
UPB University Politehnica of Bucharest
. Email address: [email protected]
Gheorghe MARIA
92
1. Introduction
The methanol to olefins (MTO) - methanol to gasoline (MTG) project was a complex scientific and industrial project that involved a significant number of specialists in the chemistry area (scientific researchers, chemists, process analysis engineers, chemical engineers working in math modeling, engineering calculations, model-based plant design, and others) from several institutions including UPB. The project lasted for a decade and a half (1980-1995) and was completed with the design, scale-up, construction, put into operation (1985), and optimal semi-automatic operation of an industrial pilot plant (including a complex catalytic fluidized-bed reactor-regenerator system) at the Petrochemical Works Brazi (Ploiesti, Romania) (PWB). Here, have been tested at an industrial-scale the MTO-MTG catalytic processes.
Several other catalytic processes related to the MTO/MTG have also been tested at both bench and pilot scale, such as: I) methanol conversion to BTX hydrocarbons (aromatics), ii) ethylbenzene (EB) alkylation with ethene to get higher aromatics, iii) ethanol conversion to olefins (EtOH), iv) C4 olefins alkylation with methanol (OA), v) MTG catalyst deactivation kinetics.
The basic concept of the whole MTO-MTG project was to capitalize on cheap and low-qualityc(regenerable) natural resources (wood waste, lower cellulosic material, inferior quality coal) by converting them to methanol (via syngas) and then to hydrocarbons.
The present paper is aiming to review a large number of published scientific contributions reported by the key-investigators in the area of kinetic modeling of the involved catalytic processes, model-based design of the industrial pilot plant (that includes a complex catalytic system consisting of two fluidized-bed reactors FBR; that is, one FBR to conduct the MTO-MTG process, and a FBR to regenerate the catalyst of the main reactor; the catalyst has a continuous circulation by pneumatic transport between the two reactors), optimal operation of the plant.
2. Participating teams and key-investigators
The project, funded by the Ministry of Chemistry of Romania (1980-1992), has been a major investment and, due to its high complexity, involved a significant number of researchers from academic area (IECB, UPB) and design engineers from IITPIC (Table 1).
This extremely complex and extended project, involved several partner institutions presented together with the involved key-investigators in the Table 1, together with their roles.

Methanol to hydrocarbons – a Romanian project of high success
93
Table 1. Key-investigators of the involved institutions and their role in the MTO-MTG
project. Institution Key-investigator Role
IECB Chemical and Biochemical
Institute Bucharest (part of ICECHIM,
central research institute for chemistry )
Senior res. eng. Dr. Gheorghe MARIA (currently prof.dr.ing. UPB)
- Kinetic modelling of catalytic processes; statistical treatment of experimental data; - Math modelling of the two FBR to be used in design; - FBR design; catalytic process scale-up; - Catalytic plant technological design, commissioning, and optimization
Senior res. eng. Dr. Straja SORIN (currently living in USA)
- Ibidem; - Kinetic modelling of the catalyst deactivation
Senior res. eng. Dr. Gavril MUSCA (retired); Senior res. eng. Dr. Grigore POP (retired)
management
(late) Senior res. eng. Dr. Ecaterina POP; Senior res. eng. Dr. Tomi PAVEL (retired); Dr. chim. Doina IVANESCU(retired); and many others
- Catalyst synthesis and characterization; - Check catalyst efficiency (process conversion, selectivity, yield), and for stability
Junior res. eng dr. Cristian TSAKIRIS (currently lecturer Univ. Ecologica Bucharest).
- Development of empirical statistic models of the investigated catalytic processes.
UPB, University Politehnica of Bucharest, Dept. Chemical Engineering
Prof.dr.ing. Raul MIHAIL Management
IITPIC Institute of
Technological Engineering and
Design for Chemical Industry
Senior design engineer Dr. Traian STAN (retired), Senior design engineer Dr. Lucica CRETOIU (retired), Senior design engineer Dr. Gigi DAMIAN (retired), and others
Mechanical and technological design, utility routes, electro-installation, etc
This large project required an important investment cost (tens of millions US$), justified by the large number of research and design activities, that is:

Gheorghe MARIA
94
catalyst screening and synthesis (IECB), process check at a lab-/bench-scale, math (kinetic) modelling of the tested catalytic process (MTO, MTH, MTG, BTX, EB, EtOH, OA) (IECB,UPB), FBR (reactor-regenerator system) modeling, and model-based reactor design (IECB,UPB), plant technological design, construction, commissioning (1985)(IITPIC), optimization, semi-automatic control (IECB,UPB,IITPIC). The industrial pilot plant was built-up at the Petrochemical Works Brazi PWB (Ploiesti, Romania), taking advantage of the facilities and utilities offered by the petrochemical platform.
Due to its high complexity, the project has been carried out in several stages, over more than a decade, as follows: I) catalyst synthesis and screening, catalytic process check at a lab-/bench-scale (chap. 3); ii) math (kinetic) modelling of the tested catalytic process (MTO, MTH, MTG, BTX, EB, EtOH, FT, OA) (chap. 3); iii) FBR (reactor-regenerator system) modelling, and model-based industrial reactor design and optimization (chap. 4).
The industrial pilot plant from PWB built-up to produce synthetic gasoline (MTG) was a major industrial achievement both nationally and internationally. At that time (1985), there was a single similar industrial pilot of MOBIL OIL (USA) operated in New Zealand, but of a simpler construction (without continuous recirculation and regeneration of the catalyst).
3. Catalytic processes tested by IECB at a lab-scale, and using the industrial pilot plant of Petrochemical Works Brazi (Ploiesti, Romania). Kinetic modeling. Being of interest in the novel paradigm of this project, not only the basic catalytic MTO, MTH, MTG, BTX processes have been studied and scaled-up, but also some other catalytic processes also developed on zeolite catalysts, as follows [1-16].
- Methanol conversion to olefins (MTO)[5-9e] - Methanol conversion to BTX and aromatic hydrocarbons
(BTX,MTH)[11] - Methanol conversion to gasoline (MTG)[10] - Benzene Alkylation in Vapour-Phase with ethylene on a zeolite catalyst
(EB)[13,13b] - Ethanol conversion to olefins (EtOH)[12] - C4 olefins alkylation with Methanol (OA)[14] - Kinetic models for zeolitic catalysts deactivation due to their coking
[15] - Analysis of the Fischer-Tropsch synthesis (FT) (at a bench-scale
only)[16] To get the most suitable/effective catalyst, an extended experimental program was conducted for every above mentioned process.

Methanol to hydrocarbons – a Romanian project of high success
95
After selection of the most suitable catalyst, every vapour phase mentioned process (MTO, MTG, BTX, EB, EtOH, OA) was tested at the lab-scale, but also with using the industrial pilot (1985-1992) over long times-on-stream (excepting FT).
As a result of the tests carried out with using the industrial pilot plant of PWB, important results were obtained. Thus, kinetic studies and mathematical models developed for the studied catalytic processes were published in top journals [1-15]. Also, the kinetic models have been the basis for the scale-up of the main catalytic processes (MTO, MTG, BTX). Below, some information’s are provided for the main studied catalytic processes, together with the modeling results obtained with using the lab-experiments and checks with the pilot plant PWB.
Methanol to olefins MTO process.
For the MTO process, SAPO-34 has been found to be the best catalyst. The process characteristics are given in the Table 2. As remarked by Sherwin (1981)[17], the MTO / SAPO-34 process is more economic than the process of hydrocarbons pyrolysis to produce ethylene. The process is moderately exothermic (ca. 20 kcal/mol methanol). Consequently, it is likely to be thermally integrated [18].
Table 2
Performances of the tested MTO process at both lab- and pilot-scales [5-9]. Obs. The MTOprocess is more economic (Sherwin, 1981) than the process of hydrocarbons pyrolysis to produc
Raw material Commercial liquid methanol Catalyst and optimal running conditions SAPO-34 zeolite at 435°C, 1.95 h-1;
mordenite-zeolite MZ at 370°C, 1.12 h-1;
Temperature 360-440°C (normal pressure; reaction is moderately exothermic, ca. 20 kcal/mole methanol)
LHSV 0.6-2.4 1/h Typical product distribution (%wt.) [9] More than 98% methanol conversion; 90% total olefins selectivity; 61% ethene selectivity. 36-41 g olefins / 100 g fed methanol; 19-27 g ethene / 100 g fed methanol
Compound Catalyst
Compound Catalyst
SAPO MZ SAPO MZ H2 0.43 0.18 C5H12 0.30 0.22
CH4 1.35 5.0 C5H10 and C6+ 1.06 0.28 C2H6 0.17 0.45 CO 4.28 C2H4 26.65 7.96 CO2 0.13 C3H8 0.44 3.43 CH3OH 1.47 2.97 C3H6 10.63 10.23 Dimethylether 0.91 0.21 C4H10 0.54 2.82 H2O 54.66 55.12 C4H8 1.39 6.65
Remark: The MTO/SAPO-34 process is more economic than the hydrocarbon pyrolysis process for producing ethene (Sherwin, 1981).
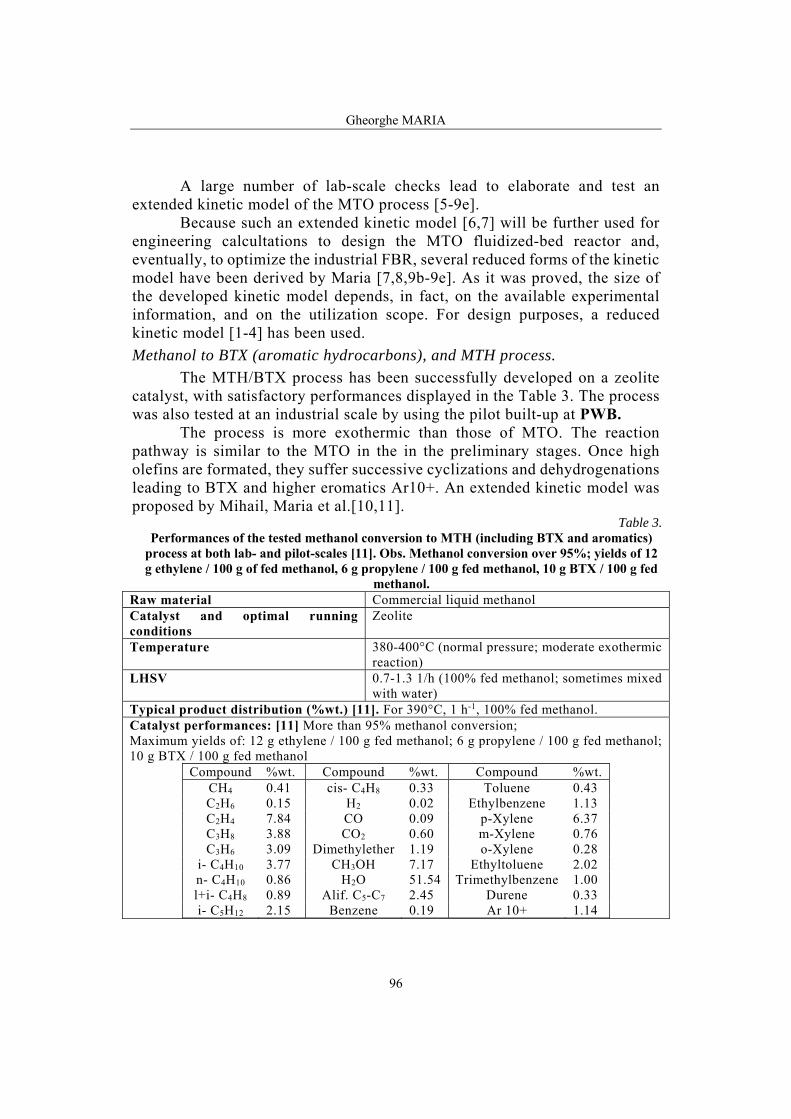
Gheorghe MARIA
96
A large number of lab-scale checks lead to elaborate and test an extended kinetic model of the MTO process [5-9e].
Because such an extended kinetic model [6,7] will be further used for engineering calcultations to design the MTO fluidized-bed reactor and, eventually, to optimize the industrial FBR, several reduced forms of the kinetic model have been derived by Maria [7,8,9b-9e]. As it was proved, the size of the developed kinetic model depends, in fact, on the available experimental information, and on the utilization scope. For design purposes, a reduced kinetic model [1-4] has been used.
Methanol to BTX (aromatic hydrocarbons), and MTH process.
The MTH/BTX process has been successfully developed on a zeolite catalyst, with satisfactory performances displayed in the Table 3. The process was also tested at an industrial scale by using the pilot built-up at PWB.
The process is more exothermic than those of MTO. The reaction pathway is similar to the MTO in the in the preliminary stages. Once high olefins are formated, they suffer successive cyclizations and dehydrogenations leading to BTX and higher eromatics Ar10+. An extended kinetic model was proposed by Mihail, Maria et al.[10,11].
Table 3. Performances of the tested methanol conversion to MTH (including BTX and aromatics)
process at both lab- and pilot-scales [11]. Obs. Methanol conversion over 95%; yields of 12 g ethylene / 100 g of fed methanol, 6 g propylene / 100 g fed methanol, 10 g BTX / 100 g fed
methanol. Raw material Commercial liquid methanol Catalyst and optimal running conditions
Zeolite
Temperature 380-400°C (normal pressure; moderate exothermic reaction)
LHSV 0.7-1.3 1/h (100% fed methanol; sometimes mixed with water)
Typical product distribution (%wt.) [11]. For 390°C, 1 h-1, 100% fed methanol. Catalyst performances: [11] More than 95% methanol conversion; Maximum yields of: 12 g ethylene / 100 g fed methanol; 6 g propylene / 100 g fed methanol; 10 g BTX / 100 g fed methanol
Compound %wt. Compound %wt. Compound %wt. CH4 0.41 cis- C4H8 0.33 Toluene 0.43 C2H6 0.15 H2 0.02 Ethylbenzene 1.13 C2H4 7.84 CO 0.09 p-Xylene 6.37 C3H8 3.88 CO2 0.60 m-Xylene 0.76 C3H6 3.09 Dimethylether 1.19 o-Xylene 0.28
i- C4H10 3.77 CH3OH 7.17 Ethyltoluene 2.02 n- C4H10 0.86 H2O 51.54 Trimethylbenzene 1.00 l+i- C4H8 0.89 Alif. C5-C7 2.45 Durene 0.33 i- C5H12 2.15 Benzene 0.19 Ar 10+ 1.14
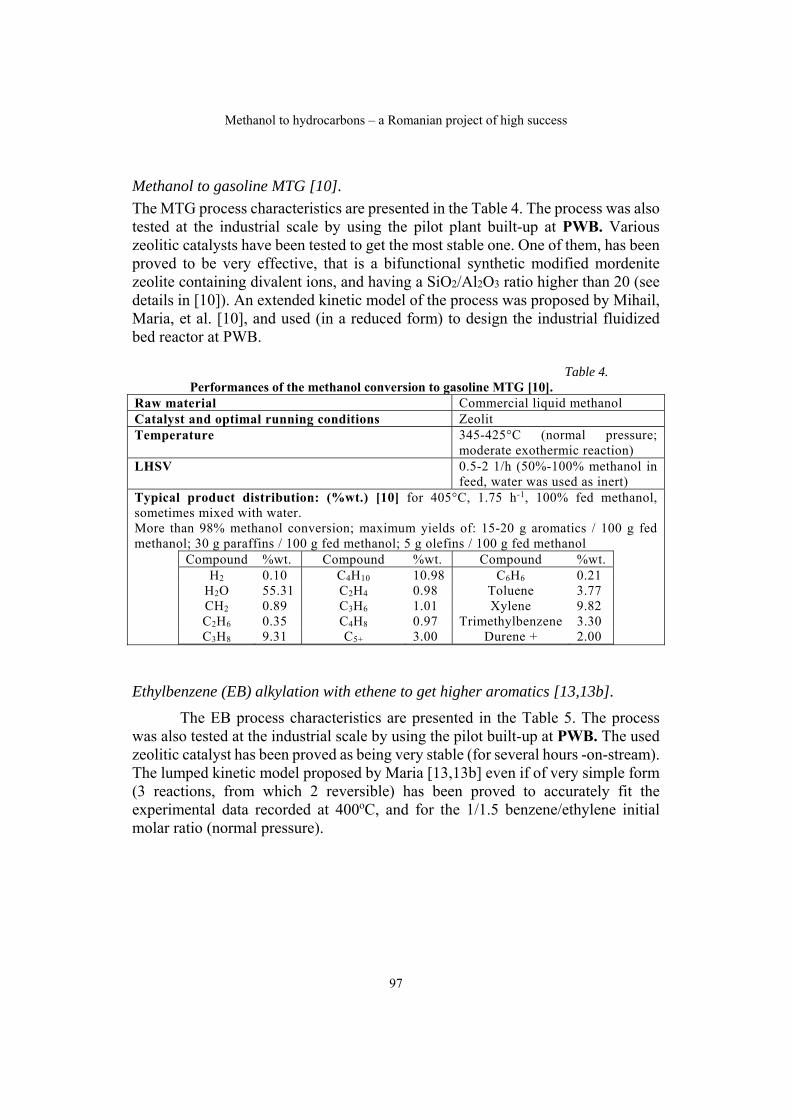
Methanol to hydrocarbons – a Romanian project of high success
97
Methanol to gasoline MTG [10].
The MTG process characteristics are presented in the Table 4. The process was also tested at the industrial scale by using the pilot plant built-up at PWB. Various zeolitic catalysts have been tested to get the most stable one. One of them, has been proved to be very effective, that is a bifunctional synthetic modified mordenite zeolite containing divalent ions, and having a SiO2/Al2O3 ratio higher than 20 (see details in [10]). An extended kinetic model of the process was proposed by Mihail, Maria, et al. [10], and used (in a reduced form) to design the industrial fluidized bed reactor at PWB.
Table 4. Performances of the methanol conversion to gasoline MTG [10].
Raw material Commercial liquid methanol Catalyst and optimal running conditions Zeolit Temperature 345-425°C (normal pressure;
moderate exothermic reaction) LHSV 0.5-2 1/h (50%-100% methanol in
feed, water was used as inert) Typical product distribution: (%wt.) [10] for 405°C, 1.75 h-1, 100% fed methanol, sometimes mixed with water. More than 98% methanol conversion; maximum yields of: 15-20 g aromatics / 100 g fed methanol; 30 g paraffins / 100 g fed methanol; 5 g olefins / 100 g fed methanol
Compound %wt. Compound %wt. Compound %wt. H2 0.10 C4H10 10.98 C6H6 0.21
H2O 55.31 C2H4 0.98 Toluene 3.77 CH2 0.89 C3H6 1.01 Xylene 9.82 C2H6 0.35 C4H8 0.97 Trimethylbenzene 3.30 C3H8 9.31 C5+ 3.00 Durene + 2.00
Ethylbenzene (EB) alkylation with ethene to get higher aromatics [13,13b].
The EB process characteristics are presented in the Table 5. The process was also tested at the industrial scale by using the pilot built-up at PWB. The used zeolitic catalyst has been proved as being very stable (for several hours -on-stream). The lumped kinetic model proposed by Maria [13,13b] even if of very simple form (3 reactions, from which 2 reversible) has been proved to accurately fit the experimental data recorded at 400oC, and for the 1/1.5 benzene/ethylene initial molar ratio (normal pressure).

Gheorghe MARIA
98
Table 5.
Performances of the tested ethylbenzene EB alkylation with ethene [13,13b]. (DEB= di-ethylbenzene).
Raw material Commercial Ethyl-benzene from oil refinery and commercial ethylene
Catalyst and optimal running conditions Zeolite Temperature 350°C (normal pressure, low exothermic
reaction) LHSV 1-1.5 1/h (0.6-0.8 moles fed ethylene /
mole de EB) Typical product distribution (%wt.) [10] for 350°C, 1 h-1, 0.73 moles fed ethylene / mole de EB 15-20% EB conversion; 20-30% ethylene conversion; 60% selectivity in EB and p-DEB; 45% selectivity of ethylene in p-DEB.
Compound %wt. Compound %wt. Compound %wt. Alif C5-C7 0.91 Pseudocumene 0.03 n- C4H10 0.13 Benzene 1.89 p-DEB 7.25 l- C4H8 0.02 Toluene 0.64 m-DEB 3.71 i- C4H8 0.11
Ethylbenzen 70.88 o-DEB 0.05 i- C5H12 0.08 p-Xylene 0.56 C2H4 11.12 cis- C4H6 0.02 m-Xylene 0.10 C3H8 0.71 n- C5H12 0.03 o-Xylene 0.07 C3H6 0.33 H2 0.01
Ethyl-toluene 1.03 i- C4H10 0.32
C4 olefins alkylation with methanol, OA [14].
The OA process is aiming to convert the C4 fraction of olefins to iso-C5 olefins by alkylation with methanol on a zeolite catalyst. The iso-C5 olefinic fraction is known as being of high importance as raw-material for the petrochemical processing industry, and a valuable component of the gasoline. Its non-conventional production by using the olefinic C4 fraction and methanol is attractive from two reasons: i) the C4 fraction is thus used in a more efficient way, and ii) ii) the process involves the methanol, i.e. a non-petrochemical raw-material,
possible to be obtained from cheap and possibly renevable raw materials (biomass / wood waste, lower cellulosic material, inferior quality coal). The OA process characteristics are presented in the Table 6. The process was also tested at the industrial scale by using the pilot built-up at PWB. The used zeolitic modified ZSM-12 and ZSM-5 catalysts have been proved to be very stable and effective.
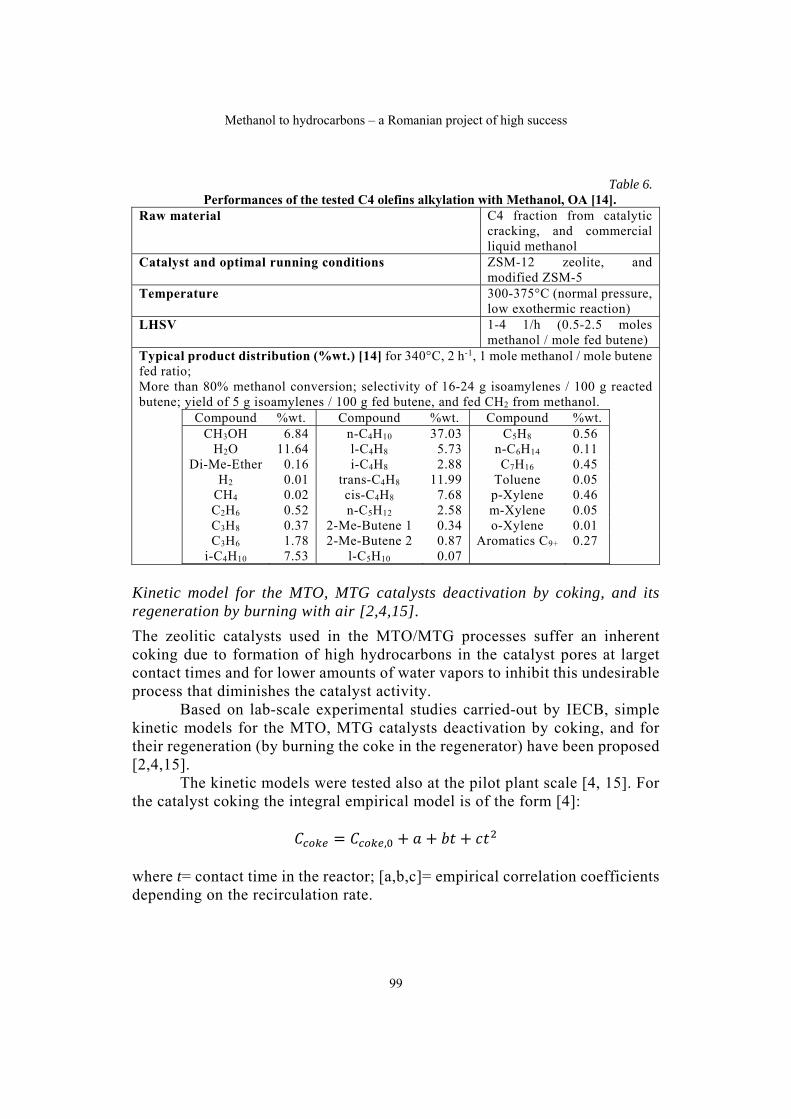
Methanol to hydrocarbons – a Romanian project of high success
99
Table 6. Performances of the tested C4 olefins alkylation with Methanol, OA [14].
Raw material C4 fraction from catalytic cracking, and commercial liquid methanol
Catalyst and optimal running conditions ZSM-12 zeolite, and modified ZSM-5
Temperature 300-375°C (normal pressure, low exothermic reaction)
LHSV 1-4 1/h (0.5-2.5 moles methanol / mole fed butene)
Typical product distribution (%wt.) [14] for 340°C, 2 h-1, 1 mole methanol / mole butene fed ratio; More than 80% methanol conversion; selectivity of 16-24 g isoamylenes / 100 g reacted butene; yield of 5 g isoamylenes / 100 g fed butene, and fed CH2 from methanol.
Compound %wt. Compound %wt. Compound %wt. CH3OH 6.84 n-C4H10 37.03 C5H8 0.56
H2O 11.64 l-C4H8 5.73 n-C6H14 0.11 Di-Me-Ether 0.16 i-C4H8 2.88 C7H16 0.45
H2 0.01 trans-C4H8 11.99 Toluene 0.05 CH4 0.02 cis-C4H8 7.68 p-Xylene 0.46 C2H6 0.52 n-C5H12 2.58 m-Xylene 0.05 C3H8 0.37 2-Me-Butene 1 0.34 o-Xylene 0.01 C3H6 1.78 2-Me-Butene 2 0.87 Aromatics C9+ 0.27
i-C4H10 7.53 l-C5H10 0.07
Kinetic model for the MTO, MTG catalysts deactivation by coking, and its regeneration by burning with air [2,4,15].
The zeolitic catalysts used in the MTO/MTG processes suffer an inherent coking due to formation of high hydrocarbons in the catalyst pores at larget contact times and for lower amounts of water vapors to inhibit this undesirable process that diminishes the catalyst activity.
Based on lab-scale experimental studies carried-out by IECB, simple kinetic models for the MTO, MTG catalysts deactivation by coking, and for their regeneration (by burning the coke in the regenerator) have been proposed [2,4,15].
The kinetic models were tested also at the pilot plant scale [4, 15]. For the catalyst coking the integral empirical model is of the form [4]:
𝐶 𝐶 , 𝑎 𝑏𝑡 𝑐𝑡
where t= contact time in the reactor; [a,b,c]= empirical correlation coefficients depending on the recirculation rate.

Gheorghe MARIA
100
The coke balance in the regenerator is [4] (where Coxy is the oxygen
molar fraction in the regenerator):
, ,
,
D C C r mcat coke inlet coke out burn cat
r k C Cburn coke out oxy
𝑘 0.19 10 𝑒𝑥𝑝18989𝑇
Kinetic model for the Fischer-Tropsch synthesis (FT).
With the same aim of evaluating alternative ways to produce gasoline, and hydrocarbons, the classical FT sythesis was investigated at a lab-scale, by using a silica-iron catalyst. Based on own experiments, and on the experiments of Bub and Baerns (1980)[19] conducted at 10-30 atm., and 220-230 oC, a complex kinetic model of power-law type was derived. Some ot their features are presented in the Figure 1. The process was tested at a bench-scale only [16], because the PWB pilot plant can not support pressures higher than 2 atm.
Fig. 1. Kinetic model for the Fischer-Tropsch synthesis (FT) (tested at a bench-
scale only)[16]

Methanol to hydrocarbons – a Romanian project of high success
101
Statistic model to characterize the Ethanol conversion to olefins (EtOH) process [12].
Conversion of EtOH to ethylene and higher hydrocarbons on a zeolitic catalyst (ZSM, HZSM5, Al2O3/silica(Akzo), and others [12]) has experimentally been investigated by IECB. Based on the recorded kinetic data, a simple statistical model was derived, linking the variables of interest, that is:
1 = yield in ethylene (g ethylene / g fed ethanol); 2 = yield in aromatics (g aromatics A7-A10/ g fed ethanol); 3 = yield in gasoline (g fraction C5+ / g fed ethanol);
with the control variables: temperature (T), LHSV, ethanol concentration in the fed (C%mol.). To inhibit the catalyst deactivation, the fed ethanol vapours are diluted with water vapours. The obtained results are presented in the Figure 2.
Fig. 2. Performances of the tested Ethanol conversion to olefins (EtOH)[12].

Gheorghe MARIA
102
4. Mathematical modelling of the fluid-bed catalytic reactor-regenerator system. Model-based optimal-design of the reactor-regenerator system. Elaboration of the industrial pilot plant technological project.
The developed kinetic models of the above investigated catalytic processes allowed to design the fluid-bed catalytic reactors of the industrial pilot plant of PWB. Also, the elaborated kinetic models for catalyst deactivation (by coking), and its regeneration (by coke burning with air) allowed to design the fluid-bed regenerator. The reactor and the regenerator are connected, thus allowing the continuous circulation of the catalyst (of ca. 0.06-1 mm avg. size) between these two main units of the industrial pilot plant of PWB
Fig. 3A. Scheme of the industrial pilot plant built-up at Petrochemical Works Brazi PWB (Ploiesti, Romania) (1985)[2], including two FBR: one for conducting the desired reaction (MTO, MTG, etc.), and one for catalyst regeneration. The catalyst has a continuous circulation, by pneumatic transport, between the two reactors [1-4].
Fig. 3B. The industrial pilot plant for the MTO process, including two inter-connected FBR offered by UOP/Hydro comp., Germany (2005), and Chinese Dalian Institute of Chemical Physics (2015)[18].
From a constructive point of view, the industrial pilot plant of PWB (Figure
3A) consists of two catalytic fluid bed reactors (see the main characteristics of the reactor-regenerator system in the Table 7) The catalyst (ZSM5, mordenite or other modified silicates) is introduced as under-millimetre particles into the reactor where it is entrained by the gaseous reactant (methanol/water vapours, etc.) introduced at

Methanol to hydrocarbons – a Romanian project of high success
103
the bottom of the reactor. Catalyst elutriation is prevented by the cyclone disposed at the top. The heat of reaction is removed through the cooling tubes immersed in the catalytic bed. The regeneration of the coked catalyst is accomplished by its continuous transport to a fluidized bed regenerator (working similarly to the main reactor), where coke is removed being burned with air. The regenerated catalyst is pumped back to the reactor by the same pneumatic transport with inert nitrogen. The reaction-regeneration process continues until the catalyst is exhausted. The stationary operation of the two catalytic reactors is maintained by a sophisticated computer assisted control system using simple statistical mathematical models of the process [1-4].
Table 7. The main characteristics of the industrial pilot plant for the MTO/MTG process from
Petrochemical Works Brazi (Ploiesti, Romania, PWB).
Industrial pilot with two catalytic reactors in fluidized-bed (FBR)
A FBR (reactor), and a FBR regenerator (for catalyst regeneration). The continuous circulation of the catalyst between the reactor and the regenerator is accomplished by pneumatic transport with inert nitrogen.
Reactor (fluidized-bed vapour phase catalytic reaction)
0.5m in diameter and 7m in height
Regenerator (fluidized-bed combustion of the coke deposited on the microscopic catalyst)
0.3m in diameter and 7m in height
LHSV; catalyst avg. size 0.4-2 1/h (for the MTG); 0.06-1 mm
temperature range 280-450°C (reactor), and 480-560°C (regenerator)
Pressure 1-2 atm.
Observations
The pilot is equipped with gas-chromatograph analyzers and process computers connected "on-line" and "off-line". Approx. 50 process parameters are continuously recorded through appropriate equipment. A specific software is used for data treatment, with including data acquisition, numerical filtering, statistical calculations, mass and thermal balances, and kinetic evaluations..
Tested catalytic processes MTO, BTX, MTG, EB, EtOH, OA, catalyst deactivation
The industrial pilot plant, with the characteristics listed in Table 7, was put
into operation on 1985. For this outstanding achievement at both national and international level (in the world, at that time, only one similar pilot plant of the MOBIL OIL comp. USA, was operated in New Zealand), the MTO-MTG team author of the i) MTO-MTG process investigation, its development/scale-up, ii) industrial pilot plant PWB design, and iii) catalytic processes testing at the pilot-

Gheorghe MARIA
104
plant scale, was awarded the "Nicolae Teclu" Prize of the Romanian Academy on 1985.
5. Conclusions
The realized industrial pilot plant by the MTO-MTG team was put into
operation at PWB on 1985. For this outstanding achievement at both national and international level, the MTO-MTG team was awarded the "Nicolae Teclu" Prize of the Romanian Academy in 1985.
Most important, the realized industrial pilot-plant at PWB was used not only for testing the feasibility of conducting the MTO-MTG process at an industrial scale, but also for testing lot of novel and important catalytic processes at a large-scale.
It is to underline that, in 1985, when the industrial pilot plant of PWB was put into operation, in the world, only one similar pilot plant (of the MOBIL OIL comp. USA) was operated in New Zealand, but presenting different characteristics (without continuous recirculation of the catalyst).
Because the MTO-MTG processes have been proved as being profitable at a large scale, similar industrial plants were later built-up, such as those offered by UOP/Hydro comp.(2005), and by the Chinese Dalian Institute of Chemical Physics (2015)[18] (see their constructive scheme in the Figure 3B). Based on the remarcable results obtained by the Romanian MTO-MTG team, a large number of papers have been published in top scientific journals, being received with a high interest by the international scientific community. Thus, these papers reported more than 500 citations. Also, some important MTO-MTG project achievements have been included in esteemed reviewing books, such as L.F. Albright, B.L. Crynes and S. Nowak, (1994), Novel production method for ethylene, light hydrocarbons, and aromatics, Marcel Dekker Inc., New York, Basel, Hong Kong, J.G. Balchen, (1992), Dynamics and control of chemical reactors, distillation columns and batch processes, (Selected papers from the 3rd IFAC Symposium, Maryland, USA, 26-29 April, 1992), Pergamon Press, Oxford, New York, Seul, Tokyo.

Methanol to hydrocarbons – a Romanian project of high success
105
SELECTIVE REFERENCES
Industrial pilot plant simulation, and control (Reactor-Regenerator system): [1] Mihail, R., Straja, S., A theoretical model concerning bubble size distribution, Chemical
Engineering Journal, 33 (1986) 71-77. [2] Tsakiris, C., Maria, G., Pop, G., Ignatescu, G., Manoliu, D., Boeru, R., Bozga, G., Muntean, O.,
A Dynamic Model for the Methanol Conversion în a Fluidized-Bed Reactor, IFAC Symposium DYCORD’92, Maryland Univ. (USA), April 27-29, 1992; in: Dynamics and Control of Chemical Reactors, Distilation Columns and Batch Processes, J.G. Balchen (Ed.), Pergamon Press, Oxford, 1993, p. 105-109.
[3] Maria, G., Musca, G., Pop,, G., Niculae, G., Boeru, R., Ignatescu, G., Manoliu, D., Data Analysis and Modelling of a Computer Assisted Fluid-Bed Pilot-Plant. Application to Several Zeolite Catalysed Processes, 7th Jornadas de Fluidizacion y Sistemas Fluido-Particula, Zaragoza (Spain), May 20-22, 1992.
[4] Tsakiris, C., Maria, G., Ignatescu, G., Manoliu, D., Boeru, R., Natu, N., Pop, G., Bozga, G., Muntean, O., Steady-State Simulation of a Methanol-to-Hydrocarbons Conversion Experimental Plant, Studia Universitatis Babes-Bolyai (Cluj-Napoca); Chemia, 36(1-2), (1991) 86-95. http://www.ubbcluj.ro/publicatii/publicatii.html. http://chem.ubbcluj.ro/~studiachemia/
MTO [5] Mihail, R., Straja, S., Maria, G., Musca, G., Pop, G., Kinetic Model for Methanol Conversion
to Olefins, Industrial Engineering Chemistry Process Design Development, 22 (1983) 532-538. DOI: 10.1021/i200022a031.
[6] Mihail, R., Straja, S., Maria, G., Musca, G., Pop, G., Reply to Comments on ‘Kinetic Model for Methanol Conversion to Olefins’ with Respect to Methane Formation at Low Conversion, Industrial Engineering Chemistry Research 26 (1987) 637-638. DOI: 10.1021/ie00063a042.
[7] Iordache, O., Maria, G., Pop, G., Lumping Analysis for the Methanol Conversion to Olefins Kinetic Model, Industrial Engineering Chemistry Research, 27 (1988) 2218-2224. DOI: 10.1021/ie00084a005.
[8] Maria, G., Muntean, O., Model Reduction and Kinetic Parameters Identification for the Methanol Conversion to Olefins, Chemical Engineering Science, 42 (1987) 1451-1460. doi:10.1016/0009-2509(87)85017-0.
[9] Pop, G., Musca, G., Ivanescu, D., Pop, E., Maria, G., Chirila, E., SAPO-34 Catalyst Selectivity for the MTO Process, AIChE’90 Meeting, in: Novel Production Methods for Ethylene, light Hydrocarbons, and Aromatics, Albright, L. et al., (eds.), Marcel Dekker, New York, 1992, pp. 443-453, ISBN= 0-8247-8588-6
[9b] Maria, G., An Adaptive Strategy for Solving Kinetic Model Concomitant Estimation-Reduction Problems, Canadian Journal of Chemical Engineering, 67 (1989) 825-832. DOI: 10.1002/cjce.5450670514 .
[9c] Maria, G., Muntean, O., Musca, G., Pop, G., MTO Kinetic Model Order of Complexity and the Relative Importance in Different Simulation Stages, Bulletin Inst. Politech. Bucharest (Ser. Chimie), 52(2), (1990) 41-46. http://www.scientificbulletin.upb.ro/.
[9d] Maria, G., Rippin, D.W.T., A Note Concerning Two Techniques for Complex Kinetic Pathway Analysis, Chemical Engineering Science, 48 (1993) 3855-3864. doi:10.1016/0009-2509(93)80228-I .
[9e] Maria, G., Rippin, D.W.T., Modified Integral Procedure (MIP) as a Reliable Short-Cut Method for Kinetic Model Estimation : Isothermal, Non-Isothermal and (Semi-) Batch Process Cases, Computers & Chemical Engineering, 21 (1997) 1169-1190. doi:10.1016/S0098-1354(96)00328-6.
Gheorghe MARIA
106
MTG [10] Mihail, R., Straja, S., Maria, G., Musca, G., Pop, G., A Kinetic Model for Methanol Conversion
to Hydrocarbons, Chemical Engineering Science, 38 (1983) 1581-1591. doi:10.1016/0009-2509(83)80094-3.
BTX [11] Pop, G., Musca, G., Maria, G., Straja, S., Mihail, R., Selective Methanol Conversion to BTX,
Industrial Engng. Chemistry Product Research Development 25 (1986) 208-213. DOI: 10.1021/i300022a015.
EtOH [12] Pop, G., Ivanescu, D., Maria, G., Straja, S., Muntean, O., Conversia Etanolului la Hidrocarburi
(Ethanol conversion to hydrocarbons), Revista de Chimie 38 (1987) 661-665. (in Romanian) Benzene Alkylation (EB) [13] Maria, G., Pop, G., Musca, G., Boeru, R., Benzene Alkylation în Vapour-Phase with Ethene
on a Zeolite Catalyst, in: New Frontiers in Catalysis, L. Guczi, F. Solymosi and P. Tetenyi (Eds.), Elsevier, Amsterdam, 1993, p. 1665-1668. (Proceedings of the 10th International Congress on Catalysis, Budapest, July 19-24, 1992)
http://www.gbv.de/dms/ilmenau/toc/124410103.PDF [13b] Maria, G., Pop, G., Musca, G., Boeru, R., Benzene Alkylation in Vapour-Phase with Ethene
on a Zeolite Catalyst, Studies in Surface Science and Catalysis (Part C), 75 (1993) 1665-1668. doi:10.1016/S0167-2991(08)64505-X
Olefins Alkylation (OA) [14] Pop, G., Boeru, R., Muntean, O., Maria, G., Selective Alkylation of Iso-Butenes with Methanol
to Produce Iso-C5 Olefins, in:Novel Production Methods for Ethylene, lighy Hydrocarbons, and Aromatics, Albright, L. et al. (eds.), Marcel Dekker, New York, 1992, pp. 453-463, ISBN= 0-8247-8588-6
Zeolitic Catalysts Deactivation [15] Pop, G., Musca, G., Chirila, E., Maria, G., Straja, S., Coke Deposit Formation on the Catalyst
for Methanol Conversion to Hydrocarbons, 2nd Yugoslav Congress of Chemical Engineering, Dubrovnic (Yugoslavia), May 11, 1987.
Fischer-Tropsch (FT) [16] Mihail, R., Pop, G., Maria, G., Birzan, L., Analysis of a kinetic model for the Fischer-Tropsch
synthesis, Revista de Chimie, 37 (1986) 293-298. (in Romanian) others [17] Sherwin, M.B., chemicals from methanol, Hydrocarbon processing, March 1981, pp. 79-84. [18] Dimian, A.C., Bildea, C.S., Energy efficient methanol-to-olefins process, Chemical
Engineering Research and Design, 131 (2018) 41-54. [19] Bub, G., Baerns, M., Prediction of the performance of catalytic fixed bed reactors for Fischer-
Tropsch Synthesis, Chemical Engineering Science, 35 (1980) 348-355.


