22
Bumper yield ahead! Insecticides India Initiating Coverage | 15 June 2015 Sector: Agri Niket Shah ([email protected]); +91 22 3982 5426 Atul Mehra ([email protected]);+91 22 3982 5417
Bumper yield ahead!
Insecticides India
Initiating Coverage | 15 June 2015
Sector: Agri
Niket Shah ([email protected]); +91 22 3982 5426
Atul Mehra ([email protected]);+91 22 3982 5417
Insecticides India
15 June 2015 2
Contents: Insecticides India | Bumper yield ahead!
Summary ............................................................................................................. 3
Company overview ............................................................................................... 4
Branded formulations business: A success story .................................................... 7
Scaling up of existing brands and robust new product pipeline to drive growth and market share gain ................................................................................................. 8
Ramp-up of technicals to give fillip to growth ...................................................... 11
Aggressive capex done; ramp-up on cards ........................................................... 12
Earnings to post 36% CAGR over FY15-17 ............................................................ 13
Valuation and view ............................................................................................. 14
Key risks ............................................................................................................. 15
Management overview ....................................................................................... 16
Industry overview .............................................................................................. 17
Financials and valuations .................................................................................... 18
Financials and valuations .................................................................................... 19
Our reports on Agri Sector .................................................................................. 20
Investors are advised to refer through disclosures made at the end of the Research Report.
Motilal Oswal research is available on www.motilaloswal.com/Institutional-Equities, Bloomberg, Thomson Reuters, Factset and S&P Capital.

Insecticides India
15 June 2015 3
Bumper yield ahead! Higher utilization to drive 36% EPS CAGR over FY15-17
Insecticides India (INST) is amongst the top 10 Indian agrochemical companies and commands ~7% market share. It has emerged as a strong player in the branded formulations market with a portfolio of 99 brands.
We expect strong growth, given its measures to ramp up revenues on existing branded products, launch of new molecules, potential scaling up of technicals business, and strong room to improve capacity utilization from ~65% currently.
We believe INST can post 18% revenue CAGR and 36% PAT CAGR over FY15-17 along with strong FCF generation (INR1.4b over FY15-17) and significant improvement in return ratios (RoCE and RoE to improve from 17.8% and 20.3% to 24.9% and 24.7%, respectively, over FY15-17. Initiate with a ‘Buy’.
Focus on ‘Navratna’ and ‘Super 11’ brands to drive growth and margins INST has built a strong portfolio of 99 brands in its branded formulations business (77% of total revenues) through a) acquisitions, b) in-licensing arrangements and c) reverse engineering. To drive better scale and improve margins, the management’s focus has been on portfolio consolidation over the last three years, (focusing on Top 20 Brands, which are amongst the Top 3 brands in their respective categories and command 500bp higher margins than the rest of the brand portfolio). Going forward, we expect reduction in number of brands to 75, taking the revenue contribution from the top 20 brands to ~80%. Within the top 20 brands, we expect growth to be led by recently launched in-licensed brands—‘Hakama’ and ‘Pulsar’, which have completed the free sampling and promotion stages and are now ready for scale-up.
Capacity utilization ramp-up to drive FCF generation and return ratios INST commissioned INR2.5b capex (which will deliver an asset turnover of ~4x) over FY11-15. Initially, the technical facility at Dahej faced teething problems after commissioning, which impacted margins in FY14. However, INST overcame those problems and ensured higher utilization (51% in FY15) at the facility. We believe with the current product mix and price levels, INST can potentially generate revenues of INR18b from the current capacities (as against INR9.2b in FY15) requiring minimal capex going forward.
Valuation and view Given its measures to ramp up revenues on existing branded products, launch of new molecules, scale up of technicals business, and strong room to improve capacity utilization from 65% currently, we believe INST can post 18% revenue CAGR and 36% PAT CAGR over FY15-17 along with strong FCF generation (INR1.4b over FY15-17) with significant improvement in return ratios (RoCE and RoE to improve from 17.8% and 20.3% to 24.9% and 24.7%, respectively, over FY15-17). We believe valuations at 12.9x FY16 and 9.5x FY17 are attractive as compared with peer group average of 26x FY16 and 21x FY17, warranting a re-rating. We initiate coverage with a ‘Buy’ rating with a PT of INR800 (15x FY17).
Initiating Coverage | Sector: Agri
Insecticides India CMP: INR510 TP: INR800 (57%) Buy
BSE Sensex S&P CNX
26,425 7,983
Stock Info
Bloomberg INST IN
Equity Shares (m) 12.7
52-Week Range (INR) 632/240
1, 6, 12 Rel. Per (%) 1/-14/85
M.Cap. (INR b) 6.2
M.Cap. (USD b) 0.1
AvgVal. INRm/Vol‘000 43/62
Free float (%) 25.3
Financial Snapshot (INR b) Y/E March 2015 2016E 2017E
Sales 9.6 11.5 13.5
EBITDA 1.1 1.4 1.8
NP 0.5 0.8 1.0
EPS (INR) 28.8 39.5 53.4
EPS Gr (%) 37.4 37.0 35.2
BV/Sh (INR) 153.8 192.6 240.9 RoE (%) 20.3 22.8 24.7 RoCE (%) 17.8 20.8 24.9 P/E (x) 17.7 12.9 9.5 P/BV (x) 3.3 2.6 2.1
Shareholding pattern (%)
As on Mar-15 Dec-14 Mar-14 Promoter 74.7 74.7 74.7
DII 6.6 6.5 5.3
FII 4.1 4.1 1.2 Others 14.6 14.7 18.8 FII Includes depository receipts
Stock Performance (1-year)
200
325
450
575
700
Jun-
14
Sep-
14
Dec
-14
Mar
-15
Jun-
15
Insecticides India
Sensex - Rebased
Insecticides India
15 June 2015 4
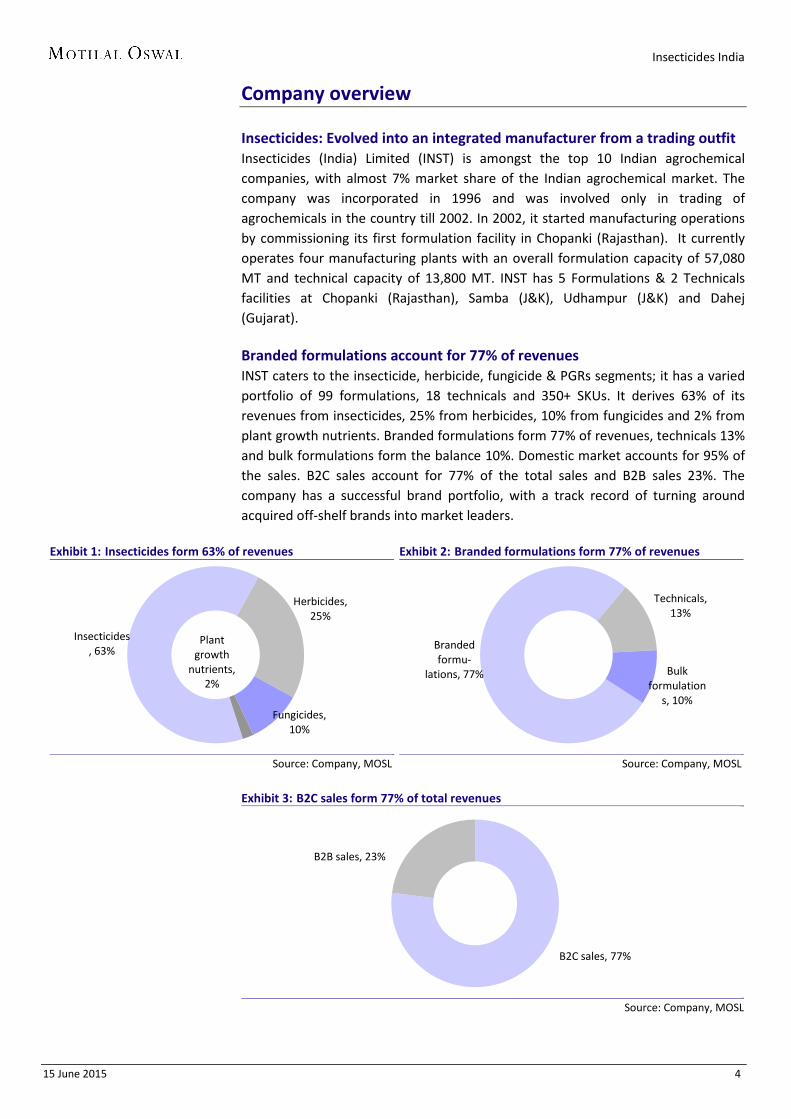
Company overview Insecticides: Evolved into an integrated manufacturer from a trading outfit Insecticides (India) Limited (INST) is amongst the top 10 Indian agrochemical companies, with almost 7% market share of the Indian agrochemical market. The company was incorporated in 1996 and was involved only in trading of agrochemicals in the country till 2002. In 2002, it started manufacturing operations by commissioning its first formulation facility in Chopanki (Rajasthan). It currently operates four manufacturing plants with an overall formulation capacity of 57,080 MT and technical capacity of 13,800 MT. INST has 5 Formulations & 2 Technicals facilities at Chopanki (Rajasthan), Samba (J&K), Udhampur (J&K) and Dahej (Gujarat). Branded formulations account for 77% of revenues INST caters to the insecticide, herbicide, fungicide & PGRs segments; it has a varied portfolio of 99 formulations, 18 technicals and 350+ SKUs. It derives 63% of its revenues from insecticides, 25% from herbicides, 10% from fungicides and 2% from plant growth nutrients. Branded formulations form 77% of revenues, technicals 13% and bulk formulations form the balance 10%. Domestic market accounts for 95% of the sales. B2C sales account for 77% of the total sales and B2B sales 23%. The company has a successful brand portfolio, with a track record of turning around acquired off-shelf brands into market leaders.
Exhibit 1: Insecticides form 63% of revenues
Source: Company, MOSL
Exhibit 2: Branded formulations form 77% of revenues
Source: Company, MOSL
Exhibit 3: B2C sales form 77% of total revenues
Source: Company, MOSL
Insecticides, 63%
Herbicides, 25%
Fungicides, 10%
Plant growth
nutrients, 2%
Branded formu-
lations, 77%
Technicals, 13%
Bulk formulation
s, 10%
B2C sales, 77%
B2B sales, 23%
Insecticides India
15 June 2015 5
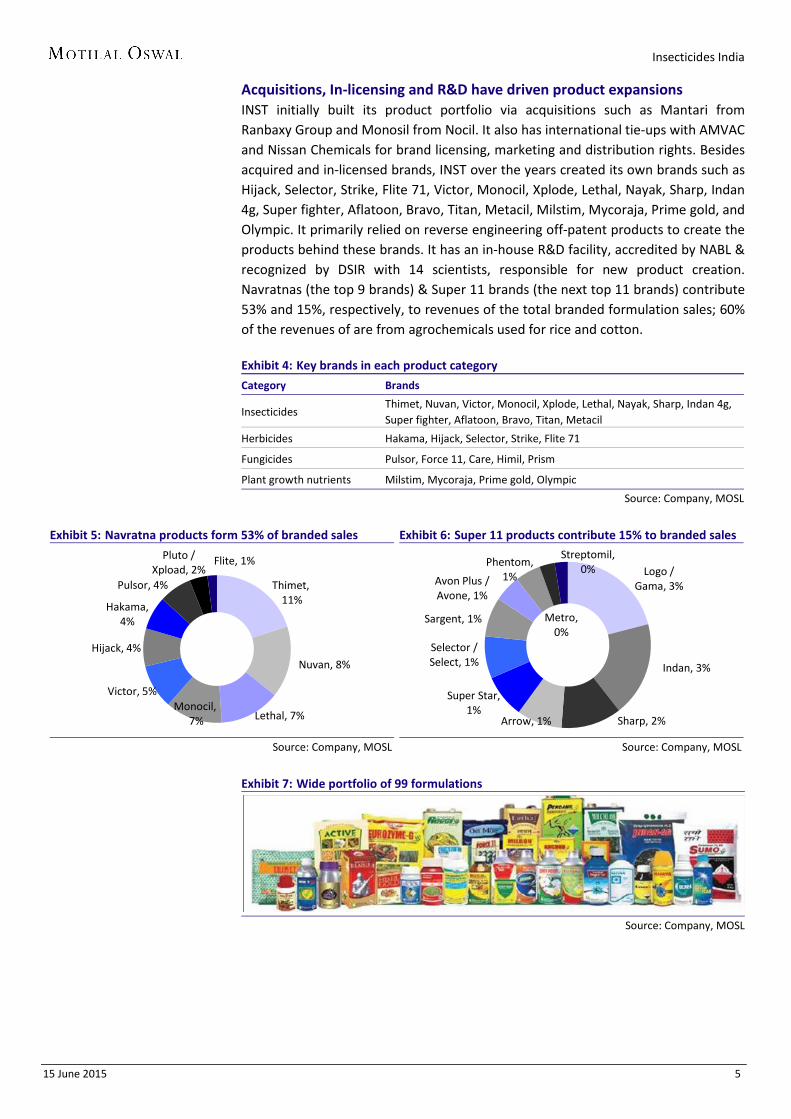
Acquisitions, In-licensing and R&D have driven product expansions INST initially built its product portfolio via acquisitions such as Mantari from Ranbaxy Group and Monosil from Nocil. It also has international tie-ups with AMVAC and Nissan Chemicals for brand licensing, marketing and distribution rights. Besides acquired and in-licensed brands, INST over the years created its own brands such as Hijack, Selector, Strike, Flite 71, Victor, Monocil, Xplode, Lethal, Nayak, Sharp, Indan 4g, Super fighter, Aflatoon, Bravo, Titan, Metacil, Milstim, Mycoraja, Prime gold, and Olympic. It primarily relied on reverse engineering off-patent products to create the products behind these brands. It has an in-house R&D facility, accredited by NABL & recognized by DSIR with 14 scientists, responsible for new product creation. Navratnas (the top 9 brands) & Super 11 brands (the next top 11 brands) contribute 53% and 15%, respectively, to revenues of the total branded formulation sales; 60% of the revenues of are from agrochemicals used for rice and cotton. Exhibit 4: Key brands in each product category
Category Brands
Insecticides Thimet, Nuvan, Victor, Monocil, Xplode, Lethal, Nayak, Sharp, Indan 4g, Super fighter, Aflatoon, Bravo, Titan, Metacil
Herbicides Hakama, Hijack, Selector, Strike, Flite 71
Fungicides Pulsor, Force 11, Care, Himil, Prism
Plant growth nutrients Milstim, Mycoraja, Prime gold, Olympic
Source: Company, MOSL
Exhibit 5: Navratna products form 53% of branded sales
Source: Company, MOSL
Exhibit 6: Super 11 products contribute 15% to branded sales
Source: Company, MOSL
Exhibit 7: Wide portfolio of 99 formulations
Source: Company, MOSL
Thimet, 11%
Nuvan, 8%
Lethal, 7% Monocil,
7%
Victor, 5%
Hijack, 4%
Hakama, 4%
Pulsor, 4%
Pluto / Xpload, 2%
Flite, 1% Logo /
Gama, 3%
Indan, 3%
Sharp, 2% Arrow, 1%
Super Star, 1%
Selector / Select, 1%
Sargent, 1%
Avon Plus / Avone, 1%
Phentom, 1%
Metro, 0%
Streptomil, 0%

Insecticides India
15 June 2015 6
Strong distribution network INST’s distribution network comprises over 5,000 distributors with pan-India presence through 29 depots/branches. Its footprint spreads across major crop producing regions, including Punjab, Haryana, Andhra Pradesh, Maharashtra, Uttar Pradesh, Karnataka, Tamil Nadu, Bihar, Gujarat and Madhya Pradesh.
Exhibit 8: Pan-India distribution network
Exhibit 9: Key milestones
Source: Company, MOSL
Insecticides India
15 June 2015 7
Branded formulations business: A success story Acquisitions, in-licensing and R&D have driven product expansions
INST has evolved into a strong player in the branded formulations business, led by acquisitions of off-the-shelf brands and converting them into successful products (Mantari acquisition from Ranbaxy Group and Monosil acquisition from Nocil).
INST complemented its acquisition strategy with in-licensing arrangements—acquiring rights for ‘Thimet’ brand from AMVAC in 2006, Nuvan, Hakama and Pulsor brands from AMVAC and Nissan in 2012.
Besides acquired and in-licensed brands, INST over the years created its own set of successful brands—primarily by reverse engineering off-patent products.
With the help of brand acquisitions, in-licensing arrangements and own product development, INST has developed a strong product portfolio of branded formulations, which contributes 77% to total revenues.
Successfully built a strong brand portfolio via acquisitions To improve scale and margins, INST (originally a bulk formulations player) made aggressive inroads into the branded formulations business via acquisitions of off-the-shelf brands and converting them into successful products. In 2003, it made its first brand acquisition by acquiring 21 leading brands of Mantari Industries (a group company of Ranbaxy). The acquisition was successful and the brands saw a significant rise in revenues within two years. It expanded its brand portfolio by acquiring the ‘Monosil’ brand from Nocil (a group company of Mafatlal) in 2011.
Complemented brand additions through in-licensing arrangements INST completed its acquisition strategy with in-licensing strategy and in 2006 acquired the exclusive rights from American Vanguard Corporation (AMVAC), USA to sell the ‘Thimet’ brand in India, which is today INST’s largest brand—(INR774m in revenues). This was followed by the launch of Nuvan, Hakama and Pulsor in collaboration with AMVAC and Nissan Chemicals in 2012. With its strong track record and distribution in the branded formulations business, INST has been a preferred partner for JVs. The terms of the license usually involve exclusive rights for the product along with three-year revenue targets; achievement of targets results in automatic renewal.
Developed new products through reverse engineering off-patent products Apart from acquired and in-licensed brands, INST over the years created its own brands such as Hijack, Selector, Strike, Flite 71, Victor, Xplode, Lethal, Nayak, Sharp, Indan 4g, Super fighter, Aflatoon, Bravo, Titan, Metacil, Milstim, Mycoraja, Prime gold, and Olympic. It primarily relied on reverse engineering off-patent products to create the products behind these brands. With the help of brand acquisitions, in-licensing arrangements with global players like AMVAC and Nissan, and own product development, INST has developed a strong product portfolio of branded formulations (contributes 77% to total revenues).
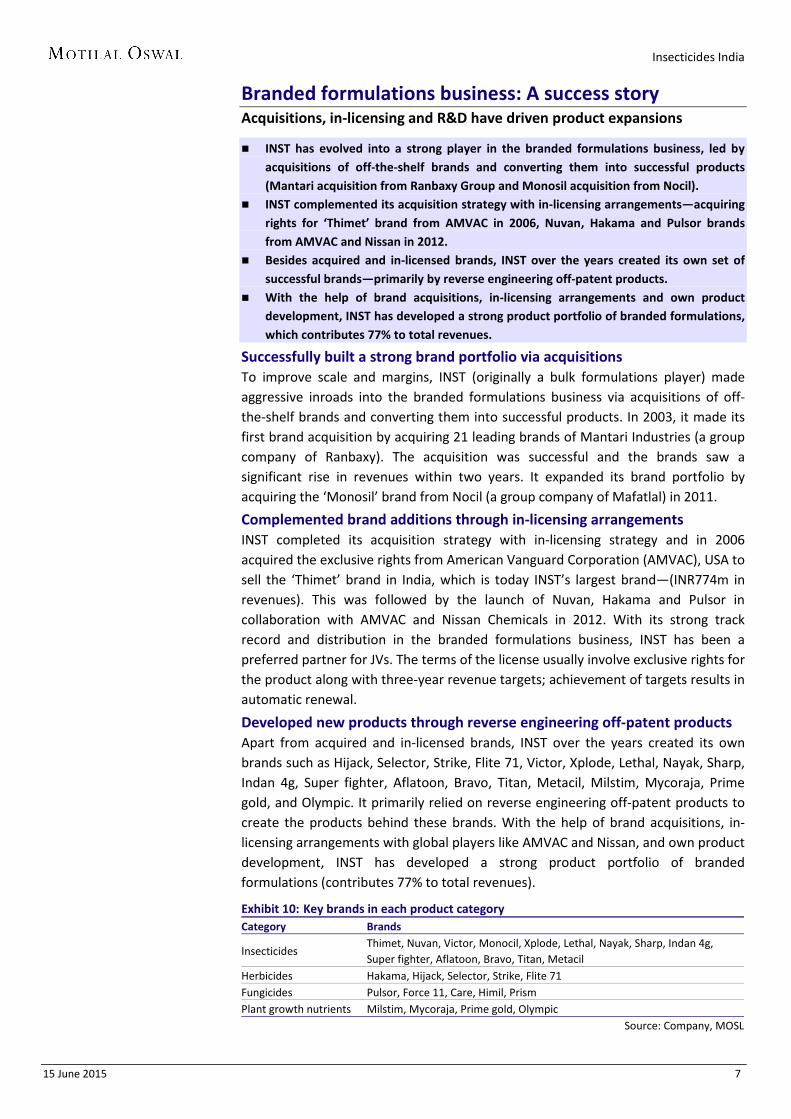
Exhibit 10: Key brands in each product category Category Brands
Insecticides Thimet, Nuvan, Victor, Monocil, Xplode, Lethal, Nayak, Sharp, Indan 4g, Super fighter, Aflatoon, Bravo, Titan, Metacil
Herbicides Hakama, Hijack, Selector, Strike, Flite 71 Fungicides Pulsor, Force 11, Care, Himil, Prism Plant growth nutrients Milstim, Mycoraja, Prime gold, Olympic
Source: Company, MOSL

Insecticides India
15 June 2015 8
Scaling up of existing brands and robust new product pipeline to drive growth and market share gain Revenue contribution from Top 20 brands to increase from 68.6% to 78.7%
We believe existing in-licensed brands ‘Hakama’ and ‘Pulsar’, which have completed their formative period (normally lasts three years and involves distributing free samples to farmers), will now enter growth phase and witness margin expansion.
We believe management’s strategy of focusing on top 20 brands will drive better focus on best-selling products and be margin accretive (as the top 20 brands enjoy 500bp higher margins than other brands).
Portfolio consolidation strategy has trimmed the brands portfolio over the last three years (from 120 to 99), thus ensuring higher revenue share from the top 20 brands (from 50.8% to 68.6% over FY12-15). We expect further reduction (to 75), taking revenues proportion from the top 20 brands to ~78.7% in FY17.
INST currently has five new in-licensing products in the pipeline. It has also developed 12 new products (through reverse engineering), which provide strong growth visibility.
Scaling up of existing in-licensed brands ‘Hakama’ and ‘Pulsar’ on cards INST entered into an in-licensing agreement with the Nissan Group in 2012 for ‘Hakama’ (used for soybean, paddy) and ‘Pulsar’ (used for Potato) brands. These brands are still in the formative years in India, with revenues of INR281m (Hakama) and INR276m (Pulsar). Our interaction with the management suggests that in the formative period (which normally lasts 3 years), the company aggressively markets the products (usually in the form of free samples to farmers) to showcase the superiority of the products. Hence, after the formative period is over, the brand witnesses strong revenue growth and margin expansion as free samples are no longer distributed and farmers demand the products because of their superiority. With both these brands now entering the fourth year of operations, we expect substantial scale up in revenues and significant margin expansion in these brands from FY16 onwards.
Exhibit 11: Navratna products form 53% of branded sales
Source: Company, MOSL
Exhibit 12: Super 11 products contribute 15% to branded sales
Source: Company, MOSL
Thimet, 11%
Nuvan, 8%
Lethal, 7% Monocil,
7%
Victor, 5%
Hijack, 4%
Hakama, 4%
Pulsor, 4%
Pluto / Xpload, 2%
Flite, 1% Logo /
Gama, 3%
Indan, 3%
Sharp, 2% Arrow, 1%
Super Star, 1%
Selector / Select, 1%
Sargent, 1%
Avon Plus / Avone, 1%
Phentom, 1%
Metro, 0%
Streptomil, 0%
Insecticides India
15 June 2015 9
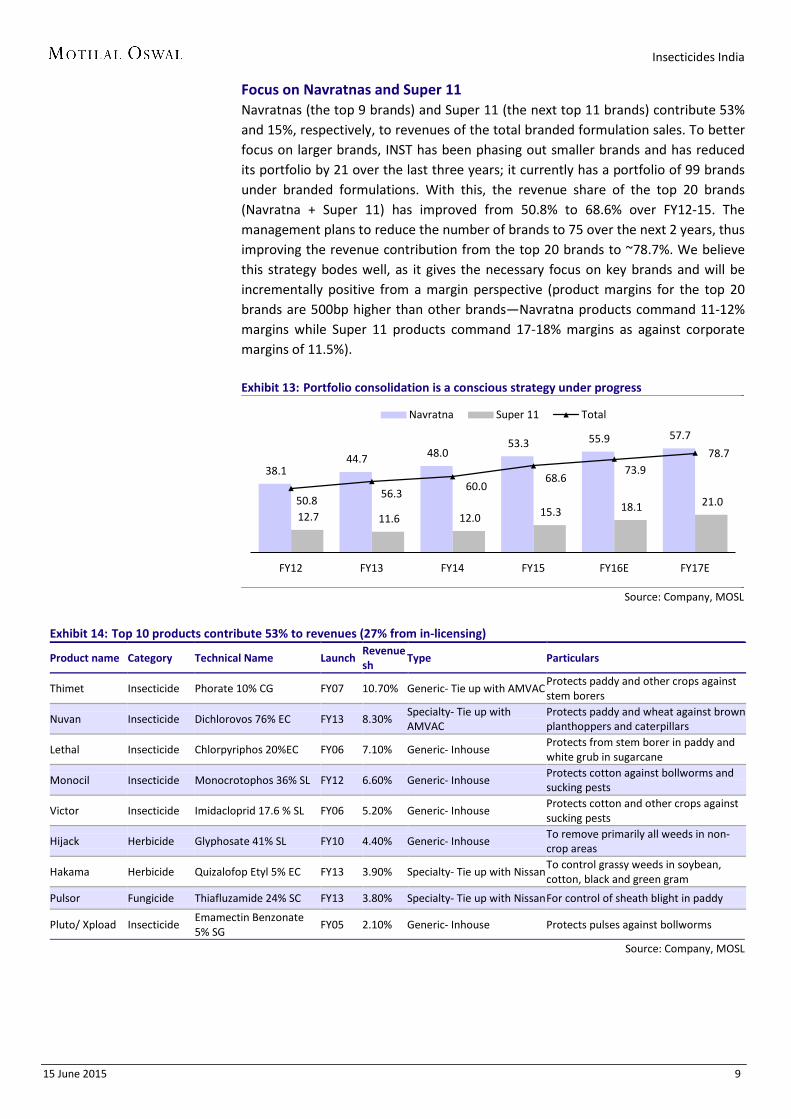
Focus on Navratnas and Super 11 Navratnas (the top 9 brands) and Super 11 (the next top 11 brands) contribute 53% and 15%, respectively, to revenues of the total branded formulation sales. To better focus on larger brands, INST has been phasing out smaller brands and has reduced its portfolio by 21 over the last three years; it currently has a portfolio of 99 brands under branded formulations. With this, the revenue share of the top 20 brands (Navratna + Super 11) has improved from 50.8% to 68.6% over FY12-15. The management plans to reduce the number of brands to 75 over the next 2 years, thus improving the revenue contribution from the top 20 brands to ~78.7%. We believe this strategy bodes well, as it gives the necessary focus on key brands and will be incrementally positive from a margin perspective (product margins for the top 20 brands are 500bp higher than other brands—Navratna products command 11-12% margins while Super 11 products command 17-18% margins as against corporate margins of 11.5%). Exhibit 13: Portfolio consolidation is a conscious strategy under progress
Source: Company, MOSL
Exhibit 14: Top 10 products contribute 53% to revenues (27% from in-licensing)
Product name Category Technical Name Launch Revenue sh
Type Particulars
Thimet Insecticide Phorate 10% CG FY07 10.70% Generic- Tie up with AMVAC Protects paddy and other crops against stem borers
Nuvan Insecticide Dichlorovos 76% EC FY13 8.30% Specialty- Tie up with AMVAC
Protects paddy and wheat against brown planthoppers and caterpillars
Lethal Insecticide Chlorpyriphos 20%EC FY06 7.10% Generic- Inhouse Protects from stem borer in paddy and white grub in sugarcane
Monocil Insecticide Monocrotophos 36% SL FY12 6.60% Generic- Inhouse Protects cotton against bollworms and sucking pests
Victor Insecticide Imidacloprid 17.6 % SL FY06 5.20% Generic- Inhouse Protects cotton and other crops against sucking pests
Hijack Herbicide Glyphosate 41% SL FY10 4.40% Generic- Inhouse To remove primarily all weeds in non-crop areas
Hakama Herbicide Quizalofop Etyl 5% EC FY13 3.90% Specialty- Tie up with Nissan To control grassy weeds in soybean, cotton, black and green gram
Pulsor Fungicide Thiafluzamide 24% SC FY13 3.80% Specialty- Tie up with Nissan For control of sheath blight in paddy
Pluto/ Xpload Insecticide Emamectin Benzonate 5% SG
FY05 2.10% Generic- Inhouse Protects pulses against bollworms
Source: Company, MOSL
38.1 44.7 48.0
53.3 55.9 57.7
12.7 11.6 12.0 15.3 18.1 21.0 50.8 56.3
60.0 68.6
73.9 78.7
FY12 FY13 FY14 FY15 FY16E FY17E
Navratna Super 11 Total

Insecticides India
15 June 2015 10
Exhibit 15: Key competitors of each product Product Name Revenue share Competitor’s Products Thimet 11% Umet (UPL), Phorotox (PI Industries) Nuvan 8% Doom (UPL), Lethal 7% Darsban (DOW), Classic (Cheminova), Chloroguard (Gharda) Monocil 7% Monostar (Swal), Lufos (Crystal), Phoskill (UPL) Victor 5% Confidor (Bayer), Tatamida (Tata), Camida (Caminova) Hijack 4% Round Up (Monsanto), Glycel (Excel), Glyfos (Cheminova) Hakama 4% Targa Super (Dhanuka), Quinella (Cheminova), Impul (Godrej), Kodama (Chambal Fert.) Pulsor 4% Exclusive Molecule Indan 3% Padan( Corromandal), Kaldan(Dhanuka), Xplode 2% Missile (Crystal), proclaim (Syngenta), Emnon (Maktesham), (Cheminova) Sharp 2% Manik (Rallis), Rekord (Dupont), Bismark (sudarshan), Tackil (biostat), Rapid (Crystal), Polar (Gharda) Arrow 1% Ektara (Syngenta) Super Star 1% Tolstar(FMC), Marker (Dhanuka), Wanted(Gharda), Disect (UPL) Sargent 1% Regent SC (Bayer) Flite 1% Mera 71 (Excel), Dakar (Cheminova) Phentom 1% Applaud (Rallis), Tribune (Crystal) Metro 0% Metador (Syngenta), Dabang(Safex)
Source: Company, MOSL
Strong new product pipeline lends good growth visibility INST currently has five in-licensed products in the pipeline and expects them to come on stream over the next 1-2 years, which will provide further growth momentum. INST has developed 12 new products (through reverse engineering), some of which are already in the pipeline for new registration. One of these products is technical of PI’s blockbuster product Nominee Gold, which is expected to be a strong growth and profitability driver for INST. The management expects to launch this product during FY17, which can witness significant scale-up over subsequent 3-5 years. Going forward, the management is targeting to launch products with broad-spectrum end-use (multi-crop/multi-pests) which will have a larger addressable market than narrow-spectrum products.
R&D center to help develop products in USD6b off-patent opportunity INST has developed an R&D centre at Chopanki (Rajasthan) for developing processes for new environmental-friendly formulations; the center is accredited with NABL (National Accreditation Board for Testing and Calibration Laboratories) and recognized by DSIR (Department of Scientific and Industrial Research). Its team includes 14 scientists, six engineers and five technicians. New products under agrochemicals have to be approved by Central Insecticides Board (CIB), which usually takes 3-5 years. Fresh product registration has to be filed under section 9:3 while registration for reverse engineered products has to be filed under section 9:4. The total viable opportunity through patent expiry is estimated at over USD6b by 2020, which opens up a large addressable market for generic players going forward.
R&D JV with OAT Agrio (Japan) to drive launch of new patented products INST has entered into a joint venture agreement with OAT Agrio (Japan) and has set up a new R&D facility at Chopanki (Rajasthan). OAT Agrio Co. Ltd. (Japan) is engaged in the manufacture and sale of agricultural chemicals and fertilizers in Japan with USD108m in revenue (2014). OAT plans to provide the technological know-how required in the invention of new agricultural molecules for domestic and international markets besides managing intellectual property. The JV will enable INST to launch new patented products in India and 14 other countries in Indian Sub-continent, Middle East, East–African countries with exclusive distribution rights.

Insecticides India
15 June 2015 11
Ramp-up of technicals to give fillip to growth Technicals contribution to revenues to increase from 16% to 19%
INST’s technicals business has posted a 38% CAGR over FY12-15, thus increasing revenue contribution from 11% in FY12 to 16% in FY15. INST manufactures off-patented technical products, of which ~50-60% are consumed in-house for manufacturing formulations and the remaining are sold in the open market.
With just 24% utilization at the Chopanki technical unit and 51% at the Dahej technical unit, we believe INST will be able to maintain a 40% CAGR in technicals over FY15-17; this will take contribution from technicals to 19% of total revenues.
Similarly, with minimal contribution of exports to INST’s revenue (~5%), and new initiatives to tap export markets (INST pursuing new registrations in the Middle East and Southeast Asia), we believe exports can be a significant growth driver.
With large manufacturing and R&D capacities in place, along with active engagements with Japanese OEMs, we believe INST is well placed to participate in CRAMS business.
Ramp-up of technicals on cards INST’s technicals business has posted a 38% CAGR over FY12-15, thus increasing revenue contribution from 11% in FY12 to 16% in FY15. INST manufactures off-patented technical products, of which ~50-60% are consumed in-house for manufacturing formulations and the remaining are sold in the open market to B2B formulators such as Dhanuka, PI Industries and Crystal. INST started manufacturing technicals in FY08 from its Chopanki unit. A new unit was set up at Dahej in FY13, which took the total capacity to 13,800MT. INST currently has more than 18 technical grade chemicals (such as glyphosate, imidacloprid, acetamiprid, and dichlorovos) under manufacturing. With just 24% utilization at the Chopanki technical unit and 51% at Dahej unit, we believe INST will be able to maintain 40% CAGR in technicals over FY15-17; this will take the revenue contribution from technicals to 19% of total revenues. Increasing geographical penetration through foray into export markets Though exports constitute ~50% of the Indian crop protection industry, their contribution to INST’s revenue is minimal at ~5%. The management is pursuing registrations in the Middle East and Southeast Asia, especially in countries such as Zambia, Uganda, Bangladesh, Vietnam, Oman, Muscat, Saudi Arabia, Ghana, and Singapore to tap into export markets for its products. We believe with registrations getting approved, and manufacturing facilities in place, exports can witness meaningful scale up over the next two to three years. CRAMs and contract manufacturing is a medium-term opportunity INST is all set to enter the prospective third-party manufacturing business. The sector presents a huge opportunity and INST has been preparing for it through its R&D capacity and focus on technology. The opportunity is attractive with increasing presence of MNCs in India (which have the technical know-how and capability to develop new molecules) and cost-effective manufacturing abilities. With active engagement with several Japanese OEMs, we believe INST is well placed to participate in CRAMS business from a medium-term perspective.

Insecticides India
15 June 2015 12
Aggressive capex done; ramp-up on cards Revenues can double without resort to further capex
Having commissioned INR2.5b capex over FY11-15, INST can double revenues from existing capacities (from INR9b to INR18b) without any major incremental capex.
With capacities in place, we believe ramp-up of revenues from existing branded products, launch of new molecules, potential scaling up of technicals business and just 65% capacity utilization currently, INST can post 18% revenue CAGR over FY15-17.
Aggressive capex done; FY16-18 to witness ramp-up of utilization INST forayed into technicals business to reduce dependence on imported raw materials, capitalize on earning margins in technicals value chain as well, and for backward integration of its formulations business. The beginning was modest (capacity of 3,800 MTPA in Rajasthan); this small capacity enabled INST to gain expertise in manufacturing technicals, which gave it the confidence to expand further in the technicals business. INST commissioned INR2.5b capex (which will deliver an asset turnover of ~4x) over FY11-15, adding 10,000 MTPA technical capacity and 14,500 MTPA formulations capacity at Dahej, adding 20,000 MTPA formulations capacity at Chopanki (Rajasthan) in FY15 and adding 2600 MTPA formulations unit at Udhampur (Jammu and Kashmir). The company faced teething problems with the Dahej technical facility, which impacted margins in FY14. However, INST overcame those problems and ensured higher utilization (51% in FY15) at the facility. INST is currently utilizing capacities at 65%, which will suffice to cater growth till FY18/19 thus entailing minimal capex. The management believes with the current product mix and price levels, it can generate revenues of INR18b from the current capacities (as against INR9.2b in FY15). Given the measures to ramp up revenues on existing branded products, launch of new molecules, scaling up of technicals business, and just 65% capacity utilization currently, we believe INST can post 18% revenue CAGR, 36% PAT CAGR over FY15-17 along with strong FCF generation (INR1.4b over FY15-17) and significant improvement in return ratios (RoCE and RoE to improve from 17.8% and 20.3% to 24.9% and 24.7%, respectively, over FY15-17). Exhibit 16: Gross block expanded by 7x over FY11-15
Source: Company, MOSL
365 584
1,530 1,896
2,756 3,006
3,256
FY11 FY12 FY13 FY14 FY15 FY16E FY17E
Gross block (INR m)
Insecticides India
15 June 2015 13
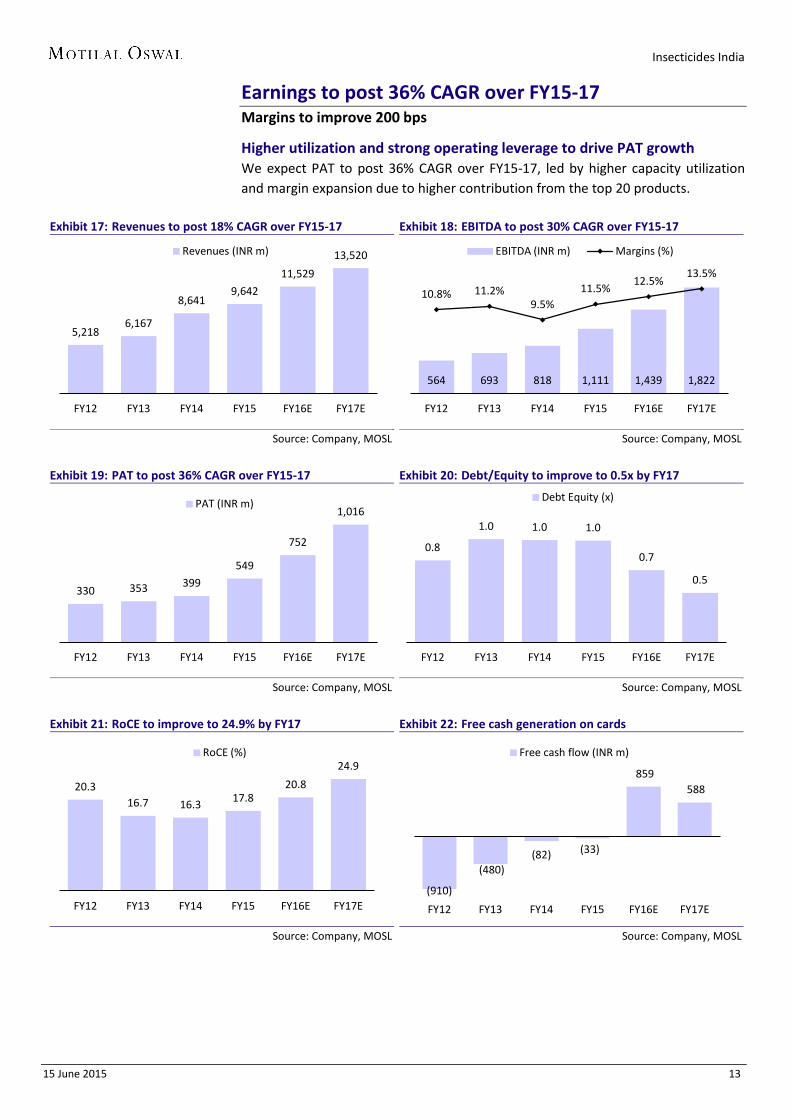
Earnings to post 36% CAGR over FY15-17 Margins to improve 200 bps
Higher utilization and strong operating leverage to drive PAT growth We expect PAT to post 36% CAGR over FY15-17, led by higher capacity utilization and margin expansion due to higher contribution from the top 20 products.
Exhibit 17: Revenues to post 18% CAGR over FY15-17
Source: Company, MOSL
Exhibit 18: EBITDA to post 30% CAGR over FY15-17
Source: Company, MOSL
Exhibit 19: PAT to post 36% CAGR over FY15-17
Source: Company, MOSL
Exhibit 20: Debt/Equity to improve to 0.5x by FY17
Source: Company, MOSL
Exhibit 21: RoCE to improve to 24.9% by FY17
Source: Company, MOSL
Exhibit 22: Free cash generation on cards
Source: Company, MOSL
5,218 6,167
8,641 9,642
11,529
13,520
FY12 FY13 FY14 FY15 FY16E FY17E
Revenues (INR m)
564 693 818 1,111 1,439 1,822
10.8% 11.2% 9.5%
11.5% 12.5%
13.5%
FY12 FY13 FY14 FY15 FY16E FY17E
EBITDA (INR m) Margins (%)
330 353 399
549
752
1,016
FY12 FY13 FY14 FY15 FY16E FY17E
PAT (INR m)
0.8
1.0 1.0 1.0
0.7
0.5
FY12 FY13 FY14 FY15 FY16E FY17E
Debt Equity (x)
20.3 16.7 16.3 17.8
20.8
24.9
FY12 FY13 FY14 FY15 FY16E FY17E
RoCE (%)
(910)
(480) (82) (33)
859 588
FY12 FY13 FY14 FY15 FY16E FY17E
Free cash flow (INR m)

Insecticides India
15 June 2015 14
Valuation and view Initiate with Buy
Capacity utilization ramp-up to drive FCF generation and return ratios Given the measures to ramp up revenues on existing branded products, launch of new molecules, scaling up of technicals business, and just 65% capacity utilization currently, we believe INST can post 18% revenue CAGR, 36% PAT CAGR over FY15-17 along with strong FCF generation (INR1.4b over FY15-17) and significant improvement in return ratios (RoCE and RoE to improve from 17.8% and 20.3% to 24.9% and 24.7%, respectively, over FY15-17. With significant improvement in metrics, we believe valuations at 12.9x FY16 and 9.5x FY17 are attractive as compared with peer group average of 26x FY16 and 21x FY17, warranting a re-rating. We initiate coverage with a ‘Buy’ rating with a PT of INR800 (15x FY17).
Exhibit 23: Price to Earnings (one year forward)
Source: Company, MOSL
Exhibit 24: Price to book (one year forward)
Source: Company, MOSL
Exhibit 25: Peer comparison
Company Name CMP (INR) Market
Cap (INR b) PE (x) ROE (%)
FY15 FY16E FY17E FY15 FY16E FY17E
Insecticides India Ltd 509 10 17.6 12.7 9.4 20.3 23.3 25.2
Bayer CropScience Ltd/India 3,718 136 35.6 29.6 24.8 20.3 19.6 20.3
PI Industries Ltd 609 83 33.8 27.3 21.1 30.9 29.1 29.5
Rallis India Ltd 226 44 27.9 22.5 18.4 20.5 22.1 23.1
Dhanuka Agritech Ltd 593 30 27.9 23.9 19.7 28.5 27.2 26.8
Average
31.3 25.8 21.0 25.1 24.5 24.9
Source: Bloomberg, MOSL
12.9 11.7
0
5
10
15
20
May
-07
Jul-0
8
Sep-
09
Nov
-10
Jan-
12
Feb-
13
Apr-
14
Jun-
15
P/E (x) 5 Yrs Avg(x)
1.7 1.3
0.0
1.0
2.0
3.0 M
ay-0
7
Jul-0
8
Sep-
09
Nov
-10
Jan-
12
Feb-
13
Apr-
14
Jun-
15
P/B (x) 5 Yrs Avg(x)
Insecticides India
15 June 2015 15
Key risks Uncertain monsoon: Unfavorable monsoon is the biggest risk for the domestic
agrochemical sector. Delayed or deficient rainfall results in sales return and, thus, negatively impacts growth. Similarly, unseasonal rainfall can damage standing crops, resulting in income loss for farmers.
Lower prices of agricultural produce: Decline in prices of agricultural commodities or lower MSP (minimum support price) can reduce farm incomes and, consequently, demand for agri-inputs. Unlike fertilizers, prices of agrochemicals are not subsidized and farmers may choose to decrease their purchase of agrochemicals to lower their production cost.
Delay in getting approvals for new products: Registration of pesticides is a time-consuming process in India. It can take 2-4 years to launch a new molecule. Delay in getting approvals could lead to loss of potential profit opportunity in that product.
Forex fluctuations: Imported raw materials constitute 30% of the total raw materials, thus exposing it to fluctuations in foreign exchange. The management plans to increase exports, which will act as a natural hedge.
Insecticides India
15 June 2015 16
Management overview
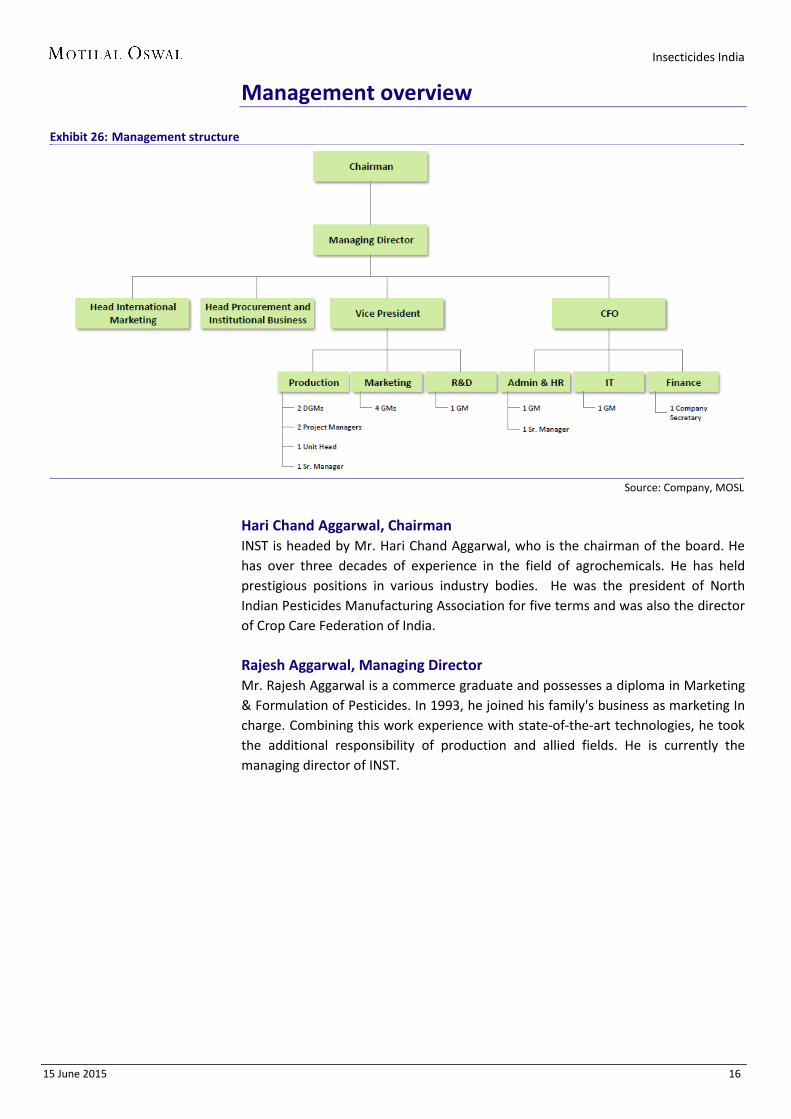
Exhibit 26: Management structure
Source: Company, MOSL
Hari Chand Aggarwal, Chairman INST is headed by Mr. Hari Chand Aggarwal, who is the chairman of the board. He has over three decades of experience in the field of agrochemicals. He has held prestigious positions in various industry bodies. He was the president of North Indian Pesticides Manufacturing Association for five terms and was also the director of Crop Care Federation of India.
Rajesh Aggarwal, Managing Director Mr. Rajesh Aggarwal is a commerce graduate and possesses a diploma in Marketing & Formulation of Pesticides. In 1993, he joined his family's business as marketing In charge. Combining this work experience with state-of-the-art technologies, he took the additional responsibility of production and allied fields. He is currently the managing director of INST.

Insecticides India
15 June 2015 17
Industry overview Strong growth potential for Indian agrochemical sector India’s crop protection industry is estimated at USD4.3b, of which domestic industry forms 52% (USD2.3b) and exports form the balance 48% (USD2b). According to CRISIL, the industry is expected to post 12% CAGR over FY14-19 to reach USD7.5b. Domestic/exports are expected to grow at 8% (to USD3.3b) and 16% (to USD4.2b). Given the minimal pesticide penetration in India (0.75 kgs/Ha as against global average of 10kgs/Ha), growth prospects for Indian industry are strong. Over 400 companies operate in the domestic market and can be broadly categorized under three heads: a) MNCs—30% market share, b) Indian organized—50% market share, and c) unorganized—20% market share.
Exhibit 27: India’s agro-chem market valued at USD4.3b
Source: Company, MOSL
Exhibit 28: Pesticide consumption lowest in India
Source: Company, MOSL
Exhibit 29: Indian organized sector dominates the domestic agro-chem market
Source: Company, MOSL
Key growth drivers Growing food demand with limited land availability will lead to higher focus on
crop yields. Escalating labor costs are driving demand for herbicides (as against manual weed cutting), thus ensuring higher agrochemicals. India’s pesticide consumption (0.75 Kgs/Ha) is amongst the lowest gloablly.
Strong export opportunity: Low-cost manufacturing, availability of technically skilled manpower, seasonal domestic demand, available capacity, better price realization globally and strong presence in generic pesticide manufacturing.
Agrochemicals worth USD6.3b are expected to be taken off-patent list by 2020; this presents a large opportunity for Indian companies to participate in global generics business.
Domestic market,
52%
Exports, 48% 0.75
5 5 7 7
12 13
17
India UK France Korea USA Japan China Taiwan
Pesticides consumption (Kgs/Ha)
MNCs, 30%
Indian Organized, 50%
Indian Unorganized, 20%
Insecticides India
15 June 2015 18
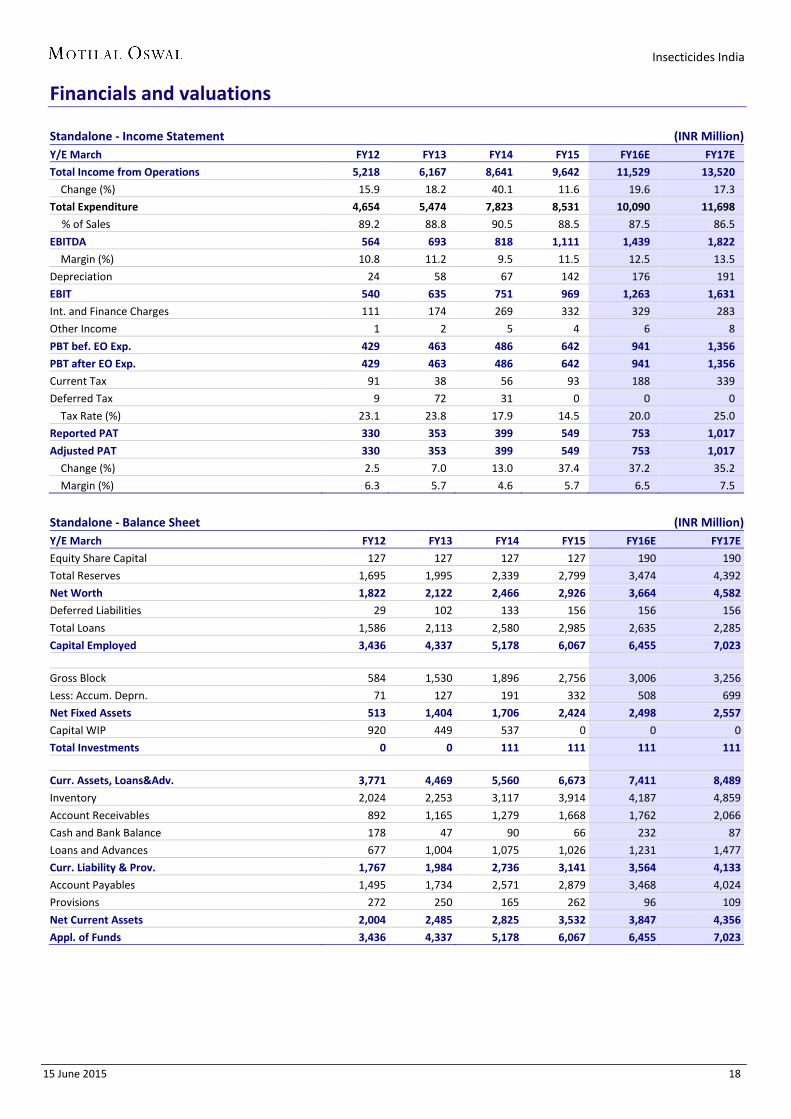
Financials and valuations
Standalone - Income Statement (INR Million) Y/E March FY12 FY13 FY14 FY15 FY16E FY17E
Total Income from Operations 5,218 6,167 8,641 9,642 11,529 13,520
Change (%) 15.9 18.2 40.1 11.6 19.6 17.3
Total Expenditure 4,654 5,474 7,823 8,531 10,090 11,698
% of Sales 89.2 88.8 90.5 88.5 87.5 86.5
EBITDA 564 693 818 1,111 1,439 1,822
Margin (%) 10.8 11.2 9.5 11.5 12.5 13.5
Depreciation 24 58 67 142 176 191
EBIT 540 635 751 969 1,263 1,631
Int. and Finance Charges 111 174 269 332 329 283
Other Income 1 2 5 4 6 8
PBT bef. EO Exp. 429 463 486 642 941 1,356
PBT after EO Exp. 429 463 486 642 941 1,356
Current Tax 91 38 56 93 188 339
Deferred Tax 9 72 31 0 0 0
Tax Rate (%) 23.1 23.8 17.9 14.5 20.0 25.0
Reported PAT 330 353 399 549 753 1,017
Adjusted PAT 330 353 399 549 753 1,017
Change (%) 2.5 7.0 13.0 37.4 37.2 35.2
Margin (%) 6.3 5.7 4.6 5.7 6.5 7.5
Standalone - Balance Sheet (INR Million) Y/E March FY12 FY13 FY14 FY15 FY16E FY17E
Equity Share Capital 127 127 127 127 190 190
Total Reserves 1,695 1,995 2,339 2,799 3,474 4,392
Net Worth 1,822 2,122 2,466 2,926 3,664 4,582
Deferred Liabilities 29 102 133 156 156 156
Total Loans 1,586 2,113 2,580 2,985 2,635 2,285
Capital Employed 3,436 4,337 5,178 6,067 6,455 7,023
Gross Block 584 1,530 1,896 2,756 3,006 3,256
Less: Accum. Deprn. 71 127 191 332 508 699
Net Fixed Assets 513 1,404 1,706 2,424 2,498 2,557
Capital WIP 920 449 537 0 0 0
Total Investments 0 0 111 111 111 111
Curr. Assets, Loans&Adv. 3,771 4,469 5,560 6,673 7,411 8,489
Inventory 2,024 2,253 3,117 3,914 4,187 4,859
Account Receivables 892 1,165 1,279 1,668 1,762 2,066
Cash and Bank Balance 178 47 90 66 232 87
Loans and Advances 677 1,004 1,075 1,026 1,231 1,477
Curr. Liability & Prov. 1,767 1,984 2,736 3,141 3,564 4,133
Account Payables 1,495 1,734 2,571 2,879 3,468 4,024
Provisions 272 250 165 262 96 109
Net Current Assets 2,004 2,485 2,825 3,532 3,847 4,356
Appl. of Funds 3,436 4,337 5,178 6,067 6,455 7,023

Insecticides India
15 June 2015 19
Financials and valuations
Ratios Y/E March FY12 FY13 FY14 FY15 FY16E FY17E
Basic (INR)
EPS 17.4 18.6 21.0 28.8 39.6 53.5
Cash EPS 27.9 32.4 36.7 54.4 48.8 63.5
BV/Share 95.8 111.6 129.6 153.8 192.6 240.9
DPS 2.5 3.0 3.0 2.5 3.5 4.5
Payout (%) 11.1 12.6 11.1 6.7 10.3 9.8
Valuation (x)
P/E 24.3 17.7 12.9 9.5
Cash P/E 13.9 9.4 10.4 8.0
P/BV 3.9 2.2 2.6 2.1
EV/Sales 1.0 0.9 0.7 0.6 EV/EBITDA 10.6 8.2 6.0 4.6
Dividend Yield (%) 0.5 0.6 0.6 0.5 0.7 0.9
FCF per share -71.8 -37.8 -6.5 -2.6 45.1 30.9
Return Ratios (%)
RoE 19.6 17.9 17.4 20.3 22.8 24.7
RoCE 20.3 16.7 16.3 17.8 20.8 24.9
Working Capital Ratios
Asset Turnover (x) 1.5 1.4 1.7 1.6 1.8 1.9
Inventory (Days) 141.6 133.4 131.6 148.2 132.6 131.2
Debtor (Days) 59 65 51 59 52 52
Creditor (Days) 173 170 175 162 164 164
Working Cap. Turnover (Days) 128 144 116 131 114 115 Leverage Ratio (x)
Current Ratio 2.1 2.3 2.0 2.1 2.1 2.1
Interest Cover Ratio 5 4 3 3 4 6
Debt/Equity 0.9 1.0 1.0 1.0 0.7 0.5
Standalone - Cash Flow Statement (INR Million) Y/E March FY12 FY13 FY14 FY15 FY16E FY17E
OP/(Loss) before Tax 429 464 487 642 941 1,356
Depreciation 24 58 67 142 176 191
Interest & Finance Charges 111 117 157 332 329 283 Direct Taxes Paid -87 -107 -84 -93 -188 -339
(Inc)/Dec in WC -839 -534 -251 -732 -148 -653
CF from Operations -362 -3 375 290 1,109 838
Others 3 -11 2 0 0 0
CF from Operating incl EO -359 -13 377 290 1,109 838
(inc)/dec in FA -551 -467 -459 -323 -250 -250
Free Cash Flow -910 -480 -82 -33 859 588
(Pur)/Sale of Investments 0 0 -111 0 0 0
Others 1 2 2 0 0 0
CF from Investments -550 -465 -567 -323 -250 -250
Issue of Shares 0 0 0 0 63 0
(Inc)/Dec in Debt 1,198 0 0 405 -350 -350 Interest Paid -111 -119 -159 -332 -329 -283
Dividend Paid -32 -32 -38 -37 -77 -99
CF from Fin. Activity 1,049 347 234 8 -693 -732
Inc/Dec of Cash 140 -131 44 -25 166 -144
Opening Balance 37 178 47 90 66 232
Closing Balance 178 47 90 66 232 87

Insecticides India
15 June 2015 20
Our reports on Agri Sector

Insecticides India
15 June 2015 21
N O T E S

Insecticides India
15 June 2015 22
Disclosures This document has been prepared by Motilal Oswal Securities Limited (hereinafter referred to as Most) to provide information about the company(ies) and/sector(s), if any, covered in the report and may be distributed by it and/or its affiliated company(ies). This report is for personal information of the selected recipient/s and does not construe to be any investment, legal or taxation advice to you. This research report does not constitute an offer, invitation or inducement to invest in securities or other investments and Motilal Oswal Securities Limited (hereinafter referred as MOSt) is not soliciting any action based upon it. This report is not for public distribution and has been furnished to you solely for your general information and should not be reproduced or redistributed to any other person in any form. This report does not constitute a personal recommendation or take into account the particular investment objectives, financial situations, or needs of individual clients. Before acting on any advice or recommendation in this material, investors should consider whether it is suitable for their particular circumstances and, if necessary, seek professional advice. The price and value of the investments referred to in this material and the income from them may go down as well as up, and investors may realize losses on any investments. Past performance is not a guide for future performance, future returns are not guaranteed and a loss of original capital may occur.
MOSt and its affiliates are a full-service, integrated investment banking, investment management, brokerage and financing group. We and our affiliates have investment banking and other business relationships with a some companies covered by our Research Department. Our research professionals may provide input into our investment banking and other business selection processes. Investors should assume that MOSt and/or its affiliates are seeking or will seek investment banking or other business from the company or companies that are the subject of this material and that the research professionals who were involved in preparing this material may educate investors on investments in such business. The research professionals responsible for the preparation of this document may interact with trading desk personnel, sales personnel and other parties for the purpose of gathering, applying and interpreting information. Our research professionals are paid on the profitability of MOSt which may include earnings from investment banking and other business.
MOSt generally prohibits its analysts, persons reporting to analysts, and members of their households from maintaining a financial interest in the securities or derivatives of any companies that the analysts cover. Additionally, MOSt generally prohibits its analysts and persons reporting to analysts from serving as an officer, director, or advisory board member of any companies that the analysts cover. Our salespeople, traders, and other professionals or affiliates may provide oral or written market commentary or trading strategies to our clients that reflect opinions that are contrary to the opinions expressed herein, and our proprietary trading and investing businesses may make investment decisions that are inconsistent with the recommendations expressed herein. In reviewing these materials, you should be aware that any or all of the foregoing among other things, may give rise to real or potential conflicts of interest. MOSt and its affiliated company(ies), their directors and employees and their relatives may; (a) from time to time, have a long or short position in, act as principal in, and buy or sell the securities or derivatives thereof of companies mentioned herein. (b) be engaged in any other transaction involving such securities and earn brokerage or other compensation or act as a market maker in the financial instruments of the company(ies) discussed herein or act as an advisor or lender/borrower to such company(ies) or may have any other potential conflict of interests with respect to any recommendation and other related information and opinions.; however the same shall have no bearing whatsoever on the specific recommendations made by the analyst(s), as the recommendations made by the analyst(s) are completely independent of the views of the affiliates of MOSt even though there might exist an inherent conflict of interest in some of the stocks mentioned in the research report Reports based on technical and derivative analysis center on studying charts company's price movement, outstanding positions and trading volume, as opposed to focusing on a company's fundamentals and, as such, may not match with a report on a company's fundamental analysis. In addition MOST has different business segments / Divisions with independent research separated by Chinese walls catering to different set of customers having various objectives, risk profiles, investment horizon, etc, and therefore may at times have different contrary views on stocks sectors and markets.
Unauthorized disclosure, use, dissemination or copying (either whole or partial) of this information, is prohibited. The person accessing this information specifically agrees to exempt MOSt or any of its affiliates or employees from, any and all responsibility/liability arising from such misuse and agrees not to hold MOSt or any of its affiliates or employees responsible for any such misuse and further agrees to hold MOSt or any of its affiliates or employees free and harmless from all losses, costs, damages, expenses that may be suffered by the person accessing this information due to any errors and delays. The information contained herein is based on publicly available data or other sources believed to be reliable. Any statements contained in this report attributed to a third party represent MOSt’s interpretation of the data, information and/or opinions provided by that third party either publicly or through a subscription service, and such use and interpretation have not been reviewed by the third party. This Report is not intended to be a complete statement or summary of the securities, markets or developments referred to in the document. While we would endeavor to update the information herein on reasonable basis, MOSt and/or its affiliates are under no obligation to update the information. Also there may be regulatory, compliance, or other reasons that may prevent MOSt and/or its affiliates from doing so. MOSt or any of its affiliates or employees shall not be in any way responsible and liable for any loss or damage that may arise to any person from any inadvertent error in the information contained in this report. MOSt or any of its affiliates or employees do not provide, at any time, any express or implied warranty of any kind, regarding any matter pertaining to this report, including without limitation the implied warranties of merchantability, fitness for a particular purpose, and non-infringement. The recipients of this report should rely on their own investigations.
This report is intended for distribution to institutional investors. Recipients who are not institutional investors should seek advice of their independent financial advisor prior to taking any investment decision based on this report or for any necessary explanation of its contents.
Most and it’s associates may have managed or co-managed public offering of securities, may have received compensation for investment banking or merchant banking or brokerage services, may have received any compensation for products or services other than investment banking or merchant banking or brokerage services from the subject company in the past 12 months. Most and it’s associates have not received any compensation or other benefits from the subject company or third party in connection with the research report. Subject Company may have been a client of Most or its associates during twelve months preceding the date of distribution of the research report
MOSt and/or its affiliates and/or employees may have interests/positions, financial or otherwise of over 1 % at the end of the month immediately preceding the date of publication of the research in the securities mentioned in this report. To enhance transparency, MOSt has incorporated a Disclosure of Interest Statement in this document. This should, however, not be treated as endorsement of the views expressed in the report.
Motilal Oswal Securities Limited is registered as a Research Analyst under SEBI (Research Analyst) Regulations, 2014. SEBI Reg. No. INH000000412
There are no material disciplinary action that been taken by any regulatory authority impacting equity research analysis activities
Analyst Certification The views expressed in this research report accurately reflect the personal views of the analyst(s) about the subject securities or issues, and no part of the compensation of the research analyst(s) was, is, or will be directly or indirectly related to the specific recommendations and views expressed by research analyst(s) in this report. The research analysts, strategists, or research associates principally responsible for preparation of MOSt research receive compensation based upon various factors, including quality of research, investor client feedback, stock picking, competitive factors and firm revenues
Disclosure of Interest Statement INSECTICIDES INDIA Analyst ownership of the stock No Served as an officer, director or employee No
A graph of daily closing prices of securities is available at www.nseindia.com and http://economictimes.indiatimes.com/markets/stocks/stock-quotes
Regional Disclosures (outside India) This report is not directed or intended for distribution to or use by any person or entity resident in a state, country or any jurisdiction, where such distribution, publication, availability or use would be contrary to law, regulation or which would subject MOSt & its group companies to registration or licensing requirements within such jurisdictions.
For U.S. Motilal Oswal Securities Limited (MOSL) is not a registered broker - dealer under the U.S. Securities Exchange Act of 1934, as amended (the"1934 act") and under applicable state laws in the United States. In addition MOSL is not a registered investment adviser under the U.S. Investment Advisers Act of 1940, as amended (the "Advisers Act" and together with the 1934 Act, the "Acts), and under applicable state laws in the United States. Accordingly, in the absence of specific exemption under the Acts, any brokerage and investment services provided by MOSL, including the products and services described herein are not available to or intended for U.S. persons.
This report is intended for distribution only to "Major Institutional Investors" as defined by Rule 15a-6(b)(4) of the Exchange Act and interpretations thereof by SEC (henceforth referred to as "major institutional investors"). This document must not be acted on or relied on by persons who are not major institutional investors. Any investment or investment activity to which this document relates is only available to major institutional investors and will be engaged in only with major institutional investors. In reliance on the exemption from registration provided by Rule 15a-6 of the U.S. Securities Exchange Act of 1934, as amended (the "Exchange Act") and interpretations thereof by the U.S. Securities and Exchange Commission ("SEC") in order to conduct business with Institutional Investors based in the U.S., MOSL has entered into a chaperoning agreement with a U.S. registered broker-dealer, Motilal Oswal Securities International Private Limited. ("MOSIPL"). Any business interaction pursuant to this report will have to be executed within the provisions of this chaperoning agreement.
The Research Analysts contributing to the report may not be registered /qualified as research analyst with FINRA. Such research analyst may not be associated persons of the U.S. registered broker-dealer, MOSIPL, and therefore, may not be subject to NASD rule 2711 and NYSE Rule 472 restrictions on communication with a subject company, public appearances and trading securities held by a research analyst account.
For Singapore Motilal Oswal Capital Markets Singapore Pte Limited is acting as an exempt financial advisor under section 23(1)(f) of the Financial Advisers Act(FAA) read with regulation 17(1)(d) of the Financial Advisors Regulations and is a subsidiary of Motilal Oswal Securities Limited in India. This research is distributed in Singapore by Motilal Oswal Capital Markets Singapore Pte Limited and it is only directed in Singapore to accredited investors, as defined in the Financial Advisers Regulations and the Securities and Futures Act (Chapter 289), as amended from time to time. In respect of any matter arising from or in connection with the research you could contact the following representatives of Motilal Oswal Capital Markets Singapore Pte Limited: Anosh Koppikar Kadambari Balachandran Email : [email protected] Email : [email protected] Contact : (+65)68189232 Contact : (+65) 68189233 / 65249115 Office Address : 21 (Suite 31),16 Collyer Quay,Singapore 04931
Motilal Oswal Securities Ltd
Motilal Oswal Tower, Level 9, Sayani Road, Prabhadevi, Mumbai 400 025 Phone: +91 22 3982 5500 E-mail: [email protected]


