DO NOT QUOTE OR CITE WITHOUT PERMISSION PRELIMINARY DRAFT Business Dynamics of Innovating Firms: Linking U.S. Patent Data with Administrative Data on Workers and Firms April 1, 2015 Stuart Graham, Cheryl Grim, Tariqul Islam, Alan Marco, and Javier Miranda* Abstract This paper discusses the construction of a new longitudinal database tracking inventors and patent owning firms over time. We match granted patents between 2000 and 2011 to administrative databases of firms and workers housed at the U.S. Census Bureau. We use both the patent assignee and inventor information to triangulate the data and improve on patent owner disambiguation. The triangulated database allows us to maximize the match rates while providing validation for a large portion of them. We describe the data construction and explore basic features of the data. We find patenting firms, particularly young patenting firms, disproportionally contribute jobs to the U.S. economy. We find patenting is a relatively rare event among small firms but that most patenting firms are nevertheless small, and that patenting is not as rare an event for the youngest firms compared to the oldest firms. While manufacturing firms tend to patent the most, we find most patenting firms are in the services and wholesale sectors. These new data are a product of a collaboration within the U.S. Department of Commerce, between the U.S. Census Bureau and the U.S. Patent and Trademark Office. * Corresponding author is Javier Miranda ([email protected]). Graham, Georgia Institute of Technology and U.S. Patent and Trademark Office; Grim and Miranda, U.S. Census Bureau; Islam, Environmental and Health Sciences; Marco, U.S. Patent and Trademark Office. We thank Kirsten Apple and Jim Hirabayashi for their assistance in answering many questions related to the U.S. Patent and Trademark Office data and processes. We thank Deborah Wagner and Juan Carlos Humud for their work to assign protected identity keys to inventors. Any opinions and conclusions in this paper are those of the authors and do not necessarily represent the views of the U.S. Census Bureau or the U.S. Patent and Trademark Office. All results have been reviewed to ensure that no confidential data are disclosed. 1
Transcript
DO NOT QUOTE OR CITE WITHOUT PERMISSION PRELIMINARY DRAFT
Business Dynamics of Innovating Firms: Linking U.S. Patent Data with Administrative Data on Workers and Firms
April 1, 2015
Stuart Graham, Cheryl Grim, Tariqul Islam, Alan Marco, and Javier Miranda*
Abstract
This paper discusses the construction of a new longitudinal database tracking inventors and patent owning firms over time. We match granted patents between 2000 and 2011 to administrative databases of firms and workers housed at the U.S. Census Bureau. We use both the patent assignee and inventor information to triangulate the data and improve on patent owner disambiguation. The triangulated database allows us to maximize the match rates while providing validation for a large portion of them. We describe the data construction and explore basic features of the data. We find patenting firms, particularly young patenting firms, disproportionally contribute jobs to the U.S. economy. We find patenting is a relatively rare event among small firms but that most patenting firms are nevertheless small, and that patenting is not as rare an event for the youngest firms compared to the oldest firms. While manufacturing firms tend to patent the most, we find most patenting firms are in the services and wholesale sectors. These new data are a product of a collaboration within the U.S. Department of Commerce, between the U.S. Census Bureau and the U.S. Patent and Trademark Office.
* Corresponding author is Javier Miranda ([email protected]). Graham, Georgia Institute of Technology and U.S. Patent and Trademark Office; Grim and Miranda, U.S. Census Bureau; Islam, Environmental and Health Sciences; Marco, U.S. Patent and Trademark Office. We thank Kirsten Apple and Jim Hirabayashi for their assistance in answering many questions related to the U.S. Patent and Trademark Office data and processes. We thank Deborah Wagner and Juan Carlos Humud for their work to assign protected identity keys to inventors. Any opinions and conclusions in this paper are those of the authors and do not necessarily represent the views of the U.S. Census Bureau or the U.S. Patent and Trademark Office. All results have been reviewed to ensure that no confidential data are disclosed.
DO NOT QUOTE OR CITE WITHOUT PERMISSION PRELIMINARY DRAFT
1. Introduction
Policy makers, researchers and the public are interested in understanding the sources of job creation and
economic growth in the U.S. economy. Innovative firms are believed to play an important role in this
regard, introducing new products or services that satisfy a previously unmet need or introduce processes
that provide existing goods and services in new and more efficient ways. These firms will prosper and
grow while their competitors will adjust and respond with further innovations of their own, or become
obsolete and eventually exit the market. The reallocation of resources from less productive, less efficient
firms to more productive firms is in large measure responsible productivity gains that ultimately drive the
long-term improvements in our standards of living. Despite the importance of this innovation and
reallocation process to U.S. economic growth, our understanding of the particular firms at the center of
the innovation activities and their role in reallocation and productivity growth is still very limited.1
The current debate concerning the value of more recent innovations relative to the great
breakthroughs of the past is a clear indication of our inability to track the impact innovative activity has
on reallocation and productivity growth in the U.S. There are two reasons for this. First, it is hard to
identify innovative firms. Data on the innovative activities of firms is difficult to measure because the
outputs of innovation (e.g., knowledge, networks, new process, new software, and marketing) are
challenging to quantify. As a consequence, the field lacks a properly defined identifying frame. Second
and relatedly, researchers often rely on inputs to innovation such as R&D expenditures as a proxy for
innovation or technological progress because measuring innovation is difficult. However, R&D survey
data are at best an imperfect measure of the inputs of innovation, and are typically skewed towards the
largest firms thus missing the smaller and younger firms – the most dynamic segment in the US
economy.2
1 See Cohen (2010) in the Handbook of the Economics of Innovation for a review of the literature in this area. 2 Most of what we know in this area is based on cross sectional samples of R&D expenditure survey data. R&D survey frames are identified from administrative records and other available information. For example, a firm is
2
DO NOT QUOTE OR CITE WITHOUT PERMISSION PRELIMINARY DRAFT
This paper discusses a new longitudinal linked patent-business database tracking patenting firms
and inventors over time created under a joint effort between the U.S. Census Bureau and the U.S. Patent
and Trademark Office (USPTO). Information contained in granted patents allows us to capture those the
types of inventive activity that result in a U.S. patent. In this initial research effort, we match patents
issued in the U.S. between 2000 and 2011 independently to two Census Bureau administrative databases,
one of businesses (firms) and the other of workers. Prior efforts have used the assignee information
contained in patent documents to identify the firms where the innovation is taking place [see Hall, Jaffe,
and Trajtenberg (2002), Kerr and Fu (2008), Balasubramanian and Sivadasan (2010, 2011), Eberhardt et
al. (2011)]. The presence of non-standard business names and the fact that corporations often file for
patents through subsidiaries or other legal entities complicates identification of the patent assignee
business considerably [Thoma et al. (2010)]. Here we extend earlier approaches by exploiting in addition
the inventor information contained in the focal patent document.
Using both inventor and assignee information to disambiguate and link granted patents to their
firm owners offer a methodological innovation in the field. Using the inventor information on the patent
allows us to identify human inventors and match these to the population of U.S. workers available in
Census Bureau databases, and provides us with an independent link to the parent corporation where they
were employed at the time the patent application was filed at the USPTO. We triangulate the two
independent sources of business information (assignees and inventors) to maximize match rates and
provide better validation for a large portion of matches.
The result is a database tracking patenting firms as well as the network of inventors employed at
those firms. We are able to account for ownership on 91 percent of U.S. patents using this approach, a
significant improvement over prior efforts matching 70-81 percent [Kerr and Fu (2008), Balasubramanian
identified as an R&D firm in an administrative data set if it has claimed an R&D tax credit. However, small and young businesses may overlook the R&D tax credit because they assume they must have on-site laboratories or breakthrough research to claim the credits (see Section 174 Test of the IRS regulations). Others might fear they might face complex tax calculations or trigger an IRS audit. Another criticism of these surveys is that small firms are typically under-represented and only the most successful ones might survive and be included.
3
DO NOT QUOTE OR CITE WITHOUT PERMISSION PRELIMINARY DRAFT
and Sivadasan (2010)]. A byproduct of this triangulation are disambiguated databases of both patenting
firms and human inventors: while forthcoming papers will offer descriptions of the inventor database and
the disambiguated databases, in this paper we describe only the firm database. In so doing, we document
basic features of the patenting firms we have identified along with characteristics of their patent
portfolios.
Our methodological improvement allows us to provide richer information on patenting by the
smallest and youngest firms in the U.S., a segment often underrepresented by standard methods. We find
patenting firms, particularly young patenting firms, disproportionally contribute jobs to the U.S.
economy. Consistent with the literature we find patenting is a relatively rare event among small firms but
nevertheless most patenting firms are small.3 We also find that, compared with patent rates among the
oldest firms, patenting is not as rare of an event for the youngest U.S. firms. Moreover, while
manufacturing firms are most likely to patent, we find that most patenting firms are in the services and
wholesale sectors. Because our methodological improvement allows us to follow both establishments
(locations, often sub-units of firms) and firms (often larger parent entities) over time, we are able to
leverage the firm-worker links in the Census databases, thereby providing an opportunity to explore
where invention occurs, and possibly allow researchers to identify the particular establishment locations
where specific inventive activities are taking place.4
Because of the sensitivity of Census Bureau data used in the match, the micro database is
restricted-use, but will be updated annually and, contingent on review, eventually will be accessible to
qualified researchers with approved projects through secure U.S. Federal Statistical Research Data
Centers.5 However, a specific goal of the joint Census Bureau-USPTO project is, to the greatest extent
possible, to create a series of new public-use products derived from the confidential microdata, since
3 See Balasubramanian and Sivadasan (2010, 2011) 4 We will explore these aspects in future papers. 5 For more information on secure Federal Statistical Research Data Centers, visit http://www.census.gov/fsrdc.
DO NOT QUOTE OR CITE WITHOUT PERMISSION PRELIMINARY DRAFT
public-use tabulations at the Census Bureau meet disclosure avoidance rules and are thus accessible to
any member of the public wishing to explore and conduct research with such aggregated tabulations.
Early results from one possible set of such tabulations are discussed in this paper.
The rest of the paper is organized as follows. Section 2 describes the source data used in the
construction of the new database. Section 3 describes the creation of the inventor and firm linkages and
our triangulation of the data to identify and validate matches. This is followed in Section 4 with a
description of the new linked database. Section 5 highlights some basic features of the longitudinal
linked patent-business database. Section 6 concludes with a discussion of directions for future work.
2. Data Sources
We use four different datasets in constructing the longitudinal linked patent-business database, one
derived from USPTO data and three built from information collected at the Census Bureau. The first, the
USPTO Patent Data Extract, contains bibliographic information including names of the human
inventor(s) and the organization assignee(s) associated with each granted patent. In the United States
during 2000-2011, patents only issue to human inventors, and it is therefore common for an agreement –
generally an employment agreement – to assign patent rights to a business firm – generally an employer-
assignee.6 Such “assignments” are information recorded routinely on the granted patent document.
Three Census datasets are also employed. The first of these is the U.S. Census Bureau Business
Register, a dataset containing the list of all businesses in the U.S. and the source of the business name
information used to link to the assignee business names in the patent records. The second is the
Longitudinal Business Database (LBD), a longitudinal file describing business activity for establishments
and firms in the U.S., and the source of economic information including the type of activity, employment,
payroll and location of the establishments and firms. The third is the Longitudinal Employer Household
6 The America Invents Act (2011) altered this rule concerning granting to non-human inventors, but the law was implemented after our study period so does not affect our data.
5
DO NOT QUOTE OR CITE WITHOUT PERMISSION PRELIMINARY DRAFT
Dynamics (LEHD) Employment History Files, a longitudinal file containing a list of job records (worker-
employer associations) and the source of the information used to link human inventors in the patent
records to their employers at time of the focal patent’s filing. We discuss these in turn.
2.1. Bibliographic Patent Data Extract
Our primary source of patent data is the USPTO’s Patent Technology Monitoring Team (PTMT) Custom
Bibliographic Patent Data Extract. These data are produced annually, generally around March or April,
from the bibliographic text files for the patents granted by the USPTO in the previous calendar year.
Available data include the patent number, series code and application number, type of patent, filing date,
title, grant date, inventor information (names), assignee type and name at time of grant, foreign priority
information, related U.S. patent documents, classification information, U.S. and foreign references,
attorney, agent or firm/legal representative, Patent Cooperation Treaty information, abstract, and if
present a statement of U.S. Government interest.7 We supplement the PTMT data with information on
assignee city and state from the USPTO Bulk Download data publicly hosted on the internet.8 Further,
the PTMT data contain information on the primary assignee only so, for patents with multiple assignees,
we obtain information on additional assignees from the USPTO Bulk Download data.9
To create the longitudinal linked patent-business firm-level data described in this paper, we focus
on information from over 2.3 million patents granted from 2000 to 2011. Of these issued patents, just
under 90 percent are assigned to either a U.S. or foreign “non-government organization”, individual, or
government. The remaining patents are listed as “unassigned” with the assumption that ownership
remains with the human inventor(s). Table 1 shows the frequency of all granted patents, all those
assigned, and all those assigned to a named organization assignee, by year. The number of patents
7 Additional information is available at http://www.uspto.gov/web/offices/ac/ido/oeip/taf/reports.htm. The files can be downloaded from: https://eipweb.uspto.gov/TOC/ (accessed February 13, 2015). 8 These are available at: http://www.google.com/googlebooks/uspto-patents-applications-biblio.html. 9 Note, there are some discrepancies between the USPTO Bulk Download data and the PTMT data including some additional granted patents in the USPTO Bulk Download data. We keep these additional patents.
DO NOT QUOTE OR CITE WITHOUT PERMISSION PRELIMINARY DRAFT
granted each year is relatively stable with the exception of a drop in 2005 and an uptick in the 2010-2011
period. Table 2 shows the frequency of assignee types in the granted patent data. According to the
applicant type code provided in the PTMT file, the bulk of patents are either assigned to a U.S. non-
government organization (44.3 percent) or to a foreign non-government organization (43.8 percent), while
less than one percent of patents are assigned to U.S. or foreign individuals and less than one percent are
assigned to U.S. or foreign governments.
We exploit the inventor and assignee name information in the patent documents to link to two
restricted-use Census databases. Inventor information included in the PTMT file is limited to inventor
name, city, and state, and is generally provided at the time of patent application and not necessarily
updated at the time of grant. Understanding this limitation, we use this information to link to the LEHD
Employment History Files. Information on firm assignee(s) is generally designated at time of grant and
includes assignee name, city, and state. We use this information to link to the Census Bureau’s Business
Register, recognizing that there is often a considerable lag between the date on which the patent
application is filed (when inventor information may be collected) and issued (when assignee information
may be collected).10
2.2. The U.S. Census Bureau Business Register
Name and address information for businesses in the U.S. come from the Census Bureau’s Business
Register (BR). Since 1972, the Census Bureau has maintained a general-purpose business register for
statistical purposes. The BR servers multiple purposes, it is the frame for economic censuses and surveys,
it is a repository of administrative data, and it is the source data for Census public use products including
the County Business Patterns (CBP) and the Business Dynamics Statistics (BDS). The database covers
all U.S. business establishments and companies with paid employees filing taxes with the Internal
Revenue Service.
10 During the 2000-2011 study period, the USPTO reported average pendency to grant averaged about 36 months, after accounting for continued applications and other influences.
7
DO NOT QUOTE OR CITE WITHOUT PERMISSION PRELIMINARY DRAFT
The BR is continuously updated with administrative data from business income and payroll
filings, as well as data collected through economic census and surveys. Naturally, the amount of detail
that is available in the BR about a particular employer depends largely on whether the industry is covered
by the Economic Census. Industries outside the scope of the Economic Census include: Agriculture,
Forestry and Fishing, Railroads, U.S. Postal Service, Certificated Passenger Air Carriers, Elementary and
Secondary Schools, Colleges and Universities, Labor Organizations, Political Organizations, Religious
Organizations and Public Administration. For these employers we simply have basic administrative data
and we do not collect information about the establishments associated with the employer or whether
multiple employers fall under common ownership or control of a firm. Most government owned or
operated entities are outside the scope of the Economic Census and their establishments are not broken
out in the BR.11 Business identifiers in the BR include business name and address, an establishment
numeric identifier, a firm identifier linking all of the establishments under common ownership and
control, and the administrative employer identification number (EIN) associated with the establishment –
the administrative payroll/income reporting unit.
2.3. The Longitudinal Business Database
The Longitudinal Business Database (LBD) is the longitudinal version of the BR [see Jarmin and
Miranda (2002) for details].12 A benefit of working with the LBD is the high quality longitudinal
linkages that allow accurate measurement of establishment and firm births and deaths. Given the
ubiquitous changes in ownership among U.S. firms, a common feature in administrative micro data such
as the BR is spurious firm and establishment entry and exit as a result of purely legal and administrative
actions. The LBD minimizes these issues by enhancing existing identifiers with name and address
matching algorithms. The LBD includes annual observations beginning in 1976 and is updated annually
11 The only exceptions are Wholesale Distributors of Beer, Wine and Distilled Alcoholic Beverages, Liquor Stores, Central Reserve Depository Institutions, Federal and Federally-sponsored Nondepository Institutions and Hospitals. 12 For more information about the LBD, see the Center for Economic Studies website at http://www.census.gov/ces/dataproducts/datasets/lbd.html.
DO NOT QUOTE OR CITE WITHOUT PERMISSION PRELIMINARY DRAFT
– the most current update runs through 2012. It provides information on the type of activity, location,
employment, payroll, and legal form of organization for every establishment in scope of the CBP.
Employment observations in the LBD are for the payroll period covering the 12th day of March in each
calendar year.
A unique advantage of the LBD is its coverage of both firms and establishments. Only in the
LBD is firm activity captured up to the level of operational control instead of being based on an arbitrary
taxpayer ID. All of the establishments under the control of a common legal operating entity are assigned
a common firm identifier. This extends to establishments of subsidiaries – as long as the parent
corporation controls more than 50 percent of their stock. This allows us to define firm characteristics
such as firm size and firm age. We construct firm size measures by aggregating the establishment
information to the firm level using the appropriate firm identifiers. We construct firm age following the
approach adopted for the BDS and based on prior work [see, e.g., Becker et al. (2006), Davis et al.
(2007) and Haltiwanger, Jarmin and Miranda (2013)]. Namely, when a new firm identifier arises for
whatever reason, we assign the firm an age based on the age of the oldest establishment that the firm
owns in the first year in which the new firm identifier is observed. The firm is then allowed to age
naturally (by one year for each additional year it is observed in the data) regardless of any acquisitions
and divestitures as long as the firm continues operations as a legal entity. Our ability to track both
establishments and firms allows us to compute measures of organic growth that abstract from growth that
results from merger and acquisition activity.13
2.4. The LEHD Employment History Files
The LEHD Employment History Files (EHF) are a product of the Longitudinal Employer Household
Dynamics (LEHD) program of the U.S. Census Bureau.14 The EHF is sourced from state Unemployment
Insurance (UI) wage records. The UI wage records are collected by state employment security agencies
13 See the appendix to Haltiwanger, Jarmin, and Miranda (2013) for an in depth treatment of these issues. 14 For more information about the LEHD program, see the LEHD website at http://lehd.ces.census.gov/.
DO NOT QUOTE OR CITE WITHOUT PERMISSION PRELIMINARY DRAFT
in compliance with the Social Security Act of 1935. Employers are required to report the total amount of
wages paid to each employee during a quarter to determine an individual’s eligibility when filing an UI
claim. The Census Bureau receives these data in a partnership with state employment security agencies.
The UI records connect individuals to every employer from which they received wages. Wage records
include information on the individual's Social Security Number, the first name, last name, and middle
initial of the employee – these are replaced with an anonymous protected identification key (PIK) by the
Census Bureau immediately upon receipt, as well as the UI account number or state employer
identification number (SEIN) of the employer to identify the employer. The LEHD program uses these
data to construct earnings and job histories for covered workers and for each of their employers. The
EHF is a virtual census of wage and salaried private employment non-farm payroll. The only major
category of private sector workers not covered by the UI system are self-employed workers. Other
workers not covered include members of the armed forces, federal employees, local government
employees and state elected officials, and members of the judiciary. Some small agricultural enterprises
and religious organizations are also excluded from the system. Data in the EHF go back to 1985 but are
only available for a majority of states starting in 2000. For our purposes it is important to note that even
post-2000 there is incomplete coverage of states.15 A relevant feature of the EHF file is that it can easily
be linked to Census Bureau personal characteristics files including demographics such as age, race,
gender, and country of origin of workers in the US. It can also be linked to the BR via the Employer
Characteristics File (ECF). The ECF includes the UI account number of the employer --the State
Employer Identification Number (SEIN), as well as a Federal Employer Identification Number (EIN).
3. Linking Methodology
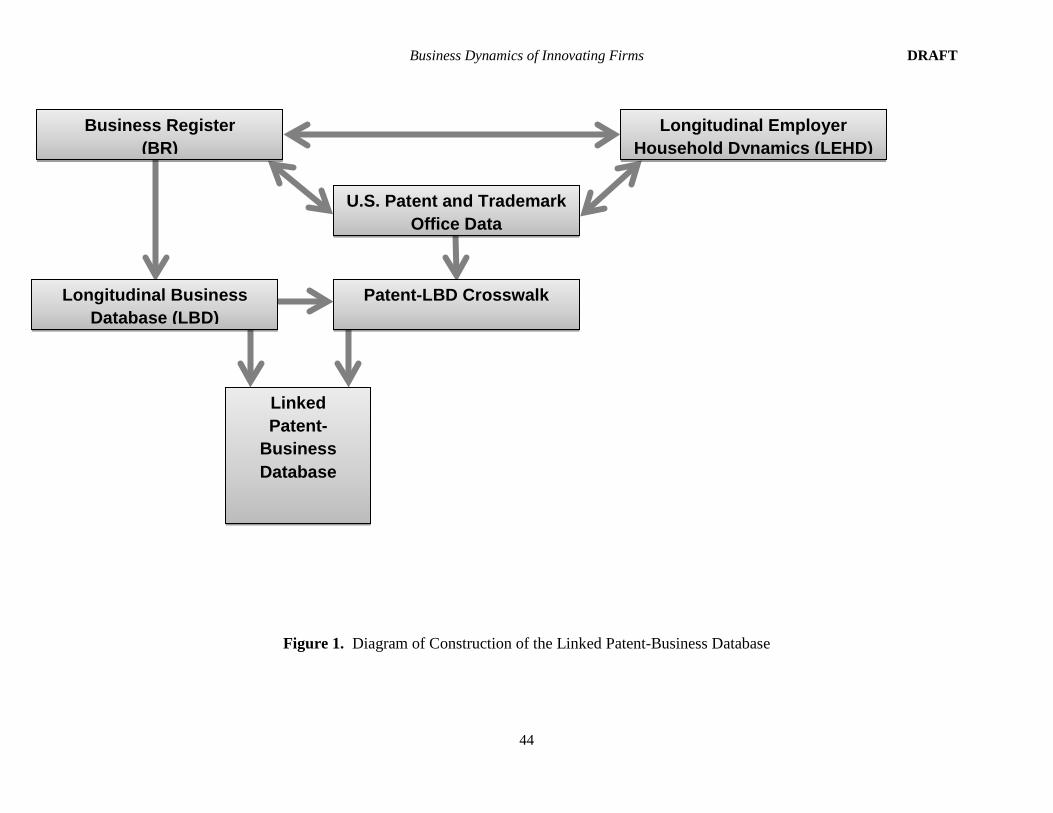
The data integration process follows a multi-step process shown in Figures 1 and 2. We first link patent
assignee names contained in the patent data directly to firm names in the BR files. This link provides
15 We use the 2011 snapshot of the LEHD infrastructure files. Data for Alabama, Arkansas, the District of Columbia, and Mississippi all start after 2000. The 2011 snapshot does not contain data for Massachusetts. For details on coverage by state, see Table 1.2 in Vilhuber and McKinney (2014).
10
DO NOT QUOTE OR CITE WITHOUT PERMISSION PRELIMINARY DRAFT
information about the legal operating entity that owns the patent as well as numeric identifiers including
the Federal Employer Identification Number (EIN) and the firm identifier (ALPHA) common across
Census Bureau files. Second, we link inventor names contained in the patent data to the LEHD data.
This link is done in two steps: (1) assign PIK to inventors and then (2) link inventors to the LEHD data
by PIK. The link to the LEHD data provides information about the inventor, their coworkers, and their
employer(s). Patent documents contain very limited name and address information on inventors and
assignees, which limits our ability to identify them uniquely. Our approach differs from typical matching
exercises in that we maximize the number of potential matches. In the initial matching exercises, we
allow matches to multiple firms and inventors in order to limit the number of missed linkages (Type II
errors). We then triangulate the independently matched databases to eliminate the incorrect matches
(Type I errors).16 We describe the matching process in detail below.
3.1. Patent Assignee Name to BR Firm Name Match
We match the patent assignee name to a firm name on the BR using an automated-rules based approach
that defines rules and compares the similarity of names. We use the available address information to limit
our search to the set of feasible potential matches. Patent assignment information is generally provided at
time of grant. However, we match assignment information to all years of the BR, from 1999 to 2012, to
allow for potential timing mismatches between the patent data and the BR data. It is important to note
patent assignees include non-U.S. firms.17 Because foreign firms without at least one establishment in the
U.S. will not be present in the BR, and many foreign firms do have a U.S. presence, while we attempt to
match foreign assignee names to the BR we anticipate much lower match rates for that sample.
In preparing the patent file for matching, we first drop all patents that have no assignee name
(unassigned or assigned to either a U.S. or foreign individual). This yields 2,054,754 assignee-named
16 Typical matching exercises rely on a single match thus requiring a careful simultaneous balance of Type I and Type II errors. 17 If the assignee state field contains no characters in the patent assignee data downloaded from Google, the assignee is classified as a foreign assignee.
11
DO NOT QUOTE OR CITE WITHOUT PERMISSION PRELIMINARY DRAFT
patents. The last column of Table 1 shows the annual frequency of this set of patents, which includes
patents assigned to U.S. and foreign entities.
We treat U.S. and foreign assignee names differently in the name match process. They are treated
differently for two reasons: (1) we do not have city and state information for foreign firms; and (2)
foreign assignee names may be structured differently than U.S. assignee names.18 The lack of
information on city and state for foreign firms means we have no blocking variable (i.e., no way to limit
the possible set of matches). This makes use of the SAS DQMatch fuzzy matching procedure we use for
U.S. firm names computationally unwieldy.19
For U.S. assignees in the patent data, we use assignee city/place and state information to attach a
3-digit zip code to the assignee. We do this because zip code information is readily available in the BR
and is much more reliable than place names as a matching variable. In some cases, multiple 3-digit zip
codes are attached to a single assignee if the place straddles multiple 3-digit zip codes. We next
standardize the firm name field by deleting punctuation and symbols (e.g., “.”, “-”, “&”, “@”), common
words (e.g., “and”, “the”), legal entity designations (e.g., “Corp.”, “Co.”, “LP”, “LLC”), and removing
blanks. Firm names from the BR are standardized using the same algorithm. We perform several
matching passes:
1. Match patent assignee name and 3-digit zip code to BR firm name and 3-digit zip code.
2. For remaining unmatched U.S. assignees, match patent assignee name and state to BR firm name
and state.
3. For remaining unmatched U.S. assignees, use SAS DQMatch “fuzzy” name matching algorithm
to match patent assignee name to BR firm name blocking on 3-digit zipcode.
18 One illustrative example is the Japanese firm styled “Panasonic Corporation” in the U.S., the Japanese name for which is Panasonikku Kabushiki-gaisha. Note, this is an illustrative example only and is not taken from restricted-use microdata. 19 Foreign firm names are also in a variety of different languages and the version of SAS DQMatch we use when matching U.S. firm names is optimized for English.
12
DO NOT QUOTE OR CITE WITHOUT PERMISSION PRELIMINARY DRAFT
4. For remaining unmatched U.S. assignees, use “fuzzy” name matching algorithm to match patent
assignee name to BR firm name blocking on state.
5. For remaining unmatched U.S. assignees, use “fuzzy” name matching algorithm to match patent
assignee name to BR firm name removing all geographic blocking variables.
We also try a word matching algorithm (described below as step 2 for foreign assignee name matching),
but did not find this algorithm produced additional good matches for the remaining unmatched U.S.
assignees after SAS DQMatch fuzzy matching. Over 87 percent of U.S. assignees are matched to at least
one BR firm in steps 1 and 2. Note we keep all matches resulting from the above steps. This means we
will have multiple matches for many assignee names. Many of these multiple matches will be resolved
during the triangulation process described later in this section.
For foreign assignees in the patent data, we have only the assignee name listed on the granted
patent. We standardize the foreign assignee names in the same way as the U.S. assignee names. We then
perform the following matching passes:
1. Match patent assignee name to BR firm name.
2. For remaining unmatched foreign assignees, use a word matching algorithm (based on the
components of the business name) to match patent assignee name to BR firm name with no
blocking variable. The following rule applies here:
a. If a match is not achieved, then remove the last word of the name and match again.
b. Continue until there are only two words left in the name.
c. Keep the match or matches from the earliest pass (the pass that uses the largest amount of
information).
As noted above, we do not apply SAS DQMatch to these records because of high computational cost due
to the lack of geographical blocking variables. Approximately 35 percent of foreign assignees have at
13
DO NOT QUOTE OR CITE WITHOUT PERMISSION PRELIMINARY DRAFT
least one match to a BR firm name in the first step and just under 24 percent are matched in the second
step. This total match rate, approximately 59 percent, is considerably lower than the match for U.S.
assignees. The lower total match rate is expected since foreign firms with no physical presence in the
U.S. have no chance of being matched.
3.2. Inventor PIK Assignment
Patent documents do not include social security numbers or birth dates for inventors so we rely on the
available identifying fields: the inventor’s name and the city and state of residence. We also know the
likely vintage of the inventor information since inventor information is supplied to the USPTO in the year
the patent application was filed. In order to match inventors from the patent data to workers in the LEHD
data, inventors first need to be assigned an anonymous PIK. The Census Bureau uses the Person
Identification Validation System (PVS) to assign PIKs to replace personal identifying information on any
file immediately upon acquisition. The PVS uses probabilistic linking to match person data to a reference
file built from a combination of administrative and commercial databases. See Wagner and Lane (2014)
for a description of the process. Note this reference file includes not only names but also residential
address information.
We create a set of inventor files for patents granted between 2000 and 2011 with application
years of 1996 and later from the PTMT data.20 Table 3 shows the percent of U.S. and foreign inventors in
the granted patents data. There are over 5.8 million non-unique named inventors on granted patents from
2000-2011. Of these, roughly 47 percent are foreign inventors with no U.S. address.21 Foreign-based
inventors with no U.S. address will not be in the PVS reference files or the LEHD data.22 Therefore, we
limit the sample of inventors we input to the PVS process to inventors with U.S. addresses in the patent
20 We lose inventors on only a very small fraction of patents (less than 0.6 percent) and inventors (just over 0.6 percent) by restricting to application years of 1996 and later. This restriction is made because reference files are not available in the PVS for years prior to 2000. The 2000 reference file is used for 1996-1999. 21 U.S. inventors have a U.S. postal state code in the inventor state field on PTMT data; foreign inventors do not. 22 Note there might be some rare exceptions to this. For example, a foreign- based inventor that receives a temporary permit to work in the U.S. in nonimmigrant status (e.g., an alien working at a U.S. company temporarily to work on an invention) might appear in the LEHD data. However, the PVS reference files do not generally cover these individuals.
14
DO NOT QUOTE OR CITE WITHOUT PERMISSION PRELIMINARY DRAFT
data. We then use the inventor city and state of residence information to attach a 3-digit zip code to the
inventor.23 Files with inventor name, state, and 3-digit zip code are used as an input to the PVS matching
process. We attempt to assign PIKs to over 3.1 million non-unique inventors on over 1.2 million patents,
which is 52 percent of the complete set of patents granted 2000-2011.24
The standard PVS is used with a few changes particular to our specific application. First, since
we are interested in working-age individuals covered by the LEHD data, we exclude matches for
individuals 16 years of age or younger. Second, due to the limited inventor information available, we
give additional weight to exact middle initial matches.25 Finally, for most applications, the PVS makes
unique PIK assignments excluding cases that do not yield a unique match. Since we have limited
inventor information and an opportunity to bring additional information to bear later in our matching
process, we allow for multiple PIKs to be assigned to a single inventor. We performed three different
matching passes as part of the PVS process:
1. Fuzzy name match blocking by 3-digit zip code
2. Fuzzy name match blocking by inventor state
3. Fuzzy name match blocking by assignee state
Only the PIK or PIKs assigned by the pass with the “best” information are retained. For example, if an
inventor received PIKs in all three passes, only those from the first pass (block by 3-digit zip code) are
kept.
We find that in more than 97 percent of our inventor-patent combinations, at least one PIK is
assigned. While many inventors are assigned multiple PIKs, over 90 percent of the 1.2 million patents
23 In some cases, city and state information link to multiple 3-digit zip codes. In these cases we provide all linked 3-digit zip codes (zip3) as an input into the PVS. The input files are at the patent-inventor-zip3 level. 24 Note, there are not 3.1 million different inventors, but here we treat each inventor-patent combination as a separate inventor since the patent data contains no inventor identifier. 25 The middle name is typically not used in PVS. PVS typically relies on additional personal information - either a birth date or a Social Security number that is more reliable.
15
DO NOT QUOTE OR CITE WITHOUT PERMISSION PRELIMINARY DRAFT
have at least one inventor assigned with a unique PIK (noting that 68 percent of patents with at least one
U.S. inventor include multiple inventors). This feature of the data in combination with the triangulation
described in Section 3.4 can be leveraged to create a disambiguated inventor database.26
3.3. Matching the Inventor to the LEHD Data and BR Firm Identifier
Once PIKs have been attached to inventors in the patent data, the inventor data is linked to the LEHD-
EHF data using PIK as a matching variable. This link provides UI state identifiers (SEIN) for the
employers where the inventor works. Recall, there is incomplete coverage of states in the LEHD data so
not all PIKs will match to the LEHD data. Roughly 90 percent of PIK-patent combinations matched to at
least one SEIN. Note we initially keep all SEIN-year combinations associated with the inventor (PIK) in
the LEHD-EHF.27 We then use the LEHD-ECF file to get all the corresponding federal employer
identifiers (EIN) where the inventor worked. Finally, we create a crosswalk between the EINs in the ECF
and firm identifiers (ALPHA) on the BR. Note there are EINs in the ECF that do not appear in the BR
and vice versa so not all ECF-EINs will match to the BR. We are able to match about 94 percent of the
LEHD EIN-year combinations in our data to the BR.28 Our final output from this step is a file of all
possible inventor identifiers (PIKs) -recall some inventors receive multiple possible PIKs - and all
possible BR firm-year combinations associated with those PIKs.29
3.4. Triangulation
The matching described in Sections 3.1-3.3 generates two sets of files each providing an independent
source of employer information including the EIN and the ALPHA. The business name match identifies
all potential patenting firms in the BR. The inventor match identifies all potential firms in the LEHD data
where the inventors may work. Our task then is to cross validate the matches and reconcile them
whenever possible. We consider matches to be valid for consideration as long as they take place at the
26 We leave discussion of the inventor database to a later time. 27 Put differently, once we identify an inventor in the LEHD we keep their whole employment history. 28 This is consistent with match rates documented in McCue (2012), pg.6, Table 5. 29 This includes both the administrative identifier, the EIN, as well as the unique Census firm identifier, the ALPHA.
16
DO NOT QUOTE OR CITE WITHOUT PERMISSION PRELIMINARY DRAFT
time of grant (for patent assignee) or application (for the inventor) or in a two year window around those
dates.30
Consider first the simplest type of case where the name of the inventor and/or the firm are rare
and therefore easily identified in our data. Statistically, unusual names are more likely to provide a
unique link. The inventor matches to a PIK (worker), which ultimately matches to a firm (employer), in
the application year. The patent assignee name matches to a firm identifier in the grant year. A match is
considered closed and validated when the same firm is identified from the inventor (worker) and the
assignee (firm-employer) sides. This situation is depicted in Appendix A Figure A.1.1 and Figure A.1.2.
(Models 1 and 2).
Many cases are considerably more complex than the simplest case described above. Recall, we
match inventors at the application date and patent assignees at the grant date because those are the points
in time when the information is most accurate and likely to provide correct matches in the LEHD or BR
data.31 There is a considerable time lag between the application date and the grant date (an average of
about just under 3 years in our data). Common situations as a result of this time lag include the
following:
1. Firms that exist at time of application (identified through the inventor worker-to-employer link)
might no longer exist as such at time of grant (identified through the firm name link). This firm
may have been acquired, merged, or changed its legal name. This situation is depicted in
Appendix A, Figure A.1.3 (Model 3). Note that in this case we still find a link between the two
sides of the match through an EIN.
2. The firm at time of application, firm A, shuts down and its portfolio of patent applications is
acquired by firm B, and granted under firm B’s name. The inventor may, or may not, have been
30 We make a few exceptions to this rule; these are described later in the section. 31 Inventors can switch jobs so timing is relevant to identifying the correct employer at the time the innovation was being developed. Similarly, merger and acquisition activity can lead to changes in the structure of firms.
17
DO NOT QUOTE OR CITE WITHOUT PERMISSION PRELIMINARY DRAFT
later employed by firm B. This situation is depicted in Appendix A, Figure A.1.4. In this case
there is no link between firm A and firm B (Model 4).
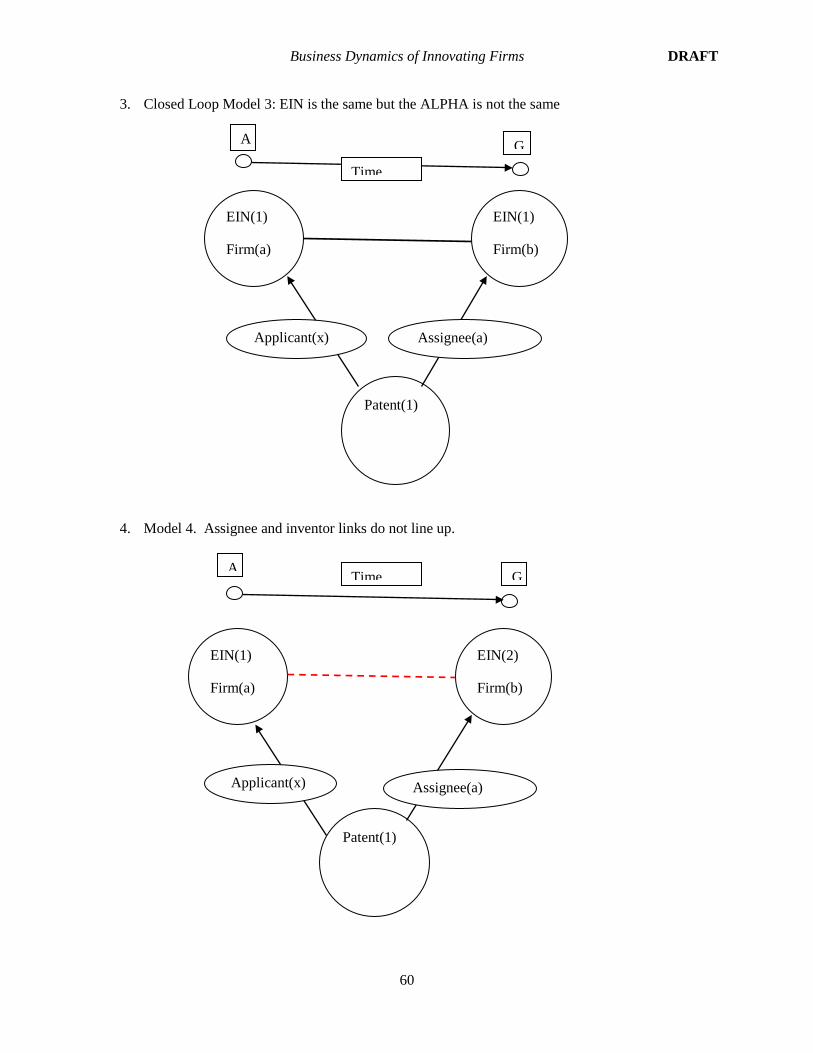
3. The firm at time of application identified through the inventor-LEHD match and the firm at time
of grant identified through the assignee name-BR match differ and they are both operational at
time of grant. This may occur when a firm transfers their patent applications to another firm prior
to grant or when a firm divests or spins off part of its activity (including patent applications) to
another named entity. This situation might also arise when the research activity is outsourced to a
contract research organization, or an entity in which firm A has an ownership interest but is not
otherwise identified in the Census data as a subsidiary.32 This situation is similar to Figure A.1.4.
In this case there is no link between firm A and firm B.
4. The patent is owned by multiple assignees. This situation is similar to Figure A.1.5 (Model 5).
We simplify these cases by treating each assignee-inventor combination as independent matches.
5. The presence of non-standard business names in the patent data and the fact that corporations
often file for patents through subsidiaries or other legal entities might lead us to find an inventor
match but no assignee name match. This situation is depicted in Appendix A, Figure A.1.6
(Model 6). In this case, it may be possible to validate the link using the inventor’s information
from another patent on which the same inventor is named (but which may include different
assignee information).
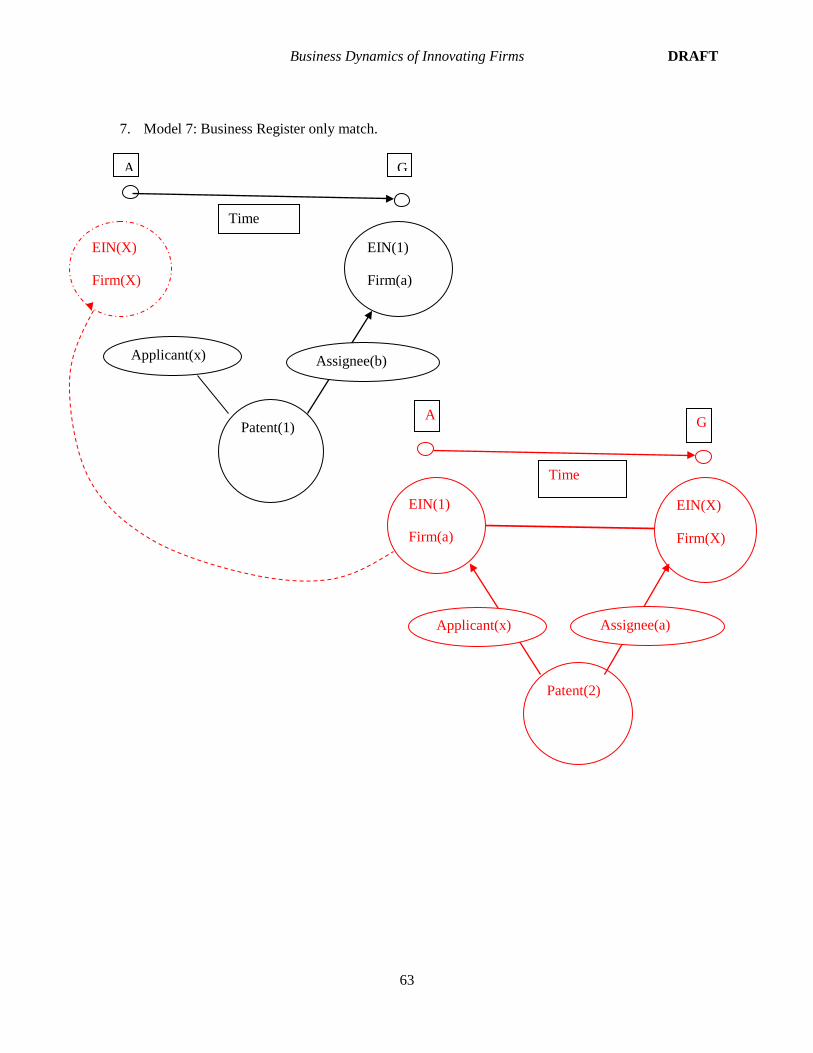
6. For foreign inventors, we will not find the inventors place of work in our database. However, we
may find the assignee name in the BR if the firm has a presence in the U.S. This situation is
depicted in Appendix A, Figure A.1.7 (Model 7). For some of these cases it might be possible to
validate the link using the assignee’s information from a different patent.
A firm is identified as a subsidiary to a parent corporation by the Census Bureau when the parent owns at least 50% of the subsidiary.
18
DO NOT QUOTE OR CITE WITHOUT PERMISSION PRELIMINARY DRAFT
In cases where simple triangulation is not sufficient to uniquely identify a unique firm we apply the
following rules:
1. The firm identified at time of grant dominates if this is a unique match.33
2. If there is no unique firm identified at time of grant but there is a unique firm identifier at time of
application then we look at the history of the inventor (or its network) to identify a likely firm at
time of grant. This is depicted in Appendix A, Figure A.1.6. If no firm is identified at time of
grant then we employ the firm identified at time of application.
Following this process, we are left with unmatched cases for which there is either (i) no unique match to a
firm either directly through the assignee name or the inventor name or (ii) there is no match using either.
We resolve some of these cases manually. We first identify the assignees with the largest number of
patents and we perform manual name matching that includes visual inspection as well as web research.
4. Linked Patent-Business Firm-level Data
We use the crosswalk that results from the triangulation methodology described above to create a
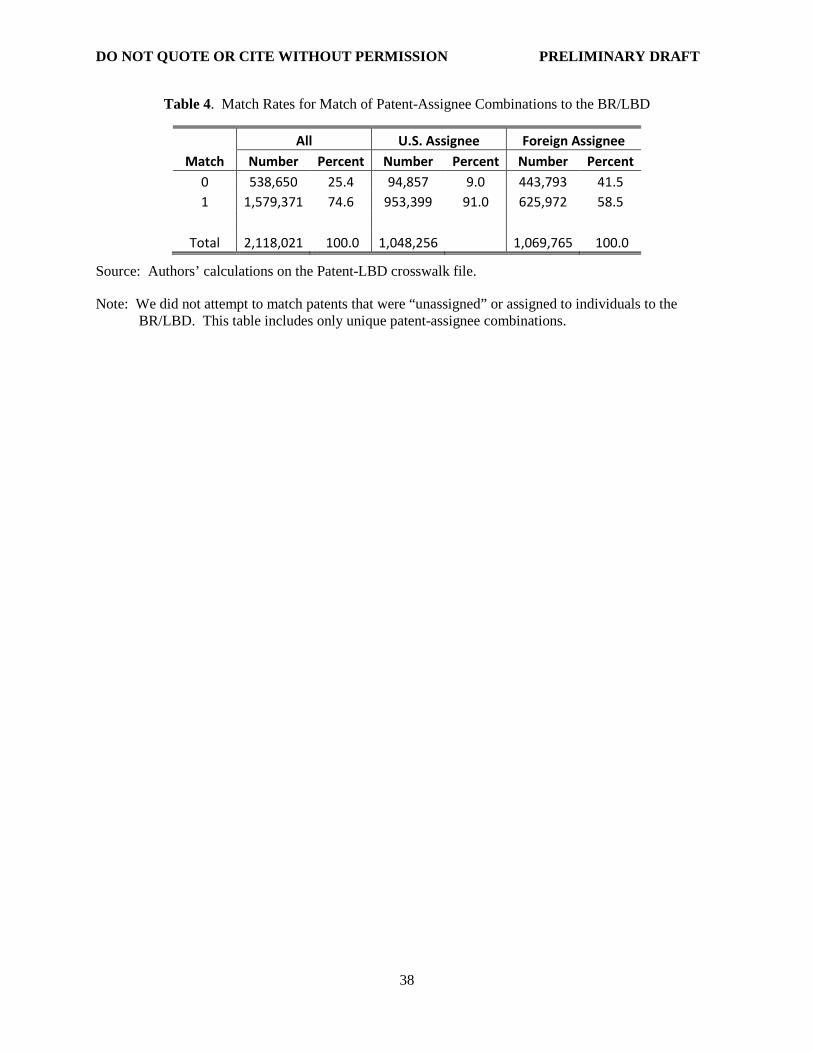
longitudinal database of patenting firms. We attempt to match roughly 2.1 million unique patent-assignee
combinations from the USPTO bibliographic patent data extract to the BR/LBD.34 Of these, we match
nearly 75 percent of all patent-assignee combinations. Table 4 shows our match rates. Many of our non-
matches are for patents with foreign firm assignees. We match 91 percent of patents with U.S. firm
assignees and nearly 59 percent of patents with foreign firm assignees.35 This compares to a match rate of
801 percent for U.S. patents in Balasubramanian et al. (2010) and 70 percent of patents in Kerr and Fu
(2008).
33 Note this database makes it possible to distinguish the firms developing the innovation (where the inventors work) and the firms that are assigned the patent rights. 34 This is all patent-assignee combinations where patents are granted patents with assignee organization name and some patents have multiple assignees. 35 We have no way of knowing how many of the foreign assignees have operations in the U.S.
19
DO NOT QUOTE OR CITE WITHOUT PERMISSION PRELIMINARY DRAFT
Overall, we match more than 1.5 million patent-assignee combinations to over 77,000 firms.
Figure 3 shows the number of patents per firm in our sample. During 2000-2011, nearly 45 percent of
patenting firms are granted only a single patent, over 16 percent are granted 2 patents, and about 25
percent are granted between 3 and 9 patents. Deeper in the distribution, close to 8 percent of firms are
granted between 10 and 24 patents, and about 4 percent of firms granted between 25 and 99 patents.
Among the most prolific patenting firms, over 1 percent of firms are granted between 100 and 499 patents
and about 0.5 percent of firms are granted over 500 patents. For multiple patent firms the average time
between patent grants (based on the named assignment) is just over 1 year, a statistic heavily influenced
by the large share of firms issued 9 or fewer patents during our 12-year study period.
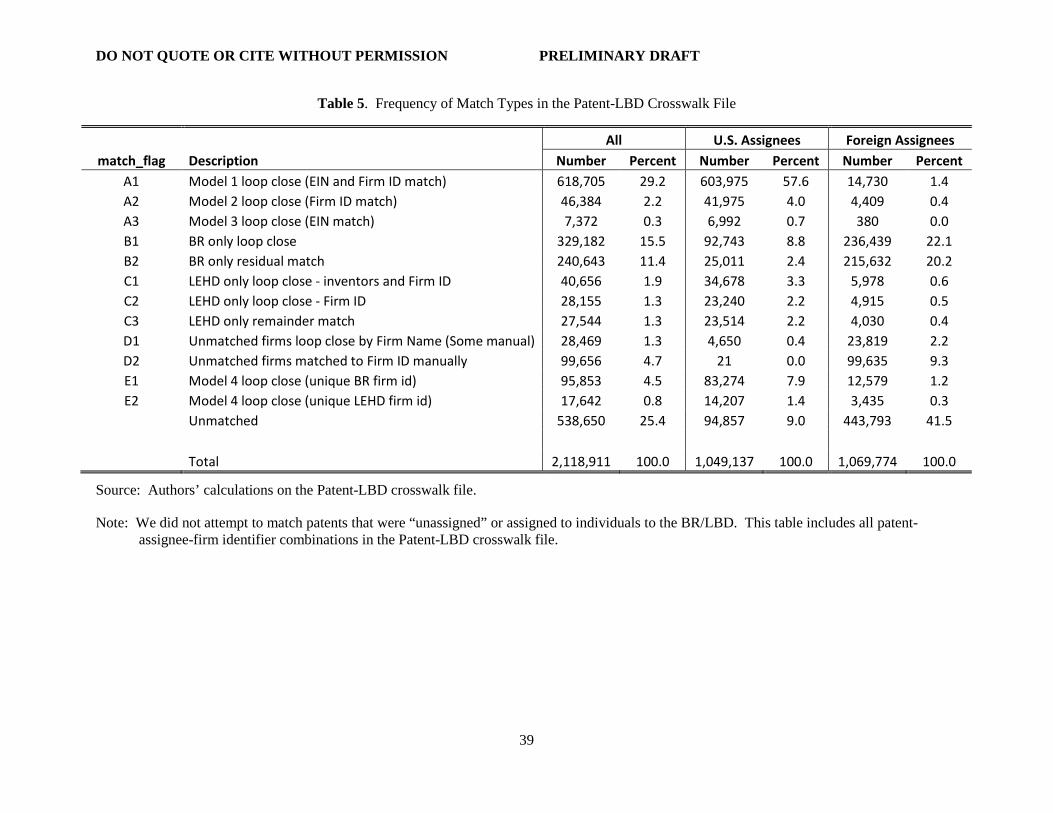
Our final Patent-LBD crosswalk file has 2,118,911 unique patent-assignee-firm identifier
combinations. This figure is larger than the number of patent-assignee combinations because in a small
number of cases we allow a single patent-assignee combination to match to multiple firm identifiers in the
BR. There are just over 1,500 of these multiple matches in the crosswalk.36 Table 5 shows the frequency
of different types of matches in the crosswalk file. Nearly 30 percent of all matches are based on a Model
1 loop close, which is the case where both the LEHD data match and BR data match lead to the same EIN
and BR firm identifier. These matches are the highest quality in that they are validated by the
triangulation strategy. Models 2 and 3 represent 2.5 percent of matches and are similarly closed loops
where only the EIN or the firm identifier match and are considered validated. The next largest category
accounts for 26.9 percent of the matches. These are cases where there is a match to a unique firm in the
BR and no inventor match at all. Of these 15.5 percent include firms that had been previously found to be
a patenting firm in a Model 1-3 loop close. We consider these firms validated by their prior history. The
remaining 11.4 percent have no prior history of validated patenting. The reverse situation is rare. There
are relatively few cases where there is a unique link through the inventor and no link through the BR.
36 These come from our manual matches. In these cases the firms appeared to be linked through a parent corporation. In the future, we plan to examine these cases more closely.
20
DO NOT QUOTE OR CITE WITHOUT PERMISSION PRELIMINARY DRAFT
These account for 4.5 percent of our matches and include cases validated through a prior inventor history,
(1.9 percent), cases validated through a prior firm patenting history (1.3 percent), and cases not validated
(1.3 percent). Roughly 5.3 percent of our matches are cases where the inventor links and assignee links
do not line up but in which a unique link is identified either through the assignee (4.5 percent), or the
inventor (0.8 percent). Our database also includes manual matches for some of the largest innovators not
identified through our algorithm, accounting for 4.7 percent of matches. Finally, we include some
matches that take place outside our valid 2-year window but in which both the inventor and the assignee
agree (1.3 percent). It is notable that the bulk of our foreign assignee matches come from BR only
matches, a reasonable outcome since inventors named on patents with foreign assignees are less likely to
be based in the U.S.
Table 6 provides a list of the variables included on the Patent-LBD crosswalk file. This is a
patent level database including the patent identifier (PRDN) linking uniquely to the patent database and a
firm identifier (firmid) linking uniquely to the BR/LBD. It also includes the patent application year, the
patent grant year, the patent assignee sequence number and their country, state, and type (see Table 2), a
U.S. inventor flag, a match flag (see Table 5), as well as the match years to the LEHD and BR datasets.
Our match rate for patent-assignee combinations to the LBD is high, but we do not match them
all. Figure 4 shows patent-assignee match rates by grant year for the full crosswalk, and broken out by
type of assignee -U.S. assignees and foreign assignees. There is not much variation in match rates across
years for the U.S. assignees. Notably, the match rate is over 90 percent in every grant year.37 Possibly
related to how information flows into the patenting process, the match rate for foreign assignees shows an
inverted-U shape over time, with minima in the earlier and later grant years and a peak at about 65
percent in 2006.
37 This is consistent with Balasubramanian et al (2010).
21
DO NOT QUOTE OR CITE WITHOUT PERMISSION PRELIMINARY DRAFT
The type of match, and perhaps also the reliability of that match as captured by the match flag,
also differs across assignee types. Figure 5 shows match rates by grant year broken out by broad type of
match: BR and LEHD match, BR only match, LEHD only match, other types of matches, and
unmatched.38 Between 58 and 64 percent of U.S. assignee matches are BR and LEHD matches where we
were able to validate by triangulating BR and LEHD data. For U.S. assignees, we do not see a lot of
variation by grant year though the BR and LEHD match rates are slightly lower in the early and late grant
years possibly reflecting various left- and right-censoring issues in the data. Less than 2 percent of
foreign assignee matches in each grant year are BR and LEHD triangulated matches. Most matches are
based on the BR only.
The LEHD partnership with state employment security agencies has expanded over time, with
some U.S. states only recently joining. We show match rates broken out by broad type of match and
assignee state as given in the patent data in Figure 6. Not surprisingly there is considerable variation in
both overall match rate and broad match type across assignee states. The District of Columbia and
Montana show the lowest overall with match rates below 70 percent, while Connecticut and New York
show the highest overall with match rates around 95 percent. For most states, over 50 percent of matches
are high-quality triangulated BR and LEHD matches. The state not in the LEHD data (Massachusetts)
and states that came in to the LEHD data post-2000 (Alabama, Arkansas, the District of Columbia and
Mississippi) have some of the lowest percentages of triangulated matches.39 This outcome makes sense
since patent assignee state is correlated with the state where the inventor(s) work, but is not always the
38 A match is a BR and LEHD match if match_flag = {A1, A2, A3}; a BR only match if match_flag = {B1, B2}; an LEHD only match if match_flag = {C1, C2, C3}; an other match if match_flag = {D1, D2, E1, E2}, and unmatched if match_flag is blank. 39 This result is not ideal, considering Massachusetts is routinely named one of the most innovative states by population, and one that generates a disproportionate share of entrepreneurial foundings. See, ITIF (The Information Technology & Innovation Foundation). 2014. "The 2014 State New Economy Index: Benchmarking Economic Transformation in the States."
22
DO NOT QUOTE OR CITE WITHOUT PERMISSION PRELIMINARY DRAFT
same.40 We consider triangulated matches to be our highest quality matches, so to the extent that match
rates differ by type across assignee states, the quality of matches might differ by assignee state.
We now examine match rates by several other patent characteristics, noting that the statistics
reported in this analysis (Tables 7, 8, and 9) include all patent-assignee-firm identifier combinations in the
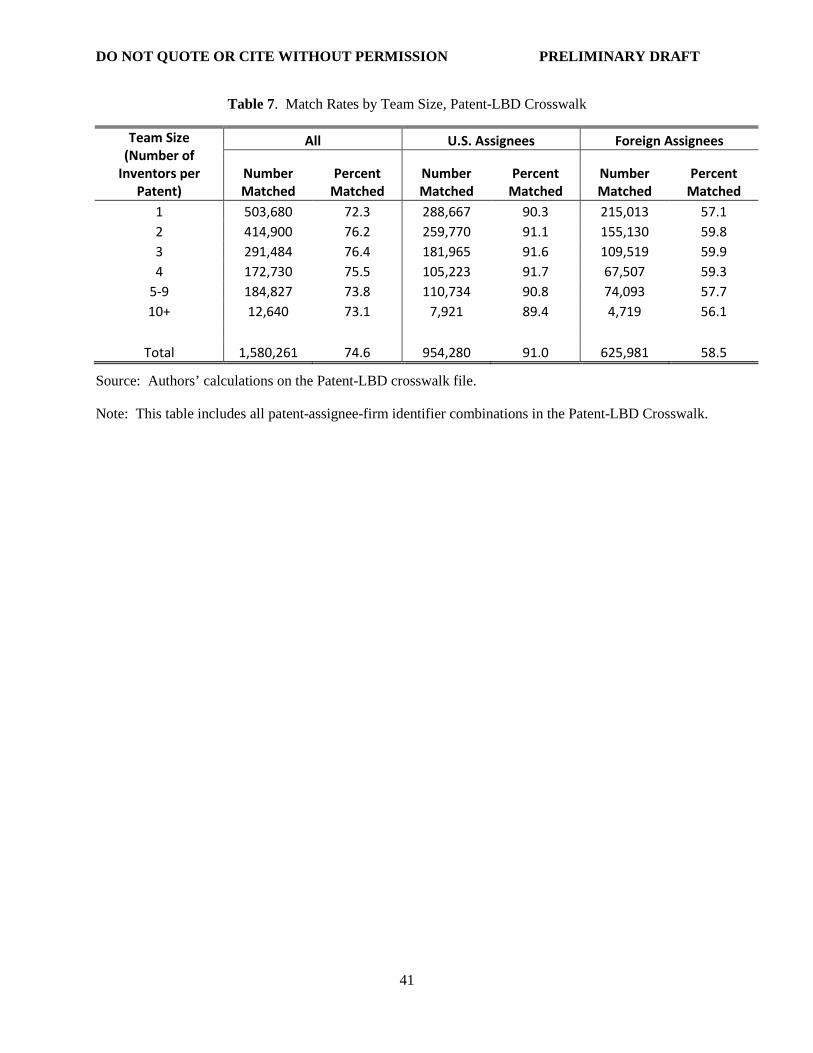
Patent-LBD crosswalk. Looking first at team size (number of inventors per patent), we begin by noting
that our matching methodology may bias our matches in the direction of patents with more inventors
since we are likely at higher hazard of identifying at least one of the (several) inventors in the LEHD data.
Table 7 shows match rates by inventor team size categories, both in terms of “all matches” and separated
into U.S. and foreign assignee match rates. We observe a relatively small amount of variation in match
rates by team size, though it does appear patents with between 2 and 9 inventors have slightly higher
match rates than those with either a single inventor or 10 or more inventors. This difference is driven
primarily by foreign patents and is consistent with the idea that non-U.S. patents are disproportionately
represented in the set with 10 or more inventors.
Next we examine match rates by number of (forward) citations per patent to see whether our
match algorithm is biased toward more highly cited (and potentially more valuable) patents. Forward
patent citations (references made by later issued patents) have been commonly used in the literature as a
proxy for technological impact or economic value [Jaffe and Trajtenberg,( 2002)]. Table 8 shows match
rates by number of citations. In general, match rates appear to increase with the number of citations. The
difference is once again largely driven by foreign patents suggesting foreign firms with more important
patents (and, relatedly, technologies, products, and services showing higher consumer demand) are more
likely to have a physical presence in the U.S.
40 For example, consider a firm where the headquarters is in the patent assignee state and the research is taking place in an establishment of the firm located in another state.
23
DO NOT QUOTE OR CITE WITHOUT PERMISSION PRELIMINARY DRAFT
Finally, we look at match rates by technology category (e.g., Chemical, Drugs & Medical).41 In
Table 9, we show match rates by technology category. Among U.S. assignees, match rates are roughly
similar across technology classes, ranging between 90.2 percent and 92.6 percent, with the exception of
patents in Drugs and Medical (85.7 percent) and plant patents (showing the lowest match rate at 80.6
percent).42 Among U.S. patents matched to foreign assignees, we find a wider distribution of match rates.
The Computers & Communications and Electrical & Electronic categories show the highest match rates
(65.4 percent and 63.2 percent respectively) and plant patents the lowest (31.1 percent), with those in
other categories ranging between 55.5 percent and 49.4 percent. We surmise that this matching pattern
among non-U.S. assignees is influenced by the high propensity of large asian electronics firms to file
many thousands of patents annually at the USPTO, and to also have business establishments located in
the United States.43
5. Patenting Firms in the U.S.
We use the longitudinal linked patent-business database to explore basic characteristics of patenting firms
in the U.S. For this simple illustrative exercise we consider all firms with one granted patent in our
crosswalk to be “patenting firms” and do not consider the size and value of their patent portfolios. We
also make no distinction for the technology class or the team size. Additionally, for this exercise we
abstract from complex issues around the identification and timing of the innovative activity. The PTMT
data include only granted patents and our approach is to identify assignee firms as close to the time of
patent grant as possible. However, timing innovative activity to the timing of patent granting rights is an
arbitrary demarcation at best for the identification of innovative activity. Patents are often issued many
years after the application is submitted, and not necessarily in relation to the timing of the innovative
41 Technology category assignment is based on U.S. Patent Classification codes assigned by USPTO and available in the U.S. Patent Grant Master Classification File. The category definitions are based on Hall et al. (2002) with additions described in detail in Dreisigmeyer et al. (2014). 42 The lower match rates for Drugs and Medical is consistent with results from Balasubramanian et al. (2010), while the plant patent finding may be due to characteristics of assignees in the plant patenting category (such as greenhouses, and horticulturists). 43 See for instance USPTO (2015) “Patent by Organizations” report, at: http://www.uspto.gov/web/offices/ac/ido/oeip/taf/topo_14.htm#PartB.
24
DO NOT QUOTE OR CITE WITHOUT PERMISSION PRELIMINARY DRAFT
activity by the firm. Firms may exploit the invention while the patent application is still pending, and
often expect to exploit their patents for many years after grant. With this caveat in mind, we pursue our
interest in examining the characteristics of patenting firms by defining a firm to be a patenting firm if it
ever held (or will hold) a patent during the period covered by our database.44 The longitudinal linked
patent-business database starts in 2000 so our indicators are necessarily left censored excluding firms that
are granted patents before 2000 and have not been granted a patent since. This obviously excludes a large
number of single patent firms.45 Also note that since it takes an average of 35 months for a patent to be
granted our sample will be right censored as we approach more recent years. This censoring tends to
particularly underrepresent the youngest firms and startups in our analysis since they have no chance to
enter our database. With these limitations in mind we proceed and provide basic descriptive statistics for
patenting firms in the U.S. We provide statistics centered around 2005 to minimize some of the censoring
issues just described.
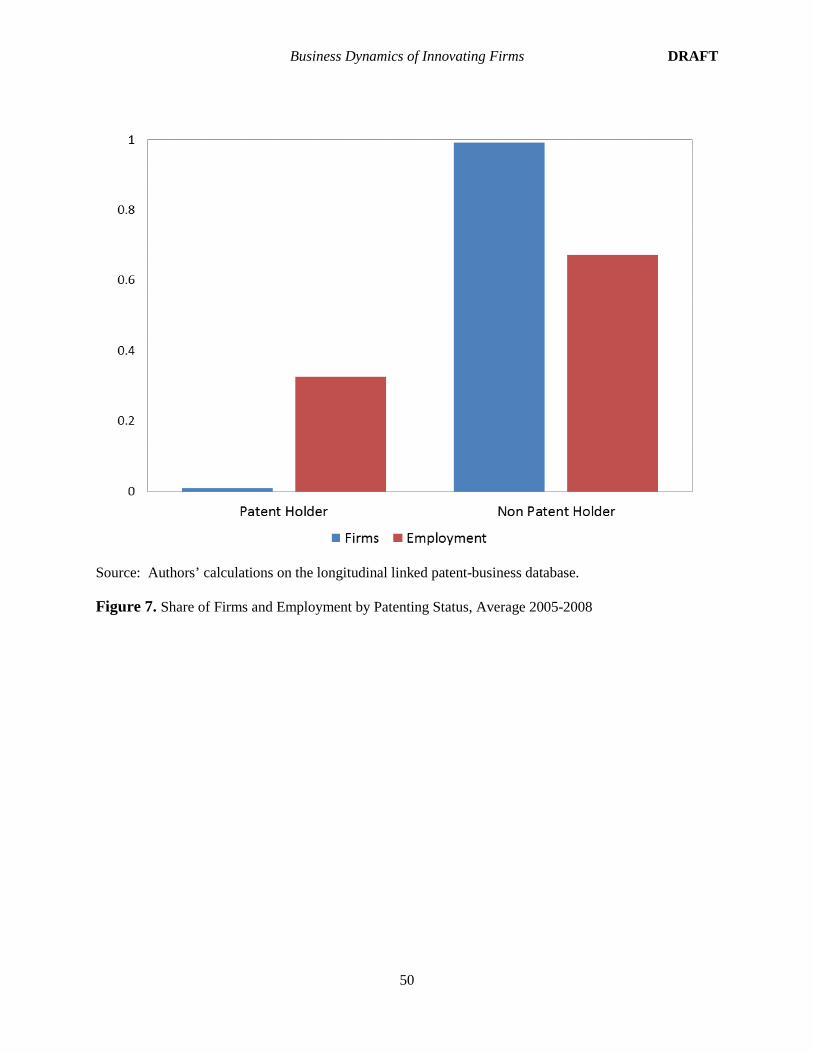
Figure 7 shows the share of patenting firms in the U.S. and their employment. Less than 1
percent of firms in the U.S. economy owned a (recently granted) patent in the period between 2005 and
2008.46 Nevertheless, these firms are among the largest firms in the economy, accounting for 33 percent
of employment. The finding that patent-owning firms are amongst the largest in the economy is
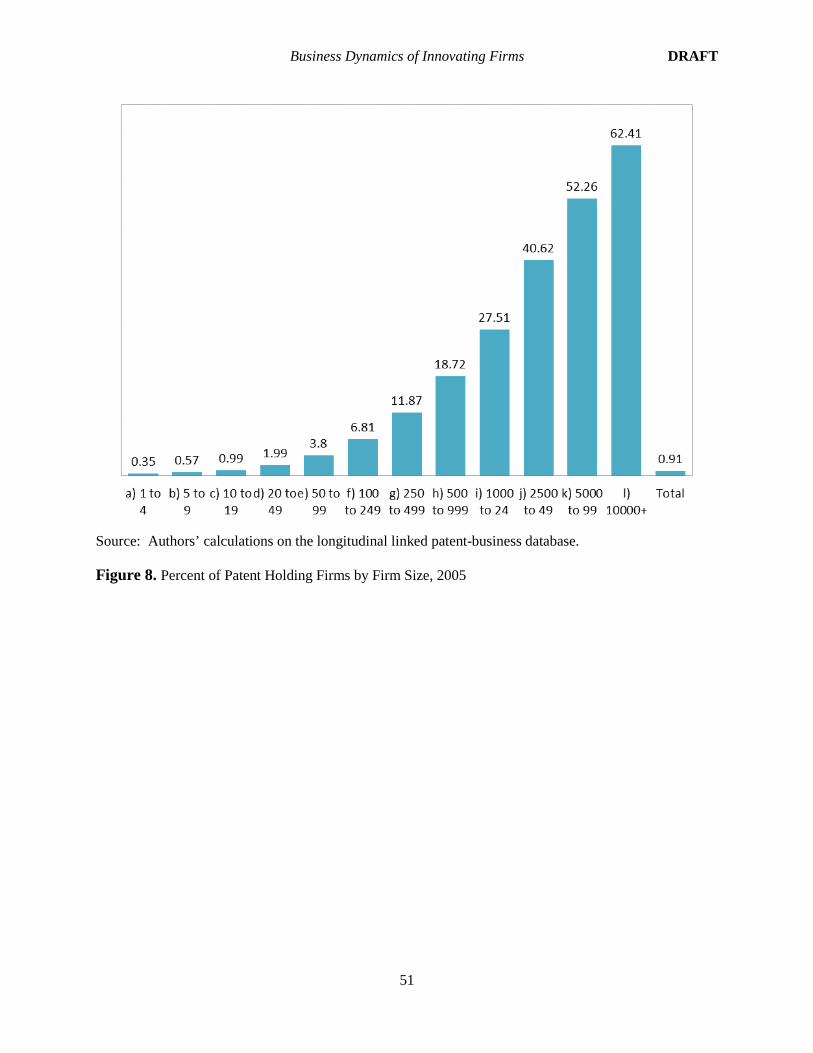
consistent with previous findings in the literature.47 Figure 8 shows the proportion of patent holding firms
by firm employment in 2005. Patenting is a rare event among the smallest firms, with a U.S. patent being
assigned to less than 0.5 percent of the smallest U.S. firms (those with 1 to 4 employees). We find this
44 Obviously there are different approaches that can be taken here depending on the question at hand. For example we may want to examine firm activity immediately before and after the granting of a patent. Alternatively we may want to examine differences across patent holding firms and not. Note Akcigit, et al. (2013) consider a firm to be innovative if it has received a patent or engaged in R&D expenditures within a five year window of time. We leave examination of timing issues for a later time. We believe both sets of questions are important. 45 We plan to explore the heterogeneity in patent portfolios, technologies, and firm characteristics in future work. 46 We note there are complex issues around the transfer of the ownership of patents after the patent has been granted. We simply note these issues here. We expect to incorporate the assignments database to future versions of the longitudinal linked patent-business database. 47 See Acs and Audretsch (1988) and Balasubramanian and Sivadasan (2011). The later find that patenting firms account for 52% of all employment in the manufacturing sector.
25
DO NOT QUOTE OR CITE WITHOUT PERMISSION PRELIMINARY DRAFT
proportion increasing monotonically with size: at least one patent is assigned to about 12 percent of firms
with between 250 and 499 employees, and to a majority of the largest firms (those with 5,000 or more
employees). Among the largest firms, those with 10,000 or more employees, we find 62 percent with at
least one assigned patent. The finding that the share of firms with patenting activity increases
monotonically with firm size in the U.S. economy is similar to prior findings for the U.S. manufacturing
sector [see Balasubramanian and Sivadasan (2011)].
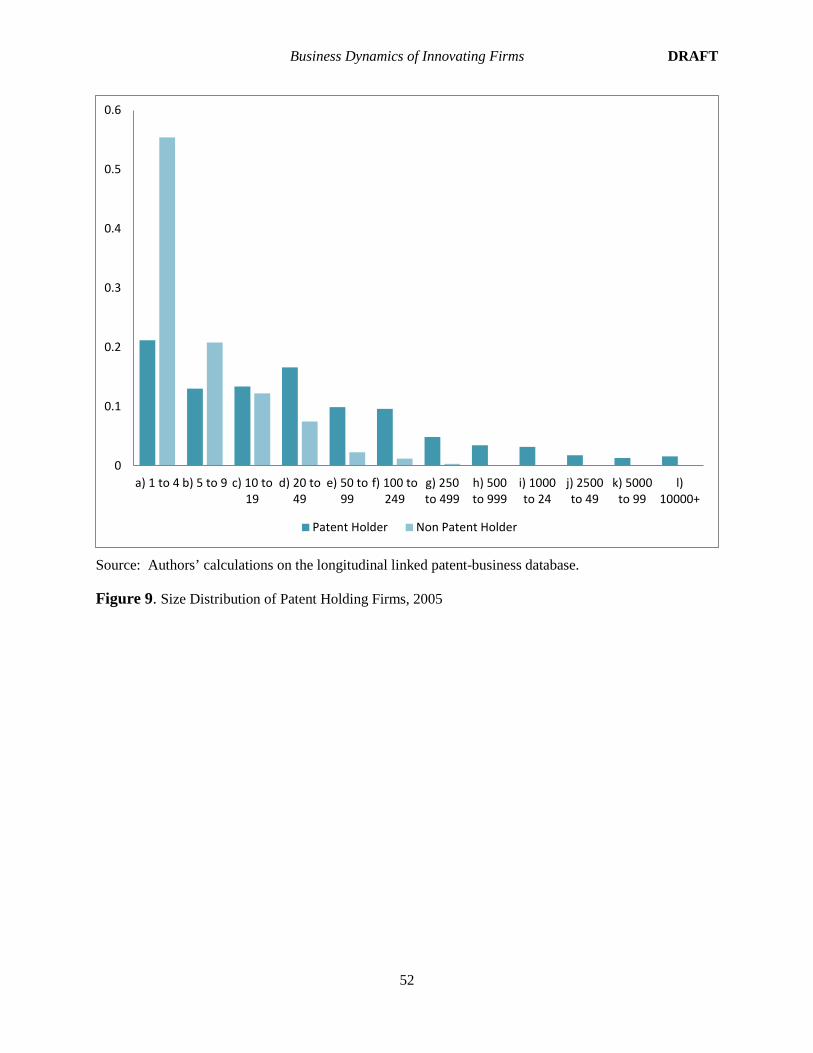
While patenting is a characteristic of large firms, our analysis demonstrates that small firms play
an important role in this economic activity. While relatively few small firms engage in patenting activity,
they account for a large share of all patenting firms. Figure 9 shows the size distribution of patent holding
firms in 2005. We find the smallest firms, those with less than 4 employees, account for 21 percent of the
total number of patenting firms. This share sums to (a maximum) of 64 percent when we consider all
firms with less than 50 employees, while the largest firms (those with at least 10,000 employees) account
for only 1.6 percent of patenting firms. This finding is driven by the very skew distribution of firms in
terms of size in the U.S. economy: Comparing the size distribution of firms that are assigned, and are not
assigned, a U.S. patent, we find the probability that small entities hold patents is lower than the likelihood
that they do not hold patents.
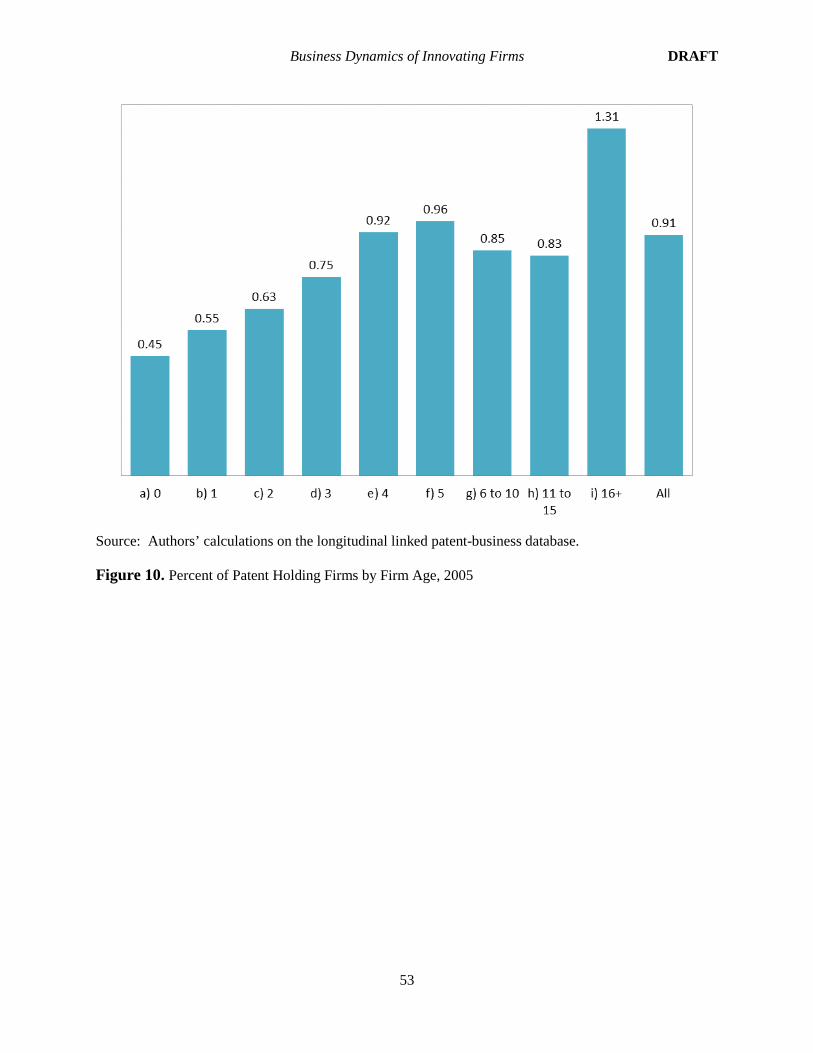
Innovation is often associated with young firms (Andrews et al. 2014). Figure 10 shows the
percent of firms that are assigned a patent in 2005, by firm age. Patenting is not as rare of an event for the
youngest firms compared to the oldest firms, with close to 0.5 percent of the startups in 2005 granted a
patent either at startup or at some later time.48 The oldest firms, those more than 16 years old, are 3 times
more likely than startups to have been granted a patent. While we cannot determine whether patenting is
more likely at older firms since we do not examine the timing of the patent grants, we can with these data
determine that older firms are more likely to be assigned patents, although we acknowledge this finding
48 Note we have abstracted from timing issues in our analysis here.
26
DO NOT QUOTE OR CITE WITHOUT PERMISSION PRELIMINARY DRAFT
may be a result of selection and the nature of innovations captured by our measures. We leave
exploration of the dynamics of patenting within firms for future work. Figure 11 compares the age
distribution of firms assigned patents in 2005 as against those with no patents assigned, revealing that
young firms are more likely to have no assigned patents than they are to have patents assigned to them.
The most commonly granted patent in the U.S. is a “utility patent” conferring exclusive rights to
use, make or sell new products, machines, combinations of matter, and processes (including software).
We expect these types of inventions to be more typically associated with innovation conducted in some
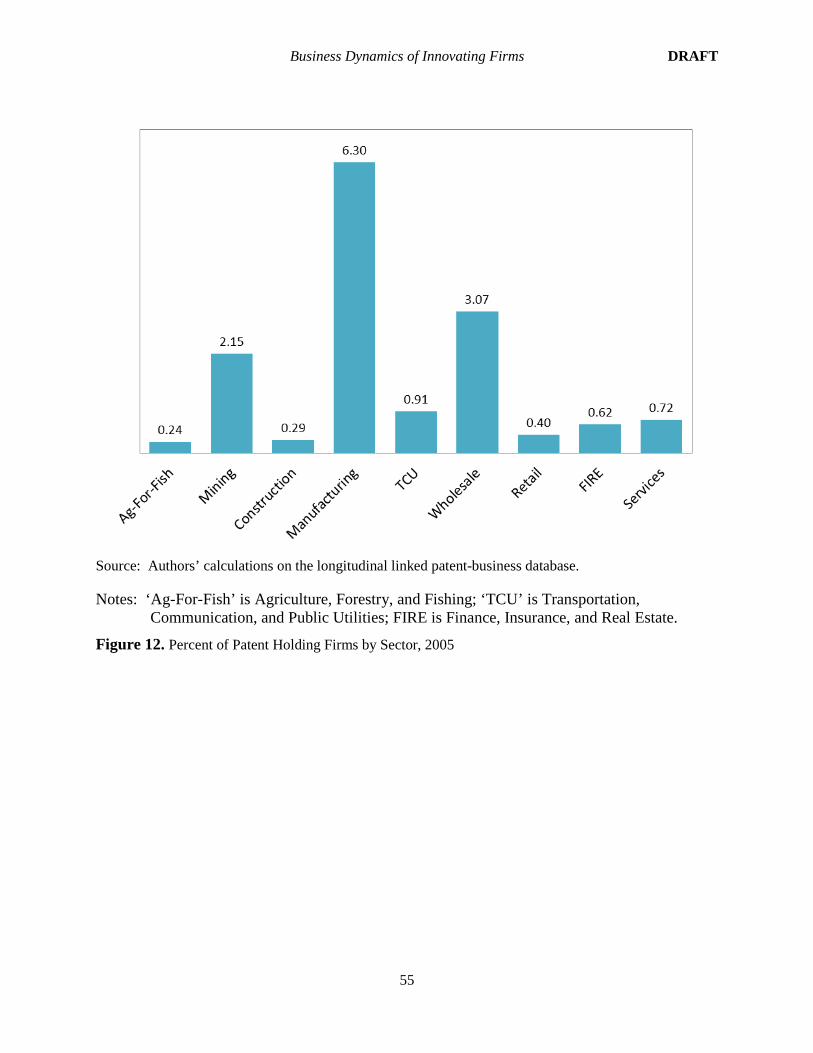
industries than in other industries. Figure 12 shows the share of firms that patent in 2005 by broad
industrial class, allowing individual firms to populate multiple categories if they engage in activities
across multiple sectors.49 We find the manufacturing sector is particularly patent intensive with more
than 6 percent of firms linked to patenting activity. Firms in the mining and wholesale sectors are also
relatively likely to patent, with 2 percent and 3 percent of their firms patenting, respectively.50 Firms in
transportation, communication, and public utilities (TCU), services and finance, insurance, and real estate
(FIRE) are less likely to patent with 0.9 percent, 0.7 percent, and 0.6 percent of firms being assigned a
patent, respectively. Firms in retail, construction, and agriculture, forestry, and fishing (Ag-For-Fish) are
the least prone to this activity, with 0.4 percent, 0.3 percent and 0.2 percent of firms patenting,
respectively.
We note that the manufacturing sector accounts for a relatively small number of firms in the
economy when compared to retail or services. So while patenting activity is more likely among
manufacturing firms, it is reasonable to hypothesize that a significant share of patenting is occurring
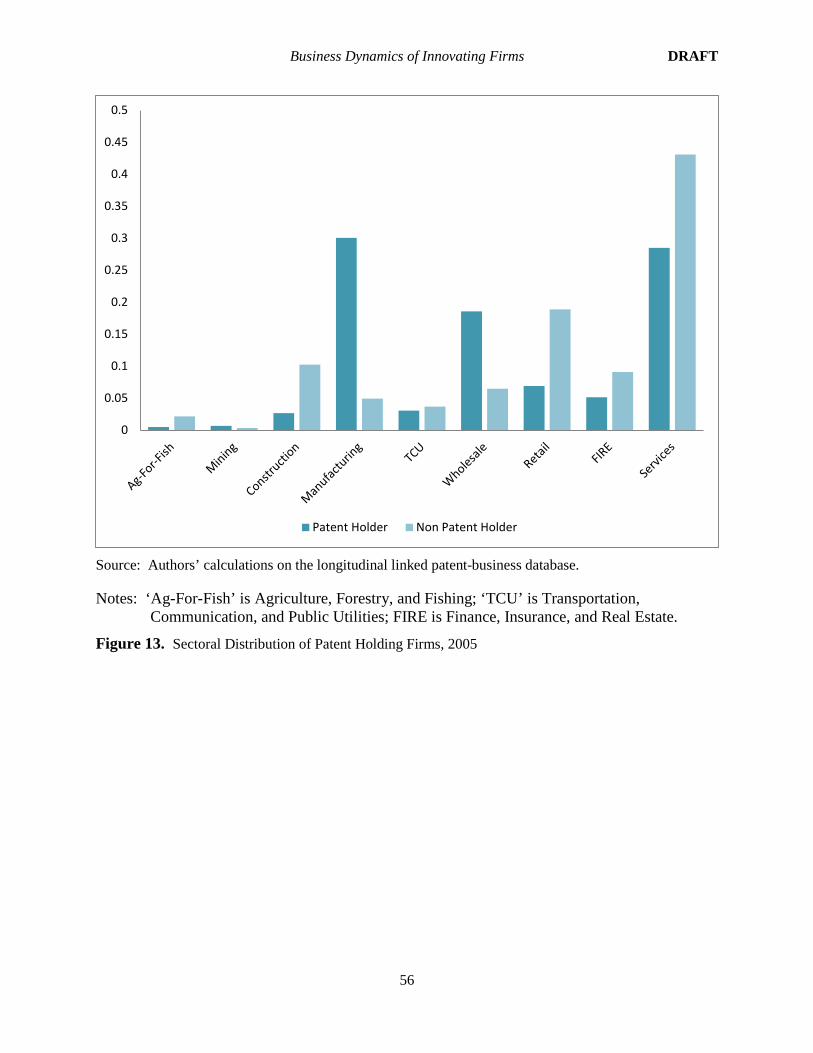
among firms outside the manufacturing sector. Figure 13 shows an activity-based distribution of
49 For example, a firm maybe included in “manufacturing” and also in “finance and insurance” if the firm controls an establishment dedicated to this activity. The U.S. Census Bureau assigns an industry code to each establishment based on its primary activity (generally the activity that generates the most revenue for the establishment). 50 Wholesale activities might be linked to factoryless manufacturing goods producers or alternatively manufacturing firms with some associated wholesale activity.
27
DO NOT QUOTE OR CITE WITHOUT PERMISSION PRELIMINARY DRAFT
patenting firms in 2005 by sector. We find that only 30 percent of patenting observations at the firm-
sector level are engaged (at least partly) in manufacturing, while a larger share of patenting firms are
active outside of manufacturing. About 28 percent of patenting observations at the firm-sector level are
active in the services sector, 19 percent in the wholesale sector, and 7 percent in the retail sector.
Comparing the sectoral distribution of patenting observations against non-patenting observations at this
firm-sector level, we find that the probability that a non-patent assignee firm is active in either the (i)
manufacturing or the (ii) wholesale sectors is smaller than the probability that the firm is a patent assignee
in 2005.
Ultimately, we are interested in understanding the innovation process and what relationships we
may discover between firm patenting and economic outcomes such as job creation and productivity
growth. We define “job creation” and “job destruction” following Davis, Haltiwanger, and Schuh (1996).
Let Eit be employment in year t for establishment i. We measure the establishment-level employment
growth rate as follows:
git =Eit − Eit-1
𝑋𝑋it
where
𝑋𝑋it =Eit+Eit-1
2
This growth rate measure has become standard in analysis of establishment and firm dynamics
both because it shares some useful properties of log differences and because it accommodates entry and
exit [See Davis et al. (1996) and Tornqvist, Vartia and Vartia 1985].51 These measures can also be
computed for any firm characteristic including firm size, firm age, and industry.
51 The DHS growth rate, like the log first difference, is a symmetric growth rate measure but has the added advantage that it accommodates entry and exit. It is a second-order approximation of the log difference for growth rates around zero. Note that the use of a symmetric growth rate does not obviate the need to be concerned about
28
DO NOT QUOTE OR CITE WITHOUT PERMISSION PRELIMINARY DRAFT
Figure 14 shows job creation and destruction rates among patenting and non-patenting firms,
excluding startups, by firm age as an average over the 2005 and 2008 period. We exclude startups from
this chart since startups only create jobs and there is no contrast between types of firms in this regard.52
We find patenting firms create more jobs than non-patenting firms for all age classes except among the
youngest firms (those that are 1 year old). Our analysis shows the average growth differential is in excess
of 3 growth points. By contrast, non-patenting firms on average shed more jobs than do patenting firms
across almost all age classes, with the youngest non-patenting firms shedding the most jobs. Our analysis
shows the average differential is nearly 7 growth points.
Larger growth among young patenting firms is consistent with results in Acemoglu et al.
(2013).53 Perhaps less understood is that the net growth differential for patenting firms is in large part
driven by a large skew in the firm growth rate distribution for young firms.54 These firms tend to
disproportionally create jobs, but there are relatively small and there are relatively few of these firms;
accordingly, while patent holding firms account for 27 percent of gross job creation in our analysis, young
patent holding firms (those up to 10 years old) account for less than 1.5 percent of the gross job creation
we observe.55
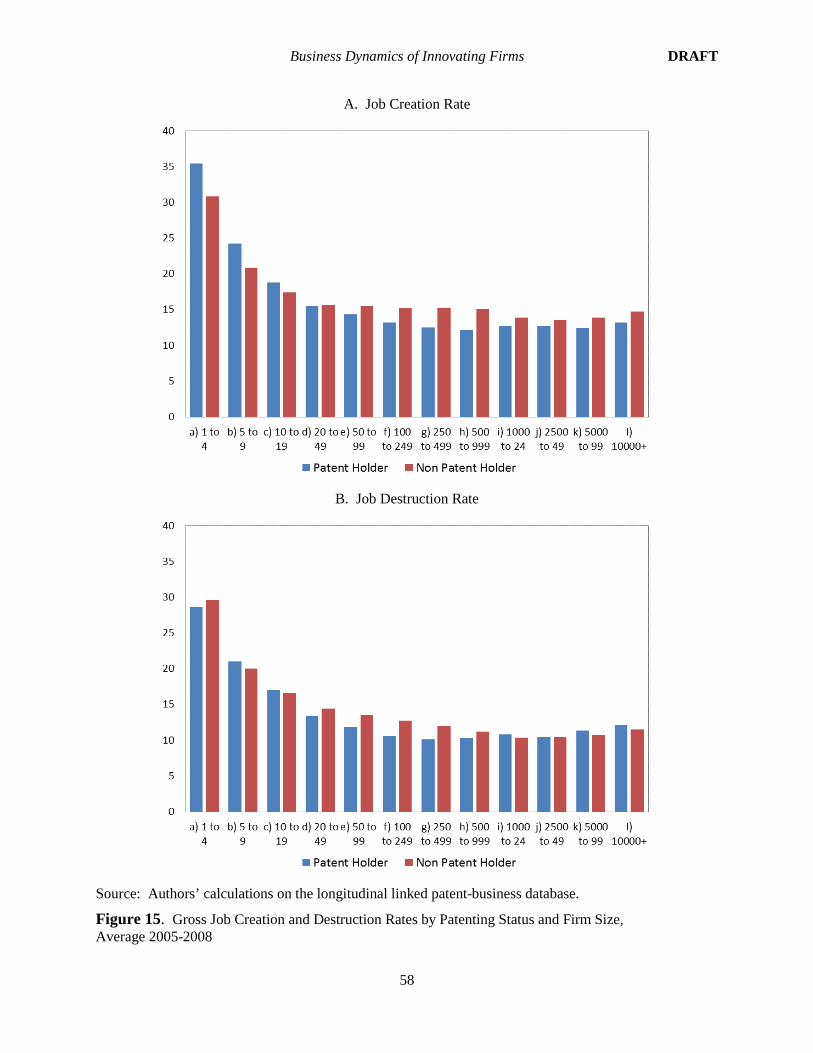
Figure 15 shows job creation and destruction rates among patenting and non-patenting firms, by
firm size as an average over the 2005-2008 period. Again small patenting firms (not controlling for age)
disproportionally contribute jobs to the economy, but the patterns we find here are much less pronounced
than in Figure 14. On average, we find job creation rates for patenting firms exceeding those for non-
regression to the mean effects. Also, note that the DHS growth rate is not only symmetric but bounded between -2 (exit) and 2 (entrant). 52 Startups are de novo firms with all brand new establishment(s). These firms have no activity in the previous year. The job creation rate for these firms is equal to 2 in the standard DHS methodology. Note that the inclusion of this rate in the graphs would only reduce the magnitude of the remaining bars making comparisons across types of firms that much harder. 53 Their sample includes both patenting firms as well as firms engaged in R&D expenditures. 54 Decker et al (2015) similarly find the growth distribution is highly skewed for young firms. They argue this is due to the most innovative transformational firms in the economy. 55 Young patent holding firms grow disproportionally fast so their contribution is expected to continue and grow as they age.
29
DO NOT QUOTE OR CITE WITHOUT PERMISSION PRELIMINARY DRAFT
patenting firms by less than 1 growth point. When we examine job destruction, the differential again
shows patenting firms performing better, but by less than 0.5 growth points.
6. Conclusion and Future Work
This paper describes the joint efforts of the U.S. Census Bureau and the USPTO to create a new
longitudinal database of patents holding firms and inventors covering the period between 2000 and 2011.
The goal of the partnership between the Census Bureau and the USPTO is to create data products that
improve our knowledge of the innovation process and describe its impact on relevant economic outcomes
such as job creation and productivity growth.
We differ from previous patent matching efforts in that we link patent data to two independent
administrative data sets –one on firms and one on workers. Previous efforts have only been able to
exploit the administrative frame of firms in the U.S. from the Census Bureau BR. We follow them but
expand on their work by using an additional administrative data set on workers and employers from the
LEHD program. The LEHD data allows us to create an independent link to the employers where the
inventors work. We triangulate the two datasets to create a more comprehensive frame of patent holding
firms in the U.S. and their workers, and inventors. We are able to match over 90 percent of U.S. patent
assignees to the BR. The use of two independent sources of information allows us to validate a large
fraction of the matches.
We use the resulting database to explore basic features of the population of patent holding firms.
We find patenting is a rare event amongst U.S. firms. Most firms in the U.S. do not patent. However,
those that do, particularly young patenting firms, disproportionally contribute jobs to the U.S. economy.
We find the population of patenting firms itself is highly skewed. Most patenting firms hold a single
patent but a small percentage of firms hold the majority of patents. A natural consequence of the skew in
the firm size distribution is that while patenting is a relatively rare event among small firms, most
patenting firms are nonetheless small. We also find patenting is not as rare an event for the youngest
30
DO NOT QUOTE OR CITE WITHOUT PERMISSION PRELIMINARY DRAFT
firms compared to the oldest firms. Finally, we find firms engaged in manufacturing are the most likely
to patent, but that most patenting firms are in the services and wholesale sectors.
This paper provides a first glimpse at the types of tabulations and analysis that are possible using
the simplest possible measure of patent activity, the presence or absence of patenting activity at the firm
level. Many other dimensions of innovative activity can be examined using these rich data. We have
developed multiple measures of the patent value, impact, and knowledge content in this database. We
have also added measures of technological innovation, including whether the innovation is general,
limited use, or is radical or incremental when compared with the prior art. In the future, we anticipate
incorporating these and other measures to characterize both particular patents and also firms’ patent
portfolios.
In terms of our matching methodology, we expect to extend and improve the match rates in
follow up extensions of these data. In particular, we expect to extend the number of years covered by the
database, and to add to the richness of assignment information available to us, by including for instance
dynamic assignment information available in the USPTO Patent Assignments Dataset (Marco et al.
2015). We also plan to refine our matching algorithms by exploiting the information contained in the
network of inventors available to us in the patent data. Supplementary versions will incorporate
information on the quality and value of the patents and firm patent portfolios. Finally, the current effort
generated additional files including a longitudinal database of inventors, a disambiguated database of
inventors, and a disambiguated database of patent holding firms. We leave the discussion of these
databases to future papers forthcoming from this team of researchers.
31
DO NOT QUOTE OR CITE WITHOUT PERMISSION PRELIMINARY DRAFT
References
Acemoglu, Daron, Ufuk Akcigit, Nicholas Bloom, and William R. Kerr. 2013. “Innovation,
Reallocation and Growth.” NBER Working Paper, No. 18993.
Acs, Zoltan J. and David B. Audretsch. 1988. “Innovation in Large and Small Firms: An Empirical
Analysis.” The American Economic Review, 78(4): 678-90.
Andrews, Dan, Chiara Criscuolo, and Carlo Menon. 2014. "Do Resources Flow to Patenting Firms?
Cross-Country Evidence from Firm Level Data." OECD Economics Department Working Papers No.:
1127.
Balasubramanian, Natarajan and Jagadeesh Sivadasan. 2010. “NBER Patent Data-BR Bridge: User
Guide and Technical Documentation.” Center for Economic Studies Discussion Paper Series,
No. 10-36.
Balasubramanian, Natarajan and Jagadeesh Sivadasan. 2011. “What Happens When Firms Patent? New
Evidence from U.S. Economic Census Data.” The Review of Economics and Statistics, 93(1): 126-46.
Becker, Randy A., John Haltiwanger, Ron Jarmin, Shawn D. Klimek, and Daniel J. Wilson. 2006.
“Micro and Macro Data Integration: The Case of Capital.” In A New Architecture for the U.S.
National Accounts, ed. Dale W. Jorgenson, J. Steven Landefeld, and William D. Nordhaus, 541-
609. The University of Chicago Press.
Cohen, Wesley M. 2010. “Fifty Years of Empirical Studies of Innovative Activity and Performance.” In
Handbook of the Economics of Innovation, Volume 1, ed. Bronwyn H. Hall and Nathan Rosenberg,
129-213. North-Holland.
Davis, Steven J., John Haltiwanger, Ron Jarmin, and Javier Miranda. 2007. “Volatility and Dispersion in
Business Growth Rates: Publicly Traded versus Privately Held Firms.” In NBER Macroeconomics
Annual 2006, Volume 21, ed. Daron Acemoglu, Kenneth Rogoff, and Michael Woodford, 107-80.
MIT Press.
Davis, Steven J., John Haltiwanger, and Scott Schuch, 1996. Job creation and destruction. Cambridge,
MA: MIT Press.
32
DO NOT QUOTE OR CITE WITHOUT PERMISSION PRELIMINARY DRAFT
Decker, Ryan, John Haltiwanger, Ron S. Jarmin, and Javier Miranda. 2015. “Where has all the skewness
gone? The decline in high-growth (young) firms in the U.S.” Unpublished paper.
Dreisigmeyer, David, Stuart Graham, Cheryl Grim, Tariqul Islam, Alan Marco, and Javier Miranda.
2014. “A Patent Classification System for the Business Dynamics Statistics.” Unpublished paper.
Hall, Bronwyn H., Adam Jaffe, and Manuel Trajtenberg. 2002. “The NBER Patent Citations Data File:
Lessons, Insights and Methodological Tools.” In Patents, Citations and Innovations, ed. Adam B.
Jaffe and Manuel Trajtenberg, 403-60. Cambridge, MA: The MIT Press.
Haltiwanger, John, Ron S. Jarmin, and Javier Miranda. 2013. “Who Creates Jobs? Small versus Large
versus Young.” The Review of Economics and Statistics, 95(2): 347-61.
Helmers, Christian, Mark Rogers, and Philipp Schautschick. 2011. “Intellectual Property at the Firm-
Level in the UK: The Oxford Firm-Level Intellectual Property Database.” University of Oxford,
Department of Economics, Discussion Paper Series #546.
Jarmin, Ron S. and Javier Miranda. 2002. “The Longitudinal Business Database.” Center for Economic
Studies Discussion Paper, No. 02-17.
Jaffe, Adam B. and Manuel Trajtenberg. 2002. Patents, Citations, and Innovations: A Window on the
Knowledge Economy. MIT Press.
Kerr, William R. and Shihe Fu. 2008. “The Survey of Industrial R&D – Patent Database Link Project.”
The Journal of Technology Transfer, 33(2): 176-86.
Marco, Alan C., Amanda F. Myers, Stuart Graham, Paul D’Agostino, and Jamie Kucab. 2015. "The
USPTO Patent Assignment Dataset: Descriptions, Lessons, and Insights." USPTO Economics
Working Paper (forthcoming).
McCue, Kristin. 2012. “Bridge Files Between Establishments in the on the LEHD-ECF and Census
Business Files for 2008 LEHD Snapshot.” Unpublished LEHD Documentation, U.S. Census Bureau.
Thoma, Grid, Salvatore Torrisi, Alfonso Gambardella, Dominque Guellec, Bronwyn H. Hall, and
Dietmar Harhoff. 2010. “Harmonizing and Combining Large Datasets – An Application to Firm-
Level Patent and Accounting Data.” NBER Working Paper, No. 15851.
33
DO NOT QUOTE OR CITE WITHOUT PERMISSION PRELIMINARY DRAFT
Vilhuber, Lars and Kevin McKinney. 2014. “LEHD Infrastructure Files in the Census RDC –
Overview.” Center for Economic Studies Discussion Paper, No. 14-26.
Wagner, Deborah and Mary Lane. 2014. “The Person Identification Validation System (PVS): Applying
the Center for Administrative Records Research and Applications’ (CARRA) Record Linkage
Software.” CARRA Working Paper Series, No. 2014-01.
Törnqvist, Leo, Pentti Vartia, and Yrjö O. Vartia. 1985. “How Should Relative Changes be Measured?”
The American Statistician 39(1): 43-6.
34
DO NOT QUOTE OR CITE WITHOUT PERMISSION PRELIMINARY DRAFT
Tables and Figures Table 1. Number of Patents per Year in USPTO Granted Patents Data, 2000-2011
Source: Authors’ calculations on the USPTO’s PTMT data. It is notable that the “All Granted Patents” counts derived from the PTMT dataset are marginally different than annual USPTO statistics here: http://www.uspto.gov/web/offices/ac/ido/oeip/taf/us_stat.htm, likely due to updates and unforeseen latent patent grants resulting from appeals entering the PTMT data.
Note: Assigned granted patents are all granted patents except for unassigned patents. Granted patents with assignee organization name are all granted patents less unassigned patents and those assigned (only) to individuals.
DO NOT QUOTE OR CITE WITHOUT PERMISSION PRELIMINARY DRAFT
Table 2. Frequency of Assignee Type in USPTO Granted Patents Data, 2000-2011
Granted Patents Assignee Type Number Percent Unassigned 247,800 10.7 U.S. non-government organization 1,026,536 44.3 Foreign non-government organization 1,016,852 43.8 U.S. individual 10,563 0.5 Foreign individual 6,172 0.3 U.S. Federal Government 10,174 0.4 Foreign government 1,192 0.1
Total 2,319,289 100.0
Source: Authors’ calculations on the USPTO’s PTMT data.
Note: This table reflects assignee type for the primary assignee only. Approximately 2.6 percent of total patents have multiple assignees.
36
DO NOT QUOTE OR CITE WITHOUT PERMISSION PRELIMINARY DRAFT
Table 3. Frequency of U.S. and Foreign Inventors in USPTO Granted Patents Data, 2000-2011
Inventors on Granted
Patents
Inventors on Granted Patents with Application
Year 1996 or Later Number Percent Number Percent U.S. 3,073,383 52.5 3,052,137 52.1 Foreign 2,785,295 47.5 2,769,850 47.3
Total 5,858,678 100.0 5,821,987 100.0
Source: Authors’ calculations on the USPTO’s PTMT data.
37
DO NOT QUOTE OR CITE WITHOUT PERMISSION PRELIMINARY DRAFT
Table 4. Match Rates for Match of Patent-Assignee Combinations to the BR/LBD
All U.S. Assignee Foreign Assignee Match Number Percent Number Percent Number Percent
Source: Authors’ calculations on the Patent-LBD crosswalk file.
Note: We did not attempt to match patents that were “unassigned” or assigned to individuals to the BR/LBD. This table includes only unique patent-assignee combinations.
38
DO NOT QUOTE OR CITE WITHOUT PERMISSION PRELIMINARY DRAFT
Table 5. Frequency of Match Types in the Patent-LBD Crosswalk File
All U.S. Assignees Foreign Assignees match_flag Description Number Percent Number Percent Number Percent
A1 Model 1 loop close (EIN and Firm ID match) 618,705 29.2 603,975 57.6 14,730 1.4 A2 Model 2 loop close (Firm ID match) 46,384 2.2 41,975 4.0 4,409 0.4 A3 Model 3 loop close (EIN match) 7,372 0.3 6,992 0.7 380 0.0 B1 BR only loop close 329,182 15.5 92,743 8.8 236,439 22.1 B2 BR only residual match 240,643 11.4 25,011 2.4 215,632 20.2 C1 LEHD only loop close - inventors and Firm ID 40,656 1.9 34,678 3.3 5,978 0.6 C2 LEHD only loop close - Firm ID 28,155 1.3 23,240 2.2 4,915 0.5 C3 LEHD only remainder match 27,544 1.3 23,514 2.2 4,030 0.4 D1 Unmatched firms loop close by Firm Name (Some manual) 28,469 1.3 4,650 0.4 23,819 2.2 D2 Unmatched firms matched to Firm ID manually 99,656 4.7 21 0.0 99,635 9.3 E1 Model 4 loop close (unique BR firm id) 95,853 4.5 83,274 7.9 12,579 1.2 E2 Model 4 loop close (unique LEHD firm id) 17,642 0.8 14,207 1.4 3,435 0.3
Unmatched 538,650 25.4 94,857 9.0 443,793 41.5
Total 2,118,911 100.0 1,049,137 100.0 1,069,774 100.0
Source: Authors’ calculations on the Patent-LBD crosswalk file.
Note: We did not attempt to match patents that were “unassigned” or assigned to individuals to the BR/LBD. This table includes all patent-assignee-firm identifier combinations in the Patent-LBD crosswalk file.
39
DO NOT QUOTE OR CITE WITHOUT PERMISSION PRELIMINARY DRAFT
Table 6. Variable Listing for Patent-LBD Crosswalk File
Variable Description PRDN Patent identifier application_year Patent application year assignee_country Patent assignee country (populated only for foreign assignees) assignee_sequence Patent assignee sequence number assignee_state Patent assignee state (populated only for U.S. assignees) assignee_type Patent assignee type (see Table 2 for assignee types; populated only for
primary assignee) firmid BR firm identifier (or ALPHA) foreign_assignee_flag = 1 when the assignee is foreign grant_year Patent grant year match_flag Match type flag (see Table 4 for values and descriptions) multiple_assignee_flag = 1 when there are multiple assignees on the patent unique_firm_id = 1 when assigned to a unique BR firm identifier
= 0 when assigned to multiple firm identifiers Note: This is only applicable when match is a Model 1-3 loop close
us_assignee_flag = 1 when the assignee is based in the U.S. us_inventor_flag = 1 when there is a U.S. applicant on the patent year Calendar year of match to the LEHD data yr Calendar year of match to the BR data
40
DO NOT QUOTE OR CITE WITHOUT PERMISSION PRELIMINARY DRAFT
Table 7. Match Rates by Team Size, Patent-LBD Crosswalk
Source: Authors’ calculations on the Patent-LBD crosswalk file.
Notes: This table includes all patent-assignee-firm identifier combinations in the Patent-LBD Crosswalk. Number of citations is the number of times the patent has been cited by other patents. This measure is right-censored because newer patents have had less time to be cited.
42
Business Dynamics of Innovating Firms DRAFT
Table 9. Match Rates by Technology Category, Patent-LBD Crosswalk
Technology Category
All U.S. Assignees Foreign Assignees Number Matched
Source: Authors’ calculations on the Patent-LBD crosswalk file.
Notes: This table includes all patent-assignee-firm identifier combinations in the Patent-LBD Crosswalk. Technology categories are based on Hall et al. (2002) with additions described in Dresigmeyer et al. (2014). Design patents are patents granted for ornamental design of a functional item. Plant patents are for new plants.
43
Business Dynamics of Innovating Firms DRAFT
Figure 1. Diagram of Construction of the Linked Patent-Business Database
Longitudinal Business Database (LBD)
Linked Patent-
Business Database
Business Register (BR)
U.S. Patent and Trademark Office Data
Patent-LBD Crosswalk
Longitudinal Employer Household Dynamics (LEHD)
44
Business Dynamics of Innovating Firms DRAFT
Figure 2. Patent to Firm Matching Process to Create Patent-LBD Crosswalk
Patent-LBD Crosswalk LBDNUM
YEAR Patent Number
NAME U.S. Patent and Trademark
Office Patent Data NAME (Business Assignee
Name) Inventor Name Inventor City Inventor State
PIK (Inventor, assigned at Census)
Application Year Grant Year
PIK
CFN-Year
Business Register (BR)
NAME (Business Name) YEAR CFN EIN
Longitudinal Business Database
(LBD) YEAR CFN
LBDNUM
EIN
Longitudinal Employer Household Dynamics (LEHD)
Data PIK (Employee)
EIN
45
Business Dynamics of Innovating Firms DRAFT
Source: Authors’ calculations on the Patent-LBD crosswalk file.
Figure 3. Number of Patents per Firm, Matched Patenting Firms Only, 2000-2011 Granted Patents
46
Business Dynamics of Innovating Firms DRAFT
Source: Authors’ calculations on the Patent-LBD crosswalk file. This figure includes all patent-assignee firm identifier combinations in the Patent-LBD crosswalk file.
Figure 4. Match Rates by Grant Year, 2000-2011
47
Business Dynamics of Innovating Firms DRAFT
A. All
B. U.S. Assignees C. Foreign Assignees
Source: Authors’ calculations on the Patent-LBD crosswalk file. This figure includes all patent-assignee-firm identifier combinations in the Patent-LBD crosswalk file.
Figure 5. Match Rates by Grant Year, 2000-2011
48
Business Dynamics of Innovating Firms DRAFT
Source: Authors’ calculations on the Patent-LBD crosswalk file. This figure includes all patent-assignee-firm identifier combinations in the Patent-LBD crosswalk file with assignee state in the U.S. (50 states plus District of Columbia).
Figure 6. Match Rates by Assignee State
49
Business Dynamics of Innovating Firms DRAFT
Source: Authors’ calculations on the longitudinal linked patent-business database.
Figure 7. Share of Firms and Employment by Patenting Status, Average 2005-2008
50
Business Dynamics of Innovating Firms DRAFT
Source: Authors’ calculations on the longitudinal linked patent-business database.
Figure 8. Percent of Patent Holding Firms by Firm Size, 2005
51
Business Dynamics of Innovating Firms DRAFT
Source: Authors’ calculations on the longitudinal linked patent-business database.
Figure 9. Size Distribution of Patent Holding Firms, 2005
0
0.1
0.2
0.3
0.4
0.5
0.6
a) 1 to 4 b) 5 to 9 c) 10 to19
d) 20 to49
e) 50 to99
f) 100 to249
g) 250to 499
h) 500to 999
i) 1000to 24
j) 2500to 49
k) 5000to 99
l)10000+
Patent Holder Non Patent Holder
52
Business Dynamics of Innovating Firms DRAFT
Source: Authors’ calculations on the longitudinal linked patent-business database.
Figure 10. Percent of Patent Holding Firms by Firm Age, 2005
53
Business Dynamics of Innovating Firms DRAFT
Source: Authors’ calculations on the longitudinal linked patent-business database.
Figure 11. Age Distribution of Patent Holding Firms, 2005
0
0.05
0.1
0.15
0.2
0.25
0.3
0.35
0.4
0.45
0.5
a. 0 b. 1 c. 2 d. 3 e. 4 f. 5 g. 610 h. 1115 i) 16+
Patent Holder Non Patent Holder
54
Business Dynamics of Innovating Firms DRAFT
Source: Authors’ calculations on the longitudinal linked patent-business database.
Notes: ‘Ag-For-Fish’ is Agriculture, Forestry, and Fishing; ‘TCU’ is Transportation, Communication, and Public Utilities; FIRE is Finance, Insurance, and Real Estate.
Figure 12. Percent of Patent Holding Firms by Sector, 2005
55
Business Dynamics of Innovating Firms DRAFT
Source: Authors’ calculations on the longitudinal linked patent-business database.
Notes: ‘Ag-For-Fish’ is Agriculture, Forestry, and Fishing; ‘TCU’ is Transportation, Communication, and Public Utilities; FIRE is Finance, Insurance, and Real Estate.
Figure 13. Sectoral Distribution of Patent Holding Firms, 2005
0
0.05
0.1
0.15
0.2
0.25
0.3
0.35
0.4
0.45
0.5
Patent Holder Non Patent Holder
56
Business Dynamics of Innovating Firms DRAFT
A. Job Creation Rate
B. Job Destruction Rate
Source: Authors’ calculations on the longitudinal linked patent-business database.
Figure 14. Gross Job Creation and Destruction Rates by Patenting Status and Firm Age, Average 2005-2008
57
Business Dynamics of Innovating Firms DRAFT
A. Job Creation Rate
B. Job Destruction Rate
Source: Authors’ calculations on the longitudinal linked patent-business database.
Figure 15. Gross Job Creation and Destruction Rates by Patenting Status and Firm Size, Average 2005-2008
58
Business Dynamics of Innovating Firms DRAFT
Appendix
Figure A.1. Matching Models
1. Closed Loop Model 1: EIN and ALPHA are the same
2. Closed Loop Model 2: EIN is not the same but the ALPHA is the same
Patent(1)
EIN(1)
Firm(a)
EIN(1)
Firm(a)
Patent(1)
EIN(1)
Firm(a)
EIN(2)
Firm(a)
Applicant(x) Assignee(a)
Applicant(x) Assignee(a)
Time A G
Time A G
59
Business Dynamics of Innovating Firms DRAFT
3. Closed Loop Model 3: EIN is the same but the ALPHA is not the same
4. Model 4. Assignee and inventor links do not line up.