303
Unit – 1 Business Finance By: Prof. Kavita Pareek ( Dnyansagar Institute of Management and Research, Balewadi, Pune.)
Unit – 1 Business Finance
By:
Prof. Kavita Pareek ( Dnyansagar Institute of Management and Research,
Balewadi, Pune.)

Introduction
Business concern needs finance to meet their
requirements in the economic world. Any kind of
business activity depends on the finance. Hence, it is
called as lifeblood of business organization. Whether
the business concerns are big or small, they need
finance to fulfil their business activities.

Meaning of Finance
Finance may be defined as the art and science of
managing money. It includes financial service and
financial instruments. Finance also is referred as the
provision of money at the time when it is needed.
Finance function is the procurement of funds and their
effective utilization in business concerns.

Definition of Finance
According to Khan and Jain, ―Finance is the art and
science of managing money‖.
According to Oxford dictionary, the word ‗finance‘
connotes ‗management of money‘.
Meaning of Business Finance
Money required for carrying out business activities is called business Finance.

Definition of Business Finance
According to the Wheeler, ―Business finance is that business
activity which concerns with the acquisition and conversation of
capital funds in meeting financial needs and overall objectives of a
business enterprise‖.
According to the Guthumann and Dougall, ―Business finance can
broadly be defined as the activity concerned with planning, raising,
controlling, administering of the funds used in the business‖.

Financial management
(Meaning)
Financial management is concerned with optimal procurement as well as usage of Finance.

Financial management
(Definition)
Howard and Upton : Financial management ―as an application of
general managerial principles to the area of financial decision-
making.
Weston and Brigham : Financial management ―is an area of
financial decision-making, harmonizing individual motives and
enterprise goals‖.
Approaches
The approach to the scope and functions of
financial management is divided for the purpose
of exposition into two broad categories:
Traditional approach.
Modern approach.
Traditional Approach
The traditional approach, which was popular in the
early stage, limited the role of financial management to
raising and administering of funds needed by the
corporate enterprises to meet their financial needs.

Main limitations of Traditional Approach
1. Ignored routine problems.
2. Ignored finance manager‘s viewpoint.
3. Ignored non-corporate enterprise.
4. No emphasis on allocation of funds.

Modern Approach
According to modern approach the term financial management provides a conceptual and analytical framework for financial decision-making.
The dividend decision.
Major decisions
The financial management can be further
classified into three major decisions:
The financing decision.
The investment decision.

Financial Decisions
Dividend
Decision
Financing Decision
Capital Budgeting
Cost of capital
Working Capital Management
Capital Structure
Investment
Decision
Investment Decisions
These decisions relate to how the firm‘s funds
are invested in different assets so that they are
able to earn the highest possible return for
their investors.

The investment criteria involved.
Factors Affecting
The rate of return.
Cash flows of the project.

Financing Decisions
This is about the quantum of finance to be
raised from various long-term sources.
The main sources of funds are
shareholders funds and borrowed funds.
Cost Risk Floatation costs. Cash flow position of the business
Factors Affecting

Dividend Decision
Dividend is that portion of profits, which is
distributed to shareholders.
The decision made here is how much of
the profit is to be distributed to the
shareholders and how much of it should
be retained to meet the investment
requirements.

Growth oppurtunities.
Factors Affecting
Earnings.
Stability of earnings.
Stability of dividend.

Objectives
Efficient financial management requires the existence
of some objectives which are as follows:
Profit Maximisation
Wealth Maximisation

OBJECTIVES
PROFIT
WEALTH

Profit Maximization Main aim of any kind of economic activity is earning profit. A
business concern is also functioning mainly for the purpose of
earning profit. Profit is the measuring techniques to understand the
business efficiency of the concern. Profit maximization is also the
traditional and narrow approach, which aims at, maximizes the profit
of the concern. Profit maximization consists of the following
important features.
1. Profit maximization is also called as cashing per share
maximization. It leads to maximize the business operation for profit
maximization.
2. Ultimate aim of the business concern is earning profit, hence, it
considers all the possible ways to increase the profitability of the
concern.
3. Profit is the parameter of measuring the efficiency of the business
concern. So it shows the entire position of the business concern.
4. Profit maximization objectives help to reduce the risk of the
business.

Wealth Maximization
Wealth maximization is one of the modern approaches, which involves
latest innovations and improvements in the field of the business concern.
The term wealth means shareholder wealth or the wealth of the persons
those who are involved in the business concern.
Wealth maximization is also known as value maximization or net present
worth
maximization. This objective is an universally accepted concept in the field
of business.
Finance and other disciplines
1. Financial Management and Economics
2. Financial Management and Accounting
3. Financial Management or Mathematics
4. Financial Management and Production
Management
5. Financial Management and Marketing
6. Financial Management and Human Resource
1. Financial Management and Economics
Economic concepts like micro and macroeconomics are directly applied
with the financial management approaches. Investment decisions, micro and
macro environmental factors are closely associated with the functions of
financial manager. Financial management also uses the economic equations
like money value discount factor, economic order quantity etc. Financial
economics is one of the emerging area, which provides immense
opportunities to finance, and economical areas.
2. Financial Management and Accounting
Accounting records includes the financial information of the business
concern. Hence, we can easily understand the relationship between the
financial management and accounting. In the olden periods, both financial
management and accounting are treated as a same discipline and then it has
been merged as Management Accounting because this part is very much
helpful to finance manager to take decisions. But nowaday‘s financial
management and accounting discipline are separate and interrelated.

3. Financial Management or Mathematics
Modern approaches of the financial management applied large number of
mathematical and statistical tools and techniques. They are also called as
econometrics. Economic order quantity, discount factor, time value of money,
present value of money, cost of capital, capital structure theories, dividend
theories, ratio analysis and working capital analysis are used as
mathematical and statistical tools and techniques in the field of financial
management.
4. Financial Management and Production Management
Production management is the operational part of the business concern,
which helps to multiple the money into profit. Profit of the concern depends
upon the production performance. Production performance needs finance,
because production department requires raw material, machinery, wages,
operating expenses etc. These expenditures are decided and estimated by
the financial department and the finance manager allocates the appropriate
finance to production department. The financial manager must be aware of
the operational process and finance required for each process of production
activities.

5. Financial Management and Marketing
Produced goods are sold in the market with innovative and modern
approaches. For this, the marketing department needs finance to meet their
requirements. The financial manager or finance department is responsible
to allocate the adequate finance to the marketing department. Hence,
marketing and financial management are interrelated and depends on each
other.
6. Financial Management and Human Resource
Financial management is also related with human resource department,
which provides manpower to all the functional areas of the management.
Financial manager should carefully evaluate the requirement of manpower
to each department and allocate the finance to the human resource
department as wages, salary, remuneration, commission, bonus, pension and
other monetary benefits to the human resource department. Hence, financial
management is directly related with human resource management.
FUNCTIONS OF FINANCE MANAGER
1. Forecasting Financial Requirements
2. Acquiring Necessary Capital
3. Investment Decision
4. Cash Management
5. Interrelation with Other Departments

IMPORTANCE OF FINANCIAL
MANAGEMENT
1. Financial Planning
2. Acquisition of Funds
3. Proper Use of Funds
4. Financial Decision
5. Improve Profitability
6. Increase the Value of the Firm
7. Promoting Savings

By:
Prof. Kavita Pareek ( Dnyansagar Institute of Management and Research,
Balewadi, Pune.)

Financial statements are written records that convey the business activities and the financial performance of a company. Financial statements are often audited by government agencies, accountants, firms, etc. to ensure accuracy and for tax, financing, or investing purposes. Financial statements include:
Balance sheet
Income statement
Cash flow statement.
The process of reviewing and analyzing a company‘s financial statements to make better economic decisions is called analysis of financial statements. In other words, the process of determining financial strengths and weaknesses of the entity by establishing the strategic relationship between the items of the balance sheet, profit and loss account, and other financial statements.
The term ‗analysis‘ means the simplification of financial data by methodical classification of the data given in the financial statements, ‗interpretation‘ means, ‗explaining the meaning and significance of the data so simplified.‘ However, both‘ analysis and interpretation‘ are interlinked and complementary to each other.

According to Metcalf and Titard, ―Analyzing financial statements is a process of evaluating the relationship between component parts of a financial statement to obtain a better understanding of a firm‘s position and performance.‖
In the words of Myers, ―Financial statement analysis is largely a study of relationship among the various financial factors in a business as disclosed by a single set-of statements and a study of the trend of these factors as shown in a series of statements.‖

Finance Manager
Top Management
Trade Payables
Lenders
Investors
Trade Unions

Finance Manager Analysis of financial statements helps the finance manager
in:
Assessing the operational efficiency and managerial effectiveness of the company.
Analyzing the financial strengths and weaknesses and creditworthiness of the company.
Analyzing the current position of financial analysis,
Assessing the types of assets owned by a business enterprise and the liabilities which are due to the enterprise.
Providing information about the cash position company is holding and how much debt the company has in relation to equity.
Studying the reasonability of stock and debtors held by the company.
Financial analysis helps the top management
To assess whether the resources of the firm are used in the most efficient manner
Whether the financial condition of the firm is sound
To determine the success of the company‘s operations
Appraising the individual‘s performance
Evaluating the system of internal control
To investigate the future prospects of the enterprise.

Trade payables analyze the financial statements for:
Appraising the ability of the company to meet its short-term obligations
Judging the probability of firm‘s continued ability to meet all its financial obligations in the future.
Firm‘s ability to meet claims of creditors over a very short period of time.
Evaluating the financial position and ability to pay off the concerns.

Suppliers of long-term debt are concerned with the firm‘s long-term solvency and survival. They analyze the firm‘s financial statements
To ascertain the profitability of the company over a period of time,
For determining a company‘s ability to generate cash, to pay interest and repay the principal amount
To assess the relationship between various sources of funds (i.e. capital structure relationships)
To assess financial statements which contain information on past performances and interpret it as a basis for forecasting future rates of return and for assessing risk.
For determining credit risk, deciding the terms and conditions of a loan if sanctioned, interest rate, and maturity date etc.
Investors, who have invested their money in the firm‘s shares, are interested in the firm‘s earnings and future profitability. Financial statement analysis helps them in predicting the bankruptcy and failure probability of business enterprises. After being aware of the probable failure, investors can take preventive measures to avoid/minimize losses.

Labour unions analyze the financial statements:
To assess whether an enterprise can increase their pay.
To check whether an enterprise can increase productivity or raise the prices of products/ services to absorb a wage increase.

Reviewing the performance of a company over the past periods
Assessing the current position & operational efficiency
Predicting growth & profitability prospects
Loan Decision by Financial Institutions and Banks
To estimate the earning capacity of the business concern.
To find out the operating performance of a company.
To examine efficiency of various business activities.
To find out the financial performance of a company.
To compare the performance of a company for different periods.
To assess the borrowing capacity of the business concern.

To determine the long term liquidity and solvency of the business concern.
To decide about the future prospects of the business concern.
To know the profitability and collection policy of the business concern.
To verify the correctness and accuracy of the decision taken by the management already.
To compare the overall performance of the company with other similar companies.
To examine the impact of past decision of the management on financial aspect.
To determine the debt capacity of the firm.
To judge the managerial ability.

It is only a study of interim reports
Financial analysis is based upon only monetary information and non-monetary factors are ignored.
It does not consider changes in price levels.
As the financial statements are prepared on the basis of a going concern, it does not give exact position. Thus accounting concepts and conventions cause a serious limitation to financial analysis.
Changes in accounting procedure by a firm may often make financial analysis misleading.
Analysis is only a means and not an end in itself. The analyst has to make interpretation and draw his own conclusions. Different people may interpret the same analysis in different ways.
Comparative Statements
Common Size Statements
Trend Analysis
Ratio Analysis
Cash Flow Statement
Fund Flow Statement

Also known as ‗horizontal analysis, are financial statements showing financial position & profitability at different periods of time. These statements give an idea of the enterprise financial position of two or more periods. Comparison of financial statements is possible only when same accounting principles are used in preparing these statements.

The progress of the company can be seen by observing the different assets and liabilities of the firm on different dates to make the comparison of balances from one date to another. To understand the comparative balance sheet, it must have two columns for the data of original balance sheets. A third column is used to show increases/decrease in figures. The fourth column gives percentages of increases or decreases.
By comparing the balance sheets of different dates, one can observe the following aspects
Current financial position and Liquidity position
Long-term financial position
Profitability of the concern

Traditionally known as trading and profit and loss A/c. Net sales, cost of goods sold, selling expenses, office expenses etc are important components of an income statement. To compare the profitability, particulars of profit & loss are compared with the corresponding figures of previous years individually. To analyze the profitability of the business, the changes in money value and percentage is determined.
By comparing the profits of different dates, one can observe the following aspects:
The increase/decrease in gross profit.
The study of operational profits.
The increase or decrease in net profit
Study of the overall profitability of the business.

Common size statements are also known as ‗Vertical analysis‘. Financial statements, when read with absolute figures, can be misleading. Therefore, a vertical analysis of financial information is done by considering the percentage form. The balance sheet items are compared:
to the total assets in terms of percentage by taking the total assets as 100.
to the total liabilities in terms of percentage by taking the total liabilities as 100.
Therefore the whole Balance Sheet is converted into percentage form. And such converted Balance Sheet is known as Common-Size Balance Sheet. Similarly profit & loss items are compared:
to the total incomes in terms of percentage by taking the total incomes as 100.
to the total expenses in terms of percentage by taking the total expenses as 100.
Therefore the whole Profit & loss account is converted into percentage form. And such converted profit & loss account is known as Common-Size Profit & Loss account. As the numbers are brought to a common base, the percentage can be easily compared with the results of corresponding percentages of the previous year or of some other firms.
Also known as the Pyramid Method. Studying the operational results and financial position over a series of years is trend analysis. Calculations of ratios of different items for various periods is done & then compared under this analysis. Whether the enterprise is trending upward or backward, the analysis of the ratios over a period of years is done. By observing this analysis, the sign of good or poor management is detected.

Quantitative analysis of information contained in a company‘s financial statements is ratio analysis. It describes the significant relationship which exists between various items of a balance sheet and a statement of profit and loss of a firm.
To assess the profitability, solvency, and efficiency of a business, management can go through the technique of ratio analysis. It is an attempt at developing a meaningful relationship between individual items (or group of items) in the balance sheet or profit and loss account.

The actual movement of cash into and out of a business is cash flow analysis. The flow of cash into the business is called the cash inflow. Similarly, the flow of cash out of the firm is called cash outflow. The difference between the inflow and outflow of cash is the net cash flow.
Cash flow statement is prepared to project the manner in which the cash has been received and has been utilized during an accounting year. It is an important analytical tool. Analysis of cash flow explains the reason for a change in cash. It helps in assessing the liquidity of the enterprise and in evaluating the operating, investment & financing decisions.

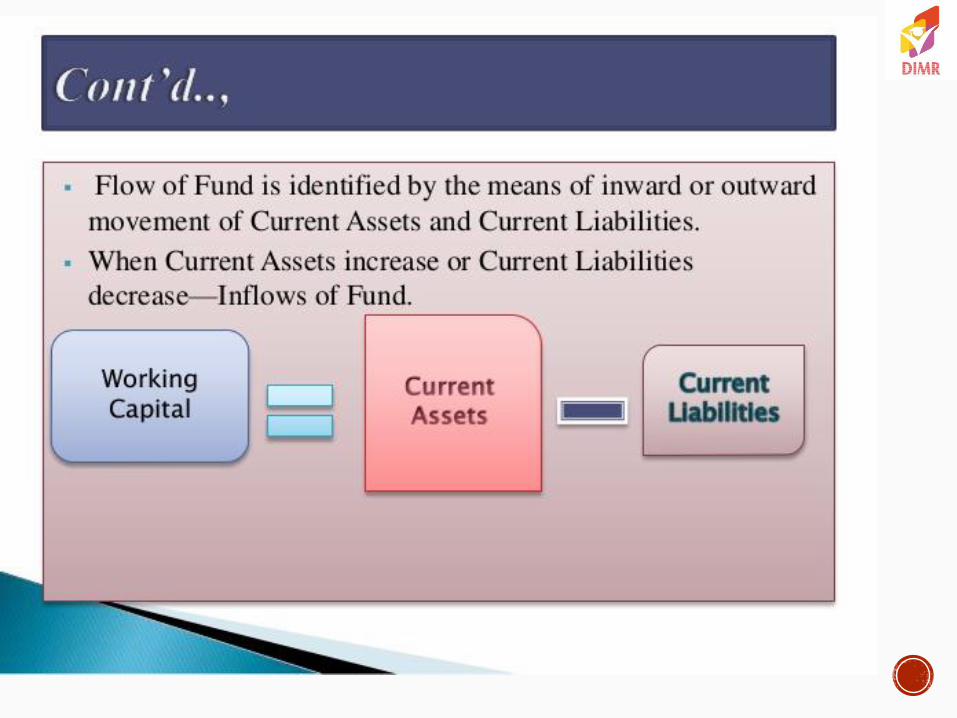
• Prepared to explain the changes which have taken
place in the working capital during the period under
consideration.
• It is a report on movement of funds explaining
wherefrom working capital originates and where into
the same goes during an accounting period.
• Essential tool for long-term financial analysis.


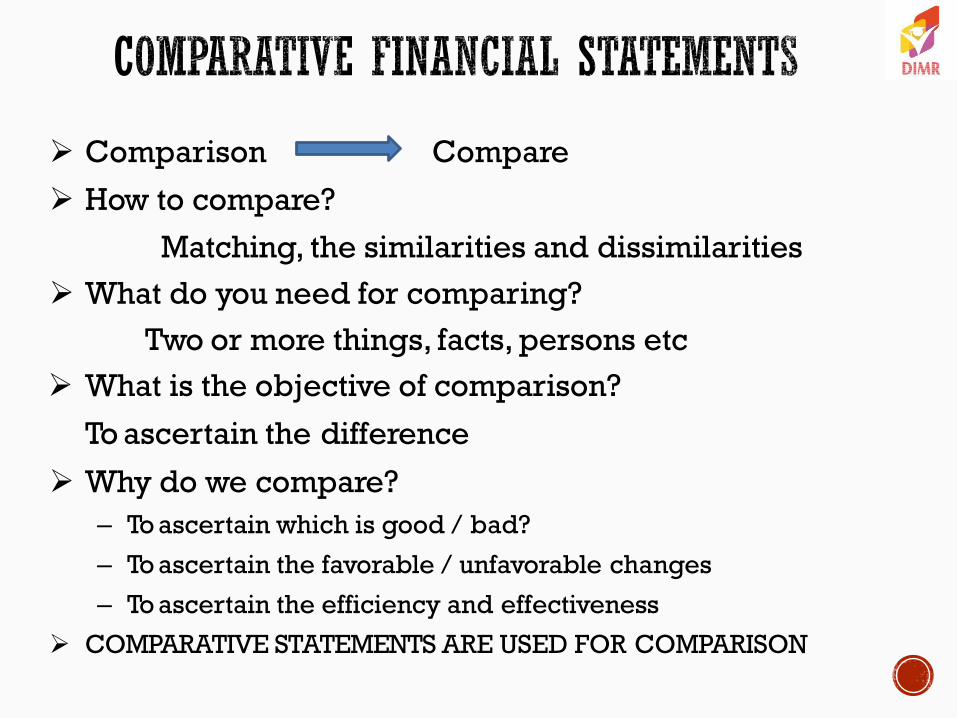
Comparison Compare
How to compare?
Matching, the similarities and dissimilarities
What do you need for comparing?
Two or more things, facts, persons etc
What is the objective of comparison?
To ascertain the difference
Why do we compare?
– To ascertain which is good / bad?
– To ascertain the favorable / unfavorable changes
– To ascertain the efficiency and effectiveness
COMPARATIVE STATEMENTS ARE USED FOR COMPARISON

Statements which summarise and present related accounting data for a number of years incorporating therein the changes (absolute or relative or both) in individual item
Figures of two or more period are placed side by side to facilitate comparison
Tool used for analysing financial statements
Aims to study the changes in individual items when compared to the previous year
On the basis of the changes, valid conclusions on financial condition and/or profitability, strengths and weaknesses etc., of the firm
The changes can be shown either in absolute or relative terms or both
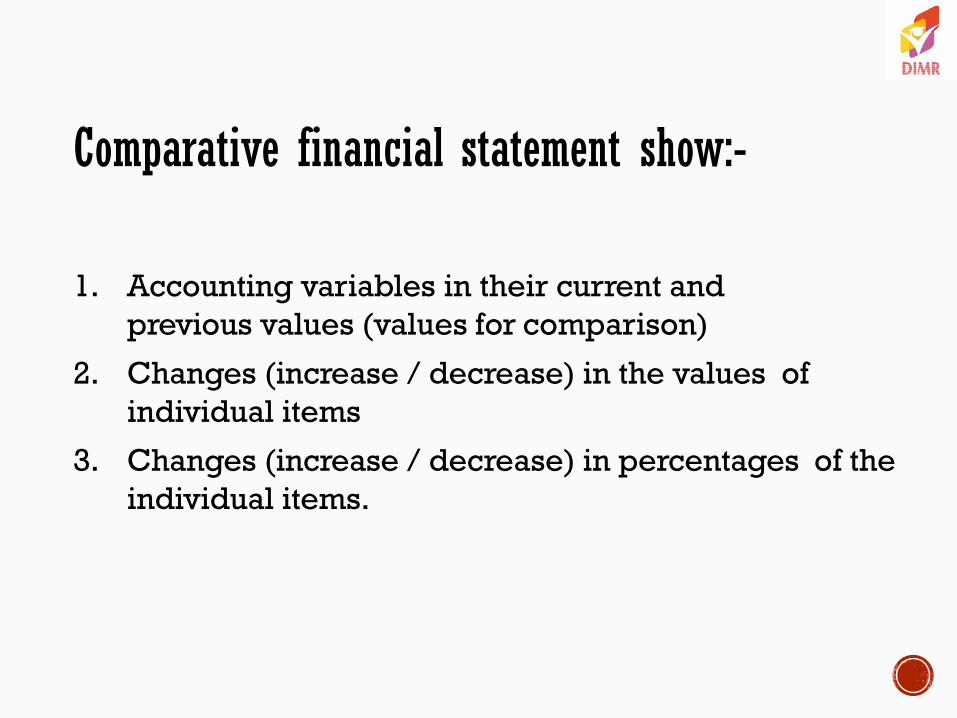
Comparative financial statement show:-
1. Accounting variables in their current and
previous values (values for comparison)
2. Changes (increase / decrease) in the values of
individual items
3. Changes (increase / decrease) in percentages of the
individual items.
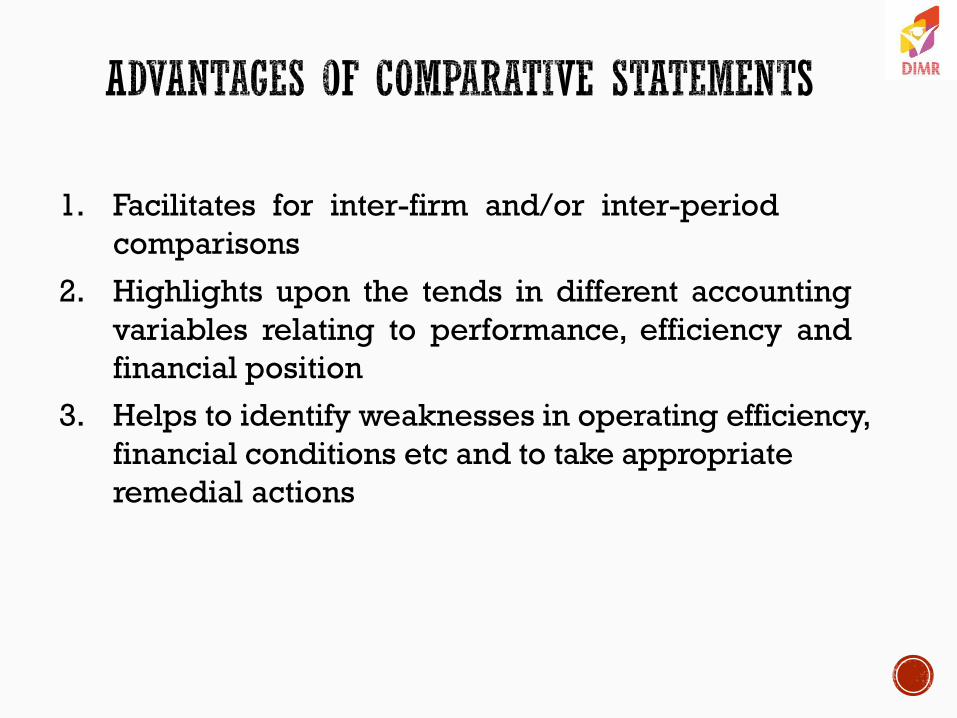
1. Facilitates for inter-firm and/or inter-period
comparisons
2. Highlights upon the tends in different accounting
variables relating to performance, efficiency and
financial position
3. Helps to identify weaknesses in operating efficiency,
financial conditions etc and to take appropriate
remedial actions
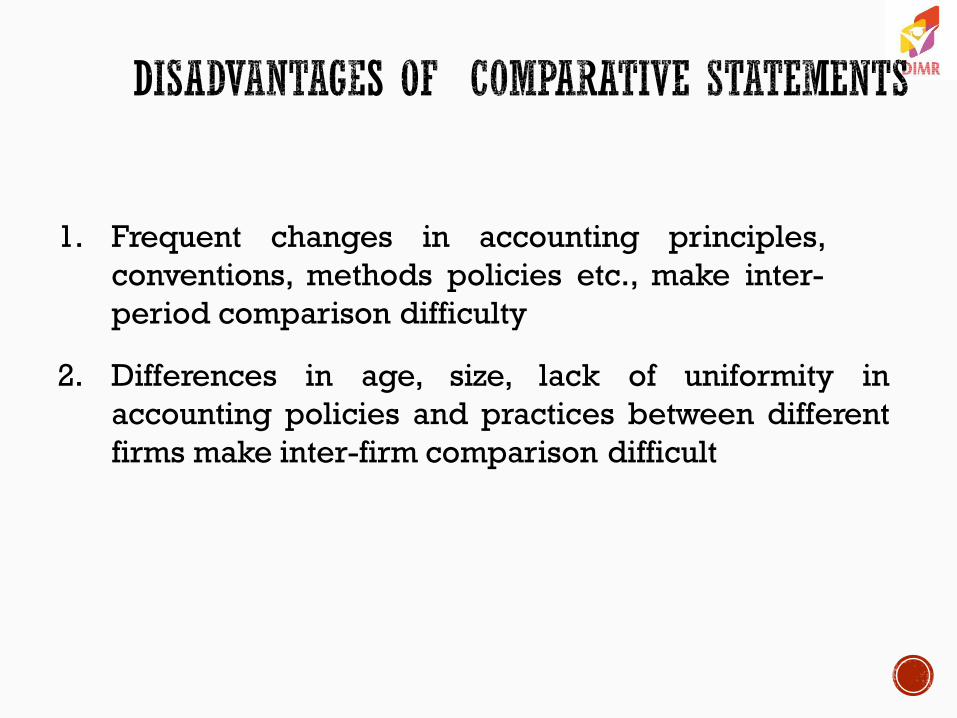
1. Frequent changes in accounting principles,
conventions, methods policies etc., make inter-
period comparison difficulty
2. Differences in age, size, lack of uniformity in
accounting policies and practices between different
firms make inter-firm comparison difficult

COMPARATIVE INCOME STATEMENT
Particulars Values Change (+ / - )
CY PY Absolute Percentage
Net sales 120 100 +20 +20.00
Less Cost of Goods Sold 40 30 +10 +33.33
Gross Profit 80 70 +10 +14.30
Operating expenses 40 25 +15 +60.00
Operating Profit (EBIT) 40 45 -5 -11.10
Less Interest 10 10 0 0
Earning Before Tax 30 35 -5 -14.30
Less Tax 12 15 +3 +20.00
Earnings After Tax 18 20 -2 -10.00
Less Preference Share Dividend 8 8 0 0
Earnings available to Equity Share Holders 10 12 -2 -16.67

COMMON-SIZE FINANCIAL STATEMENTS
Financial statements in which items reported are
converted into percentage to some common base.
In income statement total sales will be taken as the base
for conversion and all items in the income statement are
converted and expressed as percentage of sales.
In balance sheet, total of assets or liabilities will be taken as the common base and all items in the balance sheet are expressed as a percentage of total assets or liabilities.
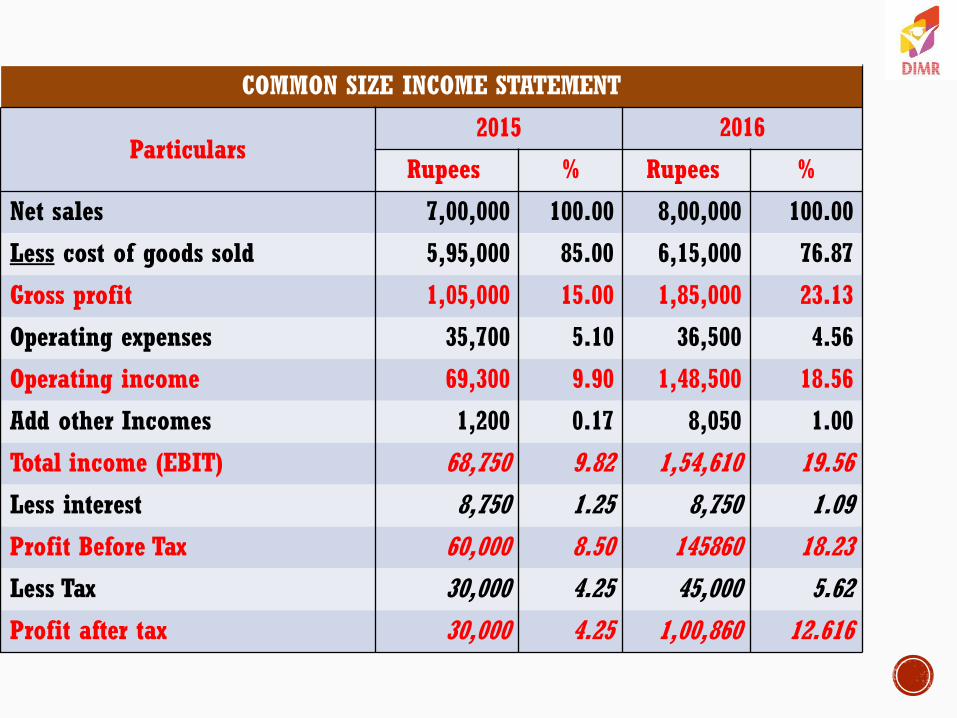
COMMON SIZE INCOME STATEMENT
Particulars 2015 2016
Rupees % Rupees %
Net sales 7,00,000 100.00 8,00,000 100.00
Less cost of goods sold 5,95,000 85.00 6,15,000 76.87
Gross profit 1,05,000 15.00 1,85,000 23.13
Operating expenses 35,700 5.10 36,500 4.56
Operating income 69,300 9.90 1,48,500 18.56
Add other Incomes 1,200 0.17 8,050 1.00
Total income (EBIT) 68,750 9.82 1,54,610 19.56
Less interest 8,750 1.25 8,750 1.09
Profit Before Tax 60,000 8.50 145860 18.23
Less Tax 30,000 4.25 45,000 5.62
Profit after tax 30,000 4.25 1,00,860 12.616

COMMON-SIZE BALANCE SHEET
ASSETS X LTD Y LTD
Rupees % Rupees %
Current Assets :-
Cash in hand 8,000 1.83 10,000 1.25
Prepaid expenses 1,000 0.23 2,000 0.25
Debtors 4,000 0.91 8,000 0.99
Stock 10,000 2.28 25,000 3.08
Temporary investment 1,000 0.23 40,000 4.95
Total Current Assets 24,000 5.48 85,000 10.52
Fixed Assets :-
Land and building 3,30,000 76.26 6,00,000 74.62
Plant and machinery 80,000 18.26 1,23,000 15.22
Total Fixed Assets 4,14,000 94.52 7,23,000 89.48
TOTAL ASSETS 4,38,000 100.00 8,08,000 100.00
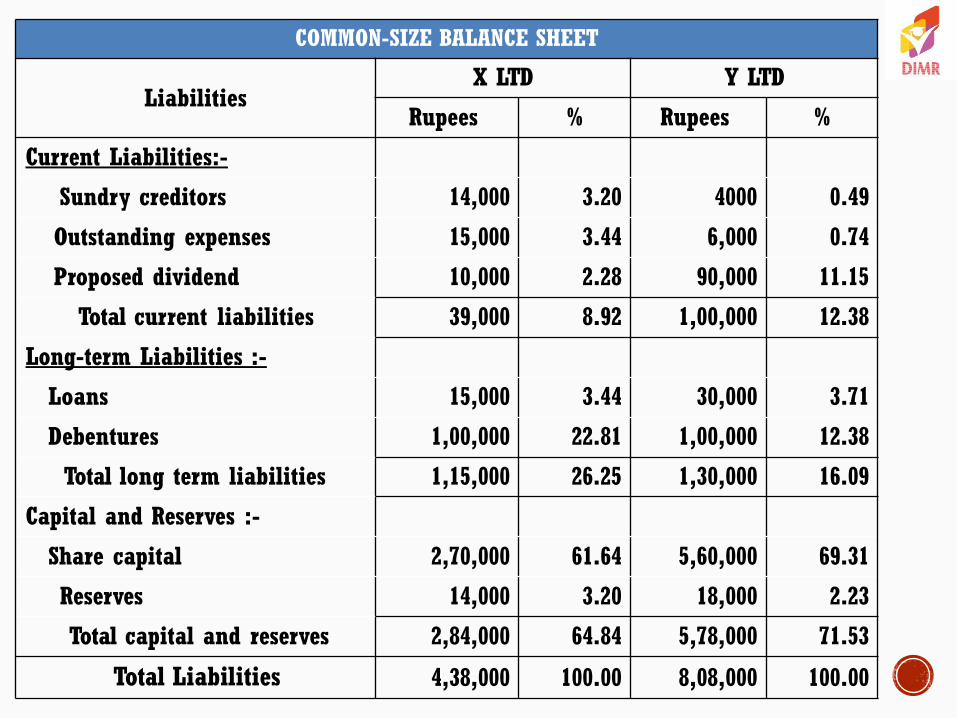
COMMON-SIZE BALANCE SHEET
Liabilities X LTD Y LTD
Rupees % Rupees %
Current Liabilities:-
Sundry creditors 14,000 3.20 4000 0.49
Outstanding expenses 15,000 3.44 6,000 0.74
Proposed dividend 10,000 2.28 90,000 11.15
Total current liabilities 39,000 8.92 1,00,000 12.38
Long-term Liabilities :-
Loans 15,000 3.44 30,000 3.71
Debentures 1,00,000 22.81 1,00,000 12.38
Total long term liabilities 1,15,000 26.25 1,30,000 16.09
Capital and Reserves :-
Share capital 2,70,000 61.64 5,60,000 69.31
Reserves 14,000 3.20 18,000 2.23
Total capital and reserves 2,84,000 64.84 5,78,000 71.53
Total Liabilities 4,38,000 100.00 8,08,000 100.00

TREND ANALYSIS
Another tool used for analysis and interpretation
Trend means ―tendency‖
Trend analysis means ―review and appraisal of
tendency in accounting variables‖
Helps in analyzing long term trend of various business factors – help in budgeting and forecasting
Helps in ascertaining favorable or unfavorable
trend in business
Trend analysis can be performed through :- (a).
Trend ratios and (b). Graphs

Ratio expresses mathematical relationship between two
figures. Expression of one figure in term of another one
Trend ratios / percentages refer to the expression of
arithmetical relationship which each item of several years
bears to the same item of ‗base year‘.
For calculating trend ratios / percentages one year is taken as
the ―base‖ and then ratios or percentages are calculated taking
the figure of the base year as ―base‖.
Where P₁ = Values of Current Year
P₀ = Values of Base Year

RATIO ANALYSIS

MEANING Mathematical relationship between two items
Expressed in quantitative form
Defined as:
―relationships expressed in quantitative terms, between
figures which have cause and effect relationships or
which are connected with each other in some manner
or the other‖

STEPS
Selection of relevant information
Comparison of calculated ratio
Interpretation and reporting
ADVANTAGES
1. Forecasting
2. Managerial control
3. Facilitates communication
4. Measuring efficiency
5. Inter firm comparisons

LIMITATIONS
1. Practical knowledge
2. Inter-relationships
3. Accuracy of financial information
4. Consistency of preparation of
financial statements
5. Time log

CLASSIFICATION
Classification of ratios by statements
Classification by users
Classification based on relative
importance.
Classification of ratios by
purpose/function.

CLASSIFICATION OF RATIO BY STATEMENTS
BLANCE SHEET RATIOS
• LIQUID RATIO
• CURRENT RATIO
• PROPRIETARY RATIO
• DEBT EQUITY RATIO
• FIXED ASSETS RATIO
• CAPITAL GEARING RATIO
PROFIT & LOSS A/C RATIOS
• GROSS PROFIT RATIO
• OPERATING RATIO
• OPERATING PROFIT RATIO
• EXPENSE RATIOS
• NET PROFIT RATIO
B/S AND P&L A/C ratios
• Return on investment
• Return on shareholder‘s fund
• Stock turnover
• Debtors turnover
• Creditors turnover
• Fixed assets turnover
• Earnings per share
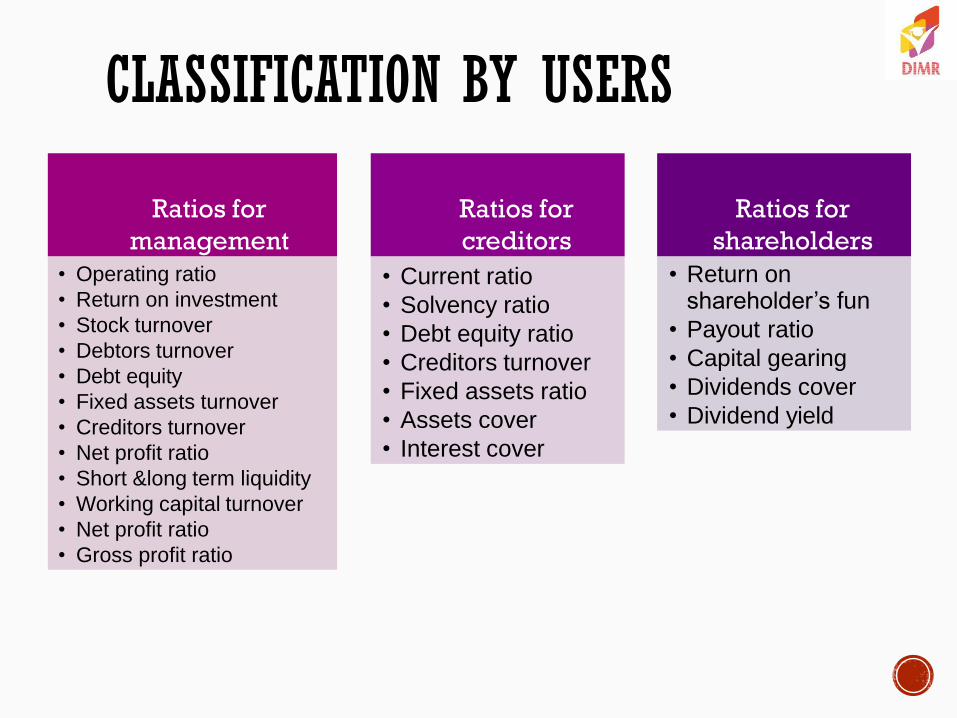
CLASSIFICATION BY USERS
Ratios for
management
• Operating ratio
• Return on investment
• Stock turnover
• Debtors turnover
• Debt equity
• Fixed assets turnover
• Creditors turnover
• Net profit ratio
• Short &long term liquidity
• Working capital turnover
• Net profit ratio
• Gross profit ratio
Ratios for
creditors
• Current ratio
• Solvency ratio
• Debt equity ratio
• Creditors turnover
• Fixed assets ratio
• Assets cover
• Interest cover
Ratios for
shareholders
• Return on shareholder’s fun
• Payout ratio
• Capital gearing
• Dividends cover
• Dividend yield
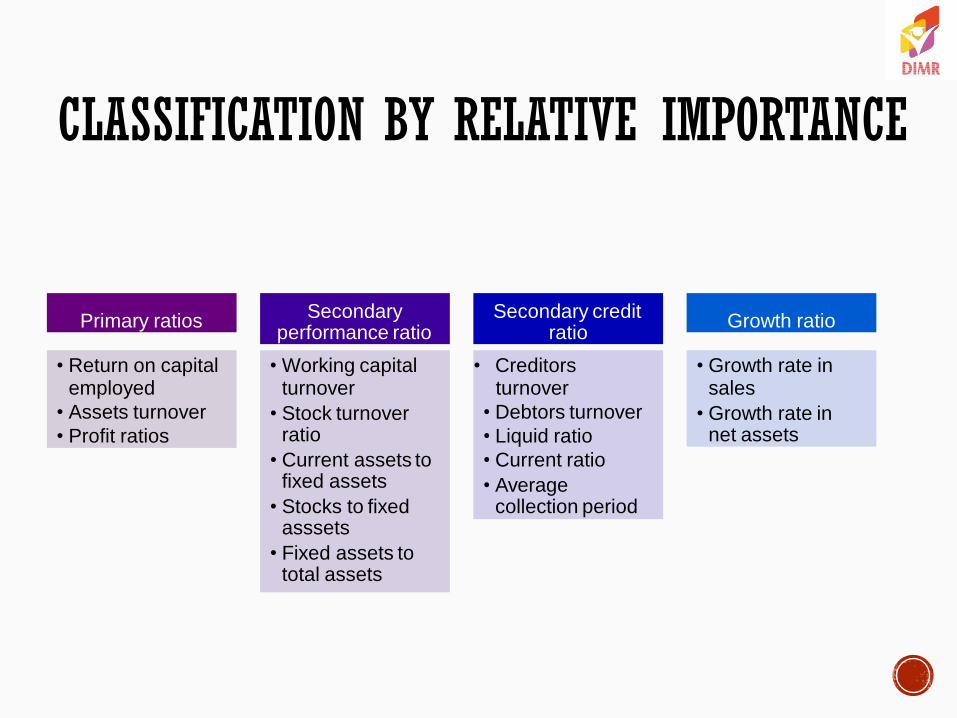
CLASSIFICATION BY RELATIVE IMPORTANCE
Primary ratios
• Return on capital employed
• Assets turnover
• Profit ratios
Secondary performance ratio
• Working capital turnover
• Stock turnover ratio
• Current assets to fixed assets
• Stocks to fixed asssets
• Fixed assets to total assets
Secondary credit ratio
• Creditors turnover
• Debtors turnover
• Liquid ratio
• Current ratio
• Average collection period
Growth ratio
• Growth rate in sales
• Growth rate in net assets

CLASSIFICATION OF RATIOS BY PURPOSE
Profitability ratio
• Return on investment
• Net profit ratio
• Gross profit ratio
• Expense ratio
• Operating profit ratio
Turnover ratio
• Stock turnover
• Debtors turnover
• Creditors turnover
• Working capital turnover
• Fixed assets turnover
Short term solvency ratio
• Current ratio
• Liquidty ratio
• Cash position ratio
Long term solvency ratio
• Proprietory ratio
• Debt equity ratio
• Fixed assets ratio
• Capital gearing ratio
Financial ratio/ solvency ratio

PROFITABILITY RATIO
1. Return on investment (or) overall profitability ratio
operating profit
R.O.I = ------------------------
capital employed
* 100
2.Gross profit ratio
Gross profit ratio= gross profit
*100 net sales

3. OPERATING RATIO
*100 net sales
4.Operating profit ratio
Operating profit ratio= operating profit
* 100
sales
=cost of sales + operating expenses

5. Expenses ratio
1.Administrative expenses ratio:
Admistrative expenses
*100
net sales
2.Selling and distribution expenses ratio:
selling and distribution expenses
* 100
net sales
3.Financial expenses ratio:
financial expenses
* 100
net sales

6. Net profit ratio
net profit ratio = net profit after tax
* 100
net sales
7. Earnings per share (EPS)
E.P.S= net profit after tax and preference dividend
no. of equity shares
8.Price earnings ratio (P.E.R)
P.E.R= market price per equity share
earnings per equity share

9.
Pay out ratio = dividend per equity share
* 100
earnings per equity share
Retained earning ratio=
retained earning per equity share
* 100
earning per equity share

10. Interest cover or fixed charges over
Interest or fixed charges cover
= profit before interest and tax
fixed interest charges
11. Dividend yield ratio
Dividend yield= dividend per share
* 100
market price per share

TURNOVER RATIOS OR ACTIVITY RATIOS
1.Inventory turnover ratio:
stock turnover ratio= cost of goods sold
average inventory
2.Inventory turnover period:
stock turnover period= days/months in a year
inventory turnover ratio
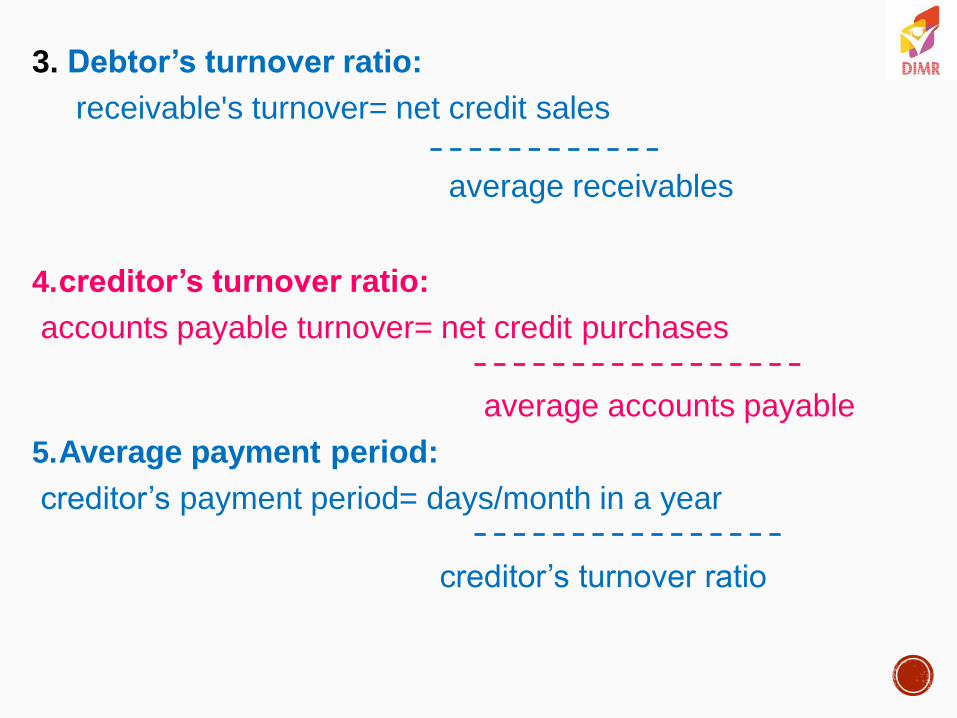
3. Debtor’s turnover ratio:
receivable's turnover= net credit sales
average receivables
4.creditor’s turnover ratio:
accounts payable turnover= net credit purchases
average accounts payable
5.Average payment period:
creditor’s payment period= days/month in a year
creditor’s turnover ratio

6. WORKING CAPITAL
TURNOVER RATIO
= COST OF SALES/SALE
net working capital
7.Fixed turnover ratio
= cost of goods sold (or) sales
net fixed assets
9. Capital turnover ratio:
capital turnover ratio= sales (or) cost of sales
capital employed
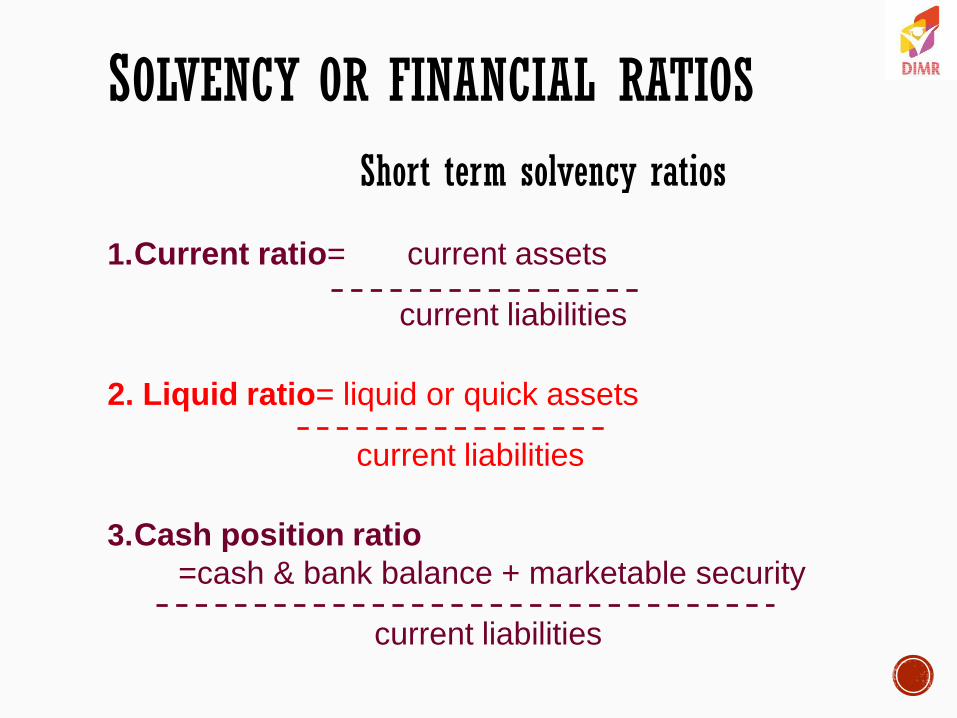
SOLVENCY OR FINANCIAL RATIOS
Short term solvency ratios
1.Current ratio= current assets
current liabilities
2. Liquid ratio= liquid or quick assets
current liabilities
3.Cash position ratio
=cash & bank balance + marketable security
current liabilities

Long term solvency ratio
1. Fixed assets ratio= fixed assets
long term funds
2. Debt equity ratio= total long term debt
(or) shareholder’s fund
= external equities
internal equities
3 Proprietary ratio. = shareholder’s fund
total tangible assets

4. Capital gearing ratio:
= long term loss + debentured + pref. capital
equity shareholder’s fund
Overall solvency ratio
Solvency ratio= total debt
total tangible assets


• Concentrates on transactions that have a direct
impact on cash.
• Deals with inflow and outflow of cash between two
Balance Sheet dates.
• An essential tool of short-term financial analysis.

1. Facilitates to prepare sound financial policies.
2. Helps to evaluate the current cash position.
3. Projected cash flow statements helps to know the future cash
position of a concern so as to enable a firm to plan and
coordinate its financial operations properly.
4. It helps in taking loan from banks and other financial
institutions. The repayment capacity of the firm can be
understood by going through the cash flow statements.
5. Helps the management in taking short-term financial
decisions.
6. Statement explains the causes for poor cash position in spite of
substantial profits in a firm by throwing light on various
applications of cash made by the firm.

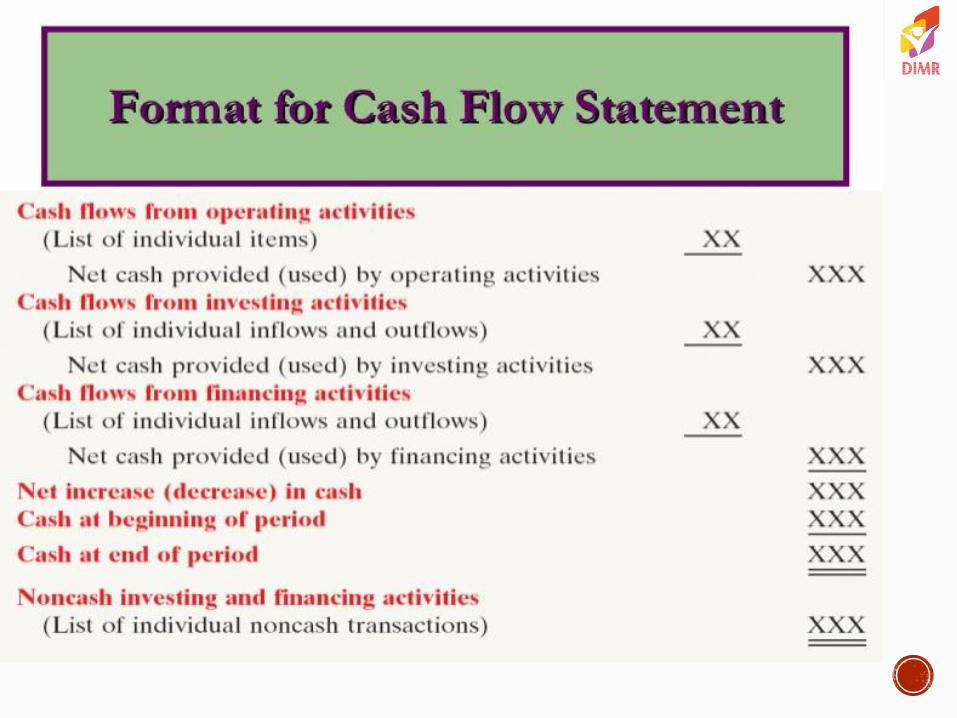
1. Cash flows from operating activities –
transactions that affect net income.
2. Cash flows from investing activities –
transactions that affect noncurrent
assets.
3. Cash flows from financing activities –
transactions that affect equity and debt
of the entity.
Reporting Cash Flows

(payments for
expenses)
Operating
Increases in Cash Decreases in Cash
(receipts from sales of
noncurrent assets)
Investing
(receipts from issuing
equity and debt securities)
Financing
(payments for acquiring
noncurrent assets)
Investing
Reporting Cash Flows
(receipts from
revenues)
Operating
(payments for treasury stock,
dividends, and redemption of debt
securities)
Financing

Typical cash inflows Typical cash outflows
What are some of the
typical cash inflows from
operating activities?`
Cash Flows from Operating Activities
Interest
revenue
Sales of goods
and services
Dividend
revenue
What are some of the
typical cash outflows from
operating activities?
Merchandise
purchases
Payments of
wages and
other expenses
Tax payments

What are some of the
typical cash inflows from
investing activities?
Typical cash inflows Typical cash outflows
Sale of long-
term
investments
Sales of fixed
assets Purchase of
fixed assets
Purchase of
long-term
investments
What are some of the
typical cash outflows
from investing
activities?
Cash Flows from Investing Activities

Cash Flows from Financing Activities
What are some of the
typical cash inflows from
financing activities?
Issuing
preferred and
common stock
Issuing bonds
and long-term
notes payable
Paying cash
dividends
Repaying debt
What are some of the
typical cash outflows from
financing activities?
Acquiring
treasury stock
Typical cash inflows Typical cash outflows
Noncash Investing and Financing Activities
Issuing bonds to acquire land
Issuing common stock for
convertible preferred stock
Issuing a long-term note to
acquire equipment
Issuing a stock dividend

1. Only reveals the inflow and outflow of cash. The cash
balance disclosed by this statement may not depict the true
liquid position.
2. It cannot be equated with the income statement. Income
statement takes into account both cash and non-cash items.
Hence cash fund does not mean net income of the business.
3. Working capital being a wider concept of funds, a fund flow
statement presents a more complete picture than cash flow.
Hence, cash flow statement gives only a narrow picture.

• Prepared to explain the changes which have taken
place in the working capital during the period under
consideration.
• It is a report on movement of funds explaining
wherefrom working capital originates and where into
the same goes during an accounting period.
• Essential tool for long-term financial analysis.
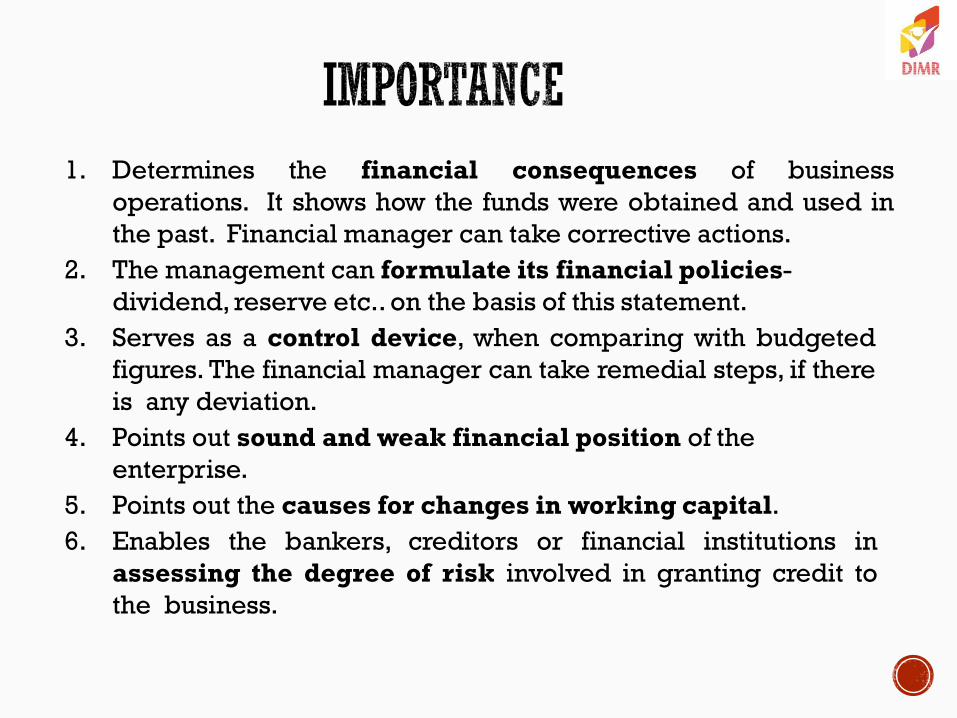
1. Determines the financial consequences of business
operations. It shows how the funds were obtained and used in
the past. Financial manager can take corrective actions.
2. The management can formulate its financial policies-
dividend, reserve etc.. on the basis of this statement.
3. Serves as a control device, when comparing with budgeted
figures. The financial manager can take remedial steps, if there
is any deviation.
4. Points out sound and weak financial position of the
enterprise.
5. Points out the causes for changes in working capital.
6. Enables the bankers, creditors or financial institutions in
assessing the degree of risk involved in granting credit to
the business.
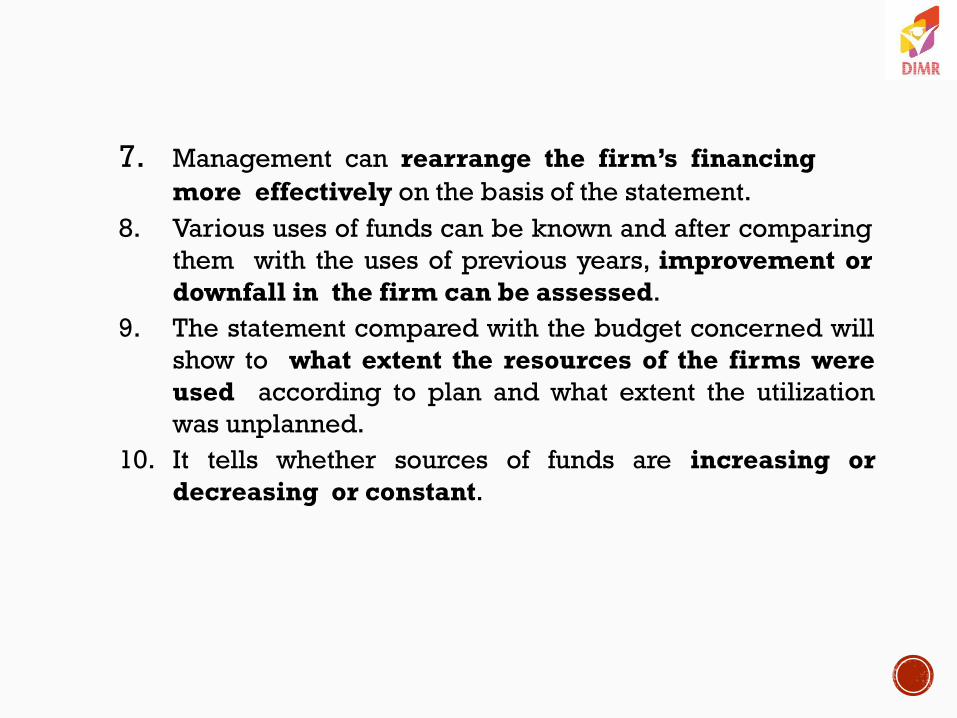
7. Management can rearrange the firm’s financing
more effectively on the basis of the statement.
8. Various uses of funds can be known and after comparing
them with the uses of previous years, improvement or
downfall in the firm can be assessed.
9. The statement compared with the budget concerned will
show to what extent the resources of the firms were
used according to plan and what extent the utilization
was unplanned.
10. It tells whether sources of funds are increasing or
decreasing or constant.


• Lacks originality because it is only rearrangement of
data appearing in accounts books.
• Indicates only the past position and not future.
• Indicates fund flow only in a summary form and does not
show various changes which take place continuously.
• When both the aspects of a transaction are current, they are not
considered.
• When both the aspects of a transaction are non-current, even
then they are not included in this statement.
• Not an ideal tool for financial analysis.
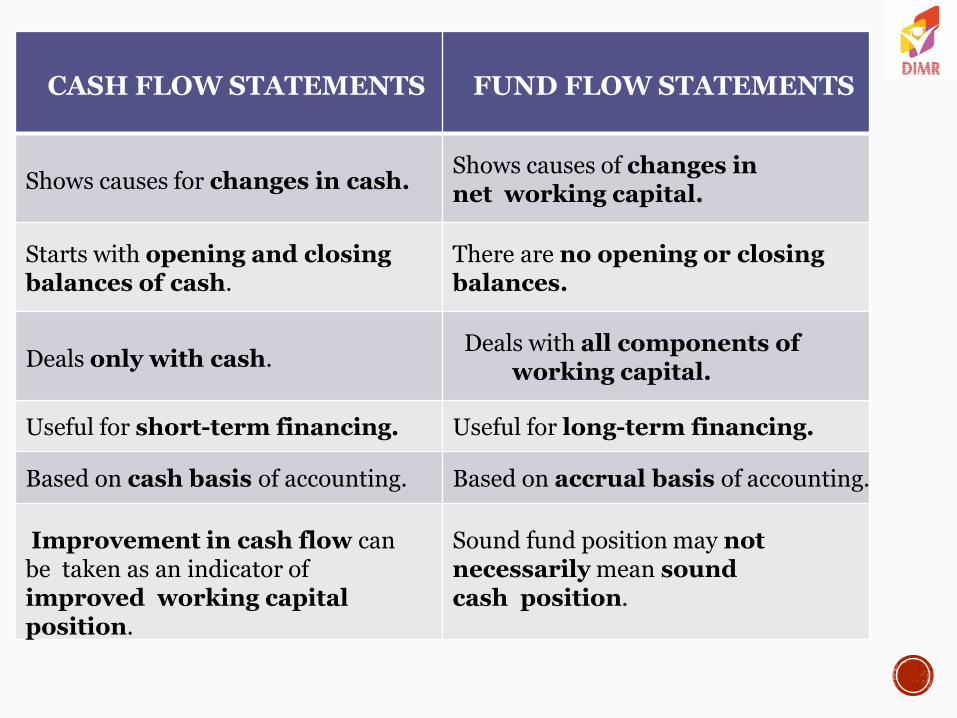
CASH FLOW STATEMENTS
FUND FLOW STATEMENTS
Shows causes for changes in cash.
Shows causes of changes in net working capital.
Starts with opening and closing balances of cash.
There are no opening or closing balances.
Deals only with cash.
Deals with all components of working capital.
Useful for short-term financing. Useful for long-term financing.
Based on cash basis of accounting. Based on accrual basis of accounting.
Improvement in cash flow can be taken as an indicator of improved working capital position.
Sound fund position may not necessarily mean sound cash position.

By:
Prof. Kavita Pareek
( Dnyansagar Institute of Management and Research,
Balewadi, Pune.)

• Capital required by business can be categorized as-
(i) Fixed Capital (ii) Working Capital
• Fixed capital is required for the purchase of fixed or long
term assets (machinery, land & building)
• Working capital is required to meet short term or current
obligation (raw material, wages)& includes all current
assets(cash, marketable securities, debtors)
• Also called as revolving capital or circulating capital
or short term capital
• It involves the relationship between a firm's short-
term assets & its short-term liabilities.
• Goal is to ensure that a firm is able to continue its
operations & that it has sufficient ability to satisfy both
maturing short-term debt & upcoming operational
expenses.
• The management of working capital involves
managing inventories, accounts receivable & payable
& cash.

Balance sheet concept
• Two interpretations : Gross working capital
Net working capital
• Net Working Capital
Current Assets - Current Liabilities.
• Can be negative and positive
• Gross Working Capital
Capital invested in the total current assets of the
enterprise.

• In the words of Genstenberg ,
―Revolving or circulating capital means current assets of a
company that are changed in the ordinary course of
business from one form to another, as for example, from
cash to inventories, inventories to receivables &
receivables into cash‖.
• Cycle starts with the purchase of raw material & other
resources & ends with the realization of cash from the
sales of finished goods.
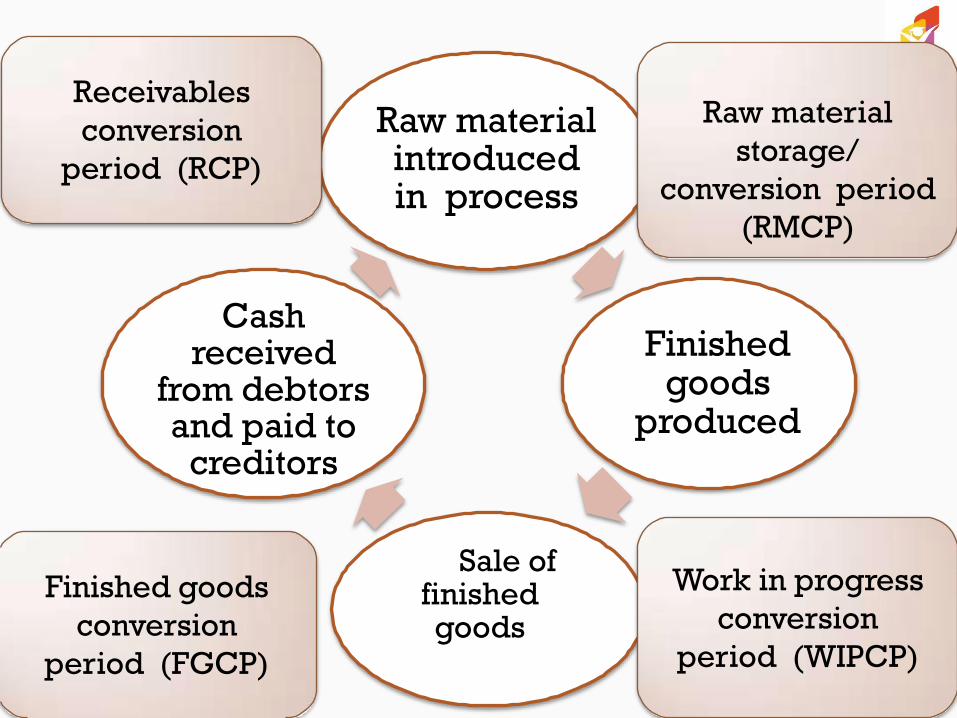
Raw material introduced in process
Finished goods
produced
Sale of finished goods
Cash received
from debtors and paid to
creditors
Work in progress
conversion
period (WIPCP)
Raw material
storage/
conversion period
(RMCP)
Receivables
conversion
period (RCP)
Finished goods
conversion
period (FGCP)
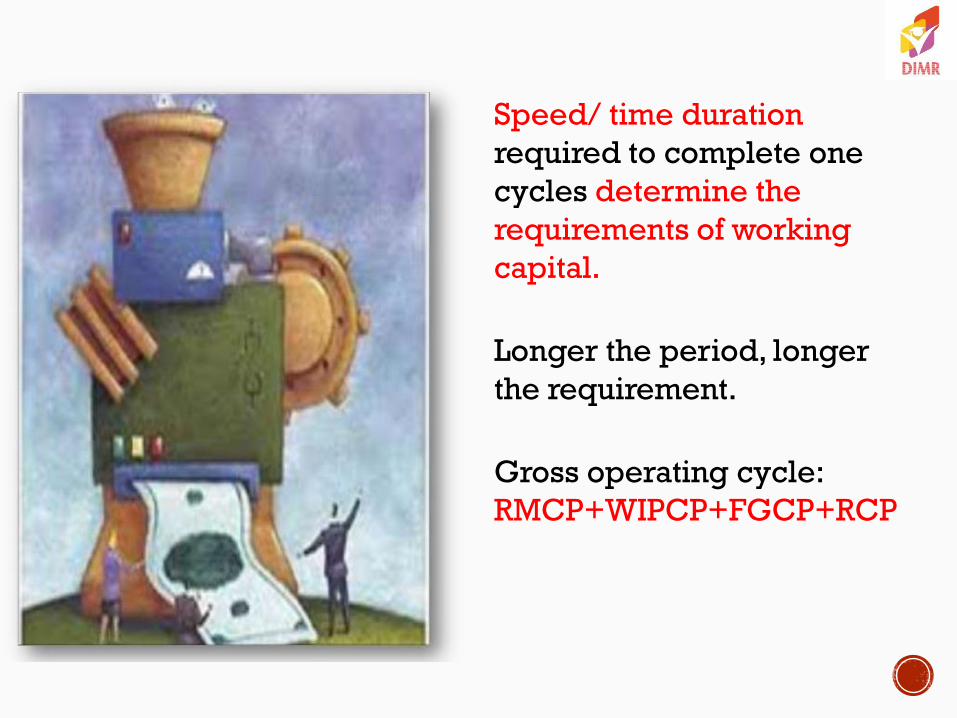
Speed/ time duration
required to complete one
cycles determine the
requirements of working
capital.
Longer the period, longer
the requirement.
Gross operating cycle:
RMCP+WIPCP+FGCP+RCP
PRINCIPLE OF RISK VARIATIONS:
Principle of risk
variation says that
there exists a definite
inverse relation
between the degree
of risk and the rate of
return.
PRINCIPLE OF WC MANAGEMENT
Principle of cost of
capital says that the
cost of capital moves
inversely with the
degree of risk. There
should be a proper
balance between
these.

PRINCIPLE OF EQUITY POSITION
Principle of
equity position
says that the
amount of
working capital
invested should
be justified by
the firm‘s equity
position.
Principle of
maturity of
payment says that a
firm should make
every effort to
relate maturity of
payment to its flow
of internally
generated funds.

Strengthen The Solvency:
- to operate the business smoothly without any financial
problem for making the payment of short-term liabilities.
-maintaining solvency of the business by providing
uninterrupted flow of production
• Enhance Goodwill:
-to make prompt payments
• Easy Obtaining Loan: A firm having
-adequate working capital
-high solvency
-good credit rating

• Regular Supply Of Raw Material
-quick payment
• Smooth Business Operation
-it maintains the firm in well condition
-any day to day financial requirement can be met without
any shortage of fund
• Ability To Face Crisis
Adequate working capital enables a firm to face business
crisis in emergencies such as depression

The need for Working Capital arises due to the time gap
between production & realization of cash from sales
-purchase of raw materials & production
-sales & realization of cash
-Purchase of components & spares
-Wages & salaries
- day to day expenses & overhead costs
-meet the selling costs
-provide credit facilities
-maintain the inventories of R-M, W-I-P, Stores, Spares &
Finished stock
NEED FOR WORKING CAPITAL

Nature of Business
Scale of Operations
Business Cycles
Seasonal Factors
Level of Competition
Inflation
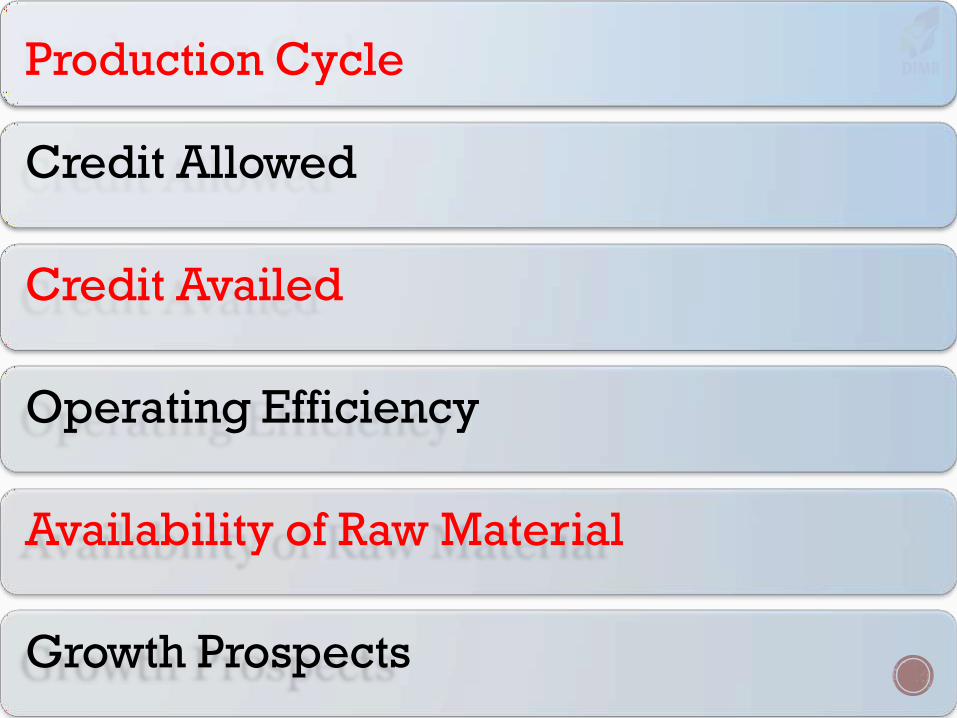
Production Cycle
Credit Allowed
Credit Availed
Operating Efficiency
Availability of Raw Material
Growth Prospects

Financing of Long term Working Capital:
Shares
Debentures
Public Deposits
Ploughing Back of Profits
Loans from Financial Institutions

FINANCING OF SHORT-TERM WORKING CAPITAL
Indigenous Bankers
Trade Credit
Installment Credit
Advances
Commercial Paper
WC finance By Commercial Banks
• Loans
• Cash Credit
• Overdrafts

WORKING CAPITAL
BASIS OF CONCEPT BASIS OF TIME
Gross Working
Capital
Net Working
Capital
Permanent
WC
Temporary /
Variable WC
Special WC Seasonal WC

2. Indicates the firm‘s ability to meet
its operating expenses and current
liability.
3. Expressed as current asset
minus current liability.
5. Useful to find out true the
financial position of a company.
Net Working Capital Gross Working Capital
1. Qualitative in nature. 1. Quantitative in nature.
2. Indicates total amount available
for financing the current assets.
3. It indicating the total sum of
current assets.
4. Suitable for sole
trader &
partnership firms.
5. It cannot reveal the true
financial position of a company.
4. Suitable for companies.
• It is the minimum level of current assets which is continuously required by a firm for carrying out its business activities & that cannot be converted into cash in normal course of business.
• Permanent working capital is either constant or it increase with
the size of the business or its scale of operations.
Characteristics:
Needed for longer period of time.
Constantly changes in the business from one asset to another.
Grows the size or volume of business operation.

• Any amount over & above the permanent level of working
capital is temporary working capital.
• Keeps on fluctuating from time to time as per the changes
in production & sales activities.
Characteristics:
It is an extra working capital needed to changing
production & sales activities.
It is created to meet liquidity requirements.
It fluctuates according to the level of operations.
It is needed for shorter period.

• The capital required to meet the seasonal demands of
the enterprise
• For example, a manufacture of woolen textiles,
refrigerators or coolers may need extra funds to carry
on production and to accumulate stock before the
sales operations.
• Being of short-term nature, has to be financed from
short- term sources like bank loan etc.

• Specific working capital is that part of working capital
which is required to meet unforeseen contingencies like
slump, strike, flood, war, launching of extensive
marketing campaign, purchase of goods for stock in
view of future increase in price etc.
SPECIFIC WORKING CAPITAL

• The Working capital is directly
related to the percentage value of
sales.
• Example, If sales of firm is
Rs.10,00,000 ; the WC is 20% of sales,
then WC = Rs. 2,00,000.
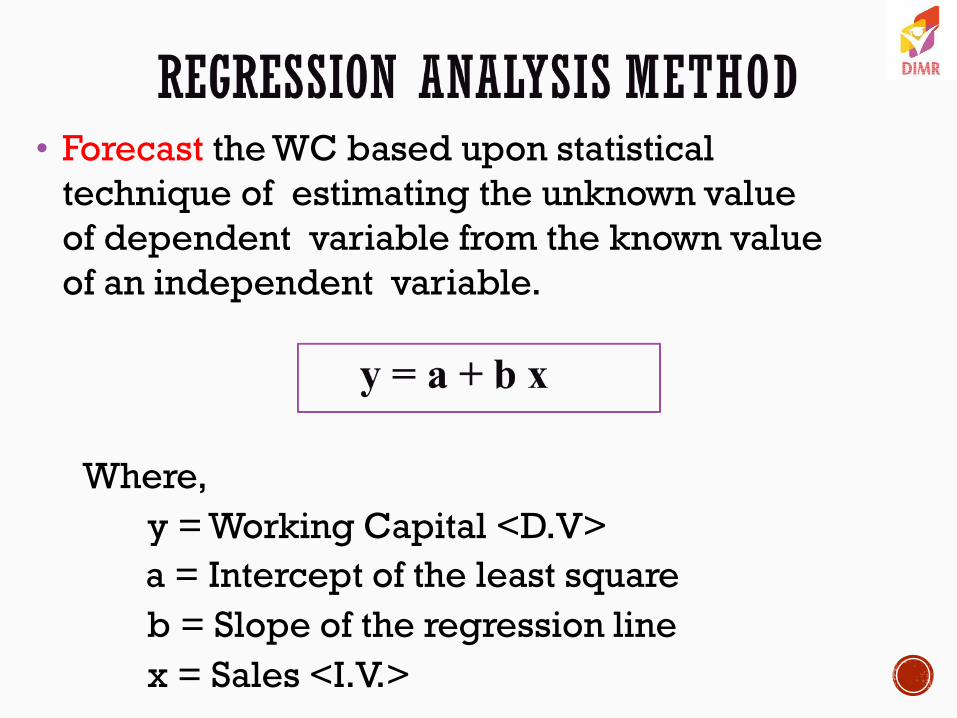
• Forecast the WC based upon statistical
technique of estimating the unknown value
of dependent variable from the known value
of an independent variable.
Where,
y = Working Capital <D.V>
a = Intercept of the least square
b = Slope of the regression line
x = Sales <I.V.>
• It involves forecasting of cash receipts and
disbursements during a future period of
time.
• It includes all the possible sources of cash
& the channels in which payments are to be
made.
• This method of estimating WC
requirements based on operating cycle .
• OC starts with the purchase of RM and
other resources and end with the
realization of cash.
• Working Capital Required
= Cost of goods sold X Operating cycle
365 or 360 days
+ Desired cash balance
PROJECTED BALANCE SHEET METHOD
• Under this method, assets and
liabilities are forecasted.
• The excess of estimated total current assets
over estimated current liabilities, as shown
in projected balance sheet, is computed to
indicate the estimated amount of WC
required.

CAPITAL STRUCTURE
By:
Prof. Kavita Pareek ( Dnyansagar Institute of Management and Research,
Balewadi, Pune.)


You may hear corporate officers, professional investors, and investment analysts discuss a company's capital structure. The concept is extremely important because it can influence the return a company earns for its shareholders and whether or not a firm survives in a recession or depression.
The term ‗structure‘ means the arrangement of the various parts. So capital structure means the arrangement of capital from different sources so that the long-term funds needed for the business are raised.
Thus, capital structure refers to the proportions or combinations of equity share capital, preference share capital, debentures, long-term loans, retained earnings and other long-term sources of funds in the total amount of capital which a firm should raise to run its business.

―Capital structure of a company refers to the make-up of its capitalisation and it includes all long-term capital resources viz., loans, reserves, shares and bonds.‖—Gerstenberg.
―Capital structure is the combination of debt and equity securities that comprise a firm‘s financing of its assets.‖—John J. Hampton.
―Capital structure refers to the mix of long-term sources of funds, such as, debentures, long-term debts, preference share capital and equity share capital including reserves and surplus.‖—I. M. Pandey.

Capital Structure = Long term Debt + Prefered Stock + Net Worth
OR
Capital Structure = Total Assets – Current Liabilities


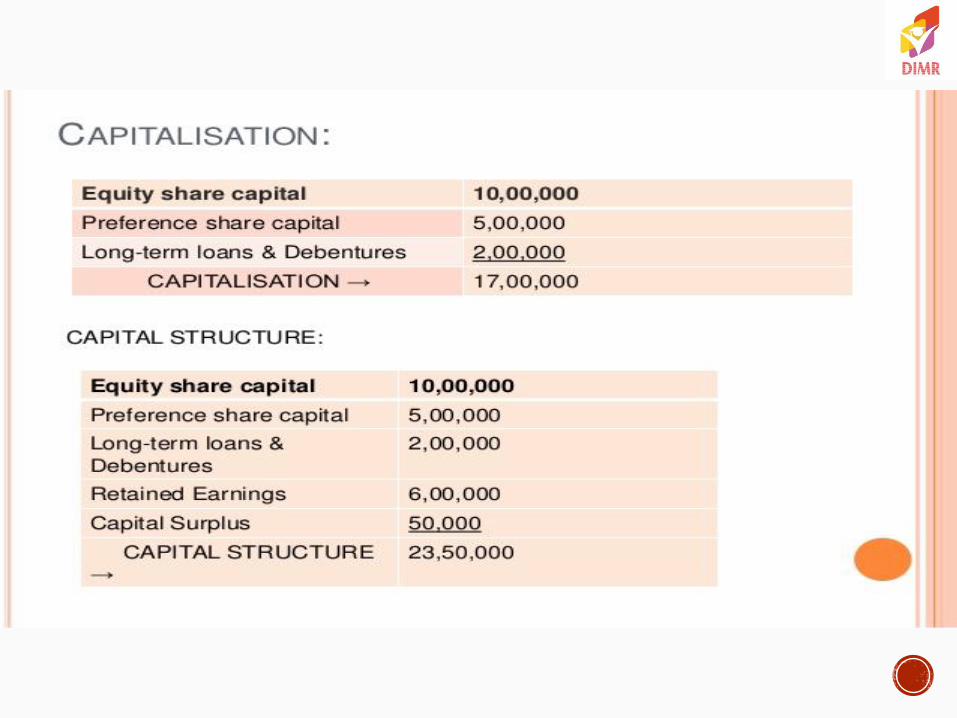
Capitalisation is a quantatitative aspect of the financial planning of an enterprise, where as Capital Structure is a qualitative aspect.
Capitalisation refers to the total amount of securities issued by a company, while Capital structure refers to the kinds of securities and proportionate amounts that make up capitalization.
Financial Structure refers to all the financial resources marshalled by the firm, short as well as long-term , and all forms of debt as well as equity.
―Thus, generally it is composed of a specified percentage of short-term debt, long-term debt & shareholders Funds.‖

Enables one to ―Optimise‖ the value of a firm by finding the ―best mix‖ for the amounts of debts and equity on the balance sheet.
Provides a signal that the firm is following proper rules of corporate finance to ―improve‖ its balance sheet. This signal is central to valuations provided by market investers and analysts.
Profitability- It should ensure most profits are earned. It should offer the least cost of financing with maximum returns.
Solvency- The structure should not lead the company to a point it risks being insolvent. Too much debt threatens a company‘s solvency so any debt taken should be manageable.
Flexibility- The capital structure should be one that can be easily changed to meet new market demands.
Control– The structure should not give away control of the company. So, caution should be taken not to give too much away that owners lose their controlling stake.

Capital structure with equity shares only
Capital structure with equity and preference shares
Capital structure with equity shares and debentures
Capital structure with equity, preference shares and debentures

Increases the value of the firm
Proper utilisation of available Funds
Maximisation of Returns
Minimisation of Cost of Capital
Solvency or liquidity position
Flexibility
Undisturbed Controlling
Minimisation of Financial Risk
Nature of Business
Size of a Company
Period of Finance
Control
Environment of Capital Market
Nature & type of the investors
Regulatory framework
Floatation Costs
Legal Provisions
Trading on Equity

Risk
Growth Rate
Tax Considerations
Cost of Capital
Profitability
Financing Purpose
Capital Structure of other Companies
Nature of business - It has great influence in the capital structure of the business, companies having stable and certain earnings prefer debentures or preference shares and companies having no assured income depends on internal resources.
Size of a company - Small size business firm‘s capital structure generally consists of loans from banks and retained profits. While on the other hand, big companies having goodwill, stability and an established profit can easily go for issuance of shares and debentures as well as loans and borrowings from financial institutions.
Period of finance - The period for which finance is needed also influences the capital structure. When funds are needed for long-term (say 10 years), it should be raised by issuing debentures or preference shares. Funds should be raised by the issue of equity shares when it is needed permanently.
Control - The consideration of retaining control of the business is an important factor in capital structure decisions. If the existing equity shareholders do not like to dilute the control, they may prefer debt capital to equity capital, as former has no voting rights.
Environment of Capital Market - Capital markets are of development, boom, and depression. In times of boom, it would be easier for the firm to raise equity, but in times of recession, the equity investors will not show much of interest in investing. Then the firm is to rely in raising debt.

Nature & Type of the investors - Some investors have an abundance of money, Whereas some others do not have much money. Hence, the form of demand by various investors differs quite substantially. Generally, bold investors make investments in equity shares, whereas cautions investors having less capital like to invest in preference shares and debentures. Some investors have shaky nature also. For them, the issue of redeemable preference shares and convertible debentures are most suited.
Regulatory framework - Capital structure also influenced by government rules. For example, banking companies can raise money by issuing share capital alone, no other security. Similarly, it is compulsory to maintain the debt-equity ratio given to other companies while raising funds. Various ideal debt-equity ratios like 2: 1; 4: 1; 6: 1 has been set for different industries. The public issue of shares and debentures is to made under SEBI guidelines.
Floatation Costs - The cost of Floatations called expenses which are spending while issuing securities. These include the commission of underwriters, brokerage, stationery expenses, etc. Generally, issuing debt capital‘s cost is less than share capital. It attracts the company towards debt capital.
Legal Provisions - Legal provisions in raising capital will also play a significant role in planning capital structure. Raising of equity capital is more complicated than raising debt.

Trading on equity - A company raises debt at low cost with a view to enhance the earnings of the equity shareholders. The cost of debt is lower due to tax advantage. A fixed rate of return is payable on debt funds. Any excess earnings over cost of debt will be added up to the equity shareholders.
Capital structure decisions should always aim at having debt component in total component in order to increase the earnings available for equity shareholders.
Risk - In capital structure decisions, two elements of risk viz.,
(i) Business risk and
(ii) Financial risk are considered.
A firm with high business risk prefer to have low levels of debt, since the volatility of its earnings is more. A firm with low level of business risk can have higher debt component in capital structure, since the risk of variations in expected earnings is lower.
Growth Rate - The growing companies will require more and more funds for its expansion schemes, which will be met through raising debt. The fast growing companies will have to rely on debt than on equity or internal earnings.

Tax Consideration - Capital structure is also affected by the existing taxation system of the country. An increase in the rates of Corporate tax issue of debenture in place of shares is regarded as more appropriate. It‘s the reason being that in respect of interests paid on debentures, deductions thereof permissible for from the profits and hence tax burden on the company gets reduced.
Cost of Capital - Cost of different components of capital will influence the capital structuring decisions. A firm should posses earning power to generate revenues to meet its cost of capital and finance its future growth. Generally the cost of equity is higher than the cost of debt, since the debt holders are assured of fixed rate of return and repayment of principal amount after the maturity period. Firms that adjust their capital structure in order to keep the riskiness of their debt and equity reasonable, should have a lower cost of capital.
Profitability - A company with higher profitability will have low reliance on outside debt and it will meet its additional requirement through internal generation.

Financing Purpose - The capital structure decisions are taken in view of the purpose of financing. The long-term projects are financed through long-term sources and in the form of equity. The short-term projects are financed by issue of debt instruments and by raising of term loans from banks and financial institutions.
The projects for productive purpose can be financed from both equity and debt. But the non-productive projects are financed by using the internal generated earnings.
Capital Structure of Other Companies - Capital structure is influenced by the industry to which a company is related. All companies related to a given industry produce almost similar products, their costs of production are similar, they depend on identical technology, they have similar profitability, and hence the pattern of their capital structure is almost similar.
Because of this fact, there are different debt- equity ratios prevalent in different industries. Hence, at the time of raising funds a company must take into consideration debt-equity ratio prevalent in the related industry.


•Finance is the basic requirement of any business.
•It is considered as the lifeblood of businesses.
•It is the amount of money, funds or capital required for
the smooth functioning of any business.
•It is required at every stage, from promotion to
liquidation.
•Adequate finance is required for orderly
functioning of a business.
•Promoters need to calculate financial needs through a
financial plan.

• Proper financial management is very important.
• Thus, finance affects the profitability, growth and
survival of a business.
• No finance, no business.

• Business finance is a process of raising, providing
and managing of all the money that is to be used in
connection with business activities.
• Business Finance is the finance required for conducting
business activities.
• Modern businesses require huge amount of fixed and
working capital for conducting business.

Money required for carrying out business activities
is called business Finance.
“Business Finance can be broadly defined as the activity concerned with planning, raising, controlling and administering of funds used in the business. ‖
Guthmann and Douglas

Full Utilization
of Funds
Maximization of Return on Investment
Survival and Prosperity of business unit
Fair balance
between Liquidity
& Profitability
Good Public
Image
FINANCIAL NEED OF A BUSINESS
OR
NEED OF BUSINESS FINANCE
1. Fixed Capital Requirement
(Fund to purchase Fixed Assets)
2.Working Capital Requirement
(Amount required for day to day operations
that means ―working capital‖)

1. Periodic Basis
(Long term – Medium Term - Short
Term)
+5 yr 1-5 yr -1 yr
2. Ownership Basis (Owner’s Fund – Borrowed Fund)
3. Sources of Generation Basis (Internal Source – External
Source)


SOURCES OF CAPITAL

1. Retained Earnings
2. Trade Credit
3. Factoring
4. Lease Financing
5. Issue of Shares (Equity and Preference
Shares)
6. Public Deposit
7. Commercial Paper
8. Debenture
9. Commercial Banks
10.Financial Institutions
SOURCES OF CAPITAL

Profits generated by a company that are not
distributed to stockholders (shareholders) as
dividends but are either reinvested in the
business or kept as a reserve for specific
objectives (such as to pay off a debt or
purchase a capital asset).
• Retained earnings is a permanent source of
funds available to an organization.
• It does not involve any explicit cost in the
form of interest, dividend or floatation cost.
• As the funds are generated internally, there is
a greater degree of operational freedom and
flexibility.

• Excessive plaguing back may cause
dissatisfaction amongst the shareholders as they
would get lower dividends.
• It is an uncertain source of funds as the
profits of business are fluctuating;
• The opportunity cost associated with these funds
is not recognized by many firms.

• Trade credit is the credit extended to you by
suppliers who let you buy now and pay later. Any
time you take delivery of materials, equipment or
other valuables without paying cash on the spot,
you're using trade credit.

Trade credit is a convenient and continuous source of funds;
Trade credit may be readily available in case the credit worthiness of the customers is known to the seller;
Trade credit needs to promote the sales of an organization;
If an organization wants to increase its inventory level in order to meet expected rise in the sales volume in the near feature.
Availability of easy and flexible trade credit
facilities may induce a firm to indulge in
overtrading which may add to the risk of the firm.
Only limited amount of funds can be generated
through trade credit.
It is generally a costly source of funds as
compared to most other sources of raising money.

• Factoring is a type of finance in which a business
would sell its accounts receivable (invoices) to a
third party to meet its short-term liquidity needs.
Under the transaction between both parties, the
factor would pay the amount due on the invoices
minus its commission or fees.

• Obtaining funds through factoring is cheaper
than financing through other means such as bank
credit.
• With cash flow accelerated by factoring the clients
is able to meet his/ her liabilities promptly as and
when these arise.
• Factoring as a source of funds is flexible and
ensures a definite pattern of cash inflows from
credit debt that a firm might otherwise be unable
to obtain.

• This source is expensive when the invoices are
numerous and smaller in amount.
• The advance finance provided by the factor firm is
generally available at a higher interest cost than
the usual rate of interest.
• The factor is a third party to the customer who
may not feel comfortable while dealing with it.

• Lease financing is one of the important sources of
medium- and long-term financing.
• The owner of an asset gives another person, the
right to use that asset against periodical
payments. The owner of the asset is known as
lessor and the user is called lessee.

• It enables the lessee to acquire the
asset with a lower investment.
• Simple documentation makes it easier to finance
assets.
• Lease rentals paid by the lessee are deductible
for computing taxable profits.
• It provides finance without diluting
the ownership or control of business.

• A lease arrangement may impose certain
restrictions on the use of assets.
• The normal business operations may be affected
in case the lease is not renewed.
• It may result in higher payout obligation in case
the equipment is not found useful and the lessee
opts for premature termination of the lease
agreement .

• Public deposits refer to the unsecured deposits invited by companies from the public mainly to finance working capital needs. A company wishing to invite public deposits makes an advertisement in the newspapers.
• Any member of the public can fill up the prescribed form and deposit the money with the company. The company in return issues a deposit receipt. This receipt is an acknowledgement of debt by the company. The terms and conditions of the deposit are printed on the back of the receipt. The rate of interest on public deposits depends on the period of deposit and reputation of the company.

• The procedure of obtaining deposits is simple and
does not contain restrictive conditions as are
generally there in a loan agreements.
• Public deposits do not usually create any charge
on the assets of the company. The assets can be
used as security for raising loans from other
sources.

• New companies generally find it difficult to raise
funds through public deposits.
• It is an unreliable source of the finance as the
public may not respond when the company needs
money.
• Collection of public deposits may prove
difficult, particularly when the size of deposits
required is large.

• Commercial Paper or CP is defined as a short-term,
unsecured money market instrument, issued as a
promissory note by big corporations having
excellent credit ratings. As the instrument is not
backed by collateral, only large firms with
considerable financial strength are authorised to
issue the instrument.
• A commercial paper is sold on an unsecured basis and does not contain any restrictive conditions.
• As it is a freely transferable instrument it has high liquidity.
• It provides more funds compared to other source.
• A commercial paper provides a continuous source of funds.
• Companies can park their excess funds in commercial paper thereby earning some good retunes on the same.

• Only financially sound and highly rated firms can
raise money through commercial papers.
• The size of money that can be raised through
commercial paper is limited to the excess
liquidity available with the suppliers of funds at a
particular time.
• Commercial paper is an impersonal method of
financing.

1. Issue of EQUITY SHARES
2. Issue of PREFERENCE
SHARES

• Equity shares are the main source of finance of a firm. It is
issued to the general public. Equity shareholders do not
enjoy any preferential rights with regard to repayment of
capital and dividend. They are entitled to residual
income of the company, but they enjoy the right to control
the affairs of the business and all the shareholders
collectively are the owners of the company.

• Equity shares are suitable for investors who are
willing to assume risk for higher returns.
• Payment of dividend to the equity shareholders is
not compulsory.
• Equity capital serves as permanent capital as it is to
be repaid only at the time of liquidation of a
company.
• Equity capital provides credit worthiness to
the company and confidence to prospective loan
providers.

• Investors who wants steady income may not prefer
equity shares as equity shares get fluctuating returns.
• The cost of equity shares is generally more as compared to
the cost of ravishing funds through other sources.
• Issue of additional equity shares dilutes the voting power
and earnings of existing equity shareholders.
• More formalities and procedural delays are involved
while raising funds through issue of equity share.
• Preference shares allow an investor to own a stake
at the issuing company with a condition that
whenever the company decides to pay dividends,
the holders of the preference shares will be the
first to be paid.
• This shares, often with no voting rights, which
receive their dividend before all other shares and
are repaid first at face value if the company goes
into liquidation.

• Preference shares provide reasonably steady
income in the form of fixed rate of return and
safety of investment.
• Preference shares are useful for those investors
who want fixed rate of return with comparatively
low risk.
• It does not affect the control of equity
shareholders over the management as preference
shareholders don‘t have voting rights.

• Preference shares are not suitable for those
investors who are willing to take risk and are
interested in higher returns .
• Preference capital dilutes the claims of equity
shareholders over assets of the company.
• The rate of dividend on preference shares is
generally higher than the rate of interest on
debentures.


• A debenture is a type of debt instrument that is not
secured by physical asset or collateral. Debentures are
backed only by the general credit worthiness and
reputation of the issuer. Both corporations and
governments frequently issue this type of bond to
secure capital. Like other types of bonds, debentures
are documented in an indenture.

If a company needs funds for extension and
development purpose without increasing its
share capital, it can borrow from the general
public by issuing certificates for a fixed period of
time and at a fixed rate of interest. Such a loan
certificate is called a debenture. Debentures are
offered to the public for subscription in the same
way as for issue of equity shares. Debenture is
issued under the common seal of the company
acknowledging the receipt of money.


• It is preferred by investors who want fixed income
at lesser risk.
• Debentures are fixed charge funds and do not
particulars in profits of the company.
• The issue of debentures is suitable in the situation
when the sales and earnings are relatively stable.

• As fixed charge instruments debentures put a
permanent burden on the earnings of a company.
• In case of redeemable debentures, the company
has to make provisions for repayment on the
specified date, even during periods of financial
difficulty.
• Each company has certain borrowing capacity.

• A commercial bank is a financial institution that
provides various financial service, such as
accepting deposits and issuing loans. Commercial
bank customers can take advantage of a range
of investment products that commercial banks
offer like savings accounts and certificates of
deposit. The loans a commercial bank issues can
vary from business loans and auto loans to
mortgages.

• Banks provide timely assistance to business by
providing funds as and when needed by it.
• Secrecy of business can be maintained as the
information supplied to the bank by the borrowers
is kept confidential.
• Formalities such as issue of prospectus and
underwriting are not required for raising loans from
a bank.
• Loan from a bank is a flexible source of finance as
the loan according to business needs and can be
repaid in advance when funds are not needed.
• Funds are generally available for short periods
and its extension or renewal is uncertain and
difficult.
• Bankers make detailed investigation of the
company affairs, financial structure etc and may
also ask for security of assets and personal
sureties .
• In some cases difficult terms and conditions are
imposed by banks for the grant of loan.

A financial institution (FI) is a company engaged
in the business of dealing with monetary
transactions, such as deposits, loans, investments
and currency exchange. ... Virtually everyone
living in a developed economy has an ongoing or
at least periodic need for the services of
financial institutions.

• Financial institutions provide long term finance
which are not provided by commercial banks.
• Besides providing funds many of these
institutions provide financial, managerial and
technical advice and consultancy to business
firms.
• As repayment of loan can be made in easy
installments, it does not prove to be much of a
burden on the business.

• Financial institutions follow rigid criteria for grant
of loans. Too many formalities make the procedure
time consuming and expensive.
• Certain restrictions such as restriction on
dividend payment are imposed on the powers of
the borrowing company by the financial
institutions.


Leverage in physics Leverage in finance
Increasi
ng the
earnings
Fixe
d
cost
fun
d
LIFTIN
G
FULCRU
M
LEVER
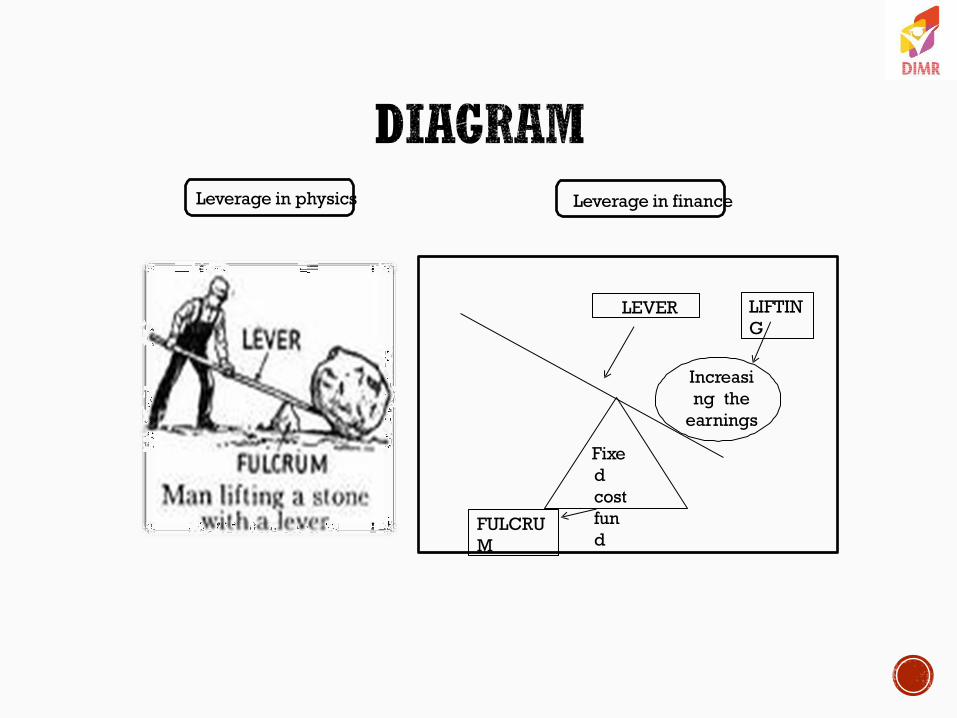
In general ,leverage refers to accomplish certain things
which are otherwise not possible i.e. lifting of heavy
objects with the help of lever. This concept of leverage is
valid in business also .
In finance ,the term ‘leverage’ is used to describe the
firm’s ability to use fixed cost assets or funds to increase
the return to its owners; i.e. equity shareholders. In other
words, the fixed cost funds i.e. debentures & preference
share capital act as the fulcrum , which assist the lever
i.e. the firm to lift i.e. to increase the earnings of its
owner i.e. the equity shareholders.
If earnings less, the variable costs exceed the fixed costs i.e. preference dividend & interest on debenture, or earnings before interest and taxes exceed the fixed return requirement, the leverage is called favourable . when they do not ,the result is unfavourable leverage .
Leverage is also the influence which an independent variable has over a dependent/related variable i.e. rainfall over production. In financial context, sales & fixed cost over profit.


Operating leverage is a measurement of the degree
to which a firm incurs a combination of fixed and
variable cost.
Operating leverage = contribution/EBIT Where,
contribution = sales – variable cost
EBIT = contribution – fixed cost
Note : in case the contribution exceeds the fixed
cost,the operating leverage is favorable. when C<F, the
operating leverages is unfavorable.

It measures how much is the effect of change in
sales on operating profit.
The degree of operating leverage at any level is
expressed in percentage change in operating profit
to percentage change in sales.


It is the tendency of the residual net income to vary
disproportionately with the operating profit. It indicate
the changes that takes place in the taxable income as a
result of the change in the operating profit.
Financial leverage = EBIT/
EBT
Where,
EBIT = Earning before interest and tax
EBT = EBIT - I , i.e. Earning before tax
I = Interest and Preference dividend
The degree of financial leverage is defined as the
percentage change in EPS due to the given
percentage change in EBIT.
DFL = % change in EPS
% change in EBIT


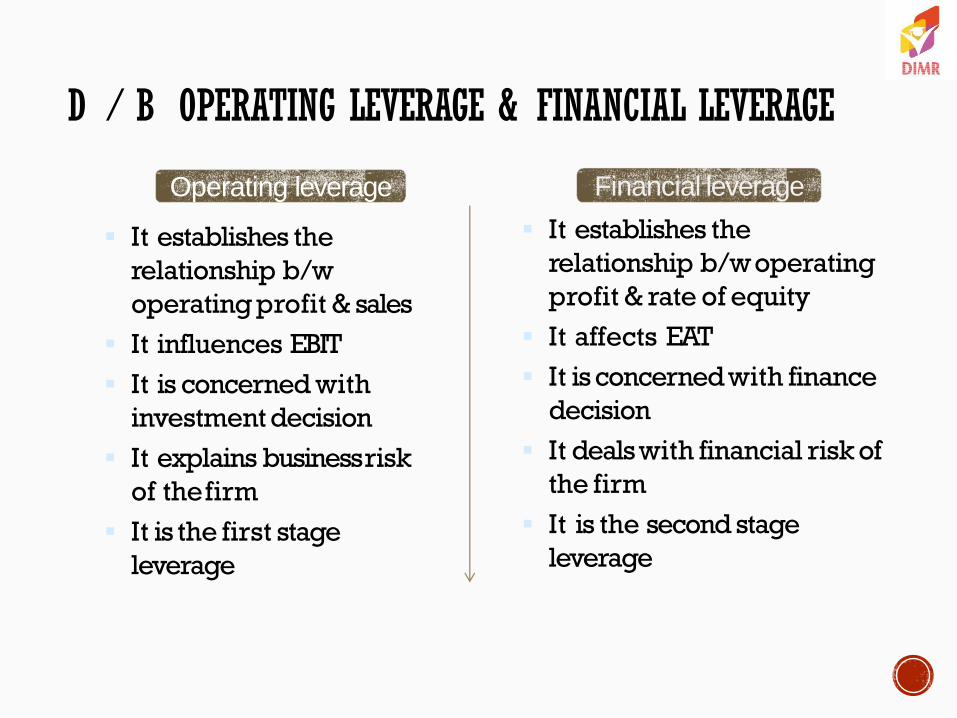
D / B OPERATING LEVERAGE & FINANCIAL LEVERAGE
It establishes the
relationship b/w
operating profit & sales
It influences EBIT
It is concerned with
investment decision
It explains business risk
of the firm
It is the first stage
leverage
It establishes the
relationship b/w operating
profit & rate of equity
It affects EAT
It is concerned with finance
decision
It deals with financial risk of
the firm
It is the second stage
leverage
Operating leverage Financial leverage

It is the combination of operating and financial
leverage.
Both of these leverage are closely concerned with firms
capacity to meet its fixed cost & their combined effect
will measure the firms financial strength.
Combined leverage = operating leverage *
financial leverage

It is calculated by multiplying the DOL and the DFL
and it is calculated by the formula.
Degree of combined leverage
= DOL * DFL
i.e., = % change in EPS /
% change in sale

Profitability Statement Amount (Rs.)
Operating Leverage
Combined Leverage
Financial
Leverage
Sales
Less: Variable Cost
Contribution
Less: Fixed Cost (xxx)
Operating Profit/ EBIT
Less: Interest (xxx)
Earnings Before Tax (EBT)
Less: Tax
Profit After Tax (PAT)
Less: Pref. Dividend (if any)
Net Earnings available to equity
sharehoIders/ PAT
No. Equity shares (N)
Earnings per Share (EPS) = (PAT + N)

MEANING
As it is evident from the name, cost of capital refers to the
weighted average cost of various capital components, i.e.
sources of finance, employed by the firm such as equity,
preference or debt.
In finer terms, it is the rate of return, that must be received
by the firm on its investment projects, to attract investors for
investing capital in the firm and to maintain its market value.
The factors which determine the cost of capital are:
(i) Source of finance
(ii) Corresponding payment for using finance.
On raising funds from the market, from various sources, the
firm has to pay some additional amount, apart from the
principal itself. The additional amount is nothing but the cost
of using the capital, i.e. cost of capital which is either paid in
lump sum or at periodic intervals.

A firm‘s cost of capital include 3 components :
1) Return at zero risk level :- It relates to the expected
rate of return when a project involves no financial or
business risk.
2) Business risk premium :- Generally business risk
premium is determined by the capital budgeting
decisions for investment proposals. If the firm selects
a project which has more than the normal risk, the
suppliers of the funds for the project will naturally
expect a higher rate of return than the normal rate.
Thus the cost of capital increases.


The above 3 components of cost of capital
may be written in the form of the following equation.
K=r0+ b + f
Where,
K= cost of capital
r0 = return at 0 risk level
b= business risk premium
f= financial risk premium
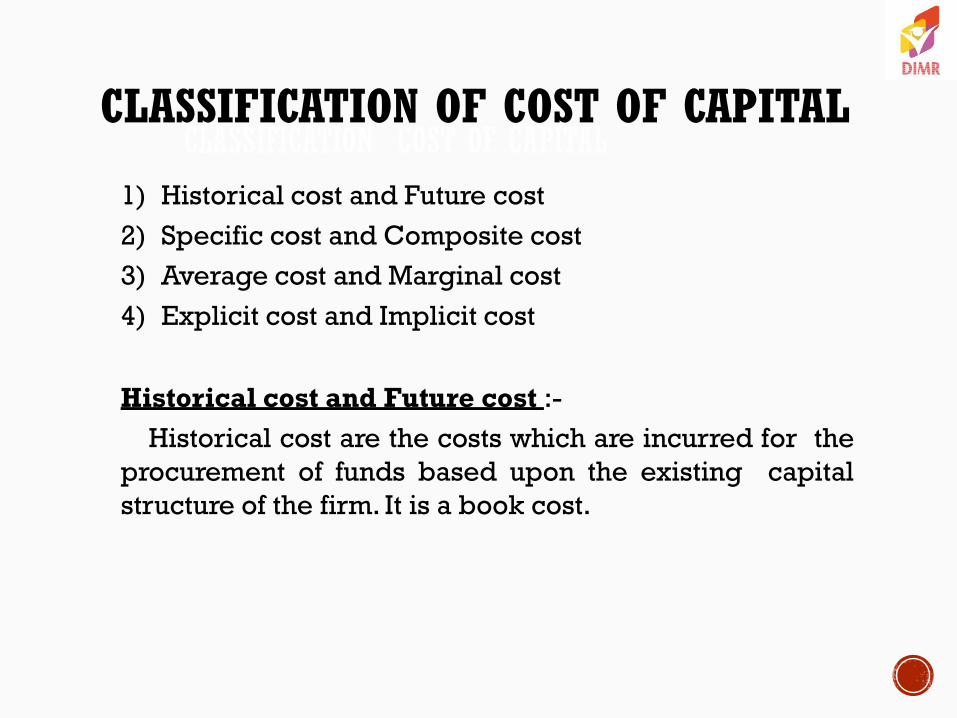
CLASSIFICATION COST OF CAPITAL
1) Historical cost and Future cost
2) Specific cost and Composite cost
3) Average cost and Marginal cost
4) Explicit cost and Implicit cost
Historical cost and Future cost :-
Historical cost are the costs which are incurred for the
procurement of funds based upon the existing capital
structure of the firm. It is a book cost.
CLASSIFICATION OF COST OF CAPITAL

Future cost is the cost which is relate to
estimated for the future. Simply it is the cost to be
incurred for raising new funds.
Specific cost and composite cost:-
Specific cost refers to the cost which is associated
with the particular sources of capital.
E.g.- Cost of Equity
Composite cost is the combined cost
of different sources of capital taken together.
E.g.- Cost of debt, cost of equity & Cost of pref.shares.

Average co Average cost and Marginal Cost :-st
and Marginal cost:-
Average cost is the combined cost of various
sources of capital such as equity shares, debentures,
preference shares.
Marginal cost of capital is the average
cost of capital which has to be incurred due to new funds
raised by the company for their financial requirements.
Explicit cost and Implicit cost:-
Explicit cost is the cut-off rate or internal rate of
return.
Implicit cost is the rate of return
related to the best investment opportunity of the firm and its
shareholders that will be foregone in order to take up a
particular project.
Computation of the Cost of Capital involves;
I. Computation of specific costs.
II. Computation of composite cost.


Computation of Specific Cost includes;
A. Cost of Debt
B. Cost of Preference Shares
C. Cost of Equity Shares
D. Cost of Retained Earnings

COMPUTATION OF SPECIFIC COST
A. Cost of Debt :-It is the rate of return which is
expected by lenders.
Cost of Debt(K d) = 𝐼
𝑁𝑃
Where,
K d = Cost of Debt
I = Interest
NP = Net proceeds

NP = Face value-Issued expenses
A2) When debt issued at premium:
NP = Face value + Premium – Issue
expenses
A3) When debt issued at discount:
NP = Face value – Discount – Issue
expenses

COST OF REDEEMABLE DEBT(BEFORE TAX)
Redeemable debt refers to the debt which is to be
redeemed or repayable after the expiry of a fixed
period of time.
K d(before tax) = I+(𝑃−𝑁𝑃)/n
(𝑃+𝑁𝑃)/2
Where,
I = Annual Interest Payment
P = Par Value Of Debentures
NP = Net Proceeds Of Debentures
n= No. Of Years To Maturity
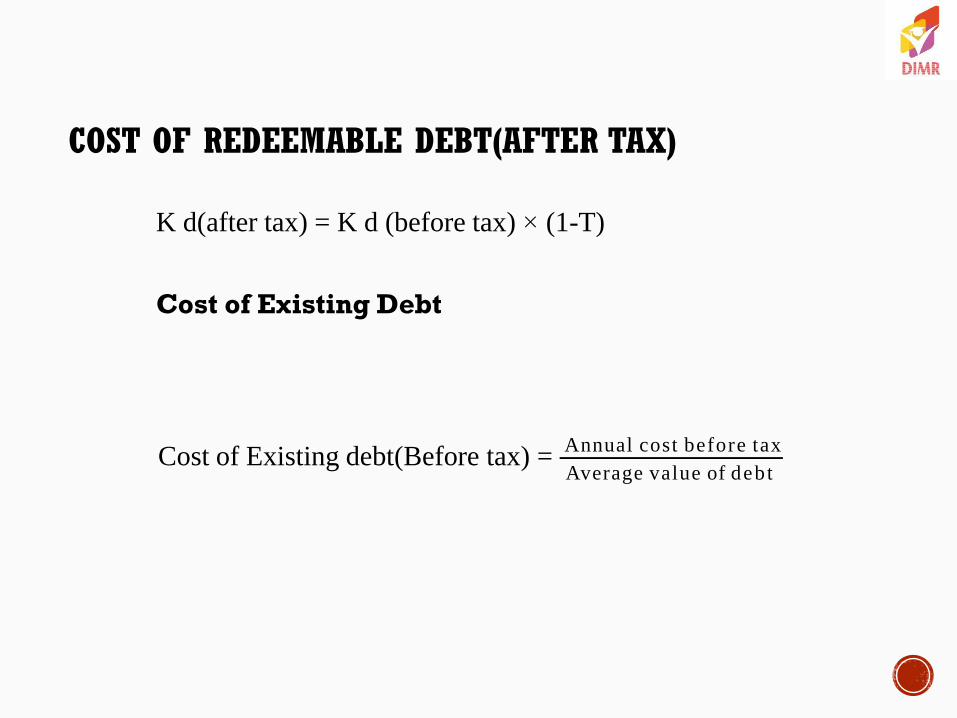
COST OF REDEEMABLE DEBT(AFTER TAX)
K d(after tax) = K d (before tax) × (1-T)
Cost of Existing Debt
Cost of Existing debt(Before tax) = Annual cost before tax
Average value of debt

AVERAGE VALUE OF DEBT
AV = 𝐍𝐏+𝐑𝐕
𝟐
Where,
AV = Average Value
NP = Net Proceeds
RV = Redemption Value
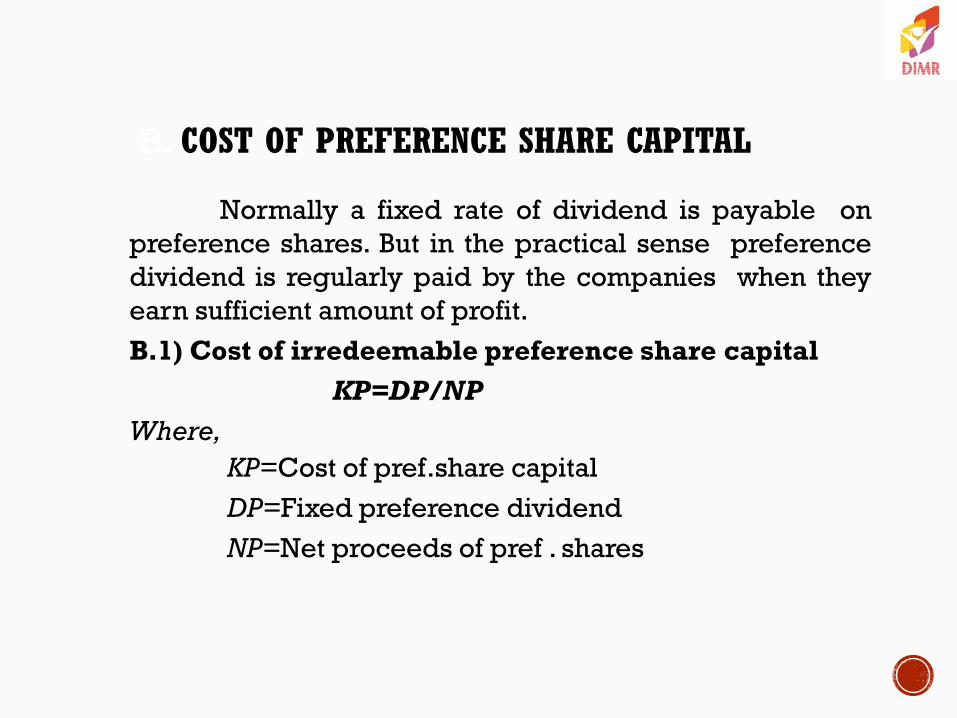
B. COST OF PREFERENCE SHARE CAPITAL
Normally a fixed rate of dividend is payable on
preference shares. But in the practical sense preference
dividend is regularly paid by the companies when they
earn sufficient amount of profit.
B.1) Cost of irredeemable preference share capital
KP=DP/NP
Where,
KP=Cost of pref.share capital
DP=Fixed preference dividend
NP=Net proceeds of pref . shares

Problem
A company raises preference share capital of
Rs.1,00,000 by issuing 10% preference shares of
Rs.100 each. Compute the cost of preference capital
when they are issued at
a) 10% premium.
b)10% discount.

SOLUTION:
a)When preference shares are issued at a
premium of 10%.
KP=DP/NP
Where,
DP=Rs.10,000(@10% on Rs.1,00,000)
NP=Rs.1,10,000(Rs.1,00,000+Rs.10,000)
i.e., = 10,000
1,10,000 = 9.09%

KP=DP\NP
= 10,000
90,000(1,00,000−10,000) = 11.11%

B2)COST OF REDEEMABLE PREFERENCE SHARES
Redeemable preference shares are those
which are to be redeemed after the expiry of specified
period of time.
KP = 𝐶+(𝐷−𝑁𝑃)/𝑛
(𝐷+𝑁𝑃)/2
C= annual dividend
D= par value of preference shares
n= no . of years to maturity
NP=net proceeds

PROBLEM:
A company issues 10% redeemable preference
shares for Rs.1,00,000 redeemable at the end of the
10th year from the year of their issue. The
underwriting cost is 5%. Calculate the effective cost
of preference share capital.
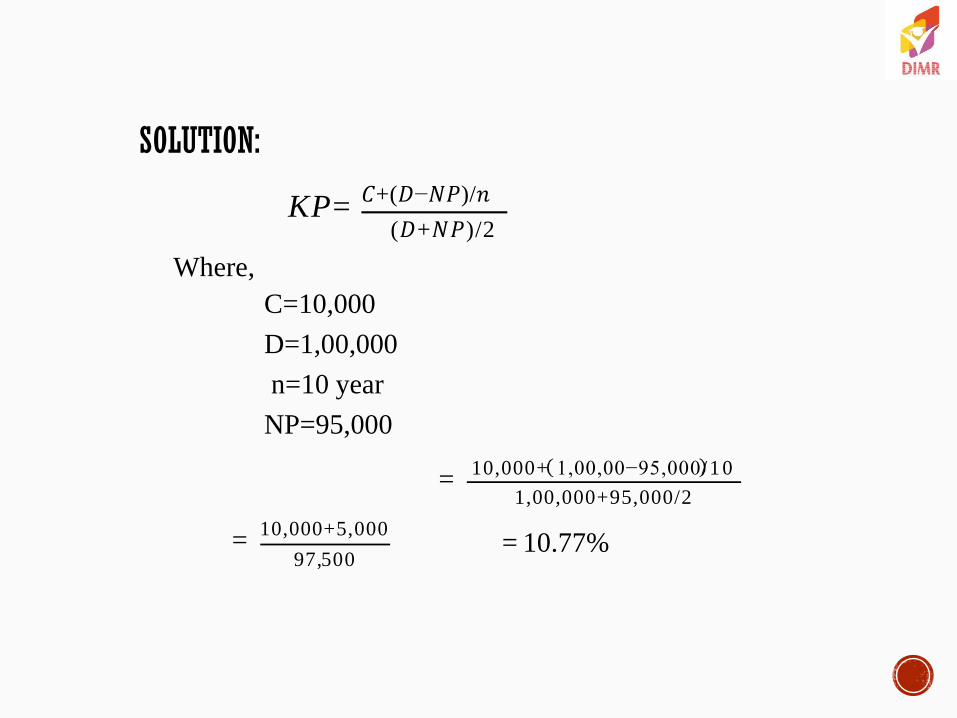
SOLUTION:
KP= 𝐶+(𝐷−𝑁𝑃)/𝑛
(𝐷+𝑁𝑃)/2
Where,
C=10,000
D=1,00,000
n=10 year
NP=95,000
= 10,000+ 1,00,00−95,000/ 1 0
1,00,000+95,000/2
= 10,000+5,000
97,500 = 10.77%

C. COST OF EQUITY CAPITAL
Cost of equity capital may be defined as
the minimum rate of return that a firm must earn on it
investment, and also the market price of the equity
shares on unchanged.
C1)Dividend price method
Ke=D/NP
Where,
Ke=Cost of equity capital
D=Expected dividend per share
NP=Net proceeds per share

C2)DIVIDEND PRICE PLUS GROWTH
In this method cost of equity capital is
calculated on the basis of the dividend yield and the
growth rate in dividend.
Ke=D/NP + g
Where,
Ke=Cost of equity capital
D=Expected dividend per share
NP=Net proceeds per share
g=Growth rate in dividends

C3) EARNING PRICE APPROACH
Ke=EPS/NP
Where,
K e=Cost of equity capital
EPS=Earning per share
NP=Net proceeds

D. COST OF RETAINED EARNINGS
It refers to that portion of the profit retained by the
company for future development, business use and
expansion is known as retained earnings.
Kr=Ke(1-t) (1-b)
Where,
Kr=Cost of retained earnings
Ke=Cost of equity capital
t=Tax rate
b=Brokerage

COMPUTATION OF COMPOSITE COST
Weighted Average Cost of Capital(WACC) It refers to the weighted average cost of
different sources of finance. It is very important in financial
decision making. Steps involved in computation of WACC;
• Calculate the cost of each of the sources of finance is
ascertained.
• Assigning weights to specific costs.
• Multiplying the cost of each sources by the
appropriate weights.
• Dividing the total weighted cost by the total
weights.
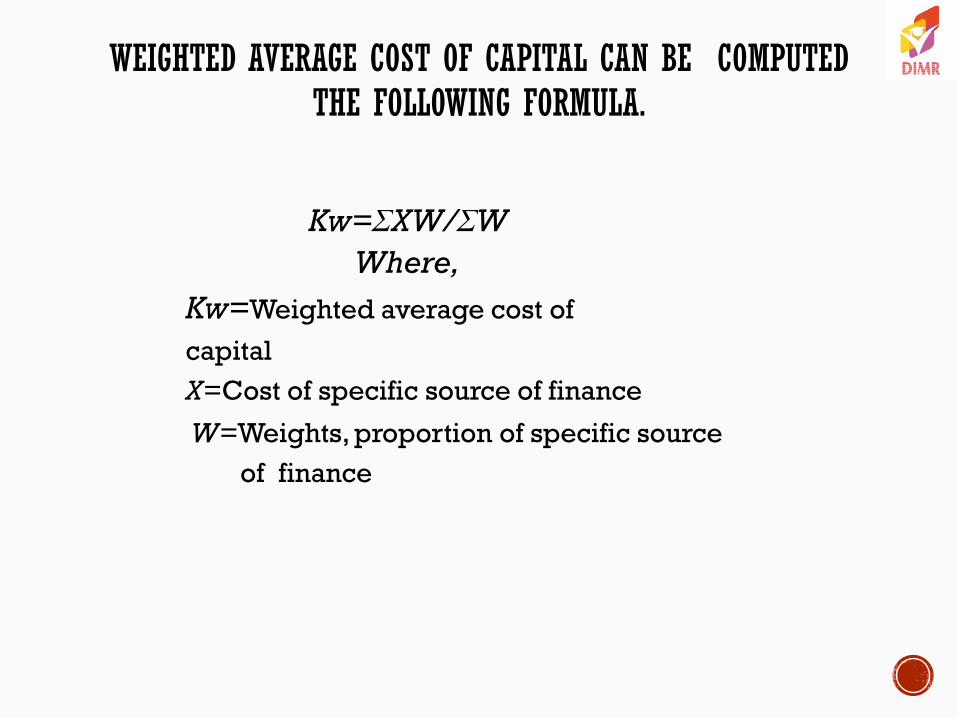
WEIGHTED AVERAGE COST OF CAPITAL CAN BE COMPUTED THE FOLLOWING FORMULA.
Kw=ΣXW/ΣW
Where,
Kw=Weighted average cost of
capital
X=Cost of specific source of finance
W=Weights, proportion of specific source
of finance

PROBLEM
The cost of capital (after tax) of a company is
the specific sources is as follows:
Cost of Debt 4.00%
Cost of Preference shares 11.50%
Cost of Equity Capital 15.50%
Cost of Retained Earnings 14.50%
(assuming external )
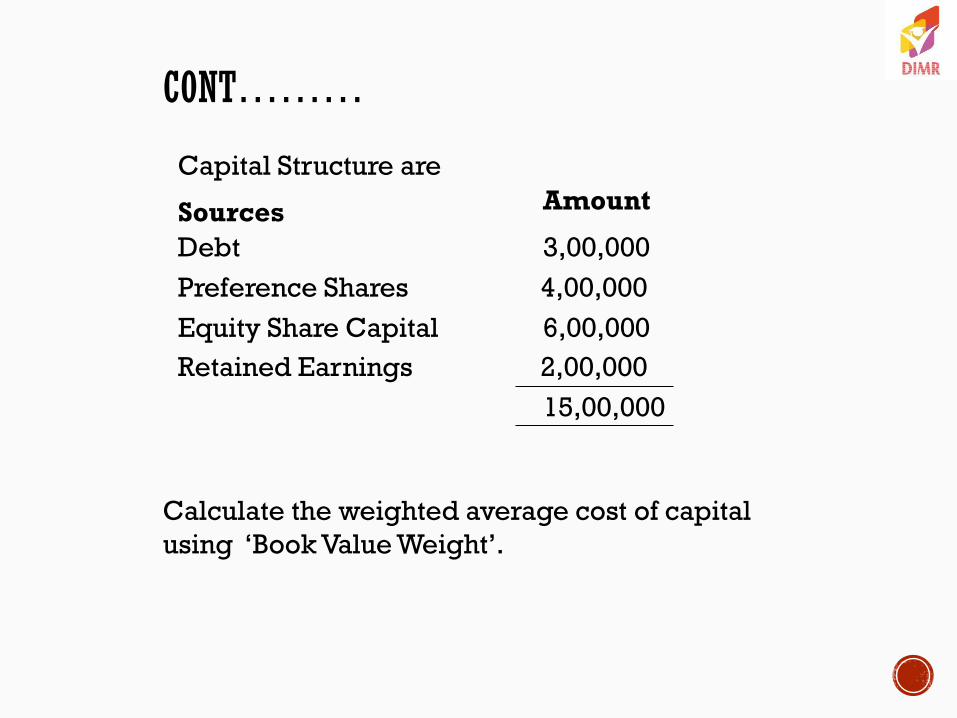
CONT………
Capital Structure are
Sources
Amount
Debt 3,00,000
Preference Shares 4,00,000
Equity Share Capital 6,00,000
Retained Earnings 2,00,000
15,00,000
Calculate the weighted average cost of capital
using ‗Book Value Weight‘.

SOLUTION: COMPUTATION OF WEIGHTED AVERAGE
Sources (a) Amount (b)
Proportion(c) After tax cost(d)
Weighted cost (e) = (c) X (d)
Debt 300000 0.200(20%) 0.0400 0.0080
Preference Share capital
400000 0.267(26.7%) 0.1150 0.0307
Equity Share Capital
600000 0.400(40%) 0.1550 0.0620
Retained Earnings
200000 0.133(13.3%) 0.1450 0.0193
1500000 1.000(100%) 0.1200
WEIGHTED AVERAGE COST OF CAPITAL : 12%

ALTERNATIVE APPROACH
Computation Of Weighted Average Cost Of Capital
Sources (a) Amount (b) Cost (c) Total cost (d) = (b) X (c)
Debt 300000 4.00% 12000
Preference Share 400000 11.50% 46000 capital
Equity Share Capital
600000 15.50% 93000
Retained Earnings
200000 14.50% 29000
1500000 180000
WEIGHTED AVERAGE COST OF CAPITAL = 180000/1500000 = 12%

From the information mentioned in the previous
eg.,Compute WACC talking into a/c that the market value
Sources Market
Value
Debt 2,50,000
Preference Shares 4,50,000
Equity and Retained Earnings 10,00,000
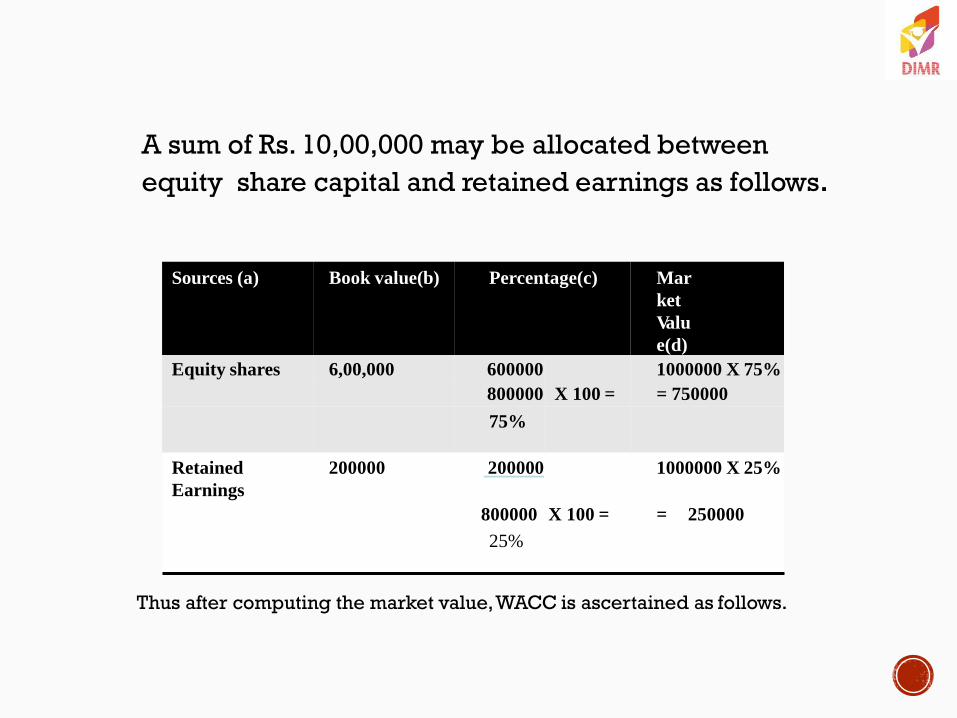
A sum of Rs. 10,00,000 may be allocated between
equity share capital and retained earnings as follows.
Sources (a) Book value(b) Percentage(c) Mar
ket
Valu
e(d)
Equity shares 6,00,000 600000 1000000 X 75%
800000 X 100 = = 750000
75%
Retained
Earnings
200000 200000 1000000 X 25%
800000 X 100 = = 250000
25%
Thus after computing the market value, WACC is ascertained as follows.

COMPUTATION OF WACC(MARKET-VALUE WEIGHT)
Sources
(a)
Market Value
Rs.
(b)
Cost
(c)
Total Cost
Rs.
(d) = b×c
Debt 2,50,000 4.00% 10,000
Preference Share 4,50,000 11.50% 51,750
Equity
Share
Capital
7,50,000 15.50% 1,16,250
Retained Earnings 2,50,000 14.50% 36,250
17,00,000
2,14,250
WACC=2,14,250/17,00,000 = 12.60%
271
By:
Prof. Kavita Pareek
( Dnyansagar Institute of Management and Research,
Balewadi, Pune )

An Investment Decision Method
272

1.
2.
3.
4.
5.
6.
7.
8.
Meaning of Budget
273
Budget Sector and Types of Budget
Capital Budgeting
Importance of Capital Budgeting
Capital Budgeting: Eight Steps
Time Value of Money
Evaluation Criteria: Capital Investment Appraisals
Conclusion

274
•Budgeting is a management tool for planning
and controlling future activity.
Financial Buzz Words: A plan for saving, borrowing and
spending.
•Budget is a financial plan and a list of all
planned expenses and revenues.

27
5
Budget Types
4
Basis of Flexibility : Fixed and Variable
Budget
Basis of Time Period : Short-Term
and
Long –Term Budget
Basis of Functionality: Sales budget,
Production budget , Marketing budget,
Project budget, Revenue budget, Cash
flow/cash budget etc.
Buisness start-up budget
Corporate/ Buisness budget Government budget Event management budget Personal / Family budget
Govt. Budget in India Prepared by:
Budget division of Economics Department of Ministry of Finance

276
Capital: Operating assets used for production.
Budget: A plan that details projected cash flows during some
period.
Capital Budgeting: Process of analyzing projects and deciding
which ones to include in capital budget.

277
According to Charles T. Horngreen , ―Capital
budgeting is long-term planning for making and
financing proposed capital outlay‖.
Milton H. Spencer defines ‗capital budgeting‘ as
―Capital budgeting involves the planning of
expenditure for assets, the returns from which will be
realized in future time periods‖.
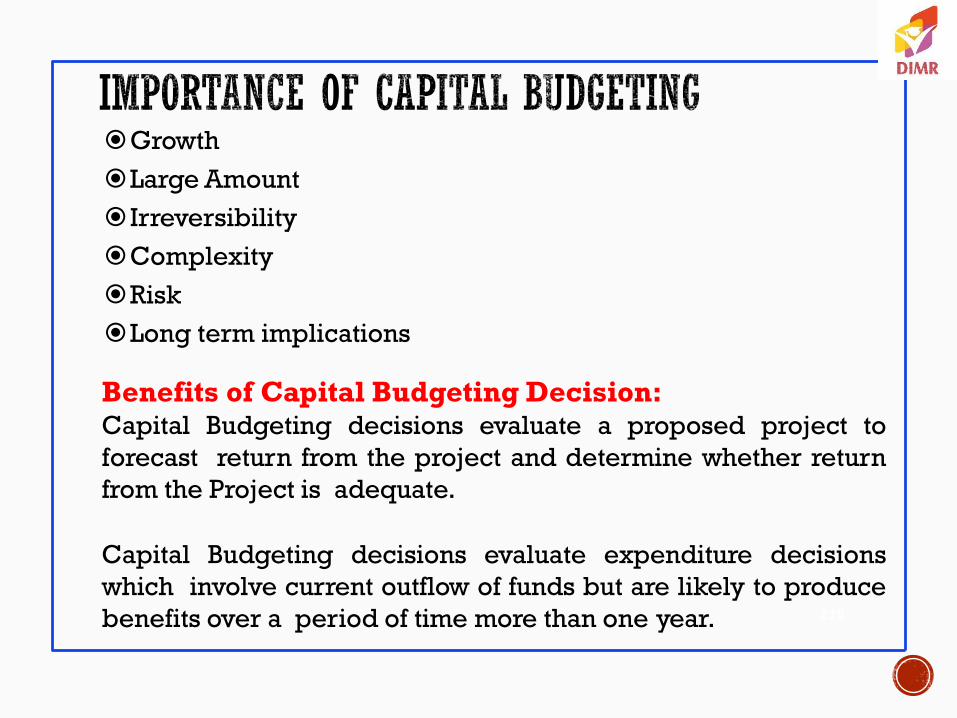
278
Growth
Large Amount
Irreversibility
Complexity
Risk
Long term implications
Benefits of Capital Budgeting Decision: Capital Budgeting decisions evaluate a proposed project to
forecast return from the project and determine whether return
from the Project is adequate.
Capital Budgeting decisions evaluate expenditure decisions
which involve current outflow of funds but are likely to produce
benefits over a period of time more than one year.

CAPITAL BUDGETING IS THE PLANNING PROCESS USED TO DETERMINE A FIRM’S LONG TERM INVESTMENTS SUCH AS NEW MACHINERY, REPLACEMENT MACHINERY, NEW PLANTS, NEW PRODUCTS AND RESEARCH & DEVELOPMENT PROJECTS.
279
Broad Prospective
280
Which would you rather have – Rs.1,000 today or
Rs.1,000 in 5 years?
Money received sooner rather than later allows one to
use the funds for investment or consumption purposes.
All other factors being equal, it is better to have
$1,000 today.
Simply put this is the concept of the time value of
money.

281
Why is TIME such an important element in your
decision?
TIME allows one the opportunity to postpone
consumption and earn INTEREST.

282
TVM help us in knowing the value of money invested. As time
changes value of money invested on any project/ firm also
changes. And its present value is calculated by using
―mathematical formula‖, which tell us the value of money with
respect of time. i.e.

283
• Risk and Uncertainty
• Inflation
• Consumption
• Investment opportunities
• e.g.- if an individual is given an alternative either to
receive Rs.10,000 now or after one year, he will
prefer Rs.10,000 now. This is because, today, he may
be in a position to purchase more goods with this
money than what he is going to get for the same
amount after one year.

284
1. In Investment Decisions - Small businesses often
have limited resources to invest in business operations,
activities and expansion. One of the factors we have to look
at is how to invest, is the time value of money.
2. In Capital Budgeting Decisions - When a
business chooses to invest money in a project - such as
an expansion, a strategic acquisition or just the purchase
of a new piece of equipment -- it may be years before
that project begins producing a positive cash flow. The
business needs to know whether those future cash flows
are worth the upfront investment.

285
The time value of money establishes that there is a
preference of having money at present than a future point of
time. It means;
If an individual is given an option A to receive Rs.10,000 now
or option B after three year, he will prefer Rs.10,000 now
because although the amount is the same, you can do much
more with the money if you have it now because over time
you can earn more interest on your money. By receiving
Rs.10,000 today you can increase the future value of your
money by investing and gaining interest over a period of
time. For Option B, you don't have time on your side, and the
payment received in three years would be your future value.

286
If you are choosing Option A, your future value will be
Rs.10,000 plus any interest acquired over the three years. The
future value for Option B, on the other hand, would only be
Rs.10,000. So how can you calculate exactly how much more
Option A is worth, compared to Option B. To illustrate, we have
provided a timeline:

287
As we prefer to choose to option A for receiving the amount and
invest the total amount at a simple annual rate of 4.5%, the future
value of your investment at the end of the first year is Rs.10,450, as on
end of second year it will be Rs.10,920.25 and same continued as
third year and as on end of third year the amount will be Rs.11411.66
Figure shows how value of money is
increasing by the time.

288
Ques. At the end of 3rd year what amount we will get or what will be the
future value of Rs.10,000 at rate of 4.5% uniformly.
Solution;
As we know PV = 𝐹𝑉 𝐹𝑉 = 𝑃𝑉(1 + 𝑖)𝑛
(1+𝑖)𝑛 where, PV= Rs.10,000 , i= 4.5% and n= 3 years
Therefore,
FV= 10,000 (1 + 0.045)3
= 10,000 (1.045)3 = 10,000 (1.14116612)
= Rs.11411.66 ( at the end of the 3rd year)
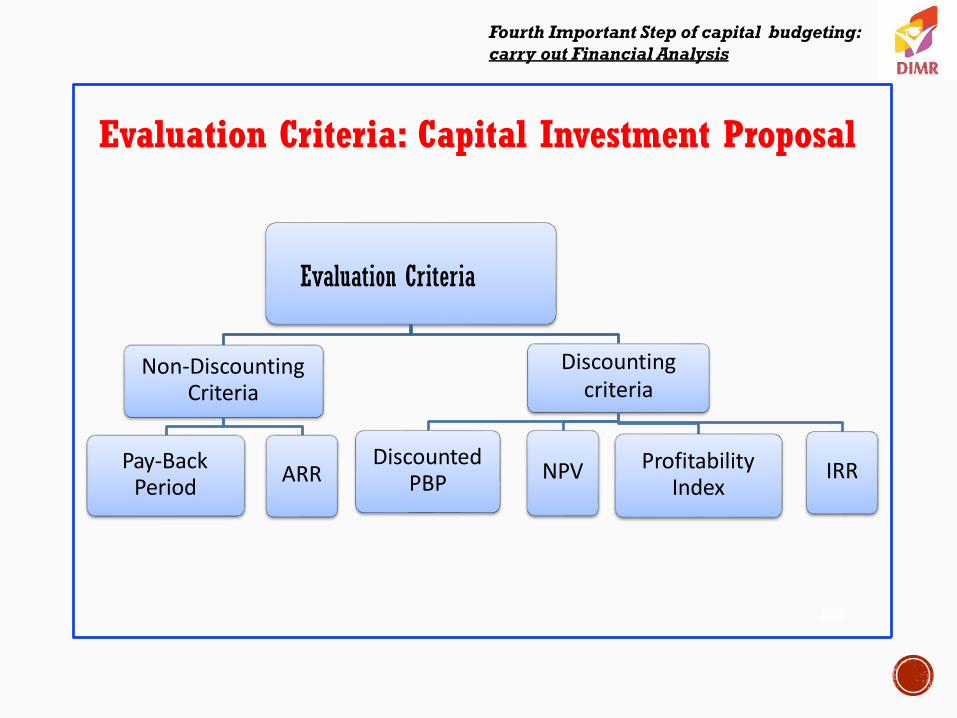
Evaluation Criteria: Capital Investment Proposal
Evaluation Criteria
Non-Discounting Criteria
Pay-Back Period
ARR
Discounting criteria
NPV Discounted
PBP Profitability
Index IRR
289
Fourth Important Step of capital budgeting:
carry out Financial Analysis

290
1. Pay-Back Period Method- It is defined as the
number of years required to recover original cost
invested in a project. It has two conditions
When cash inflow is constant every year
PBP= Cash outflow/cash inflow (p.a.)
When cash inflow are not constant every year
PBP = * 12
Required inflow Completed years +
In flow of next year
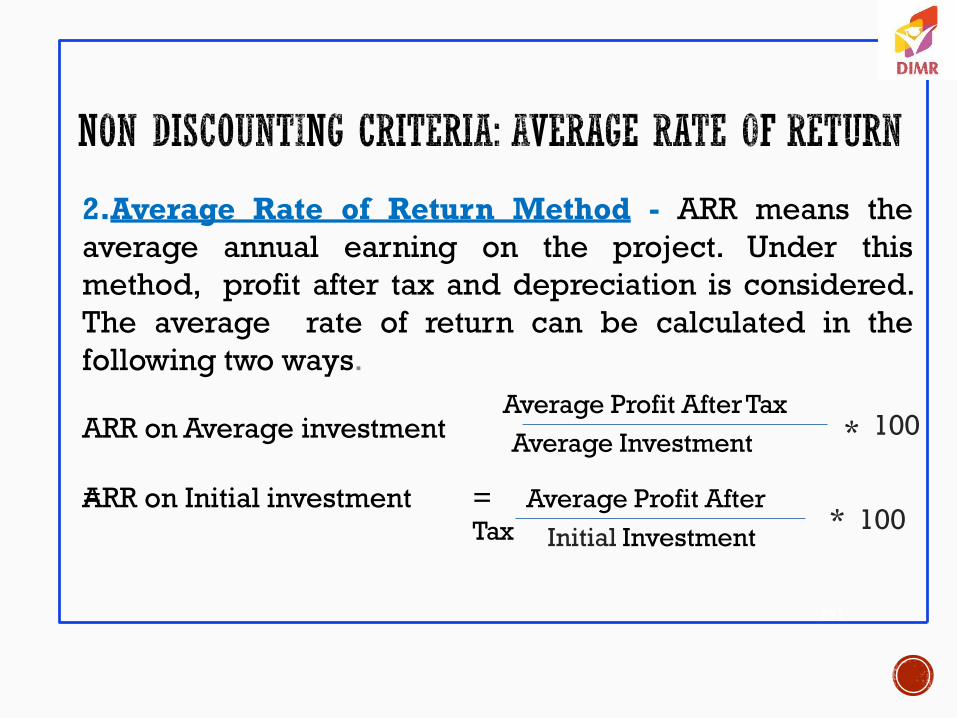
291
2.Average Rate of Return Method - ARR means the
average annual earning on the project. Under this
method, profit after tax and depreciation is considered.
The average rate of return can be calculated in the
following two ways.
ARR on Average investment
= ARR on Initial investment
* 100 Average Profit After Tax
Average Investment
* 100 = Average Profit After
Tax Initial Investment

292
3. Discounted Pay-Back Period Method - In discounted pay- back period method, the cash inflows are discounted by applying the present value factors for different time periods. For this, discounted cash inflows are calculated by multiplying the P.V. factors into cash inflows.
* 12 Required inflow
In flow of next year Dis. PBP = Completed years +
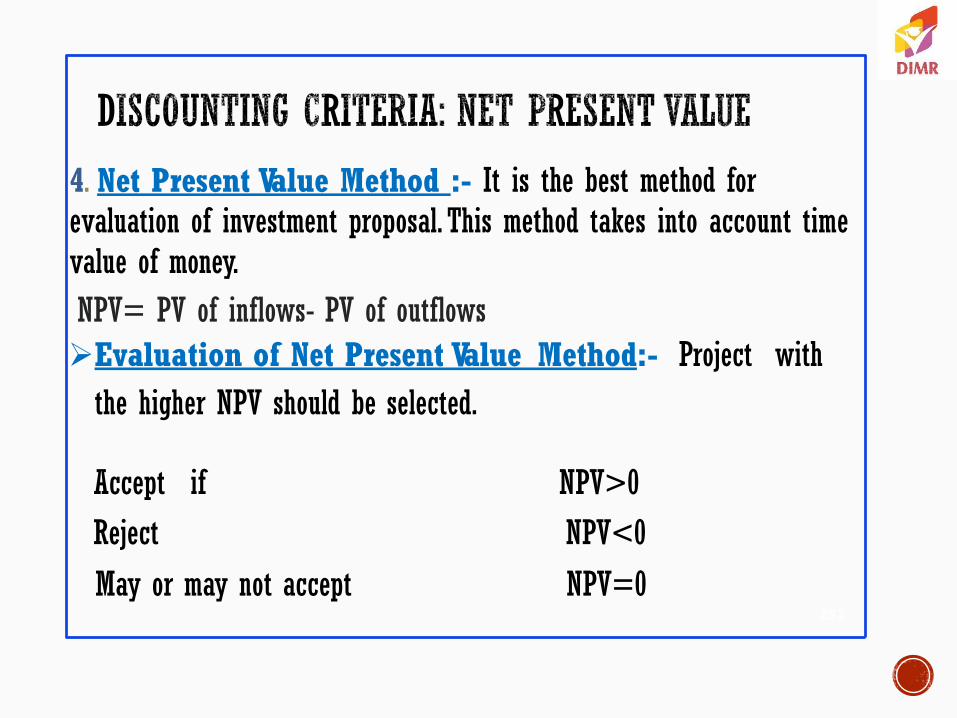
293
4. Net Present Value Method :- It is the best method for evaluation of investment proposal. This method takes into account time value of money.
NPV= PV of inflows- PV of outflows
Evaluation of Net Present Value Method:- Project with
the higher NPV should be selected.
Accept if NPV>0
Reject NPV<0
May or may not accept NPV=0

294
5. Profitability Index Method - As the NPV method it is also
shows that project is accepted or not. If Profitability index is higher than 1, the proposal can be accepted.
Accepted PI>1
Rejected PI<1
Profitability index = Total Cash Inflows
Total Cash Outflows

295
6. Internal Rate of Return Method:- IRR is the rate of return that a project earns. The rate of discount calculated by trial and error , where the present value of future cash flows is equal to the present value of outflows, is known as the Internal Rate of Return.
* Difference in
Rate
NPV of Higher Rate
Difference in cash
flows
IRR =
* Difference in
Rate
NPV of Lower Rate
Difference in cash
flows
IRR = Lower Rate +
Higher Rate -
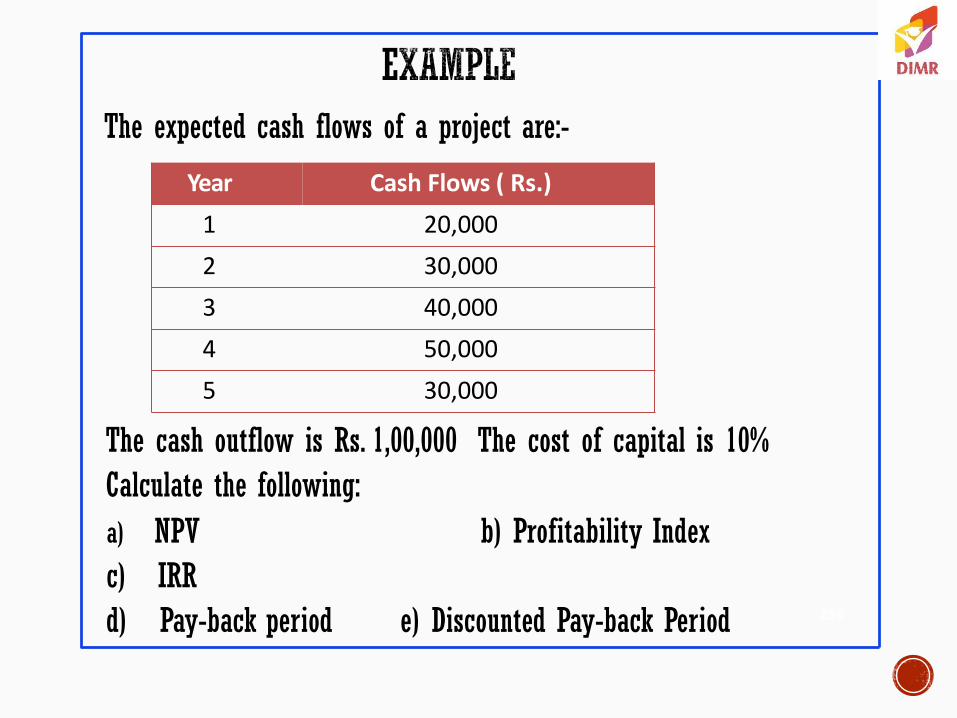
The expected cash flows of a project are:-
The cash outflow is Rs. 1,00,000 The cost of capital is 10%
Calculate the following:
a) NPV b) Profitability Index
c) IRR
d) Pay-back period e) Discounted Pay-back Period
Year Cash Flows ( Rs.)
1 20,000
2 30,000
3 40,000
4 50,000
5 30,000
296
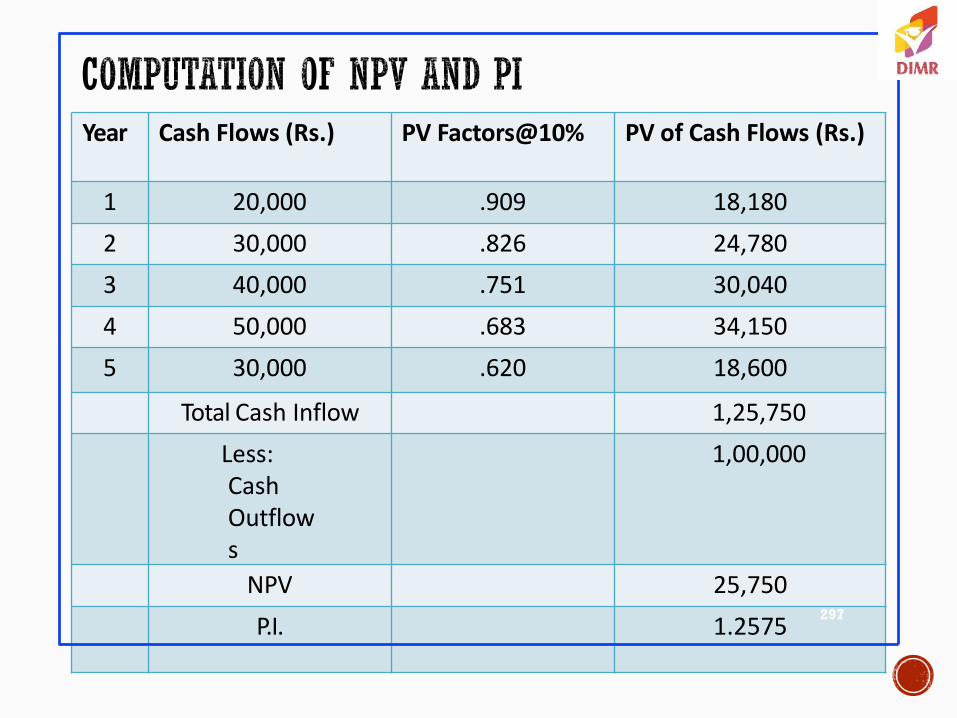
Year Cash Flows (Rs.) PV Factors@10% PV of Cash Flows (Rs.)
1 20,000 .909 18,180
2 30,000 .826 24,780
3 40,000 .751 30,040
4 50,000 .683 34,150
5 30,000 .620 18,600
Total Cash Inflow 1,25,750
Less: Cash Outflows
1,00,000
NPV 25,750
P.I. 1.2575 297

298
p Com utatio n of N PV & PI
Computation of IRR
Year Cash Flows (Rs.)
PV Factors @19%
PV of Cash Flows (Rs.)
PV Factors @18%
PV of Cash Flows (Rs.)
1 20,000 .84 16,800 .847 16,940
2 30,000 .706 21,180 .718 21,540
3 40,000 .593 23,720 .609 24,360
4 50,000 .499 24,950 .516 25,800
5 30,000 .42 12,600 .437 13,110
Total Cash Inflow 99,250 1,01,750
Less Cash Outflows 1,00,000 1,00,000
NPV (-)750 (+)1750

299

300
Year Cash Flows (Rs.) Cumulative Cash Flow
1 20,000 20,000
2 30,000 50,000
3 40,000 90,000
4 50,000 1,40,000
5 30,000 1,70,000
PBP = Completed years + Required inflow *12 Inflow of Next year
= 3years+ (1,00,000-90,000) *12 50,000
= 3 years 2.4months

301
Year Cash Flows (Rs.)
PV Factors@10%
PV of Cash Flows (Rs.)
Cumulative Cash Flows
1 20,000 .909 18,180 18,180
2 30,000 .826 24,780 42,960
3 40,000 .751 30,040 73,000
4 50,000 .683 34,150 1,07,150
5 30,000 .620 18,600 1,25,750
PBP = Completed years +
Required inflow *12 Inflow of Next year
= 3years+ (1,00,000-73,000)*12
34150 = 3 years 9.5 months
302
We have Studied various evaluation criteria for Capital
Budgeting.
Generally an impression created that the firm should
use NPV method for decision making.
Most of the large companies consider all the measures because
each one provides somewhat different piece of relevant information to
the decision maker.

30
3


