37
Business Plan 2022 Milan February 17, 2020

Business Plan 2022
Milan
February 17, 2020

MIL-6102SJ -18022020-123184/DF
2
Closing remarks: a realistic plan based on
conservative assumptions
Agenda
UBI 2022: a clear direction towards the future
based on further de-risking, digitally-enabled cost
reduction, and revenue protection
UBI 2022: a value-creation plan based
on a solid trajectory already started in
2019

MIL-6102SJ -18022020-123184/DF
3
UBI 2022: a conservative macro-economic scenario, with no material improvement
assumed over the next three years
SOURCE: Servizio Studi UBI; Prometeia; Bloomberg
1 Consensus for Euribor 3M defined using Euribor 3M futures as per 14 February 2020 2 Forecast. Official data for FY 2019 will be available in March 2020
Euribor 1M, %, annual average Real GDP, %, year on year growth
0.2
1.7
0.5
1.70.7
0.7
0.1
0.9
0.3
0.7
0.60.7
Consensus1
-0.32-0.31
-0.31 -0.32-0.36
-0.36
-0.44
-0.41-0.41
-0.43
-0.41
-0.36
-0.44-0.37 -0.37 -0.41 -0.44 -0.44
Euribor 3M, %, annual average
2017 2018 2019 2020 2021 2022 2017 2018 20192 2020 2021 2022

MIL-6102SJ -18022020-123184/DF
4
UBI today: a strong player in the Italian context, with the DNA of a multi-specialist
SOURCE: Magstat (2018), Istat, Assofin, Bank of Italy, SBA Factsheet 2019
UBI has maintained
a full-range of
product factories,
helping to boost
commission
revenues
1 Calculated through "UBINDEX", i.e., weighted sum of overall satisfaction, net promoter score, strength of client-bank relationship, and perceived positioning vs. competitors
2 Gross banking volumes calculated as the sum of loans and assets; analysis based on regional real GDP growth evolution between 2013 and 2017
3 Small Business clients served over total Small Business clients in Italy 4 Invested assets, excluding direct deposits and postal savings
Trusted bank for Italian
families
3+million
Retail customers (individuals
and families), with growing
satisfaction (from 56 in 2010
to 62 in 2019)1
Gross banking volumes in
Italian regions with above
average GDP growth2
Growth partner of the best
Italian companies
23thousand
Corporate and CIB customers
€30billion
Loans to corporate and CIB
customers
60%
Top Italian specialized
lender
Market share in
CQS/CQP (salary and
pension backed loan
business)
Italian Small Business
clients served3
10%
12%
Distinctive Wealth
Manager
4th
2,700Professional advisors to
premium and private
customers (including IW
Bank)
WM in Italy in terms of
AUM4 among banking
groups

MIL-6102SJ -18022020-123184/DF
5
Since its inception, UBI Group has delivered ~2.8 € billion of shareholder value
1 2019 tangible equity (including 2019 profit, net of 2019 proposed dividends to be paid in 2020) minus 2007 tangible equity (net of profit for the period)
€ billions
Only bank in Italy, among major banks, to have
distributed cash dividends every year since 2007
Increase in
tangible
equity1 since
2007
Capital
increases
Dividend
distribution
2.37
1.582.01
2.80
€ bln
€ bln€ bln
€ bln
Cumulated
shareholder
value 2007-
2019

MIL-6102SJ -18022020-123184/DF
6
100% owned, salary backed loan company 10% market share in 2019
100% owned, leasing company 4thby outstanding (Dec 2018)
40% owned, life bancassurance companyPartnership with Cattolica Assicurazione expiring in 2020
20% owned, life bancassurance companyPartnership with Aviva expiring in 2020
100% owned, factoring company 6th by outstanding (Sept 2019)
100% owned, life bancassurance companyAcquired with former Nuova Banca Etruria
65% owned, in partnership with Prudential US Asset management company
4thamong banking companies
ZHONG OUAsset Management 25% owned, Chinese partnership
19thby mutual funds and segregated accounts and
1stby active equity mutual funds held by institutions
100% owned, online bank 3rd by traded equity volumes (Dec 2019)
Ownership Ranking in Italy1
5thby insurance portfolio
2ndby Bancassurance (Dec 2018)
1 Except for Zhong Ou Asset Management: ranking for China
The key subsidiaries of UBI Banca: a complete service to the customer and a
strong value reserve

MIL-6102SJ -18022020-123184/DF
7
A responsible business approach based on a strong corporate culture
New Lending to Families and Small Businesses
for social and environmental purposes in 2019€6billion
Green and social bonds issued1€1.5billion
1 Cumulated since 2012 2 Gender Equality Index
Market share for loans to the third sector through a dedicated unit (i.e., UBI Comunità)10%
Share of women hired in 201953%
“Fare Banca per Bene”
Sustainability is part of the DNA of the Group
"Gran Prix de la Mixité" among FTSE MIB companies in 2018#1
Since 2020GEI2
Bloomberg
Socially responsible investments managed
by Pramerica €2.6billion
Since 2014FTSE4Good

MIL-6102SJ -18022020-123184/DF
8
UBI 2019: a solid starting point
1 Core revenues include net interest income and net commissions
2 AT1 issued in 2020 and included pro-forma in the calculation of the total ratio
Growing core revenues1
with healthy mixDecreasing cost
baselineImproving credit
qualityGrowing
capital ratio and strong protection for senior bondholders
2018
7.8
2019
10.4 -2.6 p.p.
Core revenue
mix, %Operating costs
(stated), € mlnCET1 FL ratio, %
11.3
2018 2019
12.3
2,448
2018 2019
2,368-3%
NPE ratio (gross), %
2018
49%
53%
47%
3,369
51%
2019
3,387
Net
Commissions
Net interest
income +1.0 p.p.19.1
AT1
Tier 2
0.7
CET1
2019
SNP
12.3
3.5
2.6
Total capital +
SNP, %2

MIL-6102SJ -18022020-123184/DF
9
Stronger capital
CET1 FL ratio, %
UBI 2022 targets: a solid and attractive value creation plan
1 Excluding systemic contributions (Deposit Guarantee Scheme and Resolution Fund)
Improved profitability Further improved credit quality
NPE ratio (gross), %Normalised ROTE, %
8.3
2019 2022
4.7
2019 2022 before regulatory
headwinds
2022
12.3 13.5 12.5
2019
5.2
2022
7.8
Increased resilience
Optimized operating structure
Cost/income1, %
Texas ratio, %
62.1
2019
58.1
2022
2019 2022
55.6
32.6
Growing dividend over plan horizon
Pay out ratio
LLPs related to
wholesale
disposals are not
normalized
• Average pay out ratio over the 3 year plan
of 40% of net profit, well balanced with the
maintenance of a year-end CET1 ratio of
12.5%
• In 2022 possible additional dividend
increase if CET1 ratio >12.5%

MIL-6102SJ -18022020-123184/DF
10
Value creation based on further de-risking, digitally-enabled cost reduction and
revenue protection, with growing investments to transform the business model
353
665
202212019 (net
of non-
recurring)
+88%
51%
51%
49%
49%
3,387 3,429+1%
738
387 -48%
2,368 2,235-6%
2017-2019 2020-2022
~720
~9403
+31%
Net Commissions
Net interest income
1 There are no non-recurring items in 2022 2 Core revenues include interest margin and commissions
3 Includes ~€240 mln of other administrative expenses and ~€700 mln of investments
Net profit increase… …driven by concrete measures…
… with growing investments to
transform the business model
Reduce costs mainly
through transformation
of the retail business
model
Operating costs (stated)
Protect core revenues,
further growing
commissions vs.
interest margin
Core revenues2
Further improve credit
risk management
LLPs
2019 2022
€ millions, percentage
Already significantly
higher vs. ~€370 mln in
2014-2016
Net profit Cumulated investments

MIL-6102SJ -18022020-123184/DF
11
Agenda
Closing remarks: a realistic plan based on
conservative assumptions
UBI 2022: a value creation plan based on a solid
trajectory already started in 2019
UBI 2022: a clear direction towards
the future based on further de-
risking, digitally-enabled cost
reduction, and revenue protection

MIL-6102SJ -18022020-123184/DF
12
UBI 2022: a clear strategic path, with focused efforts where we can
truly be distinctive
Further de-risk loan portfolio Transform Retail business model towards lower cost-to-serve and better service quality
A B C
Organize-to-innovate, increasing the capacity to deliver sustainable changeE
Structural capital balance and flexibility, driven by strong capital position, structural capital-liquidity balance and business flexibilityF
Data and analytics to support the transformation of the business modelD
Invest in superior services to high-end customers (Premium1, Private, Corporate and CIB)
1 Premium customers defined as customers with total financial assets between 100,000 and 500,000 €

MIL-6102SJ -18022020-123184/DF
13
Further de-risk loan portfolio: digitization of underwriting processes and new
operating model for early delinquency
Key strategic initiatives
A
1 Gross flows of loans from performing loans to non-performing exposures / initial stock of gross performing loans
New operating model
for early delinquency
▪ Optimization of early delinquency management
through investments in early warning systems and
Advanced Analytics
▪ Strengthening of the Retail early delinquency
process with centralized management of the
position right from the first credit anomaly
Enhanced credit
control through
digitization/ automation
of underwriting
processes
▪ Maintain a low risk portfolio through accurate
credit selection, in line with current strategies
▪ Digitization and automation of credit
underwriting, leveraging on Artificial Intelligence,
Robotics, Intelligent Optical Character Reader
▪ Streamlining of credit underwriting processes,
through “fast tracks”, modular credit proposal and
dynamic credit approval
Target 2022
Default rate1, %
2019
1.1
2022
1.0
High-risk performing loans, % of total performing loans, mgmt accounts
8.4
2012 2019
2.9

MIL-6102SJ -18022020-123184/DF
14
Further de-risk loan portfolio: enhancement of NPE recoveryA
Target 2022
6.84.5
Cost of risk, bps
8746
20222019
NPE stock (gross), € bln
7.8 5.2NPE ratio
(gross), %Decrease
obtained without
the need of
additional whole-
sale disposals
(but including in
2020 SME sale
initiated in 2019)
Enhancement of
NPE recovery
Key strategic initiatives
Recovery rate1, %
11.911.7▪ Further improvement of NPE
recovery and end-to-end NPE
management, leveraging on an
excellent in-house credit recovery
platform
2008 Centralization of bad loan
recovery
2017Centralization of UTP
management
2020 Centralization of "high risk"
and past-due clients
▪ Acceleration of NPE reduction
through NPE campaigns and
enhanced NPE tools, systems, and
reporting
Dedicated
FTE
170
270
50
4901 Cash in and back to performing

MIL-6102SJ -18022020-123184/DF
15
Transform Retail business model towards lower cost-to-serve and better service
quality: an omnichannel business model
B
Target 2022
Physical Retail business: cashiers and commercial,
partially redeployed, FTE
4,0805,960
Branches, #, %
82%
18%40%
60%
1,5401,365
-175
Key strategic initiatives
Superior delivery
and leverage on
customer analytics
▪ Strengthened product offer (e.g., in bancassurance,
instalment loans, etc.) and online delivery
▪ Real-time targeting and customer insights through
further development of advanced analytics
Digital and omni-
channel business
model
▪ Digitization and automation of decision making, both
commercial (e.g., Instant Lending) and non-commercial
(e.g., controls)4
▪ New customer journeys (over 20 already active in
2019) on the omnichannel commercial engagement
machine, already operational
▪ Transaction migration to digital channels (one third of
branch transactions) further improving digital ratio
Branch footprint
optimization
▪ Branch footprint optimization (-175 branches)
▪ Further branch format roll-out and technological
improvements with 35% reduction of full-cash
branches. Over 40% of branches (largest) totally
refurbished by 2022
Digitally-enabled-branches1 Full-cash-branches
Transaction migration to digital channels2, %
80 87
1 Cash-less and cash-light branches 2 Digital ratio, calculated as # digitally enabled operations executed over the year via direct digital channels (i.e., ATM, internet and mobile) / # digitally enabled operations
executed over the year (digitally enabled, i.e., available on direct channels). For individuals, it includes withdrawals (<€500), payments, bank transfers, other operations (e.g., MAV)
3 Operating cost of Households and Individuals segment, including attribution of corporate center costs 4 Also refer to page 19 for commercial and non-commercial digital processes
77 in
2018
550 cash-less
and cash-light
branches
Operating cost reduction in Retail Business3, € mln
999 884
20222019

MIL-6102SJ -18022020-123184/DF
16
Transform Retail business model towards lower cost-to-serve and better service
quality: consolidate domestic leadership in specialized retail financing and
enhance the relationship with Small Business customers
B
Target 2022 Key strategic initiatives
Pre-approved number of Small Business customers, %
>30
~0
New personal loans production, € mln
New Prestitalia production (CQS and CQP)1, € mln
1 CQS: salary backed loans; CQP: pension backed loans
New SB customers (gross), ‘000
~27
2019 2022
>40
819 >1,000
~560 >600
Digitization of
customer
acquisition
▪ Non captive consumer credit offer linked to payment
partnerships
▪ Salary backed and pension backed loans digitization
(CQS and CQP)
▪ Dedicated youth offer and mobile onboarding
Improved SB
customer coverage
▪ Dedicated Remote RM for Small Business
customers
▪ New business development of Small Business
customers through advanced analytics
Enhanced
acquisition and
retention of SB
clients
▪ Strengthened network of developers for Small
Business customers (including business developers,
partnerships best of the breed platforms to target new
customers, e.g., Atoka)
▪ Digital onboarding of new customers, also through
instant lending processes

MIL-6102SJ -18022020-123184/DF
17
Invest in superior services to high-end customers: Premium and PrivateC
Target 2022 Key strategic initiatives
Strengthened
service model
Digitization of
investment
advisory
▪ New advanced advisory with "fee only" and "fee on top" service
model in roll-out during 2020
▪ Staff training: financial advisor certification to be offered to all
Premium Relationship Managers
▪ New Wealth Advisory service for Premium Relationship
Managers leveraging on consolidated experience in Private
Banking
▪ Further growth of IW Bank financial advisors network (net
acquisition based on "open platform" model)
▪ Advanced Analytics and account aggregation services for
SOW development
Integrated
product offer
▪ Strengthened product offer for Private (e.g., Lombard lending,
attraction of off-shore assets, new products for structured finance
and with focus on sustainability)
▪ Top Private large client team with Family Office and Asset
Protection services
▪ Enhancement of ESG offer in the Asset Management factory
Total financial assets (TFA)1, € bln
~101 ~108
Financial advisors in IW Bank3, #
~690 ~830
Return on assets4, bps
1 Total assets (i.e., direct and indirect) of Premium and Private customers; it does not include TFA of IW Bank. No assumptions on performance effects
2 AUM and insurance assets 3 "Promotori" in IW Bank 4 ROA calculated on assets and loans of Top Private segment
49 54
Share of qualified TFA2, %
54% 59%
Premium RMs with financial advisor certification, #
200
850
2019 2022
MIL-6102SJ -18022020-123184/DF
18
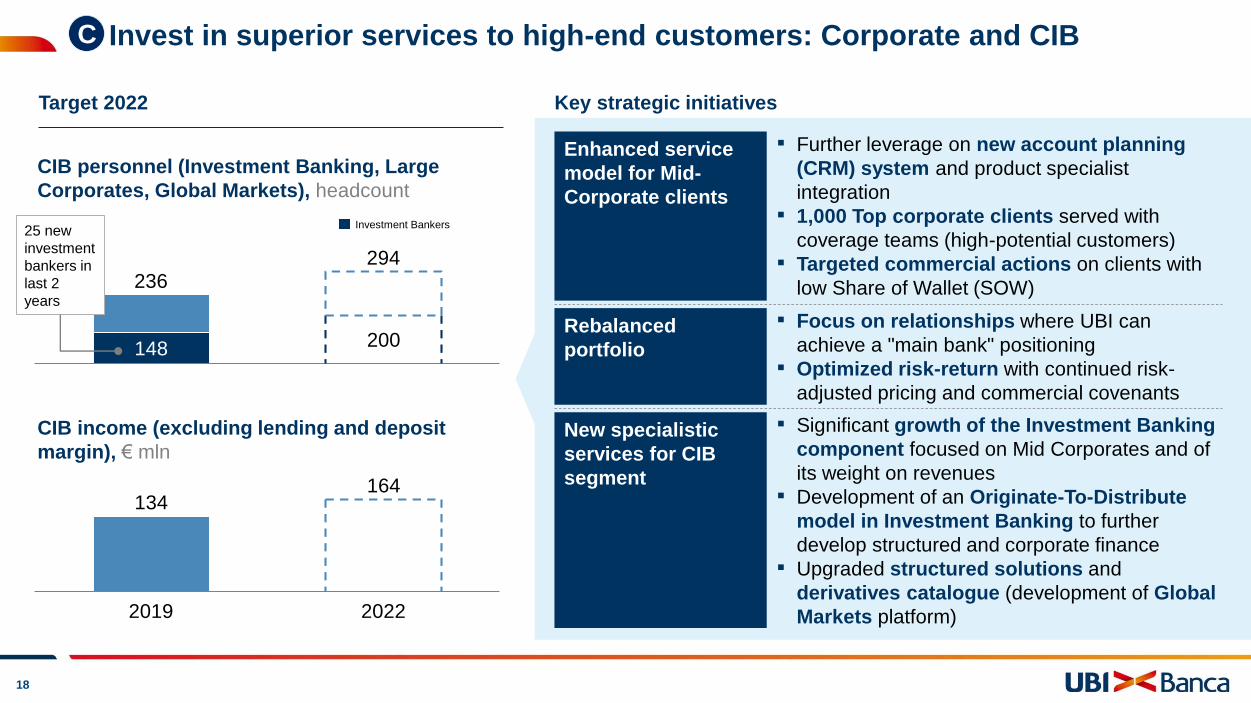
Invest in superior services to high-end customers: Corporate and CIBC
Key strategic initiatives
New specialistic
services for CIB
segment
▪ Significant growth of the Investment Banking
component focused on Mid Corporates and of
its weight on revenues
▪ Development of an Originate-To-Distribute
model in Investment Banking to further
develop structured and corporate finance
▪ Upgraded structured solutions and
derivatives catalogue (development of Global
Markets platform)
Rebalanced
portfolio
▪ Focus on relationships where UBI can
achieve a "main bank" positioning
▪ Optimized risk-return with continued risk-
adjusted pricing and commercial covenants
Enhanced service
model for Mid-
Corporate clients
▪ Further leverage on new account planning
(CRM) system and product specialist
integration
▪ 1,000 Top corporate clients served with
coverage teams (high-potential customers)
▪ Targeted commercial actions on clients with
low Share of Wallet (SOW)
Target 2022
CIB personnel (Investment Banking, Large
Corporates, Global Markets), headcount
148 200
294236
CIB income (excluding lending and deposit
margin), € mln
25 new
investment
bankers in
last 2
years
Investment Bankers
134164
2019 2022

MIL-6102SJ -18022020-123184/DF
19
Data and Analytics to support the transformation of the business modelD
New Digital,
Advanced
Analytics, and
Innovation
teams, strengthening
existing partnerships
with selected Fintech
and Universities
Commercial
Non-
commercial
Commercial
and non
commercial
processes
enhanced
through big
data &
Advanced
Analytics
▪ Targeting and customer insights through
behavioural analytics
▪ Extension of digital credit processes with
instant lending and automatic resolution
▪ Implementation of Robo4Advisory in
Wealth Management
▪ Client acquisition and retention
improvements through predictive modelling
▪ Data driven pricing model
▪ Automation of compliance and audit
controls
▪ Digitization of finance processes
▪ Anti-Money-Laundering (AML)
transaction monitoring assisted with
analytics
▪ Know-Your-Customer
▪ Advanced early-warning systems
MIL-6102SJ -18022020-123184/DF
20
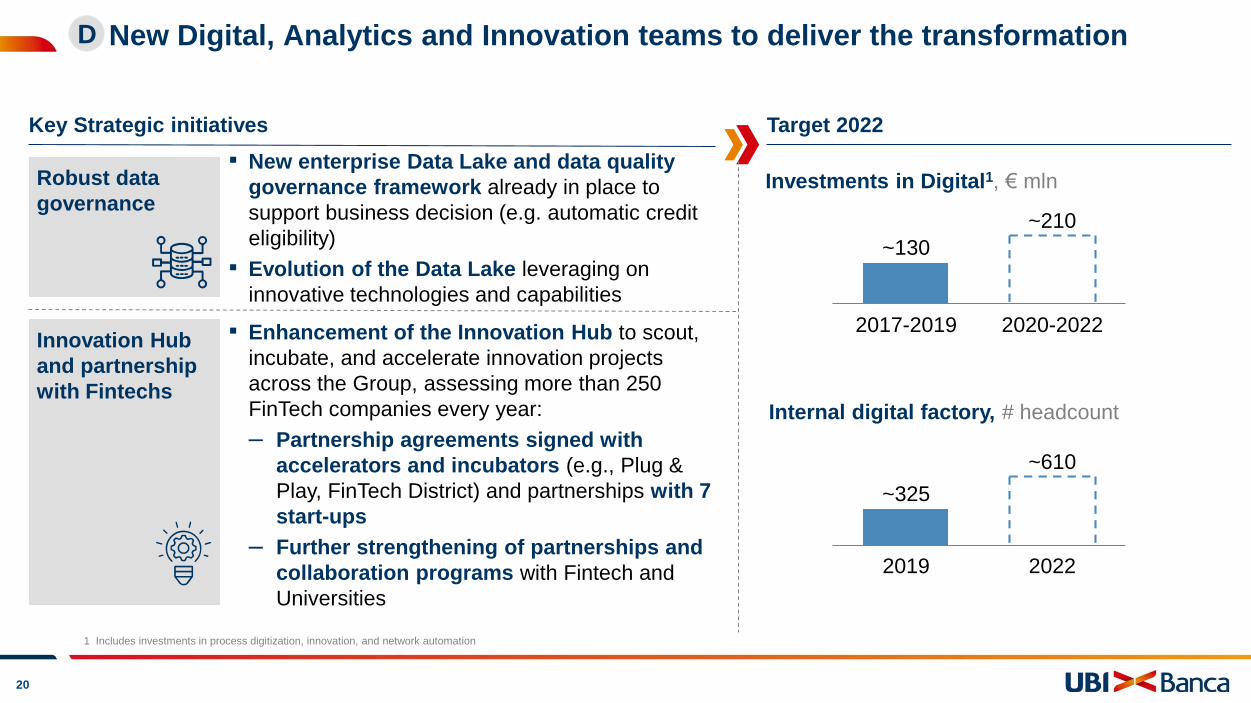
New Digital, Analytics and Innovation teams to deliver the transformation
Key Strategic initiatives
D
Target 2022
Robust data
governance
Innovation Hub
and partnership
with Fintechs
▪ New enterprise Data Lake and data quality
governance framework already in place to
support business decision (e.g. automatic credit
eligibility)
▪ Evolution of the Data Lake leveraging on
innovative technologies and capabilities
▪ Enhancement of the Innovation Hub to scout,
incubate, and accelerate innovation projects
across the Group, assessing more than 250
FinTech companies every year:
– Partnership agreements signed with
accelerators and incubators (e.g., Plug &
Play, FinTech District) and partnerships with 7
start-ups
– Further strengthening of partnerships and
collaboration programs with Fintech and
Universities
20222019
~325
~610
~130
2017-2019 2020-2022
~210
Investments in Digital1, € mln
Internal digital factory, # headcount
1 Includes investments in process digitization, innovation, and network automation

MIL-6102SJ -18022020-123184/DF
21
Organize-to-innovate: increasing the capacity to deliver sustainable changeE
Up/Re-skilling factory to
cultivate new talents, ensure
internal workforce rotation and
foster a new "Agile" way of working
Enhancement of
human capital to promote
employees’ growth, well-being,
and health
Dedicated
sustainability team to ensure deployment of new
sustainability themes across
the organization
Organize-to-
innovate
E3E4
Upgrade of the IT factory through investments in cloud,
cybersecurity, and next-generation
IT processes
E1 E2
MIL-6102SJ -18022020-123184/DF
22
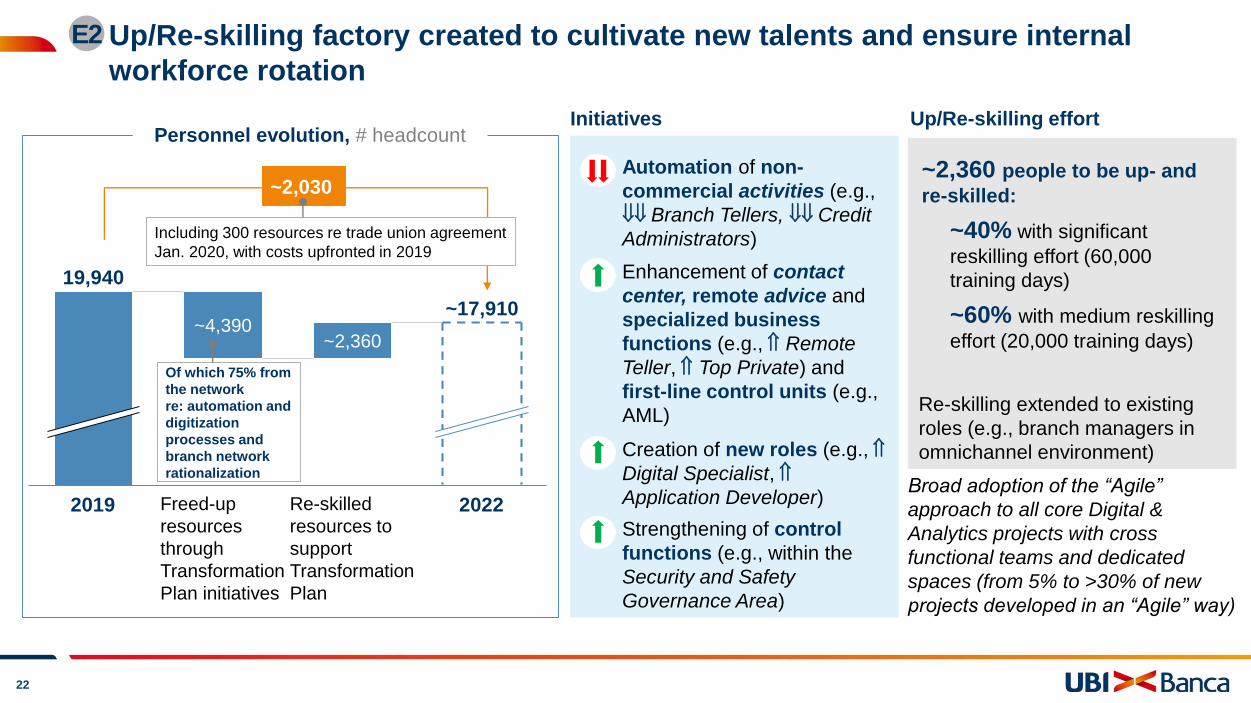
Up/Re-skilling factory created to cultivate new talents and ensure internal
workforce rotation
E2
Personnel evolution, # headcount
~2,360~4,390
2019 Freed-up
resources
through
Transformation
Plan initiatives
Re-skilled
resources to
support
Transformation
Plan
2022
19,940
~17,910
~2,030
Enhancement of contact
center, remote advice and
specialized business
functions (e.g., Remote
Teller, Top Private) and
first-line control units (e.g.,
AML)
Automation of non-
commercial activities (e.g.,
Branch Tellers, Credit
Administrators)
Creation of new roles (e.g.,
Digital Specialist,
Application Developer)
Strengthening of control
functions (e.g., within the
Security and Safety
Governance Area)
Initiatives Up/Re-skilling effort
~2,360 people to be up- and
re-skilled:
~40% with significant
reskilling effort (60,000
training days)
~60% with medium reskilling
effort (20,000 training days)
Broad adoption of the “Agile”
approach to all core Digital &
Analytics projects with cross
functional teams and dedicated
spaces (from 5% to >30% of new
projects developed in an “Agile” way)
Of which 75% from
the network
re: automation and
digitization
processes and
branch network
rationalization
Re-skilling extended to existing
roles (e.g., branch managers in
omnichannel environment)
Including 300 resources re trade union agreement
Jan. 2020, with costs upfronted in 2019
MIL-6102SJ -18022020-123184/DF
23
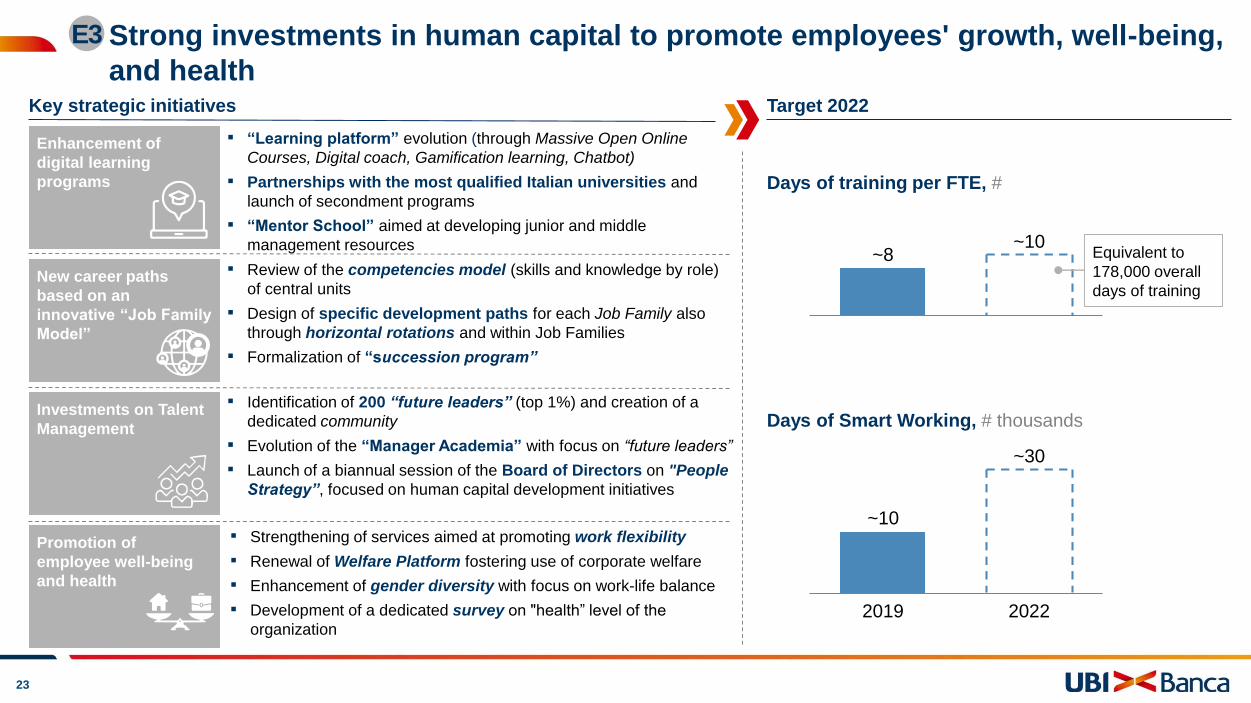
Strong investments in human capital to promote employees' growth, well-being,
and health
E3
Key strategic initiatives Target 2022
▪ “Learning platform” evolution (through Massive Open Online
Courses, Digital coach, Gamification learning, Chatbot)
▪ Partnerships with the most qualified Italian universities and
launch of secondment programs
▪ “Mentor School” aimed at developing junior and middle
management resources
Enhancement of
digital learning
programs
New career paths
based on an
innovative “Job Family
Model”
Investments on Talent
Management
Promotion of
employee well-being
and health
▪ Identification of 200 “future leaders” (top 1%) and creation of a
dedicated community
▪ Evolution of the “Manager Academia” with focus on “future leaders”
▪ Launch of a biannual session of the Board of Directors on "People
Strategy”, focused on human capital development initiatives
Days of training per FTE, #
~8~10
Days of Smart Working, # thousands
~30
2019 2022
~10
▪ Review of the competencies model (skills and knowledge by role)
of central units
▪ Design of specific development paths for each Job Family also
through horizontal rotations and within Job Families
▪ Formalization of “succession program”
▪ Strengthening of services aimed at promoting work flexibility
▪ Renewal of Welfare Platform fostering use of corporate welfare
▪ Enhancement of gender diversity with focus on work-life balance
▪ Development of a dedicated survey on "health” level of the
organization
Equivalent to
178,000 overall
days of training

MIL-6102SJ -18022020-123184/DF
24
Dedicated sustainability team to ensure deployment of new sustainability
themes across the organization
E4
CSO >10%€1.5 bln
€2 bln O2 -61%
55,000 +20% >25%
Variable remuneration
linked to sustainability
goals for top
management
Chief Sustainability Officer
to coordinate Group-level
sustainability efforts (2020)
Lending linked to
sustainability
development in Italy
in the next 3 years
New social and green
bonds issued
Complete "green"
product catalogue
(current account,
mortgage, credit card,
personal loan,
investment products)
CO2 emissions1
Beneficiaries of financial
education programs
delivered to the
community
Increase in the share of
women in managerial
roles
Of Pramerica UCI AUM
in ESG strategies
1 Scope 1 and Scope 2 market based vs 2007
Target 2022

MIL-6102SJ -18022020-123184/DF
25
Cost evolution: -5% in operating costs, including the costs to self-fund the
Transformation Plan (approx. -10% excluding Transformation costs)€ millions
Operating costs
20191
~230
~115
Operating costs
20221
Total pre-transfor-
mation plan
Cost reduction
New investments/
costs (year 2022
P&L impact –
Other adm. exp.
and D&A)
2,350
2,120
2,235
-5%
▪ Exit of ∼ 2,000 resources
▪ Real estate initiatives, mainly related to:
– Rationalization and consolidation of executive
headquarters and offices
– Closure and rationalization of branches’
buildings (175 branches closed over the
next 3 years)
– Sale of non operational real estate
– Energy management
▪ Efficiencies mainly driven by IT optimization
initiatives (i.e., systems upgrading, cloud adoption,
software defined solutions, IT processes
industrialization)
▪ Cost reduction mainly driven by:
– Other admin. expenses optimization and zero-
based budgeting
– Insourcing of activities currently outsourced
– Initiatives for containment of current expenses
▪ Increased contribution to Resolution Fund and
Deposit Guarantee Scheme
1 Net of non-recurring items; 2022 does not include any non-recurring items 2 Resolution Fund and Deposit Guarantee Scheme
3 Yearly drop in other admin. expenses and D&A compared to 2019 IT expense
RF and DGS2
Contributions
~5%
~19%
~16%3
~26%
~11%
Personnel
costs
Real Estate
cost
Running IT
cost
Other
administrative
expenses and
D&A

MIL-6102SJ -18022020-123184/DF
26
Technology and efficiency: evolution of IT costs aimed at “changing” the Bank
2017-2019 (net of
extraordinary costs)
~6101
2020-2022
~520
+17.1%
Cumulated IT investments
€ mln
Initiatives Overview
Transformation
plan
Regulatory &
other projects
▪ Projects related to regulation and requests
from supervisor over Plan horizon
▪ Continued investments on ongoing projects (e.g., product development)
▪ Distribution Network evolution (e.g., branches
plan, technological refresh)
▪ Business and digitization initiatives (e.g.,
development of advanced customer insight
capabilities, digital lending, Robo4Advisory,
development of global markets platform, optimisation
of pricing governance)
▪ Credit area (e.g., credit process digitization,
enhancement of NPE recovery capabilities)
▪ IT upgrade (e.g., cloud transformation, cyber
security investments, core banking modernisation,
software defined solutions)
▪ Human capital development and re-skilling
1 Of which ~€170 mln other admin. expenses and ~€440 mln investments
~60%
~40%

MIL-6102SJ -18022020-123184/DF
27
Shift of IT spending from "Run the Bank" to "Change the Bank"
“Changethe Bank”
Other adm. exp.,
D&A and staff cost
“Runthe Bank”
Other adm. exp. and
staff cost
35 42 4082
139 143
1731
116
1982 207 209
240
Other administrative expenses, D&A and staff cost, € millions
175 167
206 198
165
2015 2016
753
20173 2018 20222019
240
1 Including €40 mln of corporate operations relating to the Single Bank project
2 Including €72 mln of corporate operations relating to the acquisition of the 3 banks in central Italy
3 Pro-forma to include banks acquired in April 2017
Regulatory
Innovation and business
development
Corporate operations
Technological refresh
and evolution
Software management
Hardware management
Info providers
Telecommunications

MIL-6102SJ -18022020-123184/DF
28
Defined positive impacts on capital in 2020,
included in the plan:
– Real estate at fair value (+32 bps on CET1
ratio)
– Reorganization of the Group’s presence in
Milan
– Renegotiation of securities services
agreement
Capital “buffers”, not included in the plan,
e.g.:
– Bancassurance
– Zhong Ou stake (currently recognized at the
book value of €40.5 million)
– Etc.
Robust balance sheet structure
Structural balance and flexibility: a responsive business model and capital
buffers
F
Business flexibility Capital & liquidityF2F1
Capital allocation measures (eg., corporate bond
investments could shift to corporate loans, always
in full respect of the risk-reward profile set by UBI)
New and scalable business processes and
tools (e.g., cloud, digital, omnichannel), allowing
flexibility according to change in customer needs
Significant pool of resources re-skilled, to
ensure responsiveness to market demand
evolution
Financial Assets portfolio distribution allowing
for a lower exposure to Italian BTP (from 51% to
37% in 2022) and diversified investment
opportunities (e.g., corporate bonds)
MIL-6102SJ -18022020-123184/DF
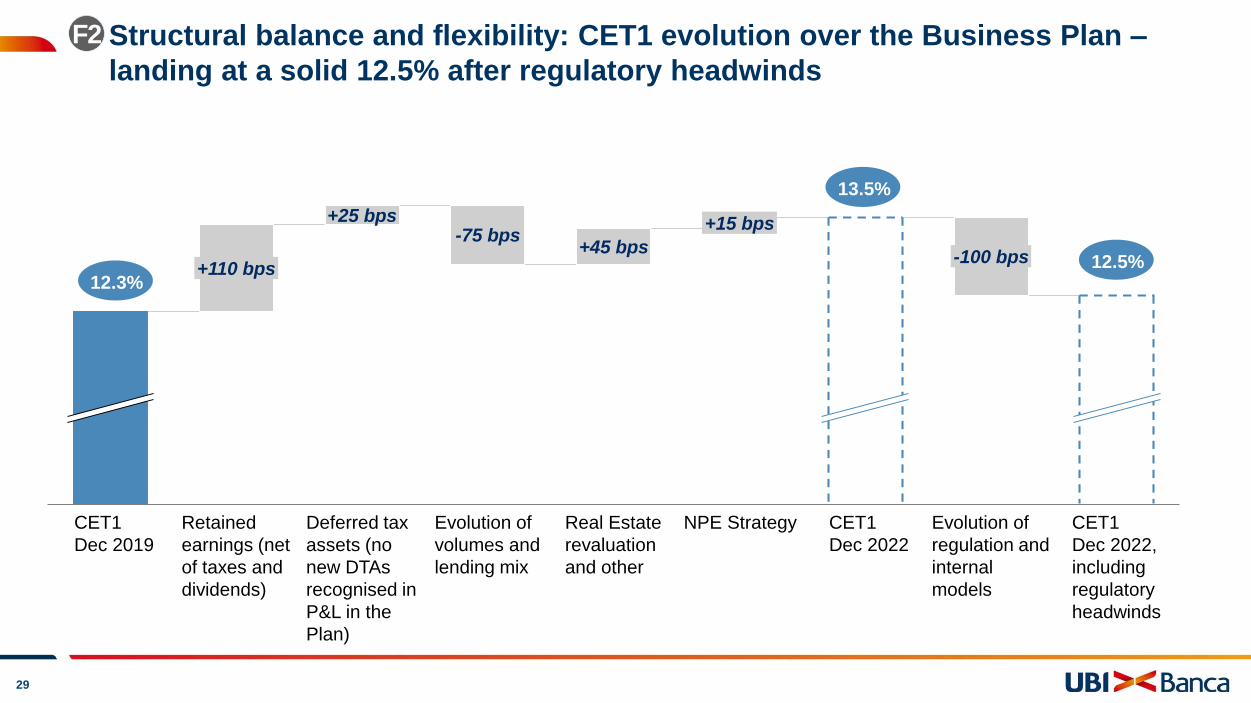
29
Evolution of
regulation and
internal
models
Deferred tax
assets (no
new DTAs
recognised in
P&L in the
Plan)
+15 bps
CET1
Dec 2019
-100 bps
CET1
Dec 2022,
including
regulatory
headwinds
+45 bps
Evolution of
volumes and
lending mix
-75 bps+25 bps
Retained
earnings (net
of taxes and
dividends)
+110 bps
NPE Strategy CET1
Dec 2022
Real Estate
revaluation
and other
12.3%12.5%
13.5%
Structural balance and flexibility: CET1 evolution over the Business Plan –
landing at a solid 12.5% after regulatory headwinds
F2

MIL-6102SJ -18022020-123184/DF
30
Regulation and internal
model evolution
EBA guidelines
Basel IV
Total Regulatory
Headwinds impact
Cumulated
2020-2022
-0.2
-0.5
-0.3
-1.0
CET1 MDA Buffer, bps
CET1 Ratio MDA trigger, %
CET1 Ratio, % year-end
On average >330 bps
9.25%
2020
-0.1
-0.2
-
-0.3
2021
0.2
-0.3
-
-0.1
2022
-0.3
-0.0
-0.3
-0.6
>12.5%
Structural balance and flexibility: details on regulatory headwindsF2
Impacts on
the CET1
Ratio
Preliminary
Pillar 2 impact SREP + Addendum +
Calendar provisioning-0.3
MDA: Maximum Distributable Amount

MIL-6102SJ -18022020-123184/DF
31
Structural balance and flexibility: confirmation of balance sheet equilibrium
CET1 Ratio – Average buffer on MDA1
trigger, bps
>260>330
2017-2019 2020-2022
LCR2 – Liquidity Buffer – Average
buffer on minimum requirement, € bln
>5>6
2017-2019 2020-2022
Total Capital Ratio – Average buffer on
MDA1 trigger, bps
>180
>350
2017-2019 2020-2022
NSFR3 - Available stable funding –
Average buffer on minimum requirement
net of TLTRO4 contribution, € bln
>3
2020-20222017-2019
~7
Leverage Ratio – Average buffer on
expected minimum requirement, bps
>240>300
2017-2019 2020-2022
MREL5 and minimum subordination
requirement
2017-2019 2020-2022
Binding starting from June 2020
Well above the two
expected minimum
requirements since
2019
Well above the two
minimum requirements
over the business plan
horizon and still
compliant also excluding
eligible retail funding
1 Maximum Distributable Amount 2 Liquidity Coverage Ratio 3 Net Stable Funding Ratio 4 Targeted long-term refinancing operations
5 Minimum Requirement for own funds and Eligible Liabilities
F2

MIL-6102SJ -18022020-123184/DF
32
Agenda
UBI 2022: a clear direction towards the future
based on further de-risking, digitally-enabled cost
reduction, and revenue protection
UBI 2022: a value creation plan based on a solid
trajectory already started in 2019
Closing remarks: a realistic plan
based on conservative assumptions

MIL-6102SJ -18022020-123184/DF
33
Significant value creation to shareholders over the next three years
1 Includes direct and indirect funding, excludes repos with CCG 2 Excludes repos with CCG 3 Excluding systemic contributions
4 Net NPE ratio: 5% in 2019 and 3.1% in 2022 5. Net equity excluding profit – intangible assets
3-years CAGR, %
Balanced revenue mix
Continued cost reduction
Lower cost of credit
Significant value creation
for shareholders
Stronger capital
and structural position
%
%
%
€ mln
€ mln -19.3%
bps
%
€ mln -1.9%
€ mln -1.9%
2022
12.5
32.6
8.3
665 (665)
387
46
5.2
-2,136
-2,235
58.1%
2019
12.3
55.6
4.7
251 (353)
738
87
7.8
% 47.645.7
% 45.747.4
€ bln +2.2%209196
€ mln +0.3%3,6753,638
€ bln 83.783.7
-2,261
-2,368
62.1
€ bln 81.079.5
• Average pay out ratio over the 3
year plan of 40% of net profit
well balanced with the
maintenance of a year-end
CET1 ratio of 12.5%
• In 2022 possible additional
dividend increase if CET1 ratio
>12.5%
9395€ bln
€ bln 8873
2018€ bln
% 51.550.9
€ mln
€ mln
-1,361
-517
-1,428
-603
€ bln 61,52758,053
€ bln
CET1 ratio
Texas ratio
ROTE normalised
Stated net income (normalised in brackets)
LLPs
Cost of risk
NPE ratio (gross) 4
Operating costs (net of systemic contributions)
Operating costs
o/w net commissions
o/w net interest income
Total financial assets (TFA1)
Operating income
Net loans to customers2
Cost/income (net of systemic contributions)
o/w direct banking funding
o/w AUM + bancassurance
o/w Institutional funding
o/w net performing loans
NPE coverage incl. write offs
o/w staff costs
o/w other administrative expenses3
RWA (fully loaded)
Tangible equity5 8,0567,498

MIL-6102SJ -18022020-123184/DF
34
Core foundations for the future
Enhancement
of human
capital, evolved
workforce skill-
set and
widespread
"agile" teams
Customer-
centric
omnichannel
experience
Efficient risk
management
and credit
processes
Updated and
scalable
technological
platform and
migration to
cloud
Sustainability and social responsibility at the core
Advanced
Analytics and
Big Data
Structural
solidity

MIL-6102SJ -18022020-123184/DF
35
A plan based on solid foundationsEvidences
Conservative
macroeconomic
scenario
▪ -0.44% Euribor 1M in 2022, with no
assumption of material improvement between
2020 and 2022
▪ 0.7% real GDP growth in 2022, vs
consensus of 0.9%
Realistic business
assumptions
▪ Revenue growth: +0.3% CAGR 2019-2022
▪ Gross NPE ratio already improved by 2.6
p.p. 2019 vs 2018
Foundation for
2022 business plan
▪ ~€130 million already invested in
digitization and Advanced Analytics
between 2017 and 2019
▪ -5% branches in 2019 vs. 2018, with an
increase of ~55% of digitally enabled ones
▪ Redundancy plan already ongoing, with
additional €70 million gross expenditure
sustained in 2019 for 300 FTEs to exit in
20201
▪ Cost of disposal of ~€800 million of SMEs
bad loans partially sustained in 2019 (pro-
forma gross NPE ratio 6.9%)
▪ Previous business plan targets under
management control achieved in 2019
Proven track record
of delivery
1,5403 1,652
2019
-7%2,368
2019
2,445-3.1%
56
2019
~87
-31 p.p.
2019
7.811.9
-4.1 p.p.
1 Over 300 further exits announced in January 2020 and already partially included in 2019 cost base 2 Update of UBI Business Plan to include the 3 Bridge Banks acquired, 11 May 2017
3 Includes closure of 12 branches decided in 2019 and planned for early 2020
NPE ratio (gross), %
Operating costs, € mln Branches, #
Texas ratio, %
Previous
BP target
2019
2019
12.3 12.3
CET1 ratio, %
Default rate, %
1.1~1.4
2019
-0.3 p.p.
2019 results vs. PREVIOUS BP2 targets
Previous
BP target
2019
Previous
BP target
2020
Previous
BP target
2020
Previous
BP target
2020
Previous
BP target
2020

MIL-6102SJ -18022020-123184/DF
36
Sensitivity to market rates
Prudence
level
Business
plan
scenario
Zero
interest rate
in 2022
2022
665Negative interest rates
at -0.44%
Improvement of interest
rates in 2022, with
Euribor 1M reaching
0.00%
Net profit, € mln
> +100

MIL-6102SJ -18022020-123184/DF
37
Disclaimer
This document has been prepared by Unione di Banche Italiane S.p.a. (“UBI Banca”) for informational purposes only and for use at the presentation of the Industrial
Plan of UBI Banca held on 17th February 2020. It is not permitted to publish, transmit or otherwise reproduce this document, in whole or in part, in any format, to any
third party without the express written consent of UBI Banca and it is not permitted to alter, manipulate, obscure or take out of context any information set out in the
document or provided to you in connection with the above mentioned presentation.
The information, opinions, estimates and forecasts contained herein have not been independently verified and are subject to change without notice. They have been
obtained from, or are based upon, sources we believe to be reliable but UBI Banca makes no representation (either expressed or implied) or warranty on their
completeness, timeliness or accuracy. Nothing contained in this document or expressed during the presentation constitutes financial, legal, tax or other advice, nor
should any investment or any other decision be solely based on this document.
This document does not constitute a solicitation, offer, invitation or recommendation to purchase, subscribe or sell any investment instruments, to effect any
transaction, or to conclude any legal act of any kind whatsoever.
This document contains statements that are forward-looking: such statements are based upon the current beliefs and expectations of UBI Banca and are subject to
significant risks and uncertainties. These risks and uncertainties, many of which are outside the control of UBI Banca, could cause the results of UBI Banca to differ
materially from those set forth in such forward looking statements.
Under no circumstances will UBI Banca or its affiliates, representatives, directors, officers and employees have any liability whatsoever (in negligence or otherwise)
for any loss or damage howsoever arising from any use of this document or its contents or otherwise arising in connection with the document or the above mentioned
presentation.
By receiving this document you agree to be bound by the foregoing limitations.
All forward-looking statements included in the document are based on information available to UBI Banca as at 17th February 2020.
UBI Banca undertakes no obligation to publicly update and / or revise forecasts and estimates following the availability of new information, future events or other
matters, without prejudice to compliance with applicable laws. All the forecasts and subsequent estimates, written and oral, attributable to UBI Banca or to persons
acting on its behalf are expressly qualified, in their entirety, by these cautionary statements.


