21
| Date post: | 31-Dec-2015 |
| Category: |
Documents |
| Upload: | ronan-pruitt |
| View: | 29 times |
| Download: | 1 times |

Next Big Q
How good are How good are you in you in making your making your goods… goods…
How good are How good are you in you in making your making your goods… goods…
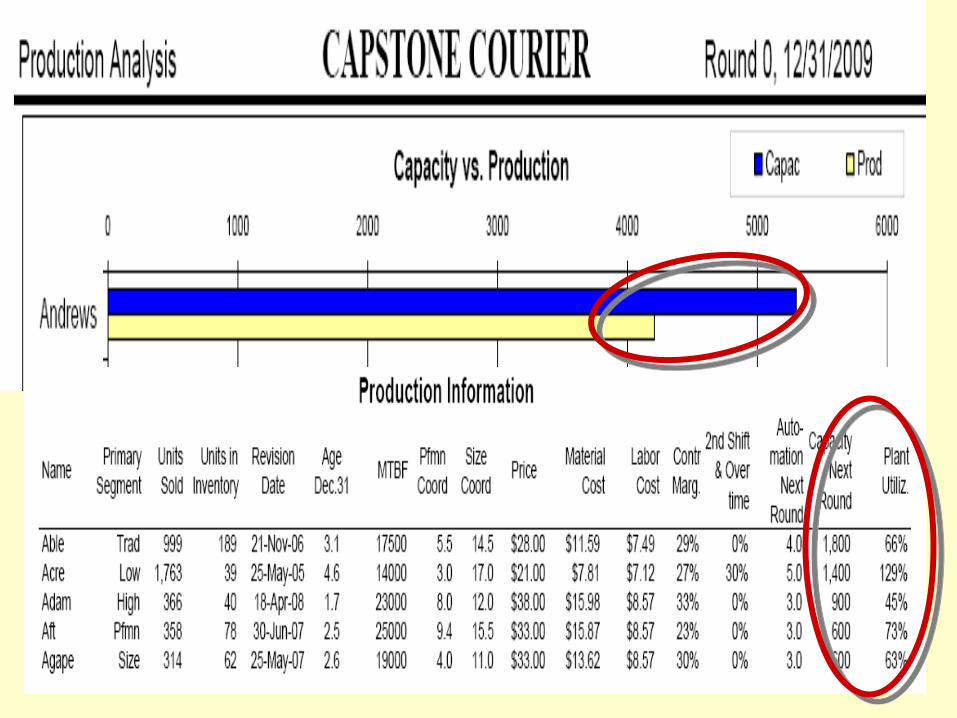

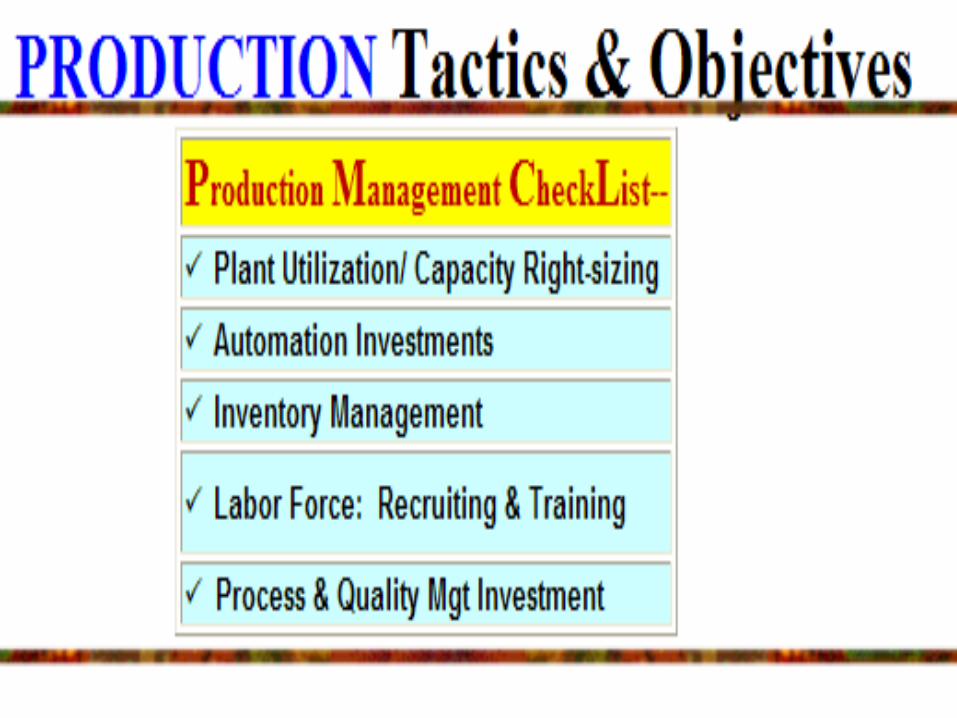
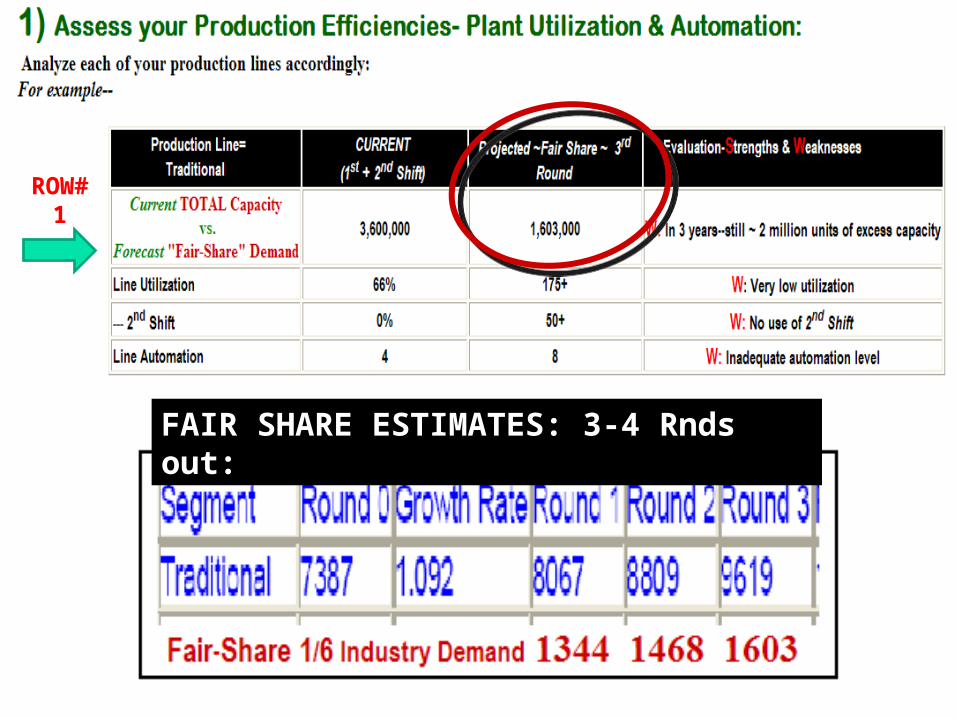
1) Assess your Production Efficiencies- Plant Utilization & Automation:
2) Assess your Company's HR & Labor Force Productivity:
3) Assess levels of automation on each of your production lines:

FAIR SHARE ESTIMATES: 3-4 Rnds out:
ROW#1
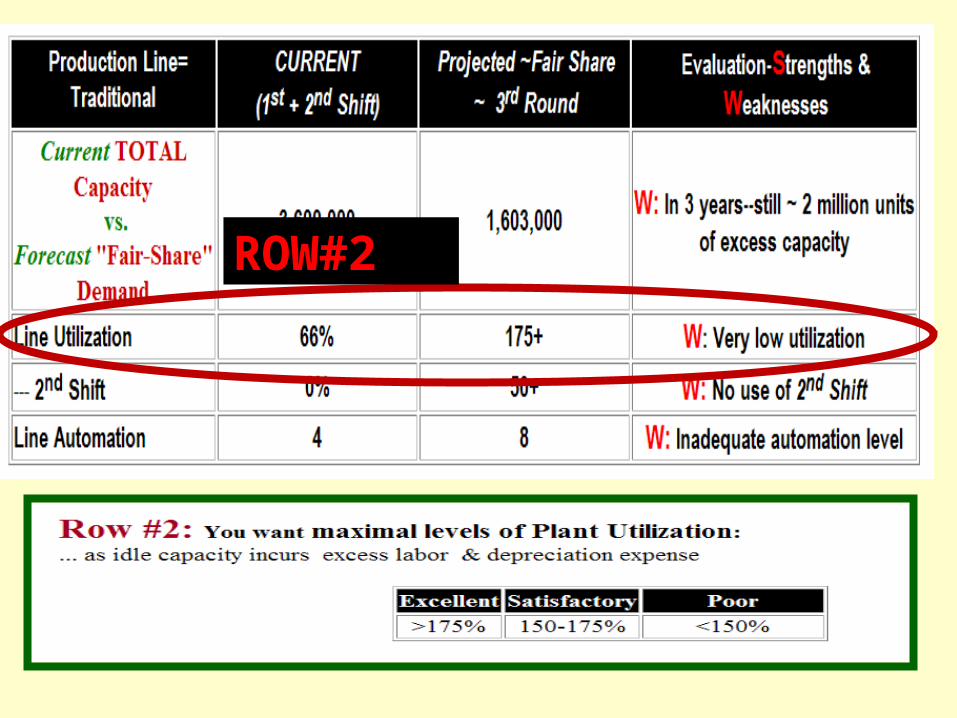
ROW#2

Utilize 2nd Shift?
ROW#3

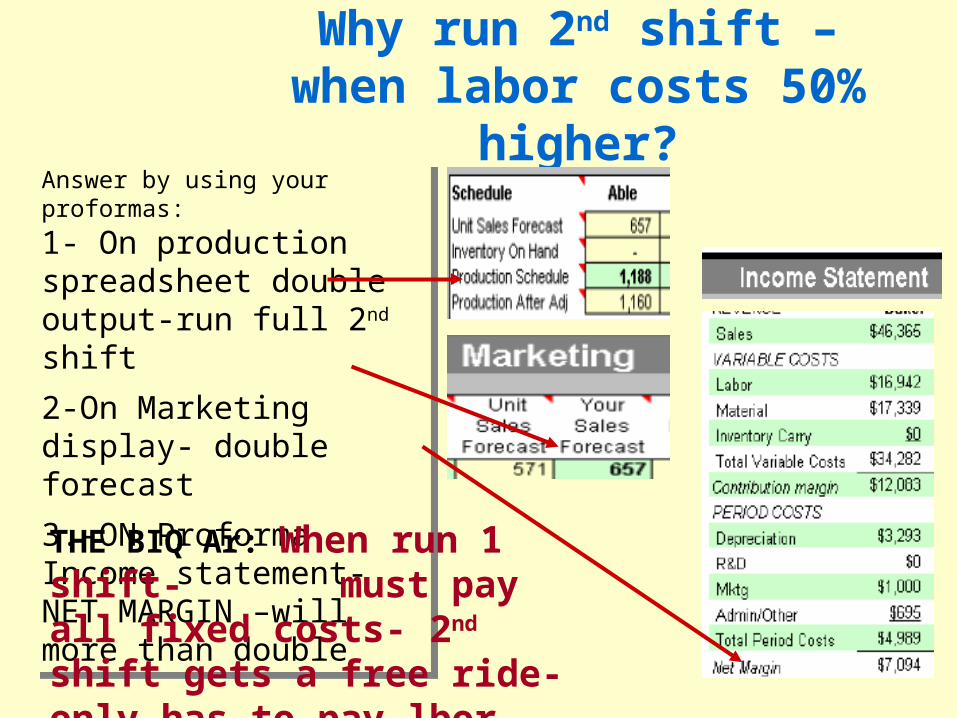
Why run 2nd shift –when labor costs 50% higher?

Why run 2nd shift –when labor costs 50% higher?
Answer by using your proformas:
1- On production spreadsheet build at capacity- if have 1000 units – build 1000 units
2-On Marketing display- FORECAST 1000 UNITS
3.-ON Proforma Income statement- note NET MARGIN –
Answer by using your proformas:
1- On production spreadsheet build at capacity- if have 1000 units – build 1000 units
2-On Marketing display- FORECAST 1000 UNITS
3.-ON Proforma Income statement- note NET MARGIN –
THE BIQ Q: If we double sales will we double our net margin?– Will we make less because labor costs are 50% higher for 2nd shift?
Why run 2nd shift –when labor costs 50% higher?
Answer by using your proformas:
1- On production spreadsheet double output-run full 2nd shift
2-On Marketing display- double forecast
3.-ON Proforma Income statement- NET MARGIN –will more than double
Answer by using your proformas:
1- On production spreadsheet double output-run full 2nd shift
2-On Marketing display- double forecast
3.-ON Proforma Income statement- NET MARGIN –will more than double
THE BIQ Ar: When run 1 shift- must pay all fixed costs- 2nd shift gets a free ride-only has to pay lbor premium…

Optimum Automation Levels?
Optimum Automation Levels?
ROW#4
FAIR SHARE ESTIMATES: 3-4 Rnds out:
ROW#1

S I M U L A T I O N
M A R K E T I N G M G T. A Historical Consideration…
RE: Projected Share
• LOW END: 0-1 product killed.. 0-1 repositioned or introduced
• TRADITIONAL: 3-6 repositioned from High…0-1 killed…1-2 introduced
• SIZE: 0-1 killed, 0-1 repositioned to Traditional, 1-2 introduced
• PERFORMANCE: 1-2 killed, 0-1 repositioned to Traditional, 0-1 introduced
• HIGH: 1-3 killed or repositioned to Traditional, 1-3 new products arrive in rounds 2 or 3

S I M U L A T I O N
M A R K E T I N G M G T. Round 3- Forecast Segment Competitive Density
• LOW END: 6 products=rivalry unchanged
• TRADITIONAL: 9 products, w/ 3 repositioned= increased competition
• SIZE: 7 products, w/ 2 new= increased competition
• PERFORMANCE: 4 products, w/ 1 new= reduced competition
• HIGH: 6 products, w/ 2 new= increased competition
66
99
77
44
66
S I M U L A T I O N
M A R K E T I N G M G T.
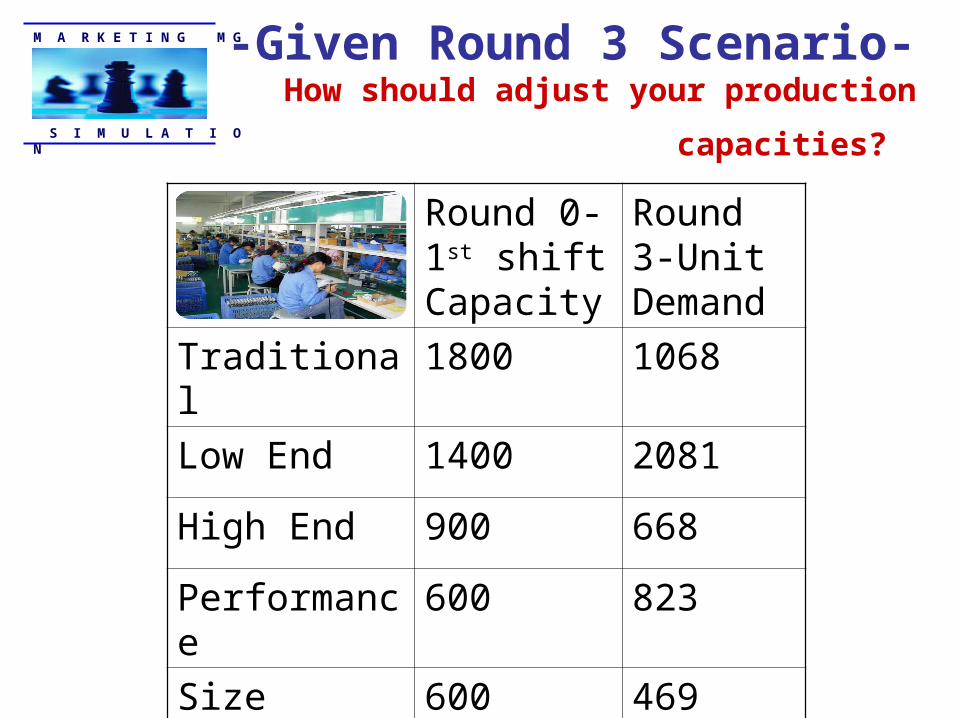
-Given Round 3 Scenario-How should adjust your production capacities?
Round 0-1st shift Capacity
Round 3-Unit Demand
Traditional 1800 1068
Low End 1400 2081
High End 900 668
Performance 600 823
Size 600 469
S I M U L A T I O N
M A R K E T I N G M G T.
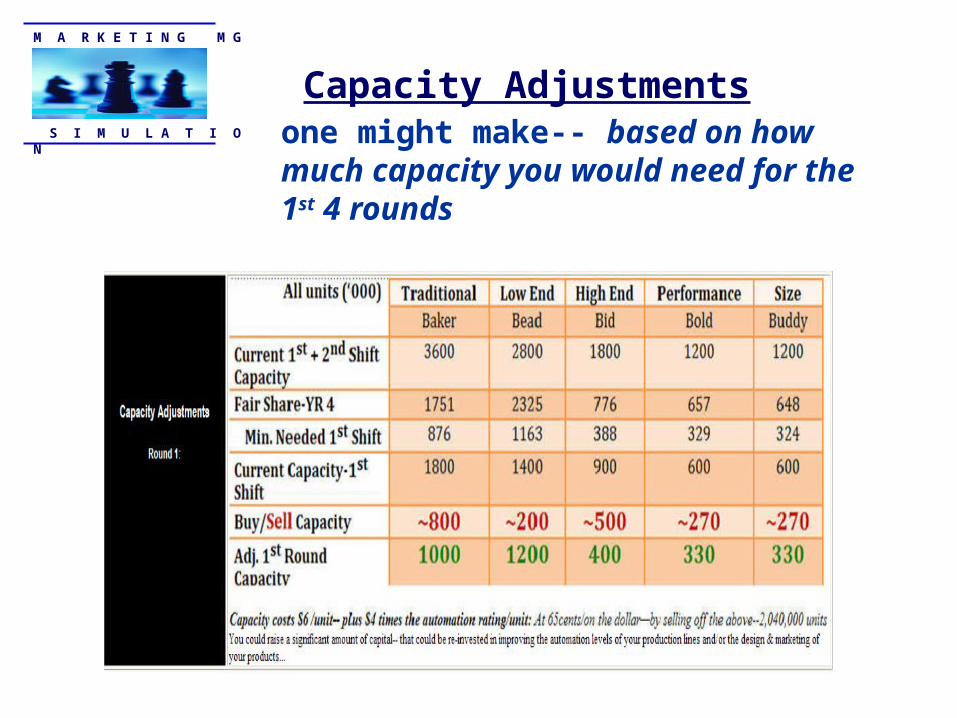
Capacity Adjustments one might make-- based on how much capacity you would need for the 1st 4 rounds

Evaluate Your Company’s
Production & HR

Worst Case:BIG INVENTORY/ no
cash– risk seeing Big Al Best case:
Lots of CASH / no Inventory -you risk stockout
How Big is your Slinky?

Determining A Reasonable Spread
Want to avoid generating an ultra Conservative Worst case scenario …matched w/ an ultra Optimistic Best case scenario
Should be able to sell excess inventory
in ~betw. 6 & 16 weeks

Take your total inventory costs
$23,900M
Take your total inventory costs
$23,900M
How to measure your slinky slack--

& Divide by total variable costs of inventory sold:
$23,900M/$131,119M =.18
52weeks *.18 = 9
Risk ~9weeks of Inventory to avoid
stockout
& Divide by total variable costs of inventory sold:
$23,900M/$131,119M =.18
52weeks *.18 = 9
Risk ~9weeks of Inventory to avoid
stockout