A Comparative Analysis of Financial Performance of Nepal SBI Bank Limited, Himalayan Bank Limited and Kumari Bank Limited By: Sushma Rai Post Graduate Campus Faculty of Management T.U. Registration No.: 7-2-218-286-2002 A Thesis Submitted To: Office of the Dean Faculty of Management Tribhuvan University In partial fulfillment of the requirements of the degree of Masters of Business Studies (M.B.S.) Biratnagar, Nepal August, 2009
Transcript
A Comparative Analysis of Financial
Performance of Nepal SBI Bank Limited,
Himalayan Bank Limited and Kumari Bank Limited
By:
Sushma Rai
Post Graduate Campus Faculty of Management
T.U. Registration No.: 7-2-218-286-2002
A Thesis Submitted To:
Office of the Dean Faculty of Management
Tribhuvan University
In partial fulfillment of the requirements of the degree of
Masters of Business Studies (M.B.S.)
Biratnagar, Nepal
August, 2009
TRIBHUVAN UNIVERSITY Faculty of Management
POST GRADUATE CAMPUS
Biratnagar, Nepal
Tel No. 021-526327
Ref. No.:
RECOMMENDATION
This is to certify that the thesis:
Submitted by
Sushma Rai
Entitled
A Comparative Analysis of Financial performance of
Nepal SBI Bank Limited, Himalayan Bank Limited
And Kumari Bank Limited
has been prepared as approved by this Department in the prescribed format of
Faculty of Management. This thesis is forwarded for examination.
Supervisor Head of Department
(Prof. Dr. Khagendra Acharya) (Prof. Dr. Madhav Bahadur Shrestha)
We have conducted the Viva-Voce examination of the thesis presented by
Sushma Rai
entitled
A Comparative Analysis of Financial Performance of
Nepal SBI Bank Limited, Himalayan Bank Limited
and Kumari Bank Limited
and found the thesis to be the original work of the student and written
according to the prescribed format. We recommend the thesis to
be accepted as partial fulfillment the requirement for
Master's Degree in Business Studies (M.B.S.)
Viva-Voce Committee Chairperson, Research Committee: .........................................
Member (Thesis Supervisor): .........................................
(Prof. Dr. Khagendra Acharya)
Member (External Expert): .........................................
Date: ...............................
ACKNOWLEDGEMENT
This research has been prepared for the partial fulfillment of requirements of the
degree of master in business studies, on the topic "A Comparative Analysis of
Financial Performance of Nepal SBI Bank Limited, Himalayan Bank Limited and
Kumari Bank Limited. This study shows the comparative financial position of NSBI,
HBL and KBL. The major objectives of this study are to examine, analyze and
interpret financial performance, identify financial strength and weakness and
mobilization of fund.
First of all, I would like to express my sincere gratitude to Prof. Dr. Khagendra
Acharya, Supervisor of this thesis, for his valuable suggestion, constant
encouragement, adequate support, patient guidance, co-operation and regular
supervision to complete this research study. Similarly, I would like to give sincere
thanks to Prof. Dr. Madhav Bahadur Shrestha, Head of the research department, Post
Graduate Campus, Biratnagar. I am indebted to Campus Chief Mr. Harihar Bhandari.
I am extremely thankful to all the staff and members of this campus, who directly and
indirectly assisted me for the completion of this research work. Likewise, personnel of
Nepal SBI Bank Limited, Himalaya Bank Limited and Kumari Bank Limited, my
special thanks for their co-operation in furnishing necessary data and information. I am
highly grateful to my respected family members for their co-operation and support.
August, 2009 Sushma Rai
Biratnagar P.G. Campus, Biratnagar
ABBREVIATION
% Percentage
A/C Account
A.D. Anno Domini
ATM Automatic Teller Machine
B.S. Bikram Sambat
CA Current Assets
CL Current Liabilities
C.V. Coefficient of Variation
DPS Dividend Per Share
Dr. Doctor
EBIT Earning Before Interest and Taxes
EBL Everest Bank Limited
EPS Earning Per Share
e.g. Example
etc. Etcetera
HBL Himalayan Bank Limited
i.e. That is
JVBs Joint Venture Banks
KBL Kumari Bank Limited
KTM Kathmandu
Ltd. Limited
MBS Master of Business Studies
MVPS Market Value Per Share
NABIL Nepal Arab Bank Limited
NIBL Nepal Investment Bank Limited
No. Number
NPAT Net Profit after Tax
NRB Nepal Rastra Bank
NSBI Nepal SBI Bank Limited
p/l Profit and Loss
P.G. Post Graduate
Prof. Professor
Rs. Rupees
SBI State Bank of India
SCBL Standard Chartered Bank Limited
S.d. Standard Deviation
TIE Time Interest Earned
T.U. Tribhuvan University
www word wide web
TABLE OF CONTENTS
Acknowledgement
Table of Contents
List of Tables
List of Figures
Abbreviation
Page No.
CHAPTER – I INTRODUCTION
1.1 Background 1
1.2 Focus of Study 2
1.3 Statement of the Problems 3
1.4 Objectives of the Study 4
1.5 Significance of the Study 5
1.6 Limitation of the Study 7
1.7 Organization of the Study 8
CHAPTER-II REVIEW OF LITERATURE
2.1 Conceptual Review 10-25
2.1.1 Meaning and Growth of Bank 10
2.1.2 History and Concept of Joint Venture Commercial Banks 12
2.1.3 Objectives of Joint Venture Banks 13
2.1.4 Brief Introduction of SBI Bank, HBL and KBL 15
2.1.5 Financial Performance 17
2.1.6 Financial Statement Analysis 18
2.1.7 Financial Ratio Analysis 20
2.1.8 Limitations of Financial Ratio 24
2.2 Review of Related Studies 26-31
2.2.1 Review of Related Articles 26
2.2.2 Review of Previous Research Work 29
CHAPTER-III RESEARCH METHODOLOGY
3.1 Introduction 32
3.2 Research Design 33
3.3 Population and Sample 34
3.4 Nature and Sources of Data 35
3.5 Data Collection Procedure 35
3.6 Data Analysis Tools 36-46
3.6.1 Financial Tools 36
3.6.1.1 Liquidity Ratio 36
3.6.1.2 Activity Ratio 38
3.6.1.3 Leverage Ratio 40
3.6.1.4 Profitability Ratio 41
3.6.1.5 Other Ratio 43
3.6.2 Statistical Tools 44
3.6.2.1 Arithmetic Mean 44
3.6.2.2 Standard Deviation 45
3.6.2.3 The Coefficient of Variation 45
3.6.2.4 Coefficient of Determination 45
3.6.2.5 Trend Analysis 46
CHAPTER-IV PRESENTATION AND ANALYSIS OF DATA
4.1 Financial Analysis 47-85
4.1.1 Ratio Analysis 47
4.1.1.1 Liquidity Ratio 48
4.1.1.2 Activity Ratio 59
4.1.1.3 Leverage Ratio 65
4.1.1.4 Profitability Ratio 71
4.1.1.5 Other Ratio 79
4.2 Statistical Analysis 85-104
4.2.1 Coefficient of Correlation Analysis 85
4.2.2 Trend Analysis 96
CHAPTER-V SUMMARY, CONCLUSIONS AND
RECOMMENDATIONS
5.1 Summary 105
5.2 Conclusion 111
5.3 Recommendation 116
BIBLIOGRAPHY
APPENDIX
LIST OF TABLES
Table No. Page No.
1 Current Ratio 48
2 Cash and Bank Balance to Current Assets Ratio 50
3 Loan and Advances to Current Assets Ratio 53
4 Cash and Bank Balance to Total Deposit Ratio 55
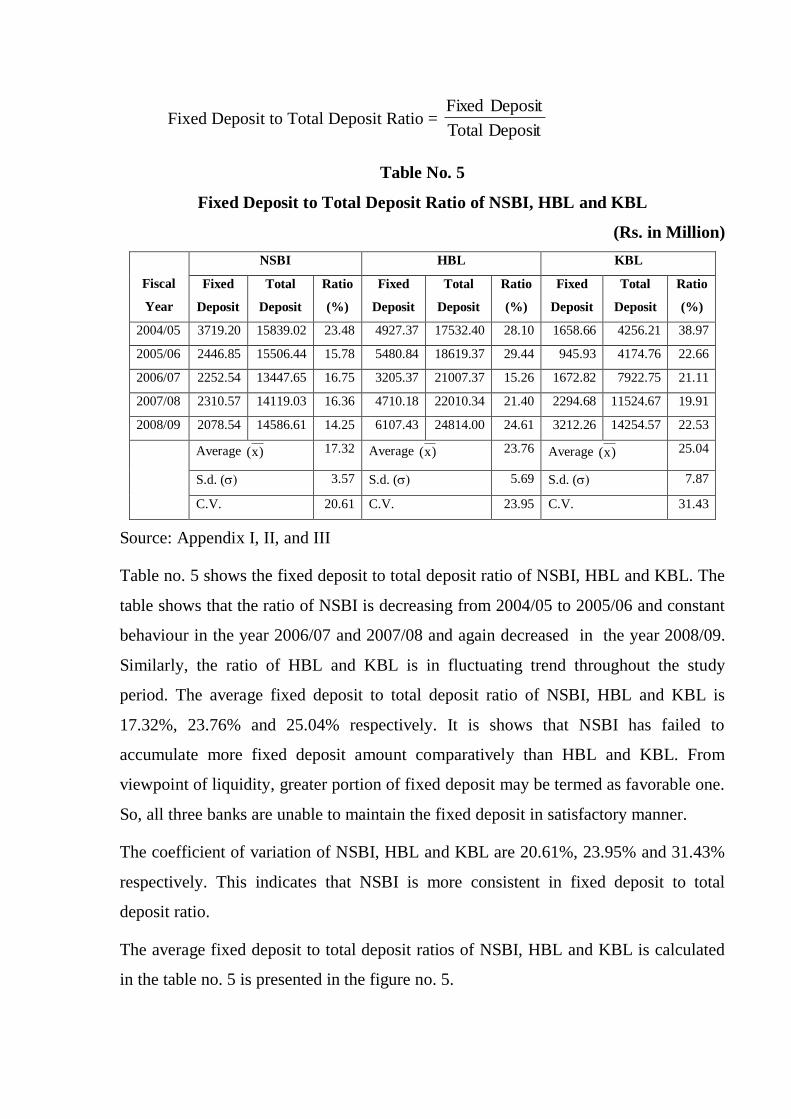
5 Fixed Deposit to Total Deposit Ratio 57
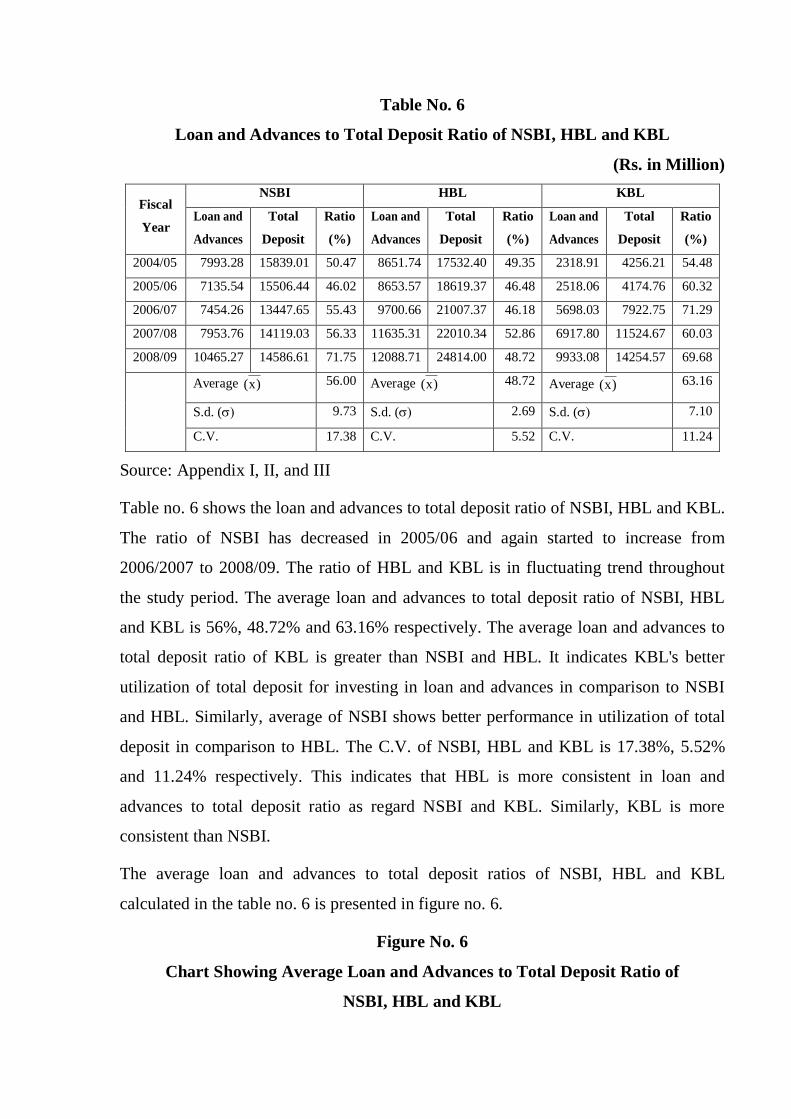
6 Loan and Advances to Total Deposit Ratio 60
7 Loan and Advances to Fixed Deposit Ratio 62
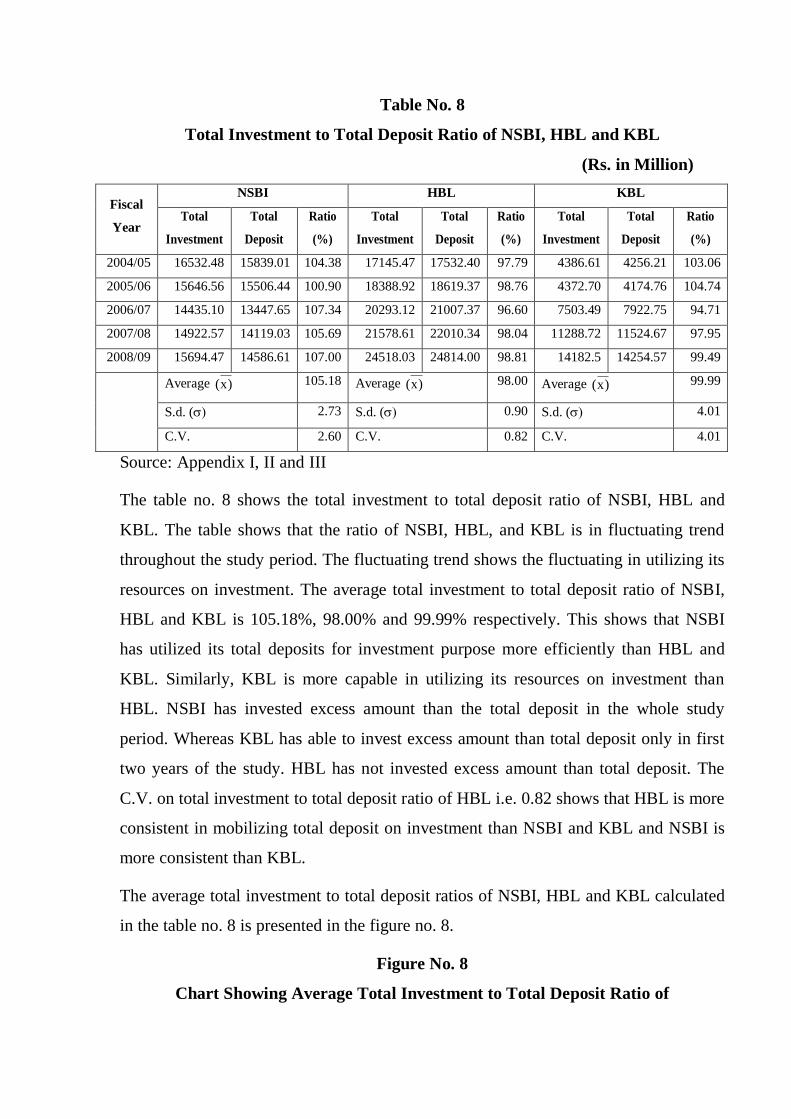
8 Total Investment to Total Deposit Ratio 64
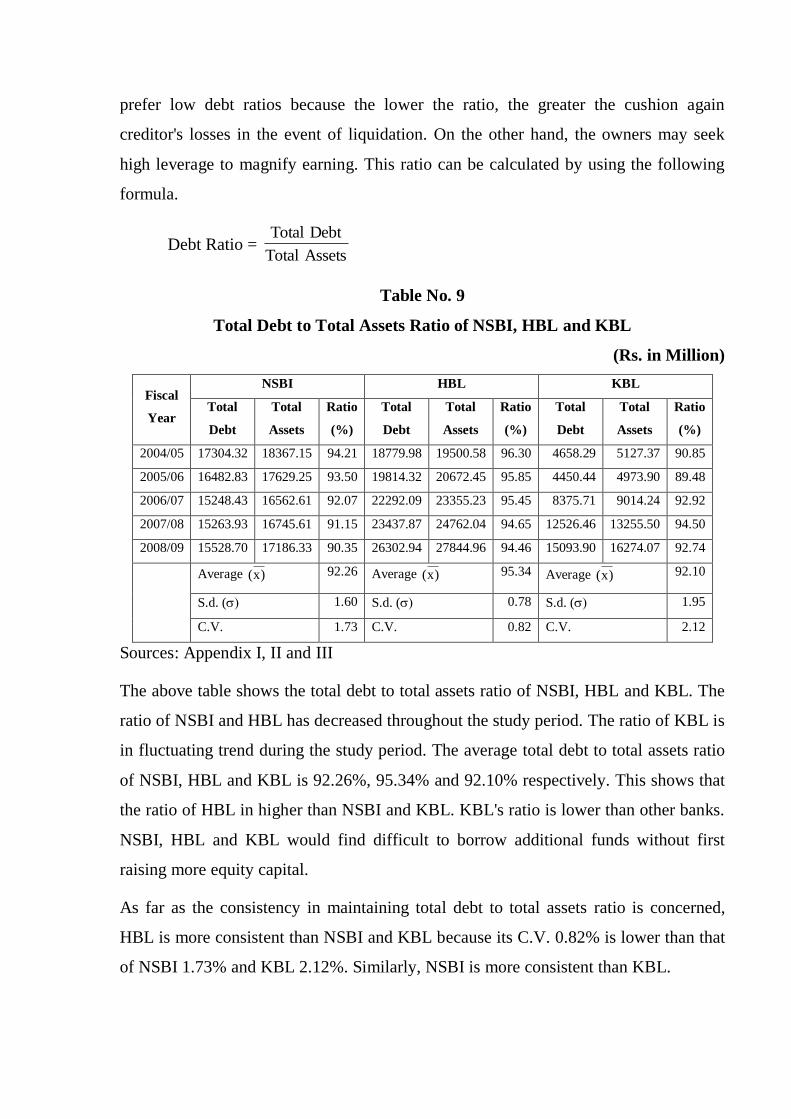
9 Total Debt to Total Assets Ratio 66
10 Debt to Equity Ratio 68
11 Time Interest Earned Ratio 70
12 Return on Equity Ratio 72
13 Return on Total Assets Ratio 74
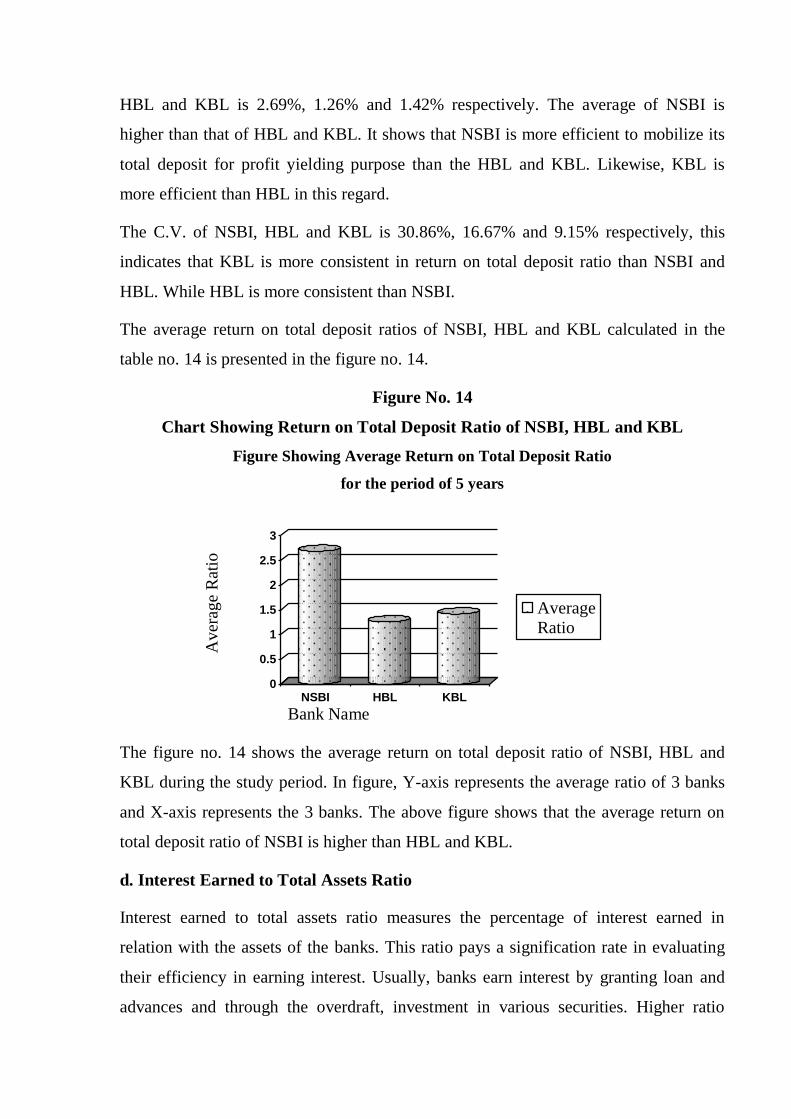
14 Return on Total Deposit 76
15 Interest Earned to Total Assets Ratio 78
16 Earning Per Share 80
17 Dividend Per Share 82
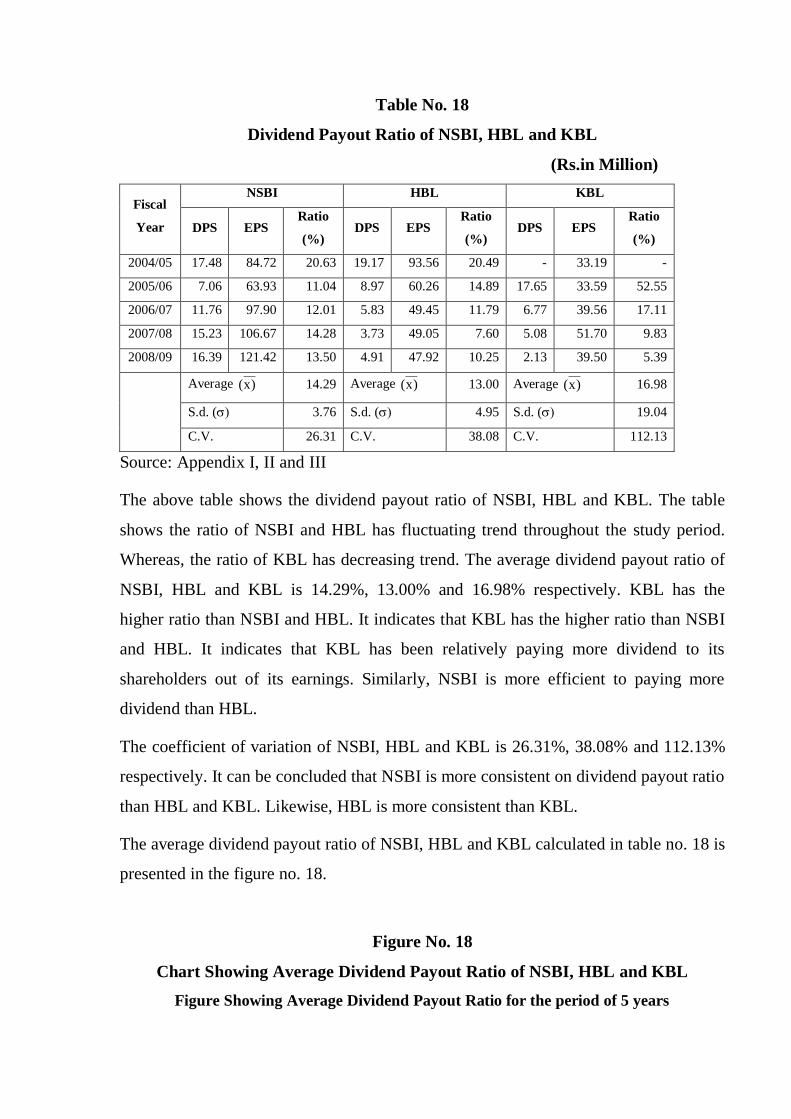
18 Dividend Payout Ratio 84
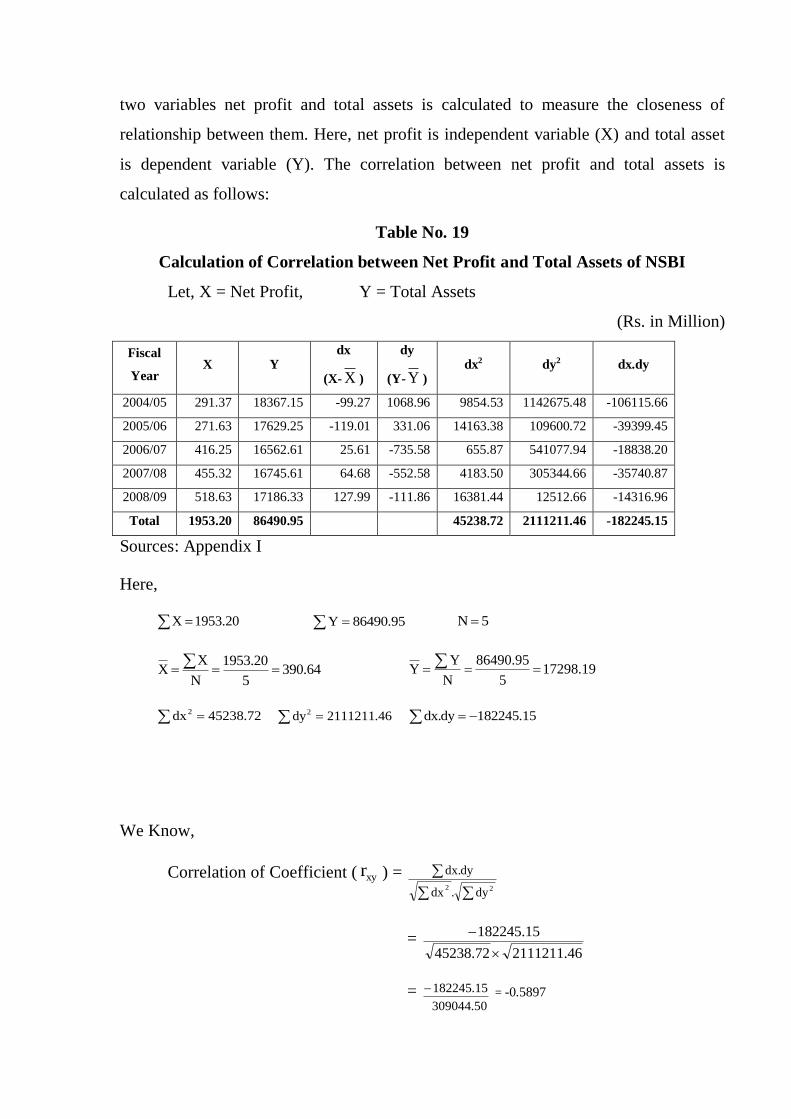
19 Calculation of Correlation between Net Profit and Total Assets of NSBI 86
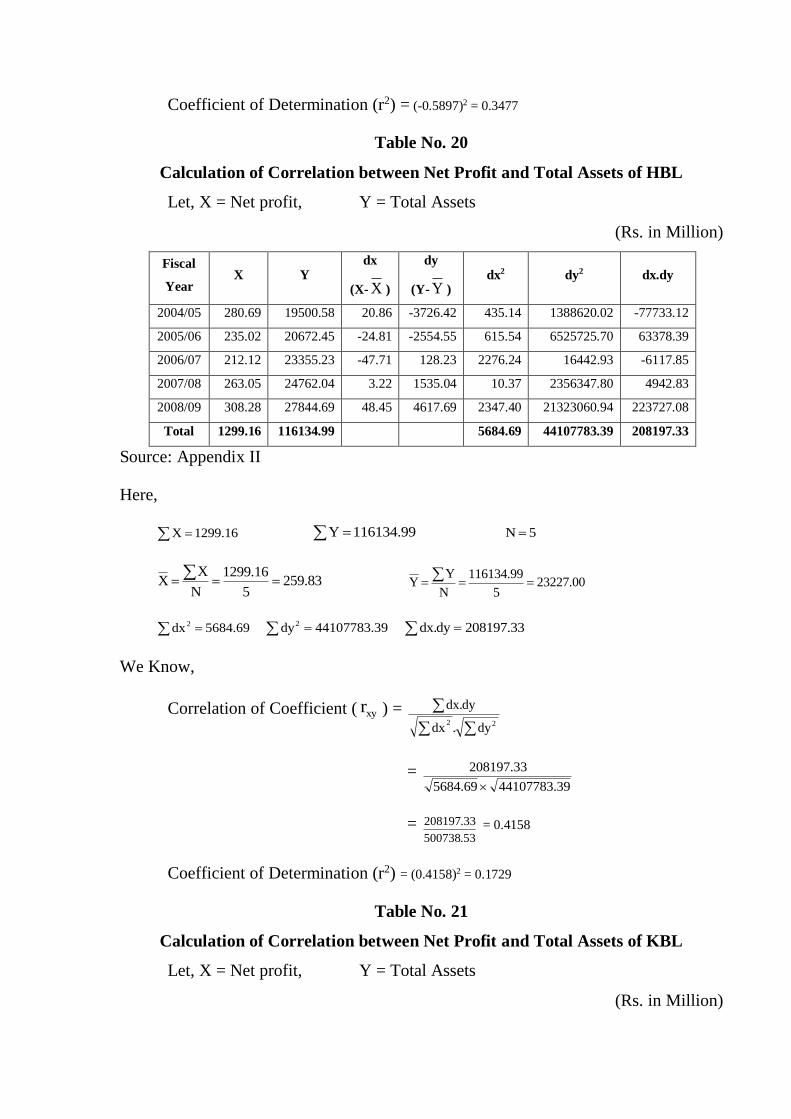
20 Calculation of Correlation between Net Profit and Total Assets of HBL 87
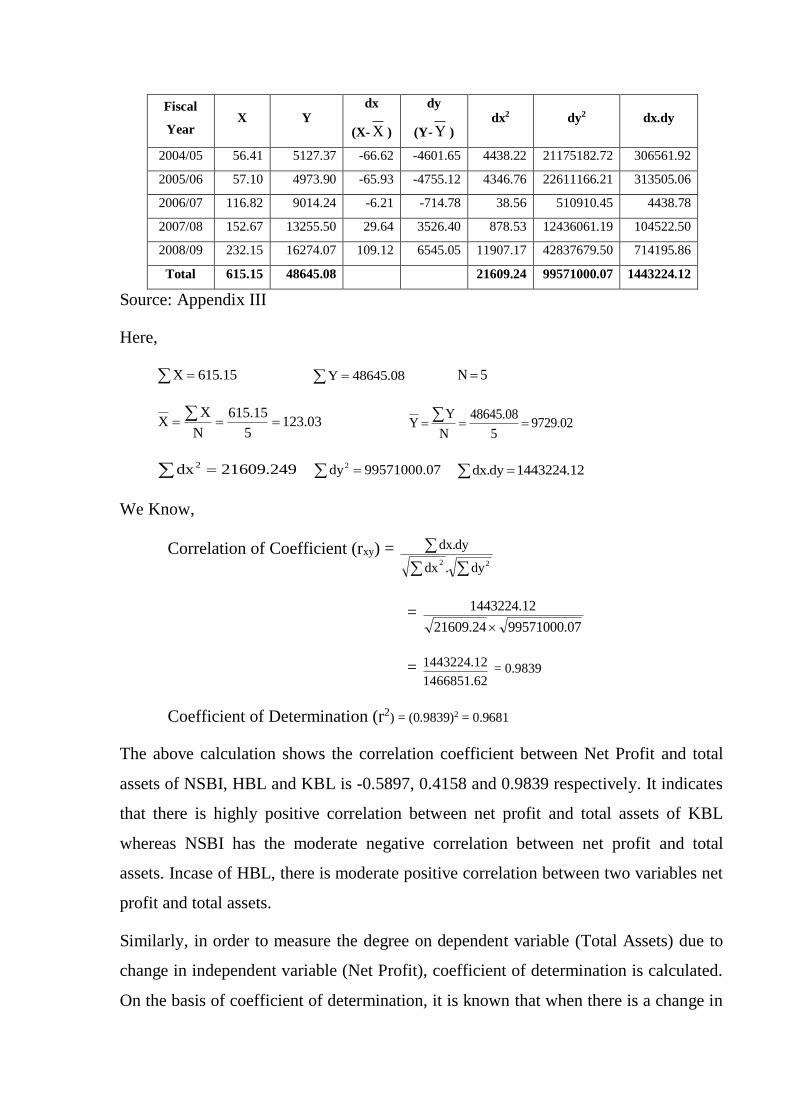
21 Calculation of Correlation between Net Profit and Total Assets of KBL 88
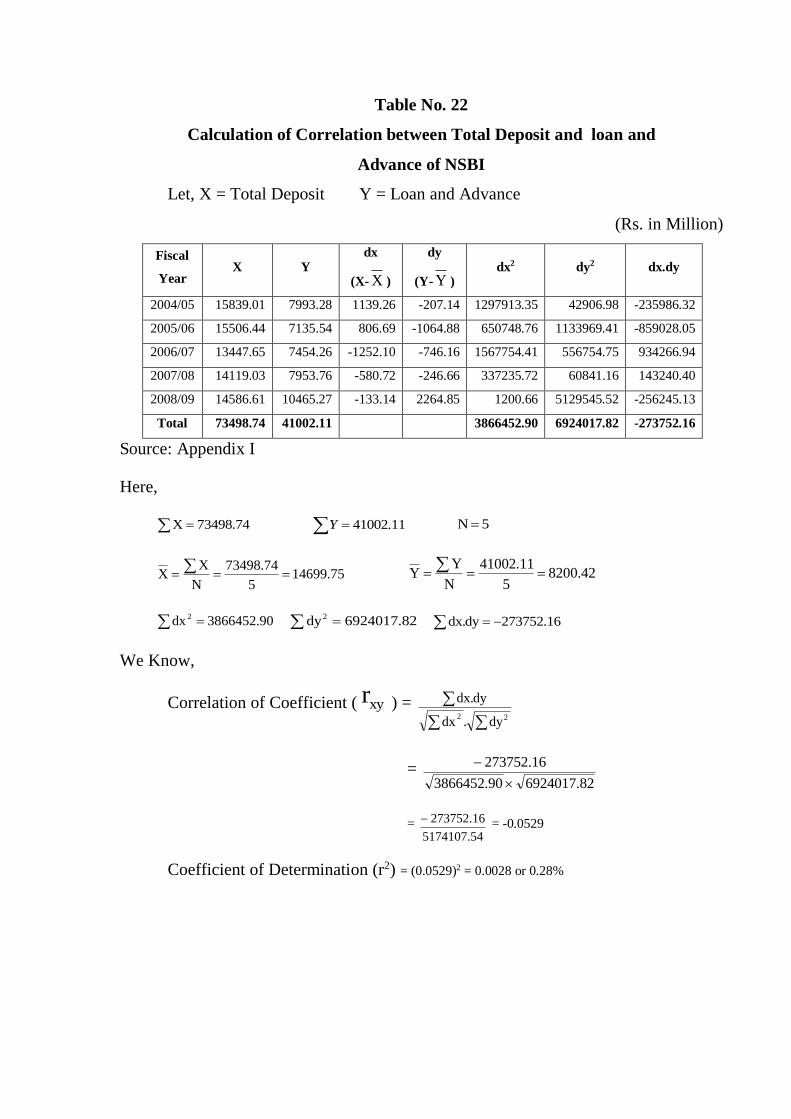
22 Calculation of Correlation between Total Deposit and
Loan and Advance of NSBI 90
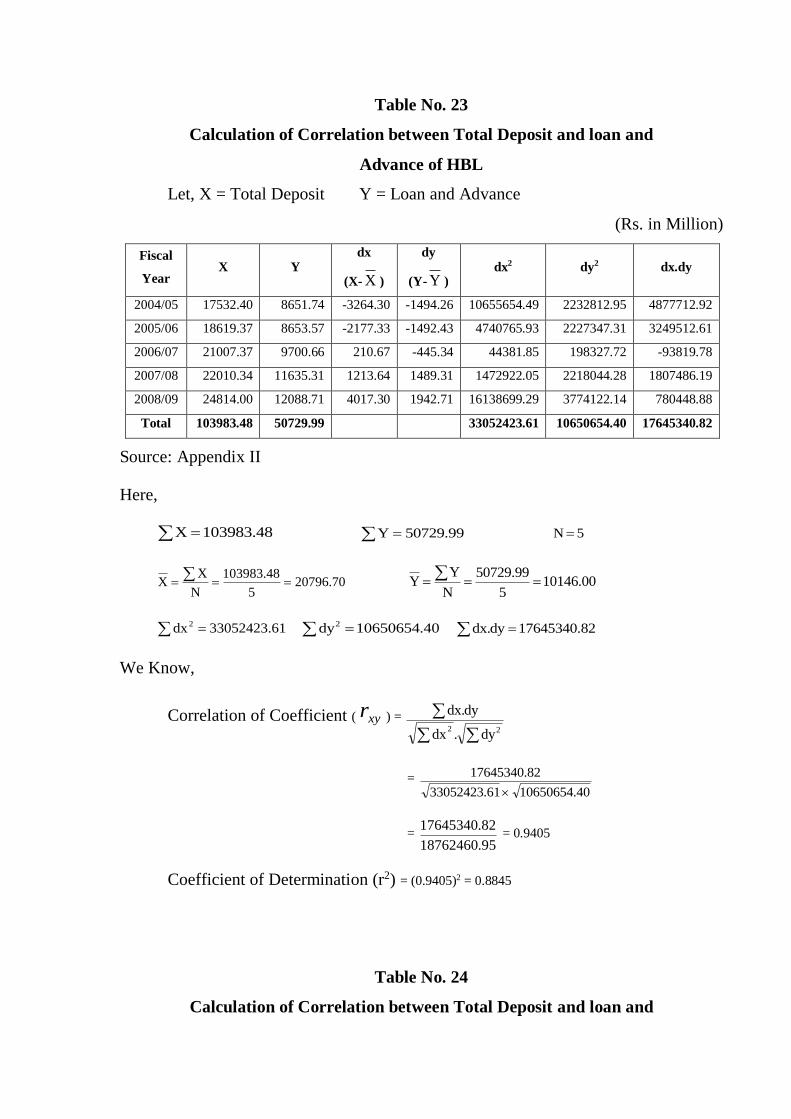
23 Calculation of Correlation between Total Deposit and
Loan and Advance of HBL 91
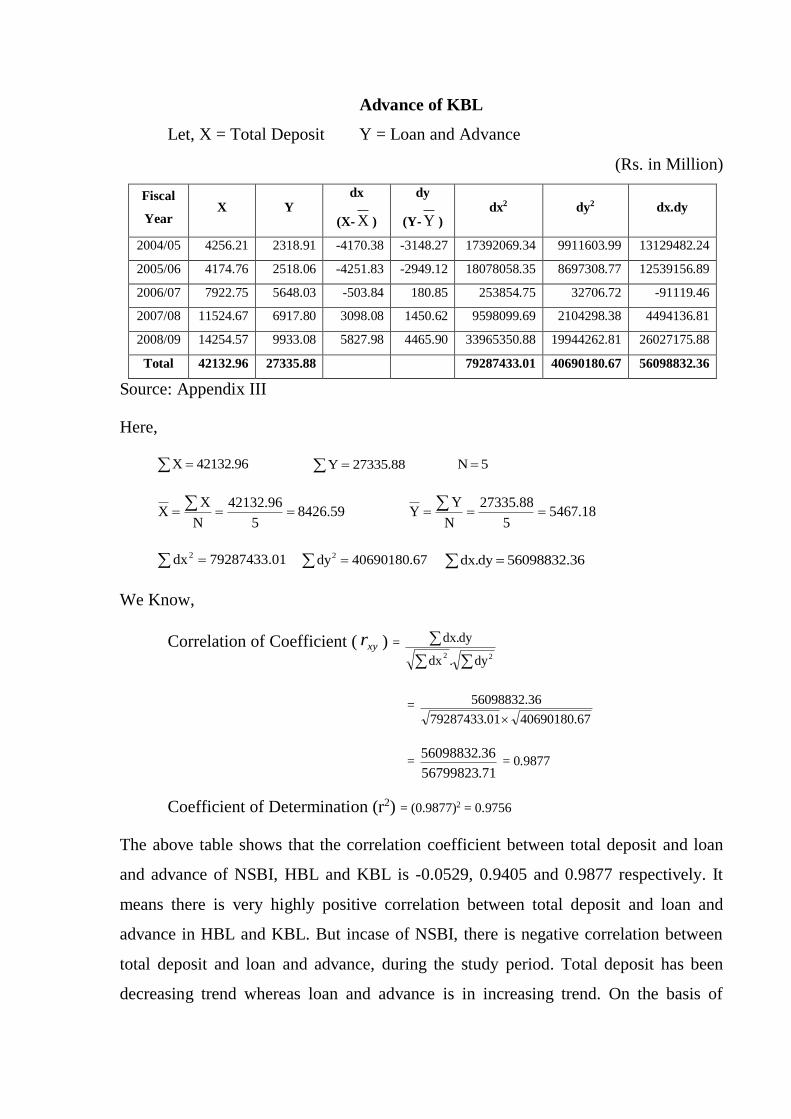
24 Calculation of Correlation between Total Deposit and
Loan and Advance of KBL 92
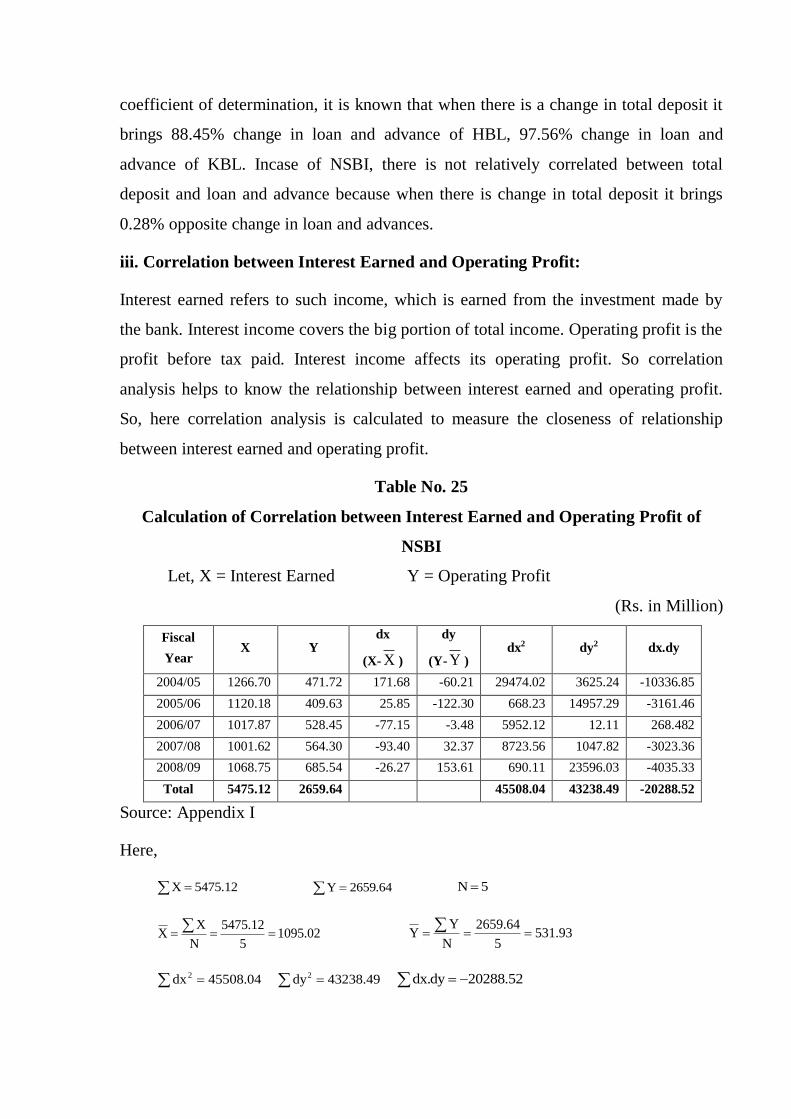
25 Calculation of Correlation between Interest Earned and
Operating Profit of NSBI 93
26 Calculation of Correlation between Interest Earned and
Operating Profit of HBL 94
27 Calculation of Correlation between Interest Earned and
Operating Profit of KBL 95
28 Trend of Total Investment 98
29 Trend of Loan and Advances 99
30 Trend of Total Deposit 100
31 Trend of Net Profit 102
32 Trend of Earning Per Share 103
LIST OF FIGURES
Figure No. Page No.
1 Current Ratio 49
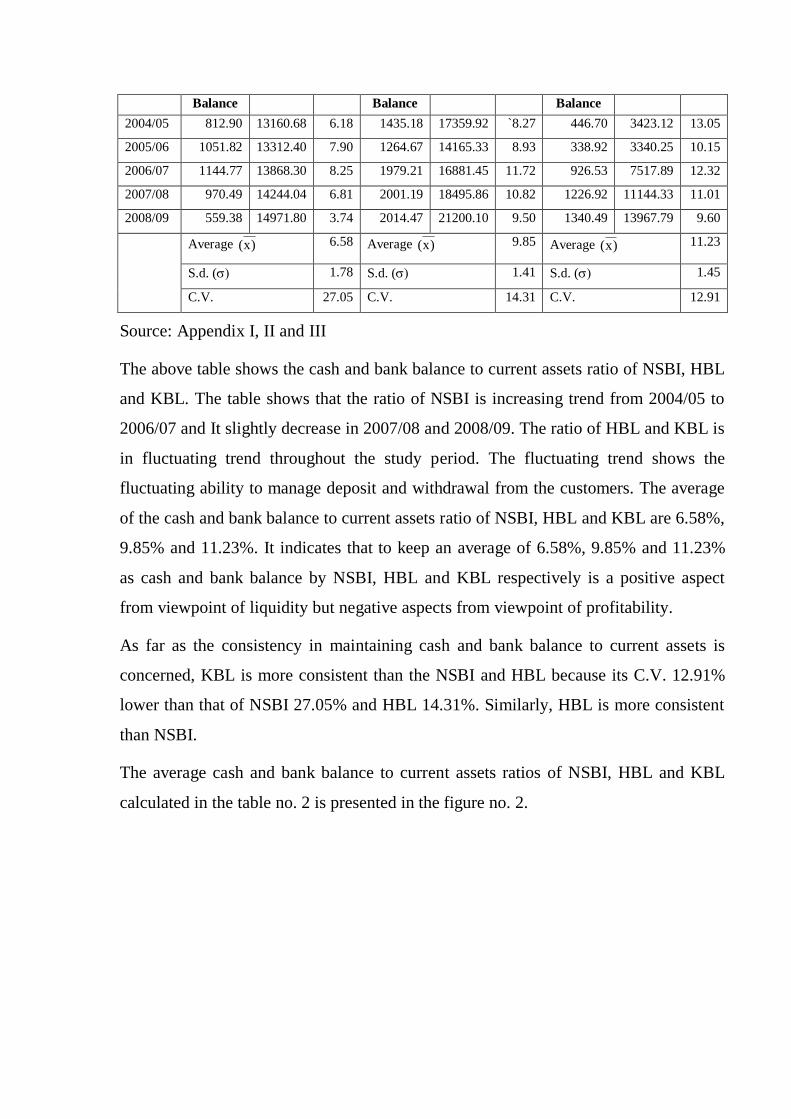
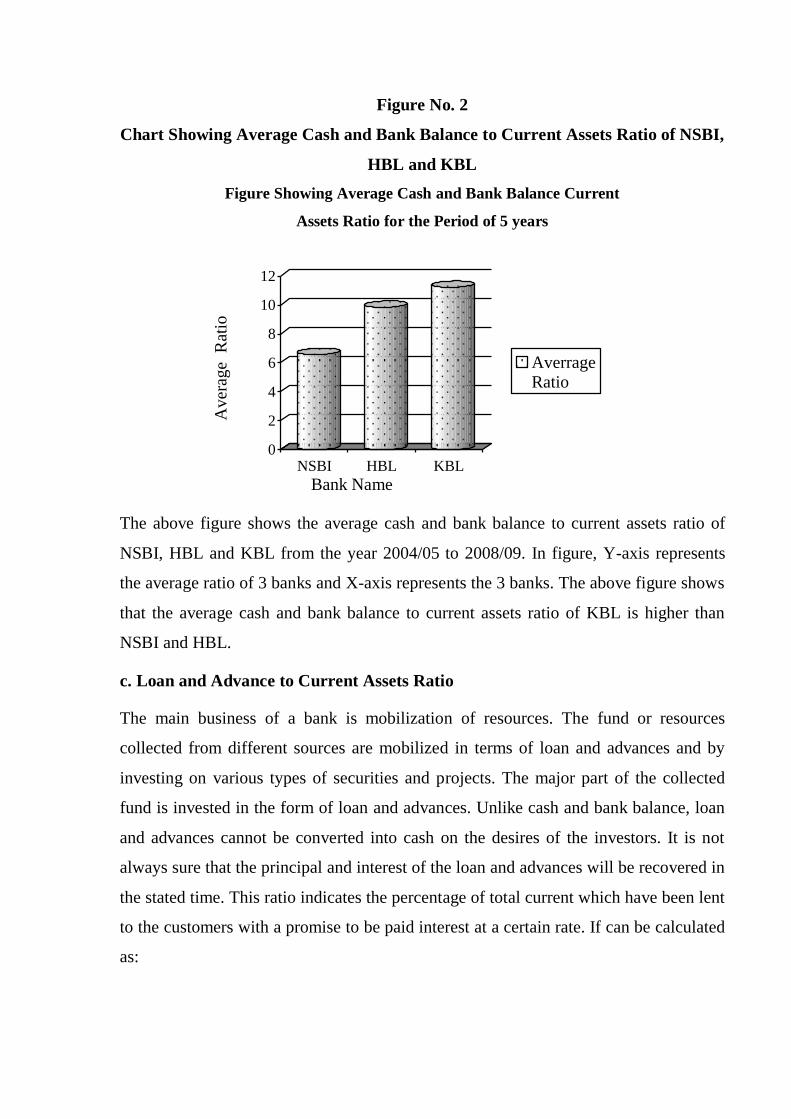
2 Cash and Bank Balance to Current Assets Ratio 52
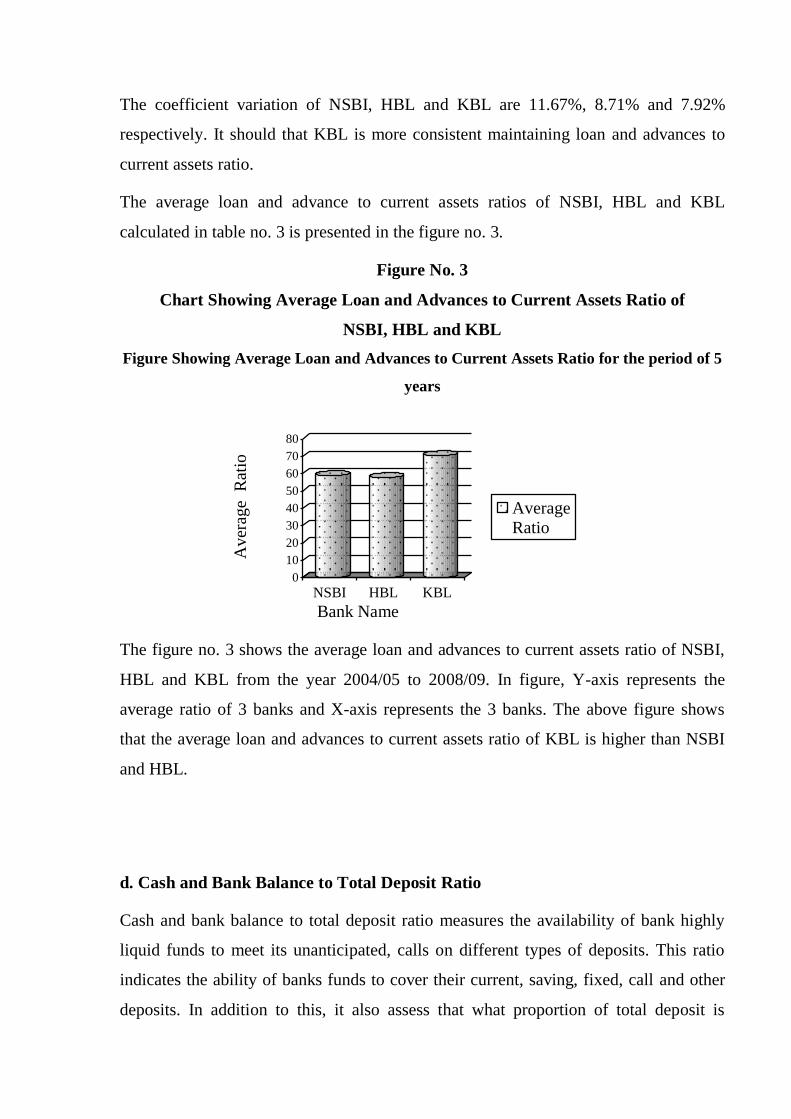
3 Loan and Advances to Current Assets Ratio 54
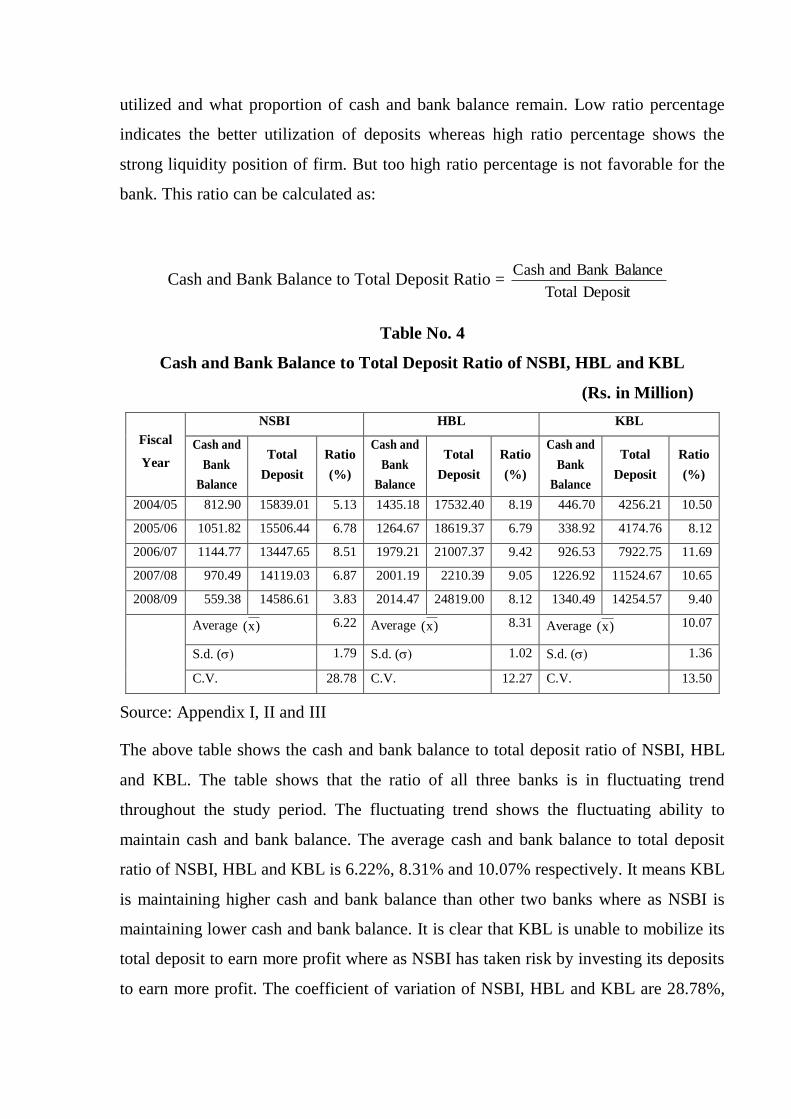
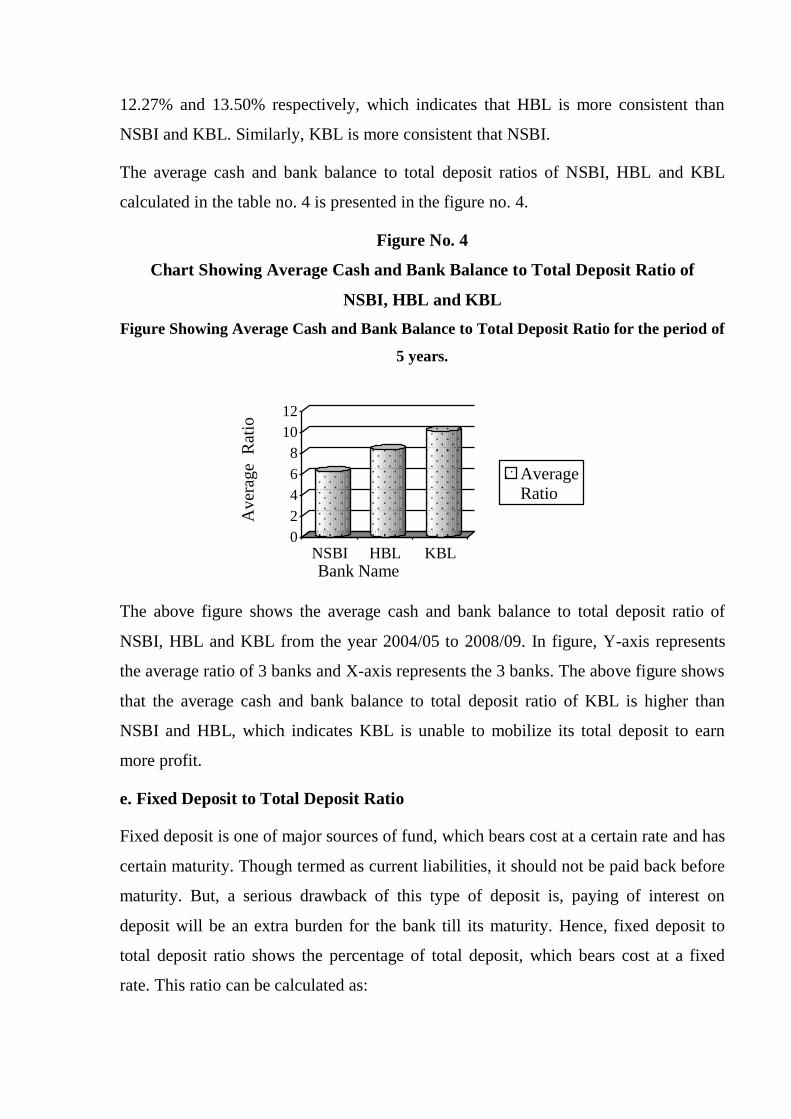
4 Cash and Bank Balance to Total Deposit Ratio 56
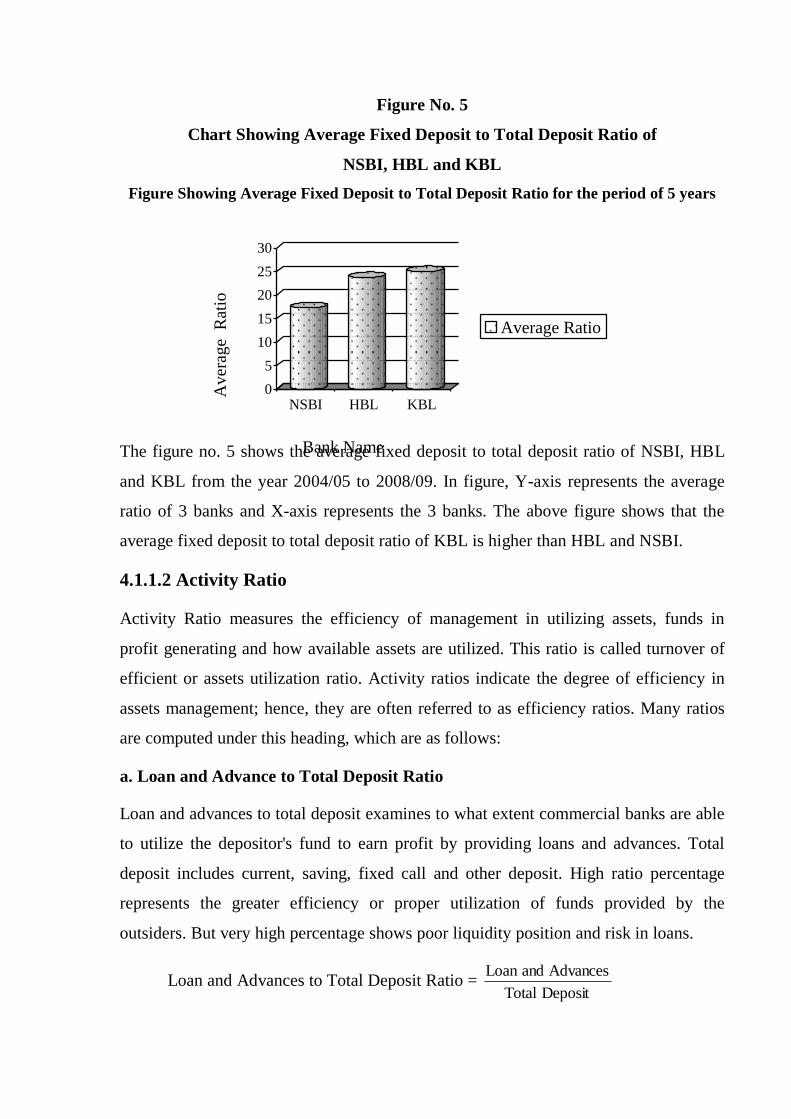
5 Fixed Deposit to Total Deposit Ratio 58
6 Loan and Advances to Total Deposit Ratio 61
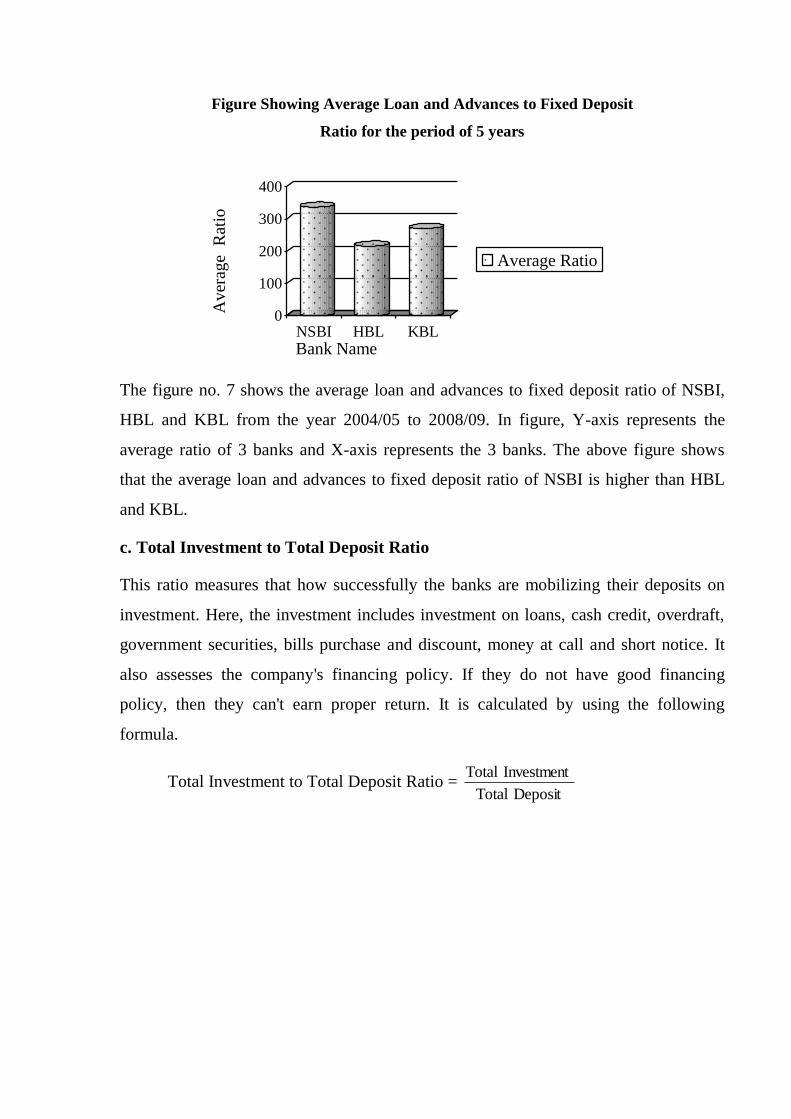
7 Loan and Advances to Fixed Deposit Ratio 63
8 Total Investment to Total Deposit Ratio 65
9 Total Debt to Total Assets Ratio 67
10 Debt to Equity Ratio 69
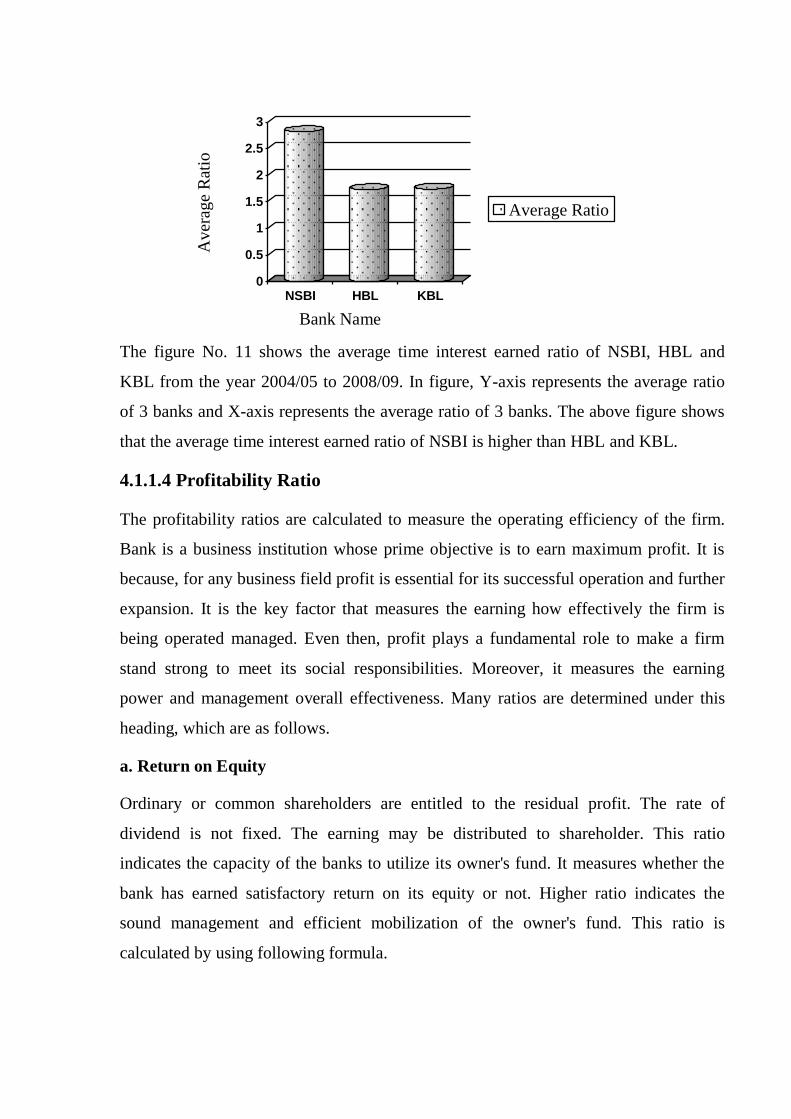
11 Time Interest Earned Ratio 71
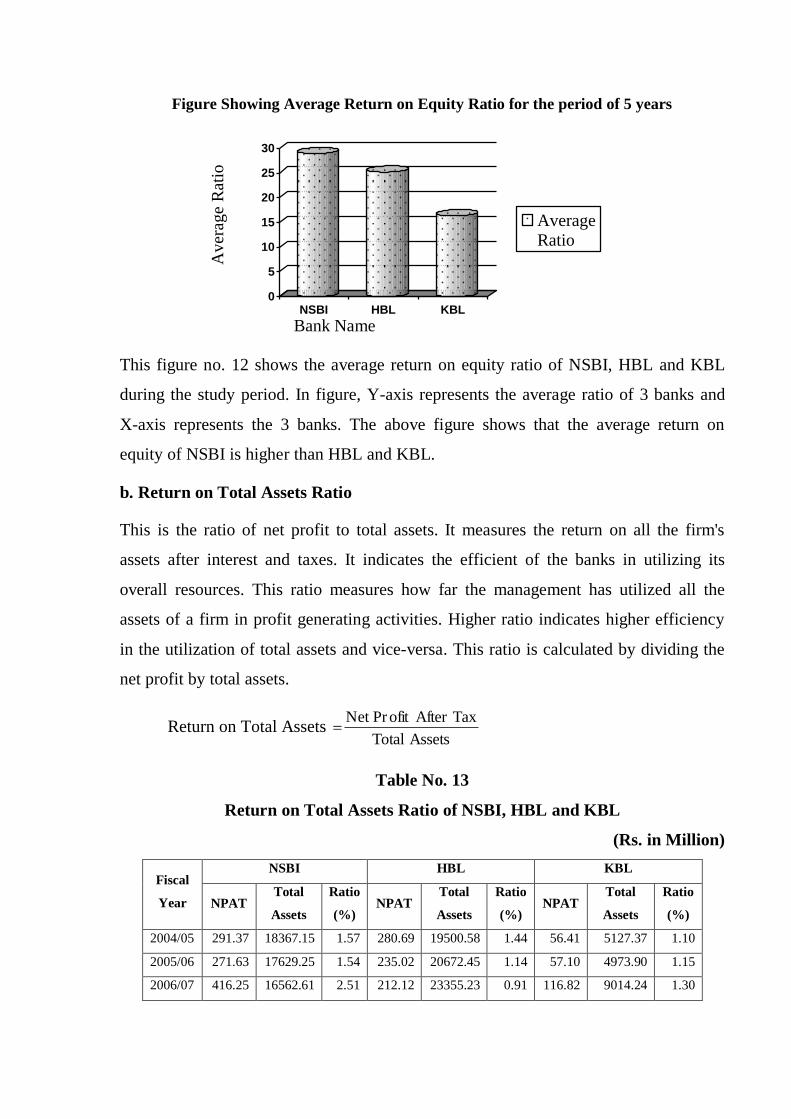
12 Return on Equity Ratio 73
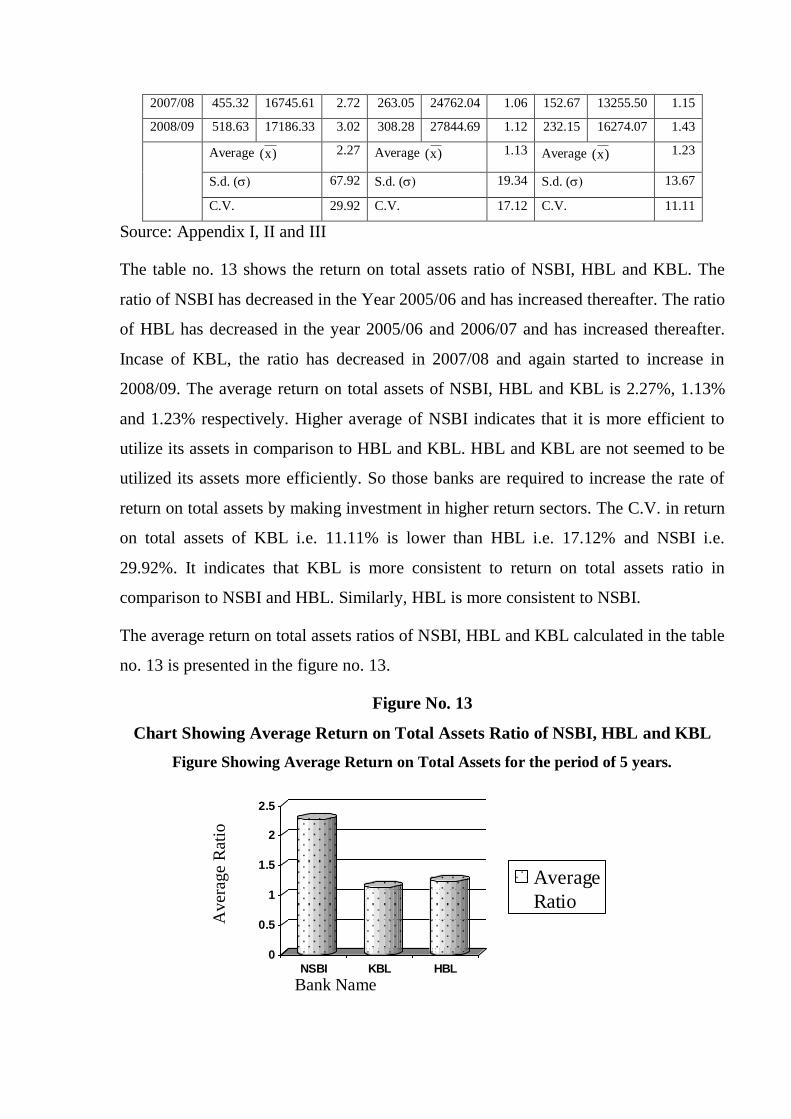
13 Return on Total Assets Ratio 75
14 Return on Total Deposit Ratio 77
15 Interest Earned to Total Assets Ratio 79
16 Earning Per Share 81
17 Dividend Per Share 83
18 Dividend Payout Ratio 85
19 Trend of Total Investment 98
20 Trend of Loan and Advances 99
21 Trend of Total Deposit 101
22 Trend of Net Profit 102
23 Trend of Earning Per Share 104
CHAPTER-I
INTRODUCTION
1.1 Background
Banking sector plays catalyst role in the process of economic growth of the country.
For the rapid development of the country, the banking activities should be entered in to
every sector of economy for a rapid development of the country. An efficient banking
system plays a vital role for the development of an efficient financial market; it
virtually benefits all members of economy and leads for saving investment and hence
economic growth. The overall development of the country depends upon the economic
growth of that country. Bank plays the pivotal role in the economic development
because the crux of the economic growth lies in the development of well managed
banking system by creating and mobilizing capital, rendering other financial services
to the member of economy. The present human activities are not performed without the
assistance of banking sector. There are involved monetary transactions in each and
every human activity directly or indirectly. In addition, monetary transactions are
performed through the bank at present. Another important thing sufficient capital is
needed to establish the enterprise and working capital also needed at the running
period and there can be crises of such type of capital, which is fulfilled by the bank by
collecting the saving from the society. In this way capital formation and capital
mobilization functions are performed by the bank, which are very much important for
the economic growth of the country.
The basic task of the bank is to mobilize the saving of the community and ensure
efficient allocation of these savings to high yielding investment projects to offer
attractive and secured returns to the surplus spending on the one hand and to the
different sectors of the economy according to plan priorities of the country; on the
other hand. Some other utility functions are also performed by banks which have great
economic significance for the economy. Such functions as cheap remittance of funds,
accepting and discounting of bills of exchange, agency functions are very important for
the working of the modern economy. Banks play the important role in the various
economic affairs of the country in various ways. Their operations record the economic
plus of the economy. They are an essential instrument, for acceleration of the growth in
the developing country. They pursue economic growth rapidly developing the banking
habit among the people by collecting the small scattered resource in one bulk, using
them in the further productive purpose and rendering other valuable service to the
country. Thus, this gives the individual an opportunity to borrow funds against future
income, which may improve the economic well being of the borrower. In fact, banks
are the essential parts of present human society and the economy of the nation. Further
more present human civilization, activities would not be possible without banking
sectors.
1.2 Focus of the Study
After the liberalization economic policy taken by the HMG Nepal, the rapid growth of
commercial banks has seen and the financial market of the country has become more
competitive, dynamic and also complex. The institutional network and volume of
operations of the financial system have expanded and diversified with the number of
commercial bank rising from five in 1990 to seventeen in 2004. Among them joint
venture commercial banks are also increased. At present, due to high competition they
all are functioning at a great complex situation. To rendered prompt and efficient
service to the client, they are adopting modern and advance technology in their
operation. To face the competition and for the better performance, changing
technology and adopting advance technology is only not sufficient there must evaluate
the performance of the banks and should be taken the corrective actions on the
weaknesses of the bank according to findings after judgment.
As other commercial banks, joint venture banks have also the great contribution in the
capital formation and mobilization process. They are seen highly efficient than other
commercial banks. So joint venture commercial banks are the important number of the
banking system. Thus it becomes necessary to evaluate, analyze and interpret the
financial performance of the Joint venture banks comparatively among them. This
study is focused on joint venture commercial banks (between three selected) of Nepal.
By analyzing their financial statements of latest five years and interpreting them the
evaluation is carried out. For the reach study, different analytical tools and techniques
are used. The information required for the research study regarding these banks are
drawn out from the annual reports of the related banks and from their separate website,
Nepal stock exchange website www.nepalstock.com and various publications published
by NRB.
1.3 Statements of the Problem
The open and liberal economic policy towards the banking sector of government of
Nepal initiated many joint venture and financial companies, rural banks and
cooperative societies in Nepal. The rapid growth of financial institutions has led a
sharp competition among each other. Although joint venture banks have been
managing for better performance than other local commercial banks within short span
of time.
Comparatively all joint venture banks are performing efficiently than other private or
governmental commercial banks but also they are facing various problem due to the
increasing competitive environment introducing various new technology like
computerization. In order to achieve financial efficiency attempts and takes
measurement for their improvement. A comparative study of financial performance is
basic process which provides information about the profitability, liquidity position,
earning capacity, efficiency in operation, credit worthiness, sources and usage of
capital, financial achievement, status of bank and pointing out their strength and
weakness.
The main problem of the study is to inquire into the financial performance of the
selected joint venture banks. This study has aimed to find out the answer to the
following questions.
How far have they been able to keep the sound status in terms of financial
performance?
What are the major problems faced by the bank in developing financial
planning?
Comparatively joint venture banks are operating efficiently than other banks?
Among the selected banks, whose financial performance is better? Are they able
to meet their financial obligations or not?
Do they manage and utilize their resources efficiently?
Are they maintaining sufficient liquidity?
In this context the main purpose of the study is, analyzing comparatively to the overall
financial performance of the banks, in terms of profitability, liquidity, turnover,
efficiency as well as other related dimensions.
1.4 Objectives of the Study
Financial analysis can be considered as a heart of financial decision. The growth and
development of an enterprise is fully affected by its financial performances. The main
objectives of this study are to analyze and to compare the financial performance of
joint venture commercial banks through the help of certain financial ratios and other
statistical tools. It helps to examine the financial strength and weakness of the banks.
The main objectives are specified as below:
a. To compare liquidity position of the related banks.
b. To compare the financial position among three banks.
c. To analyze the liquidity, profitability, leverage, activity ratios of the related
banks.
d. To make comparative analysis of other indicators with reference to Earning per
share, Dividend per share, Dividend payout ratio.
e. To compare the growth trend of banks as regard to investment, loan and
advances, total deposit, net profit and earning per share.
g. To provide suitable suggestion and possible guidelines to improve financial
performance of Nepal SBI Bank, Himalayan Bank and Kumari Bank.
1.5 Significance of the Study
Every research work or study should be fruitful. It is believed that this work must be
fruitful for various people and organizations. Due to lack of sufficient capital, only few
commercial banks are opened with domestic investment. The foreign capital is entered
our country, through the joint venture commercial banks, which is essential for the
development of banking sector and numbers of commercial banks are established with
the foreign investment. So, joint venture banks cover the major portion of Nepalese
commercial banking sector. Through the capital formation and capital mobilization
process, commercial banks help in the upliftment of the economy. Due to the poor
financial performance they can't be successes in the capital formation and capital
mobilization process. At that time they can't contribute in the economic development
of the country. A sound financial performance is important for the growth of business
enterprises and financial institutions. The banking sector is gearing up to operate in a
more competitive and market oriented system. It is modernizing to operate and moving
towards providing a range of financial products and services in an innovative and
competitive way.
Numbers of studies have been made to identify the financial performance of different
Nepalese companies among them some are the comparative study between two or
more companies among companies as well as between or among the banks also. But at
present there is not made any latest study and but done by examining the overall
factors of financial performance. There is highly competition among the joint venture
commercial banks, so there is necessary to compare the financial performance, by
which findings can be obtained about the strength ness and weaknesses. This present
study does not only fulfill this gap but also identities the overall financial performance
of related joint venture banks by the help of different financial tools and statistical
tools. It could be easier to take corrective actions in the weaknesses of related banks.
This study may also provide valuable information about the banks, which are under
this study. This study will also be helpful to find out whether these banks are going to
financially sound or not? Some other significances and importance are as follows:
a. It is helpful to find out the overall financial performance of the concerned joint
venture commercial banks.
b. The management of the bank can take crucial decision effectively on the basis
of their financial performance.
Hence, the present study will be useful for both the insiders and outsiders of concerned
banks i.e. for managers, shareholders, customers, public, government and students as
well as to the competitors also.
1.6 Limitations of the Study
It is natural that all types of study have been conducted within certain limitation. A
research is a vast study investigatory the subject matter for solving perceived research
problems. Although this research study has so much advantages aspect, after all, it is
conducted under some limitations; it means that the study has done under certain
limitation. Therefore, the following are the main limitation of the study:
This study has used only five years data of selected banks.
Up to date data and information related to the study have not been available
from the concern source.
Only balance sheet and profit and loss a/c presented in the web site of Nepal
stock exchange have been used.
The study is prepared to fulfill the requirements of Master Degree in Business
studies.
This study is mainly based on the secondary data like annual report of the
banks, journals, other published articles and works etc.
There are more than 17 commercial banks, out of them; the study is done only
of three banks due to the lack of time and resources.
This study has only focused on the comparative financial performance analysis
of selected banks.
There are many financial tools but this study deals with certain financial tools
and statistical tools.
1.7 Organization of the Study
The whole study has been divided into five chapters; each chapter deals some
important factors of financial performance. The titles of each of these chapters are
listed below:-
Chapter I : Introduction of the study
Chapter II : Review of literature
Chapter III : Research Methodology
Chapter IV : Presentation and Analysis of Data
Chapter V : Summary, Conclusion and Recommendation
Chapter I: This is the introduction chapter of the study. This chapter includes
background of the study, focus of study, statements of problems, objectives of the
study, significance of study and limitation of the study.
Chapter II: This chapter is the review of literature deals the conceptual framework:
joint venture bank, financial performance, financial statement analysis, financial ratio
analysis, history and objectives of joint venture banks have been also defined.
Similarly, different articles, books and earlier studies are reviewed.
Chapter III: This chapter explains the research methodology, which includes research
design, population and sample, nature and sources of data, data collection procedure
and method of data analysis.
Chapter IV: This chapter is the heart of the study. This chapter deals with the
presentation and analysis of data using various financial tools and statistical tools have
been used to analyze and interpret the results.
Chapter V: This chapter deals with summary and conclusion of the whole study and
offers recommendation for the improvement of the bank is future.
The bibliography and appendices are given at the end of the study.
CHAPTER-II
REVIEW OF LITERATURE
2.1 Conceptual Review
2.1.1 Meaning and Growth of Bank
A bank is an institution, which deals in money receiving deposit from customers,
honoring customer's drawings against such surplus deposits until they are required for
repayment. "Generally an institution established by law, which deals with money and
involved in monetary transaction is called bank. A bank simply carries out the work of
exchanging money, providing loan, accepting deposit and transferring the money."1
"Bank means a financial establishment for the deposit, loans exchange or issue of
money and for the transmission of funds."2
"A bank can be defined as a 'financial department store; which renders a host of
financial services besides taking deposits and giving loans."3
Hence, a bank is an establishment for the custody of money received from or on behalf
of its customers; its essential duty is to pay their draft on it. Its profit arises from its use
of the money left unemployed by them.
The growth of banking system in Nepal not from so long. In comparison with other
developing and developed country, the institutional development in banking system of
Nepal is far behind. Nepal has to wait for a long time to come to this present banking
position. Talking about the history of bank and institutional banking system came into
existence in Nepal only in the nineteenth century. Tejarath Adda established during the
tenure of the Prime Minister Ranodip Singh in 1933 B.S. was the first step towards the
institutional development of banking system in Nepal. Nepal Bank limited was the first
1 Dilli Raj Bhandari; Banking and Insurance 1st ed., Ayush Prakashan, Kathmandu, 2003 P.2 2 Dilli Raj Bhandari, OP. cit. P.3 3 Bhuwan Dahal and Sarita Dahal; A hand Book to Banking, 2nd edition, Asmita Books and Stationary,
Kathmandu, 2002, P.7
financial institution of Nepal established on the 30th of Kartik 1994 B.S. as a
commercial bank. Only one Nepal Bank limited was not sufficient to look after all the
sectors of the country. So, in 2013 B.S., another bank named Nepal Rastra Bank was
established as the central bank. Similarly, the second commercial bank, Rastriya
Banijya Bank was established as the second commercial bank of Nepal in Magh 10th,
2022 B.S. under Rastriya Banijya Bank Act. 2021. This act is now revised as
commercial bank Act 2031 B.S; "Accepting deposit, granting loan and performing
commercial banking functions are the main motto of commercial banks."
For the development of the industry, commerce and trade Nepal industrial
development corporation was established under industrial development corporation
Act, 2016 for the development of agriculture sector, Agriculture Development Bank
was established on Magh 7th, 2024 B.S. under the Agriculture Bank Act 2024 B.S.
Moreover security exchange centre was established in 1976 A.D. to enhance capital
market activities and it is functioning at by the name of Nepal stock exchange with the
establishment of Rastriya Banijya Bank and Agriculture Development Bank, banking
service spread to both the urban and rural areas. After the restoration of democracy,
government took economic liberalization policy in Nepal as a result various
commercial and development banks are established, among them some are as joint
ventures and some other are established on the sole investment of domestic investor.
2.1.2 History and Concept of Joint Venture Commercial Banks
The government of Nepal observed the necessities of rapid development of the country
for which it has adopted "Liberalized economic policy, laissez fair economy and
encouraged foreign investment." It becomes successful to attract foreign investors,
government forwards such liberal economic policy in 2039 B.S. as a result, joint
venture is welcomed in various sectors and policy allowed foreign banks to operate as
joint venture banks. As a result, Nepal Arab Bank limited was established in 29th
Ashad 2041 B.S. as a first joint venture bank. Its joint venture partner was emirates
bank international limited, Derim and Dubai. Then the number of joint venture banks
increased rapidly. All joint venture banks were established and operated under the
rules and regulations of Nepal Rastra Bank. The second joint venture bank, Nepal
Indosuez Bank limited was established in 6th Magh 2042 B.S. Similarly, others joint
venture banks like Nepal Grindlays Bank limited on 16th Marg 2043 B.S., Himalayan
Bank limited on 2049 B.S., State Bank of India limited on 2050 B.S., Nepal
Bangladesh Bank limited established on 2051 B.S., Everest Bank limited on 2051 B.S.,
Bank of Katmandu on 2052 B.S. and Nepal Bank of Celon limited on 2052 B.S. have
been also established. Till now others commercial banks have been also established.
Among them, majority of banks are established as joint venture banks. A joint venture
bank is an association of two or more persons or parties under taken to make the
operation highly effective with their collective efforts. Joint venture banks play an
important role for economic development of nation. They have been adopted new
banking technique, management like; take banking, credit card, master card from
international banking technique. Forms within a country as well as operated in
different countries may participate in a venture through instance of joint venture
happen to be more common form in different countries. Joint venture is mode of
trading through the partnership among nations and also a form of negotiation between
the various group of industrialists traders and mercantile to achieve mutual exchange
of goods and services for sharing comparative advantage in their contribution.
"Joint venture banks are the finance for high risks high profit oriented firm. JBVs are
already playing and increasing dynamics and vital role in the economic development of
the country. This will undoubtedly increase with time." 4
At present, numbers of joint ventures banks within the country has been established
and all they are functioning, providing competitive and quantitative services and play
important role in the economic development of the country.
2.1.3 Objectives of Joint Venture Banks
4 Sunil Chopra:; Nepal Rastra Bank Samachar, Nepal Rastra Bank, Kathmandu 2046, P.1-2
At present most of JVBs are operating in financial sectors specially in banking,
insurance, finance and leasing etc less efforts have been made in manufacturing,
construction, designing etc. Joint venture banks pose serious challenges to the
existence. But the same challenges can be taken by the domestic banks as an
opportunity to modernize themselves and sharpen their competitive zealous. So it is
clear that JVBs are playing and increasing dynamic role to boost up and improve the
economic status.
The main objectives of JVBs are described as follows:-
a) Introducing New Methods and Technology in Banking Services:
The joint venture banks have invited a new era of banking in this undeveloped
country by introducing high technology and efficient methods in the banking
business. Other areas of expertise are forward cover for foreign transaction by
importers and exporters, merchant banking, inter bank market for money and
securities, arranging foreign currency, loans etc.
b) Providing More Resources for Investment:
The JVBs have been played a significant role in channeling additional resources for
investment for the development of the country although it is argued by many that
resources raised to locally in the prevailing market those resources would have
been mobilized by any other domestic institution, it is assumed that the joint
venture banks have mobilized net additional resources if they tap to 30, for
untapped resources in the local market. Like this JVBs are providing more
resources for the investment.
c) Providing New Services:
Even though the joint venture banks so far have not provided any remarkable new
services that not offered by the domestic, bank they have drawn a large number of
customers who assume that they will eventually benefit from their association with
these banks when they introduce new services. At present, speedier services than
that of the cosmetic banks in the half mark of the joint venture banks through their
services are basically in traditional areas, which could highly educate for the
domestic banks.
d) Creating Competitive Environment:
The JVBs have created a competitive environment in banking business in Nepal
prior to the arrival of joint venture banks there was little competitive zeal between
the Nepal Bank Limited and Rastriya Banijya Bank as they had almost set bunch of
customers, working areas and services.
2.1.4 Brief Introduction of NSBI, HBL and KBL
Nepal SBI Bank ltd.
Nepal SBI Bank ltd. is a joint venture between employees provident fund and State
Bank of India. SBI Bank, the largest commercial bank of India holds 50% of the
equity. It was established in 2050. It started its operation on 23rd Ashad 2050 (1993)
with its head office in Kathmandu. The initial paid up capital was Rs. 119.95 Million.
After the establishment of this bank, generally the monetary transaction between Nepal
and India have been carried out through this bank. Since State Bank of India has its
network throughout the urban area to remote rural area in India. The bank operates
with the objectives of providing loan to industry, commerce and trade.
The bank has more than ten branches in various parts of the kingdom. Its corporate
office located is Hattisar, Kathmandu and main branch office in Durbar Marg,
Kathmandu. It has another branches located in New road, and Embassy of India
extension counter and remaining are outside of the valley i.e. Biratnagar, Bhairahawa,
Pokhara, Janakpur, Itahari branches. To extend more efficient services to its customers,
Nepal SBI Bank has been adopting innovative and latest banking technology. This has
not only helped the bank to constantly improve its service level but has also kept it
prepared for future adoption of new technology. Nepal SBI Bank has just entered into
the sixteenth year of successful operation. During these periods, the bank has
established itself as one of the leading joint venture banks in the country.
Himalayan Bank Ltd.
Himalayan Bank limited (HBL) was established in 2049 by the distinguished business
personalities of Nepal in partnership with employees provident fund and Habib Bank
limited, one of the largest commercial banks of Pakistan. It operation was commenced
from Poush (January) 2050 (1993). It is the first commercial bank of Nepal with
maximum share holding by the Nepalese private sector. Besides commercial activities,
the bank also offers industrial and merchant banking. The bank at present has five
branches in Kathmandu valley namely Thamel, New Road, Maharajgung, Pulchowk
and Suryavinayak. Besides, it has eleven branches outside Kathmandu valley namely
The bank is pioneer in providing some of the latest/lucrative banking services like E-
Banking and SMS Banking Services in Nepal. The bank always focus on building
sound technology driven internal system to cater the changing needs of the customers
that enhance high comfort and value. The adoption of modern Globus Software,
developed by Temenos NV, Switzerland and arrangement of centralized data base
system enables customer to make highly secured transactions in any branch regardless
of having account with particular branch. Similarly, the bank has been providing utility
bill payment services, inward and outward remittance services and various other
banking services.
2.1.5 Financial Performance
Financial performance is that managerial activity which has concern with the planning,
organizing, controlling and administrating of financial resources of an enterprise.
Again it is basically concerned with analysis of financial statement of an enterprise by
using different tools and techniques. Financial performance is not concerned with
evaluation of past and present financial condition, but also it helps the improvement of
financial condition of an enterprise is the main financial performance indicator of an
organization profit and strong financial position of an enterprise is also a result of a
successful management. "Financial management is that managerial activity which is
concerned with planning and controlling of firms financial resources."5
5 I.M. Pandey; Financial Management, 7th ed., Vikas Publishing house P. (Ltd.) New Delhi, 1997, P.103
It was easier to record and check and business transactions for each businessman in the
beginning of civilization because the number of business transaction had taken a very
small place. As the human civilization has been growing, human activities have also
been increasing remarkable. By the help of financial performance every businessman
could show actual business condition to the different parties. Financial performance is
a study of overall financial position of any organization. In the modern context, it is
concerned with making the investment decisions, financing decisions and dividend
decision.
2.1.6 Financial Statement Analysis
The analysis of financial statements is done to obtain a better is sight into a firm's
position and performance. Analysis of financial statement is a process of evaluating the
relationship between the component parts of the financial statements to obtain better
understanding of a firm's position and performance. "Financial statement analysis
attempts to examine the liquidity, the profitability, the financial structure, and the
efficiency of the firm."6
Financial statements are the basis of analysis, which include income statement, balance
sheet. This contains summary of the firm's financial affairs. The investors and financial
analyst's are the major interested party to ensure the firm's performance through the
statement. This analysis is significant in making investment, decisions. These
statements are published in company's annual report. The annual report is specially
prepared for the shareholder's, which includes chairman's speech, the director's report
and auditor's report with accounting policies. The most important financial statements
are as follows:
I. Balance Sheet (Statement of Financial Position)
Balance sheet is one dimension of statement, which assists is measuring the assets,
liabilities and capital of a firm at a moment of time. It informs the financial condition
6 Richard A. Stevenson; Fundamentals of Finance, International student edition, Mc. Graw- Hill international
book company, 1981, P.167
of affairs of a firm or bank at an accounting period. It depicts the information about
resources and obligations of a business entity. The assets, liabilities and capital fall in
it. The assets are measured in monetary terms, which are the future benefits. They are
the valuable possessions owned by the firm cash, stock, receivable and other tangible
and intangible items.
"The balance sheet is a most significant financial statement. It is a statement of assets
and liabilities and indicates the financial position of the firm of a particular time. It
contains information about economic term of accounting. The balance sheet
communicates about assets, liabilities and owner's equity in the firm. In short, it
provides information about the financial position of the firm of the end of the
accounting period."7
The balance sheet can be presented either in a T from or in a vertical order, beginning
with assets. Assets and liabilities are two constituents of balance sheet. Normally assets
and liabilities are detailed in their order of performance.
II. Profit and Loss Account (Income Statement)
It depicts information regarding income and expenses of the firm. Previously,
statement analysis was basically related the balance sheet since profit and loss accounts
were not available readily at that time. The profit and loss account was considered as a
supplement to the balance sheet in rendering information. But, in those days p/l
account are compulsorily prepared and publicly published in annual report. They are
regarded as primary function of accounting and these are related to be complementary
to balance sheet.
"Profit and loss shows the cost of production, cost of sale and finally the net operating
and net profit earned or the loss incurred during the year. In gist, it shows the
profitability and performance of business."8
7 Shiva Prasad Munakarmi; Management accounting, Buddha academic enterprises, Kathmandu 2003, P. 12. 03 8 Shiva Prasad Munakarmi; Management accounting, Buddha academic enterprises, Kathmandu 2003 P. 12. 07
The major income items of banks include interest income, foreign exchange income
and commission. On the other hand, interest expenses, staff bonus and welfare,
personnel and administrative expenses form major expenditure of a bank.
2.1.7 Financial Ratio Analysis
Financial ratio analysis is one of the important parts of the financial analysis in
evaluating firm's performance. The parties interested in financial analyses are short-
term creditors, the long-term creditors, owners and management. Short-term creditors
main interest is in the liquidity position or the short-term solvency of the firm. On the
other hand, long-term creditors are more interested in the long-term solvency and
profitability of the firm. Effective planning and control are central enhancing
enterprises value. Financial plans may take forms but any good plan must be related to
the firm's existing strength and weakness. The strength must be understood if they are
to be used to proper advantage and the weakness must be recognized if corrective
action is to be taken. For example are inventories adequate to support the projected
level of sale? For efficient operations, does the firm have too much or too little
invested in plant and equipment? Proper utilization of the bank's resources is an
indicator of sound performance.
Traditional financial ratio analysis has focused on the numbers. The value of this
approach is that quantitative relations can be used to diagnose strengths and
weaknesses in a firm's performance. But the world is becoming more dynamic and
subject to rapid changes. It is not enough to analyze operating performance. Financial
analysis must also include consideration of the strategic and economic developments to
which the firm must relate for its long run success. In the present political and social
environment, the stakeholders must be expanded to include employees, consumers and
social and environmental considerations and other government regulatory interest.
Different sources and different analysts use different lists or combinations of financial
ratios for analysis.
The ratio analysis is designed to determine the relative strengths and weaknesses of
business operations. It also provides a framework for financial planning and control.
Financial managers need the information provided by analysis both to evaluate the
firm's past performance and to map future plans. Financial analysis concentrates on
financial statement analysis, which highlights the key aspects of firms operation.
Financial ratio can be classified into various categories according to financial activity.
Generally, financial ratio can be grouped into four types. They are as follows:-
A. Liquidity Ratio
The first category of financial ratio is "Liquidity Ratio". Liquidity ratios refer to the
ability to meet its short term of current obligations as and when they fall due to the
payment. A firm should ensure that it does not suffer from the liquidity crunch an also
that it is not too much highly liquid. The failure of a company due to lack of sufficient
liquidity will result in bad credit image and loss of creditor's confidence. A high degree
of liquidity is also not good. Liquidity ratio measures the ability to meet the short term
obligations and reflects the short term financial strength and solvency of the bank. As
financial tools, following ratios have been used to find out the comparative liquidity
position of the banks.
i. Current Ratio
ii. Working Capital
iii. Cash and Bank Balance to Current Assets Ratio
iv. Loan and Advance to Current Assets Ratio
v. Cash and Bank Balance to Total Deposit Ratio
vi. Quick Ratio
vii. Fixed Deposit to Total Deposit Ratio
B. Activity Ratio
Activity ratio is concerned with measuring the efficiency in assets management. The
efficiency with which the assets are used would be reflected in the speed and rapidly
with which assets are converted into sales. The greater the rate turnover the more
efficient utilization management other things being equal. Activity ratio are also called
turnover ratio. Activity ratios establish a relationship between sales and assets. Activity
ratio consists of the following ratios.
i. Loan and Advance to Total Deposit Ratio
ii. Loan and Advance to Fixed Deposit Ratio
iii. Loan and Advance to Current Deposit Ratio
iv. Total Investment to Total Deposit Ratio
C. Leverage Ratio
Another category of financial ratio is "leverage ratio". The leverage ratio may be
defined as financial ratios, which throw light on the long term solvency of a firm as
reflected in its ability to assure the long term creditors. Therefore, leverage ratios are
calculated to evaluate the long term financial position of the firm. This ratio measures
the relationship between debts and owners equity and examine the proportion of debt
the company is using. Leverage ratio consists of the following ratio:-
i. Debt Ratio
ii. Debt to Equity Ratio
iii. Time Interest Earned (TIE) Ratio
D. Profitability Ratio
Profitability ratios measure the efficiency and effectiveness of a business enterprise.
Profit is the main element that makes an organization to survive and grow for long
term. This ratio measures the capacity of generating revenue and search for the
incomes of the firm. The operating efficiency of the bank and its ability to ensure
adequate return to its shareholders depends ultimately on the profit earned by the bank.
It measures the success of the firm in terms of profit margin, return on equity, and
return on total investment and reflects the overall efficiency effectiveness of the
management. Profitability ratios are two types.
On the basis of sales
On the basis of Investment
The above types contain the following ratios:-
i. Net Profit Margin
ii. Operating Expenses Ratio
iii. Return on Equity
iv. Return on Assets
v. Earning Per Share
vi. Dividend Per Share
vii. Dividend Payout Ratio
viii. Price Earning Ratio
2.1.8 Limitation of the Financial Ratios
Although ratios are exceptionally useful tools, they should be used with judgment.
Ratios are constructed from accounting data and these data are subject to different
interpretation and even to manipulation. For example two firms any use different
depreciation methods or inventory valuation methods, depending on the procedures
followed reported profit can be raised or lowered. Similarly differences can be
encountered in the treatment of research and development expenditures, pension plan
costs, merger, product warranties, and bad debt reserves. Further if firms use different
fiscal years, and if seasonal factors are important, this can influence the comparative
ratios.
Thus, if the ratios of two firms are to be compared, it is important to analyze the basic
accounting data upon which the ratios were based and to reconcile any major
difference. We should also note that while ratio analysis can provide useful
information concerning and company's operations and financial condition, it does not
inherent problems and limitations that necessitate care and judgment. Some potential
problems are listed below:-
Many firms want to be better than average, so nearly attaining average
performance is not necessarily good. As a target for high level performance, it is
best to look at the industry leader's ratio.
Ratios may be distorted by seasonal factors, or manipulated by management to
give the impression of a sound financial condition.
Inflation has badly distorted firm's balance sheet recorded values are often
substantially different from "true" values. Since, inflation affects both
depreciation charges and inventory costs, profits are also affected.
The use of industry averages may not provide a very challenging target for high
level performance.
It is difficult to generalize about whether a particular ratio is "good" or "bad".
For example high current ratio may indicate a strong liquidity position, which is
good or which is bad.
Ratio analysis is useful, but analysts should be aware of these problems and
make adjustments as necessary.
Many large firms operates a number of different divisions in quite different
industries, an in such cases it is difficult to develop meaningful set of industry
averages for comparative purposes. This trends to make ratio analysis more
useful for small, narrow focused firms than for large, multidivisional ones.
A firm may have some ratios, which look, "good" and others, which look "bad"
making it difficult to tell whether the company is on balance in a strong or a
weak position.
Ratio, are extremely useful tools; but as with other analytical methods, they must be
used with judgment, not in an unthinking, mechanical manner. Financial ratio analysis
is a useful part of an investigation process. But financial ratios alone are not the
complete answer to questions about the performance of a firm.
2.2 Review of Related Studies
Prior to this study, several students in various aspects of commercial bank's financial
performance or soundness value carried out various research studies. So it is not a new
research work in this section, some relevant thesis have been reviewed in order to
facilitate the subject matters of current study and some other articles related with this
research work are also reviewed.
2.2.1 Review of Related Articles
The conceptual framework provides the basic concept of financial performance of the
joint venture banks. Relevant articles relating to the different aspects of commercial
banks help to conduct this study smoothly. In this section, some articles are reviewed
which are relating to the study.
Govinda Bahadur Thapa in his namely “Nepalese Banking System can the mess be
managed states; the joint venture banks have been earning a huge profit not from fund
based lending but from fund based activities have slowed drawn in Nepal for several
years. However, commercial banks have not lowered their lending rates to revitalize
the economy. On the country, the commercial banks have been discouraging the
deposits to get rid to excess liquidity. And, new avenue that a country with such a low
saving rate and need to unlimited investment is investing huge amount of resources in
developed countries and is pilling up international reserves. Therefore, it can be
inferred that Nepalese banking system has not been made and motivated to contribute
to the promotion of the economic activities in the country as it should do.”9
In the banking book of Bhuvan Dahal and Sarita Dahal, they define bank as a financial
department store, which renders a host of financial services besides taking deposits and
giving loan. So, bank needs adequate liquidity to fulfill the demand of customers. If
liquidity is inadequate in a bank may lead to collapse while excess liquidity is
detrimental to bank's profitability, to remove this bank need to maintain optimum level
of liquidity, which is possible when there, is correctly predicted. Similarly, a bank
always puts efforts to maximize its profitability. This is so because its shareholders
expect a fair rate of return depositors expect better rate of return and employees expect
handsome salary, perks and bonus. If bank cannot satisfy either of these parties, the
success of the bank is always questioned. The profit is excess of incomes over
expenses. The major source of income of bank is interest income from loan and
investments and fee based income. For this bank invest deposits in the form of loan
and advances which have higher rate of return. But when loan and advances given they
may not pay on time and bank need to fulfill demand of depositors. So liquidity and
profitability are conflicting consideration and in the same way they are like two wheels
of carts, in absence of one bank cannot survive. A bank is an institution, which acts as
the bridge between the depositors and the borrowers and put in efforts to maximize the
earnings mainly through interest spread.10
9 Govinda Bahadur Thapa; Nepalese Banking System; can the mess be managed? The Kathmandu Post, 15th
September, 2000 10 Bhuvan and Sarita Dahal; A hand Book of Banking, Union Press Pvt. Ltd., Nepal, 2nd Edition 2002.
“Bank refers to a financial intermediary who accepts funds, principally as deposits
repayable on demand or at short notice, makes advances by overdrafts and loans, and
to hold other, mainly financial assets like marketable securities. An important banking
function has to maintain a money transmission system by accepting deposits on current
account and operating a system off transferring funds by cheques or gyro transfer.
Other important banking activities include providing foreign exchange service for
customers, financing foreign trade, operating in wholesale money markets and offering
a wide range of financial advisory services.”11
“James C. Van Horne has divided financial ratio into four types liquidity ratio, debt
ratio, profitability ratio and coverage ratio. These ratios are helpful for managerial
control and for a better understanding of what outside suppliers of capital except in
financial condition and performance. He defines until and unless there is comparison,
financial analysis is meaningless so it can be compare with own firm overtime an inter
firm. Additional insight is obtained when balance sheet and income statement items are
expressed as percentage. The percentage can be in relation to total asset or total sales
for some base year. Ratio may be judged in comparison with those of similar terms in
the same line of business and when appropriate with an industry average. In this way,
James Van Horne had written his view regarding financial performance analysis that to
have better analysis there should comparative study about various related ratios with
the several years of the inter bank and with the intra banks so that the strength,
weakness and the position of the firm in the market can be find out and improvement
in the future can be done.”12
In the book of Weston and Brigham, they describe that if management is to maximize
the value of the firm's stock price, it must analysis the weak and strength of the firm
which is possible from the ratio analysis which help to assess the financial
performance in comparing with the firm and other firm. Financial statement analysis
involves a comparison of firm's performance with that of other firm in the same line of
business. The analysis is used to determine the firm's financial position in order to find
11 C.S. Nagpal; Dictionary of economic, Anmol Publications Pvt. Ltd. New Delhi, 2nd Edition, 1998 12 James C. Van Horne; Financial Management and Policy, Prentice Hall of India Pvt. Ltd. India, 2000
out current strengths and weaknesses and to suggest action that might useful to firm to
take advantages to its strength and correction to its weakness. Financial statement
analysis is to evaluate the attractiveness of the firm as an investment by examination its
ability to meet its current obligation and expected financial obligation. However,
financial analysis is done to predict the firm's financial position in future and
determining earnings and dividend. So, financial analysis is useful in both way to
anticipate future conditions and more important, as a starting point for planning actions
that will influence the future course of events. But most important and most difficult
input to successful ratio analysis is the judgment used when interpreting the result to
reach an overall conclusion about the firm's financial position. So, ratio analysis is
used, but analysis should be aware of these problems and make adjustments as
necessary.13
2.2.2 Review of Previous Research Work
Mr. Keshav Raj Joshi through his thesis "A study on financial performance of
commercial banks"14 he reviews that the liquidity position of commercial bank is
satisfactory. He found that comparatively the local commercial banks have been found
relatively highly leveraged compared to the joint venture banks. Loan and advances
have been the main form of investment. Two third of assets have been used for earning
purposes. Profitability position of NABIL bank is stronger than the other commercial
bank.
Ragahu Bir Kapadia, "A comparative study on financial performance of NABIL Bank
and Standard Chartered Bank Limited."15 In this study he found that interest coverage
ratio of both the bank is not satisfactory over the finding period. Price earning ratio of
NABIL bank is on average, higher with consistency than that of SCBL which reflects
than NABIL bank has better performance for the growth in earning that SCBL. The
13 J. Fred Weston and Eugene F. Brigham; Essential of Managerial Finance, Illions Dryden Press. Eleventh
Edition, 1998 14 Keshav Raj Joshi; A study on financial performance of commercial banks, unpublished dissertation T.U. 1989 15 Ragahu Bir Kapadia; A comparative study on financial performance of NABIL Bank and SCBL, unpublished
dissertation, T.U. 2002
study shows efficiency in utilizing the resources is satisfactory. Comparatively NABIL
bank has good and higher liquidity position and higher leverage ratio SCBL.
Ashok Poudel in his thesis "Financial performance analysis of EBL"16 had focused on
the objectives as to examine the financial statement of the bank and analyze them to
see the financial soundness of the bank, to observe the return over the equity, to
highlight the relationship between different variables, to provide suggestion and
recommendation for the improvement of the future performance of EBL based on the
findings of analysis. `
Bindeshwar Mahato, in his thesis "A comparative study of the financial performance of
NABIL and NIBL"17 concludes that, NABIL is more oriented in discharging
responsibilities toward its share holders than NIBL. NABIL is also found paying more
attention towards the attainment of national objective. NABIL participation in the task
of economic development with liberal attitude towards the government and being more
responsive to the national priorities like branch expansion, more employment more
resource mobilization etc is appreciable.
Lekh Raj Karki in his thesis, "A comparative financial soundness analysis with special
reference to HBL and NSBI"18 concludes that NSBI has larger proportion of cash and
bank balance with assets holdings while HBL has better position of loans and
advances. In terms of its volume and annual growth rate. But the proportion of loans
and advances in total assets holdings is lower in HBL than in NSBI. The position of
loans and advances with respect to total current assets total deposits and saving
deposits was relatively more sounder in SBI Bank than in HBL. HBL's ability to attract
the public deposits is sounder than that of SBI Bank. All the values of EPS, DPS and
MVPS are larger in HBL than in NSBI.
16 Ashok Poudel; Financial performance analysis of EBL, Unpublished dissertation, T.U. 2002 17 Bindeshwor Mahato; A comparative study of the financial performance of NABIL and NIBL, Unpublished
Masters Degree Thesis. T.U. 1998. P. 114 18 Lekh Raj Karki; A comparative financial soundness analysis with special reference to HBL and NSBI
Unpublished Masters Degree Thesis, T.U. 2001, P. 127
CHAPTER – III
RESEARCH METHODOLOGY
3.1 Introduction
Research methodology is a systematic and scientific method or technique that is used
in handling a problem by the researcher. So, it is another important aspect of thesis
writing. In other words, research methodology provides various tools and techniques as
regard to the problem and also provides the various instructions as regard to the
methods and process associated with the overall study. In this way research
methodology is the process of arriving to the solution of the problem through planned
and systematic dealing with the collection analysis and interpretation of fact and
figure. Research methodology is very helpful in identifying the research problem. In
fact, research is an art of scientific investigation. For the purpose of achieving the
objectives the detailed research methodology used in this study are highlighted in this
chapter.
"Research is a systematic method of finding out solution to a problem whereas
research methodology refers to the various sequential steps to adopt by a researcher in
studying a problem with certain objectives in view".19
Research methodology covers the wide range of the investigation. According to nature
of the phenomena various statistical and financial tools and techniques are applied to
find out the solution of the problem. Research methodology is composed by two words
'research' and 'methodology'. In common sense research means to search for
knowledge, facts information that is still unknown. Like wise methodology is a
scientific and systematic process that consists of various tools and technique that can
be used to solve, the problems. Therefore, research is a systematic and organized effort
that includes the scientific method of acquiring knowledge. The scientific and
systematic methodology various authors and writers have defined research
methodology in numbers of ways. Some of the definitions are as follows:
19 C.R. Kothari; Research methodology method and technique, Wiley Eastern Pvt. Ltd. New Delhi, 1989, P. 19
"Research methodology is a way to systematically solve the research problem it may
be under stood as a science of studying how research is done systematically."20
"Research is systematic and organized effort to investigate a specific problem that
needs a solution. This process of investigation involves a series of well thought out
activities of gathering, recording, analyzing and interpreting the data with the purpose
of finding answers to the problem. This is the entire process by which we attempt to
solve problems or search the answers to questions is called research."21
From the above definition, research is the scientific and systematic process. It includes
all types of investigation requiring solution to the problem. Research also helps to
discover new ideas, knowledge in a particular area of interest. The scientific and
systematic process of research involves activities of identifying problems, collecting
facts and information tabulating and recording the data, setting hypothesis analysis the
facts and reaching certain conclusion with a view to finding answer to the problem.
3.2 Research Design
The research design is a systematic and conceptual structure within which the study is
to be conducted. Research design is a clear map of all types of investigation. The
appropriate research design is also required for the achievement of desired objectives
of the investigation it can be compared with the blue print of the procedures and
techniques, which guide to the study. "Research design is a plan for the collection and
analysis of data." Research design is the arrangement of conditions for collection and
analysis of data in a manner that aims to combine relevance to the research purpose
with economy in procedure". It presents a serious of guideposts to enable the
researcher to progress right direction in order to achieve the goal. The design may be
as specific presentation of the problem, formulation of hypothesis, conceptual clarity
and methodology, survey of literature and documentation, bibliography, data
collection, interpretation, presentation and report writing.
20 I bid. P.10 21 Howard K. Wolf and Prem R. Pant; Social Science research and thesis writing, 3rd edi., Buddha academic
publishers and distributors, KTM, 2002, P.4
A research design is the specification of methods and procedures for acquiring the
information needed. It is the overall operational pattern of framework the project that
stipulates what information is to be collected from which sources by what procedure.
Research design is essential for the whole study and helps in finding out the starting of
work. The research design is both of descriptive and prescriptive nature. For analytical
purpose, in this research the annual reports published by the related banks and other
publications of the related banks, monthly newsletter, articles published by sample
banks were collected.
3.3 Population and Sample
The term 'Population' or 'Universe' for research means all the members of any well-
defined class of people events or objects. Because of its large size, It is fairly difficult
to collect detailed information from each members a sub-group is chosen which is
believed to be representative of the population. This sub-group is called a sample and
the method of choosing this sub-group is done by sampling.
At present, there are more than seventeen commercial banks performing their activities
in our country Nepal. Among them eight commercial banks are established with the
foreign investment as joint venture commercial banks. Among them, only three joint
venture commercial banks are chosen as sample i.e. Nepal SBI Bank Limited,
Himalayan Bank Limited and Kumari Bank Limited.
3.4 Nature and Sources of Data
Adequate information are required for the research study from the different sources.
The main task of the researcher is to collect information and data from the different
sources. So, for the achievement of the desired objectives the sources of data. By
nature, data can be primary or secondary according to their sources. For this research
study mainly secondary data are used which are collected from the concern publication
from the different publishers.
Financial data of previous 5 years of the selected banks are downloaded from
www.nepalstock.com. Different books from library, periodicals, newspapers,
companies, magazines will also be used whenever required. Needless to say that this
study is associated with fast phenomena, therefore only the secondary data will be used
to carry out the whole calculations.
3.5 Data collection Procedure
Data collection is one of the course very important but there are different tools of data
collecting e.g. interview, questionnaire, schedule etc. Tools of data collection need not
only careful consideration but also proper planning. These tools can best be used only
when researcher has deep understanding of the problem. But techniques of data
collection are dependent on many factor e.g. the type of the people who are to respond,
what is the type of information sought for, duration of research investigation,
availability of manpower and so on.
To obtain the objective of this study various information has been collected from
selected banks, such as annual reports, newspapers and bulletins. Various publications
published by NRB, unpublished periodicals, magazines, dissertations information from
NRB sites have also been used to under take this study. Most of the data used in this
study are from secondary sources of data.
3.6 Data Analysis Tools
Different kind of financial tools and statistical tools and techniques are used to
determine and analyze the relative strengths and weaknesses of the performance of
Nepal SBI Bank Ltd., Himalayan Bank Ltd. and Kumari Bank Ltd. Various financial
and statistical tools that have been used in this study are as follows:
3.6.1 Financial Tools
To evaluate the financial condition and performance of a firm, the ratio analysis is the
most powerful tool of financial analysis. A financial ratio is the numerical relationship
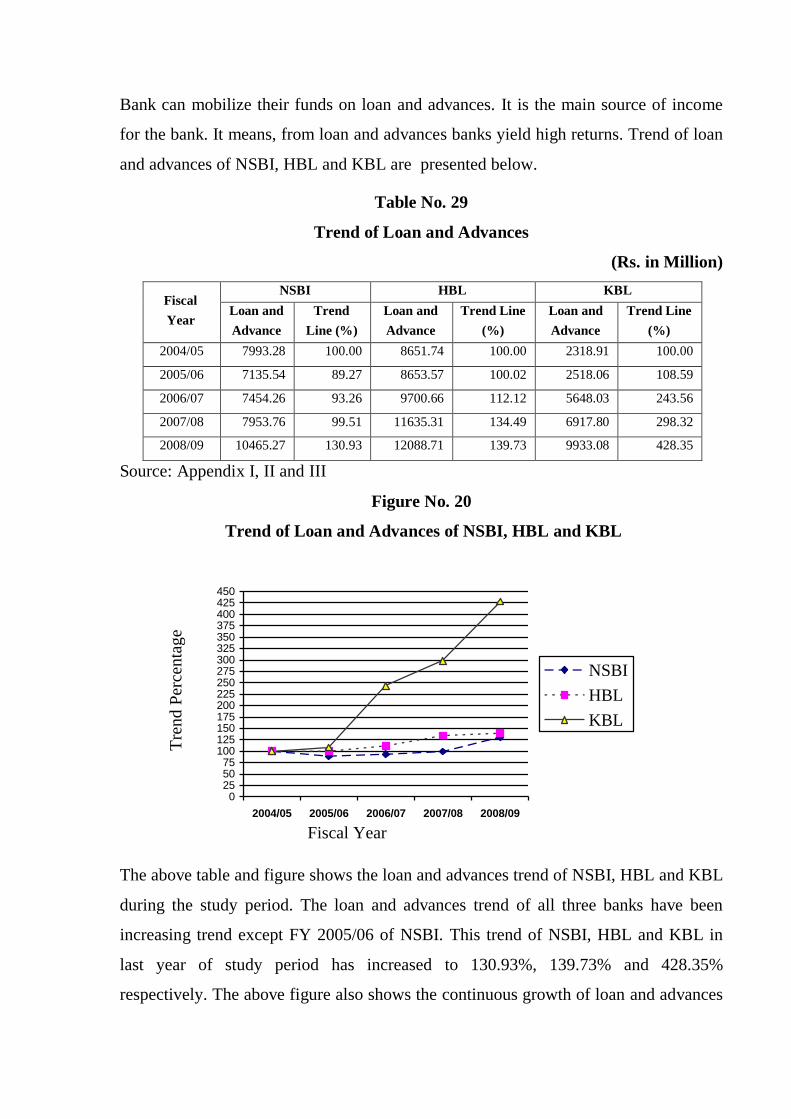
between two financial variables or figures, which should serve some meaningful
purpose. This relationship can be expressed in percentage or times. It is a process of
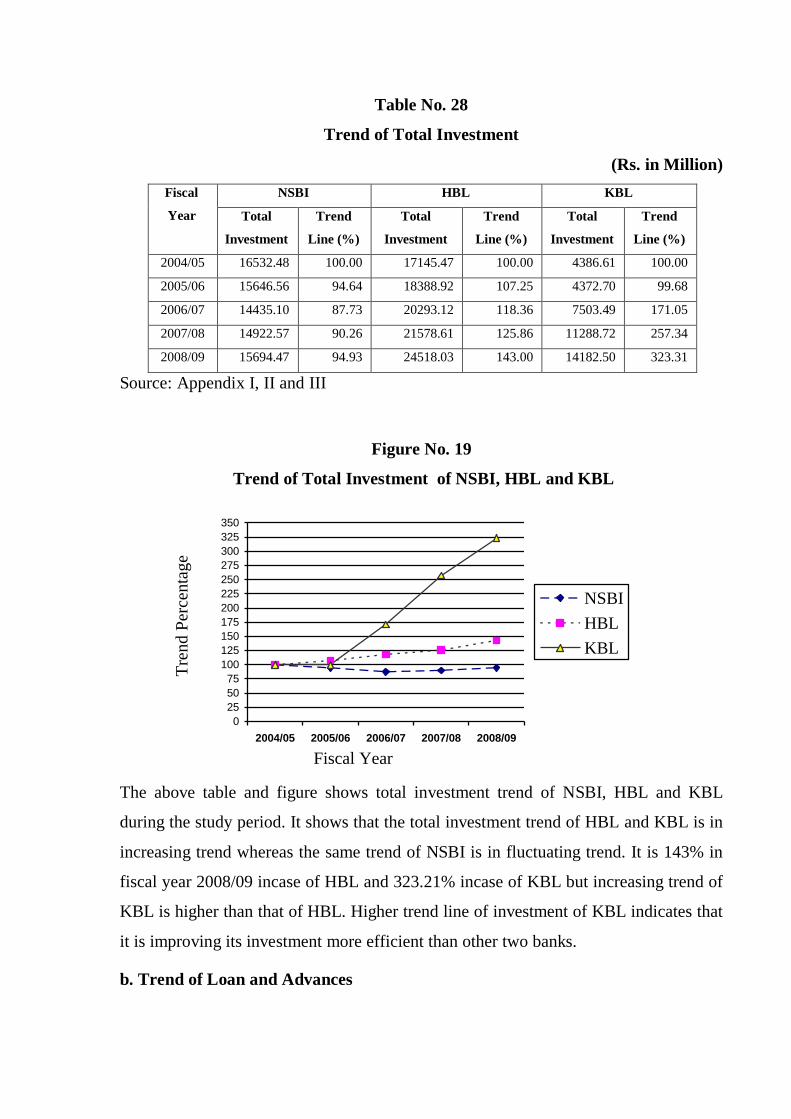
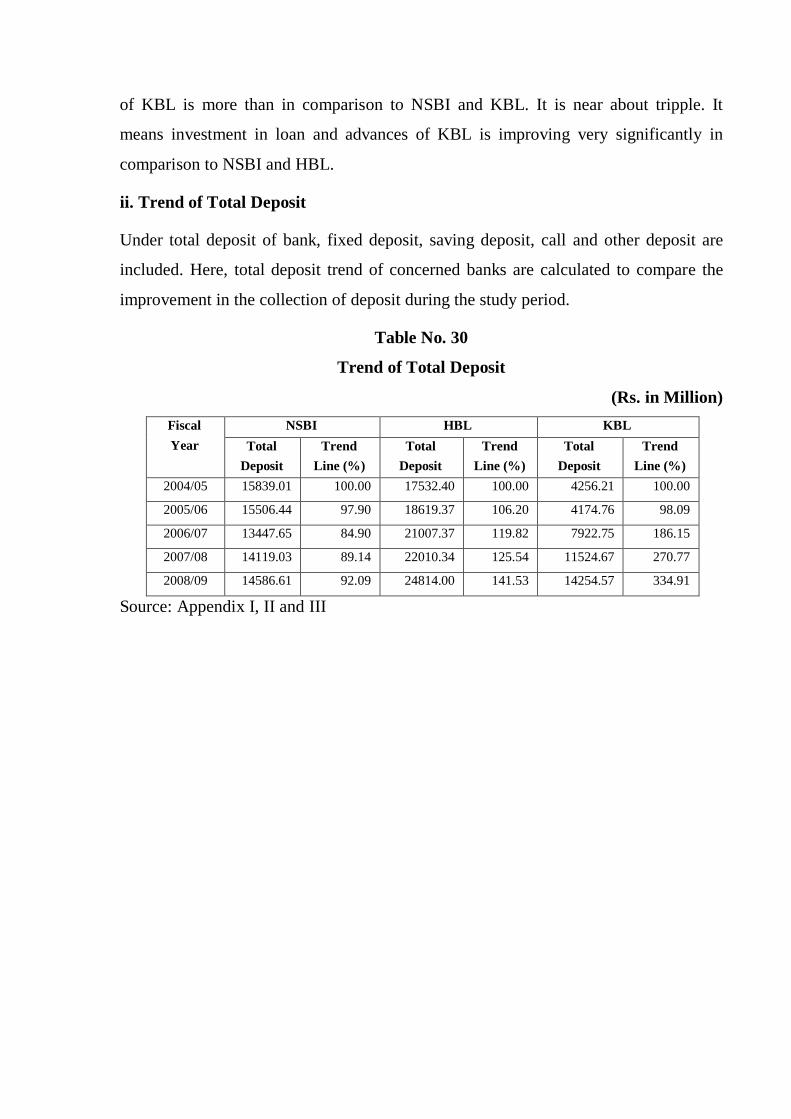
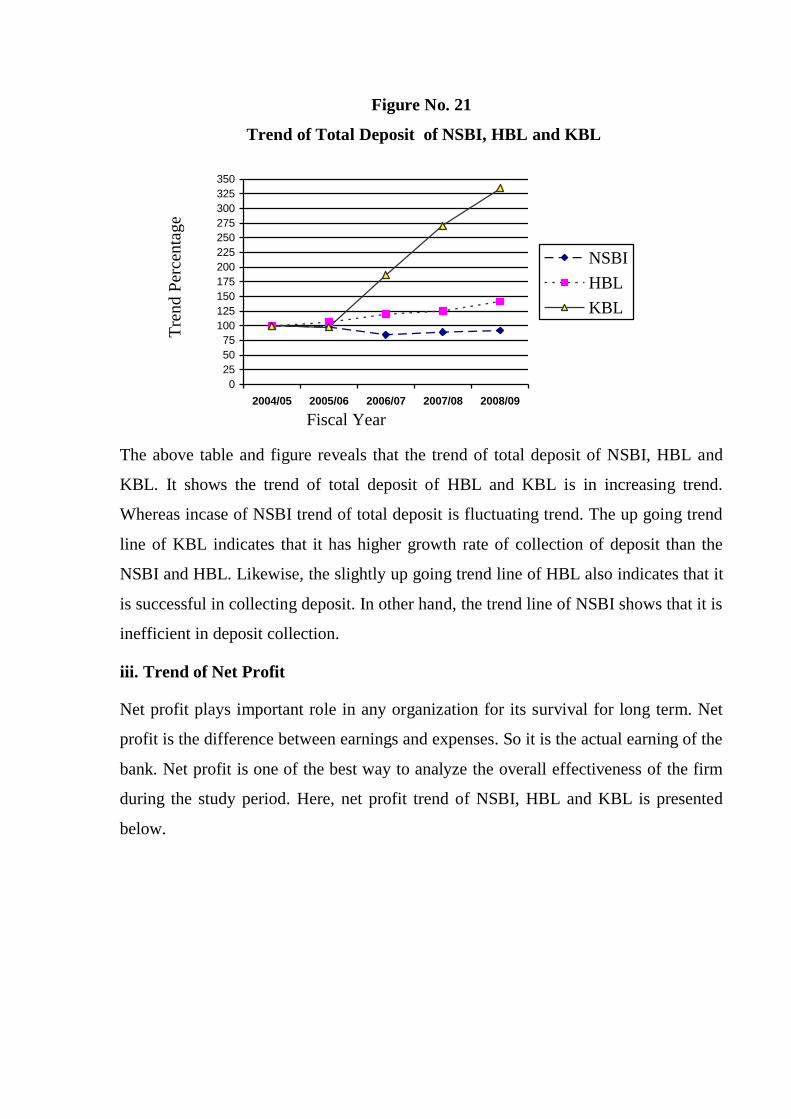
The above table and figure reveals that the trend of total deposit of NSBI, HBL and
KBL. It shows the trend of total deposit of HBL and KBL is in increasing trend.
Whereas incase of NSBI trend of total deposit is fluctuating trend. The up going trend
line of KBL indicates that it has higher growth rate of collection of deposit than the
NSBI and HBL. Likewise, the slightly up going trend line of HBL also indicates that it
is successful in collecting deposit. In other hand, the trend line of NSBI shows that it is
inefficient in deposit collection.
iii. Trend of Net Profit
Net profit plays important role in any organization for its survival for long term. Net
profit is the difference between earnings and expenses. So it is the actual earning of the
bank. Net profit is one of the best way to analyze the overall effectiveness of the firm
during the study period. Here, net profit trend of NSBI, HBL and KBL is presented
below.
Fiscal Year
Tre
nd P
erce
nta
ge
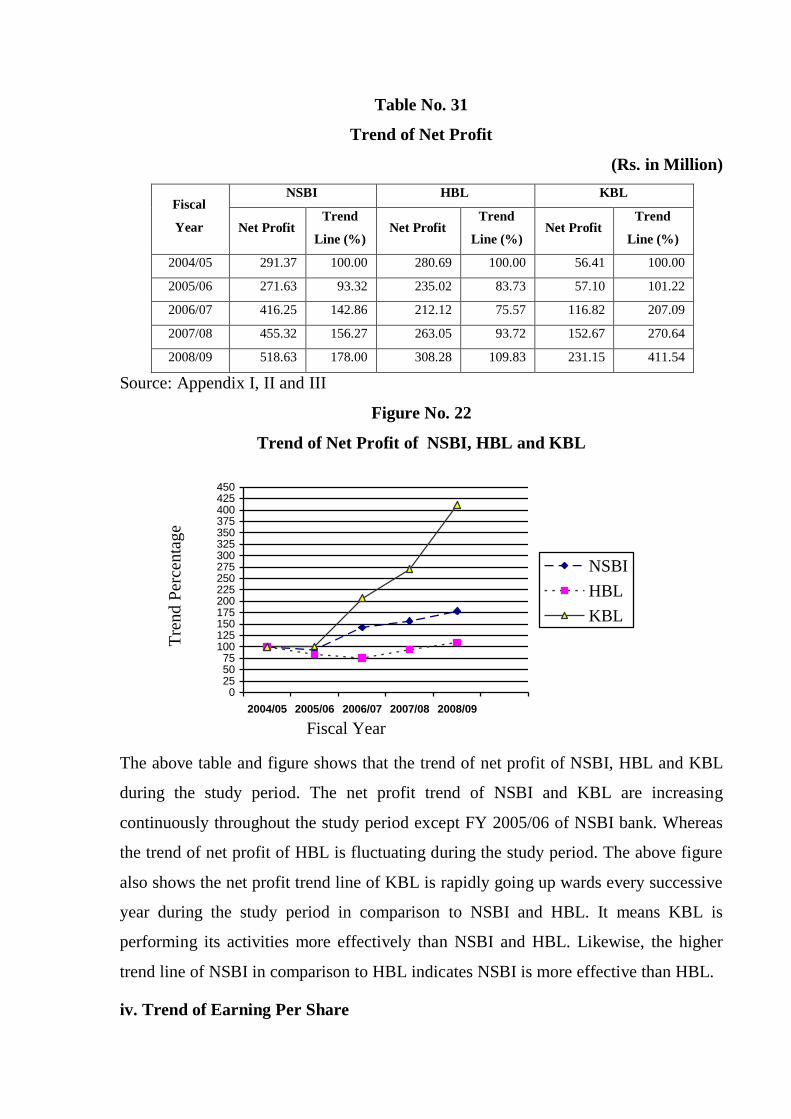
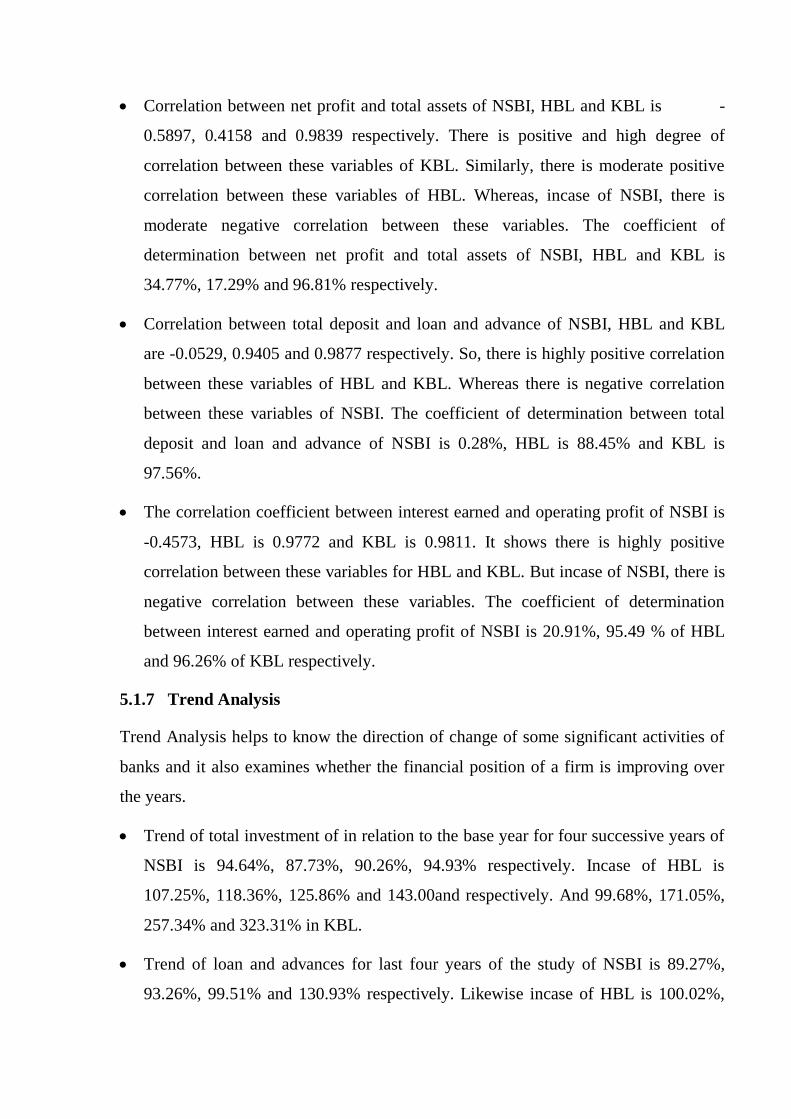
Table No. 31
Trend of Net Profit
(Rs. in Million)
Fiscal
Year
NSBI HBL KBL
Net Profit Trend
Line (%) Net Profit
Trend
Line (%) Net Profit
Trend
Line (%)
2004/05 291.37 100.00 280.69 100.00 56.41 100.00
2005/06 271.63 93.32 235.02 83.73 57.10 101.22
2006/07 416.25 142.86 212.12 75.57 116.82 207.09
2007/08 455.32 156.27 263.05 93.72 152.67 270.64
2008/09 518.63 178.00 308.28 109.83 231.15 411.54
Source: Appendix I, II and III
Figure No. 22
Trend of Net Profit of NSBI, HBL and KBL
0255075
100125150175200225250275300325350375400425450
2004/05 2005/06 2006/07 2007/08 2008/09
NSBI
HBL
KBL
The above table and figure shows that the trend of net profit of NSBI, HBL and KBL
during the study period. The net profit trend of NSBI and KBL are increasing
continuously throughout the study period except FY 2005/06 of NSBI bank. Whereas
the trend of net profit of HBL is fluctuating during the study period. The above figure
also shows the net profit trend line of KBL is rapidly going up wards every successive
year during the study period in comparison to NSBI and HBL. It means KBL is
performing its activities more effectively than NSBI and HBL. Likewise, the higher
trend line of NSBI in comparison to HBL indicates NSBI is more effective than HBL.
iv. Trend of Earning Per Share
Fiscal Year
Tre
nd
Per
cen
tag
e
Earning per share is helped in assessing the profitability of a firm form the owner's
point of view. Shareholders are concerned about the earning that will eventually be
available to pay them dividends of that are used to expand their interest in the firm
retain earning. Here, trend of earning per share of NSBI, HBL and KBL is calculated
to compare the improvement in the earning on a per share basis during the study
period.
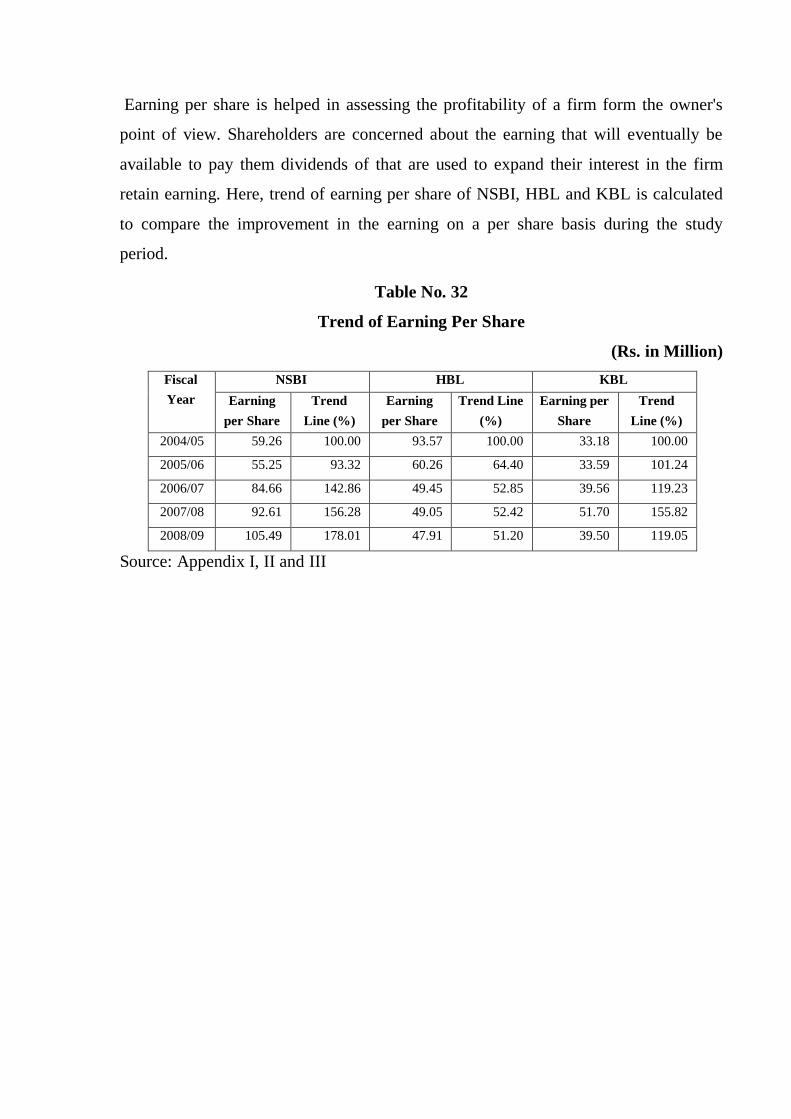
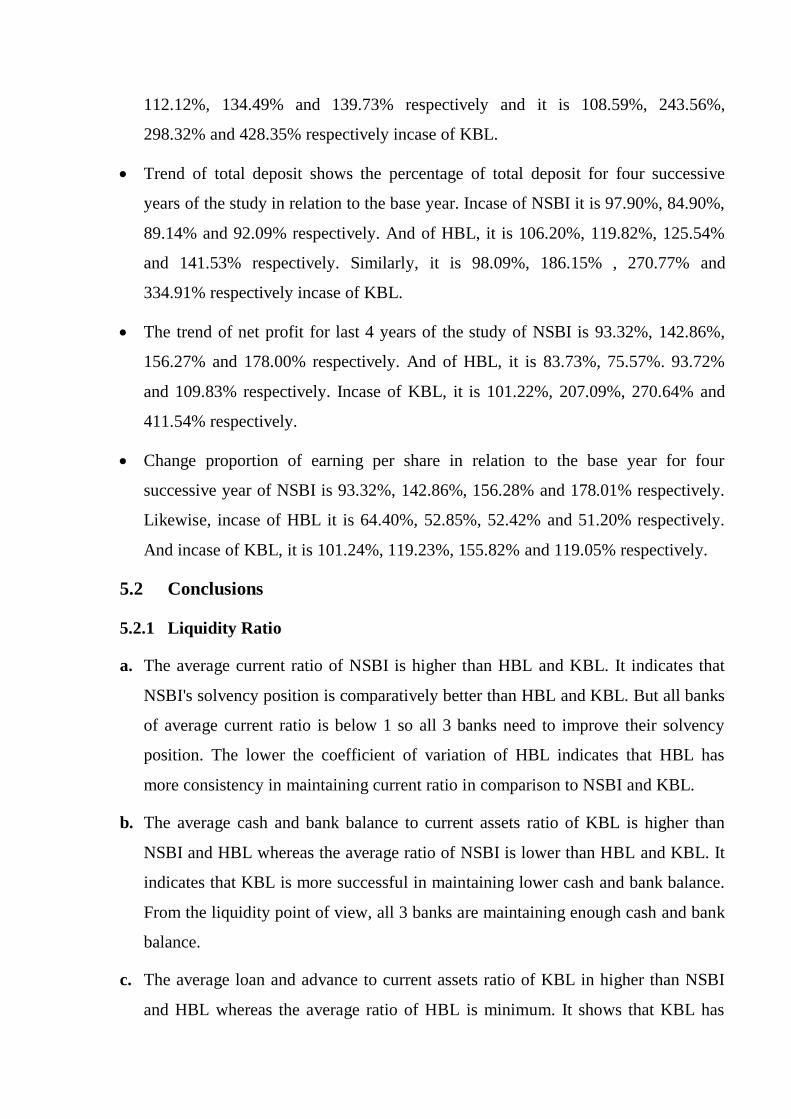
Table No. 32
Trend of Earning Per Share
(Rs. in Million)
Fiscal
Year
NSBI HBL KBL
Earning
per Share
Trend
Line (%)
Earning
per Share
Trend Line
(%)
Earning per
Share
Trend
Line (%)
2004/05 59.26 100.00 93.57 100.00 33.18 100.00
2005/06 55.25 93.32 60.26 64.40 33.59 101.24
2006/07 84.66 142.86 49.45 52.85 39.56 119.23
2007/08 92.61 156.28 49.05 52.42 51.70 155.82
2008/09 105.49 178.01 47.91 51.20 39.50 119.05
Source: Appendix I, II and III
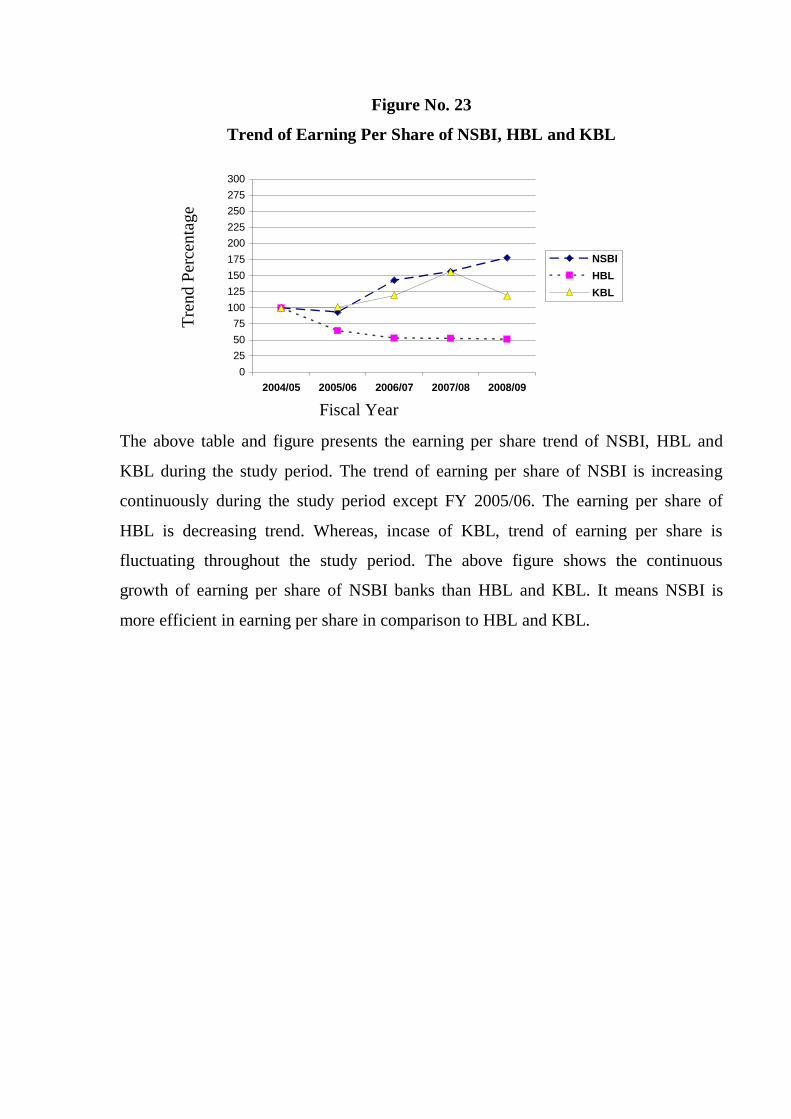
Figure No. 23
Trend of Earning Per Share of NSBI, HBL and KBL
0
25
50
75
100
125
150
175
200
225
250
275
300
2004/05 2005/06 2006/07 2007/08 2008/09
NSBI
HBL
KBL
The above table and figure presents the earning per share trend of NSBI, HBL and
KBL during the study period. The trend of earning per share of NSBI is increasing
continuously during the study period except FY 2005/06. The earning per share of
HBL is decreasing trend. Whereas, incase of KBL, trend of earning per share is
fluctuating throughout the study period. The above figure shows the continuous
growth of earning per share of NSBI banks than HBL and KBL. It means NSBI is
more efficient in earning per share in comparison to HBL and KBL.
Fiscal Year
Tre
nd P
erce
nta
ge
CHAPTER-V
SUMMARY, CONCLUSION AND RECOMMENDATION
5.1 Summary
Capital formation is based upon the saving of the country. Banks promote saving,
mainly by commercial banks. Like this, there is great contribution of commercial
banks to form the capital as well as its mobilization. By collecting saving from the
different people and organizations, it creates fund, which is reinvested to various
productive projects, providing capital to invest. After the restoration of democracy in
Nepal, government took liberalization economic policy. As a result various joint
venture banks are also established. At present all they are performing competitively.
This study, relating commercial banks is done on topic “A comparative analysis of
financial performance of NSBI, HBL and KBL.”
This study is divided into five chapters. They are introduction, review of literature,
research methodology, presentation and analysis of data and summary, conclusion and
recommendation.
The first chapter includes background of study, focus of study, statement of the
problems, objectives of the study, significance of the study, limitation of the study.
The second chapter deals meaning and growth of bank, history and concept of joint
venture commercial banks, objectives of joint venture banks, brief introduction of
NSBI Bank, HBL and KBL, financial performance, financial statements analysis,
review of financial ratio analysis, limitation of the financial ratio are theoretically
reviewed. In this chapter review of related articles and review of research work has
also been described.
Similarly, the third chapter covers research methodology in which research design,
population and sample, nature and sources of data, data collection procedure and tools
of data analysis have been included.
The fourth chapter is main part of the study. In this chapter required data for study are
presented, analyzed and interpreted by using appropriate financial and statistical tools.
In the fifth chapter summary, conclusion and recommendation have been mentioned
for the improvement of the future performance of NSBI, HBL and KBL.
5.1.1 Liquidity Ratio
To access the solvency position or short term financial strength of 3 banks, various
ratios such as current ratio, cash and bank balance to current assets ratio, loan and
advance to current assets ratio, cash and bank balance to total deposit ratio, fixed
deposit to total deposit ratio are calculated.
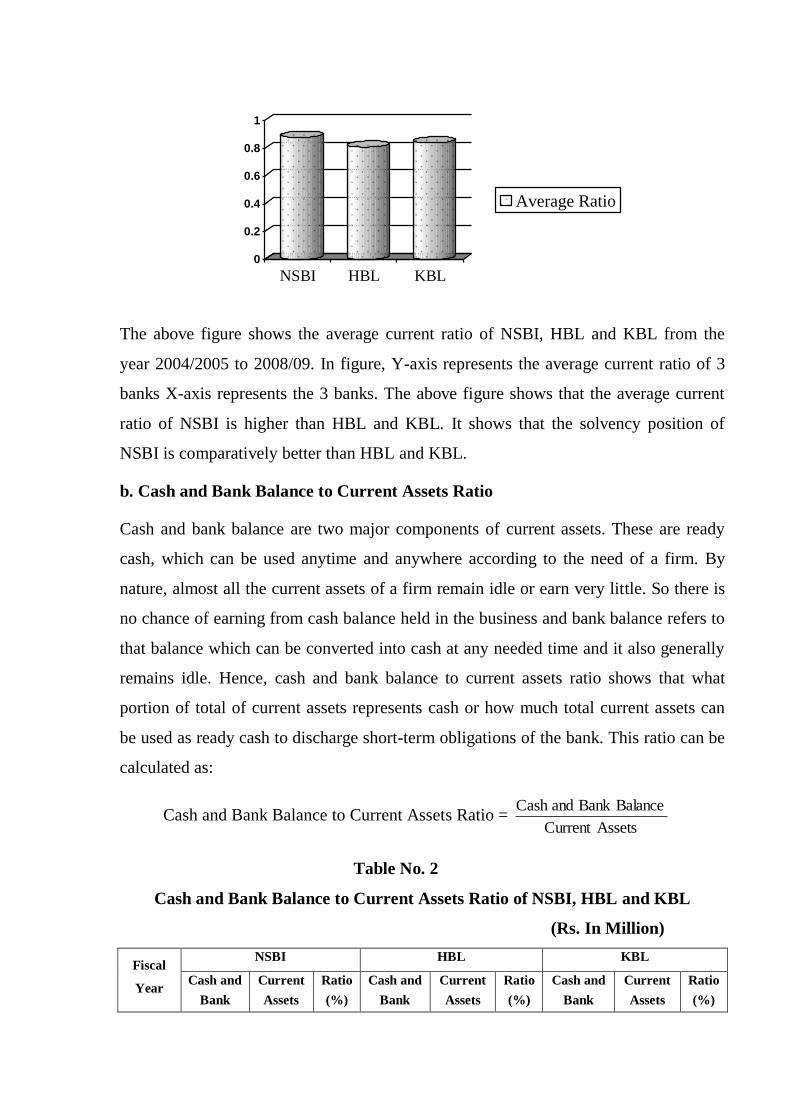
The average current ratio of NSBI, HBL and KBL is 0.88, 0.81 and 0.84
respectively. The coefficient of variation of NSBI is 10.30%, HBL is 9.78% and
KBL is 10.44%.
The mean cash and bank balance to current assets ratio of NSBI is 6.58%, HBL is
9.85% and KBL is 11.23%. Similarly, the coefficient of variation of NSBI is
27.05%, HBL is 14.31% and KBL is 12.91%.
The average loan and advance to current assets ratio of NSBI, HBL and KBL is
58.77%, 57.66% and 70.29% respectively. The coefficient of variation of NSBI is
11.67%, HBL is 8.71% and KBL is 7.92%.
The mean cash and bank balance to total deposit ratio of NSBI is 6.22%, HBL is
8.31% and KBL is 10.07%. The coefficient of variation NSBI is 28.78%, HBL is
12.27% and KBL is 13.50%.
The average fixed deposit to total deposit ratio of NSBI, HBL and KBL is 17.32%,
23.76% and 25.04% respectively. The coefficient of variation NSBI is 20.61%,
HBL is 23.95% and KBL is 31.43%.
5.1.2 Activity Ratio
In this section, to access how efficiently these banks are collecting their funds and
utilizing it in business activities, very ratios are calculated. Such as loan and advance to
total deposit ratio, loan and advance to fixed deposit, total investment to total deposit
ratio etc.
The mean loan and advance to total deposit ratio of NSBI is 56.00%, HBL is
48.72% and KBL is 63.16%. The coefficient of variation of NSBI is 17.38%, HBL
is 5.52% and KBL is 11.24%.
The average proportion of loan and advance to fixed deposit ratio of NSBI is
337.02%, HBL is 216.21% and KBL is 270.85%, the coefficient of variation of
NSBI is 28.08%, HBL is 27.17% and KBL is 28.92%.
The average proportion of total investment to total deposit of NSBI is 105.18%,
HBL is 98.00% and KBL is 99.99% and the coefficient of variation of this ratio for
the study period is 2.60%, 0.82% and 4.01% respectively of NSBI, HBL and KBL.
5.1.3 Leverage Ratio
To find out the long-term financial position of the 3 banks some ratios such as debt
ratio, debt to equity ratio and time interest-earned ratio are calculated.
The average debt ratio of NSBI is 92.26%, HBL is 95.34% and KBL is 92.10%.
The coefficient of variation of NSBI, HBL and KBL is 1.73%, 0.82% and 2.12%
respectively.
The average debt to equity ratio of NSBI, HBL and KBL is 12.39 times, 20.98
times and 11.90 times respectively. The coefficient of variation of NSBI is 2.08%,
HBL is 1.79% and KBL is 2.81%.
The mean time interest earned ratio of NSBI is 2.82%, HBL is 1.73% and KBL is
1.74%. The coefficient of variation of NSBI, HBL and KBL is 34.40%, 9.25% and
9.77% respectively.
5.1.4 Profitability Ratio
The profitability ratio analysis is done to assess the earning pattern as well as
profitability pattern of concern banks i.e. NSBI, HBL and KBL.
Mean return on equity ratio of NSBI is 28.96%, HBL is 25.23% whereas it is
16.37% of KBL and the coefficient of variation of this of NSBI, HBL and KBL is
11.11%, 32.98% and 28.04% respectively.
Average return on total assets ratio of NSBI is 2.27%, HBL is 1.13% and KBL is
1.23%. The coefficient of variation of NSBI, HBL and KBL is 29.92%, 17.12%
and 11.11% respectively.
Average return on total deposit of NSBI is 2.69%, HBL is 1.26% and KBL is
1.42%. The coefficient of variation of NSBI, HBL and KBL is 30.86%, 16.67%
and 9.15% respectively.
The average interest earned to total assets ratio for the study period on NSBI is
6.32%, 5.54% on HBL and 5.89% on KBL. The coefficient variation of this ratio of
NSBI is 5.54%, HBL is 13.18% and KBL is 12.73%.
5.1.5 Other Ratio
For accessing the financial performance of 3 banks other some indicators have also
been calculated. Such as, earning per share, dividend per share, dividend payout ratio
etc. have been calculated and analyzed.
Average earning per share of NSBI is 94.93%, HBL is 60.65% and KBL is 39.51%.
The coefficient of variation of NSBI, HBL and KBL is 23.04%, 32.29% and
18.93% respectively.
The average dividend per share of NSBI is 13.58%, HBL is 8.52% and KBL is
6.33%. The coefficient of variation of NSBI, HBL and KBL is 31.15%, 73.47%
and 95.89% respectively.
Average dividend payout ratio of NSBI is 14.29%, HBL is 13.00% KBL is 16.98%.
The coefficient of variation of NSBI, HBL and KBL is 26.31%, 38.08% and
112.13% respectively.
5.1.6 Correlation Analysis
Correlation analysis, a statistical technique has been used to measure the degree and
direction of relationship between the variables. Under this, correlation between net
profit and total assets, between total deposit and loan and advance and between interest
earned and operating profit has been calculated to know the relationship between the
concerned variables.
Correlation between net profit and total assets of NSBI, HBL and KBL is -
0.5897, 0.4158 and 0.9839 respectively. There is positive and high degree of
correlation between these variables of KBL. Similarly, there is moderate positive
correlation between these variables of HBL. Whereas, incase of NSBI, there is
moderate negative correlation between these variables. The coefficient of
determination between net profit and total assets of NSBI, HBL and KBL is
34.77%, 17.29% and 96.81% respectively.
Correlation between total deposit and loan and advance of NSBI, HBL and KBL
are -0.0529, 0.9405 and 0.9877 respectively. So, there is highly positive correlation
between these variables of HBL and KBL. Whereas there is negative correlation
between these variables of NSBI. The coefficient of determination between total
deposit and loan and advance of NSBI is 0.28%, HBL is 88.45% and KBL is
97.56%.
The correlation coefficient between interest earned and operating profit of NSBI is
-0.4573, HBL is 0.9772 and KBL is 0.9811. It shows there is highly positive
correlation between these variables for HBL and KBL. But incase of NSBI, there is
negative correlation between these variables. The coefficient of determination
between interest earned and operating profit of NSBI is 20.91%, 95.49 % of HBL
and 96.26% of KBL respectively.
5.1.7 Trend Analysis
Trend Analysis helps to know the direction of change of some significant activities of
banks and it also examines whether the financial position of a firm is improving over
the years.
Trend of total investment of in relation to the base year for four successive years of
NSBI is 94.64%, 87.73%, 90.26%, 94.93% respectively. Incase of HBL is
107.25%, 118.36%, 125.86% and 143.00and respectively. And 99.68%, 171.05%,
257.34% and 323.31% in KBL.
Trend of loan and advances for last four years of the study of NSBI is 89.27%,
93.26%, 99.51% and 130.93% respectively. Likewise incase of HBL is 100.02%,
112.12%, 134.49% and 139.73% respectively and it is 108.59%, 243.56%,
298.32% and 428.35% respectively incase of KBL.
Trend of total deposit shows the percentage of total deposit for four successive
years of the study in relation to the base year. Incase of NSBI it is 97.90%, 84.90%,
89.14% and 92.09% respectively. And of HBL, it is 106.20%, 119.82%, 125.54%
and 141.53% respectively. Similarly, it is 98.09%, 186.15% , 270.77% and
334.91% respectively incase of KBL.
The trend of net profit for last 4 years of the study of NSBI is 93.32%, 142.86%,
156.27% and 178.00% respectively. And of HBL, it is 83.73%, 75.57%. 93.72%
and 109.83% respectively. Incase of KBL, it is 101.22%, 207.09%, 270.64% and
411.54% respectively.
Change proportion of earning per share in relation to the base year for four
successive year of NSBI is 93.32%, 142.86%, 156.28% and 178.01% respectively.
Likewise, incase of HBL it is 64.40%, 52.85%, 52.42% and 51.20% respectively.
And incase of KBL, it is 101.24%, 119.23%, 155.82% and 119.05% respectively.
5.2 Conclusions
5.2.1 Liquidity Ratio
a. The average current ratio of NSBI is higher than HBL and KBL. It indicates that
NSBI's solvency position is comparatively better than HBL and KBL. But all banks
of average current ratio is below 1 so all 3 banks need to improve their solvency
position. The lower the coefficient of variation of HBL indicates that HBL has
more consistency in maintaining current ratio in comparison to NSBI and KBL.
b. The average cash and bank balance to current assets ratio of KBL is higher than
NSBI and HBL whereas the average ratio of NSBI is lower than HBL and KBL. It
indicates that KBL is more successful in maintaining lower cash and bank balance.
From the liquidity point of view, all 3 banks are maintaining enough cash and bank
balance.
c. The average loan and advance to current assets ratio of KBL in higher than NSBI
and HBL whereas the average ratio of HBL is minimum. It shows that KBL has
been providing the maximum percentage of its current assets in the form of loan
and advance. So the utilization of current assets as loan and advances has been
found higher in KBL and lower in HBL. This shows the better performance of KBL
in providing loan and advances.
d. The cash and bank balance to total deposit ratio of NSBI, HBL and KBL is in
fluctuating trend throughout the study period. This fluctuating trend shows the
fluctuating ability to maintain cash and bank balance. The average cash and bank
balance to total deposit ratio of KBL is higher than NSBI and HBL. It means KBL
is maintaining higher cash and bank balance than other two banks whereas NSBI is
maintaining lower cash and bank balance. It is clear that KBL is unable to mobilize
its total deposit to earn more profit whereas NSBI has taken risk by investing its
deposits to earn more profit. Thus, NSBI has utilized more deposit for generating
income. It means NSBI is significantly better in utilizing deposit.
e. The average fixed deposit to total deposit ratio of KBL is higher than NSBI and
HBL whereas NSBI has lower ratio. It indicates that NSBI has failed to accumulate
more fixed deposit amount comparatively than HBL and KBL. From viewpoint of
liquidity greater portion of fixed deposit may be termed as favorable one. So all
three banks are unable to maintaining fixed deposit in satisfactory manner.
5.2.2 Activity Ratio:
a. The average loan and advances to total deposit of KBL in greater than that of NSBI
and HBL. It shows that KBL has better utilization of total deposit in investing loan
and advances than the other two banks. Since investing total deposit in such
investment like loan and advances will be riskier due to liquidity. Therefore,
utilization of total deposit in loan and advances shows better performance of the
bank. So KBL stands first among these three banks whereas NSBI stands ahead of
HBL.
b. The average loan and advance to fixed deposit ratio of NSBI is higher than HBL
and KBL. It shows that NSBI has better utilization of fixed deposit for investing in
loan and advances than that of HBL and KBL. Similarly, KBL is using
comparatively more fixed deposits in granting loan and advances than that of HBL.
c. The average proportion of total investment to total deposit of NSBI is higher than
HBL and KBL. This indicates that NSBI has utilized its total deposits for
investment purpose more efficiently than HBL and KBL. Similarly, KBL has
higher deposit utilization capacity than HBL because the average ratio of total
investment to total deposit of KBL is greater than HBL. But the consistency of
utilizing total deposits for investment is better of HBL than NSBI and KBL.
5.2.3 Leverage Ratio
a. Total debt to total assets ratio of HBL is higher than NSBI and KBL. Whereas
KBL's ratio is lower than other banks. NSBI, HBL and KBL would find difficulty
to borrow additional funds without first raising more equity capital. Creditors
would be reluctant to lend the firm more money and management would probably
be subjecting the firm to the risk of bankrupty if it sought to increase the debt ratio
any further by borrowing additional funds.
b. The average debt to equity ratio of HBL is higher than NSBI and KBL. It shows
that HBL position is not satisfactory in comparison to NSBI and KBL. Likewise,
KBL's debt to equity ratio is lower than that of NSBI and HBL. So its position is
relatively satisfactory in comparison with other twos banks. Overall, these ratios of
all 3 banks are not very satisfactory because they are relying mainly on borrowed
fund.
c. The average time interest earned ratio of NSBI is higher than HBL and KBL. It
indicates that NSBI can pay off its interest easily. Whereas, HBL and KBL has low
coverage ratio. So they are recommended to increase its coverage ratio.
5.2.4 Profitability Ratio
a. The return on equity ratio of NSBI is comparatively higher than other two banks. It
indicates that NSBI has utilized its shareholder's fund more effectively in profit
yielding purpose than that of HBL and KBL. Similarly, HBL is performing more
efficiently than KBL.
b. NSBI has higher rate of return on total assets in comparison to HBL and KBL. It
indicates that NSBI has more efficient to utilize its assets than that of HBL and
KBL. HBL and KBL are not seems to be utilized its assets more efficiently.
c. Return on total deposit of NSBI is higher than that of HBL and KBL. It shows that
NSBI is more efficient to mobilize its total deposit for profit yielding purpose than
the HBL and KBL. Likewise, ratio of return on total assets of KBL is higher in
comparison to HBL shows that KBL is more effectively utilizing its total deposit in
generating profit than the HBL.
d. Higher interest earned to total assets ratio of NSBI indicates that NSBI is able to
utilize its assets successfully to earn more interest than HBL and KBL. Similarly,
KBL is performing more efficiently than HBL because of higher interest earned to
total assets ratio in comparison to HBL.
5.2.5 Other Ratio
a. NSBI has higher earning per share in comparison to HBL and KBL. It indicates that
NSBI has higher profitability on per share earning. Earning per share of KBL is
lowest among these 3 banks but, the coefficient of variation shows that it is more
consistent in earning on per share basis than NSBI and HBL.
b. Higher percentage of dividend per share of NSBI indicates that NSBI is more
efficient to contribute dividend than that of HBL and KBL. Similarly, higher
percentage of dividend per share of HBL in comparison to KBL indicates that HBL
is more efficient than KBL.
c. Dividend payout ratio of KBL is higher than that of NSBI and HBL. It indicates that
KBL has been relatively paying more dividend to its shareholders out of its
earnings. Likewise, higher dividend payout ratio of NSBI in comparison to HBL
indicates that NSBI is more efficient to paying more dividend than HBL.
5.2.6 Correlation Analysis
a. There is highly positive correlation between net profit and total assets of KBL
whereas NSBI has the moderate negative correlation between net profit and total
assets. Incase of HBL, there is moderate positive correlation between these two
variables. On the basis of coefficient of determination, it is known that when there
is change in net profit it brings 17.29% and 96.81% change in total assets of HBL
and KBL respectively. Whereas, incase of NSBI change in net profit brings 34.77%
opposite change in total assets. Therefore, it can be said that net profit and total
assets are not relatively correlated incase of NSBI.
b. There is very highly positive correlation between total deposit and loan and
advance in HBL and KBL. But in case of NSBI, there is negative correlation
between these two variables. On the basis of coefficient of determination, it is
known that when there is change in total deposit it brings 88.45%, 97.56% change
in loan and advance of HBL and KBL. Incase of NSBI, there is not relatively
correlated between total deposit and loan and advance because when there is
change in total deposit it brings 0.28% opposite change in loan and advances.
c. There is highly positive correlation between interest earned and operating profit of
HBL and KBL. But incase of NSBI, there is moderate negative correlation between
these two variables. On the basis of coefficient of determination, it is known that
when there is change in interest earned it brings 95.49% and 98.11% change in
operating profit of HBL and KBL respectively. Whereas, incase of NSBI change in
interest earned brings 20.91% opposite change in operating profit.
5.2.7 Trend Analysis:
a. The total investment trend of HBL and KBL is in increasing trend; Whereas the
same trend of NSBI is in fluctuating trend. While comparing growth rate of
investment among three banks, it is found that KBL has higher growth rate than
that of other two banks. NSBI's trend of total investment shows that it is poorest
among three banks.
b. Trend of loan and advances of all three banks is an increasing trend. The growth
rate of loan and advances increase of NSBI is nearly 3 times more higher than HBL
and KBL. This indicates that NSBI is granting its great portion as loan and
advances than that of other two banks.
c. The total deposit trend of HBL and KBL is in increasing trend, whereas the same
trend of NSBI is in fluctuating trend. The growth rate of total deposit among three
banks, KBL has higher growth rate than NSBI and HBL. Similarly, HBL has higher
growth rate of total deposit than NSBI.
d. Trend of net profit of NSBI and KBL is in increasing trend, whereas the same trend
of HBL is in fluctuating trend. While comparing growth rate of Net Profit among
three banks it is found that KBL has higher growth rate than NSBI and HBL.
Likewise, NSBI has higher growth rate of net profit than HBL.
e. Earning per share trend on NSBI is in increasing trend, it is in decreasing trend in
case of HBL whereas it is a fluctuating trend incase of KBL.
5.3 Recommendations
i. Average current ratio of all three banks i.e. NSBI, HBL and KBL is below 1 so all
three banks need to improve their solvency position either by increasing their
current assets or by decreasing their current liabilities.
ii. KBL is maintaining excess cash and bank balance, which is the symbol of idle
fund. Hence, it is suggested to mobilize its idle fund in short term loan.
iii. KBL is utilizing its assets properly in providing loan and advances in various
sectors. This shows the better performance of KBL in providing loan and
advances but KBL should be careful in recovery of loan and advances. HBL
should utilize maximum part of its current assets as a loan and advance in order to
maximize its profit.
iv. HBL performance in mobilizing its deposit in the form of investments is weak
among the three banks so it should identify the new investing sector.
v. The higher the debt to equity ratio is regarded as weaker financial position of any
firm. Generally, debt to equity ratio below 0.50 is regarded as sound position for
banking sector. So, HBL needs to decrease its debt equity ratio. This bank should
insist more in raising additional equity fund.
vi. Generally, higher interest coverage ratio is treated as good for banking sector. So
HBL and KBL is recommended to increase its interest coverage ratio.
vii. KBL has comparatively low average proportion of earning per share. So it is
suggested to KBL increase its EPS in order to increase the overall profitability of
the bank.
viii. Trend of total deposit of NSBI shows that there is lower rate of growth. So NSBI
is recommend to increase collection of deposit at higher rate.
ix. The credit worthiness of debtors must be evaluated before granting the loans.
x. Due to the establishment of other commercial banks, finance companies, co-
operative banks and insurance companies launching of new advance service such
as Tele Banking, ATM, Debit/ Credit card etc by them, so it is recommended to
all three banks that are for providing such services in all their branches in and out
from the valley.
BIBLIOGRAPHY
Annual Reports of Himalayan Bank Ltd.
Annual Reports of Kumari Bank Ltd.
Annual Reports of Nepal SBI Bank Ltd.
Bhandari, Dilli Raj; Banking and insurance 1st ed., Aayush Prakashan, Kathmandu,
2003
Chopra, Sunil; Nepal Rastra Bank Samachar, Nepal Rastra Bank, Kathmandu, 2046
Dahal, Bhuwan and Sarita; A hand book to banking, 2nd edition, Asmita Books and
Stationary, Kathmandu, 2002
Kothari, C.R; Research methodology method and technique, Wiley Eastern Pvt. Ltd.
New Delhi, 1989
Munakarmi, Shiva Prasad; Management accounting, Buddha academic enterprises,
Kathmandu, 2003
Nagpal, C.S.; Dictionary of economic, Anmol Publications Pvt. Ltd., New Delhi, 2nd
Edition, 1998
Pandey, I.M.; Financial Management, 7th ed., Vikas Publishing house Pvt. (Ltd.) New
Delhi, 1997
Stevenson, Richard A; Fundamentals of Finance, international student edition, MC.
Graw-Hill international book Company, 1981
Thapa, Govinda Bahadur; Nepalese Banking System; can the mess be managed? The
Kathmandu Post, 15th September, 2000
Van Horne, James C.; Financial Management and Policy, Prentice Hall of India Pvt.
Ltd. India, 2000
Weston, J. Fred and Brigham, Eugene F.; Essential of Managerial Finance, Illions
Dryden Press, Eleventh Edition, 1998
Wolf, Howard K. and Pant, Prem R.; Social Science research and thesis writing, 3rd
edi., Buddha academic publishers and distributors, KTM, 2002
www.himalayabank.com
www.kumaribank.com
www.nepalstock.com
Unpublished Dissertations
Joshi, Keshav Raj; A study on financial performance of commercial banks,
Unpublished dissertation T.U. 1989
Kapadia, Ragahu Bir; A comparative study on financial performance of NABIL Bank
and SCBL, unpublished dissertation, T.U. 2002
Karki, Lekh Raj; A comparative financial soundness analysis with special reference to
HBL and NSBI, Unpublished Masters Degree Thesis, T.U. 2001
Mahato, Bindesowr; A comparative study of the financial performance of NABIL and
NBL, Unpublished Masters Degree Thesis, T.U. 1998
Poudel, Ashok; Financial performance analysis of EBL, unpublished dissertation, T.U.
2002
APPENDIX-I
NEPAL SBI BANK LTD Head office: Durbar Marg, Kathmandu Paid up value/share Rs. 100 & Rs. 0 Authorized capital: Rs. 1000000000.00 Incorporation year B.S. 2050 A.D. 1193 Issued Capital: Rs. 500000000.00 Listing Date: B.S.10/03/51 A.D. : 1195
Paid-up Capital Rs. 425157300.00 Par Value/Share Rs. 100 & Rs. 0
CHANGES IN PAID-UP CAIPTAL Rs. in Million
Year Before After Remarks
2004/05 119.95 343.94 Bonus 1:1
2005/06 343.94 424.89 Right Share 2:1
2006/07 424.89 425.16
2007/08 425.16 426.86
2008/09 426.86 427.15
COMPARATIVE BALANCE SHEET Rs. in Million
As at Balance sheet 2004/05 2005/06 2006/07 2007/08 2008/09 Property & Assets A. Cash balance
208.48
318.16
187.78
286.89
146.35
B. Balance with Banks 604.42 733.66 956.99 683.60 413.03
C. Money at call & short notice 522.55 31.37 670.20 918.73 868.43 D. Investment: a. Government Securities 2732.96 4120.29 3588.77 3672.63 2413.94 b. Share & Debenture 18.82 22.22 22.22 22.22 27.36 c. Others 4952.53 4057.00 2420.18 2141.22 1825.93 7704.31 8199.51 6031.17 5836.07 4267.23 E. Loan, Advances & Bills Purchased: a. Loans, Cash Cr. & Overdrafts 7993.28 7135.54 7454.26 7953.76 10465.27
b. Bill Discounted & purchase 331.16 302.36 301.69 236.23 120.90 8324.44 7434.90 7755.95 8189.99 10586.17 F. Fixed Assets (Net): Gross Block 364.13 395.66 433.12 550.17 611.28 Less: Depreciation (129.01) (158.03) (181.21) (212.09) (250.09) 235.12 237.63 251.91 338.13 361.24 G. Others Assets: a. Interest Receivable 291.37 100.68 177.60 174.49 168.86
b. Misc. Current Assets 476.46 570.34 531.01 317.71 375.02 c. Misc. Assets 0.00 0.00 0.00 0.00 0.00 767.83 671.02 708.61 492.20 543.88 Total Assets 18367.15 17629.25 16562.61 16745.61 17186.33 Capital & Liabilities A. Current Liabilities a. Deposit & other A/C's Saving 4917.14 4972.06 5229.72 5994.12 7026.33
Fixed 3719.20 2446.85 2252.54 2310.57 2078.54 Current 2850.97 2703.82 3034.00 2688.97 2799.18 Call & Short Deposit 3948.34 4944.96 2540.70 2801.41 2341.33 Other 403.36 438.75 390.69 323.96 341.23 15839.01 15506.44 13447.65 14119.03 14586.61 b. Short term loan 0.00 417.30 961.46 229.66 17.06 c. Bills payable 69.70 67.75 108.94 173.50 119.75 d. Tax provision 0.00 0.00 0.00 0.00 0.00
e. Staff Bonus 52.60 44.12 66.36 71.94 84.20 f. Dividend payables 143.52 11.80 94.14 36.88 17.06 g. Misc. Current Liabilities 1121.38 337.32 456.87 522.12 596.14 Total Current Liabilities (A) 17226.21 16384.73 15135.72 15153.13 15420.82 B. Differed Liabilities a. Long Term Loan 0.00 0.00 0.00 0.00 0.00 b. Other Differed Liabilities 78.11 98.10 113.01 110.80 107.88 Total Differed Liabilities (B) 78.11 98.10 113.01 110.80 107.88
C. Net Worth
a. Share Capital Ordinary share 50.00 50.00 50.00 50.00 50.00 Bonus share 441.65 441.65 441.65 441.65 441.65
Preference share 0.00 0.00 0.00 0.00 0.00 Total Share Capital 491.65 491.65 491.65 491.65 491.65 b. Share holder's Reserves: General Reserve 514.50 568.83 652.08 743.20 847.00 Capital Reserve 0.07 49.24 103.32 162.87 228.37
Exchange Fluctuation Reserve 25.11 28.26 30.01 33.90 37.80 Other Reserve 5.33 6.33 7.33 20.27 22.83 Unappropriated Profit (Loss) 26.17 2.11 29.79 29.79 29.98 Total Shareholder's Reserve 571.18 654.77 822.53 990.03 1165.98 Net Worth (C) 1062.83 1146.42 1314.18 1481.68 1657.63 Total Capital & Liabilities (A+B+C) 18367.15 17629.25 16562.61 16745.61 17186.33
COMPARATIVE PROFIT & LOSS ACCOUNT
For the period Ending 2004/05 2005/06 2006/07 2007/08 2008/09 A. Operating Income a. Interest Earned 1266.70 1120.18 1017.87 1001.62 1068.75 b. Commission & Discount 146.84 114.34 144.41 135.96 128.88 c. Exchange Income 159.51 154.22 144.08 157.32 184.88 d. Dividend 0.26 0.00 0.00 0.00 0.00 e. Other Income 0.00 250.37 34.15 38.75 55.93 Total Income (A) 1573.31 1639.11 1340.51 1333.65 1438.44
B. Expenses: a. Cost of Service: Interest Paid: On Borrowings 13.57 5.31 9.85 17.47 15.64 On Deposits 564.79 456.77 307.50 265.47 227.90 578.36 462.08 317.35 282.94 243.54 Salaries, Allowances & P.F. 145.86 144.88 210.58 180.84 199.52 Total Cost of Service 724.22 606.96 527.93 463.78 443.06
b. Provision of Staff Bonus 52.60 44.12 66.36 71.94 84.20 c. Provision for Doubtful Debts 165.77 0.00 0.00 1.05 4.21 d. Total General Expenses 132.73 538.65 182.73 186.31 162.72 Total Expenses (B) 1075.32 1189.73 777.02 723.08 694.19 Gross Profit (A-B) 497.99 449.38 563.49 610.57 744.25 Less. Depreciation 26.27 39.75 35.04 46.27 58.71 Operating Profit 471.72 409.63 528.45 564.30 685.54 Add: Income from other sources 1.64 (0.05) 86.95 92.78 72.24 Pre tax Profit 473.36 409.58 615.40 657.08 685.54
Less: Provision for tax 181.99 137.95 199.15 201.76 239.15 Net Profit 291.37 271.63 416.25 455.32 518.63
Key Indicators of Last Five Years Unit 2004/05 2005/06 2006/07 2007/08 2008/09 Earning Per Share Rs. 59.26 55.25 84.66 92.61 105.49
Market Value Per share Rs. 1500 735 735 1000 1505 Price Earning Ratio Ratio 25.31 13.30 8.68 10.80 14.27 Divided of share capital (Including Bonus)
Percent
60.11
30
50
65
70
Dividend per share Rs. 40 30 50 65 70 Dividend Percent 40 30 50 65 70 Market Capitalization of Closing price (Rs. in Million)
Rs.
7374.82
3613.66
3613.66
4916.36
7399.40
Market Value Per share/ Book value 6.94 3.15 2.75 3.32 4.46
Dividend cover Ratio 1.48 1.84 1.69 1.42 1.51 Dividend yield percent 2.67 4.08 6.80 6.50 4.65 Dividend payout percent 67.50 54.30 59.06 70.19 66.36 Earning yield percent 3.95 7.52 11.52 9.26 7.01 Book Net Worth (In Million) Rs. 216.17 233.18 267.30 301.37 337.15 Total Share Number 3439400 4298900 4251600 4268600 4271500 Total Staff Number 388 382 326 372 426 Current Assets (In Million) Rs. 13160.68 13312.40 13868.30 14244.04 14971.80
Current Liabilities (In Million) Rs. 17226.21 16384.73 15135.42 15153.13 15420.82 Net Worth (In Million) Rs. 1062.83 1146.42 1314.18 1481.68 1657.63 Net profit/ Gross income Percent 18.50 16.57 29.16 31.92 39.33 Interest Income/ loans & advances Percent 11.46 10.34 9.83 9.45 8.70 Staff Expenses/ Total Operating expenses
Ratio
16.51
19.48
30.34
29.43
31.50
Interest Expenses of total deposit Percent 4 2.91 2.09 1.97 1.68
Fix Gain/total income Percent 10.13 9.41 10.09 11.03 11.24 Staff Bonus/ Total staff expenses Percent 36.03 30.45 31.51 39.78 42.2 Net Profit/ Loan & Advances Percent 3.94 3.51 5.27 5.33 5.32 Net profit/ total assets Ratio 1.71 1.53 2.43 2.73 3.06 Total loan/ Deposits Percent 52.56 50.31 60.49 60.55 75.05
Total operating expenses/ total income Percent
5.18
4.2
4.06
3.69
3.73
Capital Adequacy Ratio: A. Core capital Percent 6.5 10.53 11.45 12.12 11.35 B. Supplementary Capital Percent 3.96 3.33 1.60 1.44 1.09 C. Total Capital Fund Percent 10.46 13.86 13.05 13.56 12.44 Liquidity (CRR) Percent 5.13 6.75 8.51 6.87 3.83 Non-performing loan/ Total loan Percent 16.2 7.14 5.54 3.35 1.32
Weighted Average Interest Rate Spread
Percent
4.6
4.02
4.51
4.46
5.01
FINANCIAL RATIOS 2004/05 2005/06 2006/07 2007/08 2008/09 STABILITY RATIOS 1. Shareholder's Reserve to Share Capital% 116.18 133.18 167.30 201.37 237.16 2. Net Worth to Total Assets% 5.79 6.50 7.93 8.85 9.65 3. Current Assets to Net Worth% 1238.27 1161.21 1055.28 961.34 903.21
4. Total Deposit to Net Worth% 1490.27 1352.60 1023.27 952.91 879.97
LIQUIDITY RATIOS 5. Cash & Bank balance to Current Assets% 6.18 7.90 8.25 6.81 3.74 6. Investment on Govt. Sect. to Current Assets 20.77 30.95 25.88 25.78 16.12 7. Loans & Advances to Current Assets 63.25 55.87 55.93 57.50 70.71 8. Fixed Deposit to Total Deposit% 23.48 15.78 16.75 16.36 14.25 9. Saving Deposit to Total Deposit% 31.04 32.06 38.89 42.45 48.17 10. Short Term loan to Total Deposit% 0.00 2.69 7.15 1.63 0.12
CREDIT RATIOS 11. Cash & Bank Balance to Total Deposit% 5.13 6.78 8.51 6.87 13.83 12. Invest on Govt. Securities to Total Deposit% 17.25 26.57 26.69 26.01 16.55 13. Total Investment to Total Deposit% 48.64 52.88 44.85 41.33 29.25 TURNOVER RATIOS 14. Loans & Advances to Total Deposit 0.53 0.48 0.58 0.58 0.73 15. Loans & Advances to Fixed Deposit 2.24 3.04 3.44 3.54 5.09 16. Loans & Advances to Saving Deposit 1.69 1.50 1.48 1.37 1.51 17. Opr. Profit to Net worth 0.44 0.36 0.40 0.38 0.41
PROFITABILITY RATIOS 18. Interest earned to working fund% 6.90 6.35 6.15 5.98 6.22 19. Interest paid to working fund% 3.15 2.62 1.92 1.69 1.42 20. Cost of services to working fund% 3.94 3.44 3.19 2.77 2.58 21. Net Profit to working fund% 1.59 1.34 2.51 2.72 3.02 22. Net Profit to Total Deposit% 1.84 1.75 3.10 3.22 3.56
STRUCTURAL RATIOS 23. Long Term Debt to Net worth% 0.00 0.00 0.00 0.00 0.00
24. Net fixed Assets to long Term Debt% 0.00 0.00 0.00 0.00 0.00 25. Total Debts (Liabilities) to Net worth% 1628.14 1437.77 1160.30 1030.18 936.80 26. Total Deposit% (for Comm. Banks) 23.94 -2.10 -13.28 4.99 3.31 27. Loans & Advances% (For Comm. Banks) 13.49 -10.65 4.28 5.60 29.25 28. Loans% (For Dev. Banks) 0.00 0.00 0.00 0.00 0.00
NEPAL SBI BANK
DARBARMARG KATHMANDU
BALANCE SHEET
Trend Analysis Average of 01/02-05-06 = 100 2004/05 2005/06 2006/07 2007/08 2008/09
1. Total Assets 106.18 101.91 95.75 96.81 99.35
2. Current Assets 94.60 95.69 99.69 102.39 107.62
3. Cash & Bank balances 89.54 115.86 126.09 106.90 61.61
3. Cost of services 130.92 109.72 95.43 83.84 80.09
4. Interest paid 153.47 122.62 84.21 75.08 64.62
5. Salaries, Allowances & P.F. 82.72 82.16 119.42 102.55 113.15
6. General Expenses 108.61 195.99 66.49 68.17 60.74
7. Gross Profit 86.89 78.41 98.32 106.53 129.86
8. Net Profit 74.59 69.53 106.36 116.56 132.76
Sources: www.nepalstock.com
APPENDIX-II
HIMALAYAN BANK LTD. Head office: Thamel Kathmandu Paid up value/share Rs. 100 & Rs. 0 Authorized capital: Rs. 1000000000.00 Incorporation year B.S. 2048 A.D. 1992 Issued Capital : Rs. 650000000.00 Listing Date: B.S.03/21/2050 A.D. 1993
Paid-up Capital Rs. 643500000.00 Par Value/Share Rs. 100 & Rs. 0
CHANGES IN PAID-UP CAIPTAL Rs. in Million
Year Before After Remarks
2004/05 240.00 300.00 Bonus 1:4
2005/06 300.00 390.00 Bonus 30%
2006/07 390.00 429.00 Bonus 1:10
2007/08 429.00 536.25 Bonus 1:5
2008/09 336.25 643.50 Bonus 1:5
COMPARATIVE BALANCE SHEET Rs. in Million
As at Balance sheet 2004/05 2005/06 2006/07 2007/08 2008/09 Property and Assets
A. Cash balance
149.96
462.78
397.19
274.24
286.53 B. Balance with Banks 1285.22 801.89 1582.02 1726.95 1727.94 C. Money at call & short notice 4057.65 352.35 150.10 368.90 441.08 D. Investment: a. Government Securities 2224.30 3047.75 3998.87 3431.73 5469.73 b. Share & Debenture 10.69 34.27 34.27 34.27 39.91 c. Others 1848.17 6075.09 6142.30 5826.11 6182.70 4083.16 9157.11 10175.44 9292.11 11692.34
E. Loan, Advances & Bills Purchased: a. Loans, Cash Cr. & Overdrafts 8651.74 8653.57 9700.66 11635.31 12088.71 b. Bill Discounted & purchase 363.61 260.16 301.19 316.56 335.81 9015.35 8913.73 10001.85 11951.87 12424.52 F. Fixed Assets (Net): Gross Block 280.52 418.11 348.55 448.35 480.96 Less: Depreciation (78.52) (99.26) (118.68) (148.71) (185.14) 201.68 318.85 229.87 299.64 295.82 G. Others Assets:
a. Interest Receivable 335.75 330.38 418.46 526.65 511.18 b. Misc. Current Assets 291.19 256.45 332.96 215.52 339.12 c. Misc. Assets 80.62 78.91 67.34 106.16 126.16 707.56 665.74 818.76 848.33 976.46 Total Assets 19500.58 20672.45 23355.23 24762.04 27844.69 Capital & Liabilities A. Current Liabilities a. Deposit & other A/C's
Saving 9144.47 9163.95 10870.54 11759.60 12852.41 Fixed 4927.37 5480.84 3205.37 4710.18 6107.43 Current 2252.13 2634.37 3503.14 4145.45 5045.16 Call & Short Deposit 740.72 883.60 3041.49 970.09 222.96 Other 467.71 456.61 386.83 425.02 586.04 17532.40 18619.37 21007.37 22010.34 24814.00 b. Short term loan 79.53 174.01 285.84 299.01 146.05 c. Bills payable 22.90 35.58 46.73 64.38 68.40
d. Tax provision 154.46 0.00 0.00 0.00 0.00 e. Staff Bonus 48.34 38.78 40.00 46.73 58.06 f. Dividend payables 14.72 6.44 7.86 6.32 5.61 g. Misc. Current Liabilities 895.11 539.07 512.13 604.11 850.82 Total Current Liabilities (A) 18747.46 19433.25 21899.93 23030.89 25942.94 B. Differed Liabilities a. Long Term Loan 0.00 360.00 360.00 360.00 360.00 b. Other Differed Liabilities 32.52 21.07 32.16 46.98 0.00
Total Differed Liabilities (B) 32.52 381.07 392.16 406.98 360.00 C. Net Worth
a. Share Capital Ordinary share 120.00 120.00 120.00 120.00 120.00
Bonus share 180.00 270.00 309.00 416.25 523.50 Preference share 0.00 0.00 0.00 0.00 0.00 Total Share Capital 300.00 390.00 429.00 536.25 643.50 b. Share holder's Reserves: General Reserve 239.75 286.75 329.18 381.79 443.44
Capital Reserve 90.00 39.00 107.25 107.25 128.70 Exchange Fluctuation Reserve 21.16 22.07 23.79 26.05 13.65 Other Reserve 0.78 0.78 51.43 102.86 154.29 Unappropriated Profit (Loss) 68.91 119.53 122.49 169.97 158.17 Total Shareholder's Reserve 420.60 468.13 634.14 787.92 898.25 Net Worth (C) 720.60 858.13 1063.14 1324.17 1541.75 Total Capital & Liabilities (A+B+C) 19500.58 20672.45 23355.23 24762.04 27844.69
COMPATATIVE PROFIT & LOSS ACCOUNT Rs. in Million
For the period Ending 2004/05 2005/06 2006/07 2007/08 2008/09 A. Operating Income a. Interest Earned 1326.38 1149.00 1201.23 1245.89 1446.47 b. Commission & Discount 125.97 101.70 102.56 123.93 132.82 c. Exchange Income 114.22 104.60 109.60 112.42 137.30 d. Dividend 0.00 0.00 0.00 0.00 0.00 e. Other Income 6.35 32.04 30.15 34.08 41.30
Total Income (A) 1572.92 1387.34 1443.54 1516.32 1757.89 B. Expenses: a. Cost of Service: Interest Paid: On Borrowings 10.89 6.49 36.14 35.67 36.22 On Deposits 721.80 571.64 517.99 455.87 525.74 732.69 578.19 554.13 491.54 561.96 Salaries, Allowances & P.F. 76.90 101.54 120.15 152.51 178.59 Total Cost of Service 809.59 679.67 674.28 644.05 740.55
b. Provision of Staff Bonus 48.34 38.78 40.00 46.73 58.06 c. Provision for Doubtful Debts 134.32 166.51 202.87 186.23 147.14 d. Other General Expenses 125.28 132.05 153.85 187.31 254.98 Total Expenses (B) 1117.53 1017.01 1071.00 1064.32 1200.73 Gross Profit (A-B) 455.39 370.33 372.54 452.00 557.16 Less. Depreciation 22.70 23.74 23.28 34.73 37.41 Operating Profit 432.69 346.59 349.26 417.27 519.75 Add: Income from other sources 2.32 2.45 10.76 3.30 2.79
Pre tax Profit 435.01 349.04 360.02 420.57 522.54 Less: Provision for tax 154.32 114.02 147.90 157.52 214.26 Net Profit 280.69 235.02 212.12 263.05 308.28
Key Indicators of Last Five Years Unit 2004/05 2005/06 2006/07 2007/08 2008/09 Earning Per Share Rs. 93.57 60.26 49.45 49.05 47.91 Market Value Per share Rs. 1500.00 1000.00 836.00 840.00 920.00 Price Earning Ratio Ratio 16.03 16.59 16.91 17.13 19.20
Divided of share capital (Including Bonus)
Percent
57.50
35.00
25.00
20.00
31.58
Dividend per share Rs. 27.50 25.00 1.32 0.00 11.58 Dividend Percent 27.50 25.00 1.32 0.00 11.58 Market Capitalization of Closing price (Rs. in Million)
Rs.
4500.00
3900.00
3586.44
4504.00
5920.20
Market Value Per share/ Book value 6.25 4.55 3.37 3.40 3.84 Dividend cover Ratio 3.40 2.41 3.46 0.00 4.14
Dividend yield percent 1.83 2.50 0.16 0.00 1.26 Dividend payout percent 29.39 41.49 2.67 0.00 24.17 Earning yield percent 6.24 6.03 5.92 5.84 5.21 Book Net Worth (In Million) Rs. 240.19 220.02 247.81 246.93 239.59 Total Share Number 3000000 3900000 4290000 5362500 6435000 Total Staff Number 359 357 385 455 501 Current Assets (In Million) Rs. 17359.42 14165.33 16881.45 18495.86 21200.10 Current Liabilities (In Million) Rs. 187474.46 19433.25 21899.93 23030.89 25942.94 Net Worth (In Million) Rs. 720.60 858.13 1063.14 1324.17 1541.75
Net profit/ Gross income Percent 33.39 28.96 27.51 30.75 32.98 Interest Income/ loan & advances Percent 14.71 12.89 11.08 9.64 10.75 Staff Expenses/ Total Operating
expenses Ratio 46.00 48.00 39.00 40.00 41.95 Interest Expenses on total deposit Percent 4.19 3.11 2.64 2.23 2.26 Fix Gain/total income Percent 19.30 12.89 7.54 7.40 7.80 Staff Bonus/ Total staff expenses Percent 38.60 27.63 24.98 23.45 24.53 Net Profit/ Loan & Advances Percent 3.11 2.64 2.12 2.20 2.48
Net profit/ total assets Ratio 1.44 1.14 0.91 1.06 1.11 Total loan/ Deposits Percent 51.42 47.89 47.61 54.30 50.07 Total operating expenses/ Ttal income Percent 26.43 21.31 23.19 27.00 29.19 Capital Adequacy Ratio: A. Core capital Percent 4.67 6.55 7.07 7.69 8.33 B. Supplementary Capital Percent 3.34 5.01 3.85 2.96 2.69 C. Total Capital Fund Percent 8.01 11.56 10.93 10.65 11.01 Liquidity (CRR) Percent 11.77 11.69 8.30 8.28 7.86
STABILITY RATIOS 1. Shareholder's Reserve to Share Capital% 140.2 120.03 147.82 146.93 139.59 2. Net Worth to Total Assets% 3.70 4.15 4.55 5.35 5.54 3. Current Assets to Net Worth% 2409.02 1650.72 1587.89 1396.79 1375.07
4. Total Deposit to Net Worth% 2433.03 2169.76 1975.97 1662.20 1609.47
LIQUIDITY RATIOS 5. Cash & Bank balance to Current Assets% 8.27 8.93 11.72 10.82 9.50 6. Investment on Govt. Sec. to Current Assets 12.81 21.52 23.69 18.55 25.80 7. Loans & Advances to Current Assets 51.93 62.93 59.25 64.62 58.61 8. Fixed Deposit to Total Deposit% 28.10 29.44 15.26 21.40 24.61 9. Saving Deposit to Total Deposit% 52.16 49.22 15.26 21.40 24.61 10. Short Term loan to Total Deposit% 0.45 0.93 1.36 1.36 0.59
CREDIT RATIOS 11. Cash & Bank Balance to Total Deposit% 8.19 6.79 9.42 9.09 8.12 12. Invest on Govt. Securities to Total Deposit% 12.69 16.37 19.04 15.59 22.04 13. Total Investment to Total Deposit% 23.29 49.18 48.44 42.22 47.12 TURNOVER RATIOS 14. Loans & Advances to Total Deposit 0.51 0.48 0.48 0.54 0.50 15. Loans & Advances to Fixed Deposit 1.83 1.63 3.12 2.54 2.09 16. Loans & Advances to Saving Deposit 0.99 0.97 0.92 1.02 0.97 17. Opr. Profit to Net worth 0.60 0.40 0.33 0.32 0.34
PROFITABILITY RATIOS 18. Interest earned to working fund% 6.80 5.56 5.14 5.03 5.19 19. Interest paid to working fund% 3.76 2.80 2.37 1.99 2.02 20. Cost of services to working fund% 4.15 3.29 2.89 2.60 2.66 21. Net Profit to working fund% 1.44 1.14 0.91 1.06 1.11 22. Net Profit to Total Deposit% 1.60 1.26 1.01 1.20 1.24
STRUCTURAL RATIOS 23. Long Term Debt to Net worth% 0.00 41.95 33.86 27.19 23.35
24. Net fixed Assets to long Term Debt% 0.00 88.57 63.85 83.23 82.17 25. Total Debts (Liabilities) to net worth% 2606.16 2309.01 2096.82 1770.00 1706.04
G. Others Assets: a. Interest Receivable 78.91 55.64 83.47 77.01 81.58 b. Misc. Current Assets 150.21 103.86 242.16 358.18 314.18 c. Misc. Assets 18.27 53.00 53.59 40.99 16.99 247.39 212.50 379.22 476.18 412.75 Total Assets 5127.39 4973.90 9014.24 13255.50 16274.75 Capital & Liabilities A. Current Liabilities a. Deposit & other A/C's
Saving 1259.57 1278.79 2434.05 4886.10 6703.51 Fixed 1658.66 945.93 1672.82 2294.68 3212.26 Current 769.01 785.40 979.01 1500.10 1583.03 Call & Short Deposit 502.51 1051.89 2610.41 2556.81 2469.74 Other 66.46 112.75 226.46 286.98 286.03 4256.21 4174.76 7922.75 11524.67 14254.57 b. Short term loan 120.00 98.50 6.83 361.50 350.00 c. Bills payable 5.18 6.82 31.63 57.84 15.01
d. Tax provision 0.00 0.00 0.00 0.00 0.00 e. Staff Bonus 10.43 8.68 18.91 25.72 37.07 f. Dividend payables 5.38 1.81 1.69 5.25 5.89 g. Misc. Current Liabilities 231.82 119.64 377.65 531.96 416.30 Total Current Liabilities (A) 4629.02 4410.21 8359.46 12506.94 15078.84 B. Differed Liabilities a. Long Term Loan 0.00 360.00 360.00 360.00 360.00 b. Other Differed Liabilities 29.27 40.23 16.25 19.52 15.06
Total Differed Liabilities (B) 29.27 40.23 16.25 19.52 15.06 C. Net Worth
a. Share Capital Ordinary share 60.00 60.00 116.66 116.66 409.11
Bonus share 109.98 109.98 178.63 178.63 178.63 Preference share 0.00 0.00 0.00 0.00 0.00 Total Share Capital 169.98 169.98 295.29 295.29 587.74 b. Share holder's Reserves: General Reserve 233.78 245.20 268.70 299.24 345.67
Capital Reserve 0.00 67.99 29.53 59.06 117.83 Exchange Fluctuation Reserve 15.40 16.61 16.58 17.91 18.26 Other Reserve 0.03 0.03 0.03 42.88 85.75 Unappropriated Profit (Loss) 49.89 23.65 28.40 14.66 24.92 Total Shareholder's Reserve 299.10 353.48 343.24 433.75 592.43 Net Worth (C) 469.08 523.46 638.53 729.04 1180.17 Total Capital & Liabilities (A+B+C) 5127.37 4973.90 9014.24 13255.50 16274.07
COMPARATIVE PROFIT & LOSS ACCOUNT Rs. in Million
For the period Ending 2004/05 2005/06 2006/07 2007/08 2008/09 A. Operating Income a. Interest Earned 349.76 326.22 459.51 731.40 886.80 b. Commission & Discount 16.20 16.20 40.81 55.75 93.55 c. Exchange Income 49.83 42.86 50.83 87.98 102.52 d. Dividend 0.00 0.00 0.00 0.00 0.00
e. Other Income 11.38 30.40 26.29 36.82 56.57 Total Income (A) 427.17 415.68 577.44 911.95 1139.44 B. Expenses: a. Cost of Service: Interest Paid: On Borrowings 2.32 2.12 5.91 16.18 26.23 On Deposits 161.10 128.32 183.30 310.03 328.32 163.42 130.44 189.21 326.21 354.55
Salaries, Allowances & P.F. 33.99 41.72 61.29 89.75 97.00 Total Cost of Service 197.41 172.16 250.50 415.96 451.55 b. Provision of Staff Bonus 10.43 8.68 18.91 25.72 37.08 c. Provision for Doubtful Debts 45.28 75.19 30.34 91.09 140.41 d. Other General Expenses 71.36 76.05 96.16 126.08 150.12 Total Expenses (B) 324.48 332.08 395.91 658.85 779.16 Gross Profit (A-B) 102.69 83.60 181.53 253.10 360.28 Less. Depreciation 8.82 8.59 11.87 23.40 32.79 Operating Profit 93.87 75.01 169.66 229.70 327.49
Add: Income from other sources (0.02) 3.10 0.49 1.77 6.19 Pre tax Profit 93.85 78.11 170.15 231.47 333.68 Less: Provision for tax 37.44 21.01 53.33 78.80 101.53 Net Profit 56.41 57.10 116.82 152.67 232.15
Key Indicators of Last Five Years Unit 2004/05 2005/06 2006/07 2007/08 2008/09 Earning Per Share Rs. 33.18 33.59 39.56 51.70 39.50
Market Value Per share Rs. 1150 760 795 940 800 Price Earning Ratio Ratio 34.66 22.63 20.10 18.18 20.25 Divided of share capital (Including Bonus) Percent 0 30 20 15 12.5 Dividend per share Rs. 0 0 20 15 12.5 Dividend Percent 0 0 20 15 12.5 Market Capitalization of Closing price (Rs. in Million)
Rs.
1954.82
1291.88
2347.58
2775.75
4701.91
Market Value Per share/ Book value 4.17 2.47 3.68 3.81 3.98
Dividend cover Ratio 0 0 1.98 3.45 3.16 Dividend yield percent 0.00 0.00 2.52 1.60 1.56 Dividend payout percent 0.00 0.00 50.56 29.01 31.65 Earning yield percent 2.89 4.42 4.98 5.50 4.94 Book Net Worth (In Million) Rs. 275.95 307.95 216.24 246.89 200.80 Total Share Number 1699845 1699845 2952930 2952930 5877385 Total Staff Number 107 105 254 325 353 Current Assets (In Million) Rs. 3423.12 3340.25 7517.89 11144.33 13967.79
Current Liabilities (In Million) Rs. 4629.02 4410.21 8359.46 12506.94 15078.84 Net Worth (In Million) Rs. 469.08 523.46 638.53 729.04 1180.17 Net profit/ Gross income Percent 13.38 14.54 20.12 16.71 20.26 Interest Income/ loan & advances Percent 9.43 9.53 7.8 9.03 7.36 Staff Expenses/ Total Operating expenses Ratio 28.28 33.01 36.2 37.52 34.65
Interest Expenses on total deposit Percent 3.83 3.05 3 2.74 2.43 Fix Gain/total income Percent 11.82 10.91 8.8 9.63 8.95 Staff Bonus/ Total staff expenses Percent 33.53 20.8 30.85 28.66 38.22 Net Profit/ Loan & Advances Percent 2.32 2.1 1.97 2.08 2.22 Net profit/ total assets Ratio 1.1 1.15 1.27 1.13 1.40
Total loan/ Deposits Percent 57.07 65 74.74 69.68 73.33 Total operating expenses/ Total income Percent 2.14 2.47 1.85 1.78 1.69 Capital Adequacy Ratio: A. Core capital Percent 13.1 14.4 7.87 7.22 8.52 B. Supplementary Capital Percent 1 1.5 0.93 3.96 3.06 C. Total Capital Fund Percent 14.1 15.9 8.81 11.18 11.58 Liquidity (CRR) Percent 9.32 11.16 10.11 9.19 9.78 Non-performing loan/ Total loan Percent 8.29 4.8 1.98 2.47 2.69
STABILITY RATIOS 1. Shareholder's Reserve to Share Capital% 175.96 207.95 116.24 146.89 100.80 2. Net Worth to Total Assets% 9.15 10.52 7.08 5.50 7.25
3. Current Assets to Net Worth% 729.75 638.11 1177.37 1528.63 1183.54 4. Total Deposit to Net Worth% 907.35 797.53 1240.78 1580.80 1207.84
LIQUIDITY RATIOS 5. Cash & Bank balance to Current Assets% 13.05 10.15 12.32 11.01 9.60 6. Investment on Govt. Sec. to Current Assets 8.76 6.72 5.32 17.96 13.95 7. Loans & Advances to Current Assets 70.96 76.77 76.78 63.98 72.50 8. Fixed Deposit to Total Deposit% 38.97 22.66 21.11 19.91 22.53 9. Saving Deposit to Total Deposit% 29.59 30.63 30.72 42.40 47.03 10. Short Term loan to Total Deposit% 2.82 2.36 0.09 3.14 2.46
11. Cash & Bank Balance to Total Deposit% 10.50 8.12 11.69 10.65 9.40 12. Invest on Govt. Securities to Total Deposit% 7.05 5.38 5.05 17.36 13.67 13. Total Investment to Total Deposit% 46.29 43.65 22.52 33.51 27.60
TURNOVER RATIOS 14. Loans & Advances to Total Deposit 0.57 0.61 0.73 0.62 0.71 15. Loans & Advances to Fixed Deposit 1.46 2.71 3.45 3.11 3.15 16. Loans & Advances to Saving Deposit 1.93 2.01 2.37 1.46 1.51 17. Opr. Profit to Net worth 0.20 0.14 0.27 0.32 0.28
PROFITABILITY RATIOS 18. Interest earned to working fund% 6.82 6.56 5.10 5.52 5.45 19. Interest paid to working fund% 3.19 2.62 2.10 2.46 2.18 20. Cost of services to working fund% 3.85 3.46 2.78 3.14 2.77 21. Net Profit to working fund% 1.10 1.15 1.30 1.15 1.43 22. Net Profit to Total Deposit% 1.33 1.37 1.47 1.32 1.63
STRUCTURAL RATIOS 23. Long Term Debt to Net worth% 0.00 0.00 0.00 0.00 0.00
24. Net fixed Assets to long Term Debt% 0.00 0.00 0.00 0.00 0.00 25. Total Debts (Liabilities) to net worth% 993.07 850.20 1311.72 1718.21 1278.96