101
C City y o 20 Bie of C Illi 018 ennia Coll noi 8-20 al B ins is 019 udg svill 9 et le,

C
Cityy o
20Bie
of CIlli
018ennia
Collnoi
8-20al B
insis
019udg
svill
9 et
le,

2018/2019 BUDGET
OFFICIALS AND SENIOR MANAGEMENT ........................................................ 1 BUDGET OVERVIEW .......................................................................................... 2 2018 BUDGET SUMMARY ................................................................................ 13
2018 GOVERNMENTAL FUNDS SUMMARY .................................................. 14 2018 ENTERPRISE FUND SUMMARY ........................................................... 15
2019 BUDGET SUMMARY ................................................................................ 16 2019 GOVERNMENTAL FUNDS SUMMARY .................................................. 17 2019 ENTERPRISE FUND SUMMARY ........................................................... 18
TEN-YEAR REVENUE HISTORY .......................................................................... PROPERTY TAX ............................................................................................. 19 SALES TAX ..................................................................................................... 20 HOME RULE SALES TAX ............................................................................... 21 INCOME TAX................................................................................................... 22 GARBAGE FEES ............................................................................................. 23 AMBULANCE FEES ........................................................................................ 24 TELECOMMUNICATIONS TAX ....................................................................... 25 MOTOR FUEL TAX .......................................................................................... 26 WATER AND WASTE WATER FEES .............................................................. 27 HOTEL/MOTEL TAX ........................................................................................ 28 FOOD/BEVERAGE TAX .................................................................................. 29 UTILITY TAX ................................................................................................... 30
GENERAL FUND ................................................................................................... SUMMARY AND PROJECTIONS .................................................................... 31 LEGAL LEVEL OF CONTROL ......................................................................... 32 REVENUES ..................................................................................................... 33 ADMINISTRATION DEPARTMENT .....................................................................
City Council................................................................................................... 35 Boards .......................................................................................................... 36 City Manager ................................................................................................ 37 Operations .................................................................................................... 38 Human Resources ........................................................................................ 39 Information Technology ................................................................................ 40 Economic Development ................................................................................ 41
POLICE DEPARTMENT ...................................................................................... Administration ............................................................................................... 42 Operations .................................................................................................... 43 Support ......................................................................................................... 44 Animal Control .............................................................................................. 45
FIRE DEPARTMENT ........................................................................................... Administration ............................................................................................... 46 Operations .................................................................................................... 47 Emergency Medical Services ........................................................................ 48 Emergency Management .............................................................................. 49
PUBLIC WORKS DEPARTMENT ........................................................................ Administration ............................................................................................... 50
Facilities Management .................................................................................. 51 Streets ........................................................................................................... 52 Fleet Maintenance ........................................................................................ 54 Garbage ........................................................................................................ 55
FINANCE ......................................................................................................... 56 COMMUNITY DEVELOPMENT DEPARTMENT ..................................................
Community Development .............................................................................. 57 Economic Development ................................................................................ 58 Inspections .................................................................................................... 59 Shuttle Bus .................................................................................................... 60
PARKS AND RECREATION DEPARTMENT ....................................................... Parks and Recreation.................................................................................... 61
CAPITAL PROJECTS FUND ................................................................................. SUMMARY AND PROJECTIONS .................................................................... 62 CAPITAL PROJECTS FUND ........................................................................... 63
2018 CAPITAL PROJECTS (ALL FUNDS) ........................................................ 64 2019 CAPITAL PROJECTS (ALL FUNDS) ........................................................ 66 SPECIAL REVENUE FUNDS .................................................................................
SUMMARY AND PROJECTIONS .................................................................... 67 FORFEITURE FUND ....................................................................................... 68 TREE MEMORIAL FUND ................................................................................. 69 COLLINS HOUSE FUND ................................................................................. 70 POLICE VEHICLE FUND ................................................................................. 71 MOTOR FUEL TAX FUND ............................................................................... 72 DUI COURT FINES FUND ............................................................................... 73 TIF DISTRICT 1 FUND ..................................................................................... 74
Uptown .......................................................................................................... 76 I-255/HORSESHOE LAKE ROAD TIF DISTRICT FUND .................................. 77 TIF DISTRICT 3 FUND ..................................................................................... 78 SOUTHWEST COORIDORS TIF DISTRICT FUND ......................................... 79 SOUTHWEST CORRIDORS BUSINESS DISTRICT FUND ............................. 80 NORTHEAST BUSINESS DISTRICT FUND .................................................... 81 COLLINSVILLE CROSSINGS FUND ............................................................... 82 FOURNIE LANE FUND .................................................................................... 83 ANIMAL SHELTER FUND ................................................................................ 84
ENTERPRISE FUND (WATER AND WASTE WATER FUND) .............................. SUMMARY AND PROJECTIONS .................................................................... 85 LEGAL LEVEL OF CONTROL ......................................................................... 86 REVENUES ..................................................................................................... 87 PUBLIC WORKS DEPARTMENT ........................................................................
Administration ............................................................................................... 88 Water Lines ................................................................................................... 89 Water Plant ................................................................................................... 91 Waste Water Lines ........................................................................................ 93 Waste Water Plant ........................................................................................ 95
PROJECT FUND ............................................................................................. 97 BOND FUND .................................................................................................... 98
City of Collinsville
Officials and Senior Management
Mayor John Miller
City Council
Cheryl Brombolich Donna Green David Jerome Jeff Stehman
City Manager Mitch Bair
City Clerk
Kim Wasser
City Treasurer/Director of Finance Tamara Ammann
Chief of Police
Steve Evans
Fire Chief Kevin Edmond
Director of Public Works
Dennis Kress
Director of Community Development David Bookless
Corporate Counsel Steve Giacoletto
City Attorney
B. Marshall Hilmes
1

2018/2019 BUDGET OVERVIEW The proposed budgets for 2018 and 2019 are submitted in accordance with Chapter 65 of the Illinois Complied Statutes (65 ILCS 5/8-2-9.1 through 5/8-2-9.10). When passed by Ordinance of the City Council, this budget document establishes the City of Collinsville’s legal spending limit for the two fiscal years beginning January 1, 2018. Budget amendments can be made throughout the budget cycle as follows:
Transfers of $10,000 or less within a department may be made with the approval of the City Manager and Director of Finance.
Transfers within a department in excess of $10,000, transfers between departments or increases in budget must be approved by the City Council.
BASIS OF ACCOUNTING The City uses the cash basis of accounting for its budget, which differs from the basis of accounting required for audited financial statements. Accounting Principles Generally Accepted in the United States of America require that consolidated financial statements be presented on the full accrual basis of accounting and that fund financial statements be presented on the modified accrual basis of accounting. However, the audited financial statements include a Budgetary Comparison Schedule for each major fund in the Required Supplementary Information section, which is presented on the cash basis. FUNDS The accounts of the City are organized by funds, each of which is considered a separate accounting entity with self-balancing accounts that comprise its assets, liabilities, fund balance/equity, revenues and expenditures. The budget includes projected revenues and expenditures/expenses for twenty funds. The Governmental Funds include: General, Capital Projects, Forfeiture, Tree Memorial, Collins House, Police Vehicle, DUI Court Fines, Motor Fuel Tax, Tax Increment Financing District 1, Tax Increment Financing District 2, Tax Increment Financing District 3, Southwest Corridors Tax Increment Financing District, Southwest Corridors Business District, Northeast Business District, Collinsville Crossings, Fournie Lane, and Animal Shelter. The Proprietary Funds include: Water/Waste Water, Project and Bond. The funds are classified into four different fund types. The General Fund is the general operating fund of the City, which essentially includes all resources except those required to be accounted for in another fund. Capital Projects Funds are used to account for the construction or acquisition of governmental assets that have a useful life in excess of one year and a cost in excess of $5,000. Those assets may include buildings, equipment, infrastructure, etc. Special Revenue Funds are used to account for specific revenue sources that are restricted (either externally or internally) to expenditure for a specific purpose. Enterprise Funds or Proprietary Funds are used to account for operations that function similar to private business where the intent is that the costs of providing service are financed entirely through user charges. The City’s audited financial statements have fewer funds than the budget because the Forfeiture Fund is consolidated with the General Fund and the four Tax Increment Financing Districts are consolidated into one Fund for the financial statements. Additionally, the business-type activity, which includes Water/Waste Water Fund, Project Fund and Bond Fund, is consolidated into a single Proprietary Fund. In the December 31, 2016 financial statements, the General Fund, Tax Increment Financing Fund, and Collinsville Crossings Fund were considered major governmental funds.
2
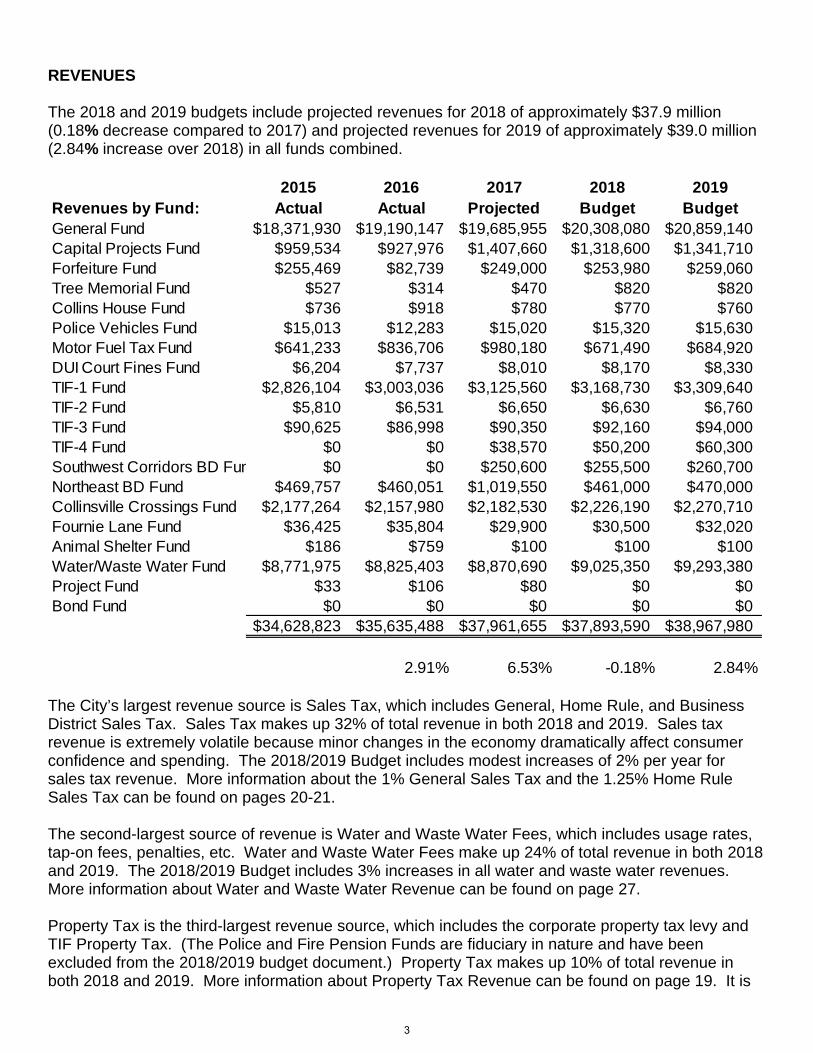
REVENUES The 2018 and 2019 budgets include projected revenues for 2018 of approximately $37.9 million (0.18% decrease compared to 2017) and projected revenues for 2019 of approximately $39.0 million (2.84% increase over 2018) in all funds combined.
2015 2016 2017 2018 2019Revenues by Fund: Actual Actual Projected Budget BudgetGeneral Fund $18,371,930 $19,190,147 $19,685,955 $20,308,080 $20,859,140Capital Projects Fund $959,534 $927,976 $1,407,660 $1,318,600 $1,341,710Forfeiture Fund $255,469 $82,739 $249,000 $253,980 $259,060Tree Memorial Fund $527 $314 $470 $820 $820Collins House Fund $736 $918 $780 $770 $760Police Vehicles Fund $15,013 $12,283 $15,020 $15,320 $15,630Motor Fuel Tax Fund $641,233 $836,706 $980,180 $671,490 $684,920DUI Court Fines Fund $6,204 $7,737 $8,010 $8,170 $8,330TIF-1 Fund $2,826,104 $3,003,036 $3,125,560 $3,168,730 $3,309,640TIF-2 Fund $5,810 $6,531 $6,650 $6,630 $6,760TIF-3 Fund $90,625 $86,998 $90,350 $92,160 $94,000TIF-4 Fund $0 $0 $38,570 $50,200 $60,300Southwest Corridors BD Fun $0 $0 $250,600 $255,500 $260,700Northeast BD Fund $469,757 $460,051 $1,019,550 $461,000 $470,000Collinsville Crossings Fund $2,177,264 $2,157,980 $2,182,530 $2,226,190 $2,270,710Fournie Lane Fund $36,425 $35,804 $29,900 $30,500 $32,020Animal Shelter Fund $186 $759 $100 $100 $100Water/Waste Water Fund $8,771,975 $8,825,403 $8,870,690 $9,025,350 $9,293,380Project Fund $33 $106 $80 $0 $0Bond Fund $0 $0 $0 $0 $0
$34,628,823 $35,635,488 $37,961,655 $37,893,590 $38,967,980
2.91% 6.53% -0.18% 2.84% The City’s largest revenue source is Sales Tax, which includes General, Home Rule, and Business District Sales Tax. Sales Tax makes up 32% of total revenue in both 2018 and 2019. Sales tax revenue is extremely volatile because minor changes in the economy dramatically affect consumer confidence and spending. The 2018/2019 Budget includes modest increases of 2% per year for sales tax revenue. More information about the 1% General Sales Tax and the 1.25% Home Rule Sales Tax can be found on pages 20-21. The second-largest source of revenue is Water and Waste Water Fees, which includes usage rates, tap-on fees, penalties, etc. Water and Waste Water Fees make up 24% of total revenue in both 2018 and 2019. The 2018/2019 Budget includes 3% increases in all water and waste water revenues. More information about Water and Waste Water Revenue can be found on page 27. Property Tax is the third-largest revenue source, which includes the corporate property tax levy and TIF Property Tax. (The Police and Fire Pension Funds are fiduciary in nature and have been excluded from the 2018/2019 budget document.) Property Tax makes up 10% of total revenue in both 2018 and 2019. More information about Property Tax Revenue can be found on page 19. It is
3
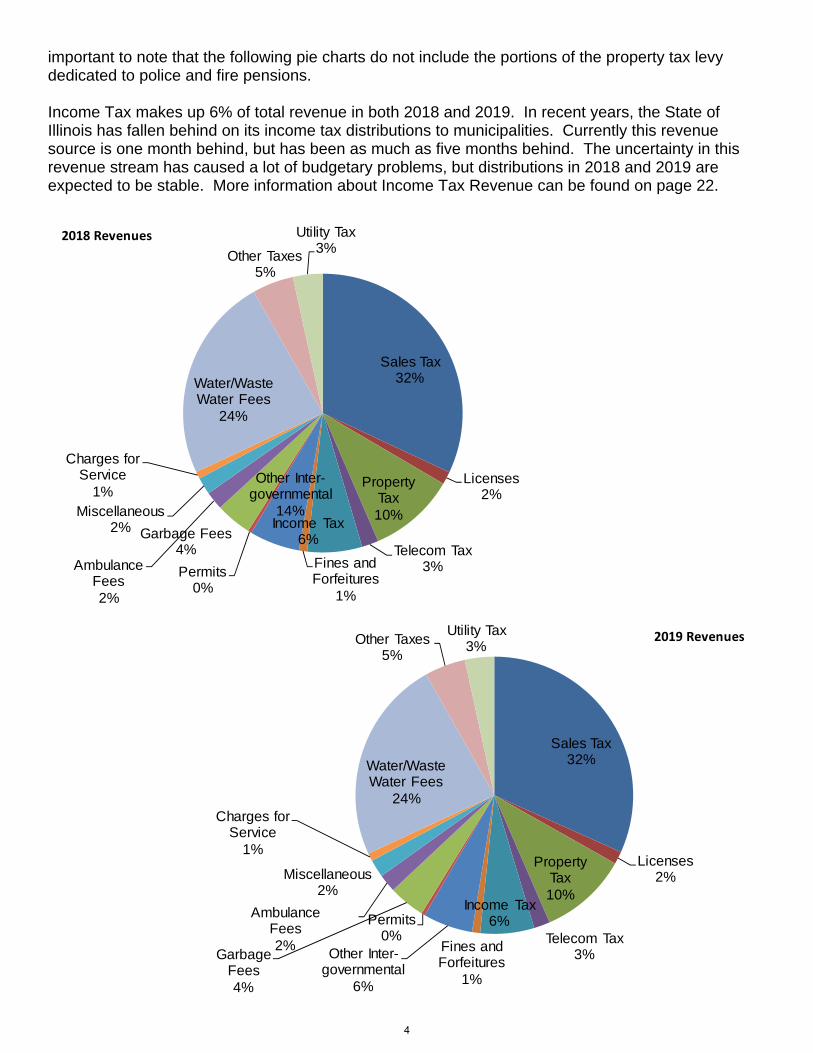
important to note that the following pie charts do not include the portions of the property tax levy dedicated to police and fire pensions. Income Tax makes up 6% of total revenue in both 2018 and 2019. In recent years, the State of Illinois has fallen behind on its income tax distributions to municipalities. Currently this revenue source is one month behind, but has been as much as five months behind. The uncertainty in this revenue stream has caused a lot of budgetary problems, but distributions in 2018 and 2019 are expected to be stable. More information about Income Tax Revenue can be found on page 22.
Sales Tax32%
Licenses2%
Property Tax10%
Telecom Tax3%
Income Tax6%
Fines and Forfeitures
1%
Other Inter-governmental
14%
Permits0%
Garbage Fees4%
Ambulance Fees2%
Miscellaneous2%
Charges for Service
1%
Water/Waste Water Fees
24%
Other Taxes5%
Utility Tax3%
2018 Revenues
Sales Tax32%
Licenses2%
Property Tax10%
Telecom Tax3%
Income Tax6%
Fines and Forfeitures
1%
Other Inter-governmental
6%
Permits0%
Garbage Fees4%
Ambulance Fees2%
Miscellaneous2%
Charges for Service
1%
Water/Waste Water Fees
24%
Other Taxes5%
Utility Tax3%
2019 Revenues
4
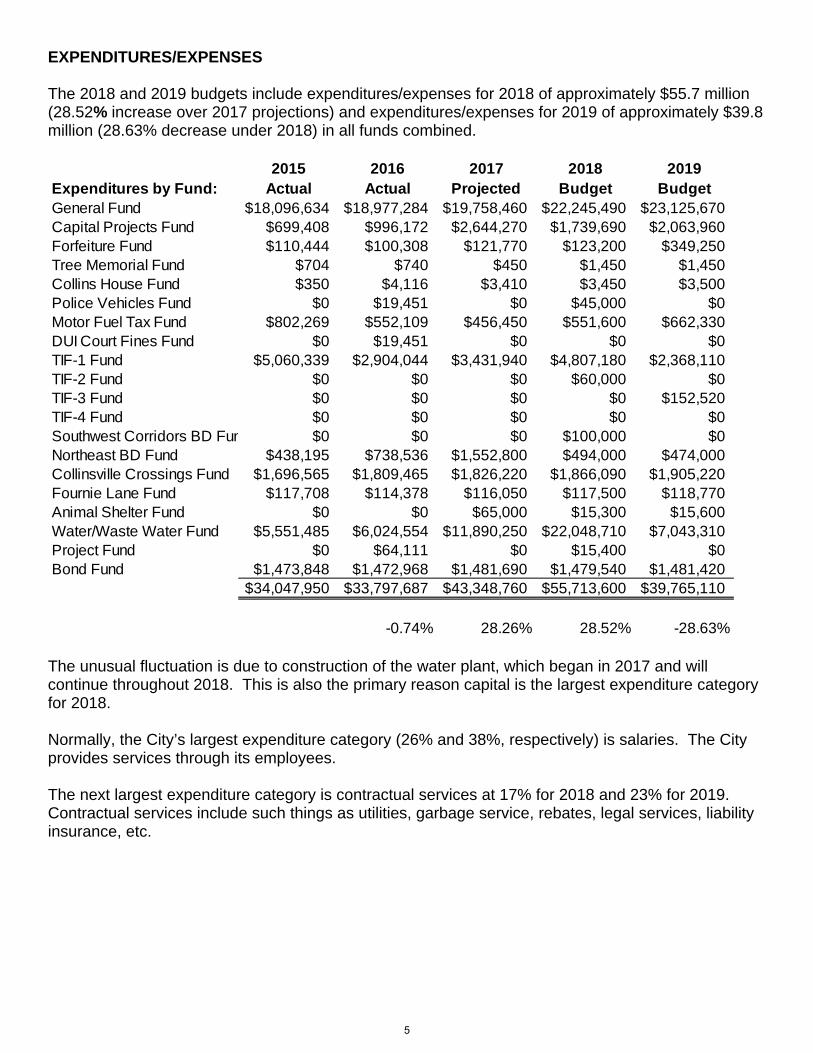
EXPENDITURES/EXPENSES The 2018 and 2019 budgets include expenditures/expenses for 2018 of approximately $55.7 million (28.52% increase over 2017 projections) and expenditures/expenses for 2019 of approximately $39.8 million (28.63% decrease under 2018) in all funds combined.
2015 2016 2017 2018 2019Expenditures by Fund: Actual Actual Projected Budget BudgetGeneral Fund $18,096,634 $18,977,284 $19,758,460 $22,245,490 $23,125,670Capital Projects Fund $699,408 $996,172 $2,644,270 $1,739,690 $2,063,960Forfeiture Fund $110,444 $100,308 $121,770 $123,200 $349,250Tree Memorial Fund $704 $740 $450 $1,450 $1,450Collins House Fund $350 $4,116 $3,410 $3,450 $3,500Police Vehicles Fund $0 $19,451 $0 $45,000 $0Motor Fuel Tax Fund $802,269 $552,109 $456,450 $551,600 $662,330DUI Court Fines Fund $0 $19,451 $0 $0 $0TIF-1 Fund $5,060,339 $2,904,044 $3,431,940 $4,807,180 $2,368,110TIF-2 Fund $0 $0 $0 $60,000 $0TIF-3 Fund $0 $0 $0 $0 $152,520TIF-4 Fund $0 $0 $0 $0 $0Southwest Corridors BD Fun $0 $0 $0 $100,000 $0Northeast BD Fund $438,195 $738,536 $1,552,800 $494,000 $474,000Collinsville Crossings Fund $1,696,565 $1,809,465 $1,826,220 $1,866,090 $1,905,220Fournie Lane Fund $117,708 $114,378 $116,050 $117,500 $118,770Animal Shelter Fund $0 $0 $65,000 $15,300 $15,600Water/Waste Water Fund $5,551,485 $6,024,554 $11,890,250 $22,048,710 $7,043,310Project Fund $0 $64,111 $0 $15,400 $0Bond Fund $1,473,848 $1,472,968 $1,481,690 $1,479,540 $1,481,420
$34,047,950 $33,797,687 $43,348,760 $55,713,600 $39,765,110
-0.74% 28.26% 28.52% -28.63%
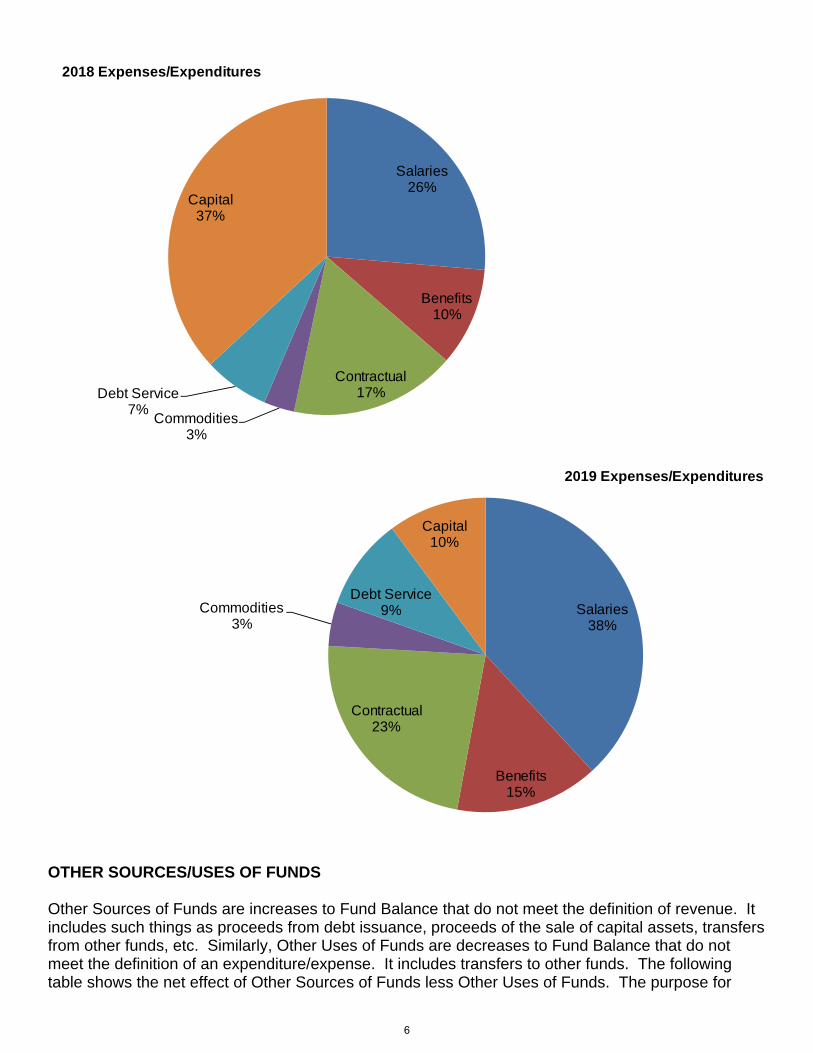
The unusual fluctuation is due to construction of the water plant, which began in 2017 and will continue throughout 2018. This is also the primary reason capital is the largest expenditure category for 2018. Normally, the City’s largest expenditure category (26% and 38%, respectively) is salaries. The City provides services through its employees. The next largest expenditure category is contractual services at 17% for 2018 and 23% for 2019. Contractual services include such things as utilities, garbage service, rebates, legal services, liability insurance, etc.
5
Salaries26%
Benefits10%
Contractual17%
Commodities3%
Debt Service7%
Capital37%
2018 Expenses/Expenditures
Salaries38%
Benefits15%
Contractual23%
Commodities3%
Debt Service9%
Capital10%
2019 Expenses/Expenditures
OTHER SOURCES/USES OF FUNDS Other Sources of Funds are increases to Fund Balance that do not meet the definition of revenue. It includes such things as proceeds from debt issuance, proceeds of the sale of capital assets, transfers from other funds, etc. Similarly, Other Uses of Funds are decreases to Fund Balance that do not meet the definition of an expenditure/expense. It includes transfers to other funds. The following table shows the net effect of Other Sources of Funds less Other Uses of Funds. The purpose for
6

using these categories is to keep these items “below the line” or out of net income on an income statement. Otherwise, consolidation of funds would result in counting these items twice as either a revenue or expenditure. The City of Collinsville’s Other Sources of Funds and Other Uses of Funds are comprised of interfund transfers and a $20 million EPA loan that will be incurred as the new water plant is constructed.
2015 2016 2017 2018 2019Other Sources/Uses: Actual Actual Projected Budget BudgetGeneral Fund $717,071 $856,159 $941,150 $1,050,190 $1,071,170Capital Projects Fund $0 $42,652 $40,000 $10,000 $10,000Forfeiture Fund $0 $2,500 $0 $0 $0Tree Memorial Fund $0 $0 $0 $0 $0Collins House Fund $0 $0 $0 $0 $0Police Vehicles Fund $0 $0 $0 $0 $0Motor Fuel Tax Fund ($98,308) ($100,000) ($100,000) ($100,000) ($100,000)DUI Court Fines Fund $0 $0 $0 $0 $0TIF-1 Fund ($81,282) ($78,573) ($92,370) ($87,000) ($86,750)TIF-2 Fund $0 $0 $0 $0 $0TIF-3 Fund $0 $0 $0 $0 $0TIF-4 Fund $0 $0 $0 $0 $0Southwest Corridors BD Fun $0 $0 $0 $0 $0Northeast BD Fund $25,082 $0 $0 $0 $0Collinsville Crossings Fund $0 $0 $0 $0 $0Fournie Lane Fund $81,282 $78,573 $86,150 $87,000 $86,750Animal Shelter Fund $0 $0 $0 $0 $0Water/Waste Water Fund ($2,138,594) ($2,230,406) $3,324,810 $11,921,270 ($2,449,590)Project Fund $0 $0 $0 $0 $0Bond Fund $1,473,848 $1,472,968 $1,481,690 $1,479,540 $1,481,420
($20,900) $43,873 $5,681,430 $14,361,000 $13,000
-309.92% 12849.72% 152.77% -99.91% FUND BALANCES The budgetary fund balance for all funds combined is estimated to be $14.0 million at December 31, 2018. Of that amount, $3.6 million will be in the City’s only business-type activity (Water/Waste Water Fund), $5.3 million will be in the General Fund for operations, $0.4 million will be in the Capital Projects Fund, and $4.6 million will remain the Special Revenue Funds, as legally obligated. The budgetary fund balance for all funds combined is estimated to be $13.2 million at December 31, 2019. Of that amount, $3.4 million will be in the City’s only business-type activity (Water/Waste Water Fund), $4.1 million will be in the General Fund for operations, ($0.4) million will be in the Capital Projects Fund, and $6.0 million will remain the Special Revenue Funds, as legally obligated.
7

2015 2016 2017 2018 2019Ending Fund Balance: Actual Actual Projected Budget BudgetGeneral Fund $4,292,226 $5,361,248 $6,229,893 $5,342,673 $4,147,313Capital Projects Fund $1,993,546 $1,968,002 $771,392 $360,302 ($351,948)Forfeiture Fund $380,892 $365,823 $493,053 $623,833 $533,643Tree Memorial Fund $4,132 $3,706 $3,726 $3,096 $2,466Collins House Fund $8,702 $5,504 $2,874 $194 ($2,546)Police Vehicles Fund $24,953 $17,785 $32,805 $3,125 $18,755Motor Fuel Tax Fund $111,940 $296,536 $720,266 $740,156 $662,746DUI Court Fines Fund $17,832 $6,117 $14,127 $22,297 $30,627TIF-1 Fund $1,586,572 $1,606,991 $1,208,241 ($517,209) $337,571TIF-2 Fund $38,521 $45,052 $51,702 ($1,668) $5,092TIF-3 Fund $98,554 $185,551 $275,901 $368,061 $309,541TIF-4 Fund $0 $0 $38,570 $88,770 $149,070Southwest Corridors BD Fun $0 $0 $250,600 $406,100 $666,800Northeast BD Fund $809,570 $531,085 ($2,165) ($35,165) ($39,165)Collinsville Crossings Fund $1,738,551 $2,087,067 $2,443,377 $2,803,477 $3,168,967Fournie Lane Fund $0 $0 $0 $0 $0Animal Shelter Fund $211,175 $211,934 $147,034 $131,834 $116,334Water/Waste Water Fund $3,862,817 $4,433,260 $4,738,510 $3,636,420 $3,436,900Project Fund $79,325 $15,320 $15,400 ($0) ($0)Bond Fund $0 $0 $0 $0 $0
$15,259,307 $17,140,982 $17,435,307 $13,976,297 $13,192,167
12.33% 1.72% -19.84% -5.61% Fund Balance is classified in the City’s audited financial statements as nonspendable, restricted, committed, assigned or unassigned as defined by the Governmental Accounting Standards Board in GASB Statement No. 54. On a Balance Sheet, Fund Balance represents the equity in the fund or the difference between assets and liabilities. For the purpose of this cash basis budget, fund balance is defined as the cash balance accumulated in the fund. The City of Collinsville has established a policy of keeping the fund balance in the two operating funds (General Fund and Water/Waste Water Fund) between 15% and 20% of current year revenues. This goal will be far exceeded in the Water/Waste Water Fund in 2018 and 2019 as ending fund balance will likely be 40.29% and 36.98%, respectively. Please refer to page 85 to see the calculation as well as the five-year projection. The ending fund balance goal will also be reached in the General Fund for 2018 and 2019 as ending fund balance is expected to be 26.31% and 19.88%, respectively. Please refer to page 31 to see the calculation as well as the five-year projection.
8
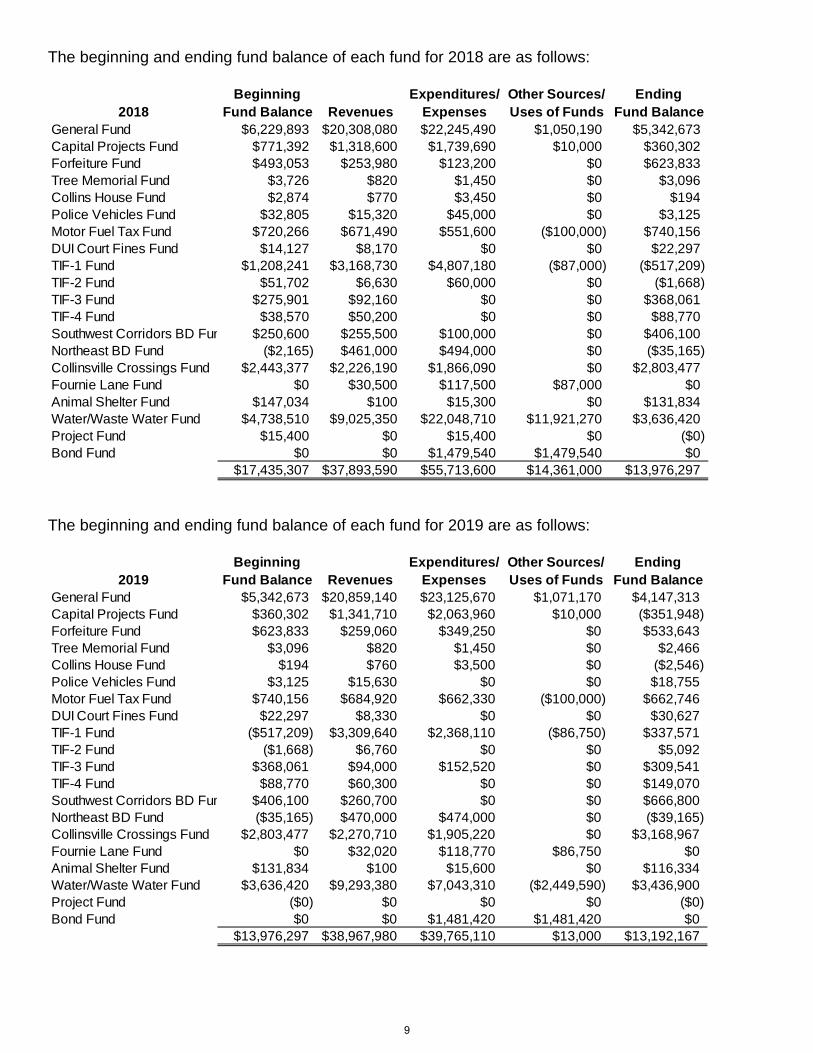
The beginning and ending fund balance of each fund for 2018 are as follows:
Beginning Expenditures/ Other Sources/ Ending2018 Fund Balance Revenues Expenses Uses of Funds Fund Balance
General Fund $6,229,893 $20,308,080 $22,245,490 $1,050,190 $5,342,673Capital Projects Fund $771,392 $1,318,600 $1,739,690 $10,000 $360,302Forfeiture Fund $493,053 $253,980 $123,200 $0 $623,833Tree Memorial Fund $3,726 $820 $1,450 $0 $3,096Collins House Fund $2,874 $770 $3,450 $0 $194Police Vehicles Fund $32,805 $15,320 $45,000 $0 $3,125Motor Fuel Tax Fund $720,266 $671,490 $551,600 ($100,000) $740,156DUI Court Fines Fund $14,127 $8,170 $0 $0 $22,297TIF-1 Fund $1,208,241 $3,168,730 $4,807,180 ($87,000) ($517,209)TIF-2 Fund $51,702 $6,630 $60,000 $0 ($1,668)TIF-3 Fund $275,901 $92,160 $0 $0 $368,061TIF-4 Fund $38,570 $50,200 $0 $0 $88,770Southwest Corridors BD Fun $250,600 $255,500 $100,000 $0 $406,100Northeast BD Fund ($2,165) $461,000 $494,000 $0 ($35,165)Collinsville Crossings Fund $2,443,377 $2,226,190 $1,866,090 $0 $2,803,477Fournie Lane Fund $0 $30,500 $117,500 $87,000 $0Animal Shelter Fund $147,034 $100 $15,300 $0 $131,834Water/Waste Water Fund $4,738,510 $9,025,350 $22,048,710 $11,921,270 $3,636,420Project Fund $15,400 $0 $15,400 $0 ($0)Bond Fund $0 $0 $1,479,540 $1,479,540 $0
$17,435,307 $37,893,590 $55,713,600 $14,361,000 $13,976,297
The beginning and ending fund balance of each fund for 2019 are as follows:
Beginning Expenditures/ Other Sources/ Ending2019 Fund Balance Revenues Expenses Uses of Funds Fund Balance
General Fund $5,342,673 $20,859,140 $23,125,670 $1,071,170 $4,147,313Capital Projects Fund $360,302 $1,341,710 $2,063,960 $10,000 ($351,948)Forfeiture Fund $623,833 $259,060 $349,250 $0 $533,643Tree Memorial Fund $3,096 $820 $1,450 $0 $2,466Collins House Fund $194 $760 $3,500 $0 ($2,546)Police Vehicles Fund $3,125 $15,630 $0 $0 $18,755Motor Fuel Tax Fund $740,156 $684,920 $662,330 ($100,000) $662,746DUI Court Fines Fund $22,297 $8,330 $0 $0 $30,627TIF-1 Fund ($517,209) $3,309,640 $2,368,110 ($86,750) $337,571TIF-2 Fund ($1,668) $6,760 $0 $0 $5,092TIF-3 Fund $368,061 $94,000 $152,520 $0 $309,541TIF-4 Fund $88,770 $60,300 $0 $0 $149,070Southwest Corridors BD Fun $406,100 $260,700 $0 $0 $666,800Northeast BD Fund ($35,165) $470,000 $474,000 $0 ($39,165)Collinsville Crossings Fund $2,803,477 $2,270,710 $1,905,220 $0 $3,168,967Fournie Lane Fund $0 $32,020 $118,770 $86,750 $0Animal Shelter Fund $131,834 $100 $15,600 $0 $116,334Water/Waste Water Fund $3,636,420 $9,293,380 $7,043,310 ($2,449,590) $3,436,900Project Fund ($0) $0 $0 $0 ($0)Bond Fund $0 $0 $1,481,420 $1,481,420 $0
$13,976,297 $38,967,980 $39,765,110 $13,000 $13,192,167
9

DEBT The City issues bonded debt to finance projects that are too large to be funded through a budget cycle. At the beginning of the 2018 budget, the total outstanding debt will be $39,380,000. During 2018, principal payments made towards the debt will equal $1,985,000, leaving total outstanding debt of $37,395,000 at December 31, 2018. During 2019, principal payments made towards the debt will equal $2,100,000, leaving total outstanding debt of $35,295,000 at December 31, 2019.
2018 Principal 2019 Principal12/31/2017 Payments 12/31/2018 Payments 12/31/2019
LIST Revenue BondsSeries 2007 $20,015,000 ($150,000) $19,865,000 ($175,000) $19,690,000
Non-taxable GO BondsSeries 2007B $430,000 ($100,000) $330,000 ($105,000) $225,000
Taxable GO BondsSeries 2009 $1,920,000 ($170,000) $1,750,000 ($195,000) $1,555,000
GO Refunding Bonds (2006)Series 2012 $9,380,000 ($65,000) $9,315,000 ($65,000) $9,250,000
GO Refunding Bonds (2006)Series 2013A $2,290,000 ($1,065,000) $1,225,000 ($1,100,000) $125,000
Taxable GO Refunding Bonds (2007A)Series 2014 $5,345,000 ($435,000) $4,910,000 ($460,000) $4,450,000
Total Outstanding Debt $39,380,000 $37,395,000 $35,295,000 The LIST Revenue Bonds issued in 2007 were for infrastructure in the Collinsville Crossings development. Principal and interest payments are budgeted in the Collinsville Crossings Fund. Funding for the debt service is limited to the incremental general sales tax that is generated within the development. The original amount of debt issued was $20,250,000. This is the only bonded debt obligation that is not backed by the full faith and credit of the City. The Non-taxable General Obligation Bonds that were issued in 2007 (2007B) were for infrastructure in the Fournie Lane Business District. Principal and interest payments are budgeted in the Fournie Lane Fund. Funding is provided by the 1% business district sales tax of the Fournie Lane Business District and transfers from the TIF District 1 Fund. The original amount of debt issued was $1,215,000. The Taxable General Obligation Bonds that were issued in 2009 were for the renovation of Hotel Collinsville into the existing DoubleTree by Hilton. Principal and interest payments are budgeted in the TIF District 1 Fund. Funding is provided by the 1% business district hotel tax of the Eastport Plaza Drive Business District as well as other revenues sources within the TIF District. General Obligation Refunding Bonds were issued in 2012 to partially refinance the 2006 bonds ($20 million sewer plant expansion.) Principal and interest payments are budgeted in the Bond Fund. Funding for the debt service is provided by a transfer from the Water/Waste Water Fund. The original amount of debt issued was $9,625,000. General Obligation Refunding Bonds were issued in 2013 to partially refinance the 2006 bonds ($20 million sewer plant expansion.) Principal and interest payments are budgeted in the Bond Fund. Funding for the debt service is provided by a transfer from the Water/Waste Water Fund. The original amount of debt issued was $5,480,000.
10
Taxable General Obligation Refunding Bonds were issued in 2014 to partially refinance the 2007A GO Bonds ($7.3 million infrastructure within the Collinsville Crossings development.) Principal and interest payments are budgeted in the Collinsville Crossings Fund. Funding is provided by the 1% business district sales tax of the Collinsville Crossings (North and South) Business Districts. The original amount of debt issued was $6,260,000. The City of Collinsville became home-rule by special census on August 24, 2005 and no longer has a debt limit. However, the City’s debt liability is still within the legal debt margin that previously applied. The City has been assigned an Aa3 bond rating by Moody’s Investors Service, which demonstrates a very strong creditworthiness. According to Moody’s, the City has a “stable financial position supported by the revenue raising flexibility afforded by home-rule status and solid reserves, moderately sized tax base, and manageable debt burden.” CAPTIAL PROJECTS The 2018/2019 Budget includes $24,596,160 in capital improvements for the City. A listing of capital projects for 2018 and 2019 can be found on pages 64-66 of this document. The entire Capital Improvement Plan (CIP) for 2017-2022 can be found at www.collinsvilleil.org/cip. These are the major projects that are planned during this budget cycle: Motor Fuel Tax Fund Sugar Loaf Reconstruction (2018-2019) – The existing oil and chip-paved Sugar Loaf Road will be replaced with asphalt and widened. Sidewalks, storm water drainage, and improved street lighting will be added in appropriate areas. Capital Projects Fund Mill and Repave Streets (2018) – Five major sections of streets (15,809-feet, total) are scheduled for resurfacing during 2018, which will bring the average condition of these roads up from a 4.3 to 10 using the PASER rating system: Green Ridge/Hoecker/Wendler/Schiller, Burlington/California/Claremont/Concord/Olive, Ramada/Sandridge, Skyline, and Duplex. Mill and Repave Streets (2019) – Seven major sections of streets (14,240-feet, total) are scheduled for resurfacing during 2019, which will bring the average condition of these roads up from a 4.6 to 10 using the PASER rating system: Cleveland/Collinsville/Merrell/Jefferson/Clay, Division/Fletcher/Westridge, Watch Hill, Northcrest/Northview/Windridge, Reed/Rock, Black Jack, and Scotch Pine. TIF District 1 Fund Eastport Water Main Extension and Loop (2018) – The existing 10” water main will be extended to Fairmont Ave to provide a secondary feed of domestic water to the entire Eastport area, which will improve reliability, water quality, and fire protection. This project will be constructed in-house by the construction crew in the Public Works Department. Uptown Resurfacing (2018) – Streets and alleys in the Uptown area will be milled down overlaid with asphalt. This will improve the pavement condition, extend the life of the streets, and improve safety. Gateway Center Bond Payment (ongoing) – This is the City’s portion of the debt service payments on a $10 million expansion in 2004 of the Collinsville Metropolitan Exposition, Auditorium and Office Building Authority.
11
Private Building Investment/Incentive (ongoing) – Grant monies are available in the Uptown area for building and façade improvements. Water/Waste Water Fund Water Treatment Plant (2018) – Construction began in 2017 on a $20 million water treatment plant to replace the existing water treatment plant, which was built in 1958. 1 Million Gallon Water Storage Tank Booster Pump Station (2018) – Due to the relocation of the water treatment plant, the existing storage tank will require the installation of a booster station to connect the vessel to the water distribution system. LOOKING FORWARD The City Council has already given some general direction about staffing and future revenue. The budget workshop will be an opportunity to review assumptions and verify that future services will be delivered efficiently and effectively. Topics of discussion will include new initiatives, financial policies, and property tax revenue. The City Council and staff can take pride in adopting responsible and balanced budgets for 2018 and 2019.
12
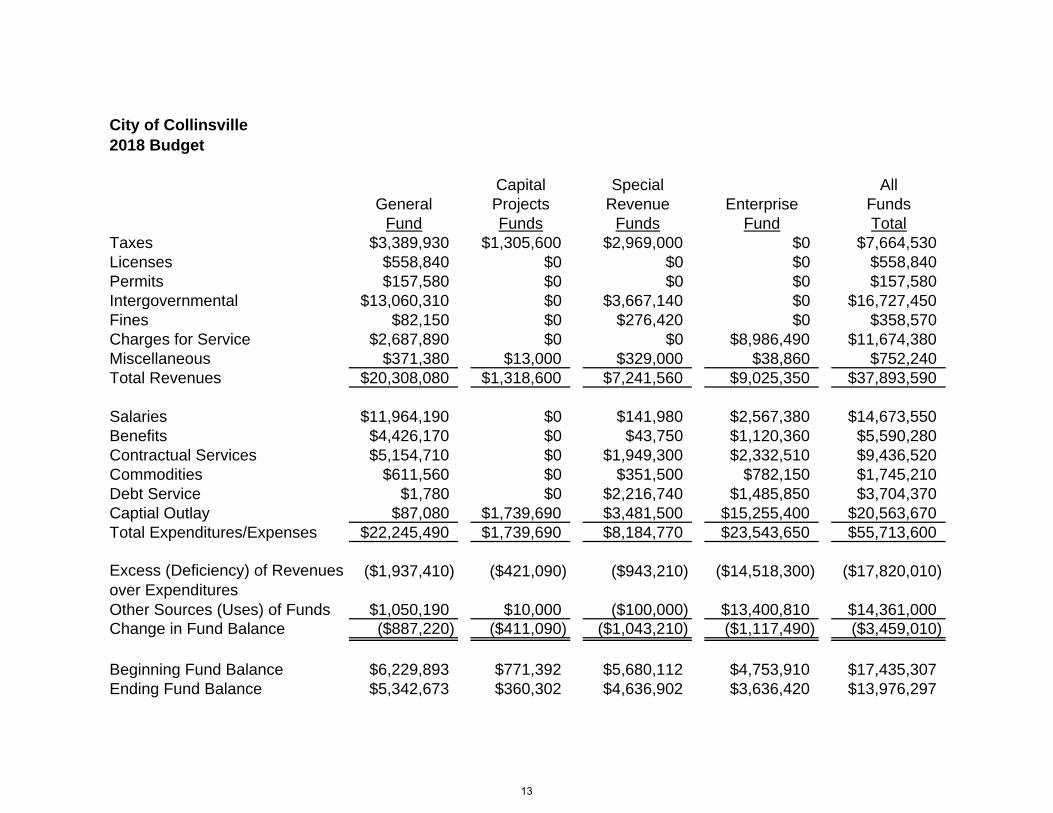
City of Collinsville2018 Budget
Capital Special AllGeneral Projects Revenue Enterprise Funds
Fund Funds Funds Fund TotalTaxes $3,389,930 $1,305,600 $2,969,000 $0 $7,664,530Licenses $558,840 $0 $0 $0 $558,840Permits $157,580 $0 $0 $0 $157,580Intergovernmental $13,060,310 $0 $3,667,140 $0 $16,727,450Fines $82,150 $0 $276,420 $0 $358,570Charges for Service $2,687,890 $0 $0 $8,986,490 $11,674,380Miscellaneous $371,380 $13,000 $329,000 $38,860 $752,240Total Revenues $20,308,080 $1,318,600 $7,241,560 $9,025,350 $37,893,590
Salaries $11,964,190 $0 $141,980 $2,567,380 $14,673,550Benefits $4,426,170 $0 $43,750 $1,120,360 $5,590,280Contractual Services $5,154,710 $0 $1,949,300 $2,332,510 $9,436,520Commodities $611,560 $0 $351,500 $782,150 $1,745,210Debt Service $1,780 $0 $2,216,740 $1,485,850 $3,704,370Captial Outlay $87,080 $1,739,690 $3,481,500 $15,255,400 $20,563,670Total Expenditures/Expenses $22,245,490 $1,739,690 $8,184,770 $23,543,650 $55,713,600
($1,937,410) ($421,090) ($943,210) ($14,518,300) ($17,820,010)
Other Sources (Uses) of Funds $1,050,190 $10,000 ($100,000) $13,400,810 $14,361,000Change in Fund Balance ($887,220) ($411,090) ($1,043,210) ($1,117,490) ($3,459,010)
Beginning Fund Balance $6,229,893 $771,392 $5,680,112 $4,753,910 $17,435,307Ending Fund Balance $5,342,673 $360,302 $4,636,902 $3,636,420 $13,976,297
Excess (Deficiency) of Revenues over Expenditures
13

City of CollinsvilleGovernmental Funds2018 Budget
I-255/ Southwest Southwest NortheastCapital Tree Collins Police Motor DUI TIF Horseshoe TIF Corridors Corridors Business Collinsville Fournie Animal All
General Projects Forfeiture Memorial House Vehicle Fuel Tax Court Fine District 1 Lake Road District 3 TIF District Bus. Dist District Crossings Lane Shelter GovernmentalFund Fund Fund Fund Fund Fund Fund Fund Fund TIF Fund Fund Fund Fund Fund Fund Fund Fund Funds Total
Taxes $3,389,930 $1,305,600 $0 $0 $0 $0 $0 $0 $2,821,230 $6,630 $91,140 $50,000 $0 $0 $0 $0 $0 $7,664,530Licenses $558,840 $0 $0 $0 $0 $0 $0 $0 $0 $0 $0 $0 $0 $0 $0 $0 $0 $558,840Permits $157,580 $0 $0 $0 $0 $0 $0 $0 $0 $0 $0 $0 $0 $0 $0 $0 $0 $157,580Intergovernmental $13,060,310 $0 $0 $0 $0 $0 $669,960 $0 $27,740 $0 $0 $0 $255,000 $461,000 $2,222,940 $30,500 $0 $16,727,450Fines $82,150 $0 $252,960 $0 $0 $15,300 $0 $8,160 $0 $0 $0 $0 $0 $0 $0 $0 $0 $358,570Charges for Service $2,687,890 $0 $0 $0 $0 $0 $0 $0 $0 $0 $0 $0 $0 $0 $0 $0 $0 $2,687,890Miscellaneous $371,380 $13,000 $1,020 $820 $770 $20 $1,530 $10 $319,760 $0 $1,020 $200 $500 $0 $3,250 $0 $100 $713,380Total Revenues $20,308,080 $1,318,600 $253,980 $820 $770 $15,320 $671,490 $8,170 $3,168,730 $6,630 $92,160 $50,200 $255,500 $461,000 $2,226,190 $30,500 $100 $28,868,240
Salaries $11,964,190 $0 $30,600 $0 $0 $0 $0 $0 $111,380 $0 $0 $0 $0 $0 $0 $0 $0 $12,106,170Benefits $4,426,170 $0 $1,140 $0 $0 $0 $0 $0 $42,610 $0 $0 $0 $0 $0 $0 $0 $0 $4,469,920Contractual Services $5,154,710 $0 $18,510 $0 $3,170 $0 $65,000 $0 $1,222,020 $0 $0 $0 $100,000 $494,000 $41,500 $0 $5,100 $7,104,010Commodities $611,560 $0 $2,550 $450 $280 $0 $336,600 $0 $6,520 $0 $0 $0 $0 $0 $0 $0 $5,100 $963,060Debt Service $1,780 $0 $0 $0 $0 $0 $0 $0 $274,650 $0 $0 $0 $0 $0 $1,824,590 $117,500 $0 $2,218,520Captial Outlay $87,080 $1,739,690 $70,400 $1,000 $0 $45,000 $150,000 $0 $3,150,000 $60,000 $0 $0 $0 $0 $0 $0 $5,100 $5,308,270Total Expenditures $22,245,490 $1,739,690 $123,200 $1,450 $3,450 $45,000 $551,600 $0 $4,807,180 $60,000 $0 $0 $100,000 $494,000 $1,866,090 $117,500 $15,300 $32,169,950
($1,937,410) ($421,090) $130,780 ($630) ($2,680) ($29,680) $119,890 $8,170 ($1,638,450) ($53,370) $92,160 $50,200 $155,500 ($33,000) $360,100 ($87,000) ($15,200) ($3,301,710)
Other Sources (Uses) of Funds $1,050,190 $10,000 $0 $0 $0 $0 ($100,000) $0 ($87,000) $0 $0 $0 $0 $0 $0 $87,000 $0 $960,190Change in Fund Balance ($887,220) ($411,090) $130,780 ($630) ($2,680) ($29,680) $19,890 $8,170 ($1,725,450) ($53,370) $92,160 $50,200 $155,500 ($33,000) $360,100 $0 ($15,200) ($2,341,520)
Beginning Fund Balance $6,229,893 $771,392 $493,053 $3,726 $2,874 $32,805 $720,266 $14,127 $1,208,241 $51,702 $275,901 $38,570 $250,600 ($2,165) $2,443,377 $0 $147,034 $12,681,396Ending Fund Balance $5,342,673 $360,302 $623,833 $3,096 $194 $3,125 $740,156 $22,297 ($517,209) ($1,668) $368,061 $88,770 $406,100 ($35,165) $2,803,477 $0 $131,834 $10,339,876
Excess (Deficiency) of Revenues over Expenditures
Special Revenue Funds
14
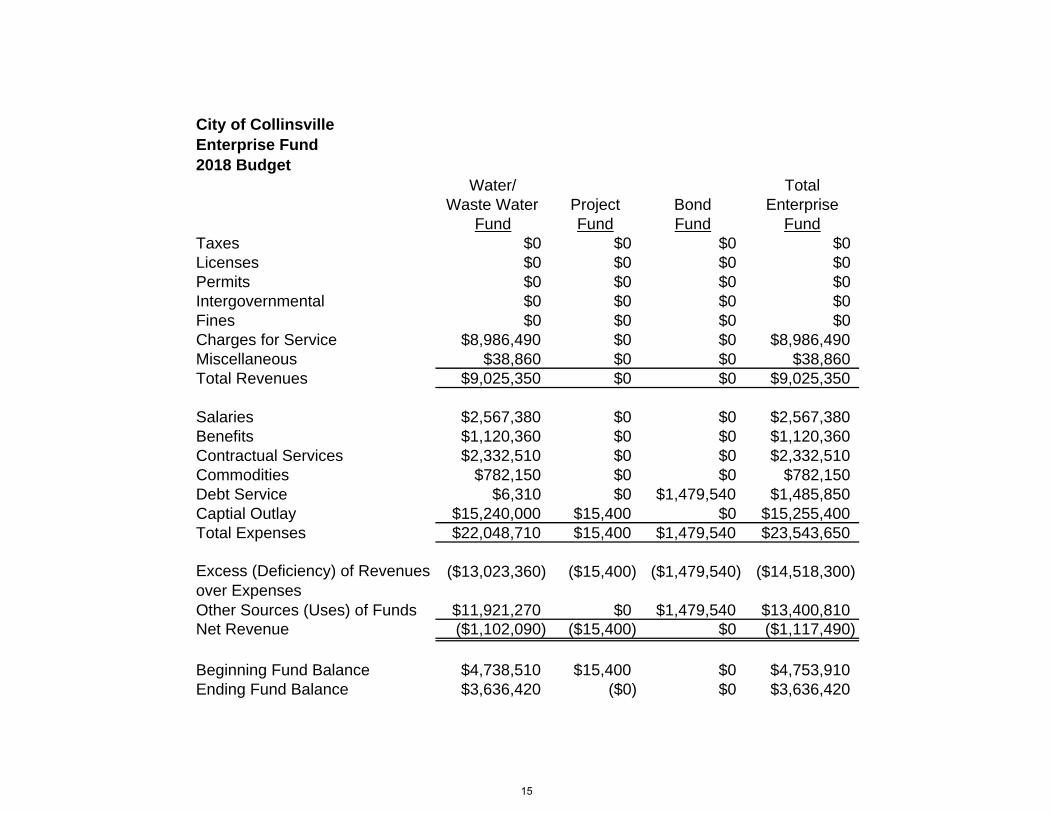
City of CollinsvilleEnterprise Fund2018 Budget
Water/ TotalWaste Water Project Bond Enterprise
Fund Fund Fund FundTaxes $0 $0 $0 $0Licenses $0 $0 $0 $0Permits $0 $0 $0 $0Intergovernmental $0 $0 $0 $0Fines $0 $0 $0 $0Charges for Service $8,986,490 $0 $0 $8,986,490Miscellaneous $38,860 $0 $0 $38,860Total Revenues $9,025,350 $0 $0 $9,025,350
Salaries $2,567,380 $0 $0 $2,567,380Benefits $1,120,360 $0 $0 $1,120,360Contractual Services $2,332,510 $0 $0 $2,332,510Commodities $782,150 $0 $0 $782,150Debt Service $6,310 $0 $1,479,540 $1,485,850Captial Outlay $15,240,000 $15,400 $0 $15,255,400Total Expenses $22,048,710 $15,400 $1,479,540 $23,543,650
($13,023,360) ($15,400) ($1,479,540) ($14,518,300)
Other Sources (Uses) of Funds $11,921,270 $0 $1,479,540 $13,400,810Net Revenue ($1,102,090) ($15,400) $0 ($1,117,490)
Beginning Fund Balance $4,738,510 $15,400 $0 $4,753,910Ending Fund Balance $3,636,420 ($0) $0 $3,636,420
Excess (Deficiency) of Revenues over Expenses
15

City of Collinsville2019 Budget
Capital Special AllGeneral Projects Revenue Enterprise Funds
Fund Funds Funds Fund TotalTaxes $3,470,510 $1,331,710 $3,119,900 $0 $7,922,120Licenses $570,020 $0 $0 $0 $570,020Permits $160,980 $0 $0 $0 $160,980Intergovernmental $13,321,530 $0 $3,741,180 $0 $17,062,710Fines $83,790 $0 $281,950 $0 $365,740Charges for Service $2,824,420 $0 $0 $9,253,850 $12,078,270Miscellaneous $427,890 $10,000 $330,720 $39,530 $808,140Total Revenues $20,859,140 $1,341,710 $7,473,750 $9,293,380 $38,967,980
Salaries $12,440,990 $0 $81,620 $2,655,300 $15,177,910Benefits $4,676,830 $0 $19,960 $1,165,260 $5,862,050Contractual Services $5,278,220 $0 $1,826,330 $2,043,750 $9,148,300Commodities $641,700 $0 $358,500 $789,000 $1,789,200Debt Service $0 $0 $2,273,740 $1,481,420 $3,755,160Captial Outlay $87,930 $2,063,960 $1,490,600 $390,000 $4,032,490Total Expenditures/Expenses $23,125,670 $2,063,960 $6,050,750 $8,524,730 $39,765,110
($2,266,530) ($722,250) $1,423,000 $768,650 ($797,130)
Other Sources (Uses) of Funds $1,071,170 $10,000 ($100,000) ($968,170) $13,000Change in Fund Balance ($1,195,360) ($712,250) $1,323,000 ($199,520) ($784,130)
Beginning Fund Balance $5,342,673 $360,302 $4,636,902 $3,636,420 $13,976,297Ending Fund Balance $4,147,313 ($351,948) $5,959,902 $3,436,900 $13,192,167
Excess (Deficiency) of Revenues over Expenditures
16
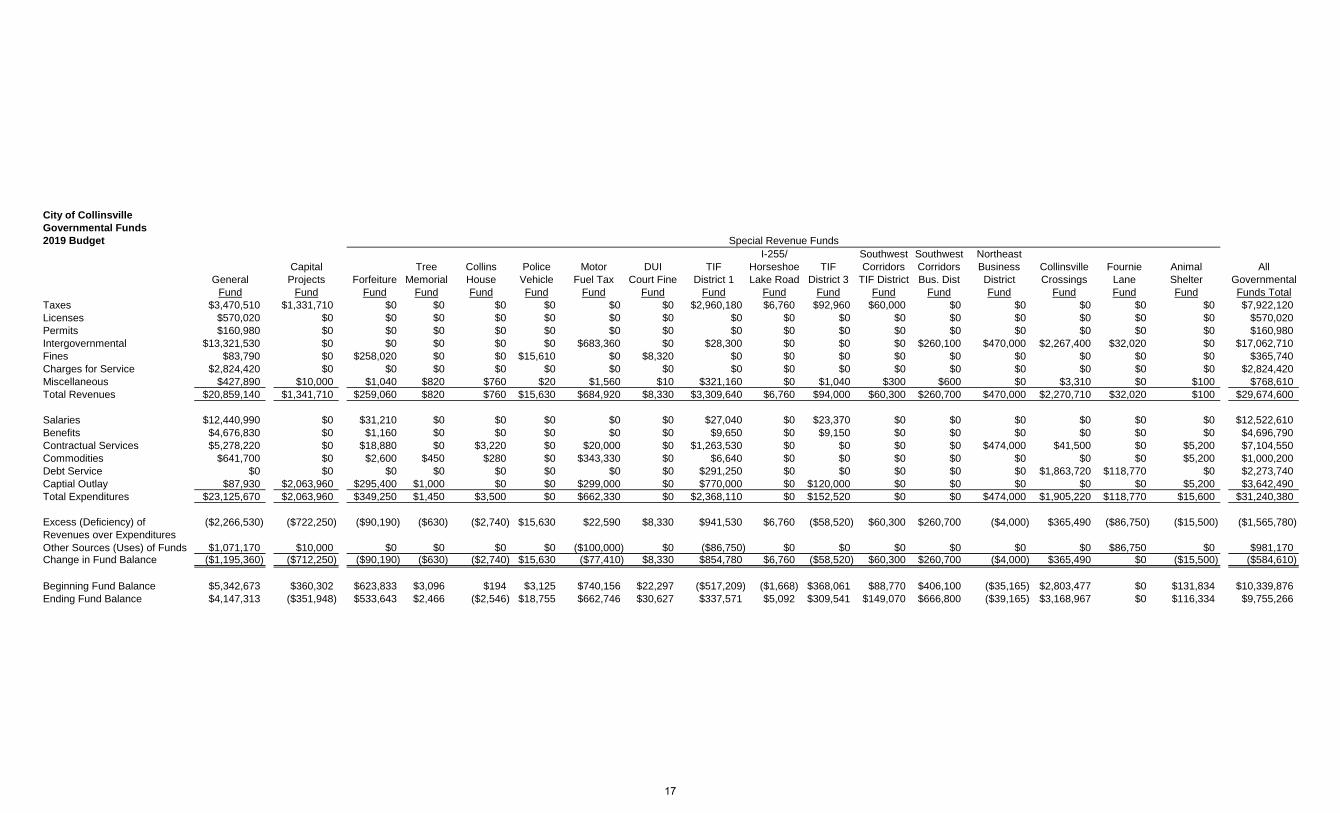
City of CollinsvilleGovernmental Funds2019 Budget
I-255/ Southwest Southwest NortheastCapital Tree Collins Police Motor DUI TIF Horseshoe TIF Corridors Corridors Business Collinsville Fournie Animal All
General Projects Forfeiture Memorial House Vehicle Fuel Tax Court Fine District 1 Lake Road District 3 TIF District Bus. Dist District Crossings Lane Shelter GovernmentalFund Fund Fund Fund Fund Fund Fund Fund Fund Fund Fund Fund Fund Fund Fund Fund Fund Funds Total
Taxes $3,470,510 $1,331,710 $0 $0 $0 $0 $0 $0 $2,960,180 $6,760 $92,960 $60,000 $0 $0 $0 $0 $0 $7,922,120Licenses $570,020 $0 $0 $0 $0 $0 $0 $0 $0 $0 $0 $0 $0 $0 $0 $0 $0 $570,020Permits $160,980 $0 $0 $0 $0 $0 $0 $0 $0 $0 $0 $0 $0 $0 $0 $0 $0 $160,980Intergovernmental $13,321,530 $0 $0 $0 $0 $0 $683,360 $0 $28,300 $0 $0 $0 $260,100 $470,000 $2,267,400 $32,020 $0 $17,062,710Fines $83,790 $0 $258,020 $0 $0 $15,610 $0 $8,320 $0 $0 $0 $0 $0 $0 $0 $0 $0 $365,740Charges for Service $2,824,420 $0 $0 $0 $0 $0 $0 $0 $0 $0 $0 $0 $0 $0 $0 $0 $0 $2,824,420Miscellaneous $427,890 $10,000 $1,040 $820 $760 $20 $1,560 $10 $321,160 $0 $1,040 $300 $600 $0 $3,310 $0 $100 $768,610Total Revenues $20,859,140 $1,341,710 $259,060 $820 $760 $15,630 $684,920 $8,330 $3,309,640 $6,760 $94,000 $60,300 $260,700 $470,000 $2,270,710 $32,020 $100 $29,674,600
Salaries $12,440,990 $0 $31,210 $0 $0 $0 $0 $0 $27,040 $0 $23,370 $0 $0 $0 $0 $0 $0 $12,522,610Benefits $4,676,830 $0 $1,160 $0 $0 $0 $0 $0 $9,650 $0 $9,150 $0 $0 $0 $0 $0 $0 $4,696,790Contractual Services $5,278,220 $0 $18,880 $0 $3,220 $0 $20,000 $0 $1,263,530 $0 $0 $0 $0 $474,000 $41,500 $0 $5,200 $7,104,550Commodities $641,700 $0 $2,600 $450 $280 $0 $343,330 $0 $6,640 $0 $0 $0 $0 $0 $0 $0 $5,200 $1,000,200Debt Service $0 $0 $0 $0 $0 $0 $0 $0 $291,250 $0 $0 $0 $0 $0 $1,863,720 $118,770 $0 $2,273,740Captial Outlay $87,930 $2,063,960 $295,400 $1,000 $0 $0 $299,000 $0 $770,000 $0 $120,000 $0 $0 $0 $0 $0 $5,200 $3,642,490Total Expenditures $23,125,670 $2,063,960 $349,250 $1,450 $3,500 $0 $662,330 $0 $2,368,110 $0 $152,520 $0 $0 $474,000 $1,905,220 $118,770 $15,600 $31,240,380
($2,266,530) ($722,250) ($90,190) ($630) ($2,740) $15,630 $22,590 $8,330 $941,530 $6,760 ($58,520) $60,300 $260,700 ($4,000) $365,490 ($86,750) ($15,500) ($1,565,780)
Other Sources (Uses) of Funds $1,071,170 $10,000 $0 $0 $0 $0 ($100,000) $0 ($86,750) $0 $0 $0 $0 $0 $0 $86,750 $0 $981,170Change in Fund Balance ($1,195,360) ($712,250) ($90,190) ($630) ($2,740) $15,630 ($77,410) $8,330 $854,780 $6,760 ($58,520) $60,300 $260,700 ($4,000) $365,490 $0 ($15,500) ($584,610)
Beginning Fund Balance $5,342,673 $360,302 $623,833 $3,096 $194 $3,125 $740,156 $22,297 ($517,209) ($1,668) $368,061 $88,770 $406,100 ($35,165) $2,803,477 $0 $131,834 $10,339,876Ending Fund Balance $4,147,313 ($351,948) $533,643 $2,466 ($2,546) $18,755 $662,746 $30,627 $337,571 $5,092 $309,541 $149,070 $666,800 ($39,165) $3,168,967 $0 $116,334 $9,755,266
Excess (Deficiency) of Revenues over Expenditures
Special Revenue Funds
17
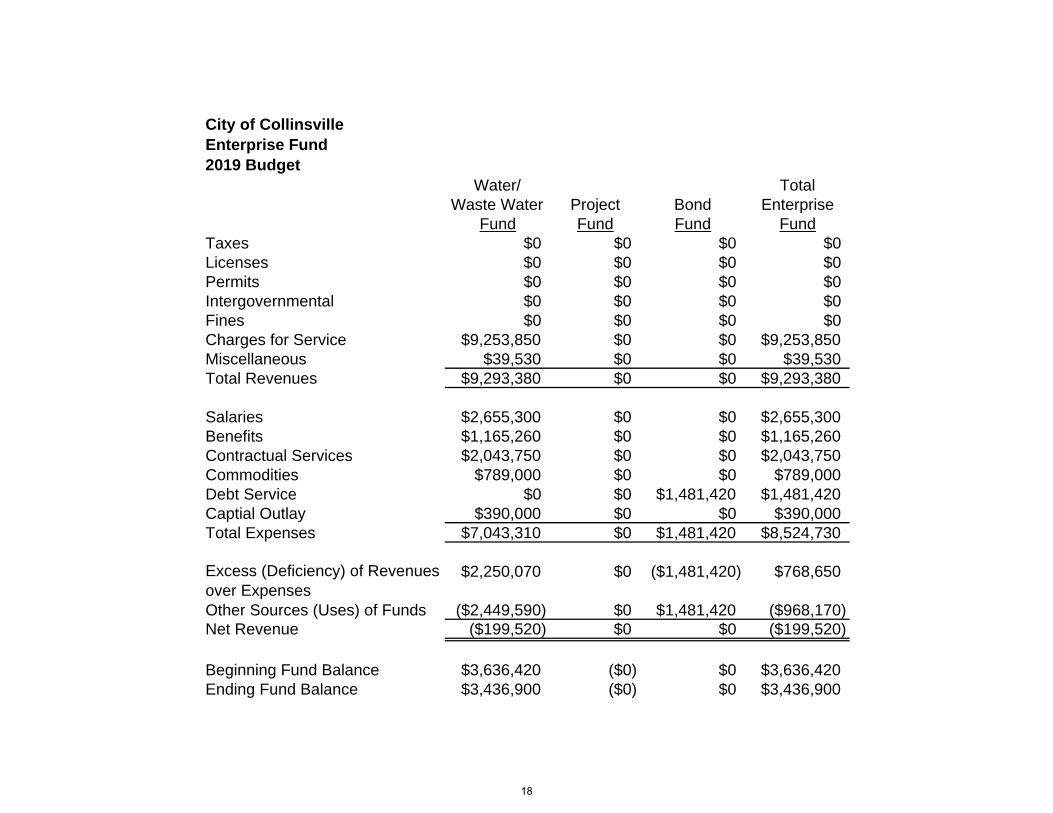
City of CollinsvilleEnterprise Fund2019 Budget
Water/ TotalWaste Water Project Bond Enterprise
Fund Fund Fund FundTaxes $0 $0 $0 $0Licenses $0 $0 $0 $0Permits $0 $0 $0 $0Intergovernmental $0 $0 $0 $0Fines $0 $0 $0 $0Charges for Service $9,253,850 $0 $0 $9,253,850Miscellaneous $39,530 $0 $0 $39,530Total Revenues $9,293,380 $0 $0 $9,293,380
Salaries $2,655,300 $0 $0 $2,655,300Benefits $1,165,260 $0 $0 $1,165,260Contractual Services $2,043,750 $0 $0 $2,043,750Commodities $789,000 $0 $0 $789,000Debt Service $0 $0 $1,481,420 $1,481,420Captial Outlay $390,000 $0 $0 $390,000Total Expenses $7,043,310 $0 $1,481,420 $8,524,730
$2,250,070 $0 ($1,481,420) $768,650
Other Sources (Uses) of Funds ($2,449,590) $0 $1,481,420 ($968,170)Net Revenue ($199,520) $0 $0 ($199,520)
Beginning Fund Balance $3,636,420 ($0) $0 $3,636,420Ending Fund Balance $3,436,900 ($0) $0 $3,436,900
Excess (Deficiency) of Revenues over Expenses
18
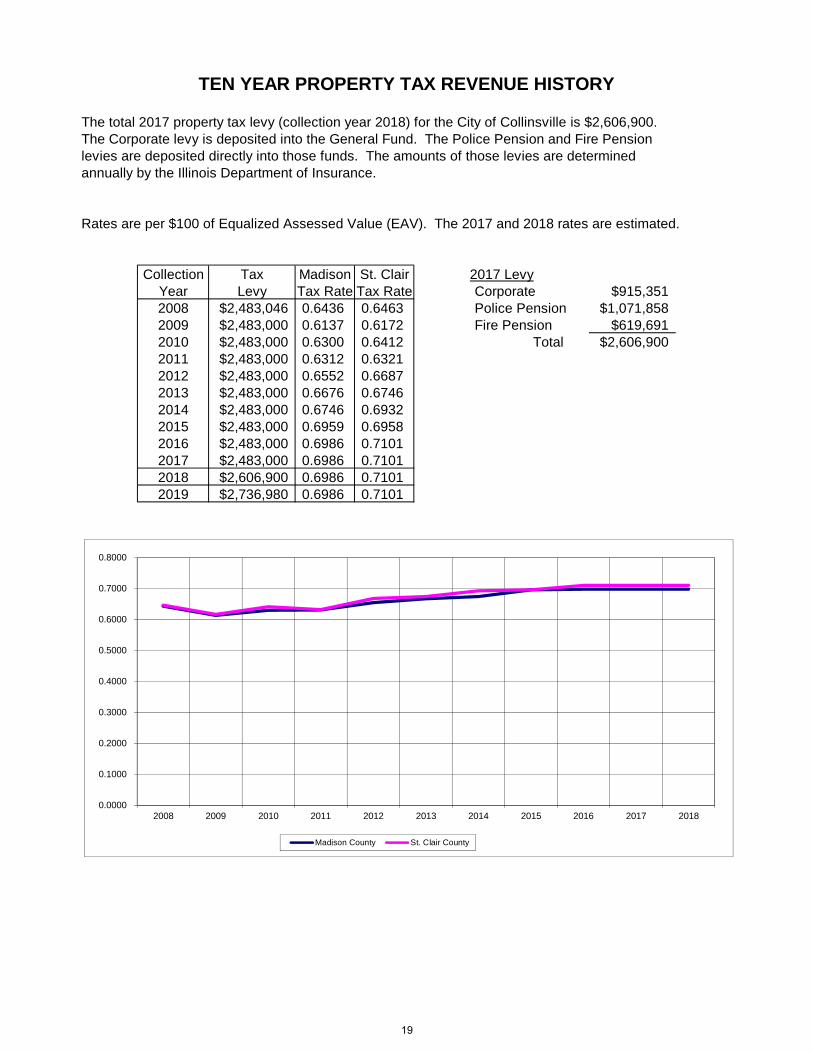
TEN YEAR PROPERTY TAX REVENUE HISTORY
The total 2017 property tax levy (collection year 2018) for the City of Collinsville is $2,606,900.The Corporate levy is deposited into the General Fund. The Police Pension and Fire Pensionlevies are deposited directly into those funds. The amounts of those levies are determinedannually by the Illinois Department of Insurance.
Rates are per $100 of Equalized Assessed Value (EAV). The 2017 and 2018 rates are estimated.
Collection Tax Madison St. Clair 2017 LevyYear Levy Tax Rate Tax Rate Corporate $915,3512008 $2,483,046 0.6436 0.6463 Police Pension $1,071,8582009 $2,483,000 0.6137 0.6172 Fire Pension $619,6912010 $2,483,000 0.6300 0.6412 Total $2,606,9002011 $2,483,000 0.6312 0.63212012 $2,483,000 0.6552 0.66872013 $2,483,000 0.6676 0.67462014 $2,483,000 0.6746 0.69322015 $2,483,000 0.6959 0.69582016 $2,483,000 0.6986 0.71012017 $2,483,000 0.6986 0.71012018 $2,606,900 0.6986 0.71012019 $2,736,980 0.6986 0.7101
0.0000
0.1000
0.2000
0.3000
0.4000
0.5000
0.6000
0.7000
0.8000
2008 2009 2010 2011 2012 2013 2014 2015 2016 2017 2018
Madison County St. Clair County
19
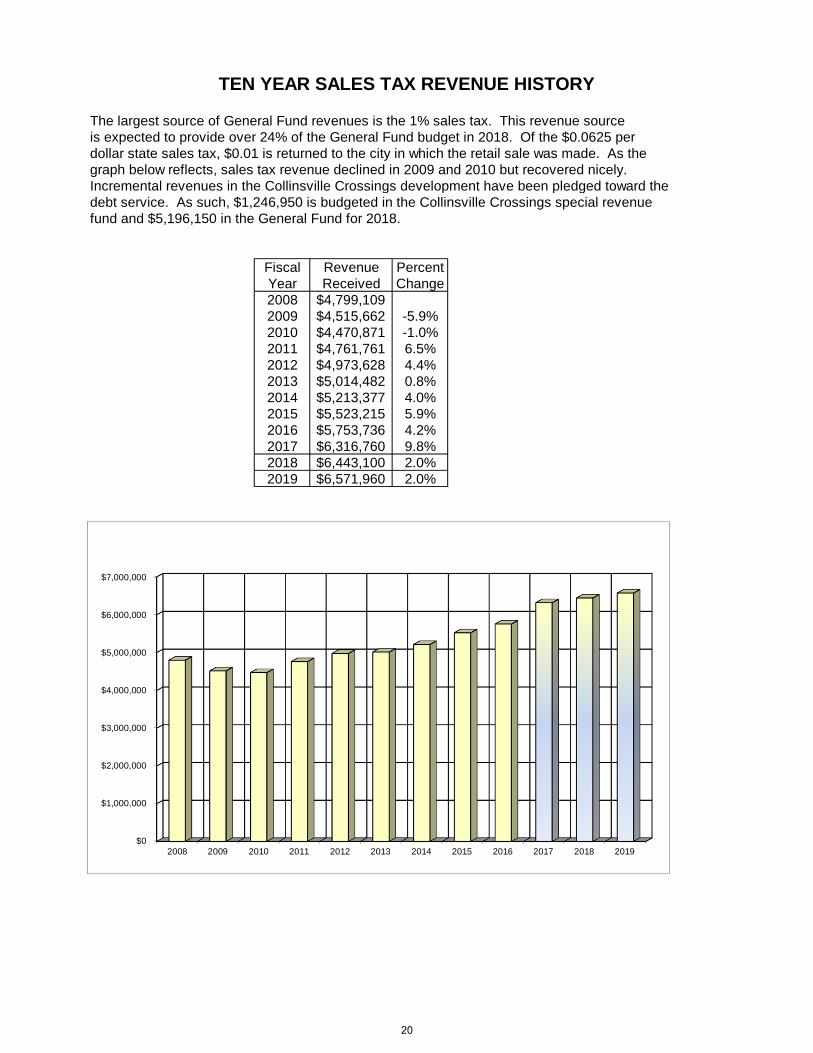
TEN YEAR SALES TAX REVENUE HISTORY
The largest source of General Fund revenues is the 1% sales tax. This revenue sourceis expected to provide over 24% of the General Fund budget in 2018. Of the $0.0625 perdollar state sales tax, $0.01 is returned to the city in which the retail sale was made. As thegraph below reflects, sales tax revenue declined in 2009 and 2010 but recovered nicely.Incremental revenues in the Collinsville Crossings development have been pledged toward thedebt service. As such, $1,246,950 is budgeted in the Collinsville Crossings special revenuefund and $5,196,150 in the General Fund for 2018.
Fiscal Revenue PercentYear Received Change2008 $4,799,1092009 $4,515,662 -5.9%2010 $4,470,871 -1.0%2011 $4,761,761 6.5%2012 $4,973,628 4.4%2013 $5,014,482 0.8%2014 $5,213,377 4.0%2015 $5,523,215 5.9%2016 $5,753,736 4.2%2017 $6,316,760 9.8%2018 $6,443,100 2.0%2019 $6,571,960 2.0%
$0
$1,000,000
$2,000,000
$3,000,000
$4,000,000
$5,000,000
$6,000,000
$7,000,000
2008 2009 2010 2011 2012 2013 2014 2015 2016 2017 2018 2019
20
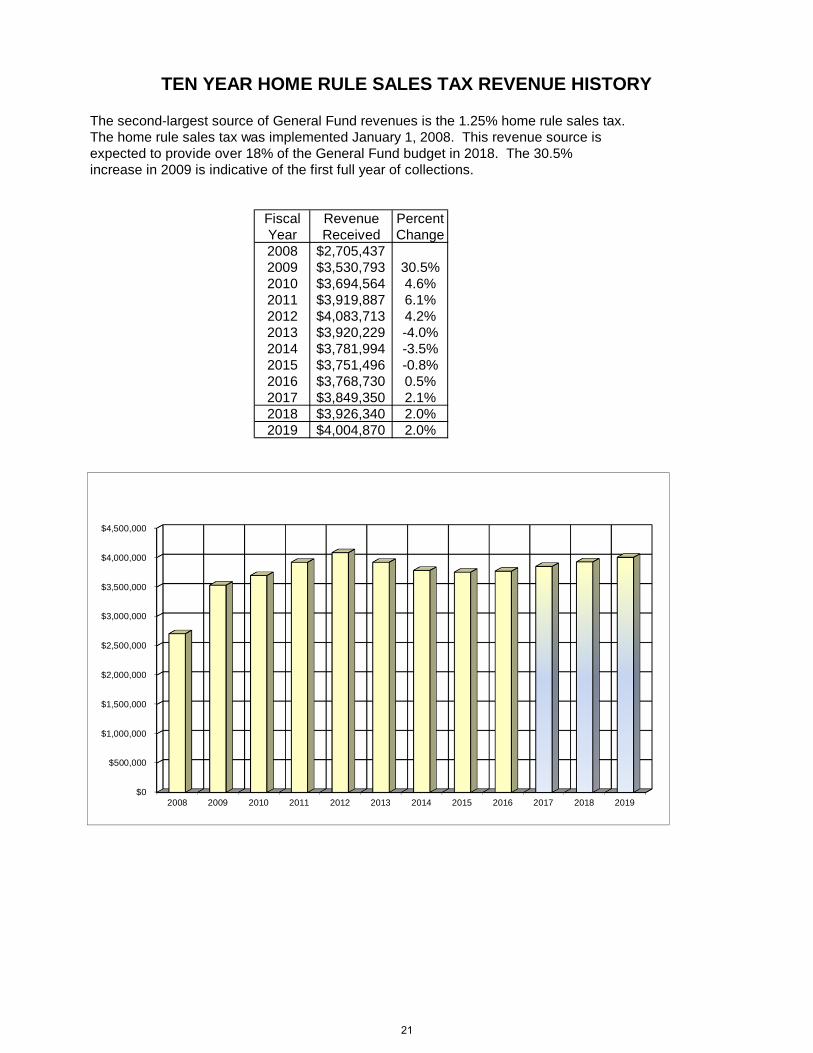
TEN YEAR HOME RULE SALES TAX REVENUE HISTORY
The second-largest source of General Fund revenues is the 1.25% home rule sales tax.The home rule sales tax was implemented January 1, 2008. This revenue source isexpected to provide over 18% of the General Fund budget in 2018. The 30.5%increase in 2009 is indicative of the first full year of collections.
Fiscal Revenue PercentYear Received Change2008 $2,705,4372009 $3,530,793 30.5%2010 $3,694,564 4.6%2011 $3,919,887 6.1%2012 $4,083,713 4.2%2013 $3,920,229 -4.0%2014 $3,781,994 -3.5%2015 $3,751,496 -0.8%2016 $3,768,730 0.5%2017 $3,849,350 2.1%2018 $3,926,340 2.0%2019 $4,004,870 2.0%
$0
$500,000
$1,000,000
$1,500,000
$2,000,000
$2,500,000
$3,000,000
$3,500,000
$4,000,000
$4,500,000
2008 2009 2010 2011 2012 2013 2014 2015 2016 2017 2018 2019
21
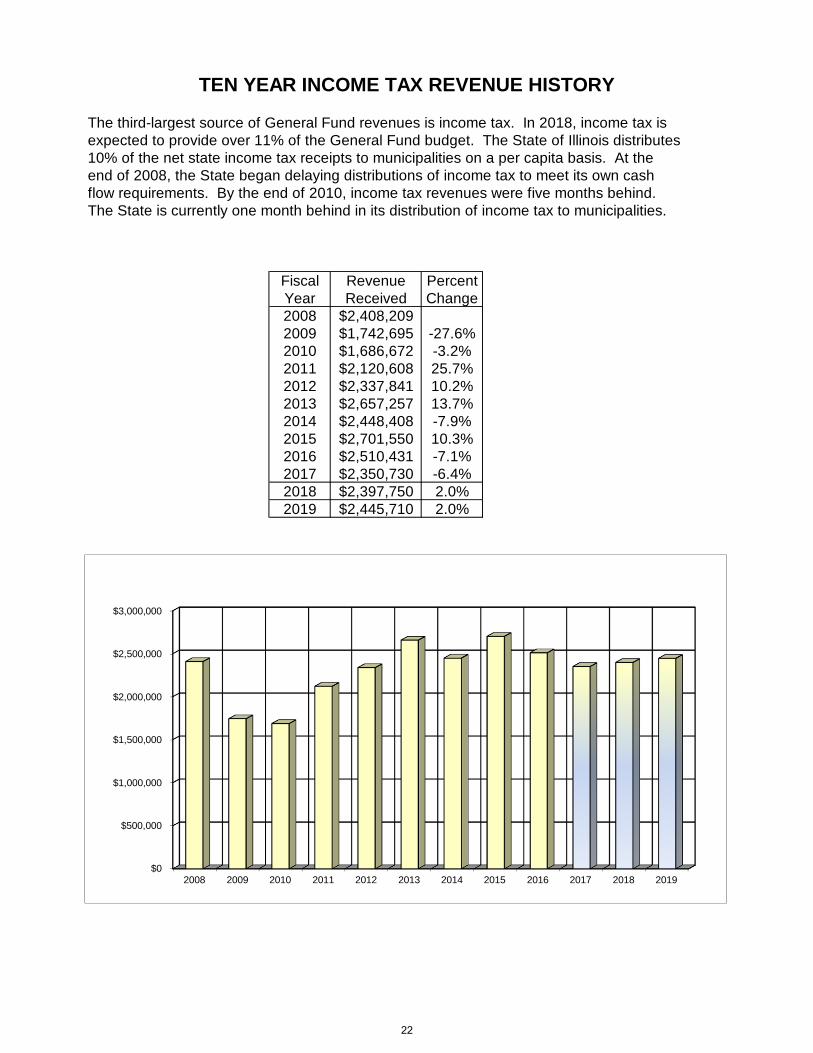
TEN YEAR INCOME TAX REVENUE HISTORY
The third-largest source of General Fund revenues is income tax. In 2018, income tax isexpected to provide over 11% of the General Fund budget. The State of Illinois distributes10% of the net state income tax receipts to municipalities on a per capita basis. At theend of 2008, the State began delaying distributions of income tax to meet its own cashflow requirements. By the end of 2010, income tax revenues were five months behind.The State is currently one month behind in its distribution of income tax to municipalities.
Fiscal Revenue PercentYear Received Change2008 $2,408,2092009 $1,742,695 -27.6%2010 $1,686,672 -3.2%2011 $2,120,608 25.7%2012 $2,337,841 10.2%2013 $2,657,257 13.7%2014 $2,448,408 -7.9%2015 $2,701,550 10.3%2016 $2,510,431 -7.1%2017 $2,350,730 -6.4%2018 $2,397,750 2.0%2019 $2,445,710 2.0%
$0
$500,000
$1,000,000
$1,500,000
$2,000,000
$2,500,000
$3,000,000
2008 2009 2010 2011 2012 2013 2014 2015 2016 2017 2018 2019
22

TEN YEAR GARBAGE REVENUE HISTORY
In August of 1991, the City contracted with a private hauler for residential curbsiderecycling and trash pickup. Currently, Republic Services provides this service to 9,663households. In 2017, Republic Services charged the City $12.43 per month per household.The City billed senior citizen households $9.96 per month and all other households $13.10per month. Note that Republic Services began directly billing rental properties withfive or more units during 2017.
Fiscal Revenue PercentYear Received Change2008 $1,154,7582009 $1,234,834 6.9%2010 $1,298,232 5.1%2011 $1,405,101 8.2%2012 $1,431,766 1.9%2013 $1,497,766 4.6%2014 $1,471,306 -1.8%2015 $1,495,212 1.6%2016 $1,459,637 -2.4%2017 $1,501,370 2.9%2018 $1,576,440 5.0%2019 $1,655,260 5.0%
$0
$200,000
$400,000
$600,000
$800,000
$1,000,000
$1,200,000
$1,400,000
$1,600,000
$1,800,000
2008 2009 2010 2011 2012 2013 2014 2015 2016 2017 2018 2019
23
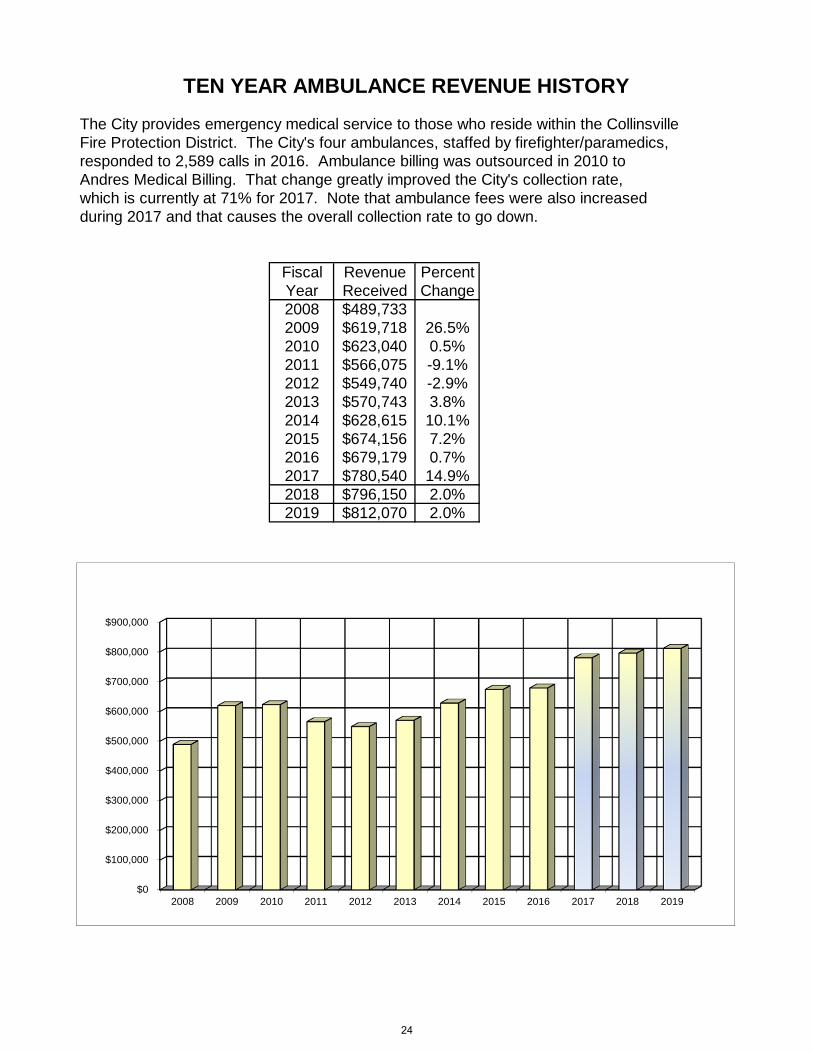
TEN YEAR AMBULANCE REVENUE HISTORY
The City provides emergency medical service to those who reside within the CollinsvilleFire Protection District. The City's four ambulances, staffed by firefighter/paramedics,responded to 2,589 calls in 2016. Ambulance billing was outsourced in 2010 toAndres Medical Billing. That change greatly improved the City's collection rate,which is currently at 71% for 2017. Note that ambulance fees were also increasedduring 2017 and that causes the overall collection rate to go down.
Fiscal Revenue PercentYear Received Change2008 $489,7332009 $619,718 26.5%2010 $623,040 0.5%2011 $566,075 -9.1%2012 $549,740 -2.9%2013 $570,743 3.8%2014 $628,615 10.1%2015 $674,156 7.2%2016 $679,179 0.7%2017 $780,540 14.9%2018 $796,150 2.0%2019 $812,070 2.0%
$0
$100,000
$200,000
$300,000
$400,000
$500,000
$600,000
$700,000
$800,000
$900,000
2008 2009 2010 2011 2012 2013 2014 2015 2016 2017 2018 2019
24

TEN YEAR TELECOMMUNICATIONS TAX REVENUE HISTORY
On July 1, 2003, the City began collecting the Simplified Telecommunications Tax at a rate of 6%.Telecommunication Tax is still a major source of revenue in the City's General Fund, but itsranking has continued to slip to eighth-largest as the telecommunications industry has changed.All telephone service providers are required to collect this tax and submit it to the State of Illinois.The State of Illinois retains 1/2% as an administration fee and returns 5 1/2% to the City.
SimplifiedFiscal Telecom PercentYear Tax Change2008 $1,053,7012009 $1,092,276 3.7%2010 $1,070,447 -2.0%2011 $1,068,851 -0.1%2012 $1,221,054 14.2%2013 $971,985 -20.4%2014 $794,993 -18.2%2015 $774,632 -2.6%2016 $779,972 0.7%2017 $733,880 -5.9%2018 $733,880 0.0%2019 $733,880 0.0%
$0
$200,000
$400,000
$600,000
$800,000
$1,000,000
$1,200,000
$1,400,000
2008 2009 2010 2011 2012 2013 2014 2015 2016 2017 2018 2019
25
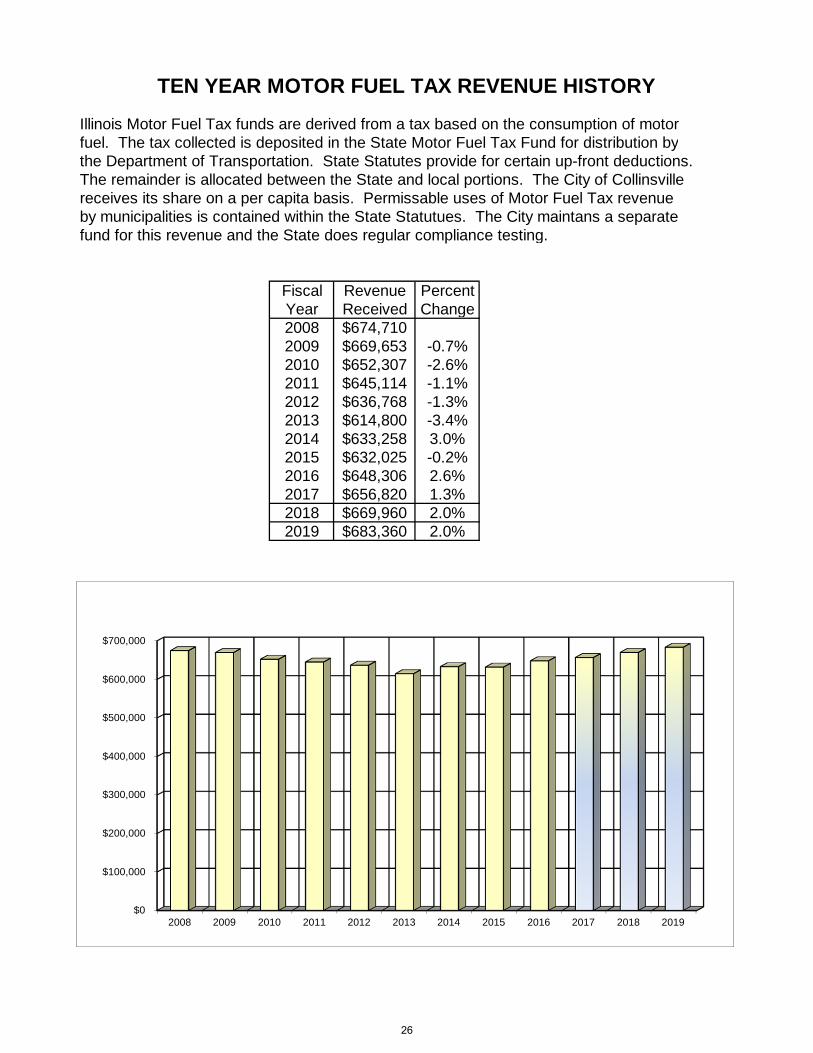
TEN YEAR MOTOR FUEL TAX REVENUE HISTORY
Illinois Motor Fuel Tax funds are derived from a tax based on the consumption of motorfuel. The tax collected is deposited in the State Motor Fuel Tax Fund for distribution bythe Department of Transportation. State Statutes provide for certain up-front deductions.The remainder is allocated between the State and local portions. The City of Collinsvillereceives its share on a per capita basis. Permissable uses of Motor Fuel Tax revenueby municipalities is contained within the State Statutues. The City maintans a separatefund for this revenue and the State does regular compliance testing.
Fiscal Revenue PercentYear Received Change2008 $674,7102009 $669,653 -0.7%2010 $652,307 -2.6%2011 $645,114 -1.1%2012 $636,768 -1.3%2013 $614,800 -3.4%2014 $633,258 3.0%2015 $632,025 -0.2%2016 $648,306 2.6%2017 $656,820 1.3%2018 $669,960 2.0%2019 $683,360 2.0%
$0
$100,000
$200,000
$300,000
$400,000
$500,000
$600,000
$700,000
2008 2009 2010 2011 2012 2013 2014 2015 2016 2017 2018 2019
26
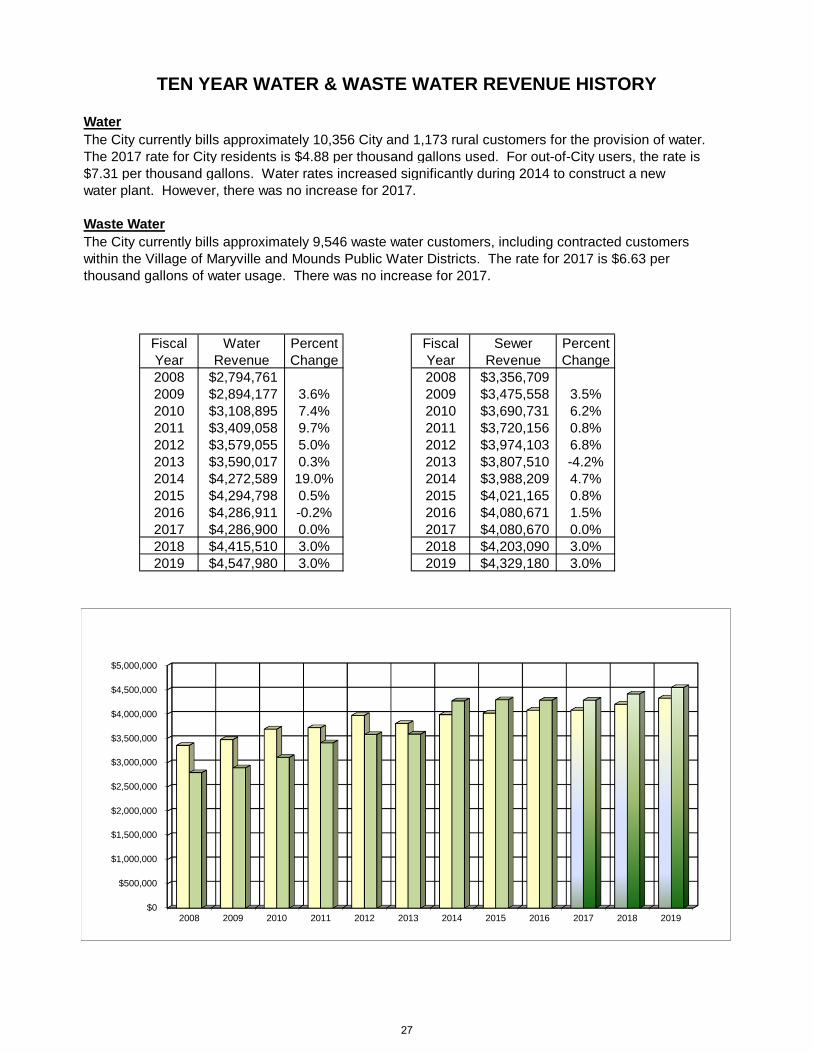
TEN YEAR WATER & WASTE WATER REVENUE HISTORY
WaterThe City currently bills approximately 10,356 City and 1,173 rural customers for the provision of water.The 2017 rate for City residents is $4.88 per thousand gallons used. For out-of-City users, the rate is$7.31 per thousand gallons. Water rates increased significantly during 2014 to construct a new water plant. However, there was no increase for 2017.
Waste WaterThe City currently bills approximately 9,546 waste water customers, including contracted customerswithin the Village of Maryville and Mounds Public Water Districts. The rate for 2017 is $6.63 perthousand gallons of water usage. There was no increase for 2017.
Fiscal Water Percent Fiscal Sewer PercentYear Revenue Change Year Revenue Change2008 $2,794,761 2008 $3,356,7092009 $2,894,177 3.6% 2009 $3,475,558 3.5%2010 $3,108,895 7.4% 2010 $3,690,731 6.2%2011 $3,409,058 9.7% 2011 $3,720,156 0.8%2012 $3,579,055 5.0% 2012 $3,974,103 6.8%2013 $3,590,017 0.3% 2013 $3,807,510 -4.2%2014 $4,272,589 19.0% 2014 $3,988,209 4.7%2015 $4,294,798 0.5% 2015 $4,021,165 0.8%2016 $4,286,911 -0.2% 2016 $4,080,671 1.5%2017 $4,286,900 0.0% 2017 $4,080,670 0.0%2018 $4,415,510 3.0% 2018 $4,203,090 3.0%2019 $4,547,980 3.0% 2019 $4,329,180 3.0%
$0
$500,000
$1,000,000
$1,500,000
$2,000,000
$2,500,000
$3,000,000
$3,500,000
$4,000,000
$4,500,000
$5,000,000
2008 2009 2010 2011 2012 2013 2014 2015 2016 2017 2018 2019
27
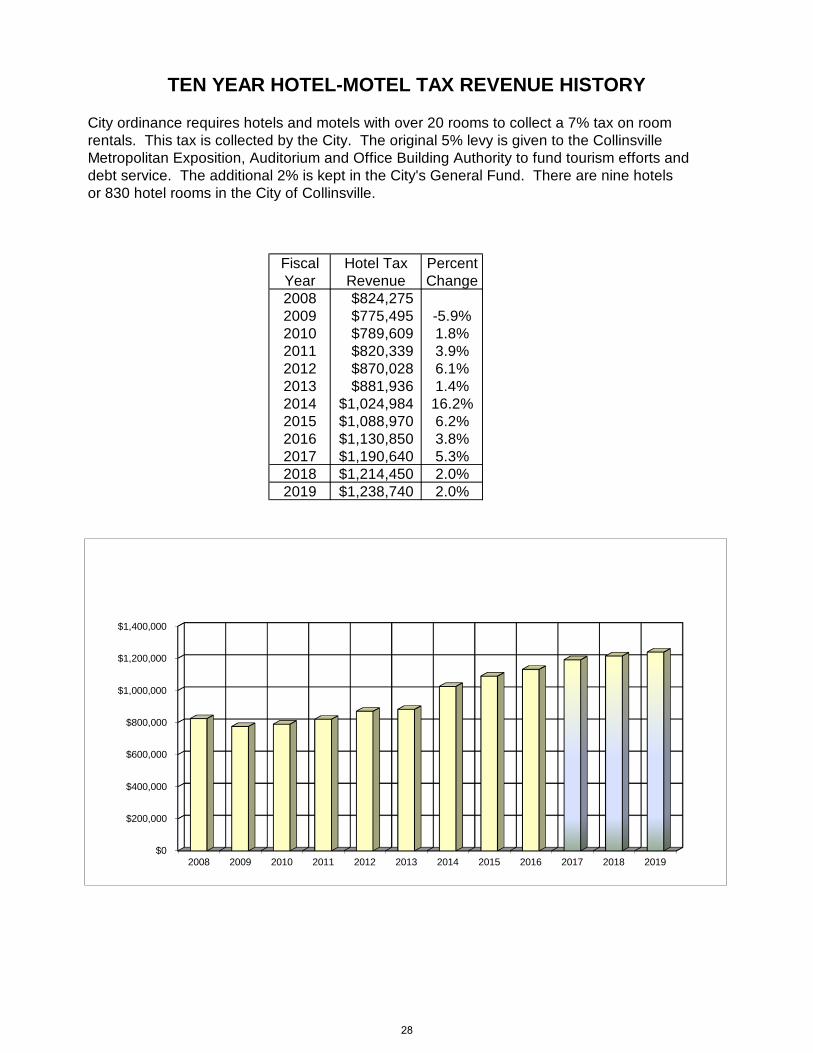
TEN YEAR HOTEL-MOTEL TAX REVENUE HISTORY
City ordinance requires hotels and motels with over 20 rooms to collect a 7% tax on roomrentals. This tax is collected by the City. The original 5% levy is given to the CollinsvilleMetropolitan Exposition, Auditorium and Office Building Authority to fund tourism efforts anddebt service. The additional 2% is kept in the City's General Fund. There are nine hotelsor 830 hotel rooms in the City of Collinsville.
Fiscal Hotel Tax PercentYear Revenue Change2008 $824,2752009 $775,495 -5.9%2010 $789,609 1.8%2011 $820,339 3.9%2012 $870,028 6.1%2013 $881,936 1.4%2014 $1,024,984 16.2%2015 $1,088,970 6.2%2016 $1,130,850 3.8%2017 $1,190,640 5.3%2018 $1,214,450 2.0%2019 $1,238,740 2.0%
$0
$200,000
$400,000
$600,000
$800,000
$1,000,000
$1,200,000
$1,400,000
2008 2009 2010 2011 2012 2013 2014 2015 2016 2017 2018 2019
28
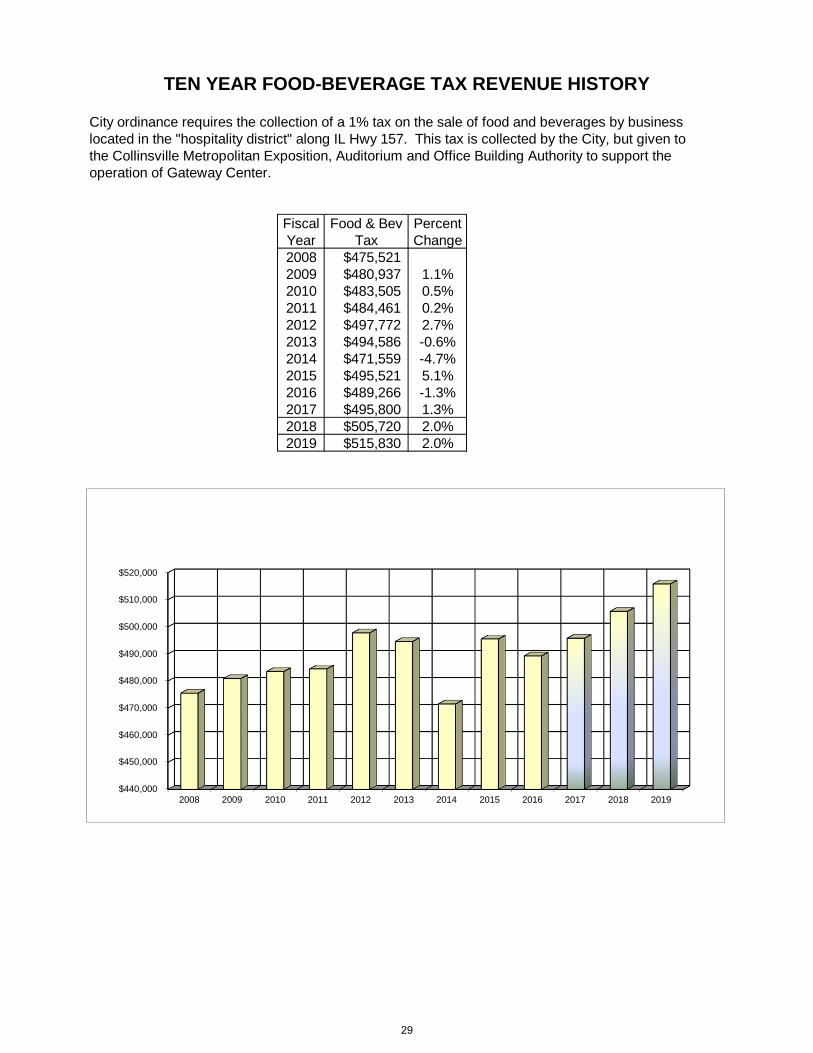
TEN YEAR FOOD-BEVERAGE TAX REVENUE HISTORY
City ordinance requires the collection of a 1% tax on the sale of food and beverages by businesslocated in the "hospitality district" along IL Hwy 157. This tax is collected by the City, but given tothe Collinsville Metropolitan Exposition, Auditorium and Office Building Authority to support theoperation of Gateway Center.
Fiscal Food & Bev PercentYear Tax Change2008 $475,5212009 $480,937 1.1%2010 $483,505 0.5%2011 $484,461 0.2%2012 $497,772 2.7%2013 $494,586 -0.6%2014 $471,559 -4.7%2015 $495,521 5.1%2016 $489,266 -1.3%2017 $495,800 1.3%2018 $505,720 2.0%2019 $515,830 2.0%
$440,000
$450,000
$460,000
$470,000
$480,000
$490,000
$500,000
$510,000
$520,000
2008 2009 2010 2011 2012 2013 2014 2015 2016 2017 2018 2019
29
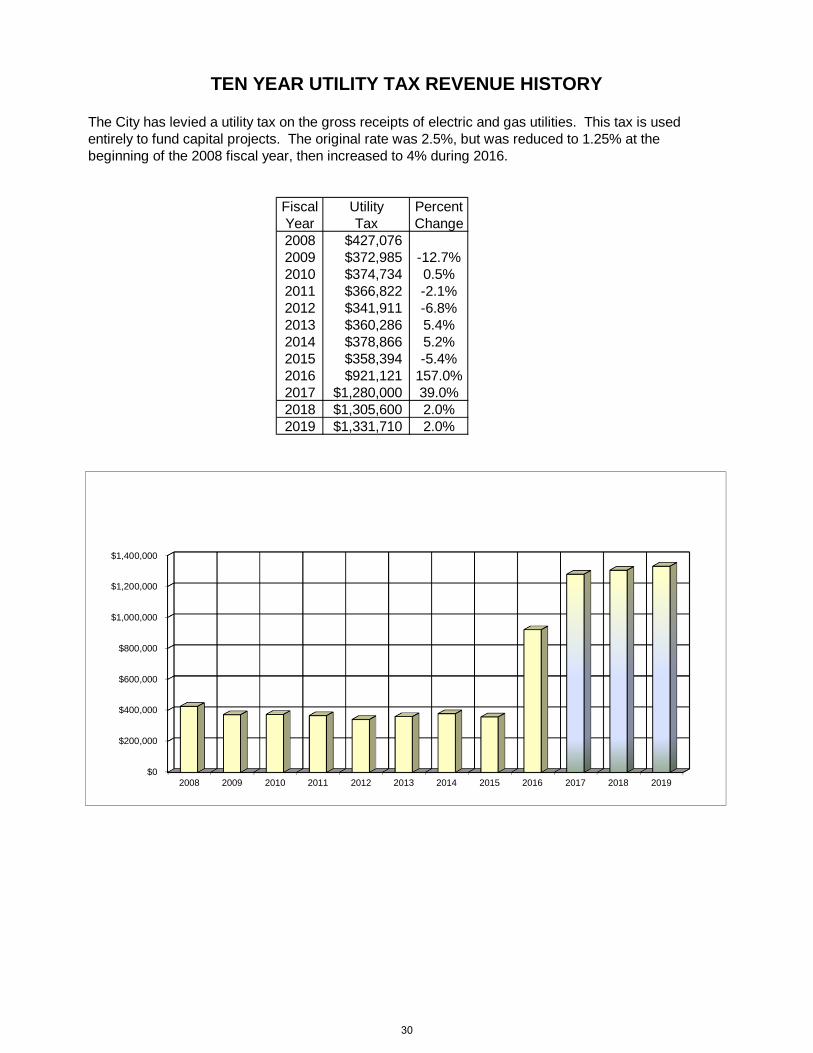
TEN YEAR UTILITY TAX REVENUE HISTORY
The City has levied a utility tax on the gross receipts of electric and gas utilities. This tax is usedentirely to fund capital projects. The original rate was 2.5%, but was reduced to 1.25% at thebeginning of the 2008 fiscal year, then increased to 4% during 2016.
Fiscal Utility PercentYear Tax Change2008 $427,0762009 $372,985 -12.7%2010 $374,734 0.5%2011 $366,822 -2.1%2012 $341,911 -6.8%2013 $360,286 5.4%2014 $378,866 5.2%2015 $358,394 -5.4%2016 $921,121 157.0%2017 $1,280,000 39.0%2018 $1,305,600 2.0%2019 $1,331,710 2.0%
$0
$200,000
$400,000
$600,000
$800,000
$1,000,000
$1,200,000
$1,400,000
2008 2009 2010 2011 2012 2013 2014 2015 2016 2017 2018 2019
30
2014 2015 2016 2017 2018 2019 2020 2021 2022 2023Actual Actual Actual Projected Budget Budget Estimate Estimate Estimate Estimate
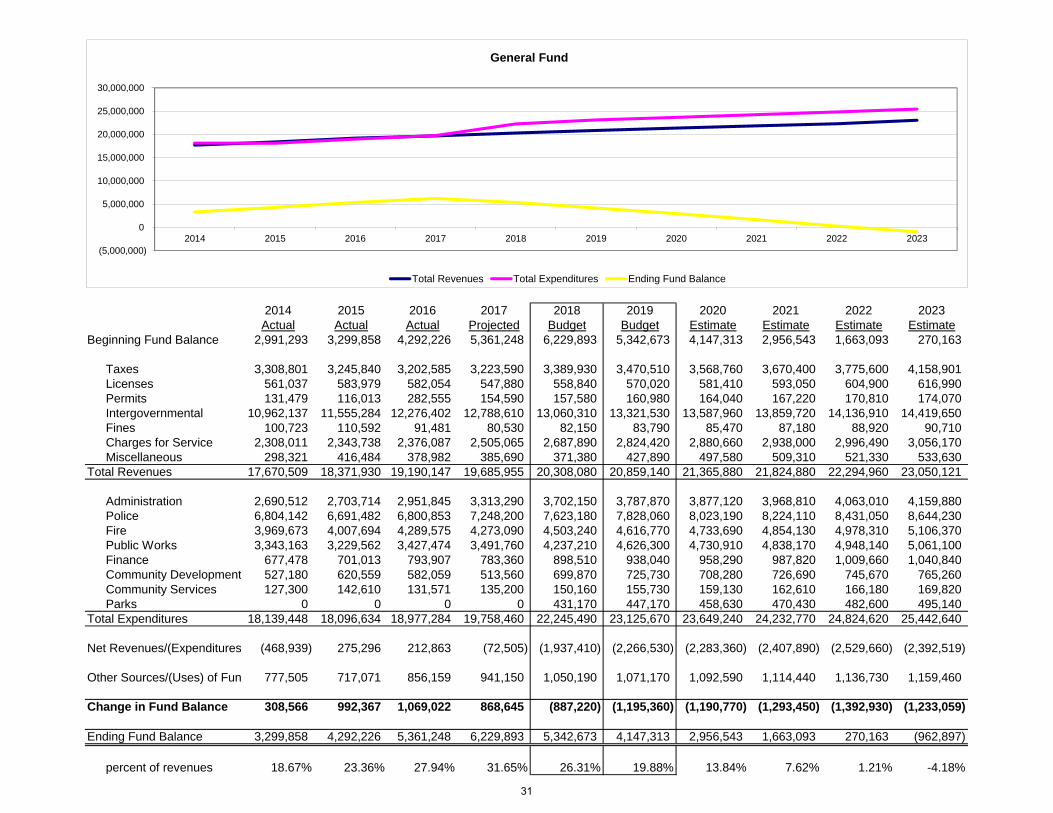
Beginning Fund Balance 2,991,293 3,299,858 4,292,226 5,361,248 6,229,893 5,342,673 4,147,313 2,956,543 1,663,093 270,163
Taxes 3,308,801 3,245,840 3,202,585 3,223,590 3,389,930 3,470,510 3,568,760 3,670,400 3,775,600 4,158,901Licenses 561,037 583,979 582,054 547,880 558,840 570,020 581,410 593,050 604,900 616,990Permits 131,479 116,013 282,555 154,590 157,580 160,980 164,040 167,220 170,810 174,070Intergovernmental 10,962,137 11,555,284 12,276,402 12,788,610 13,060,310 13,321,530 13,587,960 13,859,720 14,136,910 14,419,650Fines 100,723 110,592 91,481 80,530 82,150 83,790 85,470 87,180 88,920 90,710Charges for Service 2,308,011 2,343,738 2,376,087 2,505,065 2,687,890 2,824,420 2,880,660 2,938,000 2,996,490 3,056,170Miscellaneous 298,321 416,484 378,982 385,690 371,380 427,890 497,580 509,310 521,330 533,630
Total Revenues 17,670,509 18,371,930 19,190,147 19,685,955 20,308,080 20,859,140 21,365,880 21,824,880 22,294,960 23,050,121
Administration 2,690,512 2,703,714 2,951,845 3,313,290 3,702,150 3,787,870 3,877,120 3,968,810 4,063,010 4,159,880Police 6,804,142 6,691,482 6,800,853 7,248,200 7,623,180 7,828,060 8,023,190 8,224,110 8,431,050 8,644,230Fire 3,969,673 4,007,694 4,289,575 4,273,090 4,503,240 4,616,770 4,733,690 4,854,130 4,978,310 5,106,370Public Works 3,343,163 3,229,562 3,427,474 3,491,760 4,237,210 4,626,300 4,730,910 4,838,170 4,948,140 5,061,100Finance 677,478 701,013 793,907 783,360 898,510 938,040 958,290 987,820 1,009,660 1,040,840Community Development 527,180 620,559 582,059 513,560 699,870 725,730 708,280 726,690 745,670 765,260Community Services 127,300 142,610 131,571 135,200 150,160 155,730 159,130 162,610 166,180 169,820Parks 0 0 0 0 431,170 447,170 458,630 470,430 482,600 495,140
Total Expenditures 18,139,448 18,096,634 18,977,284 19,758,460 22,245,490 23,125,670 23,649,240 24,232,770 24,824,620 25,442,640
Net Revenues/(Expenditures (468,939) 275,296 212,863 (72,505) (1,937,410) (2,266,530) (2,283,360) (2,407,890) (2,529,660) (2,392,519)
Other Sources/(Uses) of Fun 777,505 717,071 856,159 941,150 1,050,190 1,071,170 1,092,590 1,114,440 1,136,730 1,159,460
Change in Fund Balance 308,566 992,367 1,069,022 868,645 (887,220) (1,195,360) (1,190,770) (1,293,450) (1,392,930) (1,233,059)
Ending Fund Balance 3,299,858 4,292,226 5,361,248 6,229,893 5,342,673 4,147,313 2,956,543 1,663,093 270,163 (962,897)
percent of revenues 18.67% 23.36% 27.94% 31.65% 26.31% 19.88% 13.84% 7.62% 1.21% -4.18%
(5,000,000)
0
5,000,000
10,000,000
15,000,000
20,000,000
25,000,000
30,000,000
2014 2015 2016 2017 2018 2019 2020 2021 2022 2023
General Fund
Total Revenues Total Expenditures Ending Fund Balance
31
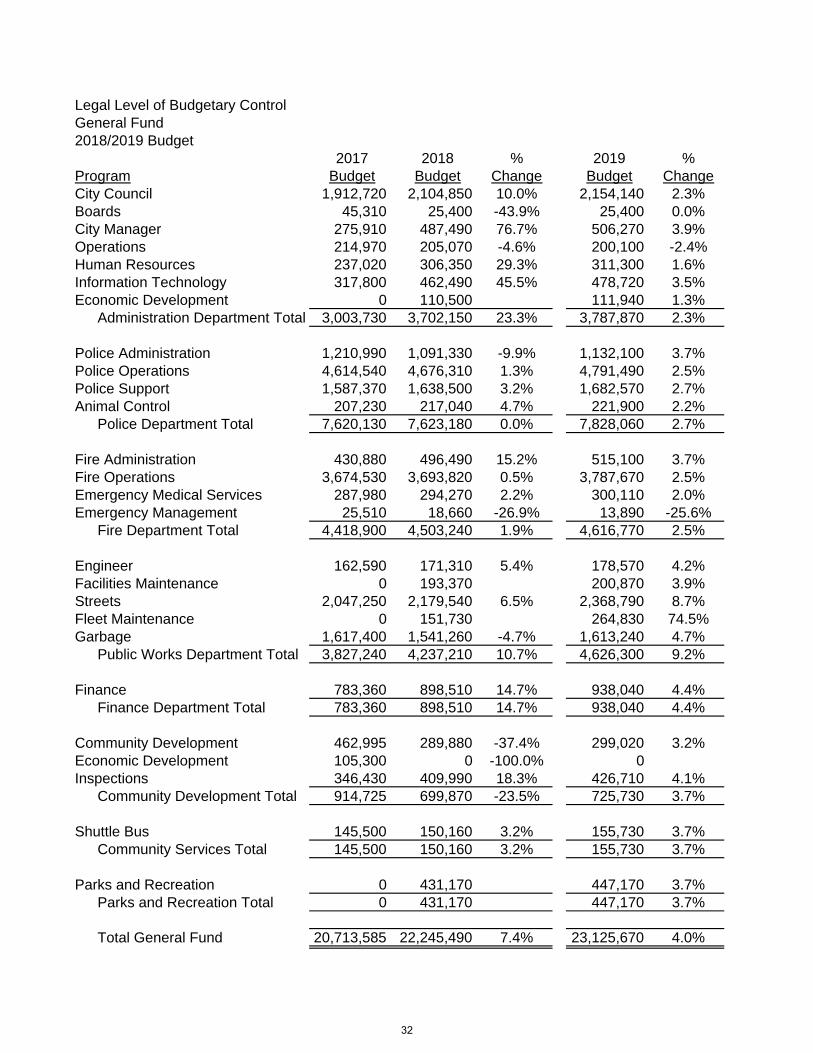
Legal Level of Budgetary ControlGeneral Fund2018/2019 Budget
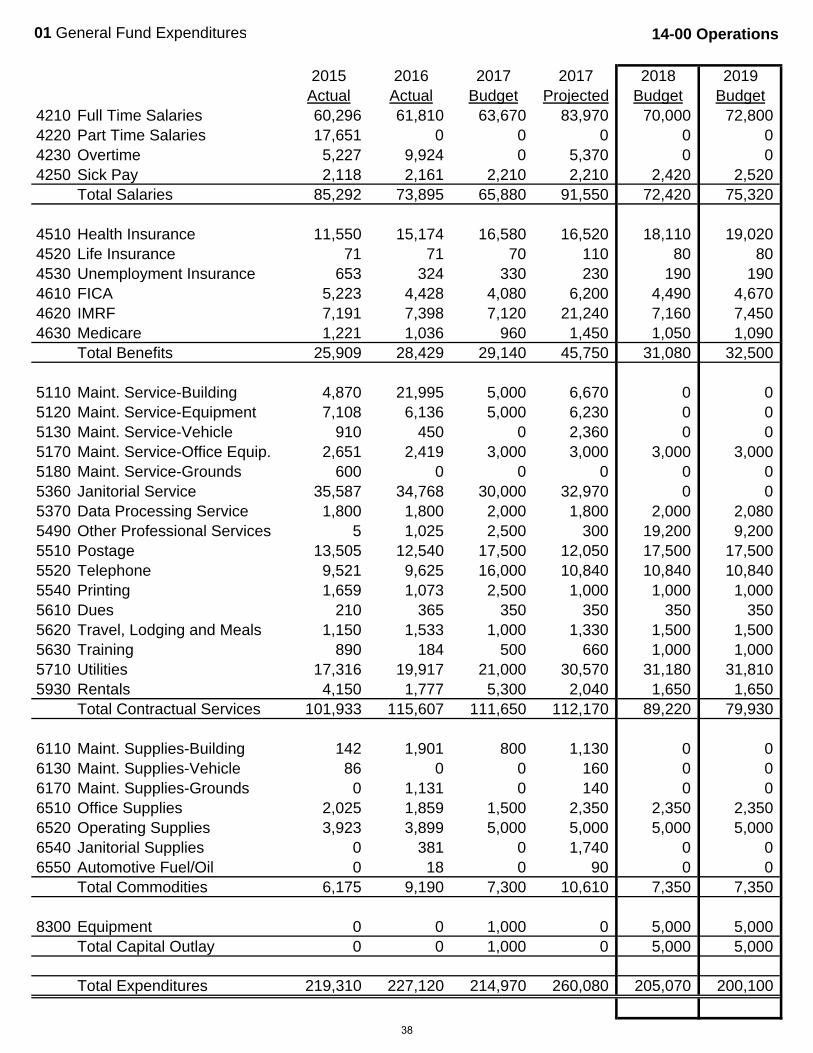
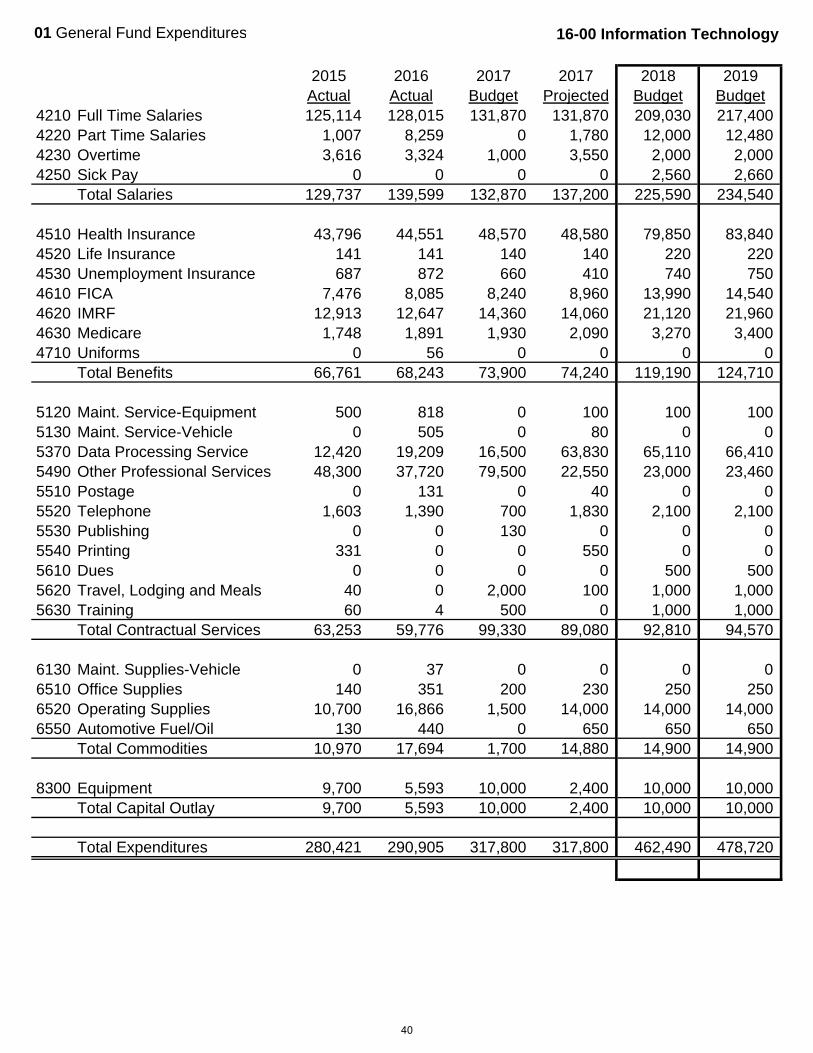
2017 2018 % 2019 %Program Budget Budget Change Budget ChangeCity Council 1,912,720 2,104,850 10.0% 2,154,140 2.3%Boards 45,310 25,400 -43.9% 25,400 0.0%City Manager 275,910 487,490 76.7% 506,270 3.9%Operations 214,970 205,070 -4.6% 200,100 -2.4%Human Resources 237,020 306,350 29.3% 311,300 1.6%Information Technology 317,800 462,490 45.5% 478,720 3.5%Economic Development 0 110,500 111,940 1.3%
Administration Department Total 3,003,730 3,702,150 23.3% 3,787,870 2.3%
Police Administration 1,210,990 1,091,330 -9.9% 1,132,100 3.7%Police Operations 4,614,540 4,676,310 1.3% 4,791,490 2.5%Police Support 1,587,370 1,638,500 3.2% 1,682,570 2.7%Animal Control 207,230 217,040 4.7% 221,900 2.2%
Police Department Total 7,620,130 7,623,180 0.0% 7,828,060 2.7%
Fire Administration 430,880 496,490 15.2% 515,100 3.7%Fire Operations 3,674,530 3,693,820 0.5% 3,787,670 2.5%Emergency Medical Services 287,980 294,270 2.2% 300,110 2.0%Emergency Management 25,510 18,660 -26.9% 13,890 -25.6%
Fire Department Total 4,418,900 4,503,240 1.9% 4,616,770 2.5%
Engineer 162,590 171,310 5.4% 178,570 4.2%Facilities Maintenance 0 193,370 200,870 3.9%Streets 2,047,250 2,179,540 6.5% 2,368,790 8.7%Fleet Maintenance 0 151,730 264,830 74.5%Garbage 1,617,400 1,541,260 -4.7% 1,613,240 4.7%
Public Works Department Total 3,827,240 4,237,210 10.7% 4,626,300 9.2%
Finance 783,360 898,510 14.7% 938,040 4.4%Finance Department Total 783,360 898,510 14.7% 938,040 4.4%
Community Development 462,995 289,880 -37.4% 299,020 3.2%Economic Development 105,300 0 -100.0% 0 Inspections 346,430 409,990 18.3% 426,710 4.1%
Community Development Total 914,725 699,870 -23.5% 725,730 3.7%
Shuttle Bus 145,500 150,160 3.2% 155,730 3.7%Community Services Total 145,500 150,160 3.2% 155,730 3.7%
Parks and Recreation 0 431,170 447,170 3.7%Parks and Recreation Total 0 431,170 447,170 3.7%
Total General Fund 20,713,585 22,245,490 7.4% 23,125,670 4.0%
32

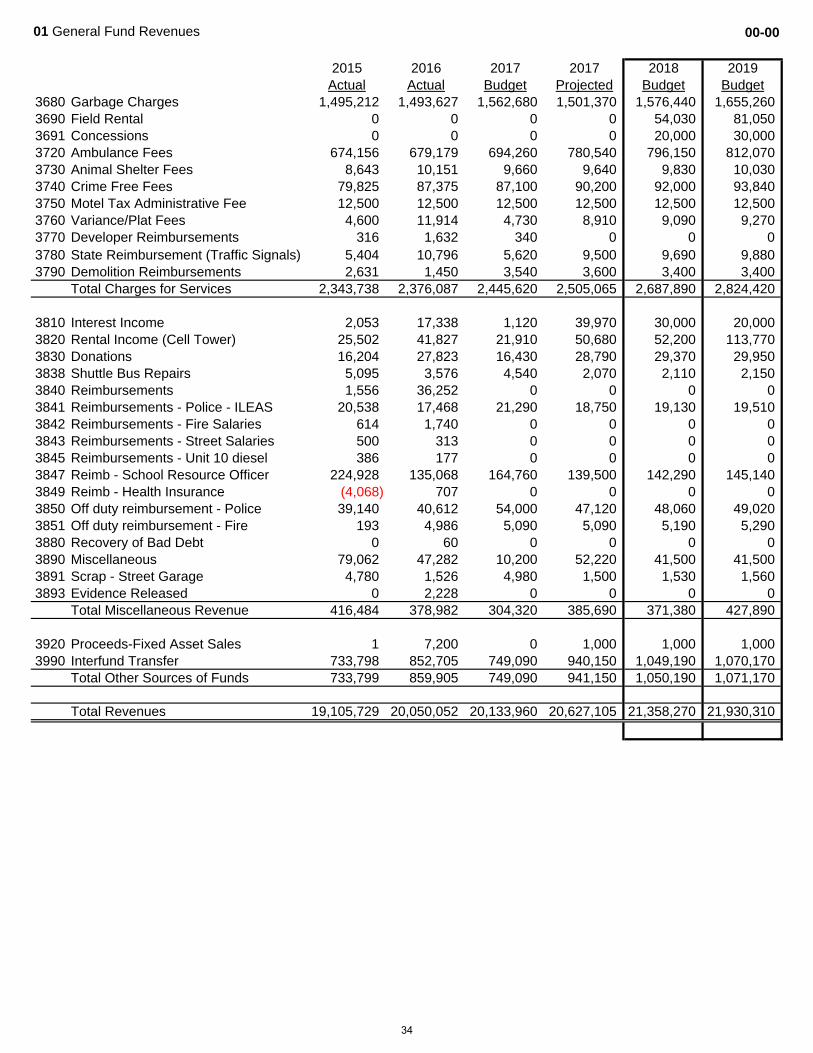
01 General Fund Revenues 00-00
2015 2016 2017 2017 2018 2019Actual Actual Budget Projected Budget Budget
3110 Property Tax 869,210 781,531 733,500 783,140 915,350 961,1203140 Hotel/Motel Tax 1,088,970 1,130,850 1,180,020 1,190,640 1,214,450 1,238,7403150 Auto Rental Tax 8,624 8,559 9,000 7,970 8,130 8,2903160 Telecommunications Tax 774,632 779,972 792,640 733,880 733,880 733,8803170 Admission Tax 8,883 8,098 9,460 8,200 8,360 8,5303171 Pulltabs and Jar Games 0 4,309 0 3,960 4,040 4,1203180 Food & Beverage Tax 495,521 489,266 512,460 495,800 505,720 515,830
Total Taxes 3,245,840 3,202,585 3,237,080 3,223,590 3,389,930 3,470,510
3210 Liquor Licenses 76,550 73,600 75,830 75,830 77,350 78,9003220 Business Licenses 24,025 25,673 25,980 15,000 15,300 15,6103221 Landlord Licenses 0 0 0 14,000 14,280 14,5703230 Cable TV Franchise 243,726 251,241 253,080 249,100 254,080 259,1603240 Telephone Franchise 193,952 169,241 201,790 136,900 139,640 142,4303260 Vending Machine Licenses 3,225 6,875 3,590 4,050 4,130 4,2103270 Video Gaming Licenses 42,500 55,425 32,650 53,000 54,060 55,140
Total Licenses 583,979 582,054 592,920 547,880 558,840 570,020
3310 Building Permits 113,504 277,574 109,710 149,160 152,140 155,1803370 Yard Sale Permits 1,204 1,106 1,250 1,000 1,020 1,0403380 Chicken Keeping Permits 0 250 0 100 0 2503390 Other Permits 1,305 3,625 1,510 4,330 4,420 4,510
Total Permits 116,013 282,555 112,470 154,590 157,580 160,980
3410 State Income Tax 2,701,550 2,510,431 2,810,690 2,350,730 2,397,750 2,445,7103420 Replacement Tax 86,513 51,269 90,460 78,380 79,950 81,5503430 Video Gaming 115,805 141,060 112,200 149,030 152,010 155,0503438 Grants/Police 0 2,970 0 1,000 0 03439 Grants/Fire 0 0 0 1,000 0 03440 Grants 0 31,497 0 8,390 0 03441 Grants/MEGSI 50,022 43,766 53,820 42,760 20,000 20,4003442 Grants/MEATF-Auto Task Force 4,463 0 0 0 0 03443 Grants/Shuttle Bus 23,667 24,275 24,760 24,300 24,790 25,2903444 PEP Grant 0 0 0 0 28,120 28,6803446 Grants/DEA 9,373 16,155 0 12,360 0 03449 Grants/Hwy Safety-DUI-Traffic 17,711 26,574 0 12,920 47,790 48,7503450 Sales Tax 4,296,514 4,556,461 4,442,510 5,094,260 5,196,150 5,300,0703451 Home Rule Sales Tax 3,151,496 3,768,730 3,906,380 3,849,350 3,926,340 4,004,8703460 Road & Bridge Tax 216,897 221,511 223,690 220,620 225,030 229,5303480 Use Tax 506,015 652,927 544,480 630,180 642,780 655,6403490 Other Intergovernmental Revenues 375,259 228,775 369,620 313,330 319,600 325,990
Total Intergovernmental Revenues 11,555,284 12,276,402 12,578,610 12,788,610 13,060,310 13,321,530
3510 Court Fines 75,962 69,850 79,540 62,260 63,510 64,7803530 City Court Fines 30,481 17,875 29,530 14,400 14,690 14,9803550 Drug Fines 3,387 3,756 3,870 3,870 3,950 4,0303553 Jail Telephone Commission 762 0 910 0 0 0
Total Fines & Forfeitures 110,592 91,481 113,850 80,530 82,150 83,790
3612 Penalty Charges 0 0 0 10,500 27,680 28,5103630 Photocopies 533 381 1,040 4,300 1,600 1,6303635 Impound Fees 59,220 66,432 63,380 73,680 75,150 76,6503640 Police Dept Fees 375 200 400 55 60 603650 Fingerprints - Liquor Licenses 298 425 320 170 170 1703660 Service Fees 25 25 50 100 100 100
33
01 General Fund Revenues 00-00
2015 2016 2017 2017 2018 2019Actual Actual Budget Projected Budget Budget
3680 Garbage Charges 1,495,212 1,493,627 1,562,680 1,501,370 1,576,440 1,655,2603690 Field Rental 0 0 0 0 54,030 81,0503691 Concessions 0 0 0 0 20,000 30,0003720 Ambulance Fees 674,156 679,179 694,260 780,540 796,150 812,0703730 Animal Shelter Fees 8,643 10,151 9,660 9,640 9,830 10,0303740 Crime Free Fees 79,825 87,375 87,100 90,200 92,000 93,8403750 Motel Tax Administrative Fee 12,500 12,500 12,500 12,500 12,500 12,5003760 Variance/Plat Fees 4,600 11,914 4,730 8,910 9,090 9,2703770 Developer Reimbursements 316 1,632 340 0 0 03780 State Reimbursement (Traffic Signals) 5,404 10,796 5,620 9,500 9,690 9,8803790 Demolition Reimbursements 2,631 1,450 3,540 3,600 3,400 3,400
Total Charges for Services 2,343,738 2,376,087 2,445,620 2,505,065 2,687,890 2,824,420
3810 Interest Income 2,053 17,338 1,120 39,970 30,000 20,0003820 Rental Income (Cell Tower) 25,502 41,827 21,910 50,680 52,200 113,7703830 Donations 16,204 27,823 16,430 28,790 29,370 29,9503838 Shuttle Bus Repairs 5,095 3,576 4,540 2,070 2,110 2,1503840 Reimbursements 1,556 36,252 0 0 0 03841 Reimbursements - Police - ILEAS 20,538 17,468 21,290 18,750 19,130 19,5103842 Reimbursements - Fire Salaries 614 1,740 0 0 0 03843 Reimbursements - Street Salaries 500 313 0 0 0 03845 Reimbursements - Unit 10 diesel 386 177 0 0 0 03847 Reimb - School Resource Officer 224,928 135,068 164,760 139,500 142,290 145,1403849 Reimb - Health Insurance (4,068) 707 0 0 0 03850 Off duty reimbursement - Police 39,140 40,612 54,000 47,120 48,060 49,0203851 Off duty reimbursement - Fire 193 4,986 5,090 5,090 5,190 5,2903880 Recovery of Bad Debt 0 60 0 0 0 03890 Miscellaneous 79,062 47,282 10,200 52,220 41,500 41,5003891 Scrap - Street Garage 4,780 1,526 4,980 1,500 1,530 1,5603893 Evidence Released 0 2,228 0 0 0 0
Total Miscellaneous Revenue 416,484 378,982 304,320 385,690 371,380 427,890
3920 Proceeds-Fixed Asset Sales 1 7,200 0 1,000 1,000 1,0003990 Interfund Transfer 733,798 852,705 749,090 940,150 1,049,190 1,070,170
Total Other Sources of Funds 733,799 859,905 749,090 941,150 1,050,190 1,071,170
Total Revenues 19,105,729 20,050,052 20,133,960 20,627,105 21,358,270 21,930,310
34

01 General Fund Expenditures 10-00 City Council
2015 2016 2017 2017 2018 2019Actual Actual Budget Projected Budget Budget
4220 Part Time Salaries 15,616 15,600 15,600 15,600 15,600 15,600Total Salaries 15,616 15,600 15,600 15,600 15,600 15,600
4510 Vision Insurance 18,890 16,525 20,000 19,700 20,000 20,4004540 Workers Compensation 149,628 143,257 180,000 150,000 150,000 153,0004610 FICA 968 967 970 970 970 9704630 Medicare 227 292 230 230 230 230
Total Benefits 169,712 161,041 201,200 170,900 171,200 174,600
5310 Accounting Service 26,018 57,694 28,000 57,000 57,600 58,7505330 Legal Service 140,247 170,287 140,000 195,000 198,900 202,8805490 Other Professional Services 11,873 6,261 10,000 10,200 10,200 10,4005520 Telephone 819 659 700 790 790 8105530 Publishing 4,257 13,872 5,000 5,150 5,250 5,3605540 Printing 157 34 0 0 0 05610 Dues 11,149 11,584 13,000 11,360 11,590 11,8205620 Travel, Lodging and Meals 1,242 1,311 2,000 2,300 2,300 2,3505630 Training 0 310 500 1,300 1,300 1,3305650 Publications 508 5,605 1,500 5,600 5,600 5,7105910 Liability Insurance 196,482 197,590 227,100 238,790 250,730 263,2705930 Rentals 0 18 0 0 0 05990 Rebates 1,258,856 1,256,217 1,267,520 1,346,260 1,373,190 1,400,650
Total Contractual Services 1,651,609 1,721,442 1,695,320 1,873,750 1,917,450 1,963,330
6510 Office Supplies 8 8 100 100 100 1006520 Operating Supplies 626 658 500 500 500 510
Total Commodities 634 666 600 600 600 610
9520 Bad Debts 16,728 3,689 0 0 0 09980 Contingencies 0 0 100,000 0 0 0
Total Other Uses of Funds 16,728 3,689 100,000 0 0 0
Total Expenditures 1,854,299 1,902,438 2,012,720 2,060,850 2,104,850 2,154,140
35
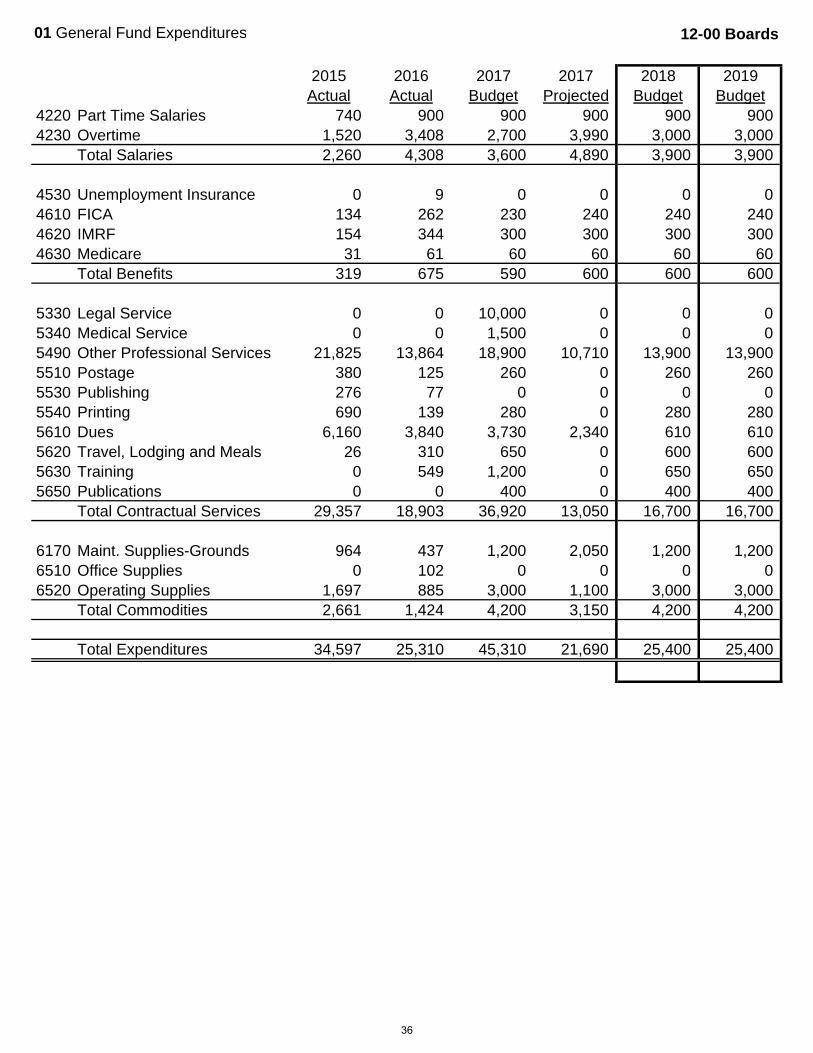
01 General Fund Expenditures 12-00 Boards
2015 2016 2017 2017 2018 2019Actual Actual Budget Projected Budget Budget
4220 Part Time Salaries 740 900 900 900 900 9004230 Overtime 1,520 3,408 2,700 3,990 3,000 3,000
Total Salaries 2,260 4,308 3,600 4,890 3,900 3,900
4530 Unemployment Insurance 0 9 0 0 0 04610 FICA 134 262 230 240 240 2404620 IMRF 154 344 300 300 300 3004630 Medicare 31 61 60 60 60 60
Total Benefits 319 675 590 600 600 600
5330 Legal Service 0 0 10,000 0 0 05340 Medical Service 0 0 1,500 0 0 05490 Other Professional Services 21,825 13,864 18,900 10,710 13,900 13,9005510 Postage 380 125 260 0 260 2605530 Publishing 276 77 0 0 0 05540 Printing 690 139 280 0 280 2805610 Dues 6,160 3,840 3,730 2,340 610 6105620 Travel, Lodging and Meals 26 310 650 0 600 6005630 Training 0 549 1,200 0 650 6505650 Publications 0 0 400 0 400 400
Total Contractual Services 29,357 18,903 36,920 13,050 16,700 16,700
6170 Maint. Supplies-Grounds 964 437 1,200 2,050 1,200 1,2006510 Office Supplies 0 102 0 0 0 06520 Operating Supplies 1,697 885 3,000 1,100 3,000 3,000
Total Commodities 2,661 1,424 4,200 3,150 4,200 4,200
Total Expenditures 34,597 25,310 45,310 21,690 25,400 25,400
36
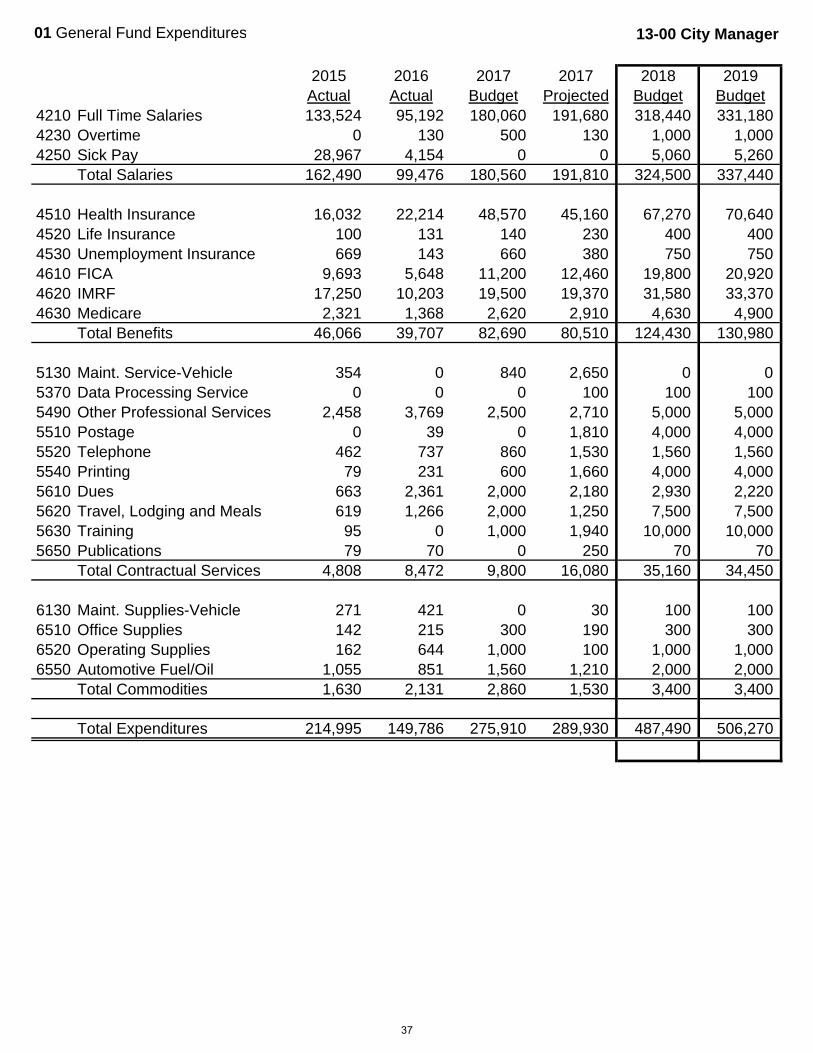
01 General Fund Expenditures 13-00 City Manager
2015 2016 2017 2017 2018 2019Actual Actual Budget Projected Budget Budget
4210 Full Time Salaries 133,524 95,192 180,060 191,680 318,440 331,1804230 Overtime 0 130 500 130 1,000 1,0004250 Sick Pay 28,967 4,154 0 0 5,060 5,260
Total Salaries 162,490 99,476 180,560 191,810 324,500 337,440
4510 Health Insurance 16,032 22,214 48,570 45,160 67,270 70,6404520 Life Insurance 100 131 140 230 400 4004530 Unemployment Insurance 669 143 660 380 750 7504610 FICA 9,693 5,648 11,200 12,460 19,800 20,9204620 IMRF 17,250 10,203 19,500 19,370 31,580 33,3704630 Medicare 2,321 1,368 2,620 2,910 4,630 4,900
Total Benefits 46,066 39,707 82,690 80,510 124,430 130,980
5130 Maint. Service-Vehicle 354 0 840 2,650 0 05370 Data Processing Service 0 0 0 100 100 1005490 Other Professional Services 2,458 3,769 2,500 2,710 5,000 5,0005510 Postage 0 39 0 1,810 4,000 4,0005520 Telephone 462 737 860 1,530 1,560 1,5605540 Printing 79 231 600 1,660 4,000 4,0005610 Dues 663 2,361 2,000 2,180 2,930 2,2205620 Travel, Lodging and Meals 619 1,266 2,000 1,250 7,500 7,5005630 Training 95 0 1,000 1,940 10,000 10,0005650 Publications 79 70 0 250 70 70
Total Contractual Services 4,808 8,472 9,800 16,080 35,160 34,450
6130 Maint. Supplies-Vehicle 271 421 0 30 100 1006510 Office Supplies 142 215 300 190 300 3006520 Operating Supplies 162 644 1,000 100 1,000 1,0006550 Automotive Fuel/Oil 1,055 851 1,560 1,210 2,000 2,000
Total Commodities 1,630 2,131 2,860 1,530 3,400 3,400
Total Expenditures 214,995 149,786 275,910 289,930 487,490 506,270
37
01 General Fund Expenditures 14-00 Operations
2015 2016 2017 2017 2018 2019Actual Actual Budget Projected Budget Budget
4210 Full Time Salaries 60,296 61,810 63,670 83,970 70,000 72,8004220 Part Time Salaries 17,651 0 0 0 0 04230 Overtime 5,227 9,924 0 5,370 0 04250 Sick Pay 2,118 2,161 2,210 2,210 2,420 2,520
Total Salaries 85,292 73,895 65,880 91,550 72,420 75,320
4510 Health Insurance 11,550 15,174 16,580 16,520 18,110 19,0204520 Life Insurance 71 71 70 110 80 804530 Unemployment Insurance 653 324 330 230 190 1904610 FICA 5,223 4,428 4,080 6,200 4,490 4,6704620 IMRF 7,191 7,398 7,120 21,240 7,160 7,4504630 Medicare 1,221 1,036 960 1,450 1,050 1,090
Total Benefits 25,909 28,429 29,140 45,750 31,080 32,500
5110 Maint. Service-Building 4,870 21,995 5,000 6,670 0 05120 Maint. Service-Equipment 7,108 6,136 5,000 6,230 0 05130 Maint. Service-Vehicle 910 450 0 2,360 0 05170 Maint. Service-Office Equip. 2,651 2,419 3,000 3,000 3,000 3,0005180 Maint. Service-Grounds 600 0 0 0 0 05360 Janitorial Service 35,587 34,768 30,000 32,970 0 05370 Data Processing Service 1,800 1,800 2,000 1,800 2,000 2,0805490 Other Professional Services 5 1,025 2,500 300 19,200 9,2005510 Postage 13,505 12,540 17,500 12,050 17,500 17,5005520 Telephone 9,521 9,625 16,000 10,840 10,840 10,8405540 Printing 1,659 1,073 2,500 1,000 1,000 1,0005610 Dues 210 365 350 350 350 3505620 Travel, Lodging and Meals 1,150 1,533 1,000 1,330 1,500 1,5005630 Training 890 184 500 660 1,000 1,0005710 Utilities 17,316 19,917 21,000 30,570 31,180 31,8105930 Rentals 4,150 1,777 5,300 2,040 1,650 1,650
Total Contractual Services 101,933 115,607 111,650 112,170 89,220 79,930
6110 Maint. Supplies-Building 142 1,901 800 1,130 0 06130 Maint. Supplies-Vehicle 86 0 0 160 0 06170 Maint. Supplies-Grounds 0 1,131 0 140 0 06510 Office Supplies 2,025 1,859 1,500 2,350 2,350 2,3506520 Operating Supplies 3,923 3,899 5,000 5,000 5,000 5,0006540 Janitorial Supplies 0 381 0 1,740 0 06550 Automotive Fuel/Oil 0 18 0 90 0 0
Total Commodities 6,175 9,190 7,300 10,610 7,350 7,350
8300 Equipment 0 0 1,000 0 5,000 5,000Total Capital Outlay 0 0 1,000 0 5,000 5,000
Total Expenditures 219,310 227,120 214,970 260,080 205,070 200,100
38

01 General Fund Expenditures 15-00 Human Resources
2015 2016 2017 2017 2018 2019Actual Actual Budget Projected Budget Budget
4210 Full Time Salaries 34,917 65,650 66,300 67,630 71,710 74,5804220 Part Time Salaries 0 1,503 0 5,810 15,600 16,220
Total Salaries 34,917 67,153 66,300 73,440 87,310 90,800
4510 Health Insurance 8,532 15,165 24,280 18,310 18,120 19,0204520 Life Insurance 47 71 70 70 70 704530 Unemployment Insurance 394 369 330 280 380 3804610 FICA 2,095 4,076 4,110 4,900 5,410 5,6304620 IMRF 3,649 6,654 7,160 7,160 7,090 7,3804630 Medicare 490 953 960 1,150 1,270 1,320
Total Benefits 15,208 27,288 36,910 31,870 32,340 33,800
5330 Legal Service 28,164 227,480 100,000 226,890 150,000 150,0005340 Medical Service 7,373 8,284 3,000 3,900 4,000 4,0005370 Data Processing Service 0 1,045 1,200 1,200 1,200 1,2005490 Other Professional Services 13,382 17,760 15,000 15,000 15,000 15,0005510 Postage 0 12 0 0 0 05520 Telephone 756 609 700 700 700 7005530 Publishing 6,025 1,105 550 100 100 1005540 Printing 0 374 500 300 0 05610 Dues 1,961 1,973 1,330 2,040 2,000 2,0005620 Travel, Lodging and Meals 3,309 319 2,500 500 2,500 2,5005630 Training 0 2,822 2,000 500 2,000 2,0005650 Publications 235 57 1,000 200 200 2005660 Employee Development 4,008 287 4,000 2,000 4,000 4,0005930 Rentals 0 220 0 400 1,000 1,000
Total Contractual Services 65,213 262,345 131,780 253,730 182,700 182,700
6510 Office Supplies 0 990 500 800 1,000 1,0006520 Operating Supplies 243 2,198 1,530 3,100 3,000 3,000
Total Commodities 243 3,188 2,030 3,900 4,000 4,000
8300 Equipment 1,240 0 0 0 0 0Total Capital Outlay 1,240 0 0 0 0 0
TOTAL EXPENDITURES 116,820 359,974 237,020 362,940 306,350 311,300
39
01 General Fund Expenditures 16-00 Information Technology
2015 2016 2017 2017 2018 2019Actual Actual Budget Projected Budget Budget
4210 Full Time Salaries 125,114 128,015 131,870 131,870 209,030 217,4004220 Part Time Salaries 1,007 8,259 0 1,780 12,000 12,4804230 Overtime 3,616 3,324 1,000 3,550 2,000 2,0004250 Sick Pay 0 0 0 0 2,560 2,660
Total Salaries 129,737 139,599 132,870 137,200 225,590 234,540
4510 Health Insurance 43,796 44,551 48,570 48,580 79,850 83,8404520 Life Insurance 141 141 140 140 220 2204530 Unemployment Insurance 687 872 660 410 740 7504610 FICA 7,476 8,085 8,240 8,960 13,990 14,5404620 IMRF 12,913 12,647 14,360 14,060 21,120 21,9604630 Medicare 1,748 1,891 1,930 2,090 3,270 3,4004710 Uniforms 0 56 0 0 0 0
Total Benefits 66,761 68,243 73,900 74,240 119,190 124,710
5120 Maint. Service-Equipment 500 818 0 100 100 1005130 Maint. Service-Vehicle 0 505 0 80 0 05370 Data Processing Service 12,420 19,209 16,500 63,830 65,110 66,4105490 Other Professional Services 48,300 37,720 79,500 22,550 23,000 23,4605510 Postage 0 131 0 40 0 05520 Telephone 1,603 1,390 700 1,830 2,100 2,1005530 Publishing 0 0 130 0 0 05540 Printing 331 0 0 550 0 05610 Dues 0 0 0 0 500 5005620 Travel, Lodging and Meals 40 0 2,000 100 1,000 1,0005630 Training 60 4 500 0 1,000 1,000
Total Contractual Services 63,253 59,776 99,330 89,080 92,810 94,570
6130 Maint. Supplies-Vehicle 0 37 0 0 0 06510 Office Supplies 140 351 200 230 250 2506520 Operating Supplies 10,700 16,866 1,500 14,000 14,000 14,0006550 Automotive Fuel/Oil 130 440 0 650 650 650
Total Commodities 10,970 17,694 1,700 14,880 14,900 14,900
8300 Equipment 9,700 5,593 10,000 2,400 10,000 10,000Total Capital Outlay 9,700 5,593 10,000 2,400 10,000 10,000
Total Expenditures 280,421 290,905 317,800 317,800 462,490 478,720
40
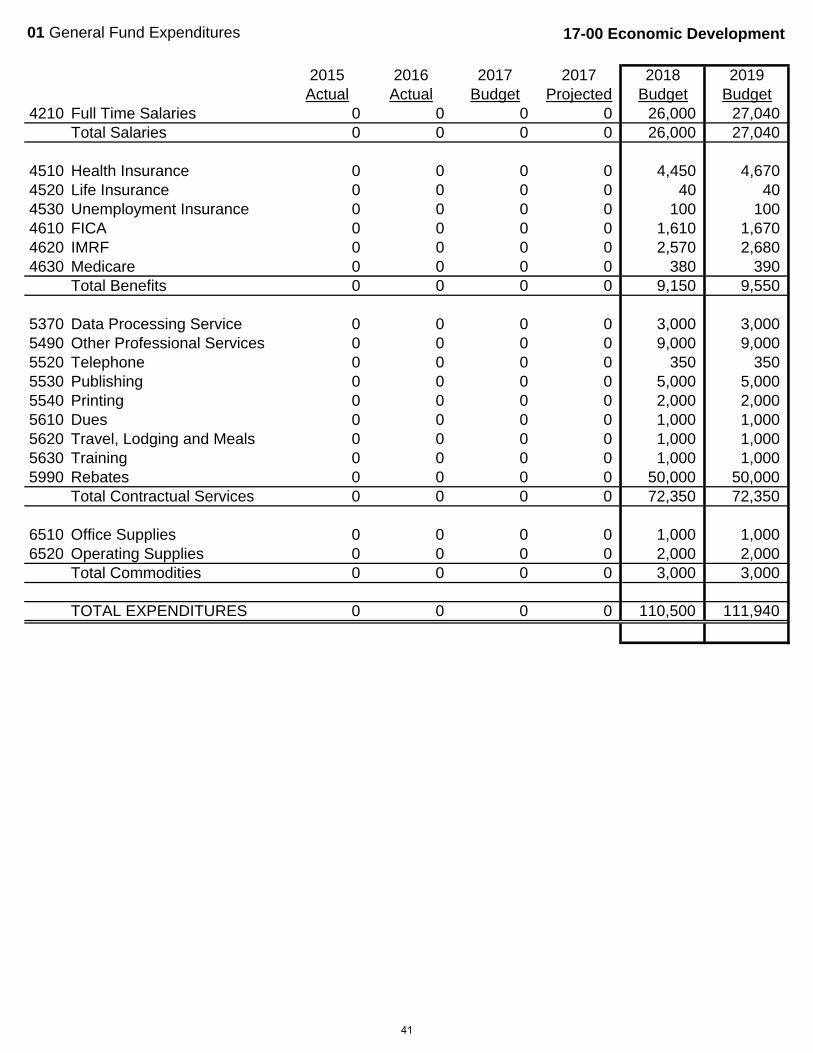
01 General Fund Expenditures 17-00 Economic Development
2015 2016 2017 2017 2018 2019Actual Actual Budget Projected Budget Budget
4210 Full Time Salaries 0 0 0 0 26,000 27,040Total Salaries 0 0 0 0 26,000 27,040
4510 Health Insurance 0 0 0 0 4,450 4,6704520 Life Insurance 0 0 0 0 40 404530 Unemployment Insurance 0 0 0 0 100 1004610 FICA 0 0 0 0 1,610 1,6704620 IMRF 0 0 0 0 2,570 2,6804630 Medicare 0 0 0 0 380 390
Total Benefits 0 0 0 0 9,150 9,550
5370 Data Processing Service 0 0 0 0 3,000 3,0005490 Other Professional Services 0 0 0 0 9,000 9,0005520 Telephone 0 0 0 0 350 3505530 Publishing 0 0 0 0 5,000 5,0005540 Printing 0 0 0 0 2,000 2,0005610 Dues 0 0 0 0 1,000 1,0005620 Travel, Lodging and Meals 0 0 0 0 1,000 1,0005630 Training 0 0 0 0 1,000 1,0005990 Rebates 0 0 0 0 50,000 50,000
Total Contractual Services 0 0 0 0 72,350 72,350
6510 Office Supplies 0 0 0 0 1,000 1,0006520 Operating Supplies 0 0 0 0 2,000 2,000
Total Commodities 0 0 0 0 3,000 3,000
TOTAL EXPENDITURES 0 0 0 0 110,500 111,940
41
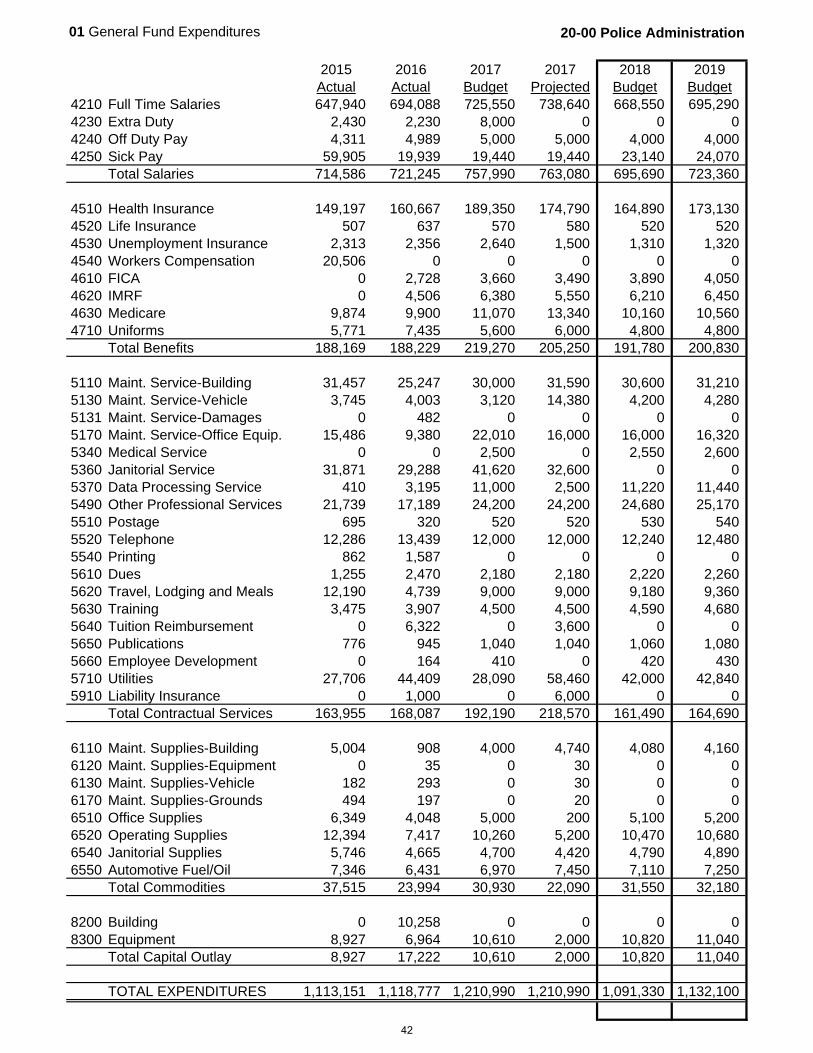
01 General Fund Expenditures 20-00 Police Administration
2015 2016 2017 2017 2018 2019Actual Actual Budget Projected Budget Budget
4210 Full Time Salaries 647,940 694,088 725,550 738,640 668,550 695,2904230 Extra Duty 2,430 2,230 8,000 0 0 04240 Off Duty Pay 4,311 4,989 5,000 5,000 4,000 4,0004250 Sick Pay 59,905 19,939 19,440 19,440 23,140 24,070
Total Salaries 714,586 721,245 757,990 763,080 695,690 723,360
4510 Health Insurance 149,197 160,667 189,350 174,790 164,890 173,1304520 Life Insurance 507 637 570 580 520 5204530 Unemployment Insurance 2,313 2,356 2,640 1,500 1,310 1,3204540 Workers Compensation 20,506 0 0 0 0 04610 FICA 0 2,728 3,660 3,490 3,890 4,0504620 IMRF 0 4,506 6,380 5,550 6,210 6,4504630 Medicare 9,874 9,900 11,070 13,340 10,160 10,5604710 Uniforms 5,771 7,435 5,600 6,000 4,800 4,800
Total Benefits 188,169 188,229 219,270 205,250 191,780 200,830
5110 Maint. Service-Building 31,457 25,247 30,000 31,590 30,600 31,2105130 Maint. Service-Vehicle 3,745 4,003 3,120 14,380 4,200 4,2805131 Maint. Service-Damages 0 482 0 0 0 05170 Maint. Service-Office Equip. 15,486 9,380 22,010 16,000 16,000 16,3205340 Medical Service 0 0 2,500 0 2,550 2,6005360 Janitorial Service 31,871 29,288 41,620 32,600 0 05370 Data Processing Service 410 3,195 11,000 2,500 11,220 11,4405490 Other Professional Services 21,739 17,189 24,200 24,200 24,680 25,1705510 Postage 695 320 520 520 530 5405520 Telephone 12,286 13,439 12,000 12,000 12,240 12,4805540 Printing 862 1,587 0 0 0 05610 Dues 1,255 2,470 2,180 2,180 2,220 2,2605620 Travel, Lodging and Meals 12,190 4,739 9,000 9,000 9,180 9,3605630 Training 3,475 3,907 4,500 4,500 4,590 4,6805640 Tuition Reimbursement 0 6,322 0 3,600 0 05650 Publications 776 945 1,040 1,040 1,060 1,0805660 Employee Development 0 164 410 0 420 4305710 Utilities 27,706 44,409 28,090 58,460 42,000 42,8405910 Liability Insurance 0 1,000 0 6,000 0 0
Total Contractual Services 163,955 168,087 192,190 218,570 161,490 164,690
6110 Maint. Supplies-Building 5,004 908 4,000 4,740 4,080 4,1606120 Maint. Supplies-Equipment 0 35 0 30 0 06130 Maint. Supplies-Vehicle 182 293 0 30 0 06170 Maint. Supplies-Grounds 494 197 0 20 0 06510 Office Supplies 6,349 4,048 5,000 200 5,100 5,2006520 Operating Supplies 12,394 7,417 10,260 5,200 10,470 10,6806540 Janitorial Supplies 5,746 4,665 4,700 4,420 4,790 4,8906550 Automotive Fuel/Oil 7,346 6,431 6,970 7,450 7,110 7,250
Total Commodities 37,515 23,994 30,930 22,090 31,550 32,180
8200 Building 0 10,258 0 0 0 08300 Equipment 8,927 6,964 10,610 2,000 10,820 11,040
Total Capital Outlay 8,927 17,222 10,610 2,000 10,820 11,040
TOTAL EXPENDITURES 1,113,151 1,118,777 1,210,990 1,210,990 1,091,330 1,132,100
42

01 General Fund Expenditures 20-10 Police Operations
2015 2016 2017 2017 2018 2019Actual Actual Budget Projected Budget Budget
4210 Full Time Salaries 2,501,009 2,616,322 2,792,320 2,688,010 2,872,400 2,930,7904230 Overtime 288,752 295,546 263,580 260,210 271,010 276,4304240 Off Duty Pay 34,721 34,490 39,640 57,230 40,750 41,5704250 Sick Pay 94,598 46,027 51,680 51,680 51,680 52,7104280 Holiday 92,477 109,819 116,270 113,290 119,550 121,930
Total Salaries 3,011,557 3,102,204 3,263,490 3,170,420 3,355,390 3,423,430
4510 Health Insurance 602,158 633,152 732,040 695,390 788,270 827,3204520 Life Insurance 948 910 1,030 1,020 1,070 1,0704530 Unemployment Insurance 12,801 12,554 12,560 6,910 7,140 7,1404540 Workers Compensation 59,252 49,255 100,000 149,000 100,000 100,0004610 FICA 2,416 2,318 0 2,690 2,900 3,0204620 Pension 4,205 3,870 0 4,290 4,630 4,8204630 Medicare 41,776 42,983 47,070 47,970 48,360 49,3204710 Uniforms 48,376 34,918 26,600 26,600 26,600 26,600
Total Benefits 771,932 779,959 919,300 933,870 978,970 1,019,290
5120 Maint. Service-Equipment 10,770 8,704 15,000 15,000 15,300 15,6105130 Maint. Service-Vehicle 41,610 24,119 58,650 58,650 0 05370 Data Processing Service 0 0 0 390 0 05490 Other Professional Services 15,135 13,790 12,000 12,100 12,240 12,4805520 Telephone 24,584 29,057 47,760 25,310 48,720 49,6905540 Printing 1,908 1,970 1,580 2,920 2,100 2,1405610 Dues 660 775 1,920 1,340 1,960 2,0005620 Travel, Lodging and Meals 3,748 10,101 11,240 11,240 11,460 11,6905630 Training 12,446 10,240 19,310 12,640 19,700 20,0905640 Tuition Reimbursement 9,178 10,746 38,200 24,700 38,960 39,7405650 Publications 656 7,186 0 0 600 6005910 Liability Insurance 3,000 1,000 0 11,000 0 05930 Rentals 0 260 0 0 0 0
Total Contractual Services 123,695 117,946 205,660 175,290 151,040 154,040
6120 Maint. Supplies-Equipment 1,493 3,084 320 530 330 3406130 Maint. Supplies-Vehicle 7,039 7,277 6,260 6,260 6,390 6,5206510 Office Supplies 1,276 1,833 0 2,700 0 06520 Operating Supplies 31,368 46,660 52,540 52,540 53,590 54,6606550 Automotive Fuel/Oil 58,976 54,203 136,970 51,700 100,000 102,000
Total Commodities 100,152 113,058 196,090 113,730 160,310 163,520
8300 Equipment 2,210 37,580 30,000 30,000 30,600 31,210Total Capital Outlay 2,210 37,580 30,000 30,000 30,600 31,210
TOTAL EXPENDITURES 4,009,546 4,150,746 4,614,540 4,423,310 4,676,310 4,791,490
43

01 General Fund Expenditures 20-20 Police Support and Records
2015 2016 2017 2017 2018 2019Actual Actual Budget Projected Budget Budget
4210 Full Time Salaries 755,811 751,013 824,110 794,560 878,450 896,0204220 Part Time Salaries 166,772 130,726 244,890 124,520 202,970 211,0904230 Overtime 29,388 39,878 33,300 42,060 38,010 38,7704250 Sick Pay 4,733 22,108 8,980 4,150 7,550 7,7004260 Shift Differential 2,929 2,676 3,250 2,480 3,250 3,2504280 Holiday 27,289 29,947 29,370 30,640 37,170 37,910
Total Salaries 986,921 976,348 1,143,900 998,410 1,167,400 1,194,740
4510 Health Insurance 181,330 173,066 202,940 201,220 237,660 249,5504520 Life Insurance 430 417 430 470 480 4804530 Unemployment Insurance 8,760 8,321 8,920 5,010 4,890 4,8904610 FICA 57,856 57,348 70,920 65,730 72,380 74,0704620 IMRF 82,767 82,281 97,090 90,920 95,380 97,2804630 Medicare 13,531 13,412 16,590 15,340 16,930 17,3204710 Uniforms 483 3,323 2,500 3,260 2,500 2,5504720 Degree 0 0 0 4,500 0 0
Total Benefits 345,156 338,167 399,390 386,450 430,220 446,140
5130 Maint. Service-Vehicle 3,987 320 4,000 1,970 0 05170 Maint. Service-Office Equip. 4,979 3,653 4,000 4,000 4,080 4,1605370 Data Processing Service 245 98 0 0 0 05490 Other Professional Services 105 213 200 210 200 2005520 Telephone 1,015 1,003 0 1,150 0 05540 Printing 351 949 2,000 1,300 2,040 2,0805620 Travel, Lodging and Meals 1,392 882 1,560 920 1,590 1,6205630 Training 3,120 1,999 3,330 2,200 3,400 3,4705640 Tuition Reimbursement 12,986 1,050 16,160 14,500 16,480 16,8105910 Liability Insurance 0 0 0 1,000 0 0
Total Contractual Services 28,181 10,167 31,250 27,250 27,790 28,340
6120 Maint. Supplies-Equipment 0 0 0 50 0 06130 Maint. Supplies-Vehicle 0 7 0 0 0 06510 Office Supplies 2,261 1,594 8,000 780 8,160 8,3206520 Operating Supplies 2,767 5,715 3,830 2,750 3,910 3,9906550 Automotive Fuel/Oil 1,006 443 1,000 330 1,020 1,040
Total Commodities 6,034 7,759 12,830 3,910 13,090 13,350
8300 Equipment 0 0 0 0 0 0Total Capital Outlay 0 0 0 0 0 0
TOTAL EXPENDITURES 1,366,294 1,332,441 1,587,370 1,416,020 1,638,500 1,682,570
44
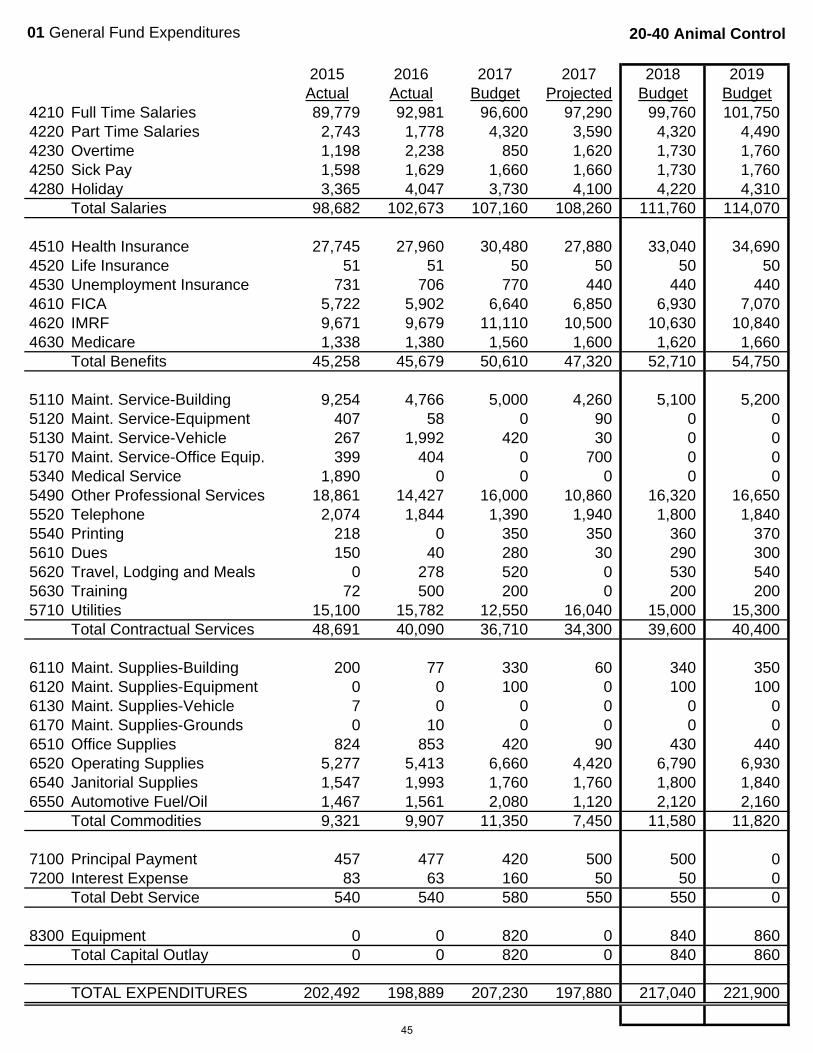
01 General Fund Expenditures 20-40 Animal Control
2015 2016 2017 2017 2018 2019Actual Actual Budget Projected Budget Budget
4210 Full Time Salaries 89,779 92,981 96,600 97,290 99,760 101,7504220 Part Time Salaries 2,743 1,778 4,320 3,590 4,320 4,4904230 Overtime 1,198 2,238 850 1,620 1,730 1,7604250 Sick Pay 1,598 1,629 1,660 1,660 1,730 1,7604280 Holiday 3,365 4,047 3,730 4,100 4,220 4,310
Total Salaries 98,682 102,673 107,160 108,260 111,760 114,070
4510 Health Insurance 27,745 27,960 30,480 27,880 33,040 34,6904520 Life Insurance 51 51 50 50 50 504530 Unemployment Insurance 731 706 770 440 440 4404610 FICA 5,722 5,902 6,640 6,850 6,930 7,0704620 IMRF 9,671 9,679 11,110 10,500 10,630 10,8404630 Medicare 1,338 1,380 1,560 1,600 1,620 1,660
Total Benefits 45,258 45,679 50,610 47,320 52,710 54,750
5110 Maint. Service-Building 9,254 4,766 5,000 4,260 5,100 5,2005120 Maint. Service-Equipment 407 58 0 90 0 05130 Maint. Service-Vehicle 267 1,992 420 30 0 05170 Maint. Service-Office Equip. 399 404 0 700 0 05340 Medical Service 1,890 0 0 0 0 05490 Other Professional Services 18,861 14,427 16,000 10,860 16,320 16,6505520 Telephone 2,074 1,844 1,390 1,940 1,800 1,8405540 Printing 218 0 350 350 360 3705610 Dues 150 40 280 30 290 3005620 Travel, Lodging and Meals 0 278 520 0 530 5405630 Training 72 500 200 0 200 2005710 Utilities 15,100 15,782 12,550 16,040 15,000 15,300
Total Contractual Services 48,691 40,090 36,710 34,300 39,600 40,400
6110 Maint. Supplies-Building 200 77 330 60 340 3506120 Maint. Supplies-Equipment 0 0 100 0 100 1006130 Maint. Supplies-Vehicle 7 0 0 0 0 06170 Maint. Supplies-Grounds 0 10 0 0 0 06510 Office Supplies 824 853 420 90 430 4406520 Operating Supplies 5,277 5,413 6,660 4,420 6,790 6,9306540 Janitorial Supplies 1,547 1,993 1,760 1,760 1,800 1,8406550 Automotive Fuel/Oil 1,467 1,561 2,080 1,120 2,120 2,160
Total Commodities 9,321 9,907 11,350 7,450 11,580 11,820
7100 Principal Payment 457 477 420 500 500 07200 Interest Expense 83 63 160 50 50 0
Total Debt Service 540 540 580 550 550 0
8300 Equipment 0 0 820 0 840 860Total Capital Outlay 0 0 820 0 840 860
TOTAL EXPENDITURES 202,492 198,889 207,230 197,880 217,040 221,900
45

01 General Fund Expenditures 30-00 Fire Administration
2015 2016 2017 2017 2018 2019Actual Actual Budget Projected Budget Budget
4210 Full Time Salaries 235,651 148,280 244,920 211,930 327,090 340,1804220 Part Time Salaries 27,232 12,289 40,610 8,440 0 04230 Overtime 0 0 0 1,300 1,000 1,0004250 Sick Pay 2,959 22,962 3,120 3,120 2,210 2,300
Total Salaries 265,843 183,531 288,650 224,790 330,300 343,480
4510 Health Insurance 46,201 27,034 47,550 38,770 63,010 66,1604520 Life Insurance 180 102 180 140 220 2204530 Unemployment Insurance 1,322 1,255 1,320 600 750 7504540 Workers Compensation 1,565 0 0 0 0 04610 FICA 4,786 3,907 5,790 7,830 8,450 8,7904620 IMRF 5,386 2,278 5,690 7,990 6,640 6,9004630 Medicare 3,743 2,573 4,200 3,300 4,800 5,0004710 Uniforms 437 370 1,000 4,700 1,000 1,000
Total Benefits 63,620 37,519 65,730 63,330 84,870 88,820
5130 Maint. Service-Vehicle 469 916 1,500 2,500 0 05170 Maint. Service-Office Equip. 637 1,037 3,000 1,300 3,060 3,1205370 Data Processing Service 1,340 7,478 3,000 1,480 3,060 3,1205490 Other Professional Services 660 196 2,000 4,320 2,040 2,0805510 Postage 39 16 100 50 100 1005520 Telephone 16,978 16,067 22,730 18,770 23,180 23,6405540 Printing 86 226 1,000 140 1,020 1,0405610 Dues 2,012 1,848 2,500 1,660 2,500 2,6005620 Travel, Lodging and Meals 2,268 3,920 3,000 1,330 5,000 5,0005630 Training 2,937 2,399 2,000 3,750 5,000 5,0005640 Tuition Reimbursement 9,339 3,234 5,000 3,870 5,100 5,2005650 Publications 2,006 3,714 1,000 1,000 1,000 1,0405710 Utilities 15,045 17,177 18,000 21,270 18,360 18,730
Total Contractual Services 53,817 58,227 64,830 61,440 69,420 70,670
6130 Maint. Supplies-Vehicle 20 0 300 20 300 3006510 Office Supplies 1,113 418 3,000 1,320 3,060 3,1206520 Operating Supplies 3,014 587 3,000 1,490 3,060 3,1206550 Automotive Fuel/Oil 2,045 1,777 5,370 1,580 5,480 5,590
Total Commodities 6,192 2,782 11,670 4,410 11,900 12,130
8300 Equipment 0 0 0 1,870 0 0Total Capital Outlay 0 0 0 1,870 0 0
TOTAL EXPENDITURES 389,472 282,059 430,880 355,840 496,490 515,100
46
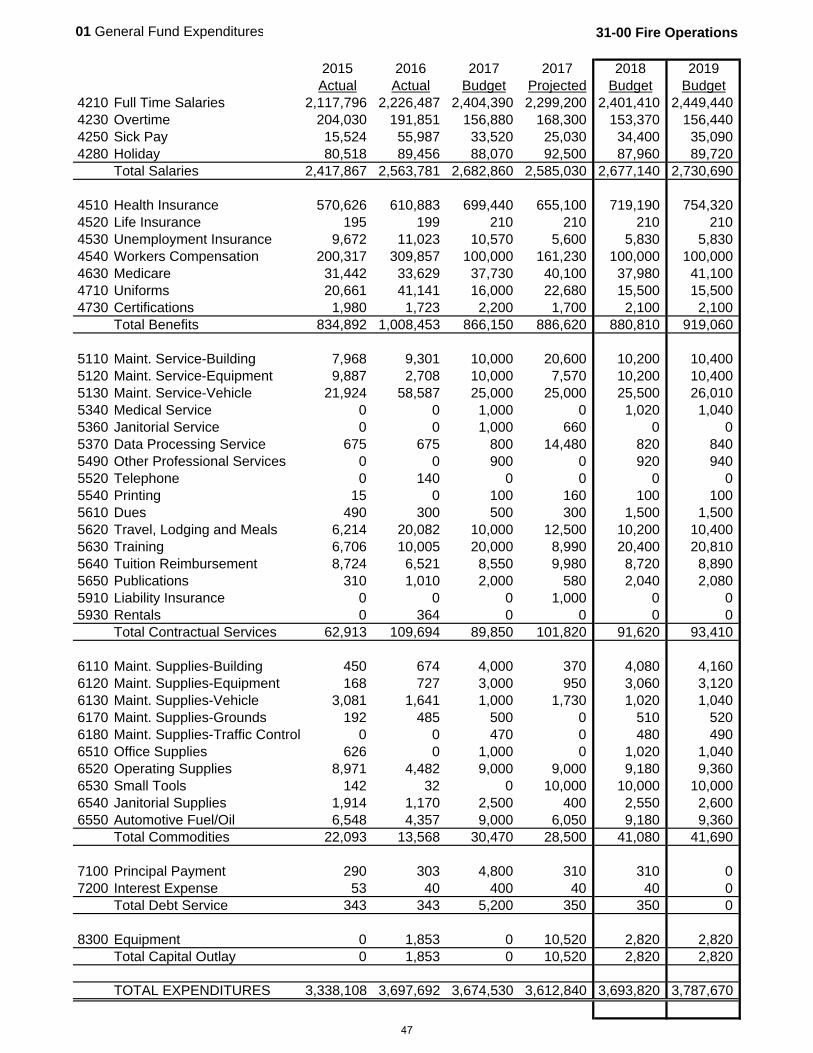
01 General Fund Expenditures 31-00 Fire Operations
2015 2016 2017 2017 2018 2019Actual Actual Budget Projected Budget Budget
4210 Full Time Salaries 2,117,796 2,226,487 2,404,390 2,299,200 2,401,410 2,449,4404230 Overtime 204,030 191,851 156,880 168,300 153,370 156,4404250 Sick Pay 15,524 55,987 33,520 25,030 34,400 35,0904280 Holiday 80,518 89,456 88,070 92,500 87,960 89,720
Total Salaries 2,417,867 2,563,781 2,682,860 2,585,030 2,677,140 2,730,690
4510 Health Insurance 570,626 610,883 699,440 655,100 719,190 754,3204520 Life Insurance 195 199 210 210 210 2104530 Unemployment Insurance 9,672 11,023 10,570 5,600 5,830 5,8304540 Workers Compensation 200,317 309,857 100,000 161,230 100,000 100,0004630 Medicare 31,442 33,629 37,730 40,100 37,980 41,1004710 Uniforms 20,661 41,141 16,000 22,680 15,500 15,5004730 Certifications 1,980 1,723 2,200 1,700 2,100 2,100
Total Benefits 834,892 1,008,453 866,150 886,620 880,810 919,060
5110 Maint. Service-Building 7,968 9,301 10,000 20,600 10,200 10,4005120 Maint. Service-Equipment 9,887 2,708 10,000 7,570 10,200 10,4005130 Maint. Service-Vehicle 21,924 58,587 25,000 25,000 25,500 26,0105340 Medical Service 0 0 1,000 0 1,020 1,0405360 Janitorial Service 0 0 1,000 660 0 05370 Data Processing Service 675 675 800 14,480 820 8405490 Other Professional Services 0 0 900 0 920 9405520 Telephone 0 140 0 0 0 05540 Printing 15 0 100 160 100 1005610 Dues 490 300 500 300 1,500 1,5005620 Travel, Lodging and Meals 6,214 20,082 10,000 12,500 10,200 10,4005630 Training 6,706 10,005 20,000 8,990 20,400 20,8105640 Tuition Reimbursement 8,724 6,521 8,550 9,980 8,720 8,8905650 Publications 310 1,010 2,000 580 2,040 2,0805910 Liability Insurance 0 0 0 1,000 0 05930 Rentals 0 364 0 0 0 0
Total Contractual Services 62,913 109,694 89,850 101,820 91,620 93,410
6110 Maint. Supplies-Building 450 674 4,000 370 4,080 4,1606120 Maint. Supplies-Equipment 168 727 3,000 950 3,060 3,1206130 Maint. Supplies-Vehicle 3,081 1,641 1,000 1,730 1,020 1,0406170 Maint. Supplies-Grounds 192 485 500 0 510 5206180 Maint. Supplies-Traffic Control 0 0 470 0 480 4906510 Office Supplies 626 0 1,000 0 1,020 1,0406520 Operating Supplies 8,971 4,482 9,000 9,000 9,180 9,3606530 Small Tools 142 32 0 10,000 10,000 10,0006540 Janitorial Supplies 1,914 1,170 2,500 400 2,550 2,6006550 Automotive Fuel/Oil 6,548 4,357 9,000 6,050 9,180 9,360
Total Commodities 22,093 13,568 30,470 28,500 41,080 41,690
7100 Principal Payment 290 303 4,800 310 310 07200 Interest Expense 53 40 400 40 40 0
Total Debt Service 343 343 5,200 350 350 0
8300 Equipment 0 1,853 0 10,520 2,820 2,820Total Capital Outlay 0 1,853 0 10,520 2,820 2,820
TOTAL EXPENDITURES 3,338,108 3,697,692 3,674,530 3,612,840 3,693,820 3,787,670
47

01 General Fund Expenditures 31-10 Emergency Medical Services
2015 2016 2017 2017 2018 2019Actual Actual Budget Projected Budget Budget
4230 Overtime 144,437 149,539 156,880 156,880 160,000 163,2004240 Off Duty Pay 2,981 5,705 5,000 5,000 4,950 5,050
Total Salaries 147,418 155,245 161,880 161,880 164,950 168,250
4530 Unemployment Insurance 441 467 0 230 0 04630 Medicare 1,890 2,029 2,350 2,530 2,320 2,4104730 Certifications 0 0 0 40 0 0
Total Benefits 2,332 2,496 2,350 2,800 2,320 2,410
5120 Maint. Service-Equipment 6,315 9,233 5,000 5,000 5,100 5,2005130 Maint. Service-Vehicle 18,823 26,882 23,000 13,850 23,460 23,9305370 Data Processing Service 120 8,980 0 4,490 4,500 4,5005490 Other Professional Services 41,517 37,879 44,000 40,430 44,880 45,7805540 Printing 0 0 0 200 0 05620 Travel, Lodging and Meals 0 0 0 100 0 05630 Training 1,145 3,180 4,000 3,680 4,080 4,1605650 Publications 0 0 100 0 100 1005710 Utilities 149 451 0 80 0 05910 Liability Insurance 1,000 0 0 0 0 0
Total Contractual Services 69,069 86,605 76,100 67,830 82,120 83,670
6120 Maint. Supplies-Equipment 2,080 2,529 1,000 1,930 1,020 1,0406130 Maint. Supplies-Vehicle 460 1,755 1,000 1,000 1,020 1,0406510 Office Supplies 0 0 0 10 0 06520 Operating Supplies 24,826 26,188 25,000 31,560 25,500 26,0106550 Automotive Fuel/Oil 10,919 7,736 17,000 9,280 17,340 17,690
Total Commodities 38,286 38,208 44,000 43,780 44,880 45,780
7100 Principal Payment 0 0 3,400 0 0 07200 Interest Expense 0 0 250 0 0 0
Total Debt Service 0 0 3,650 0 0 0
8300 Equipment 927 2,618 0 4,600 0 0Total Capital Outlay 927 2,618 0 4,600 0 0
TOTAL EXPENDITURES 258,031 285,172 287,980 280,890 294,270 300,110
48

01 General Fund Expenditures 34-00 Emergency Management
2015 2016 2017 2017 2018 2019Actual Actual Budget Projected Budget Budget
4540 Workers Compensation 0 0 0 3,100 0 04710 Uniforms 2,428 1,354 2,660 2,140 1,750 1,750
Total Benefits 2,428 1,354 2,660 5,240 1,750 1,750
5120 Maint. Service-Equipment 5,491 10,098 4,220 4,220 4,300 4,3905130 Maint. Service-Vehicle 1,162 234 1,070 330 0 05490 Other Professional Services 0 0 0 0 0 05520 Telephone 447 541 630 820 640 6505620 Travel, Lodging and Meals 0 0 0 0 0 05710 Utilities 1,248 1,507 1,480 1,820 1,510 1,5405930 Rentals 9,540 9,540 9,920 9,540 5,000 0
Total Contractual Services 17,889 21,919 17,320 16,730 11,450 6,580
6110 Maint. Supplies-Building 0 141 170 0 0 06120 Maint. Supplies-Equipment 848 399 530 200 540 5506130 Maint. Supplies-Vehicle 0 172 150 210 150 1506520 Operating Supplies 591 440 3,960 890 4,040 4,1206550 Automotive Fuel/Oil 327 226 720 250 730 740
Total Commodities 1,766 1,378 5,530 1,550 5,460 5,560
TOTAL EXPENDITURES 22,083 24,652 25,510 23,520 18,660 13,890
49
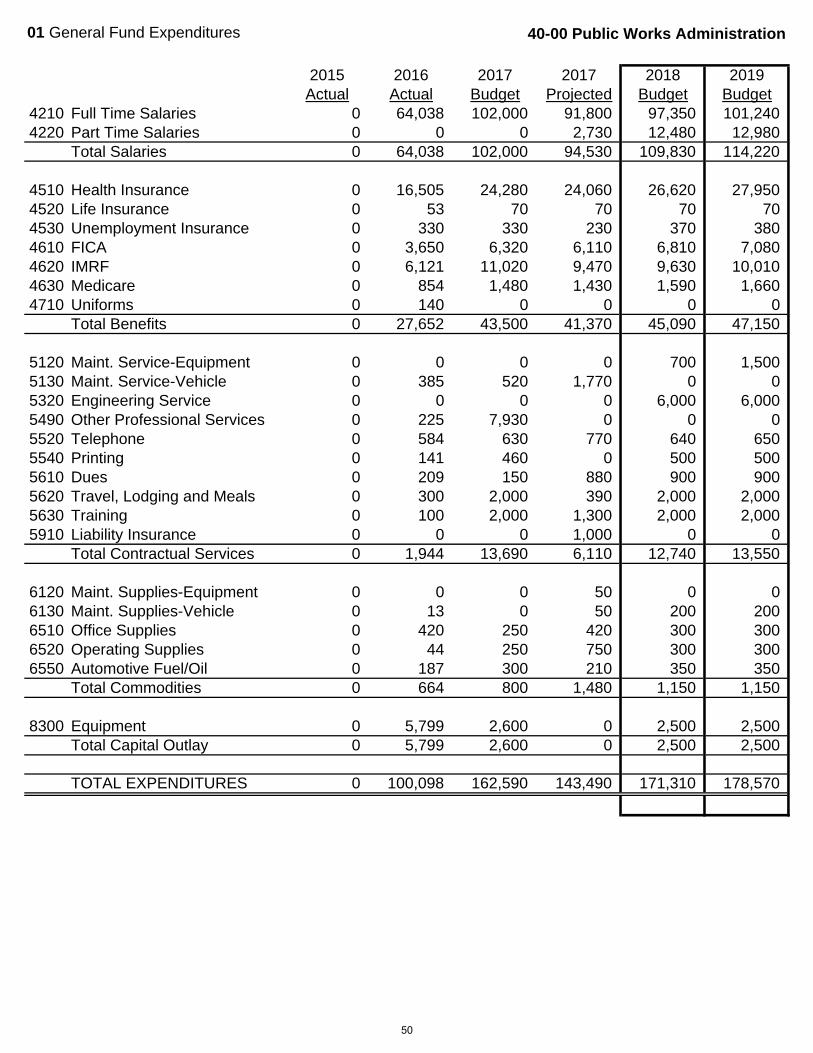
01 General Fund Expenditures 40-00 Public Works Administration
2015 2016 2017 2017 2018 2019Actual Actual Budget Projected Budget Budget
4210 Full Time Salaries 0 64,038 102,000 91,800 97,350 101,2404220 Part Time Salaries 0 0 0 2,730 12,480 12,980
Total Salaries 0 64,038 102,000 94,530 109,830 114,220
4510 Health Insurance 0 16,505 24,280 24,060 26,620 27,9504520 Life Insurance 0 53 70 70 70 704530 Unemployment Insurance 0 330 330 230 370 3804610 FICA 0 3,650 6,320 6,110 6,810 7,0804620 IMRF 0 6,121 11,020 9,470 9,630 10,0104630 Medicare 0 854 1,480 1,430 1,590 1,6604710 Uniforms 0 140 0 0 0 0
Total Benefits 0 27,652 43,500 41,370 45,090 47,150
5120 Maint. Service-Equipment 0 0 0 0 700 1,5005130 Maint. Service-Vehicle 0 385 520 1,770 0 05320 Engineering Service 0 0 0 0 6,000 6,0005490 Other Professional Services 0 225 7,930 0 0 05520 Telephone 0 584 630 770 640 6505540 Printing 0 141 460 0 500 5005610 Dues 0 209 150 880 900 9005620 Travel, Lodging and Meals 0 300 2,000 390 2,000 2,0005630 Training 0 100 2,000 1,300 2,000 2,0005910 Liability Insurance 0 0 0 1,000 0 0
Total Contractual Services 0 1,944 13,690 6,110 12,740 13,550
6120 Maint. Supplies-Equipment 0 0 0 50 0 06130 Maint. Supplies-Vehicle 0 13 0 50 200 2006510 Office Supplies 0 420 250 420 300 3006520 Operating Supplies 0 44 250 750 300 3006550 Automotive Fuel/Oil 0 187 300 210 350 350
Total Commodities 0 664 800 1,480 1,150 1,150
8300 Equipment 0 5,799 2,600 0 2,500 2,500Total Capital Outlay 0 5,799 2,600 0 2,500 2,500
TOTAL EXPENDITURES 0 100,098 162,590 143,490 171,310 178,570
50
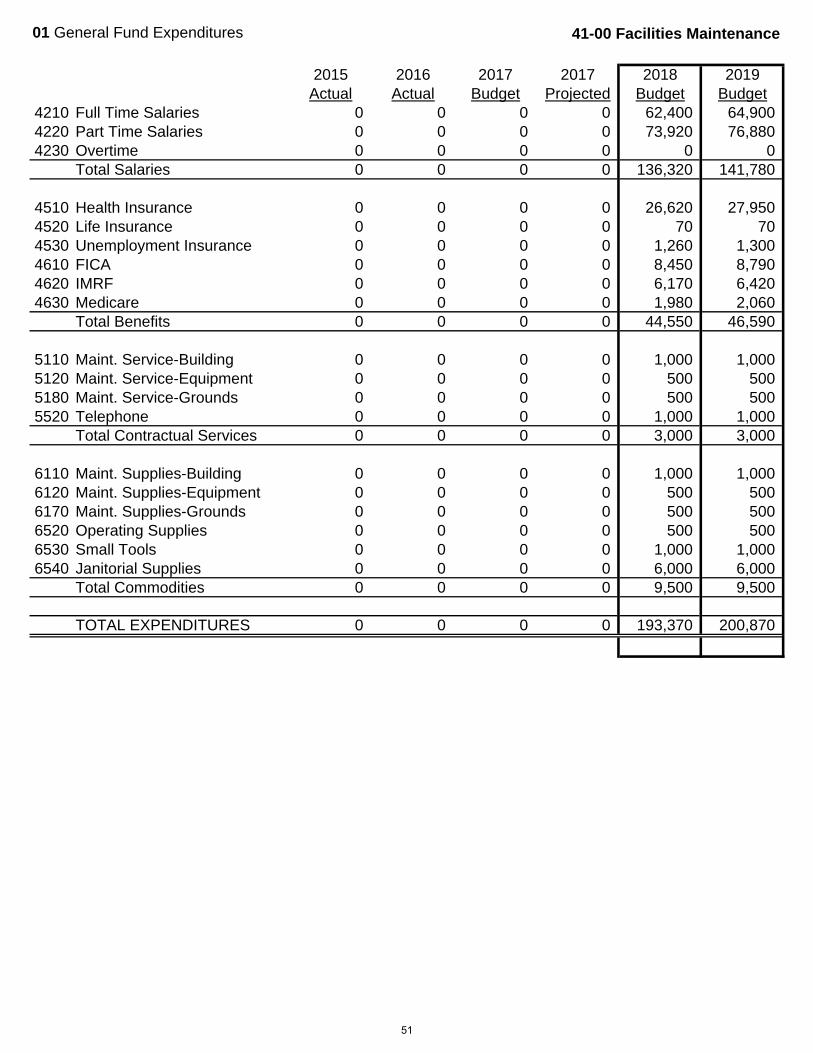
01 General Fund Expenditures 41-00 Facilities Maintenance
2015 2016 2017 2017 2018 2019Actual Actual Budget Projected Budget Budget
4210 Full Time Salaries 0 0 0 0 62,400 64,9004220 Part Time Salaries 0 0 0 0 73,920 76,8804230 Overtime 0 0 0 0 0 0
Total Salaries 0 0 0 0 136,320 141,780
4510 Health Insurance 0 0 0 0 26,620 27,9504520 Life Insurance 0 0 0 0 70 704530 Unemployment Insurance 0 0 0 0 1,260 1,3004610 FICA 0 0 0 0 8,450 8,7904620 IMRF 0 0 0 0 6,170 6,4204630 Medicare 0 0 0 0 1,980 2,060
Total Benefits 0 0 0 0 44,550 46,590
5110 Maint. Service-Building 0 0 0 0 1,000 1,0005120 Maint. Service-Equipment 0 0 0 0 500 5005180 Maint. Service-Grounds 0 0 0 0 500 5005520 Telephone 0 0 0 0 1,000 1,000
Total Contractual Services 0 0 0 0 3,000 3,000
6110 Maint. Supplies-Building 0 0 0 0 1,000 1,0006120 Maint. Supplies-Equipment 0 0 0 0 500 5006170 Maint. Supplies-Grounds 0 0 0 0 500 5006520 Operating Supplies 0 0 0 0 500 5006530 Small Tools 0 0 0 0 1,000 1,0006540 Janitorial Supplies 0 0 0 0 6,000 6,000
Total Commodities 0 0 0 0 9,500 9,500
TOTAL EXPENDITURES 0 0 0 0 193,370 200,870
51
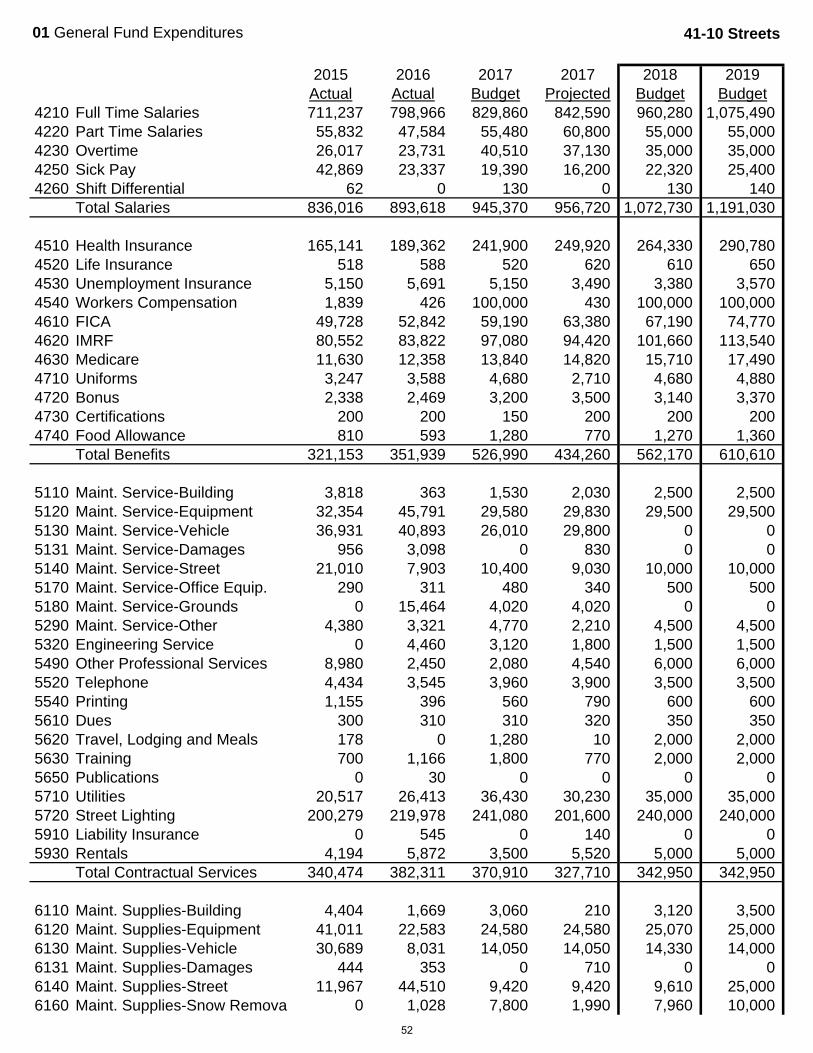
01 General Fund Expenditures 41-10 Streets
2015 2016 2017 2017 2018 2019Actual Actual Budget Projected Budget Budget
4210 Full Time Salaries 711,237 798,966 829,860 842,590 960,280 1,075,4904220 Part Time Salaries 55,832 47,584 55,480 60,800 55,000 55,0004230 Overtime 26,017 23,731 40,510 37,130 35,000 35,0004250 Sick Pay 42,869 23,337 19,390 16,200 22,320 25,4004260 Shift Differential 62 0 130 0 130 140
Total Salaries 836,016 893,618 945,370 956,720 1,072,730 1,191,030
4510 Health Insurance 165,141 189,362 241,900 249,920 264,330 290,7804520 Life Insurance 518 588 520 620 610 6504530 Unemployment Insurance 5,150 5,691 5,150 3,490 3,380 3,5704540 Workers Compensation 1,839 426 100,000 430 100,000 100,0004610 FICA 49,728 52,842 59,190 63,380 67,190 74,7704620 IMRF 80,552 83,822 97,080 94,420 101,660 113,5404630 Medicare 11,630 12,358 13,840 14,820 15,710 17,4904710 Uniforms 3,247 3,588 4,680 2,710 4,680 4,8804720 Bonus 2,338 2,469 3,200 3,500 3,140 3,3704730 Certifications 200 200 150 200 200 2004740 Food Allowance 810 593 1,280 770 1,270 1,360
Total Benefits 321,153 351,939 526,990 434,260 562,170 610,610
5110 Maint. Service-Building 3,818 363 1,530 2,030 2,500 2,5005120 Maint. Service-Equipment 32,354 45,791 29,580 29,830 29,500 29,5005130 Maint. Service-Vehicle 36,931 40,893 26,010 29,800 0 05131 Maint. Service-Damages 956 3,098 0 830 0 05140 Maint. Service-Street 21,010 7,903 10,400 9,030 10,000 10,0005170 Maint. Service-Office Equip. 290 311 480 340 500 5005180 Maint. Service-Grounds 0 15,464 4,020 4,020 0 05290 Maint. Service-Other 4,380 3,321 4,770 2,210 4,500 4,5005320 Engineering Service 0 4,460 3,120 1,800 1,500 1,5005490 Other Professional Services 8,980 2,450 2,080 4,540 6,000 6,0005520 Telephone 4,434 3,545 3,960 3,900 3,500 3,5005540 Printing 1,155 396 560 790 600 6005610 Dues 300 310 310 320 350 3505620 Travel, Lodging and Meals 178 0 1,280 10 2,000 2,0005630 Training 700 1,166 1,800 770 2,000 2,0005650 Publications 0 30 0 0 0 05710 Utilities 20,517 26,413 36,430 30,230 35,000 35,0005720 Street Lighting 200,279 219,978 241,080 201,600 240,000 240,0005910 Liability Insurance 0 545 0 140 0 05930 Rentals 4,194 5,872 3,500 5,520 5,000 5,000
Total Contractual Services 340,474 382,311 370,910 327,710 342,950 342,950
6110 Maint. Supplies-Building 4,404 1,669 3,060 210 3,120 3,5006120 Maint. Supplies-Equipment 41,011 22,583 24,580 24,580 25,070 25,0006130 Maint. Supplies-Vehicle 30,689 8,031 14,050 14,050 14,330 14,0006131 Maint. Supplies-Damages 444 353 0 710 0 06140 Maint. Supplies-Street 11,967 44,510 9,420 9,420 9,610 25,0006160 Maint. Supplies-Snow Removal 0 1,028 7,800 1,990 7,960 10,000
52
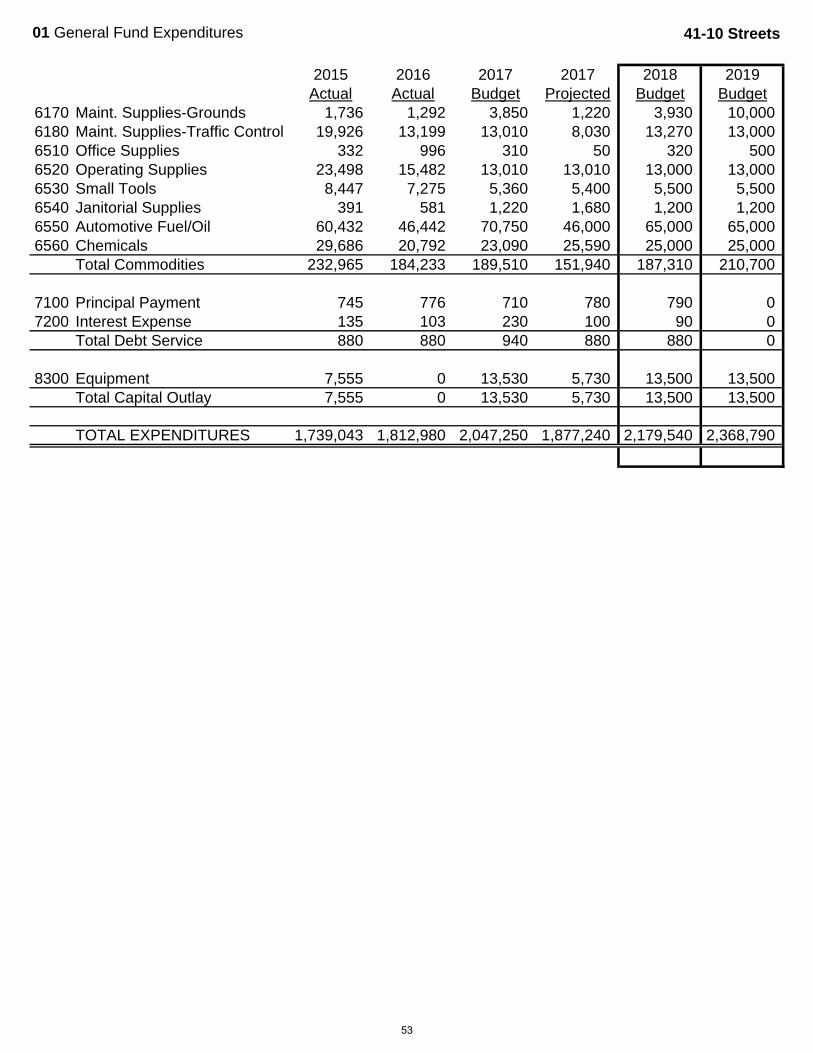
01 General Fund Expenditures 41-10 Streets
2015 2016 2017 2017 2018 2019Actual Actual Budget Projected Budget Budget
6170 Maint. Supplies-Grounds 1,736 1,292 3,850 1,220 3,930 10,0006180 Maint. Supplies-Traffic Control 19,926 13,199 13,010 8,030 13,270 13,0006510 Office Supplies 332 996 310 50 320 5006520 Operating Supplies 23,498 15,482 13,010 13,010 13,000 13,0006530 Small Tools 8,447 7,275 5,360 5,400 5,500 5,5006540 Janitorial Supplies 391 581 1,220 1,680 1,200 1,2006550 Automotive Fuel/Oil 60,432 46,442 70,750 46,000 65,000 65,0006560 Chemicals 29,686 20,792 23,090 25,590 25,000 25,000
Total Commodities 232,965 184,233 189,510 151,940 187,310 210,700
7100 Principal Payment 745 776 710 780 790 07200 Interest Expense 135 103 230 100 90 0
Total Debt Service 880 880 940 880 880 0
8300 Equipment 7,555 0 13,530 5,730 13,500 13,500Total Capital Outlay 7,555 0 13,530 5,730 13,500 13,500
TOTAL EXPENDITURES 1,739,043 1,812,980 2,047,250 1,877,240 2,179,540 2,368,790
53

01 General Fund Expenditures 41-20 Fleet Maintenance
2015 2016 2017 2017 2018 2019Actual Actual Budget Projected Budget Budget
4210 Full Time Salaries 0 0 0 0 65,000 123,3204220 Part Time Salaries 0 0 0 0 12,320 25,6204230 Overtime 0 0 0 0 0 0
Total Salaries 0 0 0 0 77,320 148,940
4510 Health Insurance 0 0 0 0 26,620 55,9004520 Life Insurance 0 0 0 0 70 1504530 Unemployment Insurance 0 0 0 0 370 7504610 FICA 0 0 0 0 4,800 9,2304620 IMRF 0 0 0 0 6,430 12,2004630 Medicare 0 0 0 0 1,120 2,160
Total Benefits 0 0 0 0 39,410 80,390
5120 Maint. Service-Equipment 0 0 0 0 0 05130 Maint. Service-Vehicle 0 0 0 0 5,000 5,0005490 Other Professional Services 0 0 0 0 0 05520 Telephone 0 0 0 0 500 1,0005610 Dues 0 0 0 0 500 5005620 Travel, Lodging and Meals 0 0 0 0 1,000 1,0005630 Training 0 0 0 0 1,000 1,000
Total Contractual Services 0 0 0 0 8,000 8,500
6120 Maint. Supplies-Equipment 0 0 0 0 1,000 1,0006130 Maint. Supplies-Vehicle 0 0 0 0 1,000 1,0006520 Operating Supplies 0 0 0 0 10,000 10,0006530 Small Tools 0 0 0 0 5,000 5,000
Total Commodities 0 0 0 0 17,000 17,000
8300 Equipment 0 0 0 0 10,000 10,000Total Capital Outlay 0 0 0 0 10,000 10,000
TOTAL EXPENDITURES 0 0 0 0 151,730 264,830
54
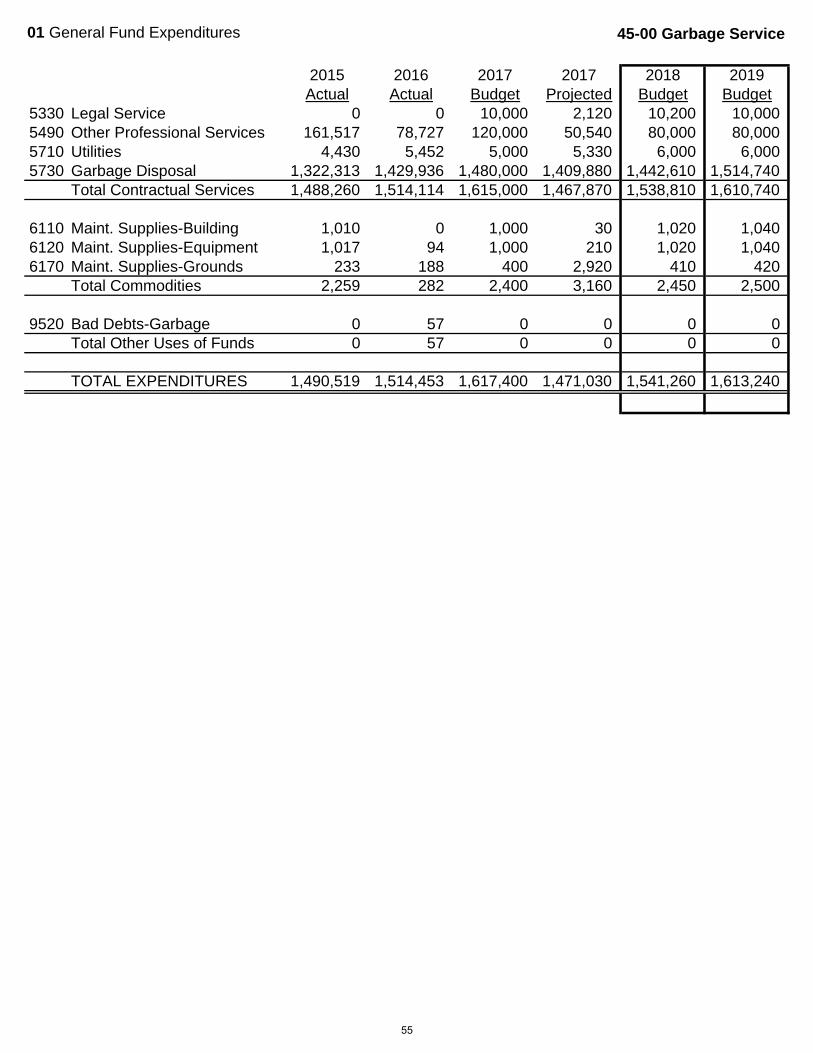
01 General Fund Expenditures 45-00 Garbage Service
2015 2016 2017 2017 2018 2019Actual Actual Budget Projected Budget Budget
5330 Legal Service 0 0 10,000 2,120 10,200 10,0005490 Other Professional Services 161,517 78,727 120,000 50,540 80,000 80,0005710 Utilities 4,430 5,452 5,000 5,330 6,000 6,0005730 Garbage Disposal 1,322,313 1,429,936 1,480,000 1,409,880 1,442,610 1,514,740
Total Contractual Services 1,488,260 1,514,114 1,615,000 1,467,870 1,538,810 1,610,740
6110 Maint. Supplies-Building 1,010 0 1,000 30 1,020 1,0406120 Maint. Supplies-Equipment 1,017 94 1,000 210 1,020 1,0406170 Maint. Supplies-Grounds 233 188 400 2,920 410 420
Total Commodities 2,259 282 2,400 3,160 2,450 2,500
9520 Bad Debts-Garbage 0 57 0 0 0 0Total Other Uses of Funds 0 57 0 0 0 0
TOTAL EXPENDITURES 1,490,519 1,514,453 1,617,400 1,471,030 1,541,260 1,613,240
55
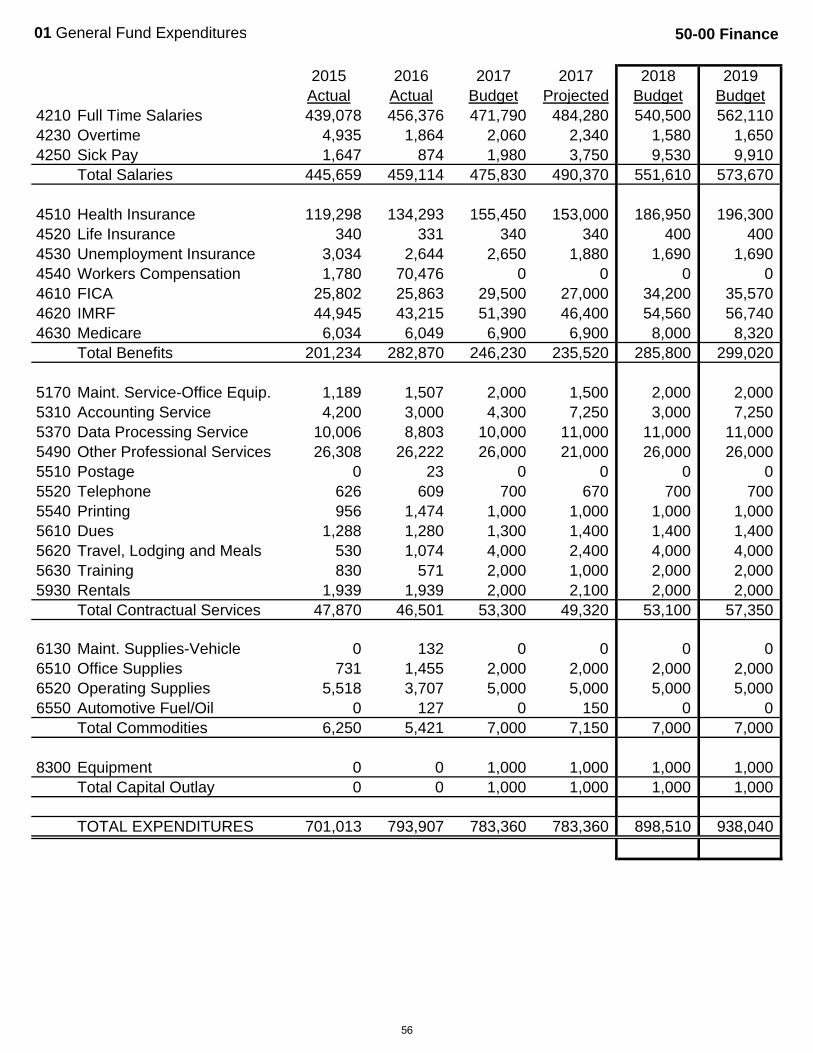
01 General Fund Expenditures 50-00 Finance
2015 2016 2017 2017 2018 2019Actual Actual Budget Projected Budget Budget
4210 Full Time Salaries 439,078 456,376 471,790 484,280 540,500 562,1104230 Overtime 4,935 1,864 2,060 2,340 1,580 1,6504250 Sick Pay 1,647 874 1,980 3,750 9,530 9,910
Total Salaries 445,659 459,114 475,830 490,370 551,610 573,670
4510 Health Insurance 119,298 134,293 155,450 153,000 186,950 196,3004520 Life Insurance 340 331 340 340 400 4004530 Unemployment Insurance 3,034 2,644 2,650 1,880 1,690 1,6904540 Workers Compensation 1,780 70,476 0 0 0 04610 FICA 25,802 25,863 29,500 27,000 34,200 35,5704620 IMRF 44,945 43,215 51,390 46,400 54,560 56,7404630 Medicare 6,034 6,049 6,900 6,900 8,000 8,320
Total Benefits 201,234 282,870 246,230 235,520 285,800 299,020
5170 Maint. Service-Office Equip. 1,189 1,507 2,000 1,500 2,000 2,0005310 Accounting Service 4,200 3,000 4,300 7,250 3,000 7,2505370 Data Processing Service 10,006 8,803 10,000 11,000 11,000 11,0005490 Other Professional Services 26,308 26,222 26,000 21,000 26,000 26,0005510 Postage 0 23 0 0 0 05520 Telephone 626 609 700 670 700 7005540 Printing 956 1,474 1,000 1,000 1,000 1,0005610 Dues 1,288 1,280 1,300 1,400 1,400 1,4005620 Travel, Lodging and Meals 530 1,074 4,000 2,400 4,000 4,0005630 Training 830 571 2,000 1,000 2,000 2,0005930 Rentals 1,939 1,939 2,000 2,100 2,000 2,000
Total Contractual Services 47,870 46,501 53,300 49,320 53,100 57,350
6130 Maint. Supplies-Vehicle 0 132 0 0 0 06510 Office Supplies 731 1,455 2,000 2,000 2,000 2,0006520 Operating Supplies 5,518 3,707 5,000 5,000 5,000 5,0006550 Automotive Fuel/Oil 0 127 0 150 0 0
Total Commodities 6,250 5,421 7,000 7,150 7,000 7,000
8300 Equipment 0 0 1,000 1,000 1,000 1,000Total Capital Outlay 0 0 1,000 1,000 1,000 1,000
TOTAL EXPENDITURES 701,013 793,907 783,360 783,360 898,510 938,040
56

01 General Fund Expenditures 64-00 Community Development
2015 2016 2017 2017 2018 2019Actual Actual Budget Projected Budget Budget
4210 Full Time Salaries 188,508 161,291 266,030 178,360 140,240 145,8504220 Part Time Salaries 4,432 18,453 19,140 10,090 0 04230 Overtime 1,611 2,523 130 2,250 1,000 1,0004250 Sick Pay 4,575 1,891 5,560 0 0 0
Total Salaries 199,126 184,159 290,860 190,700 141,240 146,850
4510 Health Insurance 37,334 27,722 66,620 32,490 36,390 38,2104520 Life Insurance 212 176 280 220 150 1504530 Unemployment Insurance 1,104 1,944 1,650 800 380 3804610 FICA 11,881 11,062 18,030 12,860 8,760 9,1104620 IMRF 20,202 16,714 29,350 19,510 13,970 14,5204630 Medicare 2,779 2,587 4,220 3,010 2,050 2,130
Total Benefits 73,512 60,206 120,150 68,890 61,700 64,500
5130 Maint. Service-Vehicle 438 0 775 1,920 0 05170 Maint. Service-Office Equip. 1,404 1,714 2,040 2,040 2,080 2,1205320 Engineering Service 27,891 4,524 10,000 1,820 10,200 10,4005370 Data Processing Service 0 0 5,000 0 5,100 5,2005490 Other Professional Services 6,942 1,151 15,000 1,460 50,000 50,0005510 Postage 0 0 0 30 0 05520 Telephone 2,149 1,577 2,500 1,330 2,550 2,6005530 Publishing 0 0 500 0 510 5205540 Printing 0 192 500 390 510 5205610 Dues 669 590 1,000 1,000 1,020 1,0405620 Travel, Lodging and Meals 748 788 3,100 1,640 3,160 3,2205630 Training 400 83 2,500 630 2,550 2,6005650 Publications 313 432 500 0 510 5205910 Liability Insurance 0 0 0 1,000 0 05930 Rentals 2,121 2,121 2,040 2,040 2,080 2,120
Total Contractual Services 43,074 13,171 45,455 15,300 80,270 80,860
6130 Maint. Supplies-Vehicle 0 33 0 0 0 06510 Office Supplies 1,895 2,665 2,250 1,860 2,300 2,3506520 Operating Supplies 1,379 117 2,750 950 2,810 2,8706550 Automotive Fuel/Oil 645 362 1,530 290 1,560 1,590
Total Commodities 3,919 3,176 6,530 3,100 6,670 6,810
8300 Equipment 0 1,911 0 0 0 0Total Capital Outlay 0 1,911 0 0 0 0
TOTAL EXPENDITURES 319,631 262,623 462,995 277,990 289,880 299,020
57
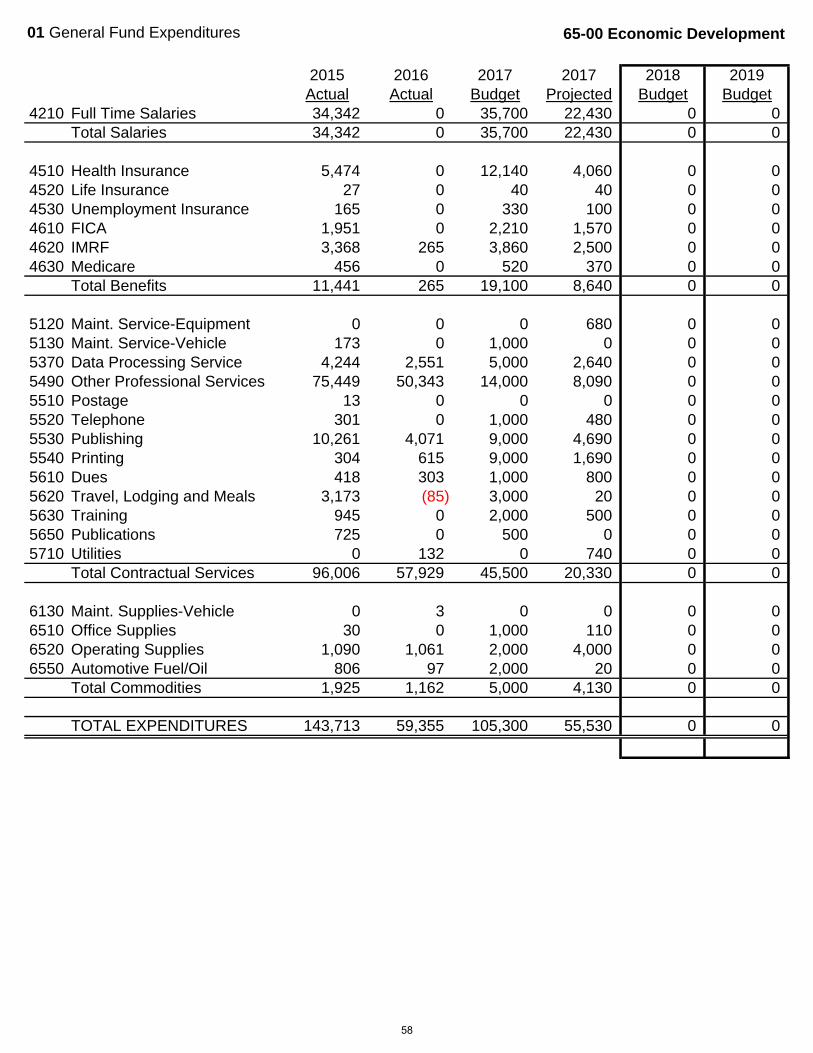
01 General Fund Expenditures 65-00 Economic Development
2015 2016 2017 2017 2018 2019Actual Actual Budget Projected Budget Budget
4210 Full Time Salaries 34,342 0 35,700 22,430 0 0Total Salaries 34,342 0 35,700 22,430 0 0
4510 Health Insurance 5,474 0 12,140 4,060 0 04520 Life Insurance 27 0 40 40 0 04530 Unemployment Insurance 165 0 330 100 0 04610 FICA 1,951 0 2,210 1,570 0 04620 IMRF 3,368 265 3,860 2,500 0 04630 Medicare 456 0 520 370 0 0
Total Benefits 11,441 265 19,100 8,640 0 0
5120 Maint. Service-Equipment 0 0 0 680 0 05130 Maint. Service-Vehicle 173 0 1,000 0 0 05370 Data Processing Service 4,244 2,551 5,000 2,640 0 05490 Other Professional Services 75,449 50,343 14,000 8,090 0 05510 Postage 13 0 0 0 0 05520 Telephone 301 0 1,000 480 0 05530 Publishing 10,261 4,071 9,000 4,690 0 05540 Printing 304 615 9,000 1,690 0 05610 Dues 418 303 1,000 800 0 05620 Travel, Lodging and Meals 3,173 (85) 3,000 20 0 05630 Training 945 0 2,000 500 0 05650 Publications 725 0 500 0 0 05710 Utilities 0 132 0 740 0 0
Total Contractual Services 96,006 57,929 45,500 20,330 0 0
6130 Maint. Supplies-Vehicle 0 3 0 0 0 06510 Office Supplies 30 0 1,000 110 0 06520 Operating Supplies 1,090 1,061 2,000 4,000 0 06550 Automotive Fuel/Oil 806 97 2,000 20 0 0
Total Commodities 1,925 1,162 5,000 4,130 0 0
TOTAL EXPENDITURES 143,713 59,355 105,300 55,530 0 0
58
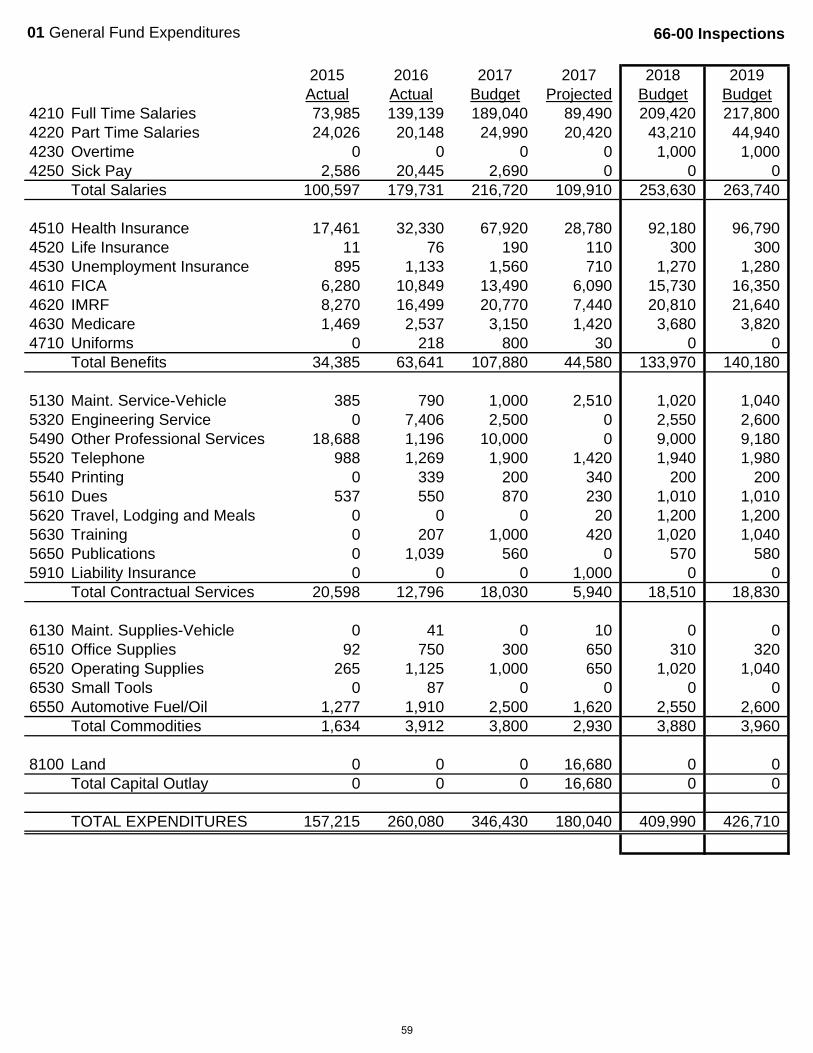
01 General Fund Expenditures 66-00 Inspections
2015 2016 2017 2017 2018 2019Actual Actual Budget Projected Budget Budget
4210 Full Time Salaries 73,985 139,139 189,040 89,490 209,420 217,8004220 Part Time Salaries 24,026 20,148 24,990 20,420 43,210 44,9404230 Overtime 0 0 0 0 1,000 1,0004250 Sick Pay 2,586 20,445 2,690 0 0 0
Total Salaries 100,597 179,731 216,720 109,910 253,630 263,740
4510 Health Insurance 17,461 32,330 67,920 28,780 92,180 96,7904520 Life Insurance 11 76 190 110 300 3004530 Unemployment Insurance 895 1,133 1,560 710 1,270 1,2804610 FICA 6,280 10,849 13,490 6,090 15,730 16,3504620 IMRF 8,270 16,499 20,770 7,440 20,810 21,6404630 Medicare 1,469 2,537 3,150 1,420 3,680 3,8204710 Uniforms 0 218 800 30 0 0
Total Benefits 34,385 63,641 107,880 44,580 133,970 140,180
5130 Maint. Service-Vehicle 385 790 1,000 2,510 1,020 1,0405320 Engineering Service 0 7,406 2,500 0 2,550 2,6005490 Other Professional Services 18,688 1,196 10,000 0 9,000 9,1805520 Telephone 988 1,269 1,900 1,420 1,940 1,9805540 Printing 0 339 200 340 200 2005610 Dues 537 550 870 230 1,010 1,0105620 Travel, Lodging and Meals 0 0 0 20 1,200 1,2005630 Training 0 207 1,000 420 1,020 1,0405650 Publications 0 1,039 560 0 570 5805910 Liability Insurance 0 0 0 1,000 0 0
Total Contractual Services 20,598 12,796 18,030 5,940 18,510 18,830
6130 Maint. Supplies-Vehicle 0 41 0 10 0 06510 Office Supplies 92 750 300 650 310 3206520 Operating Supplies 265 1,125 1,000 650 1,020 1,0406530 Small Tools 0 87 0 0 0 06550 Automotive Fuel/Oil 1,277 1,910 2,500 1,620 2,550 2,600
Total Commodities 1,634 3,912 3,800 2,930 3,880 3,960
8100 Land 0 0 0 16,680 0 0Total Capital Outlay 0 0 0 16,680 0 0
TOTAL EXPENDITURES 157,215 260,080 346,430 180,040 409,990 426,710
59
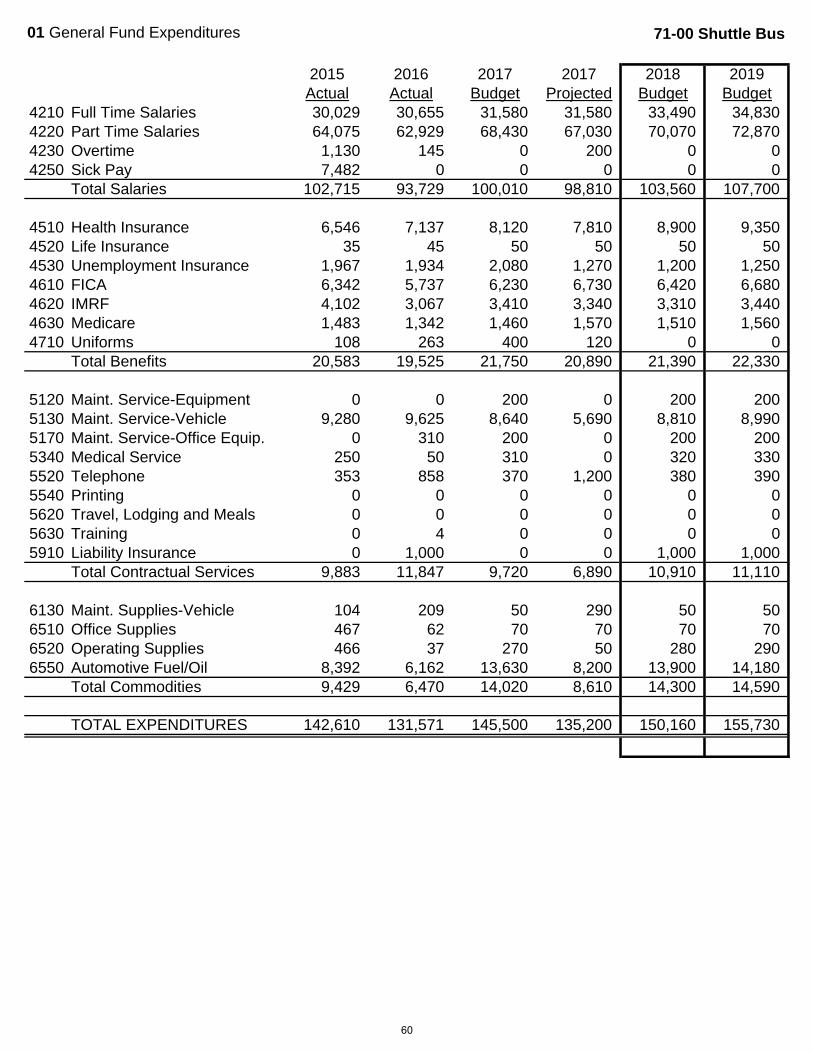
01 General Fund Expenditures 71-00 Shuttle Bus
2015 2016 2017 2017 2018 2019Actual Actual Budget Projected Budget Budget
4210 Full Time Salaries 30,029 30,655 31,580 31,580 33,490 34,8304220 Part Time Salaries 64,075 62,929 68,430 67,030 70,070 72,8704230 Overtime 1,130 145 0 200 0 04250 Sick Pay 7,482 0 0 0 0 0
Total Salaries 102,715 93,729 100,010 98,810 103,560 107,700
4510 Health Insurance 6,546 7,137 8,120 7,810 8,900 9,3504520 Life Insurance 35 45 50 50 50 504530 Unemployment Insurance 1,967 1,934 2,080 1,270 1,200 1,2504610 FICA 6,342 5,737 6,230 6,730 6,420 6,6804620 IMRF 4,102 3,067 3,410 3,340 3,310 3,4404630 Medicare 1,483 1,342 1,460 1,570 1,510 1,5604710 Uniforms 108 263 400 120 0 0
Total Benefits 20,583 19,525 21,750 20,890 21,390 22,330
5120 Maint. Service-Equipment 0 0 200 0 200 2005130 Maint. Service-Vehicle 9,280 9,625 8,640 5,690 8,810 8,9905170 Maint. Service-Office Equip. 0 310 200 0 200 2005340 Medical Service 250 50 310 0 320 3305520 Telephone 353 858 370 1,200 380 3905540 Printing 0 0 0 0 0 05620 Travel, Lodging and Meals 0 0 0 0 0 05630 Training 0 4 0 0 0 05910 Liability Insurance 0 1,000 0 0 1,000 1,000
Total Contractual Services 9,883 11,847 9,720 6,890 10,910 11,110
6130 Maint. Supplies-Vehicle 104 209 50 290 50 506510 Office Supplies 467 62 70 70 70 706520 Operating Supplies 466 37 270 50 280 2906550 Automotive Fuel/Oil 8,392 6,162 13,630 8,200 13,900 14,180
Total Commodities 9,429 6,470 14,020 8,610 14,300 14,590
TOTAL EXPENDITURES 142,610 131,571 145,500 135,200 150,160 155,730
60

01 General Fund Expenditures 81-00 Parks and Recreation
2015 2016 2017 2017 2018 2019Actual Actual Budget Projected Budget Budget
4210 Full Time Salaries 0 0 0 0 194,000 201,7604220 Part Time Salaries 0 0 0 0 66,000 68,640
Total Salaries 0 0 0 0 260,000 270,400
4510 Health Insurance 0 0 0 0 79,850 83,8404520 Life Insurance 0 0 0 0 220 2204530 Unemployment Insurance 0 0 0 0 1,520 1,5604610 FICA 0 0 0 0 16,120 16,7704620 IMRF 0 0 0 0 19,190 19,9604630 Medicare 0 0 0 0 3,770 3,920
Total Benefits 0 0 0 0 120,670 126,270
5130 Maint. Service-Vehicle 0 0 0 0 1,000 1,0005370 Data Processing Service 0 0 0 0 5,000 5,0005490 Other Professional Services 0 0 0 0 14,000 14,0005520 Telephone 0 0 0 0 1,000 1,0005530 Publishing 0 0 0 0 9,000 9,0005540 Printing 0 0 0 0 9,000 9,0005610 Dues 0 0 0 0 1,000 1,0005620 Travel, Lodging and Meals 0 0 0 0 3,000 3,0005630 Training 0 0 0 0 2,000 2,0005650 Publications 0 0 0 0 500 500
Total Contractual Services 0 0 0 0 45,500 45,500
6510 Office Supplies 0 0 0 0 1,000 1,0006520 Operating Supplies 0 0 0 0 2,000 2,0006550 Automotive Fuel/Oil 0 0 0 0 2,000 2,000
Total Commodities 0 0 0 0 5,000 5,000
TOTAL EXPENDITURES 0 0 0 0 431,170 447,170
61
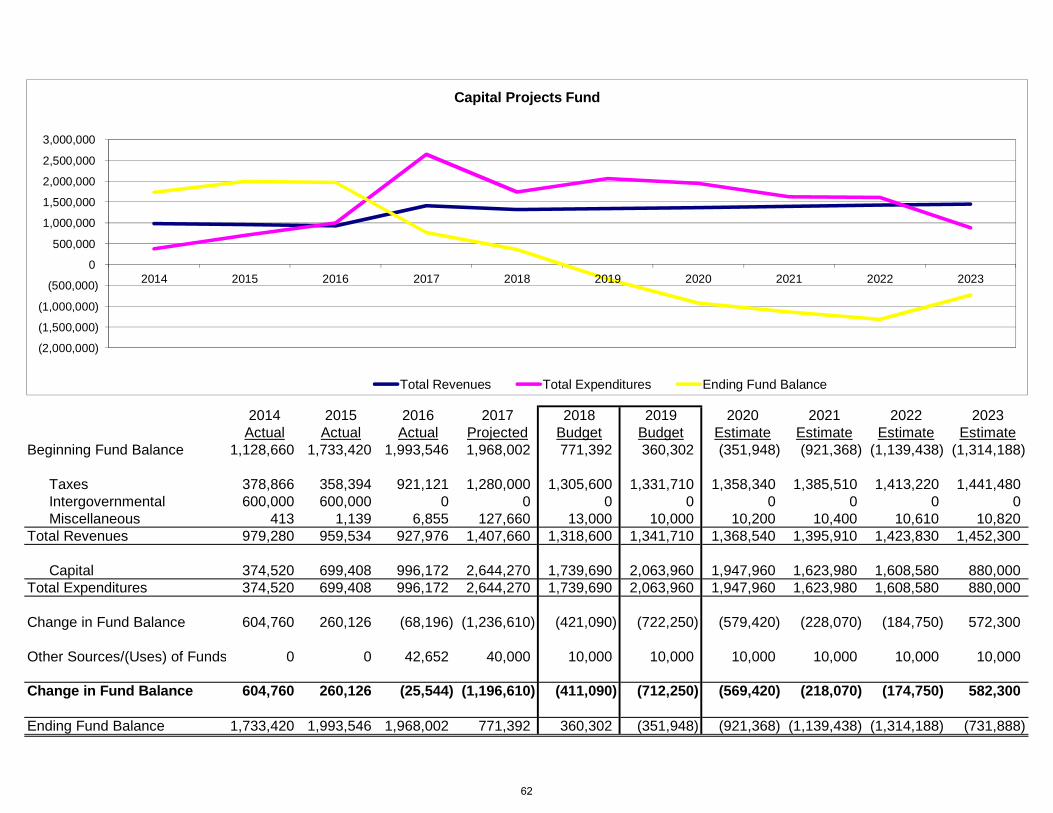
2014 2015 2016 2017 2018 2019 2020 2021 2022 2023Actual Actual Actual Projected Budget Budget Estimate Estimate Estimate Estimate
Beginning Fund Balance 1,128,660 1,733,420 1,993,546 1,968,002 771,392 360,302 (351,948) (921,368) (1,139,438) (1,314,188)
Taxes 378,866 358,394 921,121 1,280,000 1,305,600 1,331,710 1,358,340 1,385,510 1,413,220 1,441,480Intergovernmental 600,000 600,000 0 0 0 0 0 0 0 0Miscellaneous 413 1,139 6,855 127,660 13,000 10,000 10,200 10,400 10,610 10,820
Total Revenues 979,280 959,534 927,976 1,407,660 1,318,600 1,341,710 1,368,540 1,395,910 1,423,830 1,452,300
Capital 374,520 699,408 996,172 2,644,270 1,739,690 2,063,960 1,947,960 1,623,980 1,608,580 880,000Total Expenditures 374,520 699,408 996,172 2,644,270 1,739,690 2,063,960 1,947,960 1,623,980 1,608,580 880,000
Change in Fund Balance 604,760 260,126 (68,196) (1,236,610) (421,090) (722,250) (579,420) (228,070) (184,750) 572,300
Other Sources/(Uses) of Funds 0 0 42,652 40,000 10,000 10,000 10,000 10,000 10,000 10,000
Change in Fund Balance 604,760 260,126 (25,544) (1,196,610) (411,090) (712,250) (569,420) (218,070) (174,750) 582,300
Ending Fund Balance 1,733,420 1,993,546 1,968,002 771,392 360,302 (351,948) (921,368) (1,139,438) (1,314,188) (731,888)
(2,000,000)
(1,500,000)
(1,000,000)
(500,000)
0
500,000
1,000,000
1,500,000
2,000,000
2,500,000
3,000,000
2014 2015 2016 2017 2018 2019 2020 2021 2022 2023
Capital Projects Fund
Total Revenues Total Expenditures Ending Fund Balance
62

28 Capital Projects 00-00
2015 2016 2017 2017 2018 2019Actual Actual Budget Projected Projected Projected
3130 Utility Tax 358,394 921,121 1,343,340 1,280,000 1,305,600 1,331,710Total Taxes 358,394 921,121 1,343,340 1,280,000 1,305,600 1,331,710
3440 Grants 0 0 100,000 0 0 03451 Home Rule Sales Tax 600,000 0 0 0 0 0
Total Intergovernmental 600,000 0 100,000 0 0 0
3810 Interest Income 1,139 6,855 940 16,000 13,000 10,0003840 Reimbursements 0 0 0 111,660 0 03890 Miscellaneous 0 0 0 0 0 0
Total Miscellaneous Revenue 1,139 6,855 940 127,660 13,000 10,000
3920 Proceeds-Capital Asset Sales 0 42,652 10,000 40,000 10,000 10,000Total Other Sources of Funds 0 42,652 10,000 40,000 10,000 10,000
Total Revenues 959,534 970,628 1,454,280 1,447,660 1,328,600 1,351,710
8100 Land 0 1,000 300,000 300,000 0 08200 Building 0 0 300,000 300,000 0 08300 Equipment - EMA 37,500 0 27,000 27,000 30,000 30,0008301 Equipment - Administration 30,293 38,785 64,000 64,000 113,000 63,0008302 Equipment - Police 104,832 0 19,460 19,460 11,880 361,8808303 Equipment - Fire 41,514 32,961 79,400 79,400 82,230 35,4008304 Equipment - Public Works 0 95,172 115,000 115,000 0 08305 Equipment - Community Development 0 0 0 0 100,000 08401 Vehicles - Administration 0 0 52,000 52,000 0 80,0008402 Vehicles - Police 106,480 176,353 112,500 112,500 112,500 165,0008403 Vehicles - Fire 0 117,882 572,910 572,910 218,080 183,0808404 Vehicles - Public Works 0 54,234 152,000 152,000 222,000 309,0008406 Vehicles - Economic Development 0 0 0 0 0 08500 Infrastructure 378,788 479,786 850,000 850,000 850,000 836,600
Total Capital Outlay 699,408 996,172 2,644,270 2,644,270 1,739,690 2,063,960
TOTAL EXPENDITURES 699,408 996,172 2,644,270 2,644,270 1,739,690 2,063,960
NET CHANGE IN FUND BALANCE 260,126 (25,544) (1,189,990) (1,196,610) (411,090) (712,250)
Beginning Fund Balance 1,733,420 1,993,546 1,968,002 1,968,002 771,392 360,302Ending Fund Balance 1,993,546 1,968,002 778,012 771,392 360,302 (351,948)
63
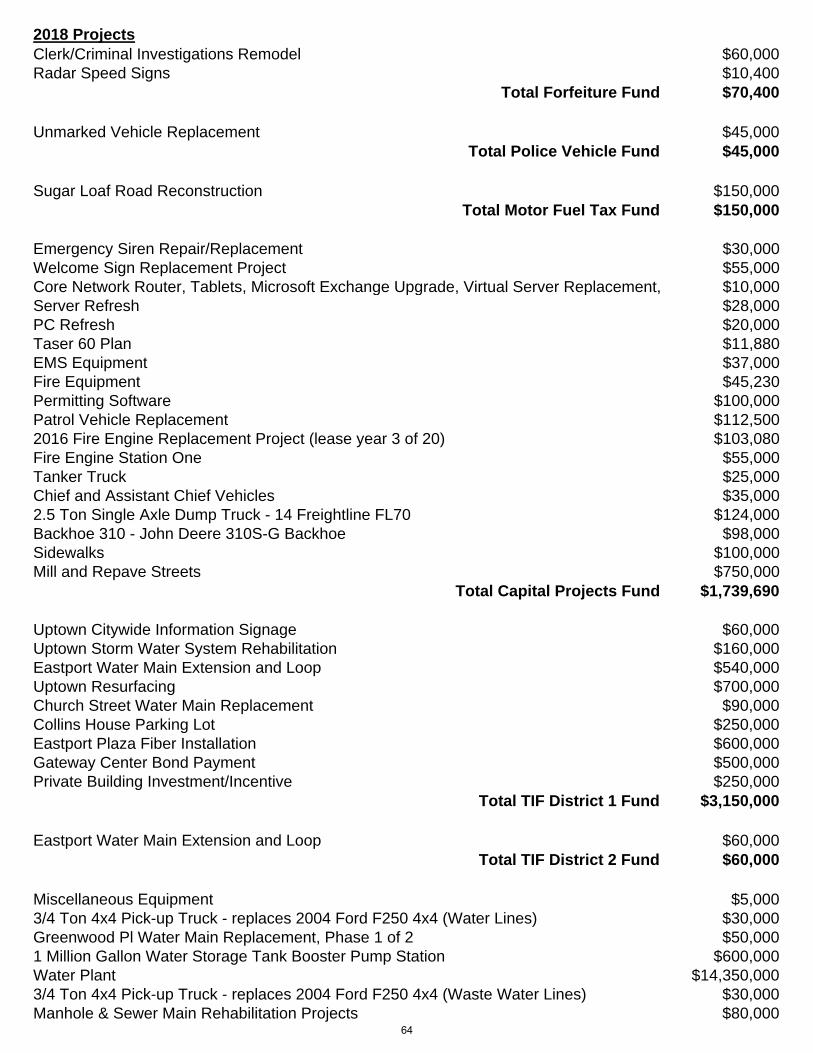
2018 ProjectsClerk/Criminal Investigations Remodel $60,000Radar Speed Signs $10,400
Total Forfeiture Fund $70,400
Unmarked Vehicle Replacement $45,000Total Police Vehicle Fund $45,000
Sugar Loaf Road Reconstruction $150,000Total Motor Fuel Tax Fund $150,000
Emergency Siren Repair/Replacement $30,000Welcome Sign Replacement Project $55,000Core Network Router, Tablets, Microsoft Exchange Upgrade, Virtual Server Replacement, $10,000Server Refresh $28,000PC Refresh $20,000Taser 60 Plan $11,880EMS Equipment $37,000Fire Equipment $45,230Permitting Software $100,000Patrol Vehicle Replacement $112,5002016 Fire Engine Replacement Project (lease year 3 of 20) $103,080Fire Engine Station One $55,000Tanker Truck $25,000Chief and Assistant Chief Vehicles $35,0002.5 Ton Single Axle Dump Truck - 14 Freightline FL70 $124,000Backhoe 310 - John Deere 310S-G Backhoe $98,000Sidewalks $100,000Mill and Repave Streets $750,000
Total Capital Projects Fund $1,739,690
Uptown Citywide Information Signage $60,000Uptown Storm Water System Rehabilitation $160,000Eastport Water Main Extension and Loop $540,000Uptown Resurfacing $700,000Church Street Water Main Replacement $90,000Collins House Parking Lot $250,000Eastport Plaza Fiber Installation $600,000Gateway Center Bond Payment $500,000Private Building Investment/Incentive $250,000
Total TIF District 1 Fund $3,150,000
Eastport Water Main Extension and Loop $60,000Total TIF District 2 Fund $60,000
Miscellaneous Equipment $5,0003/4 Ton 4x4 Pick-up Truck - replaces 2004 Ford F250 4x4 (Water Lines) $30,000Greenwood Pl Water Main Replacement, Phase 1 of 2 $50,0001 Million Gallon Water Storage Tank Booster Pump Station $600,000Water Plant $14,350,0003/4 Ton 4x4 Pick-up Truck - replaces 2004 Ford F250 4x4 (Waste Water Lines) $30,000Manhole & Sewer Main Rehabilitation Projects $80,000
64

2018 ProjectsSewer Colleciton System Lift Station Rehabilitation $90,000
Total Water/Waste Water Fund $15,235,000
Miscellaneous building improvements $5,100Total Animal Shetler Fund $5,100
Infrastructure $15,400Total Project Fund $15,400
Grand Total $20,470,590
65
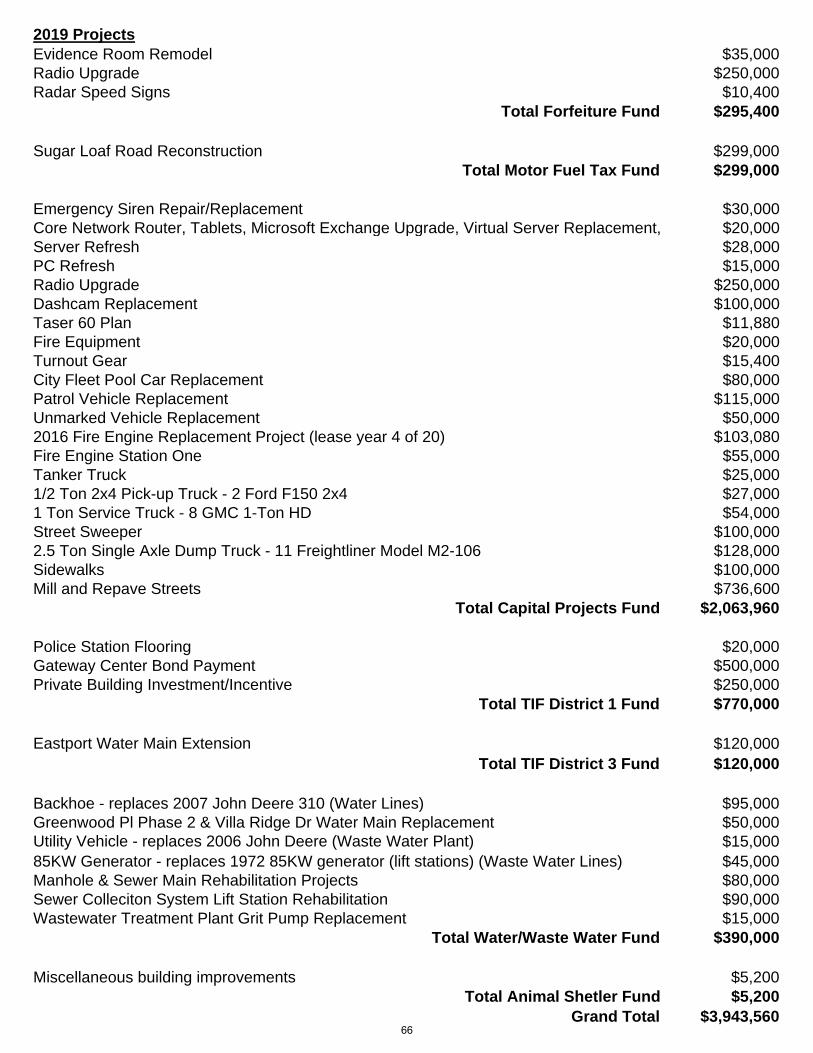
2019 ProjectsEvidence Room Remodel $35,000Radio Upgrade $250,000Radar Speed Signs $10,400
Total Forfeiture Fund $295,400
Sugar Loaf Road Reconstruction $299,000Total Motor Fuel Tax Fund $299,000
Emergency Siren Repair/Replacement $30,000Core Network Router, Tablets, Microsoft Exchange Upgrade, Virtual Server Replacement, $20,000Server Refresh $28,000PC Refresh $15,000Radio Upgrade $250,000Dashcam Replacement $100,000Taser 60 Plan $11,880Fire Equipment $20,000Turnout Gear $15,400City Fleet Pool Car Replacement $80,000Patrol Vehicle Replacement $115,000Unmarked Vehicle Replacement $50,0002016 Fire Engine Replacement Project (lease year 4 of 20) $103,080Fire Engine Station One $55,000Tanker Truck $25,0001/2 Ton 2x4 Pick-up Truck - 2 Ford F150 2x4 $27,0001 Ton Service Truck - 8 GMC 1-Ton HD $54,000Street Sweeper $100,0002.5 Ton Single Axle Dump Truck - 11 Freightliner Model M2-106 $128,000Sidewalks $100,000Mill and Repave Streets $736,600
Total Capital Projects Fund $2,063,960
Police Station Flooring $20,000Gateway Center Bond Payment $500,000Private Building Investment/Incentive $250,000
Total TIF District 1 Fund $770,000
Eastport Water Main Extension $120,000Total TIF District 3 Fund $120,000
Backhoe - replaces 2007 John Deere 310 (Water Lines) $95,000Greenwood Pl Phase 2 & Villa Ridge Dr Water Main Replacement $50,000Utility Vehicle - replaces 2006 John Deere (Waste Water Plant) $15,00085KW Generator - replaces 1972 85KW generator (lift stations) (Waste Water Lines) $45,000Manhole & Sewer Main Rehabilitation Projects $80,000Sewer Colleciton System Lift Station Rehabilitation $90,000Wastewater Treatment Plant Grit Pump Replacement $15,000
Total Water/Waste Water Fund $390,000
Miscellaneous building improvements $5,200Total Animal Shetler Fund $5,200
Grand Total $3,943,56066
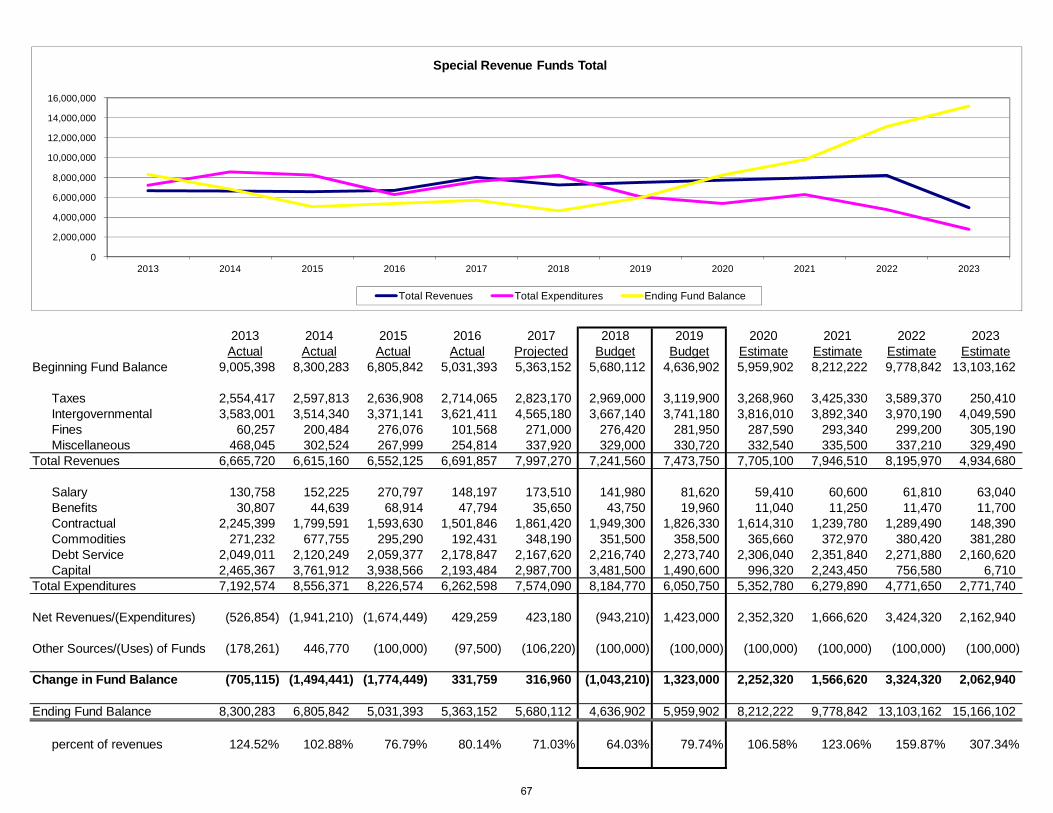
2013 2014 2015 2016 2017 2018 2019 2020 2021 2022 2023Actual Actual Actual Actual Projected Budget Budget Estimate Estimate Estimate Estimate
Beginning Fund Balance 9,005,398 8,300,283 6,805,842 5,031,393 5,363,152 5,680,112 4,636,902 5,959,902 8,212,222 9,778,842 13,103,162
Taxes 2,554,417 2,597,813 2,636,908 2,714,065 2,823,170 2,969,000 3,119,900 3,268,960 3,425,330 3,589,370 250,410Intergovernmental 3,583,001 3,514,340 3,371,141 3,621,411 4,565,180 3,667,140 3,741,180 3,816,010 3,892,340 3,970,190 4,049,590Fines 60,257 200,484 276,076 101,568 271,000 276,420 281,950 287,590 293,340 299,200 305,190Miscellaneous 468,045 302,524 267,999 254,814 337,920 329,000 330,720 332,540 335,500 337,210 329,490
Total Revenues 6,665,720 6,615,160 6,552,125 6,691,857 7,997,270 7,241,560 7,473,750 7,705,100 7,946,510 8,195,970 4,934,680
Salary 130,758 152,225 270,797 148,197 173,510 141,980 81,620 59,410 60,600 61,810 63,040Benefits 30,807 44,639 68,914 47,794 35,650 43,750 19,960 11,040 11,250 11,470 11,700Contractual 2,245,399 1,799,591 1,593,630 1,501,846 1,861,420 1,949,300 1,826,330 1,614,310 1,239,780 1,289,490 148,390Commodities 271,232 677,755 295,290 192,431 348,190 351,500 358,500 365,660 372,970 380,420 381,280Debt Service 2,049,011 2,120,249 2,059,377 2,178,847 2,167,620 2,216,740 2,273,740 2,306,040 2,351,840 2,271,880 2,160,620Capital 2,465,367 3,761,912 3,938,566 2,193,484 2,987,700 3,481,500 1,490,600 996,320 2,243,450 756,580 6,710
Total Expenditures 7,192,574 8,556,371 8,226,574 6,262,598 7,574,090 8,184,770 6,050,750 5,352,780 6,279,890 4,771,650 2,771,740
Net Revenues/(Expenditures) (526,854) (1,941,210) (1,674,449) 429,259 423,180 (943,210) 1,423,000 2,352,320 1,666,620 3,424,320 2,162,940
Other Sources/(Uses) of Funds (178,261) 446,770 (100,000) (97,500) (106,220) (100,000) (100,000) (100,000) (100,000) (100,000) (100,000)
Change in Fund Balance (705,115) (1,494,441) (1,774,449) 331,759 316,960 (1,043,210) 1,323,000 2,252,320 1,566,620 3,324,320 2,062,940
Ending Fund Balance 8,300,283 6,805,842 5,031,393 5,363,152 5,680,112 4,636,902 5,959,902 8,212,222 9,778,842 13,103,162 15,166,102
percent of revenues 124.52% 102.88% 76.79% 80.14% 71.03% 64.03% 79.74% 106.58% 123.06% 159.87% 307.34%
0
2,000,000
4,000,000
6,000,000
8,000,000
10,000,000
12,000,000
14,000,000
16,000,000
2013 2014 2015 2016 2017 2018 2019 2020 2021 2022 2023
Special Revenue Funds Total
Total Revenues Total Expenditures Ending Fund Balance
67
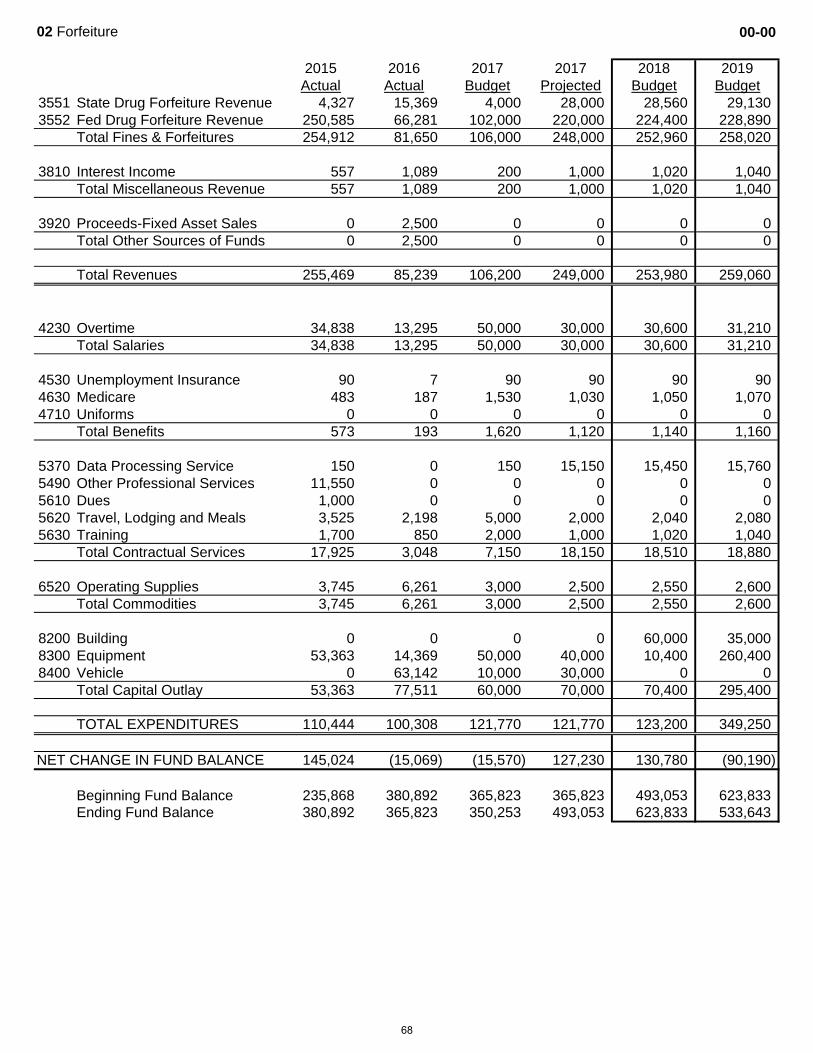
02 Forfeiture 00-00
2015 2016 2017 2017 2018 2019Actual Actual Budget Projected Budget Budget
3551 State Drug Forfeiture Revenue 4,327 15,369 4,000 28,000 28,560 29,1303552 Fed Drug Forfeiture Revenue 250,585 66,281 102,000 220,000 224,400 228,890
Total Fines & Forfeitures 254,912 81,650 106,000 248,000 252,960 258,020
3810 Interest Income 557 1,089 200 1,000 1,020 1,040Total Miscellaneous Revenue 557 1,089 200 1,000 1,020 1,040
3920 Proceeds-Fixed Asset Sales 0 2,500 0 0 0 0Total Other Sources of Funds 0 2,500 0 0 0 0
Total Revenues 255,469 85,239 106,200 249,000 253,980 259,060
4230 Overtime 34,838 13,295 50,000 30,000 30,600 31,210Total Salaries 34,838 13,295 50,000 30,000 30,600 31,210
4530 Unemployment Insurance 90 7 90 90 90 904630 Medicare 483 187 1,530 1,030 1,050 1,0704710 Uniforms 0 0 0 0 0 0
Total Benefits 573 193 1,620 1,120 1,140 1,160
5370 Data Processing Service 150 0 150 15,150 15,450 15,7605490 Other Professional Services 11,550 0 0 0 0 05610 Dues 1,000 0 0 0 0 05620 Travel, Lodging and Meals 3,525 2,198 5,000 2,000 2,040 2,0805630 Training 1,700 850 2,000 1,000 1,020 1,040
Total Contractual Services 17,925 3,048 7,150 18,150 18,510 18,880
6520 Operating Supplies 3,745 6,261 3,000 2,500 2,550 2,600Total Commodities 3,745 6,261 3,000 2,500 2,550 2,600
8200 Building 0 0 0 0 60,000 35,0008300 Equipment 53,363 14,369 50,000 40,000 10,400 260,4008400 Vehicle 0 63,142 10,000 30,000 0 0
Total Capital Outlay 53,363 77,511 60,000 70,000 70,400 295,400
TOTAL EXPENDITURES 110,444 100,308 121,770 121,770 123,200 349,250
NET CHANGE IN FUND BALANCE 145,024 (15,069) (15,570) 127,230 130,780 (90,190)
Beginning Fund Balance 235,868 380,892 365,823 365,823 493,053 623,833Ending Fund Balance 380,892 365,823 350,253 493,053 623,833 533,643
68
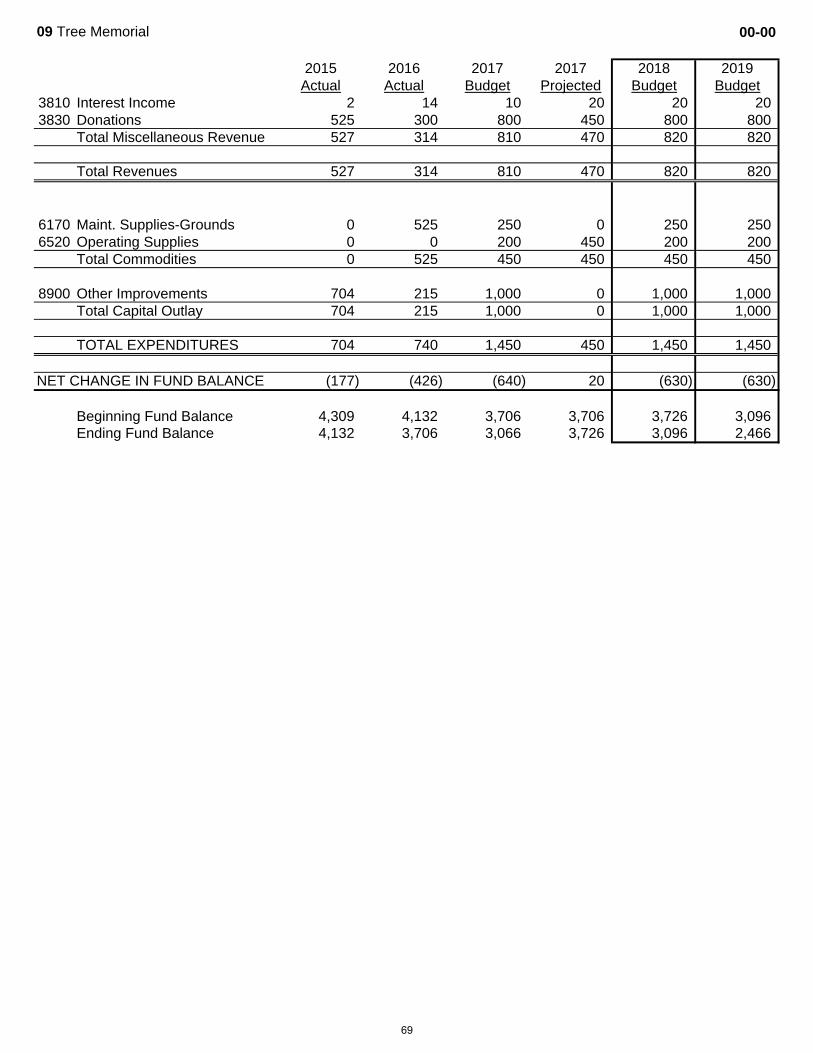
09 Tree Memorial 00-00
2015 2016 2017 2017 2018 2019Actual Actual Budget Projected Budget Budget
3810 Interest Income 2 14 10 20 20 203830 Donations 525 300 800 450 800 800
Total Miscellaneous Revenue 527 314 810 470 820 820
Total Revenues 527 314 810 470 820 820
6170 Maint. Supplies-Grounds 0 525 250 0 250 2506520 Operating Supplies 0 0 200 450 200 200
Total Commodities 0 525 450 450 450 450
8900 Other Improvements 704 215 1,000 0 1,000 1,000Total Capital Outlay 704 215 1,000 0 1,000 1,000
TOTAL EXPENDITURES 704 740 1,450 450 1,450 1,450
NET CHANGE IN FUND BALANCE (177) (426) (640) 20 (630) (630)
Beginning Fund Balance 4,309 4,132 3,706 3,706 3,726 3,096Ending Fund Balance 4,132 3,706 3,066 3,726 3,096 2,466
69
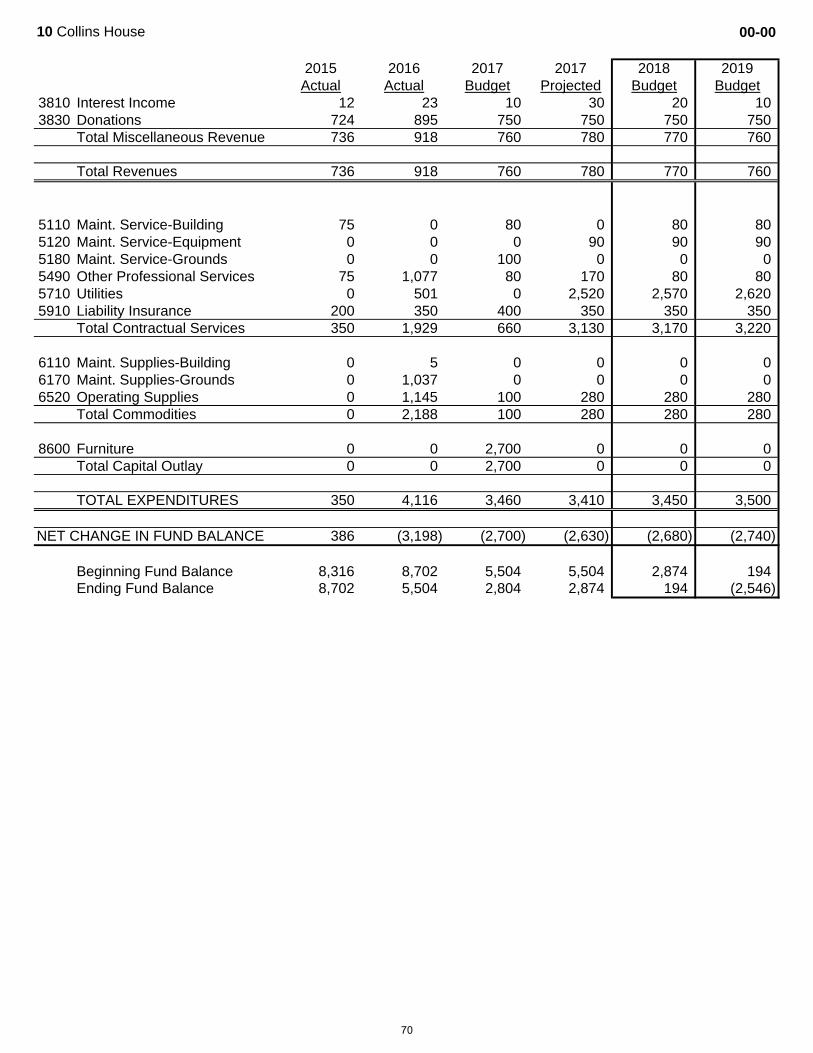
10 Collins House 00-00
2015 2016 2017 2017 2018 2019Actual Actual Budget Projected Budget Budget
3810 Interest Income 12 23 10 30 20 103830 Donations 724 895 750 750 750 750
Total Miscellaneous Revenue 736 918 760 780 770 760
Total Revenues 736 918 760 780 770 760
5110 Maint. Service-Building 75 0 80 0 80 805120 Maint. Service-Equipment 0 0 0 90 90 905180 Maint. Service-Grounds 0 0 100 0 0 05490 Other Professional Services 75 1,077 80 170 80 805710 Utilities 0 501 0 2,520 2,570 2,6205910 Liability Insurance 200 350 400 350 350 350
Total Contractual Services 350 1,929 660 3,130 3,170 3,220
6110 Maint. Supplies-Building 0 5 0 0 0 06170 Maint. Supplies-Grounds 0 1,037 0 0 0 06520 Operating Supplies 0 1,145 100 280 280 280
Total Commodities 0 2,188 100 280 280 280
8600 Furniture 0 0 2,700 0 0 0Total Capital Outlay 0 0 2,700 0 0 0
TOTAL EXPENDITURES 350 4,116 3,460 3,410 3,450 3,500
NET CHANGE IN FUND BALANCE 386 (3,198) (2,700) (2,630) (2,680) (2,740)
Beginning Fund Balance 8,316 8,702 5,504 5,504 2,874 194Ending Fund Balance 8,702 5,504 2,804 2,874 194 (2,546)
70

11 Police Vehicle 00-00
2015 2016 2017 2017 2018 2019Actual Actual Budget Projected Budget Budget
3510 Court Fines 14,984 12,213 15,000 15,000 15,300 15,610Total Fines & Forfeitures 14,984 12,213 15,000 15,000 15,300 15,610
3810 Interest Income 29 70 20 20 20 20Total Miscellaneous Revenue 29 70 20 20 20 20
Total Revenues 15,013 12,283 15,020 15,020 15,320 15,630
8400 Vehicle 0 19,451 19,000 0 45,000 08900 Other Improvements 0 0 0 0 0 0
Total Capital Outlay 0 19,451 19,000 0 45,000 0
TOTAL EXPENDITURES 0 19,451 19,000 0 45,000 0
NET CHANGE IN FUND BALANCE 15,013 (7,168) (3,980) 15,020 (29,680) 15,630
Beginning Fund Balance 9,941 24,953 17,785 17,785 32,805 3,125Ending Fund Balance 24,953 17,785 13,805 32,805 3,125 18,755
71

18 Motor Fuel Tax 00-00
2015 2016 2017 2017 2018 2019Actual Actual Budget Projected Budget Budget
3430 Motor Fuel Tax 632,025 648,306 620,000 656,820 669,960 683,3603440 Grants/Matching 0 187,690 0 319,460 0 0
Total Intergovernmental 632,025 835,996 620,000 976,280 669,960 683,360
3810 Interest Income 1,123 710 1,500 3,900 1,530 1,5603840 Reimbursements 2,710 0 2,820 0 0 03890 Miscellaneous 5,375 0 0 0 0 0
Total Miscellaneous Revenue 9,208 710 4,320 3,900 1,530 1,560
Total Revenues 641,233 836,706 624,320 980,180 671,490 684,920
5320 Engineering Service 166,317 67,597 45,000 6,450 65,000 20,0005330 Legal Service 0 0 0 0 0 05490 Other Professional Services 3,510 0 0 0 0 0
Total Contractual Services 169,827 67,597 45,000 6,450 65,000 20,000
6140 Maint. Supplies-Street 171,511 115,923 220,000 220,000 224,400 228,8906150 Maint. Supplies-Infrastructure 245 413 10,000 10,000 10,200 10,4006160 Maint. Supplies-Snow Removal 117,872 56,779 100,000 100,000 102,000 104,0406180 Maint. Supplies-Traffic Control 0 5,229 0 0 0 0
Total Commodities 289,628 178,345 330,000 330,000 336,600 343,330
8100 Land 27,300 0 0 0 0 08500 Infrastructure 315,514 306,168 150,000 120,000 150,000 299,000
Total Capital Outlay 342,814 306,168 150,000 120,000 150,000 299,000
9990 Transfer Out 98,308 100,000 100,000 100,000 100,000 100,000Total Other Uses of Funds 98,308 100,000 100,000 100,000 100,000 100,000
TOTAL EXPENDITURES 900,577 652,109 625,000 556,450 651,600 762,330
NET CHANGE IN FUND BALANCE (259,345) 184,596 (680) 423,730 19,890 (77,410)
Beginning Fund Balance 371,284 111,940 296,536 296,536 720,266 740,156Ending Fund Balance 111,940 296,536 295,856 720,266 740,156 662,746
72

35 DUI Court Fines 00-00
2015 2016 2017 2017 2018 2019Actual Actual Budget Projected Budget Budget
3511 DUI Court Fines 6,181 7,705 8,000 8,000 8,160 8,320Total Fines & Forfeitures 6,181 7,705 8,000 8,000 8,160 8,320
3810 Interest Income 23 32 10 10 10 10Total Miscellaneous Revenue 23 32 10 10 10 10
Total Revenues 6,204 7,737 8,010 8,010 8,170 8,330
8300 Equipment 0 0 10,000 0 0 08400 Vehicle 0 19,451 0 0 0 0
Total Capital Outlay 0 19,451 10,000 0 0 0
TOTAL EXPENDITURES 0 19,451 10,000 0 0 0
NET CHANGE IN FUND BALANCE 6,204 (11,714) (1,990) 8,010 8,170 8,330
Beginning Fund Balance 11,628 17,832 6,117 6,117 14,127 22,297Ending Fund Balance 17,832 6,117 4,127 14,127 22,297 30,627
73
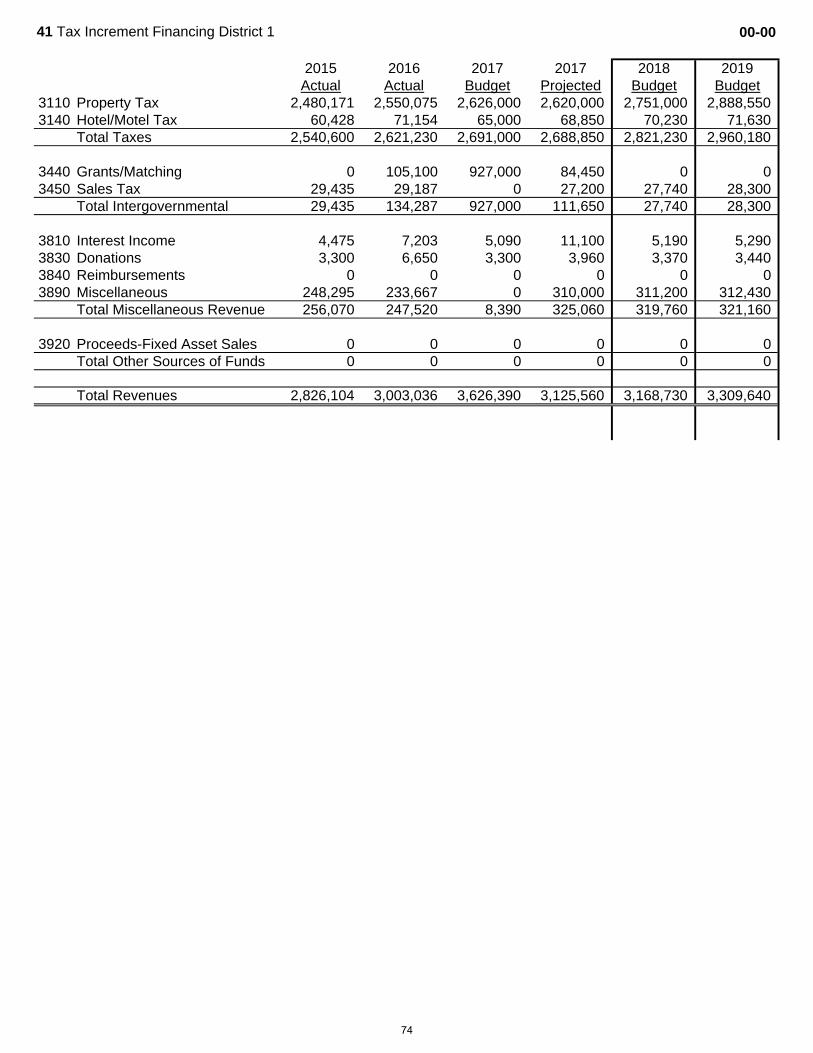
41 Tax Increment Financing District 1 00-00
2015 2016 2017 2017 2018 2019Actual Actual Budget Projected Budget Budget
3110 Property Tax 2,480,171 2,550,075 2,626,000 2,620,000 2,751,000 2,888,5503140 Hotel/Motel Tax 60,428 71,154 65,000 68,850 70,230 71,630
Total Taxes 2,540,600 2,621,230 2,691,000 2,688,850 2,821,230 2,960,180
3440 Grants/Matching 0 105,100 927,000 84,450 0 03450 Sales Tax 29,435 29,187 0 27,200 27,740 28,300
Total Intergovernmental 29,435 134,287 927,000 111,650 27,740 28,300
3810 Interest Income 4,475 7,203 5,090 11,100 5,190 5,2903830 Donations 3,300 6,650 3,300 3,960 3,370 3,4403840 Reimbursements 0 0 0 0 0 03890 Miscellaneous 248,295 233,667 0 310,000 311,200 312,430
Total Miscellaneous Revenue 256,070 247,520 8,390 325,060 319,760 321,160
3920 Proceeds-Fixed Asset Sales 0 0 0 0 0 0Total Other Sources of Funds 0 0 0 0 0 0
Total Revenues 2,826,104 3,003,036 3,626,390 3,125,560 3,168,730 3,309,640
74
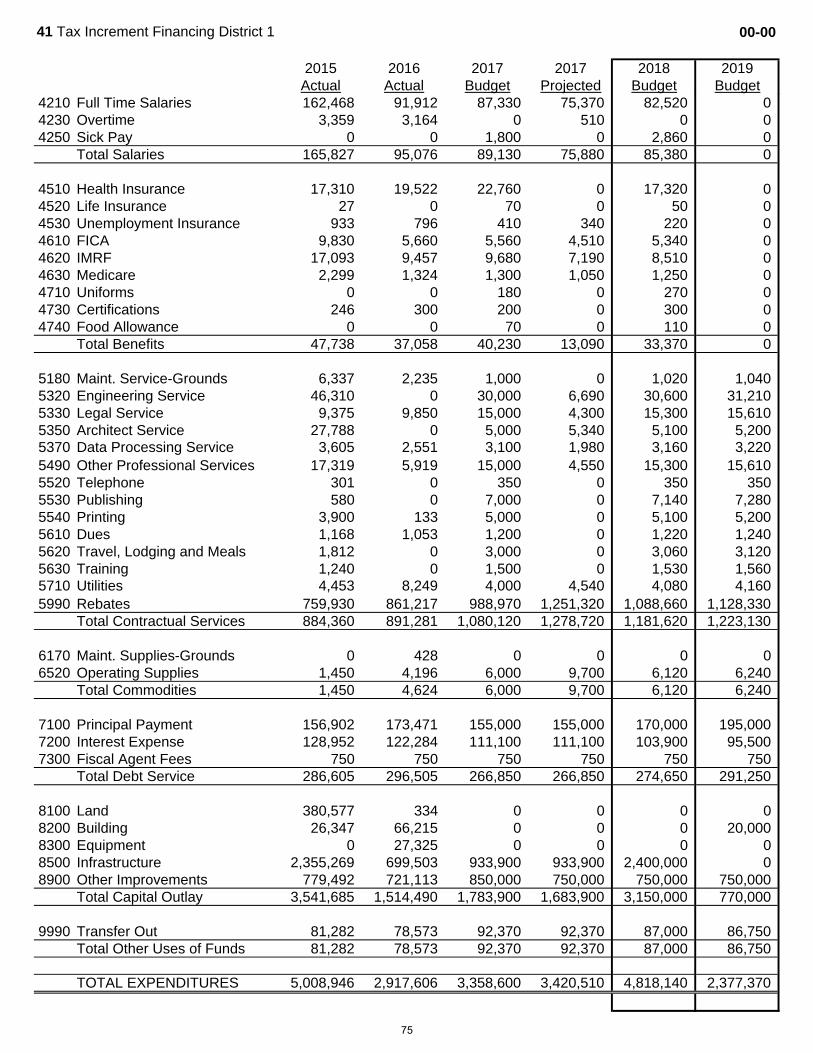
41 Tax Increment Financing District 1 00-00
2015 2016 2017 2017 2018 2019Actual Actual Budget Projected Budget Budget
4210 Full Time Salaries 162,468 91,912 87,330 75,370 82,520 04230 Overtime 3,359 3,164 0 510 0 04250 Sick Pay 0 0 1,800 0 2,860 0
Total Salaries 165,827 95,076 89,130 75,880 85,380 0
4510 Health Insurance 17,310 19,522 22,760 0 17,320 04520 Life Insurance 27 0 70 0 50 04530 Unemployment Insurance 933 796 410 340 220 04610 FICA 9,830 5,660 5,560 4,510 5,340 04620 IMRF 17,093 9,457 9,680 7,190 8,510 04630 Medicare 2,299 1,324 1,300 1,050 1,250 04710 Uniforms 0 0 180 0 270 04730 Certifications 246 300 200 0 300 04740 Food Allowance 0 0 70 0 110 0
Total Benefits 47,738 37,058 40,230 13,090 33,370 0
5180 Maint. Service-Grounds 6,337 2,235 1,000 0 1,020 1,0405320 Engineering Service 46,310 0 30,000 6,690 30,600 31,2105330 Legal Service 9,375 9,850 15,000 4,300 15,300 15,6105350 Architect Service 27,788 0 5,000 5,340 5,100 5,2005370 Data Processing Service 3,605 2,551 3,100 1,980 3,160 3,2205490 Other Professional Services 17,319 5,919 15,000 4,550 15,300 15,6105520 Telephone 301 0 350 0 350 3505530 Publishing 580 0 7,000 0 7,140 7,2805540 Printing 3,900 133 5,000 0 5,100 5,2005610 Dues 1,168 1,053 1,200 0 1,220 1,2405620 Travel, Lodging and Meals 1,812 0 3,000 0 3,060 3,1205630 Training 1,240 0 1,500 0 1,530 1,5605710 Utilities 4,453 8,249 4,000 4,540 4,080 4,1605990 Rebates 759,930 861,217 988,970 1,251,320 1,088,660 1,128,330
Total Contractual Services 884,360 891,281 1,080,120 1,278,720 1,181,620 1,223,130
6170 Maint. Supplies-Grounds 0 428 0 0 0 06520 Operating Supplies 1,450 4,196 6,000 9,700 6,120 6,240
Total Commodities 1,450 4,624 6,000 9,700 6,120 6,240
7100 Principal Payment 156,902 173,471 155,000 155,000 170,000 195,0007200 Interest Expense 128,952 122,284 111,100 111,100 103,900 95,5007300 Fiscal Agent Fees 750 750 750 750 750 750
Total Debt Service 286,605 296,505 266,850 266,850 274,650 291,250
8100 Land 380,577 334 0 0 0 08200 Building 26,347 66,215 0 0 0 20,0008300 Equipment 0 27,325 0 0 0 08500 Infrastructure 2,355,269 699,503 933,900 933,900 2,400,000 08900 Other Improvements 779,492 721,113 850,000 750,000 750,000 750,000
Total Capital Outlay 3,541,685 1,514,490 1,783,900 1,683,900 3,150,000 770,000
9990 Transfer Out 81,282 78,573 92,370 92,370 87,000 86,750Total Other Uses of Funds 81,282 78,573 92,370 92,370 87,000 86,750
TOTAL EXPENDITURES 5,008,946 2,917,606 3,358,600 3,420,510 4,818,140 2,377,370
75
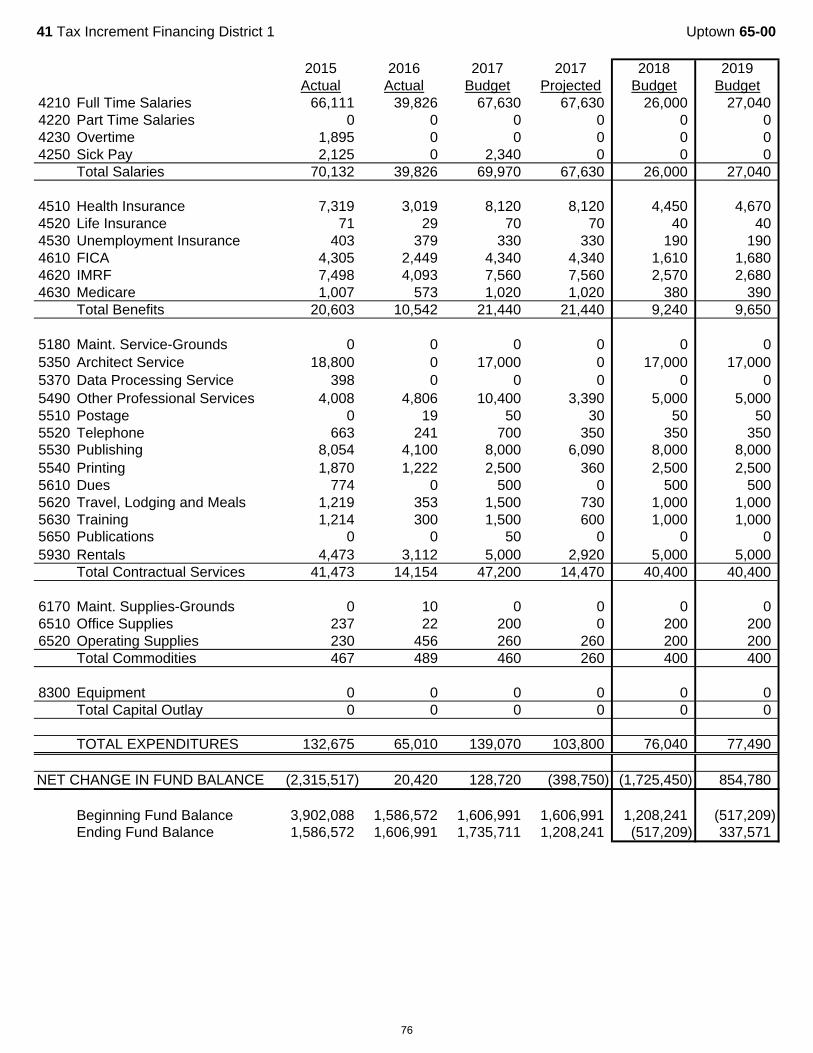
41 Tax Increment Financing District 1 Uptown 65-00
2015 2016 2017 2017 2018 2019Actual Actual Budget Projected Budget Budget
4210 Full Time Salaries 66,111 39,826 67,630 67,630 26,000 27,0404220 Part Time Salaries 0 0 0 0 0 04230 Overtime 1,895 0 0 0 0 04250 Sick Pay 2,125 0 2,340 0 0 0
Total Salaries 70,132 39,826 69,970 67,630 26,000 27,040
4510 Health Insurance 7,319 3,019 8,120 8,120 4,450 4,6704520 Life Insurance 71 29 70 70 40 404530 Unemployment Insurance 403 379 330 330 190 1904610 FICA 4,305 2,449 4,340 4,340 1,610 1,6804620 IMRF 7,498 4,093 7,560 7,560 2,570 2,6804630 Medicare 1,007 573 1,020 1,020 380 390
Total Benefits 20,603 10,542 21,440 21,440 9,240 9,650
5180 Maint. Service-Grounds 0 0 0 0 0 05350 Architect Service 18,800 0 17,000 0 17,000 17,0005370 Data Processing Service 398 0 0 0 0 05490 Other Professional Services 4,008 4,806 10,400 3,390 5,000 5,0005510 Postage 0 19 50 30 50 505520 Telephone 663 241 700 350 350 3505530 Publishing 8,054 4,100 8,000 6,090 8,000 8,0005540 Printing 1,870 1,222 2,500 360 2,500 2,5005610 Dues 774 0 500 0 500 5005620 Travel, Lodging and Meals 1,219 353 1,500 730 1,000 1,0005630 Training 1,214 300 1,500 600 1,000 1,0005650 Publications 0 0 50 0 0 05930 Rentals 4,473 3,112 5,000 2,920 5,000 5,000
Total Contractual Services 41,473 14,154 47,200 14,470 40,400 40,400
6170 Maint. Supplies-Grounds 0 10 0 0 0 06510 Office Supplies 237 22 200 0 200 2006520 Operating Supplies 230 456 260 260 200 200
Total Commodities 467 489 460 260 400 400
8300 Equipment 0 0 0 0 0 0Total Capital Outlay 0 0 0 0 0 0
TOTAL EXPENDITURES 132,675 65,010 139,070 103,800 76,040 77,490
NET CHANGE IN FUND BALANCE (2,315,517) 20,420 128,720 (398,750) (1,725,450) 854,780
Beginning Fund Balance 3,902,088 1,586,572 1,606,991 1,606,991 1,208,241 (517,209)Ending Fund Balance 1,586,572 1,606,991 1,735,711 1,208,241 (517,209) 337,571
76

42 I-255/Horseshoe Lake Road TIF District 00-00
2015 2016 2017 2017 2018 2019Actual Actual Budget Projected Budget Budget
3110 Property Tax 5,759 6,403 6,100 6,500 6,630 6,760Total Taxes 5,759 6,403 6,100 6,500 6,630 6,760
3810 Interest Income 51 129 0 150 0 0Total Miscellaneous Revenue 51 129 0 150 0 0
Total Revenues 5,810 6,531 6,100 6,650 6,630 6,760
5990 Rebates 0 0 0 0 0 0Total Contractual Services 0 0 0 0 0 0
8500 Infrastructure 0 0 0 0 60,000 0Total Capital Outlay 0 0 0 0 60,000 0
TOTAL EXPENDITURES 0 0 0 0 60,000 0
NET CHANGE IN FUND BALANCE 5,810 6,531 6,100 6,650 (53,370) 6,760
Beginning Fund Balance 32,711 38,521 45,052 45,052 51,702 (1,668)Ending Fund Balance 38,521 45,052 51,152 51,702 (1,668) 5,092
77
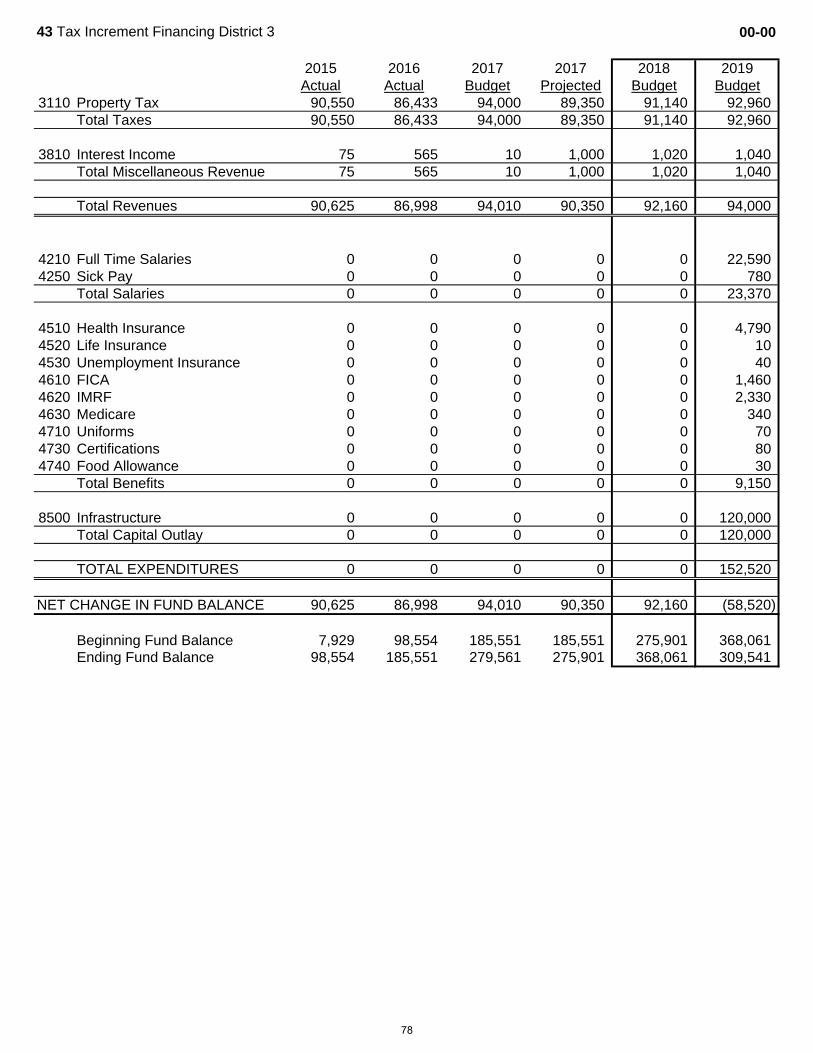
43 Tax Increment Financing District 3 00-00
2015 2016 2017 2017 2018 2019Actual Actual Budget Projected Budget Budget
3110 Property Tax 90,550 86,433 94,000 89,350 91,140 92,960Total Taxes 90,550 86,433 94,000 89,350 91,140 92,960
3810 Interest Income 75 565 10 1,000 1,020 1,040Total Miscellaneous Revenue 75 565 10 1,000 1,020 1,040
Total Revenues 90,625 86,998 94,010 90,350 92,160 94,000
4210 Full Time Salaries 0 0 0 0 0 22,5904250 Sick Pay 0 0 0 0 0 780
Total Salaries 0 0 0 0 0 23,370
4510 Health Insurance 0 0 0 0 0 4,7904520 Life Insurance 0 0 0 0 0 104530 Unemployment Insurance 0 0 0 0 0 404610 FICA 0 0 0 0 0 1,4604620 IMRF 0 0 0 0 0 2,3304630 Medicare 0 0 0 0 0 3404710 Uniforms 0 0 0 0 0 704730 Certifications 0 0 0 0 0 804740 Food Allowance 0 0 0 0 0 30
Total Benefits 0 0 0 0 0 9,150
8500 Infrastructure 0 0 0 0 0 120,000Total Capital Outlay 0 0 0 0 0 120,000
TOTAL EXPENDITURES 0 0 0 0 0 152,520
NET CHANGE IN FUND BALANCE 90,625 86,998 94,010 90,350 92,160 (58,520)
Beginning Fund Balance 7,929 98,554 185,551 185,551 275,901 368,061Ending Fund Balance 98,554 185,551 279,561 275,901 368,061 309,541
78

44 Southwest Corridors TIF District 00-00
2015 2016 2017 2017 2018 2019Actual Actual Budget Projected Budget Budget
3110 Property Tax 0 0 0 38,470 50,000 60,000Total Taxes 0 0 0 38,470 50,000 60,000
3810 Interest Income 0 0 0 100 200 300Total Miscellaneous Revenue 0 0 0 100 200 300
Total Revenues 0 0 0 38,570 50,200 60,300
5990 Rebates 0 0 0 0 0 0Total Contractual Services 0 0 0 0 0 0
TOTAL EXPENDITURES 0 0 0 0 0 0
NET CHANGE IN FUND BALANCE 0 0 0 38,570 50,200 60,300
Beginning Fund Balance 0 0 0 0 38,570 88,770Ending Fund Balance 0 0 0 38,570 88,770 149,070
79
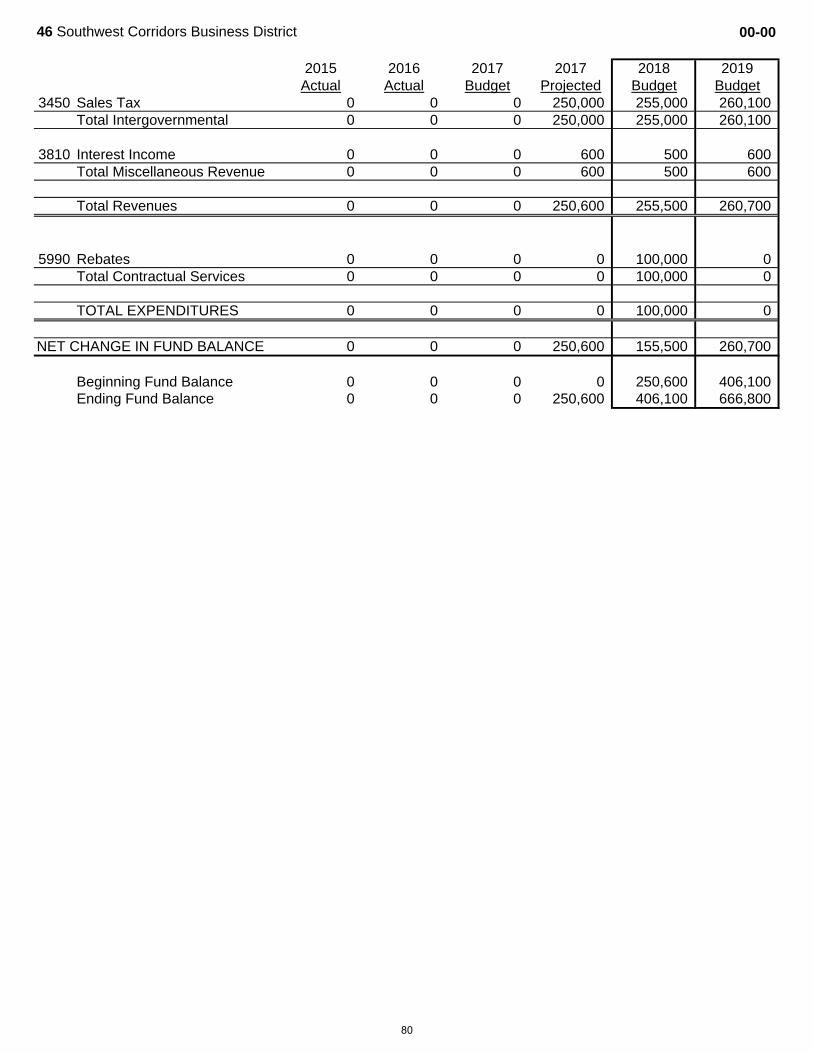
46 Southwest Corridors Business District 00-00
2015 2016 2017 2017 2018 2019Actual Actual Budget Projected Budget Budget
3450 Sales Tax 0 0 0 250,000 255,000 260,100Total Intergovernmental 0 0 0 250,000 255,000 260,100
3810 Interest Income 0 0 0 600 500 600Total Miscellaneous Revenue 0 0 0 600 500 600
Total Revenues 0 0 0 250,600 255,500 260,700
5990 Rebates 0 0 0 0 100,000 0Total Contractual Services 0 0 0 0 100,000 0
TOTAL EXPENDITURES 0 0 0 0 100,000 0
NET CHANGE IN FUND BALANCE 0 0 0 250,600 155,500 260,700
Beginning Fund Balance 0 0 0 0 250,600 406,100Ending Fund Balance 0 0 0 250,600 406,100 666,800
80
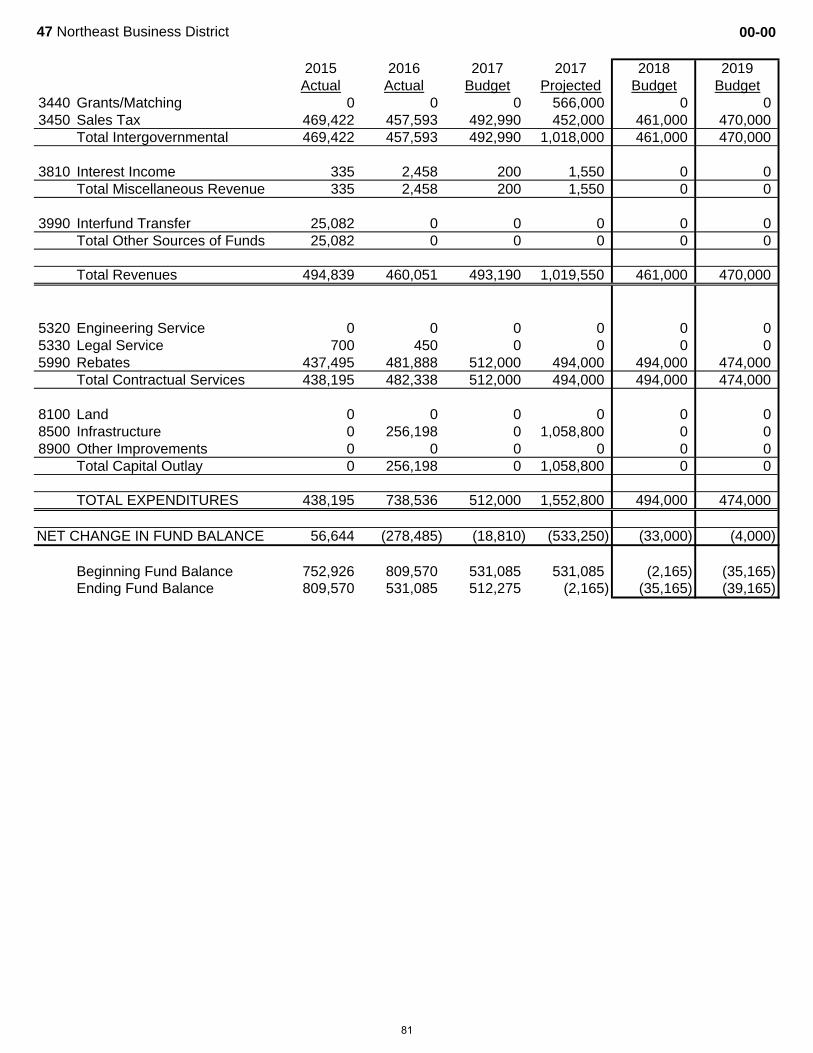
47 Northeast Business District 00-00
2015 2016 2017 2017 2018 2019Actual Actual Budget Projected Budget Budget
3440 Grants/Matching 0 0 0 566,000 0 03450 Sales Tax 469,422 457,593 492,990 452,000 461,000 470,000
Total Intergovernmental 469,422 457,593 492,990 1,018,000 461,000 470,000
3810 Interest Income 335 2,458 200 1,550 0 0Total Miscellaneous Revenue 335 2,458 200 1,550 0 0
3990 Interfund Transfer 25,082 0 0 0 0 0Total Other Sources of Funds 25,082 0 0 0 0 0
Total Revenues 494,839 460,051 493,190 1,019,550 461,000 470,000
5320 Engineering Service 0 0 0 0 0 05330 Legal Service 700 450 0 0 0 05990 Rebates 437,495 481,888 512,000 494,000 494,000 474,000
Total Contractual Services 438,195 482,338 512,000 494,000 494,000 474,000
8100 Land 0 0 0 0 0 08500 Infrastructure 0 256,198 0 1,058,800 0 08900 Other Improvements 0 0 0 0 0 0
Total Capital Outlay 0 256,198 0 1,058,800 0 0
TOTAL EXPENDITURES 438,195 738,536 512,000 1,552,800 494,000 474,000
NET CHANGE IN FUND BALANCE 56,644 (278,485) (18,810) (533,250) (33,000) (4,000)
Beginning Fund Balance 752,926 809,570 531,085 531,085 (2,165) (35,165)Ending Fund Balance 809,570 531,085 512,275 (2,165) (35,165) (39,165)
81
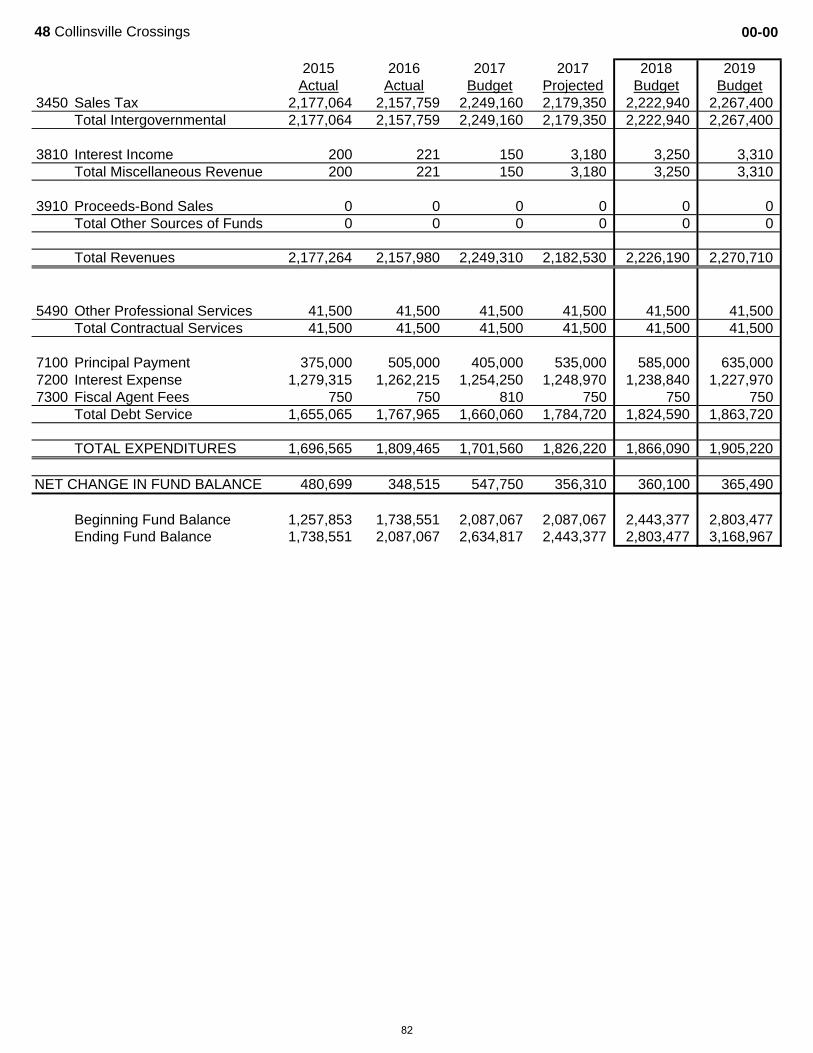
48 Collinsville Crossings 00-00
2015 2016 2017 2017 2018 2019Actual Actual Budget Projected Budget Budget
3450 Sales Tax 2,177,064 2,157,759 2,249,160 2,179,350 2,222,940 2,267,400Total Intergovernmental 2,177,064 2,157,759 2,249,160 2,179,350 2,222,940 2,267,400
3810 Interest Income 200 221 150 3,180 3,250 3,310Total Miscellaneous Revenue 200 221 150 3,180 3,250 3,310
3910 Proceeds-Bond Sales 0 0 0 0 0 0Total Other Sources of Funds 0 0 0 0 0 0
Total Revenues 2,177,264 2,157,980 2,249,310 2,182,530 2,226,190 2,270,710
5490 Other Professional Services 41,500 41,500 41,500 41,500 41,500 41,500Total Contractual Services 41,500 41,500 41,500 41,500 41,500 41,500
7100 Principal Payment 375,000 505,000 405,000 535,000 585,000 635,0007200 Interest Expense 1,279,315 1,262,215 1,254,250 1,248,970 1,238,840 1,227,9707300 Fiscal Agent Fees 750 750 810 750 750 750
Total Debt Service 1,655,065 1,767,965 1,660,060 1,784,720 1,824,590 1,863,720
TOTAL EXPENDITURES 1,696,565 1,809,465 1,701,560 1,826,220 1,866,090 1,905,220
NET CHANGE IN FUND BALANCE 480,699 348,515 547,750 356,310 360,100 365,490
Beginning Fund Balance 1,257,853 1,738,551 2,087,067 2,087,067 2,443,377 2,803,477Ending Fund Balance 1,738,551 2,087,067 2,634,817 2,443,377 2,803,477 3,168,967
82
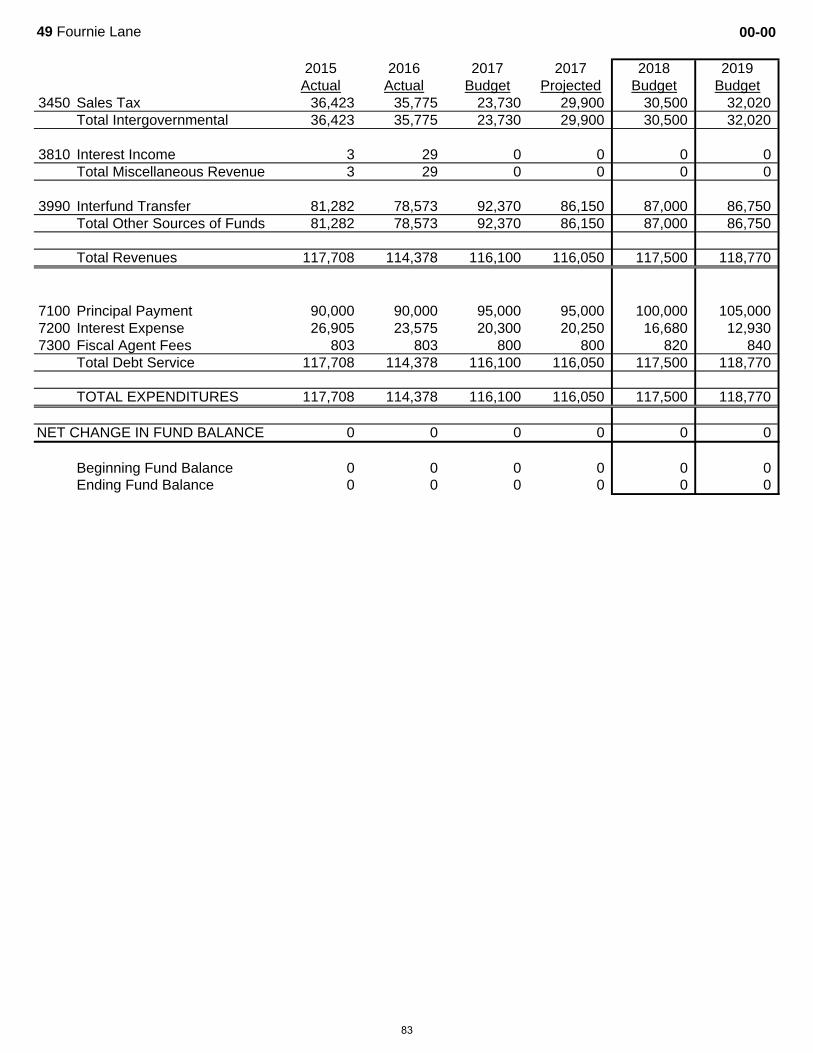
49 Fournie Lane 00-00
2015 2016 2017 2017 2018 2019Actual Actual Budget Projected Budget Budget
3450 Sales Tax 36,423 35,775 23,730 29,900 30,500 32,020Total Intergovernmental 36,423 35,775 23,730 29,900 30,500 32,020
3810 Interest Income 3 29 0 0 0 0Total Miscellaneous Revenue 3 29 0 0 0 0
3990 Interfund Transfer 81,282 78,573 92,370 86,150 87,000 86,750Total Other Sources of Funds 81,282 78,573 92,370 86,150 87,000 86,750
Total Revenues 117,708 114,378 116,100 116,050 117,500 118,770
7100 Principal Payment 90,000 90,000 95,000 95,000 100,000 105,0007200 Interest Expense 26,905 23,575 20,300 20,250 16,680 12,9307300 Fiscal Agent Fees 803 803 800 800 820 840
Total Debt Service 117,708 114,378 116,100 116,050 117,500 118,770
TOTAL EXPENDITURES 117,708 114,378 116,100 116,050 117,500 118,770
NET CHANGE IN FUND BALANCE 0 0 0 0 0 0
Beginning Fund Balance 0 0 0 0 0 0Ending Fund Balance 0 0 0 0 0 0
83
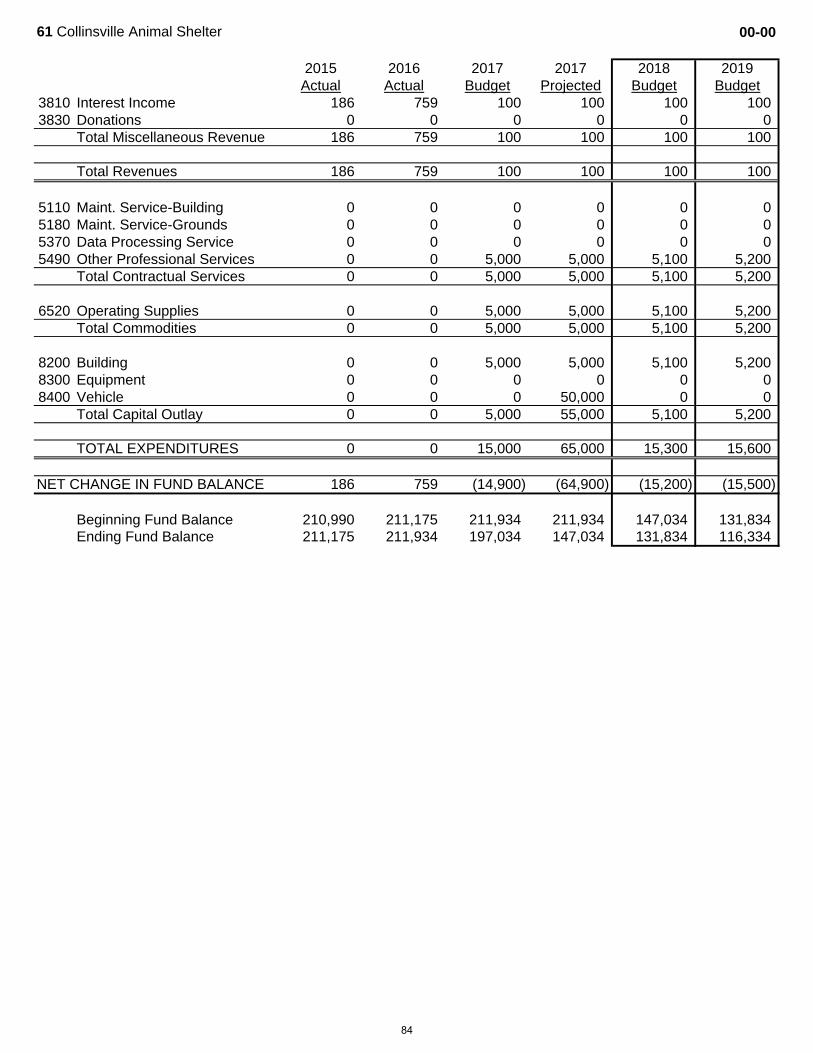
61 Collinsville Animal Shelter 00-00
2015 2016 2017 2017 2018 2019Actual Actual Budget Projected Budget Budget
3810 Interest Income 186 759 100 100 100 1003830 Donations 0 0 0 0 0 0
Total Miscellaneous Revenue 186 759 100 100 100 100
Total Revenues 186 759 100 100 100 100
5110 Maint. Service-Building 0 0 0 0 0 05180 Maint. Service-Grounds 0 0 0 0 0 05370 Data Processing Service 0 0 0 0 0 05490 Other Professional Services 0 0 5,000 5,000 5,100 5,200
Total Contractual Services 0 0 5,000 5,000 5,100 5,200
6520 Operating Supplies 0 0 5,000 5,000 5,100 5,200Total Commodities 0 0 5,000 5,000 5,100 5,200
8200 Building 0 0 5,000 5,000 5,100 5,2008300 Equipment 0 0 0 0 0 08400 Vehicle 0 0 0 50,000 0 0
Total Capital Outlay 0 0 5,000 55,000 5,100 5,200
TOTAL EXPENDITURES 0 0 15,000 65,000 15,300 15,600
NET CHANGE IN FUND BALANCE 186 759 (14,900) (64,900) (15,200) (15,500)
Beginning Fund Balance 210,990 211,175 211,934 211,934 147,034 131,834Ending Fund Balance 211,175 211,934 197,034 147,034 131,834 116,334
84

2014 2015 2016 2017 2018 2019 2020 2021 2022 2023Actual Actual Actual Projected Budget Budget Estimate Estimate Estimate Estimate
Cash Balance (Beginning) 2,281,888 2,780,921 3,862,817 4,433,260 4,738,510 3,636,420 3,436,900 1,620,130 710,320 44,050
Intergovernmental 62,144 0 0 0 0 0 0 0 0 0Charges for Service 8,665,500 8,681,389 8,795,750 8,726,890 8,986,490 9,253,850 9,529,170 9,812,680 10,104,670 10,405,380Miscellaneous 17,763 90,586 29,654 143,800 38,860 39,530 25,510 15,620 15,930 16,240
Total Revenues 8,745,407 8,771,975 8,825,403 8,870,690 9,025,350 9,293,380 9,554,680 9,828,300 10,120,600 10,421,620
Administration 51,564 63,466 63,739 66,230 72,150 73,590 75,060 76,560 78,090 79,650Water Lines 1,439,165 1,243,436 1,212,849 1,210,330 1,449,560 1,520,610 1,451,290 1,556,980 1,538,500 1,494,920Water Plant 1,352,769 1,340,955 1,612,526 7,270,820 16,969,070 1,783,890 2,813,430 2,829,030 2,865,520 2,902,990Waste Water Plant 2,067,334 2,037,352 2,190,838 2,069,270 2,351,520 2,410,530 3,335,220 2,471,710 2,524,440 2,578,490Waste Water Lines 1,202,549 866,277 944,602 1,273,600 1,206,410 1,254,690 1,226,660 1,285,290 1,239,590 1,134,560
Total Expenses 6,113,380 5,551,485 6,024,554 11,890,250 22,048,710 7,043,310 8,901,660 8,219,570 8,246,140 8,190,610
Net Revenues/(Expenses) 2,632,026 3,220,489 2,800,850 (3,019,560) (13,023,360) 2,250,070 653,020 1,608,730 1,874,460 2,231,010
Other Sources/(Uses) of Funds (2,132,993) (2,138,594) (2,230,406) 3,324,810 11,921,270 (2,449,590) (2,469,790) (2,518,540) (2,540,730) (2,557,130)
Change in Fund Balance 499,034 1,081,896 570,443 305,250 (1,102,090) (199,520) (1,816,770) (909,810) (666,270) (326,120)
Cash Balance (Ending) 2,780,921 3,862,817 4,433,260 4,738,510 3,636,420 3,436,900 1,620,130 710,320 44,050 (282,070)
percent of revenues 31.80% 44.04% 50.23% 53.42% 40.29% 36.98% 16.96% 7.23% 0.44% -2.71%
(5,000,000)
0
5,000,000
10,000,000
15,000,000
20,000,000
25,000,000
2014 2015 2016 2017 2018 2019 2020 2021 2022 2023
Water and Waste Water Fund
Total Revenues Total Expenses Cash Balance (Ending)
85
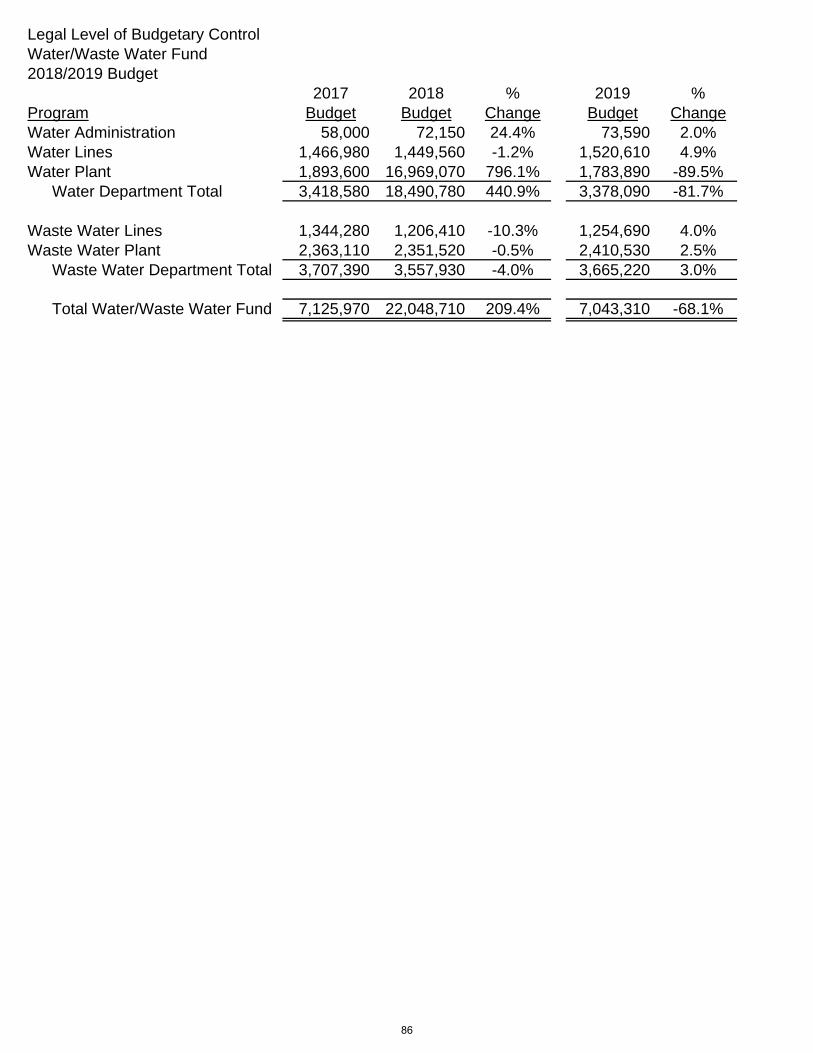
Legal Level of Budgetary ControlWater/Waste Water Fund2018/2019 Budget
2017 2018 % 2019 %Program Budget Budget Change Budget ChangeWater Administration 58,000 72,150 24.4% 73,590 2.0%Water Lines 1,466,980 1,449,560 -1.2% 1,520,610 4.9%Water Plant 1,893,600 16,969,070 796.1% 1,783,890 -89.5%
Water Department Total 3,418,580 18,490,780 440.9% 3,378,090 -81.7%
Waste Water Lines 1,344,280 1,206,410 -10.3% 1,254,690 4.0%Waste Water Plant 2,363,110 2,351,520 -0.5% 2,410,530 2.5%
Waste Water Department Total 3,707,390 3,557,930 -4.0% 3,665,220 3.0%
Total Water/Waste Water Fund 7,125,970 22,048,710 209.4% 7,043,310 -68.1%
86
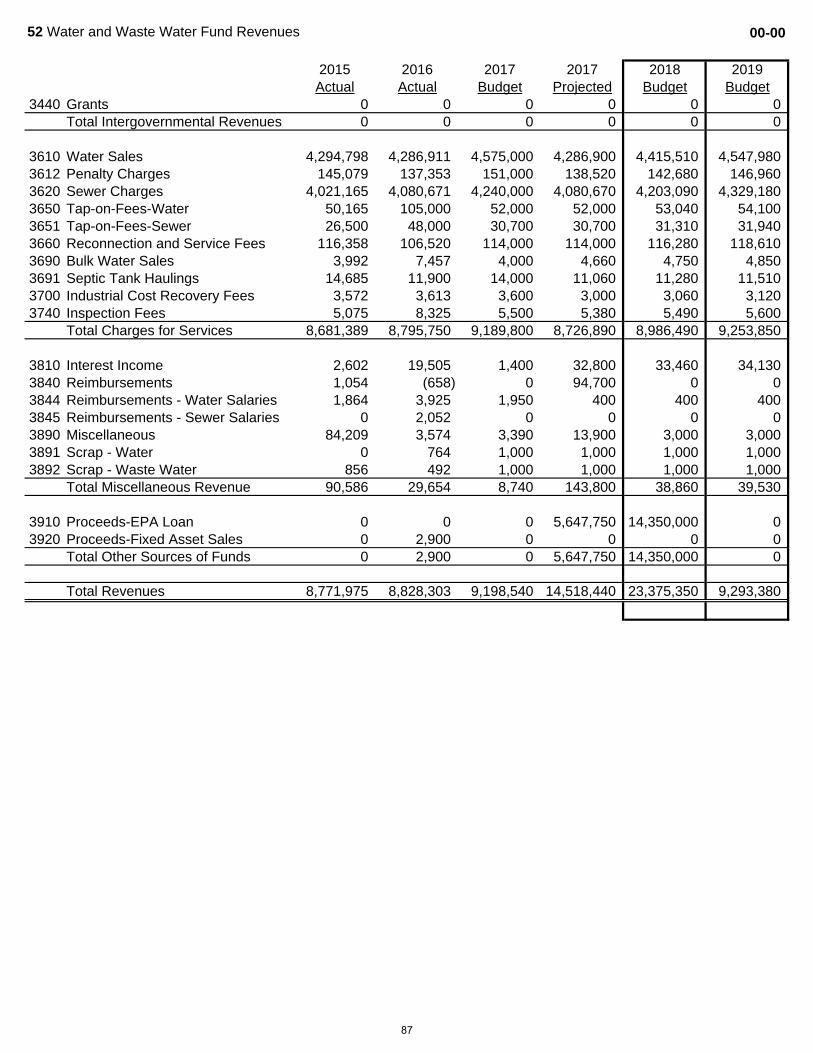
52 Water and Waste Water Fund Revenues 00-00
2015 2016 2017 2017 2018 2019Actual Actual Budget Projected Budget Budget
3440 Grants 0 0 0 0 0 0Total Intergovernmental Revenues 0 0 0 0 0 0
3610 Water Sales 4,294,798 4,286,911 4,575,000 4,286,900 4,415,510 4,547,9803612 Penalty Charges 145,079 137,353 151,000 138,520 142,680 146,9603620 Sewer Charges 4,021,165 4,080,671 4,240,000 4,080,670 4,203,090 4,329,1803650 Tap-on-Fees-Water 50,165 105,000 52,000 52,000 53,040 54,1003651 Tap-on-Fees-Sewer 26,500 48,000 30,700 30,700 31,310 31,9403660 Reconnection and Service Fees 116,358 106,520 114,000 114,000 116,280 118,6103690 Bulk Water Sales 3,992 7,457 4,000 4,660 4,750 4,8503691 Septic Tank Haulings 14,685 11,900 14,000 11,060 11,280 11,5103700 Industrial Cost Recovery Fees 3,572 3,613 3,600 3,000 3,060 3,1203740 Inspection Fees 5,075 8,325 5,500 5,380 5,490 5,600
Total Charges for Services 8,681,389 8,795,750 9,189,800 8,726,890 8,986,490 9,253,850
3810 Interest Income 2,602 19,505 1,400 32,800 33,460 34,1303840 Reimbursements 1,054 (658) 0 94,700 0 03844 Reimbursements - Water Salaries 1,864 3,925 1,950 400 400 4003845 Reimbursements - Sewer Salaries 0 2,052 0 0 0 03890 Miscellaneous 84,209 3,574 3,390 13,900 3,000 3,0003891 Scrap - Water 0 764 1,000 1,000 1,000 1,0003892 Scrap - Waste Water 856 492 1,000 1,000 1,000 1,000
Total Miscellaneous Revenue 90,586 29,654 8,740 143,800 38,860 39,530
3910 Proceeds-EPA Loan 0 0 0 5,647,750 14,350,000 03920 Proceeds-Fixed Asset Sales 0 2,900 0 0 0 0
Total Other Sources of Funds 0 2,900 0 5,647,750 14,350,000 0
Total Revenues 8,771,975 8,828,303 9,198,540 14,518,440 23,375,350 9,293,380
87

52 Water and Waste Water Fund Expenses 43-00 Administration
2015 2016 2017 2017 2018 2019Actual Actual Budget Projected Budget Budget
5490 Other Professional Services 36,868 39,506 30,000 43,230 44,090 44,9705510 Postage 25,225 20,215 25,000 20,000 25,000 25,5005540 Printing 1,373 1,904 3,000 3,000 3,060 3,120
Total Contractual Services 63,466 61,625 58,000 66,230 72,150 73,590
6510 Office Supplies 0 0 0 0 0 06520 Operating Supplies 0 12 0 0 0 0
Total Commodities 0 12 0 0 0 0
8300 Equipment 0 2,102 0 0 0 0Total Capital Outlay 0 2,102 0 0 0 0
9520 Bad Debts 4,174 7,633 0 1,100 0 09980 Contingencies 0 0 100,000 0 0 09990 Transfer Out 2,134,420 2,225,673 2,128,110 2,321,840 2,428,730 2,449,590
Total Other Uses of Funds 2,138,594 2,233,306 2,228,110 2,322,940 2,428,730 2,449,590
Total Expenses 2,202,059 2,297,046 2,286,110 2,389,170 2,500,880 2,523,180
88
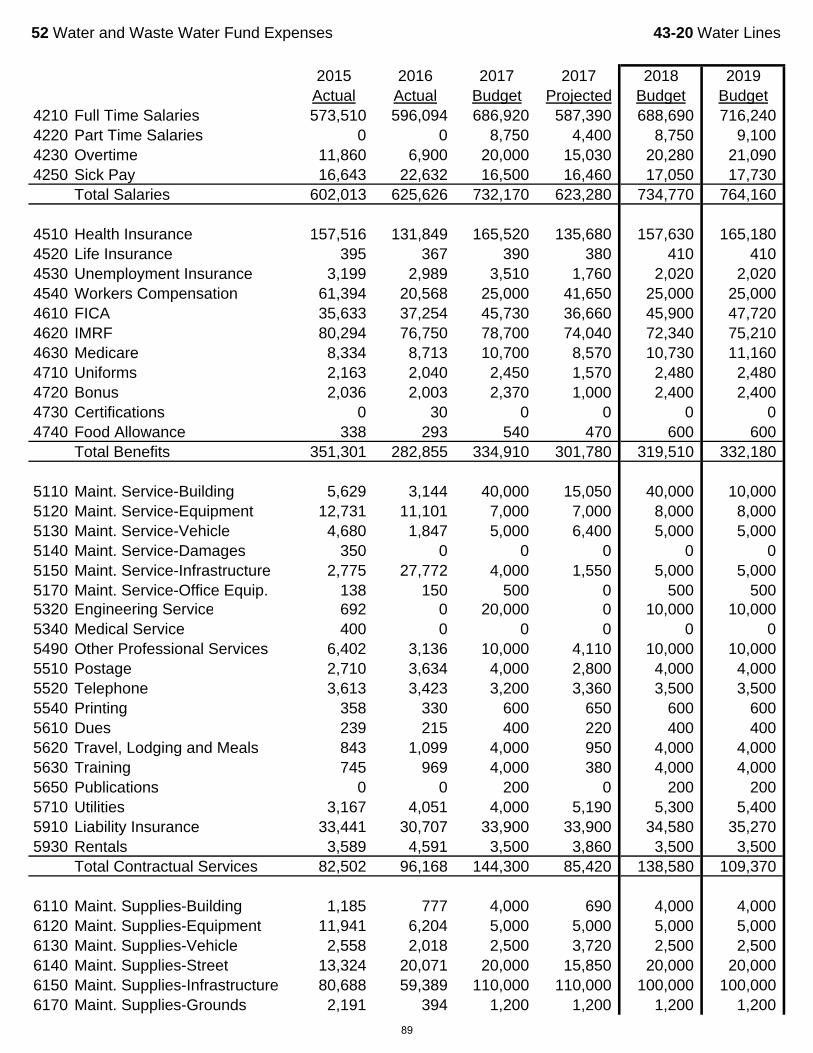
52 Water and Waste Water Fund Expenses 43-20 Water Lines
2015 2016 2017 2017 2018 2019Actual Actual Budget Projected Budget Budget
4210 Full Time Salaries 573,510 596,094 686,920 587,390 688,690 716,2404220 Part Time Salaries 0 0 8,750 4,400 8,750 9,1004230 Overtime 11,860 6,900 20,000 15,030 20,280 21,0904250 Sick Pay 16,643 22,632 16,500 16,460 17,050 17,730
Total Salaries 602,013 625,626 732,170 623,280 734,770 764,160
4510 Health Insurance 157,516 131,849 165,520 135,680 157,630 165,1804520 Life Insurance 395 367 390 380 410 4104530 Unemployment Insurance 3,199 2,989 3,510 1,760 2,020 2,0204540 Workers Compensation 61,394 20,568 25,000 41,650 25,000 25,0004610 FICA 35,633 37,254 45,730 36,660 45,900 47,7204620 IMRF 80,294 76,750 78,700 74,040 72,340 75,2104630 Medicare 8,334 8,713 10,700 8,570 10,730 11,1604710 Uniforms 2,163 2,040 2,450 1,570 2,480 2,4804720 Bonus 2,036 2,003 2,370 1,000 2,400 2,4004730 Certifications 0 30 0 0 0 04740 Food Allowance 338 293 540 470 600 600
Total Benefits 351,301 282,855 334,910 301,780 319,510 332,180
5110 Maint. Service-Building 5,629 3,144 40,000 15,050 40,000 10,0005120 Maint. Service-Equipment 12,731 11,101 7,000 7,000 8,000 8,0005130 Maint. Service-Vehicle 4,680 1,847 5,000 6,400 5,000 5,0005140 Maint. Service-Damages 350 0 0 0 0 05150 Maint. Service-Infrastructure 2,775 27,772 4,000 1,550 5,000 5,0005170 Maint. Service-Office Equip. 138 150 500 0 500 5005320 Engineering Service 692 0 20,000 0 10,000 10,0005340 Medical Service 400 0 0 0 0 05490 Other Professional Services 6,402 3,136 10,000 4,110 10,000 10,0005510 Postage 2,710 3,634 4,000 2,800 4,000 4,0005520 Telephone 3,613 3,423 3,200 3,360 3,500 3,5005540 Printing 358 330 600 650 600 6005610 Dues 239 215 400 220 400 4005620 Travel, Lodging and Meals 843 1,099 4,000 950 4,000 4,0005630 Training 745 969 4,000 380 4,000 4,0005650 Publications 0 0 200 0 200 2005710 Utilities 3,167 4,051 4,000 5,190 5,300 5,4005910 Liability Insurance 33,441 30,707 33,900 33,900 34,580 35,2705930 Rentals 3,589 4,591 3,500 3,860 3,500 3,500
Total Contractual Services 82,502 96,168 144,300 85,420 138,580 109,370
6110 Maint. Supplies-Building 1,185 777 4,000 690 4,000 4,0006120 Maint. Supplies-Equipment 11,941 6,204 5,000 5,000 5,000 5,0006130 Maint. Supplies-Vehicle 2,558 2,018 2,500 3,720 2,500 2,5006140 Maint. Supplies-Street 13,324 20,071 20,000 15,850 20,000 20,0006150 Maint. Supplies-Infrastructure 80,688 59,389 110,000 110,000 100,000 100,0006170 Maint. Supplies-Grounds 2,191 394 1,200 1,200 1,200 1,200
89
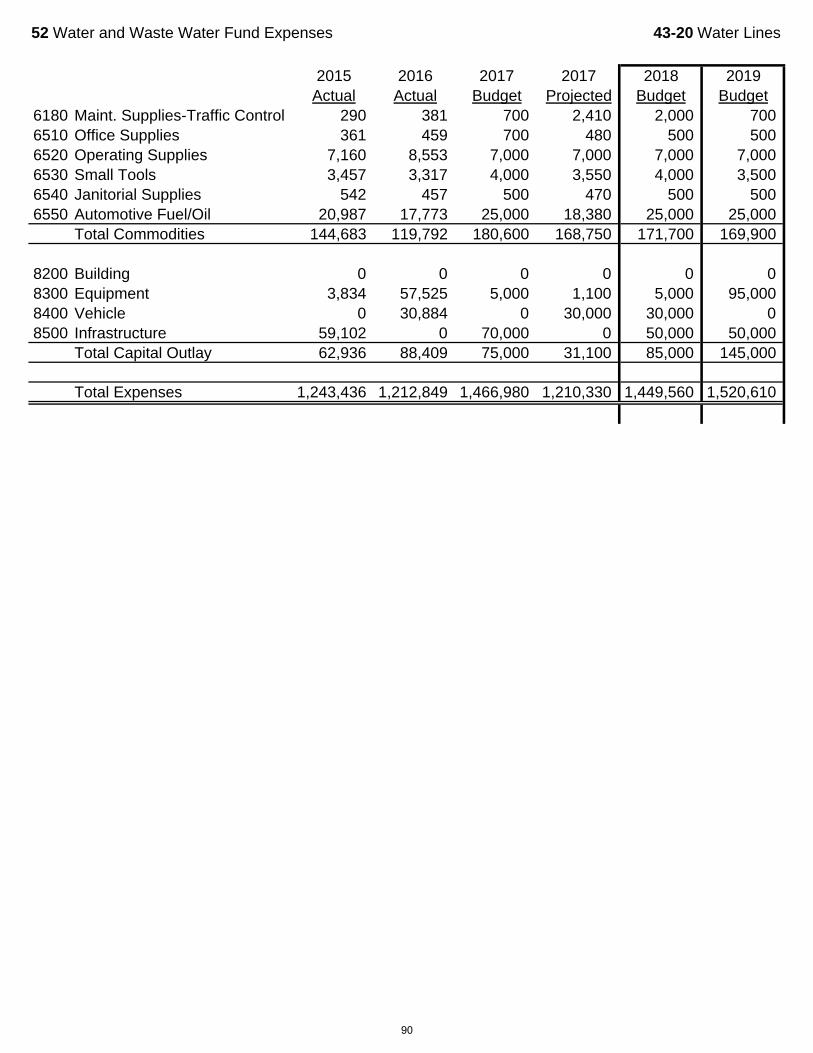
52 Water and Waste Water Fund Expenses 43-20 Water Lines
2015 2016 2017 2017 2018 2019Actual Actual Budget Projected Budget Budget
6180 Maint. Supplies-Traffic Control 290 381 700 2,410 2,000 7006510 Office Supplies 361 459 700 480 500 5006520 Operating Supplies 7,160 8,553 7,000 7,000 7,000 7,0006530 Small Tools 3,457 3,317 4,000 3,550 4,000 3,5006540 Janitorial Supplies 542 457 500 470 500 5006550 Automotive Fuel/Oil 20,987 17,773 25,000 18,380 25,000 25,000
Total Commodities 144,683 119,792 180,600 168,750 171,700 169,900
8200 Building 0 0 0 0 0 08300 Equipment 3,834 57,525 5,000 1,100 5,000 95,0008400 Vehicle 0 30,884 0 30,000 30,000 08500 Infrastructure 59,102 0 70,000 0 50,000 50,000
Total Capital Outlay 62,936 88,409 75,000 31,100 85,000 145,000
Total Expenses 1,243,436 1,212,849 1,466,980 1,210,330 1,449,560 1,520,610
90

52 Water and Waste Water Fund Expenses 43-30 Water Plant
2015 2016 2017 2017 2018 2019Actual Actual Budget Projected Budget Budget
4210 Full Time Salaries 483,759 515,703 501,380 500,880 524,870 545,8704220 Part Time Salaries 4,147 190 8,750 0 8,750 8,9304230 Overtime 62,674 58,209 50,000 76,680 60,000 50,0004250 Sick Pay 11,359 10,631 15,380 15,380 16,220 16,8704260 Shift Differential 3,313 3,347 3,330 3,330 3,330 3,3304280 Holiday 4,327 3,315 17,660 3,590 17,510 18,210
Total Salaries 569,579 591,393 596,500 599,860 630,680 643,210
4510 Health Insurance 105,748 111,797 118,720 112,250 135,110 141,8704520 Life Insurance 249 236 270 240 240 2904530 Unemployment Insurance 2,254 2,153 2,490 1,500 1,460 1,4604540 Workers Compensation 0 0 25,000 0 25,000 25,0004610 FICA 34,018 35,264 37,180 35,870 38,650 40,1804620 IMRF 58,809 58,905 63,820 57,220 60,780 63,1804630 Medicare 7,956 8,247 8,700 8,390 9,040 9,4004710 Uniforms 1,260 1,217 1,610 1,500 1,640 1,6404720 Bonus 1,379 1,456 1,620 1,500 1,650 1,6504730 Certifications 300 200 0 100 0 04740 Food Allowance 38 8 90 10 90 90
Total Benefits 212,010 219,482 259,500 218,580 273,660 284,760
5110 Maint. Service-Building 469 910 3,000 1,340 3,000 3,0005120 Maint. Service-Equipment 13,666 13,990 23,000 13,030 20,000 20,0005130 Maint. Service-Vehicle 4,120 807 500 0 500 5005150 Maint. Service-Infrastructure 49,578 74,831 88,000 46,680 88,000 88,0005170 Maint. Service-Office Equip. 686 1,344 1,300 910 1,300 1,3005320 Engineering Service 40,293 35,831 175,000 144,000 315,000 80,0005490 Other Professional Services 16,810 53,052 35,000 11,610 35,000 35,0005510 Postage 85 83 500 50 500 5005520 Telephone 8,587 9,941 7,000 10,850 10,850 10,8505530 Publishing 481 1,202 0 0 0 05540 Printing 60 186 150 150 200 2005610 Dues 419 235 750 530 750 7705620 Travel, Lodging and Meals 352 278 1,500 470 1,500 1,5005630 Training 291 997 1,500 780 1,500 1,5005650 Publications 0 0 200 0 200 2005710 Utilities 139,010 153,707 200,000 169,600 225,000 200,0005730 Sludge Disposal 0 0 90,000 0 90,000 90,0005910 Liability Insurance 36,195 33,236 31,800 33,830 35,520 37,3005930 Rentals 2,742 2,621 2,500 2,500 2,500 2,550
Total Contractual Services 313,846 383,249 661,700 436,330 831,320 573,170
6110 Maint. Supplies-Building 121 354 1,500 740 1,500 1,5006120 Maint. Supplies-Equipment 10,923 17,743 15,000 7,930 15,000 15,0006130 Maint. Supplies-Vehicle 37 159 200 40 200 2006150 Maint. Supplies-Infrastructure 535 33 7,200 400 7,200 7,340
91
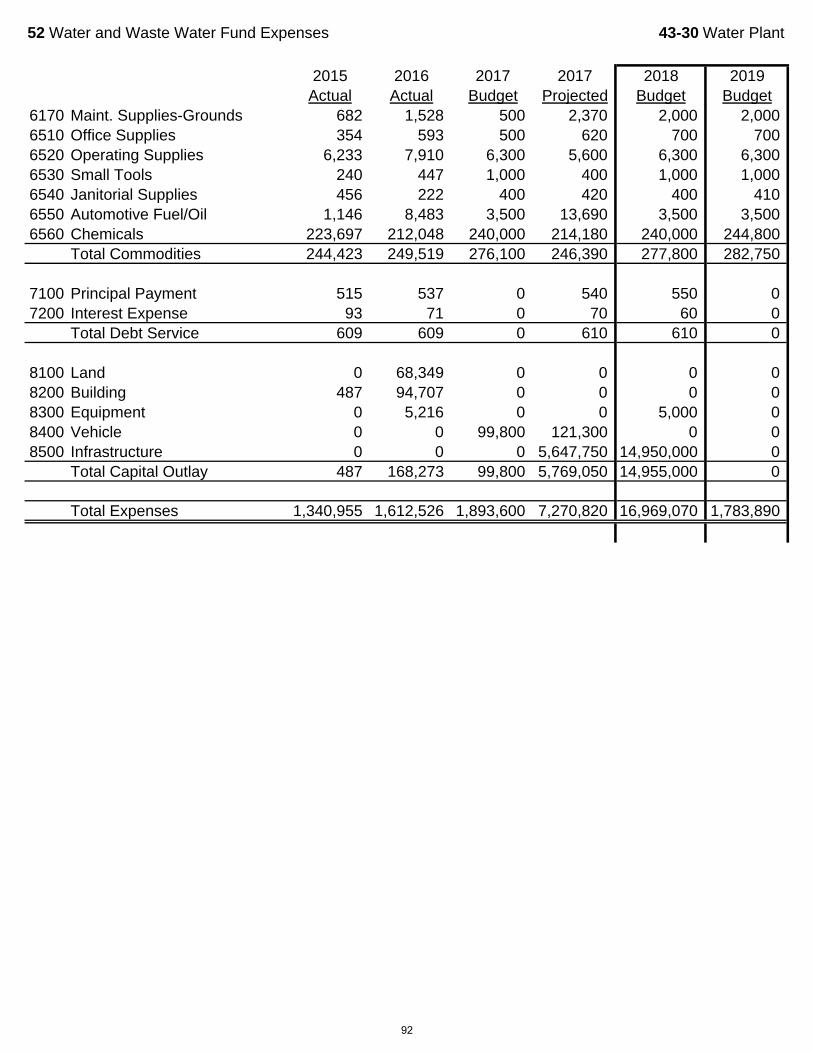
52 Water and Waste Water Fund Expenses 43-30 Water Plant
2015 2016 2017 2017 2018 2019Actual Actual Budget Projected Budget Budget
6170 Maint. Supplies-Grounds 682 1,528 500 2,370 2,000 2,0006510 Office Supplies 354 593 500 620 700 7006520 Operating Supplies 6,233 7,910 6,300 5,600 6,300 6,3006530 Small Tools 240 447 1,000 400 1,000 1,0006540 Janitorial Supplies 456 222 400 420 400 4106550 Automotive Fuel/Oil 1,146 8,483 3,500 13,690 3,500 3,5006560 Chemicals 223,697 212,048 240,000 214,180 240,000 244,800
Total Commodities 244,423 249,519 276,100 246,390 277,800 282,750
7100 Principal Payment 515 537 0 540 550 07200 Interest Expense 93 71 0 70 60 0
Total Debt Service 609 609 0 610 610 0
8100 Land 0 68,349 0 0 0 08200 Building 487 94,707 0 0 0 08300 Equipment 0 5,216 0 0 5,000 08400 Vehicle 0 0 99,800 121,300 0 08500 Infrastructure 0 0 0 5,647,750 14,950,000 0
Total Capital Outlay 487 168,273 99,800 5,769,050 14,955,000 0
Total Expenses 1,340,955 1,612,526 1,893,600 7,270,820 16,969,070 1,783,890
92
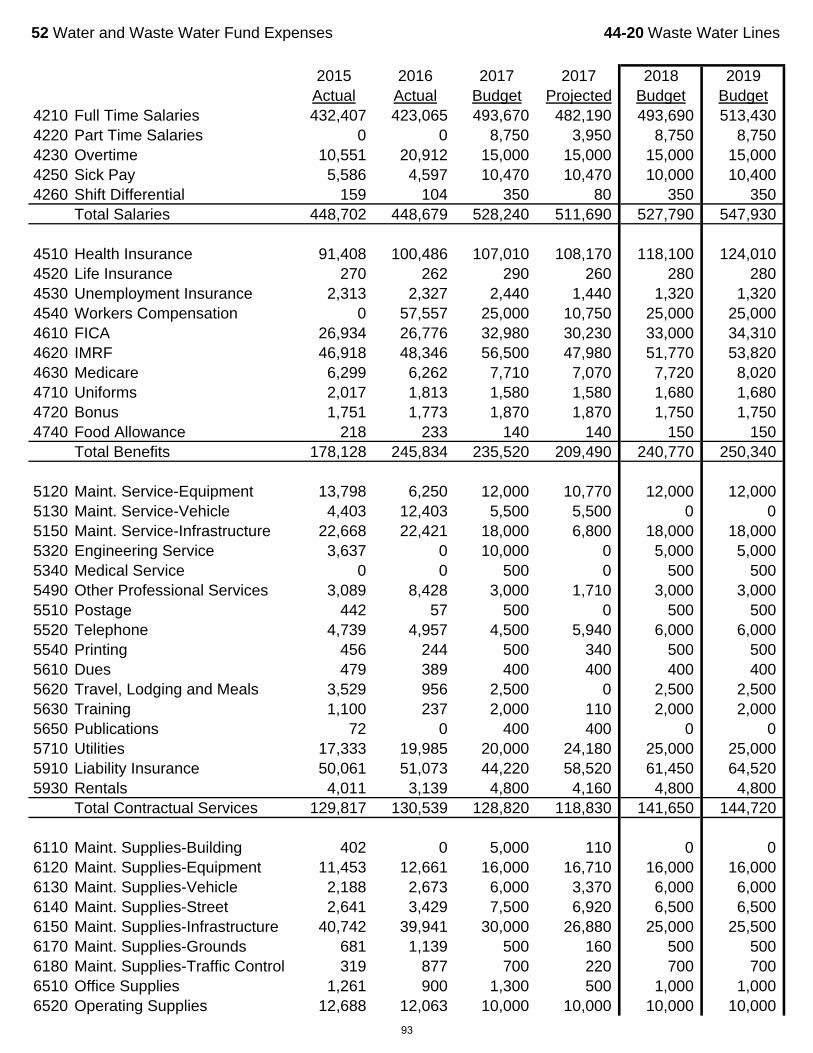
52 Water and Waste Water Fund Expenses 44-20 Waste Water Lines
2015 2016 2017 2017 2018 2019Actual Actual Budget Projected Budget Budget
4210 Full Time Salaries 432,407 423,065 493,670 482,190 493,690 513,4304220 Part Time Salaries 0 0 8,750 3,950 8,750 8,7504230 Overtime 10,551 20,912 15,000 15,000 15,000 15,0004250 Sick Pay 5,586 4,597 10,470 10,470 10,000 10,4004260 Shift Differential 159 104 350 80 350 350
Total Salaries 448,702 448,679 528,240 511,690 527,790 547,930
4510 Health Insurance 91,408 100,486 107,010 108,170 118,100 124,0104520 Life Insurance 270 262 290 260 280 2804530 Unemployment Insurance 2,313 2,327 2,440 1,440 1,320 1,3204540 Workers Compensation 0 57,557 25,000 10,750 25,000 25,0004610 FICA 26,934 26,776 32,980 30,230 33,000 34,3104620 IMRF 46,918 48,346 56,500 47,980 51,770 53,8204630 Medicare 6,299 6,262 7,710 7,070 7,720 8,0204710 Uniforms 2,017 1,813 1,580 1,580 1,680 1,6804720 Bonus 1,751 1,773 1,870 1,870 1,750 1,7504740 Food Allowance 218 233 140 140 150 150
Total Benefits 178,128 245,834 235,520 209,490 240,770 250,340
5120 Maint. Service-Equipment 13,798 6,250 12,000 10,770 12,000 12,0005130 Maint. Service-Vehicle 4,403 12,403 5,500 5,500 0 05150 Maint. Service-Infrastructure 22,668 22,421 18,000 6,800 18,000 18,0005320 Engineering Service 3,637 0 10,000 0 5,000 5,0005340 Medical Service 0 0 500 0 500 5005490 Other Professional Services 3,089 8,428 3,000 1,710 3,000 3,0005510 Postage 442 57 500 0 500 5005520 Telephone 4,739 4,957 4,500 5,940 6,000 6,0005540 Printing 456 244 500 340 500 5005610 Dues 479 389 400 400 400 4005620 Travel, Lodging and Meals 3,529 956 2,500 0 2,500 2,5005630 Training 1,100 237 2,000 110 2,000 2,0005650 Publications 72 0 400 400 0 05710 Utilities 17,333 19,985 20,000 24,180 25,000 25,0005910 Liability Insurance 50,061 51,073 44,220 58,520 61,450 64,5205930 Rentals 4,011 3,139 4,800 4,160 4,800 4,800
Total Contractual Services 129,817 130,539 128,820 118,830 141,650 144,720
6110 Maint. Supplies-Building 402 0 5,000 110 0 06120 Maint. Supplies-Equipment 11,453 12,661 16,000 16,710 16,000 16,0006130 Maint. Supplies-Vehicle 2,188 2,673 6,000 3,370 6,000 6,0006140 Maint. Supplies-Street 2,641 3,429 7,500 6,920 6,500 6,5006150 Maint. Supplies-Infrastructure 40,742 39,941 30,000 26,880 25,000 25,5006170 Maint. Supplies-Grounds 681 1,139 500 160 500 5006180 Maint. Supplies-Traffic Control 319 877 700 220 700 7006510 Office Supplies 1,261 900 1,300 500 1,000 1,0006520 Operating Supplies 12,688 12,063 10,000 10,000 10,000 10,000
93
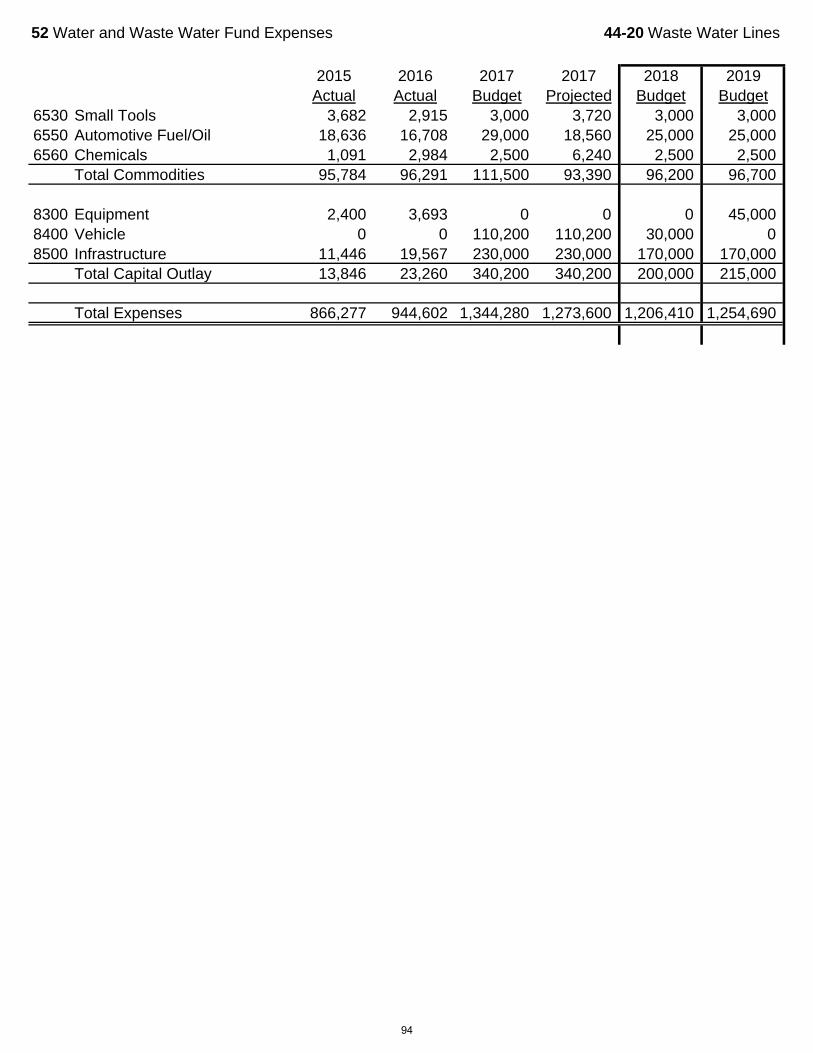
52 Water and Waste Water Fund Expenses 44-20 Waste Water Lines
2015 2016 2017 2017 2018 2019Actual Actual Budget Projected Budget Budget
6530 Small Tools 3,682 2,915 3,000 3,720 3,000 3,0006550 Automotive Fuel/Oil 18,636 16,708 29,000 18,560 25,000 25,0006560 Chemicals 1,091 2,984 2,500 6,240 2,500 2,500
Total Commodities 95,784 96,291 111,500 93,390 96,200 96,700
8300 Equipment 2,400 3,693 0 0 0 45,0008400 Vehicle 0 0 110,200 110,200 30,000 08500 Infrastructure 11,446 19,567 230,000 230,000 170,000 170,000
Total Capital Outlay 13,846 23,260 340,200 340,200 200,000 215,000
Total Expenses 866,277 944,602 1,344,280 1,273,600 1,206,410 1,254,690
94
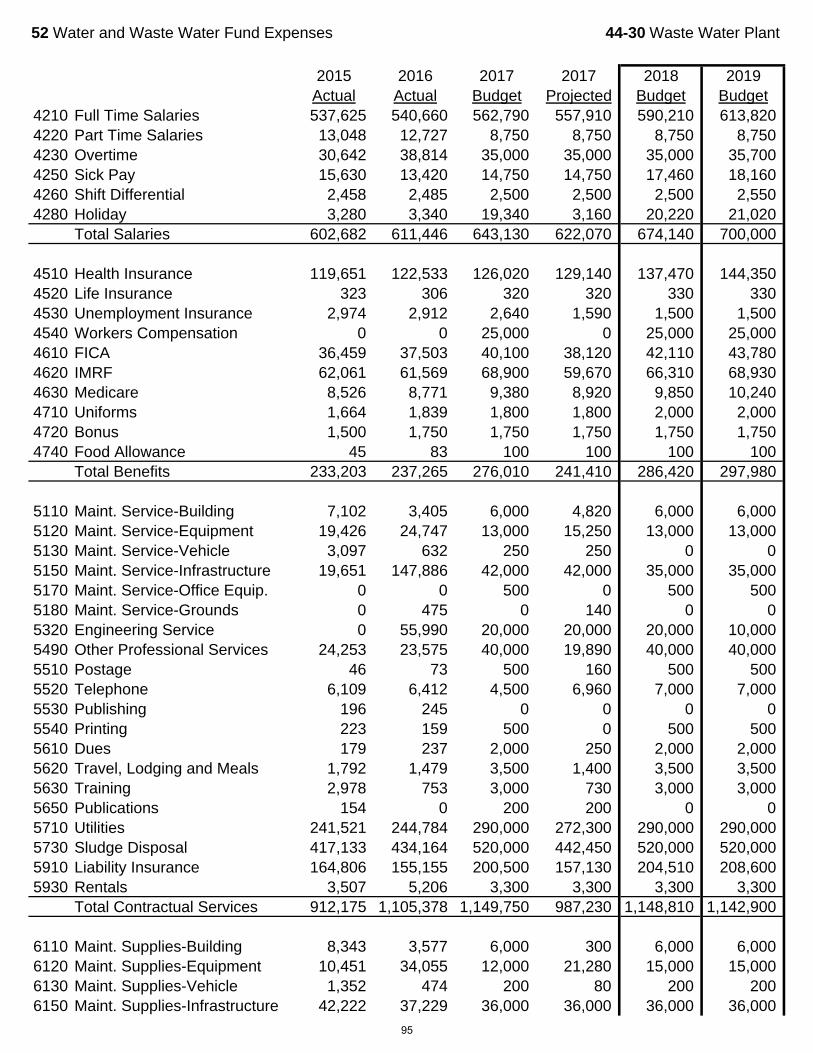
52 Water and Waste Water Fund Expenses 44-30 Waste Water Plant
2015 2016 2017 2017 2018 2019Actual Actual Budget Projected Budget Budget
4210 Full Time Salaries 537,625 540,660 562,790 557,910 590,210 613,8204220 Part Time Salaries 13,048 12,727 8,750 8,750 8,750 8,7504230 Overtime 30,642 38,814 35,000 35,000 35,000 35,7004250 Sick Pay 15,630 13,420 14,750 14,750 17,460 18,1604260 Shift Differential 2,458 2,485 2,500 2,500 2,500 2,5504280 Holiday 3,280 3,340 19,340 3,160 20,220 21,020
Total Salaries 602,682 611,446 643,130 622,070 674,140 700,000
4510 Health Insurance 119,651 122,533 126,020 129,140 137,470 144,3504520 Life Insurance 323 306 320 320 330 3304530 Unemployment Insurance 2,974 2,912 2,640 1,590 1,500 1,5004540 Workers Compensation 0 0 25,000 0 25,000 25,0004610 FICA 36,459 37,503 40,100 38,120 42,110 43,7804620 IMRF 62,061 61,569 68,900 59,670 66,310 68,9304630 Medicare 8,526 8,771 9,380 8,920 9,850 10,2404710 Uniforms 1,664 1,839 1,800 1,800 2,000 2,0004720 Bonus 1,500 1,750 1,750 1,750 1,750 1,7504740 Food Allowance 45 83 100 100 100 100
Total Benefits 233,203 237,265 276,010 241,410 286,420 297,980
5110 Maint. Service-Building 7,102 3,405 6,000 4,820 6,000 6,0005120 Maint. Service-Equipment 19,426 24,747 13,000 15,250 13,000 13,0005130 Maint. Service-Vehicle 3,097 632 250 250 0 05150 Maint. Service-Infrastructure 19,651 147,886 42,000 42,000 35,000 35,0005170 Maint. Service-Office Equip. 0 0 500 0 500 5005180 Maint. Service-Grounds 0 475 0 140 0 05320 Engineering Service 0 55,990 20,000 20,000 20,000 10,0005490 Other Professional Services 24,253 23,575 40,000 19,890 40,000 40,0005510 Postage 46 73 500 160 500 5005520 Telephone 6,109 6,412 4,500 6,960 7,000 7,0005530 Publishing 196 245 0 0 0 05540 Printing 223 159 500 0 500 5005610 Dues 179 237 2,000 250 2,000 2,0005620 Travel, Lodging and Meals 1,792 1,479 3,500 1,400 3,500 3,5005630 Training 2,978 753 3,000 730 3,000 3,0005650 Publications 154 0 200 200 0 05710 Utilities 241,521 244,784 290,000 272,300 290,000 290,0005730 Sludge Disposal 417,133 434,164 520,000 442,450 520,000 520,0005910 Liability Insurance 164,806 155,155 200,500 157,130 204,510 208,6005930 Rentals 3,507 5,206 3,300 3,300 3,300 3,300
Total Contractual Services 912,175 1,105,378 1,149,750 987,230 1,148,810 1,142,900
6110 Maint. Supplies-Building 8,343 3,577 6,000 300 6,000 6,0006120 Maint. Supplies-Equipment 10,451 34,055 12,000 21,280 15,000 15,0006130 Maint. Supplies-Vehicle 1,352 474 200 80 200 2006150 Maint. Supplies-Infrastructure 42,222 37,229 36,000 36,000 36,000 36,000
95
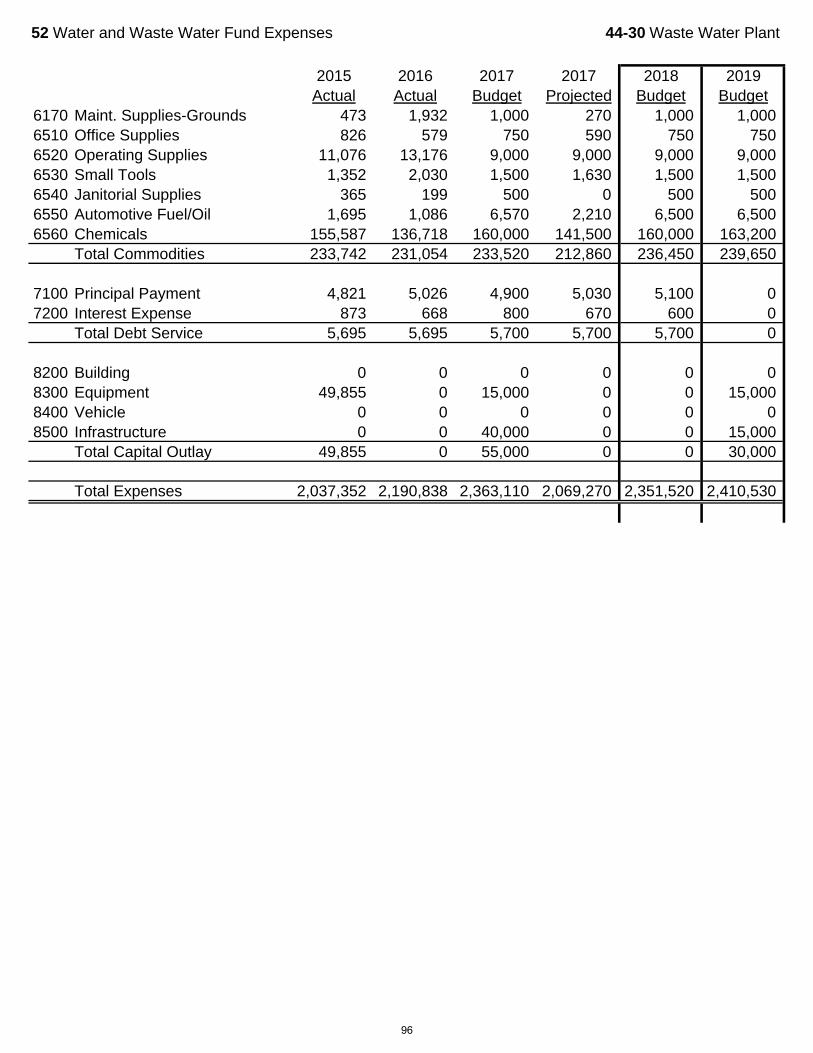
52 Water and Waste Water Fund Expenses 44-30 Waste Water Plant
2015 2016 2017 2017 2018 2019Actual Actual Budget Projected Budget Budget
6170 Maint. Supplies-Grounds 473 1,932 1,000 270 1,000 1,0006510 Office Supplies 826 579 750 590 750 7506520 Operating Supplies 11,076 13,176 9,000 9,000 9,000 9,0006530 Small Tools 1,352 2,030 1,500 1,630 1,500 1,5006540 Janitorial Supplies 365 199 500 0 500 5006550 Automotive Fuel/Oil 1,695 1,086 6,570 2,210 6,500 6,5006560 Chemicals 155,587 136,718 160,000 141,500 160,000 163,200
Total Commodities 233,742 231,054 233,520 212,860 236,450 239,650
7100 Principal Payment 4,821 5,026 4,900 5,030 5,100 07200 Interest Expense 873 668 800 670 600 0
Total Debt Service 5,695 5,695 5,700 5,700 5,700 0
8200 Building 0 0 0 0 0 08300 Equipment 49,855 0 15,000 0 0 15,0008400 Vehicle 0 0 0 0 0 08500 Infrastructure 0 0 40,000 0 0 15,000
Total Capital Outlay 49,855 0 55,000 0 0 30,000
Total Expenses 2,037,352 2,190,838 2,363,110 2,069,270 2,351,520 2,410,530
96

53 Project Fund 00-00
2015 2016 2017 2017 2018 2019Actual Actual Budget Projected Budget Budget
3810 Interest Income 33 106 0 80 0 0Total Miscellaneous Revenue 33 106 0 80 0 0
3910 Proceeds-Bond Sales 0 0 0 0 0 0Total Other Sources of Funds 0 0 0 0 0 0
Total Revenues 33 106 0 80 0 0
5320 Engineering Service 0 57,810 0 0 0 0Total Contractual Services 0 57,810 0 0 0 0
6150 Maint. Supplies-Infrastructure 0 6,301 0 0 0 0Total Commodities 0 6,301 0 0 0 0
8500 Infrastructure 0 0 0 0 15,400 0Total Capital Outlay 0 0 0 0 15,400 0
TOTAL EXPENDITURES 0 64,111 0 0 15,400 0
NET CHANGE IN FUND BALANCE 33 (64,005) 0 80 (15,400) 0
Beginning Fund Balance 79,293 79,325 15,320 15,320 15,400 (0)Ending Fund Balance 79,325 15,320 15,320 15,400 (0) (0)
97
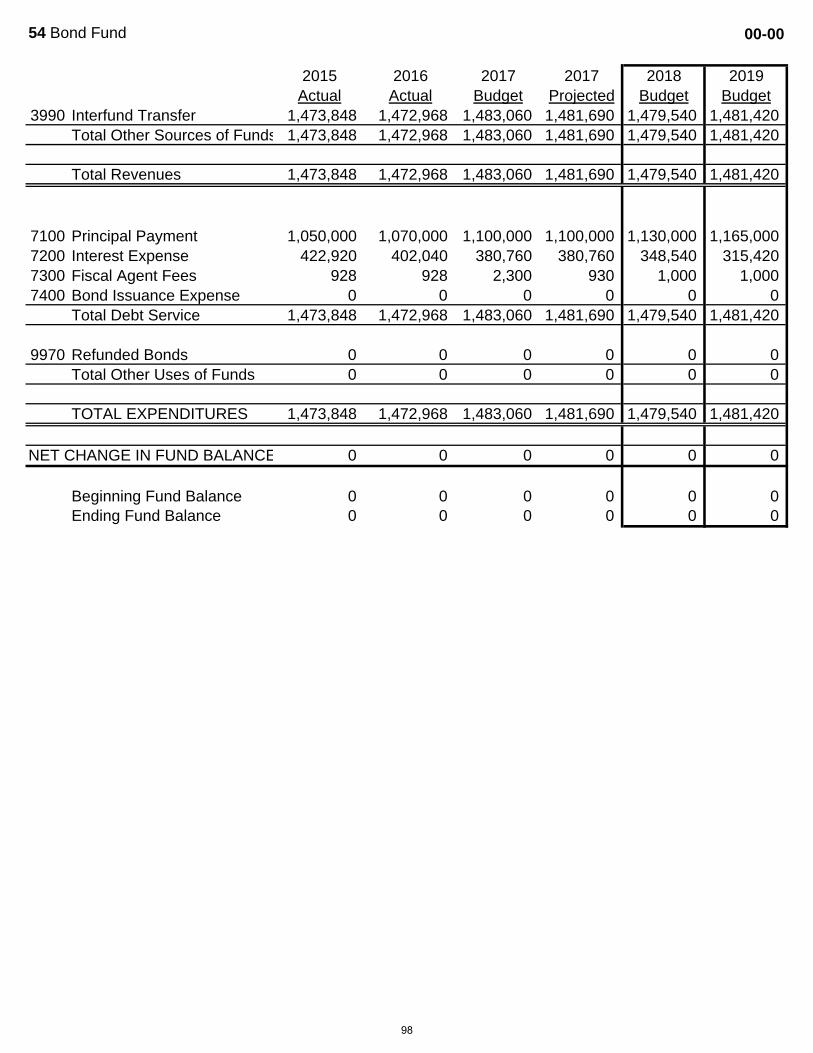
54 Bond Fund 00-00
2015 2016 2017 2017 2018 2019Actual Actual Budget Projected Budget Budget
3990 Interfund Transfer 1,473,848 1,472,968 1,483,060 1,481,690 1,479,540 1,481,420Total Other Sources of Funds 1,473,848 1,472,968 1,483,060 1,481,690 1,479,540 1,481,420
Total Revenues 1,473,848 1,472,968 1,483,060 1,481,690 1,479,540 1,481,420
7100 Principal Payment 1,050,000 1,070,000 1,100,000 1,100,000 1,130,000 1,165,0007200 Interest Expense 422,920 402,040 380,760 380,760 348,540 315,4207300 Fiscal Agent Fees 928 928 2,300 930 1,000 1,0007400 Bond Issuance Expense 0 0 0 0 0 0
Total Debt Service 1,473,848 1,472,968 1,483,060 1,481,690 1,479,540 1,481,420
9970 Refunded Bonds 0 0 0 0 0 0Total Other Uses of Funds 0 0 0 0 0 0
TOTAL EXPENDITURES 1,473,848 1,472,968 1,483,060 1,481,690 1,479,540 1,481,420
NET CHANGE IN FUND BALANCE 0 0 0 0 0 0
Beginning Fund Balance 0 0 0 0 0 0Ending Fund Balance 0 0 0 0 0 0
98


