96
C. Linn Gould, MS, MPH Erda Environmental Services, Inc. [email protected] The Physical Environment & Population Health HSERV 534 May 18, 2006
| Date post: | 17-Dec-2015 |
| Category: |
Documents |
| Upload: | gervais-jenkins |
| View: | 214 times |
| Download: | 0 times |

C. Linn Gould, MS, MPH
Erda Environmental Services, Inc.
The Physical Environment& Population Health
HSERV 534May 18, 2006

Agree or Disagree
The physical environment does not have much to do with population health
compared to other factors like income inequality or poverty.

What Stephen asked me to do
1. Is there an independent effect of the physical environment that can be demonstrated over and above the ideas of relative poverty?
2. What is there in the science or facts that the physical environment is a critical factor?

Argument for today
Environmental (in)equality is an important determinant of health

Objectives
1. Explore environment definition
2. Environmental racism/(in)justice and health
3. Where is the evidence?
4. Income inequality, the environment, and population health
5. Discussion

How define environment?

Everything
Minus genetic
Minus behavior
Minus social
Minus natural
Physical, chemical, biological agents
Adapted from Smith et al, 1999
Different Definitions of Environment

Actual Causes of Death
our “health …is determined by factors acting not … in isolation but by our experience where domains interconnect.”
40%Behavior
15% Social
circum-stances
10% Medical
30% Genetics
5% Environment
Adapted from McGinnis et al. 2002

Environment definitions
“The interplay between ecological (biological), physical (natural and built), social, political,
aesthetic, and economic environments.” (IOM, 2001)
The environment includes the chemical, physical, and biological agents to which we are exposed in
our regular everyday surroundings, but also lifestyle choices, socioeconomic status, poverty,
diet and nutrition, and behavior(NIH from: EPA, Building Healthy Environments to Eliminate Health Disparities
Symposium, 2003)

Poverty/SES
EnvironmentHealthQuality
Environment defined as:•Ambient and indoor air•Water quality•Noise•Residential crowding•Housing•Education•Work•Neighborhood conditions
Evans & Kantrowitz, 2002
Causal Pathway Between Socioeconomic Status and Health Through Environmental Risk Exposure

What is environmental (in)justice (EJ)?
Can you give some examples?

Toxic residues exported from developed countries to developing countries OR to our own people (garbage, mercury, pesticides, etc)
“Toxic Terrorism”

Niger River Delta Oil discovered 1958
Nigeria

Contamination from Explosion
Flares - 28 million cubic meters per day Oil contaminated water

Polluted SwampsOn Niger Delta

Hung for protesting against Shell
Ken Saro-Wiwa
• Ogoni people deprived of economic prosperity of own lands
• Poverty one of highest in Nigeria. No electricity, piped water, health care, schools limited
• Sick people from oil contamination. Life expectancy drops to 6 years less than national average.
• Structural adjustment – oil produces $20 billion annually

Global Climate Change and Population Health
• Increased heat related morbidity and mortality• More frequent and intensified weather disasters
(Hurricane Katrina)• Increases in geographic range and incidence of
vector borne diseases• Climactically related production of photochemical
air pollutants, pollens, and spores• Environmental refugees?
Tong el al, 2002

EJ issues in Washington State

Duwamish industrial corridor today

What Duwamish would look like if not filled in

Contaminated fish consumption

EJ vs. Mainstream Environmental Movement - social agenda
• Social determinants of health orientation – exposure to pollution is rooted in disparities caused by societal structure
• Social justice demands – clean jobs, sustainable economy, safe and affordable housing, racial justice (Cole & Foster, 2001) Cherry Cayabyab, LELO

EJ Movement Recognition – Social factors increases susceptibility to disease
• Poor nutrition
• Socioeconomic stress
• Insufficient access to health care
• Lack of affordable and/or safe housing
• Lack of community cohesion
• Limited control at work
• Co-exposure to other pollutants

EJ environment defined differently:
• Includes home, workplace, community in addition to toxic assaults
• “A community’s perception is its reality” (Bullard, 1994)
• Health impacts can be psychosocial – If water/air perceived to be contaminated, lifestyle is affected (Edelstein, 2002)

Pyschosocial Impacts on Health
• Noise, odors, traffic, etc• Loss of control of physical and social
environment• Distrust and stress if no participation in
decision making• If environment perceived to be contaminated,
life style behavior changes (bathing, gardening, cooking, diet, cleaning)
Edelstein, 2002

EJ movement redefines environmentalism
“It basically says that the environment is everything:
where we live, work, play, go to school, as well as the
physical and natural world. And so we can’t separate the
physical environment from the cultural environment.”
Robert Bullard, 1999

Housing(affordable, safe, etc)
Individual factors(diet, smoking, alcohol, genetics)
Political, Economic, Social, and Cultural/Spiritual Context to EJ
Health care access Sustainable economy
Stress
Transportation
Natural world(green space)Contamination
(air, water, food, soils, etc)
Activities(work, play, church, culturalpractices, etc.)
Crime

Environmentalhazards
Adverse healtheffect
(low cumulativedoses)
?Pollutionexposure
(air, water, soil)
Where is the evidence???????
Gould, 2005

Environmentalhazards
PollutionExposure
(air, water, soil)
The Evidence:US GAO, 1983: African Americans make up majority of population where landfills are located.United Church of Christ, 1987: Minority and low income communities are afflicted with disproportionate amount of country’s pollution.EPA, 1992: same as aboveNational Law Journal, 1992: Unequal enforcement in minority communities across nation - “Proof” that least power receives inadequate protection.Lopez, 2002: Increased segregation associated with increaseddisparity in potential exposure to air pollutionMorello-Frosch et al, 2002: Communities of color bear a disproportionate burden in location of treatment, storage, and disposal facilities and Toxic Release Inventory FacilitiesAND MANY MANY MORE Gould, 2005

Pollution Exposure(industrial facilities,
transportation corridors)
Adverse healtheffect
(premature death, chronic disease)
?
Burden of proof placed on the exposed.Why hasn’t the research been done?Institutional discrimination? Classist?
Where is the evidence?

Lack of evidence – racist?
“Those scholars who attempt to isolate economics from racism as causal factors in
explaining environmental inequity are missing the point. In fact, such efforts to
tease out, for analytical purposes, the effects of these discrete variables on
pollution impacts can itself be seen as a form of racism” (Clarke and Gerlak, 1998)

The evidence: plethora of conceptual models
being introduced
Poverty/SES
PhysicalEnvironment
HealthQuality
Evans & Kantrowitz, 2002

Geography of
Exposure
Geographyof
Risk
Geographyof
Susceptibility
Jerrett & Finkelstein, 2005
Analytic Framework: Geographies of Susceptibility, Exposure, and Risk

“Double Jeopardy”
High frequency and magnitude
of multiple contaminant
exposure
+
Psycho-social Stressors:Poverty,Material
deprivation,Lack of services
=Health
Disparities(Birth
outcomes)
Morello-Frosch & Shenassa, 2006

Socioeconomic position Race/ethnicity/sex
Differential vulnerability-Existing medical conditions-Genetic susceptibility-Access to health care-Access to fresh foods-Violence/stress
Differential exposuresWork: low-wage job, occupational exposuresNeighborhoods: outdoor pollutantsHousing: crowding, allergens, indoor pollutants
Unequal health outcomes
Potential Pathways for Socioeconomic Position to Increase Susceptibility and Exposure
O’Neill et al, 2003

• Natural disasters such as “London Fog” – thousands of deaths in 1952
• Particulates in smoke associated with and pulmonary morbidity and CHD
• 1996 Atlanta Olympic games – no cars allowed in city – 42% reduction in asthma claims reported to Medicaid
Brown et al, 2003
Air Pollution Asthma
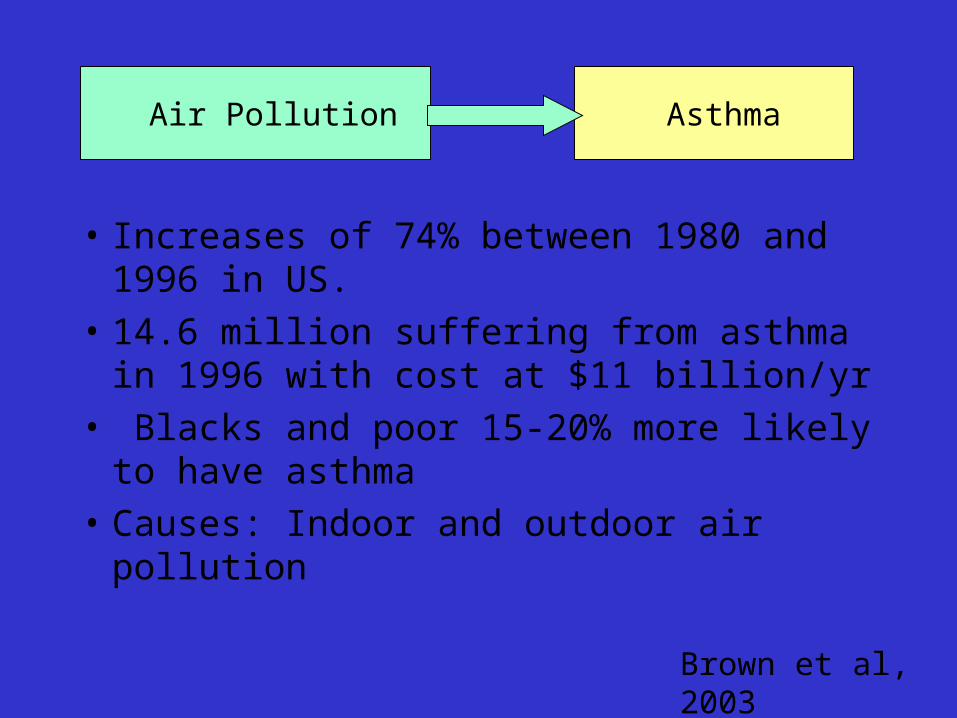
• Increases of 74% between 1980 and 1996 in US.
• 14.6 million suffering from asthma in 1996 with cost at $11 billion/yr
• Blacks and poor 15-20% more likely to have asthma
• Causes: Indoor and outdoor air pollution
Brown et al, 2003
Air Pollution Asthma

The Evidence:Social ecology and child vulnerability to
environmental pollutants (Weiss & Bellinger, 2006) • Exposure to neurotoxic chemicals in early life,
even prenatal environment creates permanent changes in brain structure and chemistry and behavior
• Early social environment variables (neighborhood and community characteristics) need to be accounted for – SES is not enough
• Traditional approaches need to be revised.

The Evidence:Pre-term births: social environment and
physical environment interactions(Ponce et al 2006)
• Adverse social environment (concentrated poverty, unemployment, dependence on public assistance)
• Adverse physical environment (winter thermal inversions trapping traffic related air pollutants)
• Pre-term births higher in low SES neighborhoods

A Former Metal Stamping Plant
Brownfields in Baltimore, Maryland (Litt et al, 2002)
The rail industry
Brownfields Excess mortality

Population Characteristics
Percent Minority *by Census Block Group
Home-Owner OccupancyPercent BelowPoverty
0 - 19 percent20 -50 percent51 - 82 percent83 - 100 percent
0 - 22 percent23 - 44 percent45 - 64 percent65 - 88 percent
0 - 19 percent20 -39 percent40 - 59 percent60 percent and higher
Source: Litt et al,, Environ Health Perspect 110(suppl2):183-193 (2002)

Less than High School Degree
Population Characteristics
Working Class
21 - 46 percent47 - 66 percent66 - 75 percent75 percent or higher
2 - 17 percent18 - 24 percent25 - 44 percent45 - 73 percent
Source: Litt et al,, Environ Health Perspect 110(suppl2):183-193 (2002)
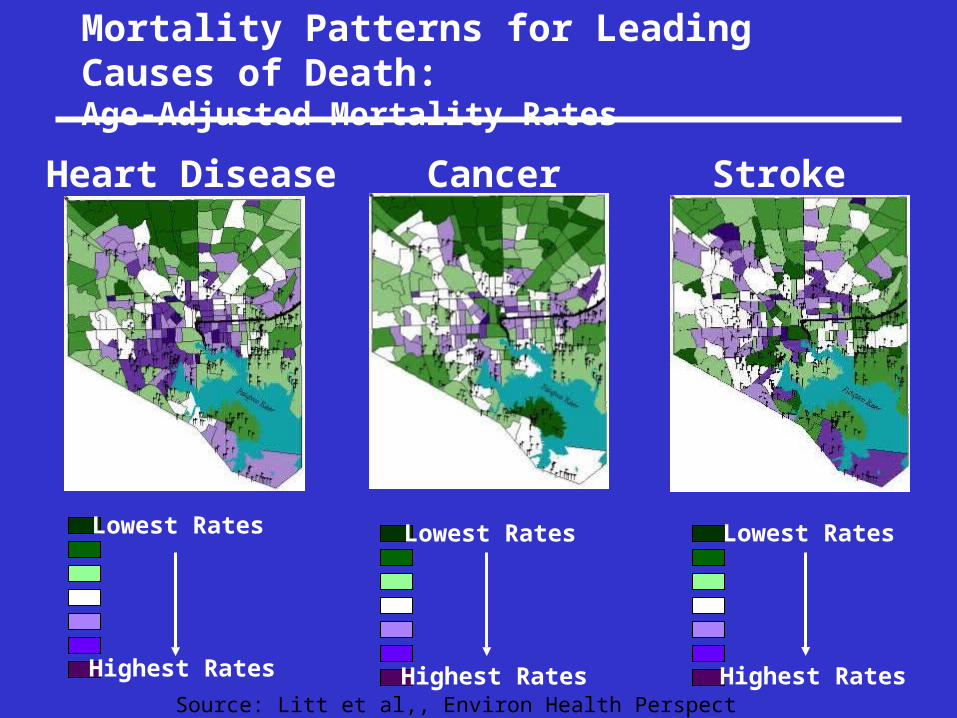
Mortality Patterns for Leading Causes of Death: Age-Adjusted Mortality Rates
Heart Disease Cancer
Lowest Rates
Highest Rates
Lowest Rates
Highest Rates
Stroke
Lowest Rates
Highest RatesSource: Litt et al,, Environ Health Perspect 110(suppl2):183-193 (2002)

Mortality Patterns for Leading Causes of Death: Age-Adjusted Mortality Rates (Litt et al, 2002)
COPD Lung
Lowest Rates
Highest Rates
Lowest Rates
Highest Rates

Methods: Statistical Analysis
Independent Variables:- Brownfields Score- Age (categorical)- Area of census tract- Principal Component 1: Poverty
status, Percent Minority and Home-Owner Occupancy
- Principal Component 2: Working Class, Educational Attainment
Response Variables:Mortality:- Leading Cause of
Death Index- Heart Disease- Cancer- Stroke- Influenza -Pneumonia- Diabetes- COPD- Liver Disease
Cancer Incidence:- Respiratory System- Digestive System- Brain and Other
Nervous System- Multiple Myelomas- Leukemias- Lymphomas
Log (Expected Deaths) =
0 + 1(Brownfields Score) + 2 (Age) + 3 (Area of Census Tract) + 4 (PC1) + 5 (PC2)
Source: Litt et al,, Environ Health Perspect 110(suppl2):183-193 (2002)

Comparing Baltimore’s Mortality to Maryland and U.S. Rates
United States
Maryland
Rest of City
Southeast Baltimore
Age
-Adj
uste
d R
ates
per
100
,000
Source: Litt et al,, Environ Health Perspect 110(suppl2):183-193 (2002)
Findings: Excess mortality in Zone 3 compared to Zone 1 was observed when adjusted for socioeconomic position, age, and area of census tract.

Income Inequality
EnvironmentalQuality
Indicator:Morbidity?Mortality?
Power?Well being?
Causal Pathway from Income Inequality to Population Health through
Environment
Gould, 2003

Environmental Paglin-Gini (EPG)• If air and water emissions unequally
distributed across locations, no equity unless individuals/states appropriately compensated.
• EPG is calculated 1988-1996 for states and then grouped by amount of per capita manufacturing.
• EPG higher in high manufacturing areas but has improved with time
• Overall inequality is risingMillimet & Slottje, 2002

Per capita income
Current path
Desired path
Potential interventions:? Regulate/enforce early? tax early? Income equality
Consequently, rates never rise as high
-Demands for improvement in env quality and resources for env friendly investments-Government actsConsequently, rates decline
Env
iron
men
tal d
egra
dati
onEnvironmental Kuznets Curve
Environmental quality initially worsens but ultimately improveswith income

Current path
Industrialized countries > $15,000growing income inequality = increasing power inequality???
-Demands for improvement in env quality and resources for env friendly investments-Government actsConsequently, rates decline
Per capita income
Env
iron
men
tal d
egra
dati
on
Redrawn Environmental Kuznets Curve
Environmental quality initially worsens, then improves, but then worsens due to increasing income inequality = increasing power inequality?? (Torras & Boyce, 1998)
Gould, 2005

Power Distribution Hypothesis (Boyce et al, 1999)
• “Wider inequalities of power tend to result in greater environmental degradation”
• “Power inequalities will affect size of pollution pie, as well as how it is sliced.”

Dr Wangari Maathaireceives Peace Prize
Why has an environmentalist won a Nobel Peace Prize?
• Wars are fought over resources and they are becoming increasingly scarce (ie water, oil)
• People with power undermine those without.
AP

Inequality• Economic, social, political
•Segregation (race/ethnicity, income)•Lack of social capital
Community Policy Decisions•Institutional (siting, pollution prevention, control strategies)
•Structural (development, transportation,job creation)
Environmental Health Stress•Siting (facilities, transport corridors)•Pollution exposures (air, water, soil)
•Increased health risk (cancer, noncancer)
Population Health•Premature death rate
•Chronic diseases (asthma)Adapted from: Morello-Frosch et al, 2002
Environmental Inequality Framework

Discussion:Environmental Inequality
What can be done?

Thank You

How measure power?
• Voter participation
• Tax fairness
• Medicaid accessibility
• Educational attainment
• Power distribution as a function of income inequality
Boyce et al, 1999

Measuring relationship between population health and environment
• Do we have the right indicators?• Are mortality rates sensitive enough?• What about aggregate indicators?
(Genuine Progress Indicator? - combines economics, social and environmental indicators)
• What about measurements of social well being?
Soskolne and Broemling, 2002

Argument for social well being index
SES and degraded environmental conditions are often likely to aggregate together, as higher
income households have better means (including access to knowledge and a stronger
political voice) with which to insulate themselves. The widening gap between the rich
and poor may provide a sensitive measure of declining social well being.
Soskolne and Broemling, 2002

X
best offmosteducationmost money best jobs
worst offleast educationleast moneyworst jobs or no job
Subjective Social Status
"Think of this ladder as representing where people stand in our society. At the
top of the ladder are the people who are the best off,
those who have the most money, most education and best jobs. At the bottom are the people who are the worst off, those who have the least money, least education, and
worst jobs or no job."Place an X on the rung that best represents where you stand on the ladder.Singh-Manoux et al, 2003

Environment and disease: association or causation?
• Strength – chimney sweeps and scrotal cancer, smoking and lung cancer, sewage water and cholera (John Snow, 1854)
• Consistency – disease in several places
• Specificity – TB lung
• Temporality – length of time for disease development
• Biological gradient or dose response – the higher the dose, the more likely the disease.
• Plausibility – biological plausibility – may depend on knowledge of the day
• Coherence – generally known facts of natural hx and biology of disease
• Experiment – does prevention stop disease?
• Analogy – similar disease with similar evidence
Sir Austin Bradford Hill, 1965

Pressure
State
Exposure
Effect
Driving force
Choice of residence
Inequality/race based policies
Outdoor/indoor pollutants housing quality, job control
Multiple contaminants fromindustry (historic and current)
Increased morbidity (asthma),
decreased well being
Cause Effect Framework: Taking Action
ACTION
Adapted from Corvalan et al, 1999

Cultural Competence Continuum: A developmental process
Cultural destructiveness
Cultural incapacity
Cultural blindness
Cultural pre-competence
Cultural competenceCultural
proficiency(Cross et al, 1989)

Argument for today
Environmental (in)equality is an important determinant of health
Our responsibility to incorporate EJ as part of the inequality equation

Acknowledgements
• Dr Sharyne Shiu Thornton – Cultural Competency professor, University of Washington
• Dr Owens Wiwa – Nigerian EJ Activist, University of Toronto
• Stephen Bezruchka - UW

RoadsSidewalks
Public transportSafety
Walk/bike vs. bus/car
EnvironmentalQuality
Loss of forest/farm landGlobal climate change
Air pollutionHazardous waste sitesWater supply/purity
Green SpaceRecreationAestheticsControlled naturePhysical activity
Figure 3:Effects of income inequality on health through environmental factors
Income inequality
degradedENVIRONMENT
Disease/Well being
Reduced social cohesion
AsthmaCancerChronic
Injuries/accidentsObesityMental Health
StressHeart diseaseObesity
Gould, 2003

Log (Expected Deaths) =
0 + 1(Brownfields Zone) + 2 (Age) + 3 (Area of Census Tract) + 4 (PC1) + 5 (PC2)
• Excess mortality in Zone 3 compared to Zone 1 was observed when adjusted for socioeconomic position, age, and area of census tract.
» Leading cause of death index
»Total cancer deaths
» Lung cancer mortality
»New respiratory cancers
»Respiratory-related mortality (lung cancer, COPD, and influenza)
Findings: Brownfields and Community Health
Source: Litt et al,, Environ Health Perspect 110(suppl2):183-193 (2002)

Inequality
Political inequality(i.e., policy decisions)
Economic inequality(i.e., income, wealth)
Social inequality(i.e., social capital)
PopulationHealth
Gould, 2003

EJ Movement Recognition – Social factors increases susceptibility to disease
• Poor nutrition
• Socioeconomic stress
• Insufficient access to health care
• Lack of affordable and/or safe housing
• Lack of community cohesion
• Limited control at work
• Co-exposure to other pollutants

EJ environment defined differently:
• Includes home, workplace, community in addition to toxic assaults
• “A community’s perception is its reality” (Bullard, 1994)
• Health impacts can be psychosocial – If water/air perceived to be contaminated, lifestyle is affected (Edelstein, 2002)

Pyschosocial Impacts on Health
• If environment perceived to be contaminated, life style behavior changes (bathing, gardening, cooking, diet, cleaning)
• Noise, odors, traffic, etc• Loss of control of physical and social
environment• Distrust and stress if no participation in
decision making
Edelstein, 2002

“Poverty is both a cause and a symptom of
environmental degradation…When
you’re in poverty, you’re trapped because the
poorer you become, the more you degrade the
environment, the poorer you become.”
www.progressive.org, Dr.Wangari Maathai

Honduras – outside of La Ceiba visiting Adelante Foundation. Women receiving microcredit make charcoal. Yet, deforestation scars on mountain.
Gould, 2005

War and EnvironmentPekka Haavisto UNEP
• Direct effects-Resources bombed (oil refineries, factories)
-Land mines-Depleted uranium-Deforestation to finance war
• Indirect effects
-Refugees
-Sanctions-infrastructure collapse (dumps, water)
-Corruption-Habitat loss (wetlands)
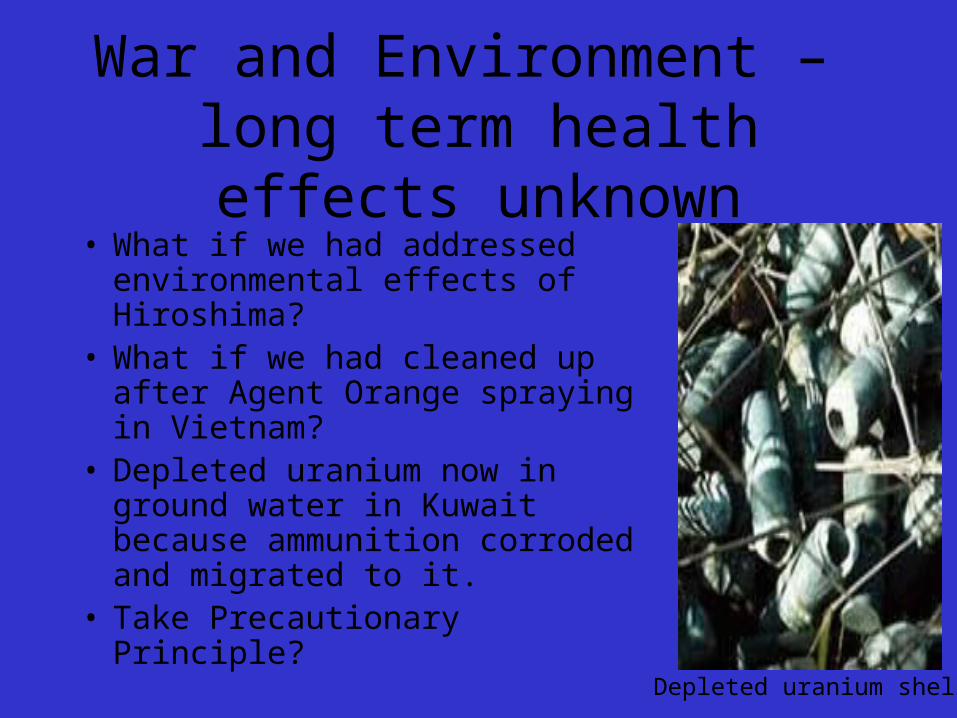
War and Environment – long term health effects unknown• What if we had addressed
environmental effects of Hiroshima?
• What if we had cleaned up after Agent Orange spraying in Vietnam?
• Depleted uranium now in ground water in Kuwait because ammunition corroded and migrated to it.
• Take Precautionary Principle?Depleted uranium shells

Environment and social inequality: Maternal and child health disparities
(Morello-Frosch & Shenassa, 2006)
• Disparity for pre-term births and low birth babies between blacks and whites still high

Nigerian women threaten nudity
•Corporate responsibility•Demand for jobs, schoolsscholarships, hospitals, water,electricity, and env protection

Environmental Racism/injustice
•Environmental racism is considered a human rights violation. It deprives communities of color of their economic, social, and cultural rights’
•Any policy, practice, or directive that differentially affects or disadvantages (whether intended or unintended) individuals, groups, or communities based on race or color.
• Environmental racism combines public policies and industry practices to provide benefits for whites while shifting industry costs to people of color.
•It is reinforced by governmental, legal, economic, political, and military institutions.
Bullard, 2000

Birth of Modern Environmentalism
• 1960’s
-preservation of wilderness and wildlife, resource conservation, pollution abatement, population control
-Social justice orientation with roots in civil rights and anti-Vietnam war movements - participatory
• 1970’s
-Legal (RCRA, Superfund, etc) and scientific approaches (RA, CULs) to solving environmental issues - pollution business industry evolves.
-Movement becomes “insider” focused and elitist, white dominant paradigm

Mainstream Environmentalism (1970’s continued)
• Social justice dropped from environmental agenda
• Communities of color and low income groups excluded
• Disadvantaged groups lack expertise to participate or assist in environmental decision making

EJ Movement Birth (early 80’s)
People of color have come to understand that environmentalists are no more enlightened than non-environmentalists
when it comes to issues of justice and social equity
(Robert Bullard, 2000)

‘We survived slavery, colonization, and neocolonialism… but we may not survive economic
globalization….’“The corporations came as vectors, as carriers of diseases, that killed or made people very ill. Good
public health practice addresses bad practices, such as the double standard of environmental racism”.
(Dr Owens Wiwa, May 2005)
‘Environmental racism is considered a human rights violation. It deprives communities of color of their
economic, social, and cultural rights’(Bullard, 2000)
Wiwa sues Shell in U.S. Supreme Court

‘Effects of war on environment are
psychological…people are afraid to use their resources because they don’t know if
they are contaminated or not.’
‘People say that people living in developing countries don’t care about the environment. To the contrary, they do care – their
lives depend on it.’
Pekka Haavisto, UNEP

Dominant Current Environmental Protection Paradigm:
• Discriminatory zoning and land-use practices• Institutionalizes unequal enforcement of laws• Trades human and ecological health for profit• Differential exposure to harmful chemicals in home,
school, neighborhood, workplace• Places burden of proof on victims as opposed to
polluting industry itself• Risk assessment perpetuates injustice • Exclusionary policies and practices in participating in
decision making• Cleanup actions delayed
Bullard, 1994

Environmental Justice Paradigm (EJP)
• Framework comes from civil rights movement – communitarian discourse
• Ideological framework which explicitly links ecological concerns with class, race, gender, labor and social justice
• Community, grassroots, bottom up• Diverse - Leaders are 50% male/female, high %
minorities. • Cooperative endeavors• BUT.. caught in reactive vs proactive mode –
stopping environmental badsAgyeman, 2005

Complex relationship between poverty, pollution, and health
• Health disparities exist in low income communities
• What is the environment in these communities
• “Genetics loads the gun, but the environment pulls the trigger” (Judith Stern)

Why no exposure health evidence?
• Lack of scientific consensus on health based standards for toxic substances
• No clear data regarding effects of exposures to many toxic substances
• Difficulties in assessing impact from substances not yet tested (1500 new chemicals introduced each year)
• Distance on toxicity not well documented (poor monitoring methods and models for predicting exposures)
Maantay (2001)

Why no exposure health evidence? (cont)
• Difficulty in assessing cumulative and synergistic impacts
• Uncertainties in assessing impacts emitted through different media (air, soil, water) and exposure pathway (ingestion, dermal, inhalation)
• Even if standard thresholds, set for average individual as opposed to vulnerable population
• Lack or reliable actual emission measurements (polluters are responsible) and no account for other polluters (regulated and/or unregulated)
Maantay (2001)

Common Myths/AttitudesRacist? Classist?
• Risk assessment culture (perpetuates injustice)
• Which came first? Facility siting or move-in? (blame the victim)
• Where’s the evidence? (burden of proof)

Pollution Exposure(industrial facilities,
transportation corridors)
Adverse healtheffect
(premature death, chronic disease)
?
Where is the evidence?
Many institutions and researchers stating the need for research:NEJAC (2000), Maantay (2001), Morello-Frosch (2002), Northridge et al (2003), National Environmental Policy Commission (2003), EPA (2003), Jerret & Finkelstein (2005)

Alleviation of economic disparities and air pollution
• Reliable estimates of health effects including potential confounding and effect modification

Link between Environment and Health Disparities
High dose issues – no contest
• Vermiculite mining in Libby Montana and mesothelioma, asbestosis, lung cancer
• Chemical facilities in Louisiana

Cause and effect: Temporality
• What to do about time?
• If sufficiently long time horizon is taken, all disease is environmental (chronic vs infectious diseases; even genetics)
• If causation is confined to limited time period, long term environmental health threats such as global change don’t count
Smith et al, 1999

SEP, pollution, and health
SEP both a potential confounder and effect modifier1. Groups with lower SEP have higher exposure to
air pollution2. Lower SEP groups have compromised health
status due to material deprivation and psychosocial stress – more susceptible to health effects of air pollution
3. Combination of exposure + susceptibility = greater health effects.
O’Neill 2003

Eco-epidemiology
• “Non-threshold and threshold health effects, induced by exposure to degraded environmental states, must be understood within populations rather than at the individual level”
Soskolne and Broemling, 2002

EPA EJ Definition
“The fair treatment and meaningful involvement of all people regardless of color, national origin, or
income with respect to development, implementation, and enforcement of environmental
laws, regulations and policies. Fair treatment means that no group of people should bear a
disproportionate share of negative environmental consequences from industrial, municipal, and
commercial operations or the execution of federal, state, local, and tribal programs and policies.”

The Evidence: Exposure to outdoor air toxics
(Morello-Frosch et al, 2002)
• Exposure to outdoor toxics from mobile and stationary sources in Southern California
• Controlled for socioeconomic and demographic indicators
• Disproportionate exposure for communities of color


