370
Java Agent Guide Version 9.0 CA Wily Introscope®
| Date post: | 31-Dec-2015 |
| Category: |
Documents |
| Upload: | vinicius-malloni |
| View: | 647 times |
| Download: | 11 times |

Java Agent Guide Version 9.0
CA Wily Introscope®

This documentation, which includes embedded help systems and electronically distributed materials, (hereinafter referred to as the “Documentation”) is for your informational purposes only and is subject to change or withdrawal by CA at any time.
This Documentation may not be copied, transferred, reproduced, disclosed, modified or duplicated, in whole or in part, without the prior written consent of CA. This Documentation is confidential and proprietary information of CA and may not be disclosed by you or used for any purpose other than as may be permitted in (i) a separate agreement between you and CA governing your use of the CA software to which the Documentation relates; or (ii) a separate confidentiality agreement between you and CA.
Notwithstanding the foregoing, if you are a licensed user of the software product(s) addressed in the Documentation, you may print or otherwise make available a reasonable number of copies of the Documentation for internal use by you and your employees in connection with that software, provided that all CA copyright notices and legends are affixed to each reproduced copy.
The right to print or otherwise make available copies of the Documentation is limited to the period during which the applicable license for such software remains in full force and effect. Should the license terminate for any reason, it is your responsibility to certify in writing to CA that all copies and partial copies of the Documentation have been returned to CA or destroyed.
TO THE EXTENT PERMITTED BY APPLICABLE LAW, CA PROVIDES THIS DOCUMENTATION “AS IS” WITHOUT WARRANTY OF ANY KIND, INCLUDING WITHOUT LIMITATION, ANY IMPLIED WARRANTIES OF MERCHANTABILITY, FITNESS FOR A PARTICULAR PURPOSE, OR NONINFRINGEMENT. IN NO EVENT WILL CA BE LIABLE TO YOU OR ANY THIRD PARTY FOR ANY LOSS OR DAMAGE, DIRECT OR INDIRECT, FROM THE USE OF THIS DOCUMENTATION, INCLUDING WITHOUT LIMITATION, LOST PROFITS, LOST INVESTMENT, BUSINESS INTERRUPTION, GOODWILL, OR LOST DATA, EVEN IF CA IS EXPRESSLY ADVISED IN ADVANCE OF THE POSSIBILITY OF SUCH LOSS OR DAMAGE.
The use of any software product referenced in the Documentation is governed by the applicable license agreement and such license agreement is not modified in any way by the terms of this notice.
The manufacturer of this Documentation is CA.
Provided with “Restricted Rights.” Use, duplication or disclosure by the United States Government is subject to the restrictions set forth in FAR Sections 12.212, 52.227-14, and 52.227-19(c)(1) - (2) and DFARS Section 252.227-7014(b)(3), as applicable, or their successors.
Copyright © 2011 CA. All rights reserved. All trademarks, trade names, service marks, and logos referenced herein belong to their respective companies.

CA Technologies Product References
This document references the following CA Technologies products:
■ CA SiteMinder®
■ CA Spectrum® Infrastructure Manager
■ CA SYSVIEW® Performance Management
■ CA Wily Extension for CA SYSVIEW®
■ CA Wily Introscope®
■ CA Wily Introscope® ErrorDetector™
■ CA Wily Introscope® ChangeDetector™
■ CA Wily Introscope® PowerPack™ for CA SiteMinder Web Access Manager
■ CA Wily Introscope® PowerPack™ for BEA Tuxedo Connectors
■ CA Wily Introscope® PowerPack™ for BEA WebLogic Integration
■ CA Wily Introscope® PowerPack™ for BEA WebLogic Server
■ CA Wily Introscope® PowerPack™ for IBM CICS Transaction Gateway
■ CA Wily Introscope® PowerPack™ for IBM WebSphere Business Integration Adapters
■ CA Wily Introscope® PowerPack™ for IBM WebSphere Application Server
■ CA Wily Introscope® PowerPack™ for IBM WebSphere MQ
■ CA Wily Introscope® PowerPack™ for IBM z/OS
■ CA Wily Introscope® PowerPack™ for Oracle Database
■ CA Wily Introscope® PowerPack™ for Web Servers
■ CA Wily Introscope® for Microsoft .NET
■ CA Wily Introscope® for SAP NetWeaver
■ CA Wily Introscope® for SAP ABAP
■ CA Wily Introscope® Integration Pack for CA NSM
■ CA Wily Introscope® LeakHunter™
■ CA Wily Introscope® SNMP Adapter™
■ CA Wily Introscope® PowerPack™ for IBM WebSphere Application Server for Distributed Environments

Contact CA Technologies
Contact CA Support
For your convenience, CA Technologies provides one site where you can access the information you need for your Home Office, Small Business, and Enterprise CA Technologies products. At http://ca.com/support, you can access the following:
■ Online and telephone contact information for technical assistance and customer services
■ Information about user communities and forums
■ Product and documentation downloads
■ CA Support policies and guidelines
■ Other helpful resources appropriate for your product
Provide Feedback
If you have comments or questions about CA Technologies product documentation, you can send a message to [email protected].
If you would like to provide feedback about CA Technologies product documentation, complete our short customer survey, which is available on the CA Support website at http://ca.com/docs.
Contents 5
Contents
Chapter 1: The Java Agent Overview 19
Documentation Changes ........................................................................ 19
Application triage map support ............................................................... 19
Agent-only business transaction recording ...................................................... 20
Dynamic instrumentation .................................................................... 20
Java NIO .................................................................................. 21
Multiple inheritance support ................................................................. 21
LeakHunter and ErrorDetector configuration .................................................... 21
The Introscope environment ..................................................................... 21
Planning a Java Agent deployment ................................................................ 23
Discover Introscope functionality .............................................................. 23
Determine configuration requirements ......................................................... 24
Create and define Java Agent configuration ..................................................... 24
Evaluate Java Agent performance overhead ..................................................... 25
Validate and deploy Java Agent configuration ................................................... 25
Deploying the Java Agent ........................................................................ 25
Chapter 2: Installing and Configuring the Java Agent 27
Before you begin ............................................................................... 27
Application server support ................................................................... 27
Enterprise Manager connection information .................................................... 28
JVM AutoProbe ............................................................................ 29
Installing the Java Agent ......................................................................... 29
The Java Agent installer ...................................................................... 30
Installing the Java Agent in GUI mode .......................................................... 31
Installing the Java Agent in console mode ....................................................... 34
Installing the Java Agent in silent mode......................................................... 36
Manual installation ......................................................................... 40
Java Agent installation directories and files ......................................................... 43
Contents of the wily directory ................................................................ 43
Contents of the wily\connectors directory ...................................................... 44
Contents of the wily\deploy directory .......................................................... 44
Contents of the wily\examples directory........................................................ 44
Contents of the wily\ext directory ............................................................. 44
Contents of the wily\hotdeploy directory ....................................................... 46
Contents of the wily\install directory .......................................................... 47
6 Java Agent Guide
Contents of the wily\tools directory ........................................................... 47
Contents of the wily\UninstallerData directory .................................................. 47
Contents of the wily\readme and wily\versions directories ........................................ 47
Configuring the JVM to use the Java Agent .......................................................... 48
Starting the Java Agent .......................................................................... 48
Connecting to the Enterprise Manager ............................................................. 48
Connecting to the Enterprise Manager with HTTP tunneling ....................................... 49
Configuring a proxy server for HTTP tunneling ................................................... 50
Connecting to the Enterprise Manager with HTTPS tunneling....................................... 51
Connecting to the Enterprise Manager over SSL .................................................. 52
Java Agent configuration overview ................................................................ 53
Operational configurations ................................................................... 53
Optional operational configurations ........................................................... 54
Data collection configurations ................................................................ 55
CA Wily CEM integration ..................................................................... 57
Upgrading multiple agent types ................................................................... 57
Uninstalling the Java Agent ...................................................................... 59
Uninstalling the Java Agent from z/OS .......................................................... 59
Chapter 3: AutoProbe and ProbeBuilding Options 61
AutoProbe and ProbeBuilding overview ............................................................ 61
Unsupported instrumentation methods ........................................................ 62
Configuring JVM AutoProbe ...................................................................... 62
JVM AutoProbe ............................................................................ 62
JVM AutoProbe for WAS 7 on z/OS ............................................................ 63
JVM AutoProbe on OS/400 ................................................................... 63
WebSphere or WebLogic..................................................................... 64
Creating an AutoProbe connector file .......................................................... 64
Running the AutoProbe Connector for a Sun, IBM, or HP JVM ...................................... 64
JRockit JVM AutoProbe ...................................................................... 67
Configuring ProbeBuilding ....................................................................... 67
Full or typical tracing options ................................................................. 68
Dynamic ProbeBuilding ...................................................................... 68
Dynamic ProbeBuilding vs. dynamic instrumentation ............................................. 71
ProbeBuilding class hierarchies (JVM 1.5) ....................................................... 72
Removing line numbers in bytecode ........................................................... 75
Chapter 4: Deploying the Java Agent on WebLogic 77
Before you begin ............................................................................... 77
Configuring AutoProbe for WebLogic Server ........................................................ 77
Application server management data .............................................................. 78
Contents 7
Configuring a startup class for WebLogic 9.0 or higher ............................................ 78
Configuring the SQL Agent for WebLogic Server ..................................................... 79
Supported JDBC drivers and datasources ....................................................... 79
Configure the SQL Agent for WebLogic ......................................................... 80
Configuring WebLogic Diagnostic Framework (WLDF) ................................................. 82
Understanding WLDF metric conversion ........................................................ 82
Enabling WLDF reporting .................................................................... 83
Cross-process Transaction Tracing in WebLogic ...................................................... 83
Enabling cross-process tracing in WebLogic Server ............................................... 83
Introscope Java Agent JMX support ................................................................ 84
Introscope support for WebLogic 9.0 JMX metrics ................................................ 84
JMX filters for WebLogic ..................................................................... 84
Chapter 5: Deploying the Java Agent on WebSphere 85
Before you begin ............................................................................... 85
AutoProbe for WebSphere 6.1 .................................................................... 85
AutoProbe for WebSphere 7.0 .................................................................... 88
AutoProbe for WebSphere 6.1 and 7.0 for z/OS ...................................................... 89
Modifying Java2 Security Policy ................................................................... 91
Disable agent naming for WebSphere .............................................................. 91
WebSphere application server management data .................................................... 91
Configuring a custom service in WebSphere 6.1 .................................................. 92
WAS 6.1 on AIX platform ..................................................................... 92
The SQL Agent for WebSphere .................................................................... 93
Supported JDBC drivers and DataSources ....................................................... 93
Configuring the SQL Agent for WebSphere Application Server (WAS) ................................ 94
Configure the JDBC DataSource or Driver in WebSphere ........................................... 94
Instrument the JDBC DataSource or Driver ...................................................... 94
WebSphere PMI ............................................................................... 96
Using WebSphere PMI with Introscope on z/OS .................................................. 97
Enabling PMI in WebSphere .................................................................. 97
Configuring WebSphere PMI in Introscope ...................................................... 97
Viewing WebSphere PMI data ................................................................ 98
Logging considerations on WebSphere for z/OS ..................................................... 98
Tagging log output as EBCDIC ................................................................. 98
Eliminating startup timing issues with logging facilities ............................................ 98
Cross-process Transaction Tracing in WebSphere .................................................... 99
Chapter 6: Deploying the Java Agent on other application servers using JVM AutoProbe 101
Deploying the Java Agent on other application servers using JVM AutoProbe ............................ 101

8 Java Agent Guide
Configuring Apache Tomcat ..................................................................... 102
Tomcat PBD tracing options ................................................................. 103
Editing the startup script .................................................................... 104
Configuring JBoss ............................................................................. 105
JBoss PBDs and PBLs ....................................................................... 107
Configuring Oracle Application Server 10g ......................................................... 107
Configuring GlassFish 2.1 ....................................................................... 108
Configuring SAP Netweaver 7.1 .................................................................. 108
Chapter 7: ProbeBuilder Directives 109
ProbeBuilder Directives overview ................................................................ 109
Components traced by the default PBDs ....................................................... 110
Default PBD files .......................................................................... 111
Default PBL files ........................................................................... 114
Default tracer groups and toggles files ........................................................ 114
Turning tracer groups on or off .............................................................. 125
Adding classes to a tracer group.............................................................. 126
EJB naming ............................................................................... 128
Using the IntroscopeAgent.profile, PBLs, and PBDs together .......................................... 129
Applying ProbeBuilder Directives ................................................................ 129
Using JVM AutoProbe ...................................................................... 130
Using the ProbeBuilder Wizard or command-line ProbeBuilder .................................... 130
Instrumenting with new and changed PBDs .................................................... 130
Creating custom tracers ........................................................................ 132
Using a custom BlamePointTracer tracer for common metrics ..................................... 132
Directive names and arguments used in tracer syntax ............................................ 133
Commonly used tracer names and examples ................................................... 135
Advanced single-metric tracers .............................................................. 137
Skip directives ............................................................................ 140
Counting object instances ................................................................... 141
Turning on InstrumentPoint directives ........................................................ 141
Combining custom tracers .................................................................. 142
Instrumenting and inheritance ............................................................... 142
Java 1.5 annotations ....................................................................... 143
Using Blame Tracers to mark blame points ......................................................... 143
Blame Tracers ............................................................................. 143
High agent CPU overhead from deep nested frontend transactions ................................ 144
Custom FrontendMarker directive ............................................................ 145
Blame Tracers in standard PBDs .............................................................. 145
Boundary Blame and Oracle backends ........................................................ 146
Supplementary directives and tracers information .................................................. 146

Contents 9
Chapter 8: Java Agent Naming 147
Understanding the Java Agent name .............................................................. 147
How the agent determines its name .......................................................... 148
How Introscope resolves agent naming conflicts ................................................ 149
Agent naming considerations for clustered applications .............................................. 150
Specifying an agent name using a Java system property .............................................. 150
Specifying an agent name using a system property key .............................................. 151
Obtaining an agent name from the application server ............................................... 151
Application servers that support agent naming ................................................. 151
Automatic agent naming ....................................................................... 152
Automatic agent naming and renamed agents .................................................. 153
Advanced automatic agent naming options .................................................... 153
Enabling cloned agent naming in clustered environments ............................................ 155
Cloned agent naming scenario ............................................................... 155
Configuring unique names for application instances ............................................. 155
Application triage map and the agent name ........................................................ 156
Chapter 9: Java Agent Monitoring and Logging 157
Configuring agent connection metrics............................................................. 157
Socket metrics ................................................................................ 158
Restricting socket and SSL metric collection .................................................... 159
Fine-tuning socket and SSL metric collection ................................................... 159
SSL, NIO, and socket tracing in the application triage map ........................................ 160
Turning off socket and SSL metric collection .................................................... 161
Backwards compatibility .................................................................... 162
Configuring logging options ..................................................................... 162
Running the agent in verbose mode .......................................................... 163
Redirecting agent output to a file............................................................. 164
Changing the name or location of the agent logfile .............................................. 165
Agent log files and automatic agent naming .................................................... 165
Rolling up logs by date or size ................................................................ 166
Managing ProbeBuilder Logs .................................................................... 167
Command-line ProbeBuilder and ProbeBuilder Wizard log name and location ........................ 167
AutoProbe log name and location ............................................................ 167
Chapter 10: Using Virtual Agents to Aggregate Metrics 169
Understanding Virtual Agents ................................................................... 169
Virtual Agent requirements ..................................................................... 169
Configuring Virtual Agents ...................................................................... 170

10 Java Agent Guide
Chapter 11: Configuring Java Agent Failover 173
Understanding agent failover .................................................................... 173
Defining backup Enterprise Managers............................................................. 174
Defining failover connection order ............................................................... 175
Configuring failback to primary Enterprise Manager ................................................. 175
Configuring domain/user information ............................................................. 176
Chapter 12: Configuring LeakHunter and ErrorDetector 177
LeakHunter .................................................................................. 177
How LeakHunter works ..................................................................... 178
What LeakHunter tracks in Java .............................................................. 179
What LeakHunter does not track ............................................................. 179
System and version requirements ............................................................ 180
Enabling and disabling LeakHunter ............................................................... 180
Configuring LeakHunter properties ............................................................... 181
Ignoring collections that cause poor performance ............................................... 182
Running LeakHunter ........................................................................... 183
Identifying potential leaks with collection IDs ...................................................... 183
LeakHunter log file ............................................................................ 184
Potential leak first identified log entry ........................................................ 184
Identified potential leak stops leaking log entry ................................................. 185
Identified potential leak is leaking again log entry ............................................... 186
LeakHunter timeout log entry ............................................................... 186
Using LeakHunter ............................................................................. 186
ErrorDetector................................................................................. 187
Types of errors ............................................................................ 187
How ErrorDetector works ................................................................... 188
Enabling ErrorDetector in the Java Agent .......................................................... 189
Configuring ErrorDetector options ............................................................... 189
Advanced error data capture .................................................................... 190
Defining new error types ....................................................................... 190
ExceptionErrorReporter .................................................................... 191
MethodCalledErrorReporter ................................................................. 191
ThisErrorReporter ......................................................................... 191
HTTPErrorCodeReporter .................................................................... 192
Using error tracer directives with caution ...................................................... 192
More help ................................................................................... 192
Using ErrorDetector ........................................................................... 193
Contents 11
Chapter 13: Configuring Boundary Blame 195
Understanding Boundary Blame ................................................................. 195
Using URL groups ............................................................................. 196
Defining keys for URL groups ................................................................ 196
Defining membership of each URL group ...................................................... 197
Define the name for a URL group ............................................................. 197
Advanced naming techniques for URL groups (optional) .......................................... 198
Running the URLGrouper ................................................................... 201
Using Blame tracers ........................................................................... 201
Disabling Boundary Blame ...................................................................... 201
Chapter 14: Configuring Transaction Trace Options 203
Controlling automatic Transaction Tracing behavior ................................................. 203
Transaction Trace component clamp .......................................................... 203
Transaction trace sampling .................................................................. 204
Agent heap sizing .......................................................................... 205
Configuring cross-process Transaction Tracing ...................................................... 205
Extending transaction trace data collection ........................................................ 205
About User ID data ........................................................................ 206
About servlet request data .................................................................. 206
Configuring Agent to collect additional transaction trace data ..................................... 207
Disabling the capture of stalls as Events ........................................................... 208
Chapter 15: Configuring the Introscope SQL Agent 209
The SQL Agent overview ........................................................................ 209
The SQL Agent files ............................................................................ 210
SQL statement normalization .................................................................... 210
How poorly written SQL statements create metric explosions ..................................... 210
SQL statement normalization options ......................................................... 212
Turning off statement metrics ................................................................... 218
Turning off Blame metrics ...................................................................... 218
SQL metrics .................................................................................. 219
Chapter 16: Enabling JMX Reporting 221
Introscope Java Agent JMX support ............................................................... 221
Introscope support for WebLogic 9.0 JMX metrics ............................................... 222
Default JMX metric conversion process ........................................................... 222
Using primary key conversion to streamline JMX metrics ............................................. 223
Managing metric volume with JMX filters .......................................................... 224

12 Java Agent Guide
JMX filters for WebLogic .................................................................... 224
Configuring JMX reporting ...................................................................... 225
Enabling JSR-77 data for WAS 6.x ................................................................ 226
Chapter 17: Configuring Platform Monitoring 229
Understanding platform monitors ................................................................ 229
Enabling platform monitors on Windows Server 2003 ............................................... 231
Enabling platform monitors on AIX ............................................................... 231
Disabling platform monitors ..................................................................... 232
Troubleshooting platform monitoring ............................................................. 234
Troubleshooting platform monitoring on Windows .............................................. 234
Appendix A: Java Agent Properties 237
Configuring the IntroscopeAgent.profile location ................................................... 238
Command-line property overrides ............................................................... 239
Agent failover ................................................................................ 239
introscope.agent.enterprisemanager.connectionorder ........................................... 240
introscope.agent.enterprisemanager.failbackRetryIntervalInSeconds ............................... 240
Agent HTTP tunneling .......................................................................... 241
Agent HTTP tunneling for proxy servers ....................................................... 241
Agent HTTPS tunneling ..................................................................... 242
Agent memory overhead ....................................................................... 244
introscope.agent.reduceAgentMemoryOverhead ............................................... 244
Agent metric aging ............................................................................ 244
Configuring agent metric aging............................................................... 245
Agent metric clamp ............................................................................ 249
introscope.agent.metricClamp ............................................................... 250
Agent naming ................................................................................ 250
introscope.agent.agentAutoNamingEnabled ................................................... 251
introscope.agent.agentAutoNamingMaximumConnectionDelayInSeconds ........................... 251
introscope.agent.agentAutoRenamingIntervalInMinutes ......................................... 252
introscope.agent.disableLogFileAutoNaming ................................................... 252
introscope.agent.agentName ................................................................ 253
introscope.agent.agentNameSystemPropertyKey ............................................... 253
introscope.agent.clonedAgent ............................................................... 254
introscope.agent.customProcessName ........................................................ 254
introscope.agent.defaultProcessName ........................................................ 255
introscope.agent.disableLogFileAutoNaming ................................................... 255
introscope.agent.display.hostName.as.fqdn .................................................... 256
Agent recording (business recording) ............................................................. 256
introscope.agent.bizRecording.enabled ....................................................... 257

Contents 13
Agent thread priority .......................................................................... 257
introscope.agent.thread.all.priority ........................................................... 258
Agent to Enterprise Manager connection .......................................................... 258
introscope.agent.enterprisemanager.transport.tcp.host.DEFAULT ................................. 258
introscope.agent.enterprisemanager.transport.tcp.port.DEFAULT ................................. 259
introscope.agent.enterprisemanager.transport.tcp.socketfactory.DEFAULT.......................... 259
Application triage map ......................................................................... 260
introscope.agent.appmap.enabled ........................................................... 260
introscope.agent.appmap.metrics.enabled..................................................... 261
introscope.agent.appmap.catalystIntegration.enabled ........................................... 261
introscope.agent.appmap.queue.size ......................................................... 262
introscope.agent.appmap.queue.period ....................................................... 262
introscope.agent.appmap.intermediateNodes.enabled .......................................... 263
Application triage map business transaction POST parameters ........................................ 263
introscope.agent.bizdef.matchPost ........................................................... 264
Known limitations ......................................................................... 265
Application triage map managed socket configuration ............................................... 265
introscope.agent.sockets.managed.reportToAppmap ............................................ 266
introscope.agent.sockets.managed.reportClassAppEdge ......................................... 266
introscope.agent.sockets.managed.reportMethodAppEdge ....................................... 267
introscope.agent.sockets.managed.reportClassBTEdge ........................................... 267
introscope.agent.sockets.managed.reportMethodBTEdge ........................................ 268
Application triage map transaction sampling ....................................................... 268
introscope.agent.tracer.sampling.maxrate ..................................................... 269
introscope.agent.tracer.sampling.initial.period ................................................. 269
introscope.agent.tracer.sampling.reset.period .................................................. 270
AutoProbe ................................................................................... 270
introscope.autoprobe.directivesFile .......................................................... 270
introscope.autoprobe.enable ................................................................ 271
introscope.autoprobe.logfile ................................................................ 271
Blame ....................................................................................... 272
introscope.agent.blame.type ................................................................ 272
Bootstrap Classes Instrumentation Manager ....................................................... 272
introscope.bootstrapClassesManager.enabled .................................................. 273
introscope.bootstrapClassesManager.waitAtStartup ............................................. 273
CA Wily CEM integration ....................................................................... 274
ChangeDetector .............................................................................. 274
introscope.changeDetector.enable ........................................................... 275
introscope.changeDetector.rootDir ........................................................... 275
introscope.changeDetector.isengardStartupWaitTimeInSec ....................................... 276
introscope.changeDetector.waitTimeBetweenReconnectInSec .................................... 276
introscope.changeDetector.agentID .......................................................... 276

14 Java Agent Guide
introscope.changeDetector.profile ........................................................... 277
introscope.changeDetector.profileDir ......................................................... 277
introscope.changeDetector.compressEntries.enable ............................................. 278
introscope.changeDetector.compressEntries.batchSize .......................................... 278
Cross-process tracing in WebLogic Server .......................................................... 278
introscope.agent.weblogic.crossjvm .......................................................... 279
Cross-process transaction trace .................................................................. 279
introscope.agent.transactiontracer.tailfilterPropagate.enable ..................................... 279
Dynamic ProbeBuilding ......................................................................... 280
introscope.autoprobe.dynamicinstrument.enabled .............................................. 280
autoprobe.dynamicinstrument.pollIntervalMinutes ............................................. 281
introscope.autoprobe.dynamicinstrument.classFileSizeLimitInMegs ................................ 281
introscope.autoprobe.dynamic.limitRedefinedClassesPerBatchTo .................................. 281
introscope.agent.remoteagentdynamicinstrumentation.enabled .................................. 282
introscope.autoprobe.dynamicinstrument.pollIntervalMinutes .................................... 282
ErrorDetector................................................................................. 282
introscope.agent.errorsnapshots.enable ....................................................... 283
introscope.agent.errorsnapshots.throttle ...................................................... 283
introscope.agent.errorsnapshots.ignore.<index> ................................................ 284
Extensions ................................................................................... 284
introscope.agent.extensions.directory ........................................................ 284
Java NIO ..................................................................................... 285
Buffers .................................................................................. 285
Channels ................................................................................. 286
NIODatagramTracing metrics ................................................................ 286
Restricting Java NIO metrics ................................................................. 287
JMX ......................................................................................... 292
introscope.agent.jmx.enable ................................................................ 292
introscope.agent.jmx.ignore.attributes ........................................................ 293
introscope.agent.jmx.name.filter ............................................................. 294
introscope.agent.jmx.name.jsr77.disable ...................................................... 295
introscope.agent.jmx.name.primarykeys ...................................................... 296
introscope.agent.jmx.excludeStringMetrics .................................................... 297
LeakHunter .................................................................................. 297
introscope.agent.leakhunter.collectAllocationStackTraces ........................................ 298
introscope.agent.leakhunter.enable .......................................................... 298
introscope.agent.leakhunter.leakSensitivity .................................................... 299
introscope.agent.leakhunter.logfile.append .................................................... 299
introscope.agent.leakhunter.logfile.location ................................................... 300
introscope.agent.leakhunter.timeoutInMinutes................................................. 300
introscope.agent.leakhunter.ignore.<number> ................................................. 301
Logging ...................................................................................... 301

Contents 15
log4j.logger.IntroscopeAgent ................................................................ 302
log4j.appender.logfile.File................................................................... 303
log4j.logger.IntroscopeAgent.inheritance ...................................................... 303
log4j.appender.pbdlog.File .................................................................. 304
log4j.appender.pbdlog ..................................................................... 304
log4j.appender.pbdlog.layout ............................................................... 305
log4j.appender.pbdlog.layout.ConversionPattern ............................................... 305
log4j.additivity.IntroscopeAgent.inheritance ................................................... 306
Metric count ................................................................................. 306
introscope.ext.agent.metric.count ............................................................ 307
Multiple inheritance ........................................................................... 307
introscope.autoprobe.hierarchysupport.enabled ................................................ 308
introscope.autoprobe.hierarchysupport.runOnceOnly ........................................... 308
introscope.autoprobe.hierarchysupport.pollIntervalMinutes ...................................... 309
introscope.autoprobe.hierarchysupport.executionCount ......................................... 309
introscope.autoprobe.hierarchysupport.disableLogging .......................................... 310
introscope.autoprobe.hierarchysupport.disableDirectivesChange .................................. 310
Platform monitoring ........................................................................... 310
introscope.agent.platform.monitor.system .................................................... 311
Remote configuration .......................................................................... 311
introscope.agent.remoteagentconfiguration.enabled ............................................ 311
introscope.agent.remoteagentconfiguration.allowedFiles ........................................ 312
Security ..................................................................................... 312
introscope.agent.decorator.security .......................................................... 312
Servlet header decorator ....................................................................... 313
introscope.agent.decorator.enabled .......................................................... 313
Socket metrics ................................................................................ 313
introscope.agent.sockets.reportRateMetrics ................................................... 314
introscope.agent.io.socket.client.hosts ........................................................ 314
introscope.agent.io.socket.client.ports ........................................................ 315
introscope.agent.io.socket.server.ports ....................................................... 315
SQL Agent .................................................................................... 316
introscope.agent.sqlagent.useblame .......................................................... 316
introscope.agent.sqlagent.normalizer.extension ................................................ 317
introscope.agent.sqlagent.normalizer.regex.matchFallThrough .................................... 318
introscope.agent.sqlagent.normalizer.regex.keys ............................................... 318
introscope.agent.sqlagent.normalizer.regex.key1.pattern ........................................ 319
introscope.agent.sqlagent.normalizer.regex.key1.replaceAll ...................................... 319
introscope.agent.sqlagent.normalizer.regex.key1.replaceFormat .................................. 320
introscope.agent.sqlagent.normalizer.regex.key1.caseSensitive ................................... 320
SSL communication ............................................................................ 321
introscope.agent.enterprisemanager.transport.tcp.host.DEFAULT ................................. 321
16 Java Agent Guide
introscope.agent.enterprisemanager.transport.tcp.port.DEFAULT ................................. 322
introscope.agent.enterprisemanager.transport.tcp.socketfactory.DEFAULT.......................... 322
introscope.agent.enterprisemanager.transport.tcp.truststore.DEFAULT ............................. 323
introscope.agent.enterprisemanager.transport.tcp.trustpassword.DEFAULT ......................... 323
introscope.agent.enterprisemanager.transport.tcp.keystore.DEFAULT .............................. 323
introscope.agent.enterprisemanager.transport.tcp.keypassword.DEFAULT .......................... 324
introscope.agent.enterprisemanager.transport.tcp.ciphersuites.DEFAULT ........................... 324
Stall metrics .................................................................................. 324
introscope.agent.stalls.thresholdseconds ...................................................... 325
introscope.agent.stalls.resolutionseconds ..................................................... 325
Transaction tracing ............................................................................ 326
introscope.agent.transactiontracer.parameter.httprequest.headers ................................ 326
introscope.agent.transactiontracer.parameter.httprequest.parameters ............................. 327
introscope.agent.transactiontracer.parameter.httpsession.attributes .............................. 327
introscope.agent.transactiontracer.userid.key .................................................. 328
introscope.agent.transactiontracer.userid.method .............................................. 329
introscope.agent.transactiontrace.componentCountClamp ....................................... 330
introscope.agent.crossprocess.compression ................................................... 331
introscope.agent.crossprocess.compression.minlimit ............................................ 332
introscope.agent.crossprocess.correlationid.maxlimit............................................ 333
introscope.agent.transactiontracer.sampling.enabled............................................ 333
introscope.agent.transactiontracer.sampling.perinterval.count .................................... 334
introscope.agent.transactiontracer.sampling.interval.seconds ..................................... 334
introscope.agent.transactiontrace.headFilterClamp ............................................. 335
introscope.agent.ttClamp ................................................................... 336
URL grouping ................................................................................. 336
introscope.agent.urlgroup.keys .............................................................. 337
introscope.agent.urlgroup.group.default.pathprefix ............................................. 337
introscope.agent.urlgroup.group.default.format ................................................ 337
WebSphere PMI .............................................................................. 338
introscope.agent.pmi.enable ................................................................ 339
introscope.agent.pmi.enable.alarmManager ................................................... 339
introscope.agent.pmi.enable.bean ........................................................... 340
introscope.agent.pmi.enable.cache ........................................................... 340
introscope.agent.pmi.enable.connectionPool .................................................. 341
introscope.agent.pmi.enable.hamanager ...................................................... 341
introscope.agent.pmi.enable.j2c ............................................................. 342
introscope.agent.pmi.enable.jvmpi ........................................................... 342
introscope.agent.pmi.enable.jvmRuntime ..................................................... 343
introscope.agent.pmi.enable.objectPool ....................................................... 343
introscope.agent.pmi.enable.orbPerf ......................................................... 344
introscope.agent.pmi.enable.scheduler ....................................................... 344

Contents 17
introscope.agent.pmi.enable.servletSessions ................................................... 345
introscope.agent.pmi.enable.system .......................................................... 345
introscope.agent.pmi.enable.threadPool ...................................................... 346
introscope.agent.pmi.enable.transaction ...................................................... 346
introscope.agent.pmi.enable.webApp ......................................................... 347
introscope.agent.pmi.enable.webServices ..................................................... 347
introscope.agent.pmi.enable.wlm ............................................................ 348
introscope.agent.pmi.enable.wsgw ........................................................... 348
introscope.agent.pmi.filter.objref ............................................................ 349
WLDF metrics................................................................................. 349
introscope.agent.wldf.enable ................................................................ 350
Appendix B: Using the CA Wily PBD Generator 351
About the CA Wily PBD Generator ................................................................ 351
Configuring the CA Wily PBD Generator ........................................................... 352
Required PBD Generator parameters ......................................................... 352
Using the CA Wily PBD Generator ................................................................ 352
Appendix C: Manual ProbeBuilding 355
Before you begin .............................................................................. 355
Manual ProbeBuilding options ............................................................... 356
Using the ProbeBuilder wizard ................................................................... 356
Update the application startup script ......................................................... 358
Using the command-line ProbeBuilder ............................................................ 358
Adding Probes to bytecode .................................................................. 359
Editing the classpath ....................................................................... 361
Running instrumented code ..................................................................... 361
Switching back to non-instrumented code ......................................................... 362
The ProbeBuilder Wizard.lax file ................................................................. 362
Appendix D: The Java Agent and Application Server AutoProbe 365
Deploying the Java Agent on other application servers ............................................... 365
Configuring Sun ONE 7.0 ........................................................................ 366
Configuring Oracle 10g 10.0.3 ................................................................... 367
Configuring WebLogic Server .................................................................... 368
Configuring HTTP servlet tracing ................................................................. 368
Index 369


Chapter 1: The Java Agent Overview 19
Chapter 1: The Java Agent Overview
The topics in this section describe the Introscope architecture and the Java Agent deployment process.
This section contains the following topics:
Documentation Changes (see page 19) The Introscope environment (see page 21) Planning a Java Agent deployment (see page 23) Deploying the Java Agent (see page 25)
Documentation Changes
This release includes the following new or changed features that affect configuration and administration of the Introscope Java Agent 9.0:
■ Application triage map support (see page 19)
■ Agent-only business transaction recording (see page 20)
■ Dynamic instrumentation (see page 20)
■ Java New Input/Output (NIO) (see page 21)
■ Multiple inheritance support (see page 21)
■ LeakHunter and ErrorDetector configuration (see page 21)
Application triage map support
The application triage map presents a graphical visualization of the components that make up your application, showing application health and errors. This map is automatically generated from performance and analysis of Introscope metrics, errors, and events. It presents applications in the business-centric terms that you’ve defined. The application triage map enables you to instantly grasp the layout of the applications in your environment in a visual manner to help you identify and triage current and emerging problems.
The metrics collected by the Java Agent and sent to the Enterprise Manager support the generation of the application triage map.
For more information about the properties used to configure application triage map data, see Application triage map (see page 260), Application triage map business transaction POST parameters (see page 263), Application triage map managed socket configuration (see page 265), and Application triage map transaction sampling (see page 268).

Documentation Changes
20 Java Agent Guide
For more information about the ProbeBuilder Directives used to configure application triage map data, see Default PBD files (see page 111).
For support for EJB 2.0 and 3.0 for the application triage map, see EJB 2.0 and 3.0 support for the application triage map (see page 127).
For SSL, NIO, and socket tracing in the application triage map, see SSL, NIO, and socket tracing in the application triage map (see page 160).
Agent-only business transaction recording
Introscope 9.0 allows you to record information from agents using the Wily CEM console. Introscope 9.0 agents can now record and monitor transactions, allowing you to track information about how your application is doing from a business perspective. For example, you can record a business transaction in your Purchasing application with the agent, and then monitor these transactions in the Introscope Workstation. The data from the agent shows which specific business transactions the Purchasing application is having problems with.
The business transaction information works hand-in-hand with the information gathered by application triage map support to display the activity of your application in a graphical format. For more information on how to record business transaction information using the agent, see the CA Wily APM Transaction Definition Guide. For more information about the application triage map and viewing information in the map, see the Introscope Workstation User Guide.
For more information about configuring the agent for business transaction recording, see Agent recording (business recording) (see page 256).
Dynamic instrumentation
Dynamic instrumentation is performed from the Introscope Workstation transaction trace viewer. Instrumenting a method dynamically means inserting the instrumentation during runtime. Users can dynamically instrument one, more, or all of the methods during a transaction trace session, and subsequently view metrics returned by the newly instrumented methods. This allows users to do dynamic application performance tuning.
For more information about dynamic instrumentation, see Dynamic ProbeBuilding vs. dynamic instrumentation (see page 71).

The Introscope environment
Chapter 1: The Java Agent Overview 21
Java NIO
The Java Agent supports the Java New I/O (Java NIO, or NIO) capabilities introduced in Java 1.4. Java NIO is a collection of APIs designed to provide access to the low-level I/O operations of modern operating systems. The agent’s Java NIO metrics capture information about how instrumented applications use Java NIO. For more information, see Java NIO (see page 21).
Multiple inheritance support
The Introscope Java Agent supports instrumentation by interface as well as multiple inheritance. This ability has been extended to dynamic instrumentation in Introscope 9.0. A new tracer to instrument interfaces and abstract methods is available. For more information, see Support for multiple inheritance, interfaces, and abstract methods (see page 73).
LeakHunter and ErrorDetector configuration
LeakHunter and ErrorDetector are now included in the core Introscope installation. As such, the configuration information for LeakHunter and ErrorDetector has been incorporated into this guide. For more information, see Configuring LeakHunter and ErrorDetector (see page 177).
The Introscope environment
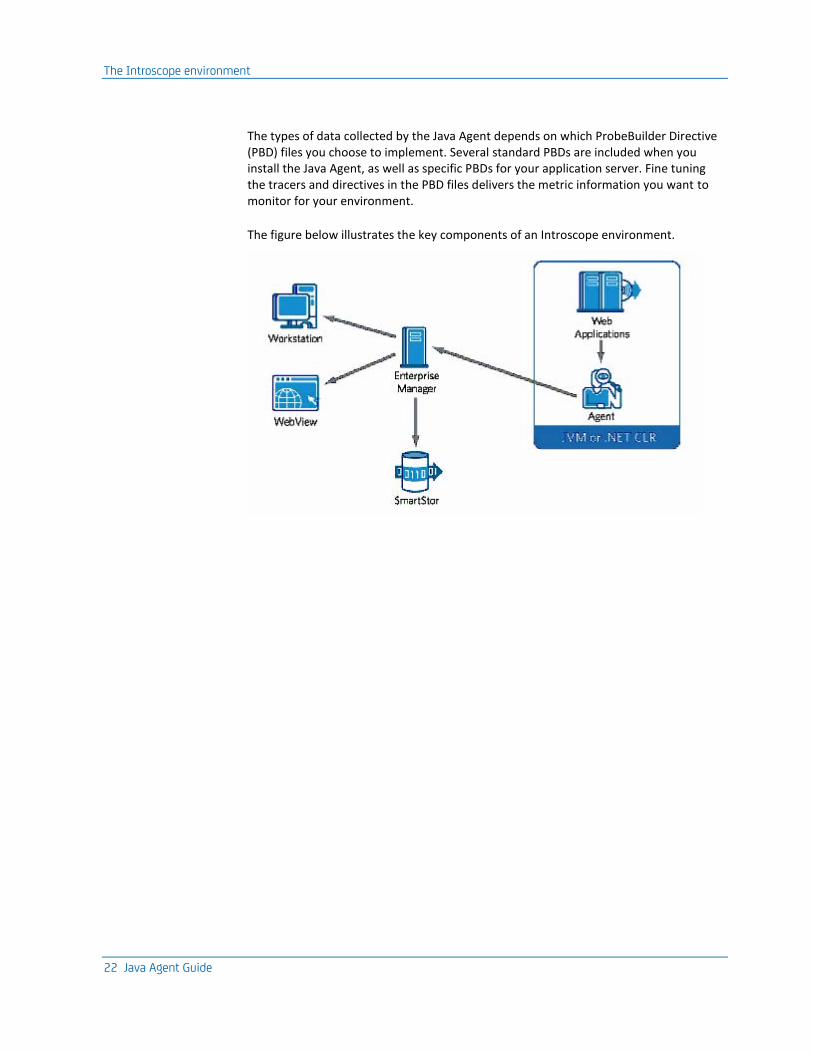
CA Wily Introscope is an enterprise application performance management solution that enables you to monitor complex web applications in production environments 24x7, detect problems before they affect your customers, and resolve these issues quickly and collaboratively.
The Java Agent is the component of Introscope that collects performance data from applications running on Java Virtual Machines (JVMs), as well as the application server, and performance and availability data from the surrounding computing environment. The Java Agent uses probes in the application byte code to gather this data, and then sends it to the Introscope Enterprise Manager. Which data the probes monitor is controlled by ProbeBuilder Directive (PBD) files, which you can change to suit the monitoring needs of your environment.
The Enterprise Manager processes and analyzes the data received from the Java Agent. You can access this information from the Introscope Workstation, where you can review the information and set up actions and alerts based on the data received.
The Introscope environment
22 Java Agent Guide
The types of data collected by the Java Agent depends on which ProbeBuilder Directive (PBD) files you choose to implement. Several standard PBDs are included when you install the Java Agent, as well as specific PBDs for your application server. Fine tuning the tracers and directives in the PBD files delivers the metric information you want to monitor for your environment.
The figure below illustrates the key components of an Introscope environment.

Planning a Java Agent deployment
Chapter 1: The Java Agent Overview 23
Planning a Java Agent deployment
It is important to develop the right Java Agent configuration for your applications and the environments in which they run. The figure below illustrates the key processes in a Java Agent configuration and deployment process.
Discover Introscope functionality
The first step in developing an Introscope implementation involves "test driving" the default Introscope Java Agent configuration. A default Java Agent configuration demonstrates data collection functionality and is key to understanding and evaluating the out-of-the box features of the Java Agent and Introscope as a whole. When you install Introscope, a default Java Agent configuration is included.
The Java Agent provides a variety of data collection options out-of-the box and can be customized to collect more environment-specific data. Naturally, however, the more data (metrics) a Java Agent collects, the more system resources it consumes.
When evaluating the environment, the primary goal is to understand the depth and breadth of Introscope’s data collection and application management features. As you refine your Java Agent configuration, you will streamline data collection to balance the depth of data collection against overhead constraints and arrive at a configuration that employs the proper level of instrumentation that delivers essential information.
Planning a Java Agent deployment
24 Java Agent Guide
Determine configuration requirements
Before introducing Introscope into your environment, whether pre-production or live, you should determine your data collection requirements. This information will help you tailor the data collection behaviors of the Java Agent and evaluate the impact on overhead through alternative configurations of the Java Agent.
Since Introscope is employed across an application lifecycle—in development, testing and performance, and production—your monitoring goals, environmental constraints, and service level requirements will change over time. You will need to configure Java Agents differently to deliver on the goals for each phase or environment.
Java Agent configuration is a trade-off between visibility vs. overhead. The goal is to obtain optimal visibility at a reasonable cost.
In pre-production environments, such as development and QA, you typically configure a higher level of data collection to provide deeper visibility into the performance characteristics of the application.
In production or production-like environments, you reduce the level of metric reporting to control Java Agent overhead, and when appropriate, implement optional configurations such as Virtual Agents or agent failover.
If you intend to collect data from multiple environments, you will need to develop an appropriate Java Agent configuration for each.
Create and define Java Agent configuration
After defining your configuration requirements based on your application and its operating environment, you should create a "candidate" agent configuration. Most high level Java Agent behaviors are configured in the agent profile (IntroscopeAgent.profile). Which metrics are gathered by the Java Agent are controlled by ProbeBuilder Directive and ProbeBuilder List files. Some features may also require some configuration in your application server or require other configuration steps.
Depending on the complexity of your configuration and the target environment, you may choose to build up the agent configuration in stages so that you can evaluate the impact of each add-on component, such as ChangeDetector, LeakHunter, or Introscope PowerPacks and ensure it is working before adding more.

Deploying the Java Agent
Chapter 1: The Java Agent Overview 25
Evaluate Java Agent performance overhead
When evaluating a Java Agent configuration, verify that the metrics collected provide sufficient visibility into application performance and availability, and that the volume of metrics do not impose an unacceptable load on the operating environment. The Java Agent should not report more metrics than are necessary to identify and localize performance and availability problems.
To effectively understand and evaluate Java Agent overhead, you must understand the performance characteristics of the application prior to monitoring it with Introscope.
For example, you can load test your application before and after implementing out-of-the-box monitoring to verify impact. Similarly, a conservative approach is to extend data collection in a controlled fashion—for instance, one PowerPack at a time—and evaluate the impact of each add-on individually.
Validate and deploy Java Agent configuration
After you have verified that a candidate agent configuration provides the visibility required for the target environment without imposing unacceptable overhead, you should deploy the validated configuration across that environment.
In practice, the process of deploying a validated configuration includes installing the validated configuration artifacts—specifically IntroscopeAgent.profile and modified or custom PBD files—to the target environment.
Deploying the Java Agent
The Java Agent deployment process follows these high level steps:
1. Install the Java Agent on the target JVM. For more information, see Installing and Configuring the Java Agent (see page 27).
2. Configure the properties in the IntroscopeAgent.profile file that govern the operating and data collection behaviors of the Java Agent, including which PBDs to use during the ProbeBuilding process and optional ProbeBuilding behaviors. For more information, see Java Agent configuration overview (see page 53) and ProbeBuilder Directives (see page 56).
3. Configure the JVM to use a supported method of ProbeBuilding. For more information, see AutoProbe and ProbeBuilding Options (see page 61).
4. Restart your application and start data collection.


Chapter 2: Installing and Configuring the Java Agent 27
Chapter 2: Installing and Configuring the Java Agent
This section provides instructions for installing the Java Agent, including key information, decisions, and resources that should be identified or obtained before you install and configure the Java Agent and the different methods you can use to install the agent.
This section contains the following topics:
Before you begin (see page 27) Installing the Java Agent (see page 29) Java Agent installation directories and files (see page 43) Configuring the JVM to use the Java Agent (see page 48) Starting the Java Agent (see page 48) Connecting to the Enterprise Manager (see page 48) Java Agent configuration overview (see page 53) Upgrading multiple agent types (see page 57) Uninstalling the Java Agent (see page 59)
Before you begin
Before you install and configure the Java Agent, you need to verify the application server where you want to install is supported, identify the Enterprise Manager to which the agent should send data, and determine how Java classes should be instrumented.
Application server support
The following application servers with the required patches are supported by the Java Agent:
■ Apache Tomcat 4.1, 5.0, 5.5, or 6.0
■ JBoss 4.0.3 SP1, 4.0.2, 4.2x, or 5.0
■ Fujitsu Interstage Application Server v9.0 (Japanese & English)
■ Oracle 10g Application Server version 10.1.3 with any required updates
■ SAP NetWeaver 7.10
■ Sun Application Server 8.0, 9.0, or Sun Glassfish 2.1
Before you begin
28 Java Agent Guide
■ WebLogic 9.0.x ,9.2 10.x or 10.3.x with any required patches
■ WebSphere Application Server 6.1, or 7.0 with any required patches
■ WebSphere Application Server on z/O 6.1, or higher, with any required patches
Important: Java Agents, version 9.0 and higher, do not support applications running on Java 1.4.x. If you have a Java 1.4.x-based application, use the 8.x Java Agent to manage that application. If you have a Java 1.3.x-based application, use the 7.2 Java Agent to monitor that application. The Introscope Enterprise Manager supports Java Agents 6.0 and higher.
When the Java Agent is installed on an application server, after the server with the Java Agent starts, a Wily log directory is created here: <Agent_Home>/wily/logs, where <Agent_Home> is the location of the Java Agent installation. Because the agent runs inside the application server, the application server process must have full read/write/execute permissions on the <Agent_Home>/wily directory. To accomplish this, install the Java Agent on the same operating system as the user who runs the application server process. Or, install the Java Agent as a different user, then use the commands appropriate for your application server to assign the necessary permissions to the agent files.
Fore more information on the file structure created when the Java Agent is installed, see Java Agent installation directories and files (see page 43).
Enterprise Manager connection information
The Java Agent runs inside the JVM that runs the applications you wish to monitor and connects to the Introscope Enterprise Manager. If your agent reports to a clustered Enterprise Manager you must configure it to connect to a Manager of Managers (MOM) Enterprise Manager. For more information on the MOM Enterprise Manager, see the Introscope Configuration and Administration Guide.
If you have multiple Enterprise Managers, clustered or not, you can configure your Java Agent to failover to an alternate Enterprise Manager if it disconnects from its primary Enterprise Manager. For more information on connecting to an Enterprise Manager, see Connecting to the Enterprise Manager (see page 48). For more information on agent failover to alternate Enterprise Managers, see Configuring Java Agent Failover (see page 173). For more information on clustered Enterprise Managers, see the Introscope Configuration and Administration Guide.

Installing the Java Agent
Chapter 2: Installing and Configuring the Java Agent 29
JVM AutoProbe
CA Technologies recommends using JVM AutoProbe to dynamically instrument all classes loaded by the JVM, adding probes that generate metrics from the Java bytecode. JVM AutoProbe is supported if you use:
■ Java 1.5 JVM or higher
■ Sun or IBM 1.5 JVM
■ JRockit 1.5 or higher
■ HP Hotspot 1.5 or higher
Most CA Wily Introscope users instrument their applications using JVM AutoProbe.
Other ProbeBuilding options
Very rarely, a JVM might not support JVM AutoProbe. If you find that your JVM does not work with JVM AutoProbe, there are two other options:
■ configure Application Server AutoProbe, as described in The Java Agent and Application Server AutoProbe (see page 365).
■ perform the ProbeBuilding process manually, as described in Manual ProbeBuilding (see page 355).
If JVM AutoProbe does not function with your JVM, please contact CA Support before attempting the above ProbeBuilding options. CA Support may be able to resolve your functionality problems with JVM AutoProbe, or will be able to recommend the best alternative for your environment.
Important: CA Technologies highly recommends using JVM AutoProbe to instrument your applications. Other methods of instrumentation should only be used if JVM AutoProbe fails. If you do not use JVM AutoProbe to instrument your applications, you will not be able to use some of the new agent features.
Installing the Java Agent
There are two methods of installing the Java Agent:
■ Use the Java Agent installer, which performs several tasks for you. For more information, see The Java Agent installer (see page 30).
OR
■ Manually install the Java Agent, where you perform all installation tasks. For more information, see Manual installation (see page 40).
You should select only one method for installing a Java Agent. Using both methods at the same time may cause the Java Agent to not function correctly.

Installing the Java Agent
30 Java Agent Guide
The Java Agent installer
The Java Agent installer is an operating system specific program that automates several of the installation tasks, making it easier to deploy agents across large environments. To use the Java Agent installer, select the installer appropriate for your operating environment:
■ Windows - IntroscopeAgentInstaller9.0.0.0windows.zip contains IntroscopeAgent9.0windows.exe and a response file.
■ UNIX - IntroscopeAgentInstaller9.0.0.0unix.tar contains IntroscopeAgent9.0unix.bin and a response file.
■ z/OS - IntroscopeAgentInstaller9.0.0.0zOS.tar contains IntroscopeAgent9.0zOS.jar, a runinstaller.sh script, a tmppath file, and a response file.
■ OS/400 - IntroscopeAgentInstaller9.0.0.0os400.zip contains the IntroscopeAgent9.0os400.jar, a runinstaller.sh script, and a response file.
Note: The Java Agent installer must be launched with JVM 1.5 or later. If you specify an application server JVM, that JVM also must be version 1.5 or later.
When you use the Java Agent installer, it performs the following tasks for you:
■ Installs the Java Agent, including platform monitors and PBDs for the target environment.
■ Edits certain settings in the IntroscopeAgent.profile, or installs an agent profile provided by you.
■ Generates the connector .jar, if appropriate.
■ Installs any custom PBDs, add-ons, or PowerPacks you select.
■ Before exiting, the installer prints the location of a text file that contains application server-specific "Next Steps".
The Java Agent installer has three modes it can be used in:
■ GUI mode: an interactive installer that allows you to select components for installation from menus. For more information, see Installing the Java Agent in GUI mode (see page 31).
■ Console mode: an installer supported on most non-Windows platforms. On these platforms, such as UNIX, z/OS, or OS/400, the console installer launches automatically. Selections made for the installation are input in to a command line interface. For more information, see Installing the Java Agent in console mode (see page 34).
■ Silent mode: an installer that requires no interaction with a GUI or console. Silent installations use settings specified in a response file. For more information, see Installing the Java Agent in silent mode (see page 36).
Installing the Java Agent
Chapter 2: Installing and Configuring the Java Agent 31
Installing the Java Agent in GUI mode
The GUI mode of the Java Agent installer allows you to make selections from drop-down menus.
To install the Java Agent using the installer in GUI mode:
1. Choose an installer that matches your target environment and open it.
■ If you are installing the Java Agent on a UNIX system, you must use the tar -xvf command to extract the .tar file. Do not use unzip.
■ If you are installing the Java Agent on Linux, you need to open a terminal and launch the Java Agent installer with the following command:
IntroscopeAgent<version>unix.bin -i swing
Where <version> is the release number you want to install.
2. Follow the onscreen prompts to install the Java Agent. You will need to know the following:
■ The location of the application server root directory.
If you do not want to specify an application server root directory, you should accept the default response (C:\ on Windows, / on UNIX).
■ The application server type.
■ Where you want the install directory to be located.
If you supplied a root directory on the first screen of the install process, the installer suggests the application server root directory. If you did not specify an application root directory, the default Introscope install directory is suggested.
This directory will become the <Agent_Home> referred to in the rest of this guide.
■ Whether you want to use a custom agent profile, or create a new agent profile when the agent is installed.
■ If you choose to use a custom agent profile, the installer will ask you for the location of the this file. Supply the fully qualified path to the file location.
■ If you choose to create a new agent profile, you must decide to use either typical or full instrumentation, the agent and process name, and the Enterprise Manager host and port.
Note: Empty values are allowed for both the agent and process name, and the Enterprise Manager host and port. These values can be configured after installation in the IntroscopeAgent.profile, located in the <Agent_Home>/wily directory that will be installed.
Installing the Java Agent
32 Java Agent Guide
■ Name of the agent and process.
■ The Enterprise Manager host name and port. This information can be added later. See Connecting to the Enterprise Manager (see page 48) for more information.
■ The instrumentation level.
Select between Full or Typical.
■ Full produces more detailed reporting and is recommended for QA or development environments.
■ Typical consumes less overhead and is recommended for production environments.
You can change the instrumentation levels after installing if you choose. For more information, see AutoProbe and ProbeBuilding overview (see page 61).
■ Specify the Java executable that is used to launch your application server.
■ Specify the ProbeBuilding method that will be used to instrument your application. CA Technologies recommends using JVM AutoProbe. For more information on instrumentation, see AutoProbe and ProbeBuilding overview (see page 61).
■ Choose whether to enable the ChangeDetector agent extension or not.
■ If you decide to enable ChangeDetector, the next screen will ask you to name the ChangeDetector agent.
■ If you choose not to enable the ChangeDetector agent extension, the ChangeDetector files will be placed in the <Agent_Home>/wily/examples directory. If you later want to enable ChangeDetector, copy the files to the <Agent_Home>/wily/ext directory and modify the introscope.changeDetector.enable property in the IntroscopeAgent.profile to enable ChangeDetector.
For more information on the directory structure and files that are installed with the Java Agent, see Java Agent installation directories and files (see page 43).
For more information about ChangeDetector, see the Introscope ChangeDetector User Guide.

Installing the Java Agent
Chapter 2: Installing and Configuring the Java Agent 33
■ Choose whether to enable SOA Performance Management and SOA extensions or not. Select the check box next to the components you want to enable. If you choose to enable SOA agent extensions:
■ Two PBD files, appmap-soa.pbd and webservices.pbd, are added to the introscope.autoprobe.directivesFile property in the IntroscopeAgent.profile.
■ The WebServicesAgent.jar and BoundaryOnlyTrace.jar files are added to the <Agent_Home>/wily/ext directory.
If you do not enableSOA Performance Management or SOA extensions, files for enabling them later are added to the <Agent_Home>/wily/examples directory. For more information about configuring SOA Performance Management or SOA extensions, see the SOA Performance Management Guide.
For more information on the directory structure and files that are installed with the Java Agent, see Java Agent installation directories and files (see page 43).
■ Select PowerPacks you want to install using the check boxes provided.
Depending on the application server JVM you chose, only PowerPacks that function with that application server are available for selection.
If you choose not to install PowerPacks, the files for all the PowerPacks are stored in the <Agent_Home>/wily/examples folder.
For the PowerPacks you choose to install, the files are stored in the <Agent_Home>/wily/ext folder as well as the <Agent_Home>/wily/examples folder.
If you want to install additional PowerPacks at a later time, copy the selected PowerPack files from the <Agent_Home>/wily/examples folder to the <Agent_Home>/wily/ext folder.
Refer to the PowerPack documentation for more configuration information.
For more information on the directory structure and files that are installed with the Java Agent, see Java Agent installation directories and files (see page 43).
Installing the Java Agent
34 Java Agent Guide
■ The location of a "pickup folder".
Any .zip or .tar files in this folder are extracted into the agent directory, by default <Agent_Home>/wily.
If unusable input is provided for any of the above options, the installer will provide reasonable error messages explaining the problem and how to correct it.
3. When you are finished making selections, click Install. The installer will install the Java Agent. When the installation is complete, the installer provides a fully qualified path to the Introscope_Agent_Installation_README.txt file, which contains:
■ the specific steps the installer took to install the Java Agent.
■ the next steps that must be performed manually in order to complete the installation.
The GUI installer does not stop or start the application server, or modify the application server JVM configuration parameters. These tasks need to be performed manually.
Installing the Java Agent in console mode
The Java Agent installer in console mode is supported on most non-Windows platforms. On these platforms, such as UNIX, z/OS, or OS/400, the console installer launches automatically.
When using the Java Agent installer in console mode, the console will prompt you to enter information about your installation. For example, you will need to know:
■ The location of the application server root directory.
If you do not want to specify an application server root directory, you should accept the default response (C:\ on Windows, / on UNIX).
■ The application server type. The Java Agent can monitor the following application servers:
■ Default
■ WebSphere
■ JBoss
■ Sun Application Server
■ Tomcat
■ Oracle
■ WebLogic
■ Interstage
■ Where you want the install directory to be located.

Installing the Java Agent
Chapter 2: Installing and Configuring the Java Agent 35
■ Whether you want to use a custom agent profile, or create a new agent profile when the agent is installed.
■ If you choose to use a custom agent profile, the installer will ask you for the location of the this file. Supply the fully qualified path to the file location.
■ If you choose to create a new agent profile, you must decide typical or full instrumentation, the agent and process name, and the Enterprise Manager host and port.
Empty values are allowed for both the agent and process name, and the Enterprise Manager host and port. These values can be configured after installation.
■ The agent name and process name.
■ Connection settings for the Enterprise Manager.
■ The instrumentation type. CA Technologies recommends using JVM AutoProbe. For more information on JVM AutoProbe, see Configuring JVM AutoProbe (see page 62).
■ The application server JVM.
■ Enable the ChangeDetector agent extension or not.
■ If you decide to enable ChangeDetector, name the ChangeDetector agent/
■ If you choose not to enable the ChangeDetector agent extension, the ChangeDetector files will be placed in the <Agent_Home>/wily/examples directory. If you later want to enable ChangeDetector, copy the files to the <Agent_Home>/wily/ext directory and modify the introscope.changeDetector.enable property in the IntroscopeAgent.profile to enable ChangeDetector.
For more information on configuration and use of ChangeDetector, see the Introscope ChangeDetector User Guide.
■ Enable SOA Performance Management and SOA extensions or not. If you chose to enable SOA agent extensions:
■ Two PBD files, appmap-soa.pbd and webservices.pbd, are added to the introscope.autoprobe.directivesFile property in the IntroscopeAgent.profile.
■ The WebServicesAgent.jar and BoundaryOnlyTrace.jar files are added to the <Agent_Home>/wily/ext directory.
If you do not enableSOA Performance Management or SOA extensions, files for enabling them later are added to the <Agent_Home>/wily/examples directory. For more information about configuring SOA Performance Management or SOA extensions, see the SOA Performance Management Guide.
Installing the Java Agent
36 Java Agent Guide
■ Select the PowerPacks you want to install using the check boxes provided. If you choose not to install PowerPacks, the files for all the PowerPacks are stored in the <Agent_Home>/wily/examples folder. For the PowerPacks you choose to install, the files are stored in the <Agent_Home>/wily/ext folder as well as the <Agent_Home>/wily/examples folder.
If you want to install the PowerPacks at a later time, copy the selected PowerPack files from the <Agent_Home>/wily/examples folder to the <Agent_Home>/wily/ext folder.
■ The location of a "pickup folder". Any .zip or .tar files in this folder are extracted into the agent directory, by default <Agent_Home>/wily.
The console displays the selections you made during installation and asks for confirmation. The installer then provides a fully qualified path to the Introscope_Agent_Installation_README.txt file, which contains:
■ the specific steps the console install took to install the Java Agent.
■ the next steps that must be performed manually in order to complete the installation.
The console installer does not stop or start the application server, or modify the application server JVM configuration parameters. These tasks need to be performed manually.
Installing the Java Agent in silent mode
The Java Agent can be installed in silent mode, which requires no interaction with a GUI or console. Silent installations use the settings specified in a response file.
To install the Java Agent in silent mode:
1. Open the SampleResponseFile.Agent.txt file, located in the same directory as the executable agent installer.
2. Edit the SampleResponseFile.Agent.txt file to reflect your preferred settings.
3. Place the SampleResponseFile.Agent.txt file in any directory.
The silent installer performs these tasks:
■ places Java Agent files on the filesystem
■ edits the IntroscopeAgent.profile
■ generates a connector .jar, if necessary
■ copies certain .jar files into your application server directories, where applicable
■ generates a "Next Steps" readme file

Installing the Java Agent
Chapter 2: Installing and Configuring the Java Agent 37
The silent installer does not stop or start the application server, or modify the application server JVM configuration parameters. These tasks need to be performed manually.
Important: The silent installer does not perform upgrades. By default, if the silent installer detects a pre-existing Java Agent in the specified install directory, no installation is performed. CA Technologies recommends you do not use this installer to overwrite an existing Java Agent installation.
To install the Java Agent using the installer in silent mode:
1. Open the SampleResponseFile.Agent.txt.
2. Set the following properties:
■ USER_INSTALL_DIR=
Specify the directory where the Java Agent files are to be installed. CA Technologies recommends selecting the application server's root directory.
On all platforms, the file path must end with a file separator. On Windows, backslashes must be escaped. For example:
■ On Windows: C:\\myAppServerHome\\
■ On UNIX: /myAppServerHome/
■ silentInstallChosenFeatures=Agent,Documentation
Specify the agent features to install. This must be a comma-delimited list. Valid values are Agent and Documentation, which are case-sensitive. If the Documentation feature is included, basic documentation is installed into the <Agent_Home>\wily directory.
■ appServer=Default
Specify the application server type. Valid values are Default, JBoss, Tomcat, WebLogic, WebSphere, Sun, Oracle, or Interstage. Application server-specific ProbeBuilder Directives (PBDs) are installed with the Java Agent.
■ appServerHome=
You can also specify the home directory of the application server to monitor. This is an optional configuration. To use it, uncomment and set the property.
The installer uses this information to copy certain .jar files into the application server directories if necessary.
On all platforms, the path must end with a file separator. On Windows, backslashes must be escaped. For example, on Windows:
C:\\apache\\tomcat\\5.0.30\\
D:\\bea\\weblogic900\\
On UNIX:
/root/bea/weblogic900/

Installing the Java Agent
38 Java Agent Guide
■ appServerJavaExecutable=
You can also specify the Java executable used to launch the monitored application server. The silent installer uses this information to check the JVM vendor and version, and generates a connector jar if necessary.
On Windows, backslashes in the path must be escaped. Some sample values for this property are:
■ On Windows: C:\\Program Files\\Java\\jre1.5.0_06\\bin\\java.exe
■ On UNIX: /usr/bin/java
■ instrumentationLevel=Typical
Specify the level of instrumentation to use. Valid values are Full or Typical, which are case-sensitive.
The Full setting achieves more detailed reporting and is recommended for test environments.
The Typical setting provides less detail with reduced overhead, and is recommended for production environments.
■ instrumentationType=JVM AutoProbe
Specify the ProbeBuilding method that is used to instrument the application. Case-sensitive valid values are:
■ JVM AutoProbe
■ Application Server AutoProbe
■ Manual ProbeBuilding
CA Technologies recommends using JVM AutoProbe. See the AutoProbe and ProbeBuilding Options (see page 61) for more information.
■ agentName=Default Agent
■ processName=Default Process
Specify the agent and process names. Spaces and empty values are allowed.
■ emHost=localhost
■ emPort=5001
Specify the hostname and port of the Introscope Enterprise Manager to which this agent will connect.

Installing the Java Agent
Chapter 2: Installing and Configuring the Java Agent 39
■ #alternateAgentProfile=
You can choose to use a custom agent profile. Uncomment and specify the absolute path to a custom agent profile. If you specify an alternate file, it will be used instead of the default agent profile, and all of the properties in the "Agent Settings" section of the SampleResponseFile.Agent.txt file will be ignored, except for the instrumentationType property.
On Windows, backslashes must be escaped. Some sample values for this property are:
■ On Windows: C:\\customAgentProfiles\\CustomIntroscopeAgent.profile
■ On UNIX: /home/iscadmin/customAgentProfiles/CustomIntroscopeAgent.profile
■ #pickupFolder=
You can also specify the absolute path to a "pickup folder". The pickup folder provides a convenient way of installing extensions or add-ons alongside the base agent. Any .zip or .tar files present in the pickup folder will be extracted into the agent directory at install time. On all platforms, the path must end with a file separator. On Windows, backslashes must be escaped. For example:
■ On Windows: C:\\pickupFolderContainingAddOns\\
■ On UNIX: /home/iscadmin/customAgentProfiles/pickupFolderContainingAddOns/
■ changeDetectorEnable=false
Specify whether to enable the ChangeDetector agent extension during installation. You can specify true or false.
If you specify false, ChangeDetector files are installed but are not enabled. You can enable ChangeDetector later by editing the agent profile.
If you have enabled ChangeDetector, you should also uncomment and specify the ChangeDetector agent ID. For example:
changeDetectorAgentID=JBossChangeDetector
■ SOA Agent extensions
Specify which SOA Performance Management and SOA extensions you want to enable during installation by changing the appropriate property value to true. If you choose not to enable any SOA extensions, the files are installed in the <Agent_Home>/wily/examples directory. To enable them later, you must copy the files to the <Agent_Home>/wily/ext directory and modify the agent profile to enable the files.
shouldEnableSPM=false
shouldEnableSOAExtForOSB=false
shouldEnableSOAExtForWPS=false
shouldEnableSOAExtForWESB=false

Installing the Java Agent
40 Java Agent Guide
■ PowerPacks
Specify the PowerPacks you want to enable during this installation by changing the property to true. If you choose not to install PowerPacks, the files for all the PowerPacks are stored in the <Agent_Home>/wily/examples directory. For the PowerPacks you choose to install, the files are stored in the <Agent_Home>/wily/ext directory as well as the <Agent_Home>/wily/examples directory.
If you want to install additional PowerPacks at a later time, copy the selected PowerPack files from the <Agent_Home>/wily/examples folder to the <Agent_Home>/wily/ext folder.
shouldEnablePowerPackForWebLogic=false
shouldEnablePowerPackForWebSphere=false
shouldEnablePowerPackForSiteMinder=false
3. Save the SampleResponseFile.Agent.txt.
4. Select the appropriate command format from the list below, and enter it at the command line to invoke the installer:
■ installer.exe -f <absolute_path_to_response_file>
■ installer.bin -f <absolute_path_to_response_file>
■ java -classpath installer.jar install -f <absolute_path_to_response_file>
■ installer.sh IntroscopeAgent9.0os400.jar <aabsolute_path_to_response_file>
Manual installation
Extract the Java Agent installer archive into a Java a directory of your choice, referred to in this guide as the <Agent_Home>. For information about the directory structure of the agent installation, see Java Agent installation directories and files (see page 43).
For a list of Java Agent installer archives, see Java Agent installer archives (see page 41).
The Java Agent requires 35 MB of free disk space to be installed.
To manually install the Java Agent:
1. Select an installer archive for your specific JVM. For a list of installer archives, see Java Agent installer archives (see page 41).
2. Extract the files of the installer archive into a location your JVM can access.
If you are installing the Java Agent on a UNIX system, you must use the tar -xvf command to extract the .tar file. Do not use unzip.

Installing the Java Agent
Chapter 2: Installing and Configuring the Java Agent 41
3. Configure the properties in IntroscopeAgent.profile to your specific environmental needs. This file governs the Java Agent’s operating and data collection behaviors, including which PBDs to use during the ProbeBuilding process, optional ProbeBuilding behaviors, and the connection to the Enterprise Manager. You will need to know the location of the files extracted in step 2.
Additional configuration options for the IntroscopeAgent.profile are covered in the rest of this guide. See Connecting to the Enterprise Manager (see page 48) to get started.
4. Configure the JVM to use a supported method of ProbeBuilding. For more information, see AutoProbe and ProbeBuilding Options (see page 61).
5. Restart your application.
Java Agent installer archives
Java Agent installer archives contain all files that would have been installed on your system had you run the agent installer. CA Technologies provides these archives to expidite deployment of the Java Agent during manual installation.
The following Java Agent installer archives are available for different application servers and operating systems.
WebLogic
IntroscopeAgentFilesOnly-NoInstaller<version>weblogic.os400.zip
IntroscopeAgentFilesOnly-NoInstaller<version>weblogic.unix.tar
IntroscopeAgentFilesOnly-NoInstaller<version>weblogic.windows.zip
IntroscopeAgentFilesOnly-NoInstaller<version>weblogic.zOS.tar
WebSphere
IntroscopeAgentFilesOnly-NoInstaller<version>websphere.unix.tar
IntroscopeAgentFilesOnly-NoInstaller<version>websphere.windows.zip
IntroscopeAgentFilesOnly-NoInstaller<version>websphere.zOS.tar
IntroscopeAgentFilesOnly-NoInstaller<version>websphere.os400.zip
Sun
IntroscopeAgentFilesOnly-NoInstaller<version>sun.unix.tar
IntroscopeAgentFilesOnly-NoInstaller<version>sun.windows.zip
Oracle 10g
IntroscopeAgentFilesOnly-NoInstaller<version>oracleas.unix.tar
IntroscopeAgentFilesOnly-NoInstaller<version>oracleas.windows.zip
SAP NetWeaver
For SAP support on Windows:
IntroscopeForSAPNetWeaverConversionKit<version>.windows.zip
For Solaris, HP-UX, AIX, and Linux:
IntroscopeForSAPNetWeaverConversionKit<version>.unix.tar

Installing the Java Agent
42 Java Agent Guide
Apache Tomcat
IntroscopeAgentFilesOnly-NoInstaller<version>tomcat.unix.tar
IntroscopeAgentFiles-NoInstaller<version>tomcat.windows.zip
Fujitsu Interstage
IntroscopeAgentFilesOnly-NoInstaller<version>interstage.unix.tar
IntroscopeAgentFilesOnly-NoInstaller<version>interstage.windows.zip
JBoss
IntroscopeAgentFilesOnly-NoInstaller<version>jboss.unix.tar
IntroscopeAgentFilesOnly-NoInstaller<version>jboss.windows.zip
Default
IntroscopeAgentFilesOnly-NoInstaller<version>default.unix.tar
IntroscopeAgentFilesOnly-NoInstaller<version>default.windows.zip
IntroscopeAgentFilesOnly-NoInstaller<version>default.zOS.tar
IntroscopeAgentFilesOnly-NoInstaller<version>default.os400.zip
All application servers
The files contained in these archives have all files for all application servers supported by the Java Agent:
IntroscopeAgentFilesOnly-NoInstaller<version>allappserver.os400.zip
IntroscopeAgentFilesOnly-NoInstaller<version>allappserver.unix.tar
IntroscopeAgentFilesOnly-NoInstaller<version>allappserver.windows.zip
IntroscopeAgentFilesOnly-NoInstaller<version>allappserver.zOS.tar
In the file names, <version> indicates the release number of the Java Agent in the format of n.n.n.n. For example, if you want to install the files for the 9.0 Java Agent for monitoring WebLogic applications on a UNIX server, the Java Agent archive file name is:
IntroscopeAgentFiles-NoInstaller9.0.0.0weblogic.unix.tar

Java Agent installation directories and files
Chapter 2: Installing and Configuring the Java Agent 43
Java Agent installation directories and files
Installing a Java Agent creates the following directory structure:
wily\
connectors
deploy
examples
ext
hotdeploy
install
readme
tools
UninstallerData
version
Note: If you manually install the Java Agent, the install and UninstallerData directories are not present.
Java Agent operating and data collection behaviors are controlled by configuration properties stored in the agent profile and the PBDs it references. For more information about PBDs, see ProbeBuilder Directives (see page 56).
Contents of the wily directory
The wily directory contains:
■ Agent.jar—The Java Agent executable .jar file.
■ WebAppSupport.jar—Contains startup classes that you can configure to allow the Java Agent to obtain management information from an application server.
■ IntroscopeAgent.profile files—For the JVM you indicated during agent installation, a corresponding agent profile is present in this directory. The agent profile contains properties that control the behavior of the agent and AutoProbe. Defaults are supplied for many properties; the default values for certain properties vary, depending on the application server your agent installation supports. You can also change the location of the agent profile. For more information, see Configuring the IntroscopeAgent.profile location (see page 238).
■ ProbeBuilder Directives (PBDs)—Contains the standard ProbeBuilder Directives (PBDs) and ProbeBuilder Lists (PBLs) provided with the Java Agent, as well as application server-specific PBDs, which vary depending on the application server your agent installation supports. For more information on the standard PBDs and PBLs, see Default PBD files (see page 111) and Default PBL files (see page 114).
PBD files used for extensions and PowerPacks are also placed in this directory. See the documentation for the specific extension or PowerPack for more information.
■ ChangeDetector-config.xml—The configuration file for ChangeDetector.

Java Agent installation directories and files
44 Java Agent Guide
Contents of the wily\connectors directory
The wily\connectors directory contains:
■ CreateAutoProbeConnector.jar—Used in configuring JVM AutoProbe in supported environments.
Contents of the wily\deploy directory
If you install the Java Agent on JBoss, the wily\deploy directory is also installed. This directory contains:
■ introscope-jboss-service.xml—Web application support for JBoss, specifically JMX metrics.
Contents of the wily\examples directory
The wily\examples directory contains sample configuration files for agent extensions, such as PowerPacks, SOA, or SYSVIEW. If you did not enable an extension or PowerPack at installation, you can manually enable the extensions using the files in this directory. See the documentation for the specific extension or PowerPack for more information on where specific files should be placed and how to configure the extension.
SYSVIEW files
Files for the CA Technologies extension for CA SYSVIEW are installed by default when you run the Java Agent installer in any mode. Sample files are placed in the <Agent_Home>/wily/examples directory. SYSVIEW is disabled by default. See the Introscope Extension for CA SYSVIEW Guide for information on how to enable and configure this extension.
Contents of the wily\ext directory
The wily\ext directory contains:
■ The following files support the functioning of business definition monitoring and the application triage map:
■ AppMap.jar—Contains application triage map tracer and NameFormatter extensions.
■ BizDef.jar—Contains business definition monitoring and provides support for the application triage map in the Introscope Workstation Investigator.
■ BizTrxHttp.jar—Contains business definition monitoring and provides support for the application triage map in the Introscope Workstation Investigator.

Java Agent installation directories and files
Chapter 2: Installing and Configuring the Java Agent 45
■ CEMTracer.jar—Used in environments that integrate CA Wily Customer Experience Manager (CEM) with the Java Agent.
■ ChangeDetectorAgent.jar—Contains the ChangeDetector executable. The following JARs aid in ChangeDetector functionality:
■ ChangeDetector-Agent_Server.jar
■ ChangeDetector-CommonAll.jar
■ DynInstrBootstrap.jar—Contains dynamic instrumentation for bootstrap class support.
■ DynInstrSupport15.jar—Contains Dynamic Instrumentation support for Java 1.5.
■ Inheritance.jar—Used in Java 1.5 environments to enable AutoProbe to instrument multiple levels of subclasses of a probed class.
■ introscopeWindowsIntelAmd32Stats.jar—Contains platform monitors for Windows only.
■ introscopeWindowsIntelAmd64Stats.jar—Contains platform monitors for Windows only.
■ Java15DynamicInstrumentation.jar—Used in Java 1.5 environments to enable dynamic instrumentation, which allows you to implement new and changed PBDs without restarting the managed application or the agent.
■ LeakHunter.jar—Contains the LeakHunter executable.
■ ProbeBuilder.jar—Contains the ProbeBuilder executable. One of the following extensions to ProbeBuilder.jar is also included:
■ BasicDirectiveLoader.jar
■ SignedJARDirectiveLoader.jar
■ UnifiedDirectiveLoader.jar
■ RegexNormalizerExtension.jar—Contains the SQL Agent SQL normalizer extension.
■ ServletHeaderDecorator.jar—Used in environments that integrate CA Wily CEM with the Introscope agent.
■ SMWebAgentExt.jar—Contains the SPM Agent extension.
■ SQLAgent.jar—Contains the SQL Agent executable.
■ Supportability-Agent.jar—Supportability extensions for use by CA Supportt in agent support.

Java Agent installation directories and files
46 Java Agent Guide
Contents of the wily\hotdeploy directory
The hotdeploy directory allows Introscope administrators to deploy new directives more quickly and easily, without editing the IntroscopeAgent.profile, and, potentially, without restarting applications.
For more information about creating custom PBDs, see ProbeBuilder Directives (see page 56) and Creating custom tracers. For more information about dynamic ProbeBuilding, see Dynamic ProbeBuilding (see page 68).
Note: Any ProbeBuilder Lists (PBLs) placed in the hotdeploy directory are ignored by the Java Agent.
Placing directives in this directory heightens the need for caution. If your custom PBDs contain invalid syntax, or are configured to collect too many metrics, the impact will be felt more quickly. Invalid PBDs cause AutoProbe to shut off and PBDs that collect too many metrics can affect application performance.
To address this, CA Technologies recommends:
■ testing and validating all directives in QA and performance environments before pushing them out to production environments.
■ ensuring that your server environment's change control process is updated to reflect the new option for deploying PBDs.
Alterturnatively, you can decide not to use the hotdeploy directory.
To unconfigure the hotdeploy directory:
1. Move any of the custom PBDs stored in the hotdeploy directory to the main <Agent_Home>/wily directory.
2. Open the IntroscopeAgent.profile.
3. Remove hotdeploy from the introscope.autoprobe.directivesFile property.
4. Add the PBDs you want to use to the introscope.autoprobe.directivesFile property. For example:
introscope.autoprobe.directivesFile=default-typical.pbl,custom1.pbd,custom2.p
bd,custom3.pbd
5. Save the IntroscopeAgent.profile and restart the agent.

Java Agent installation directories and files
Chapter 2: Installing and Configuring the Java Agent 47
Contents of the wily\install directory
The wily\install directory contains:
■ autogenerated.responsefile.<date_and_time_stamp>—an automatically generated response file that reflects the settings you chose during installation. This file can be used to replicate the installation on other systems.
■ Introscope_Agent_<version>_InstallLog.log—if you installed the Java Agent using the agent installer, this log details the actions taken by the automatic installer.
■ IntroscopeAgentInstallation_README.txt—details the next steps you should take after installing the Java Agent, based on the decisions you made during the automatic installation.
■ SampleResponseFile.Agent.txt—Sample silent response file
Contents of the wily\tools directory
The wily\tools directory contains:
■ URLGrouper.jar—Contains the URLGrouper, a command-line utility that analyzes web server log files. For more information about the URLGrouper, see Running the URLGrouper (see page 201).
Contents of the wily\UninstallerData directory
The wily\UninstallerData directory contains:
■ Uninstall Introscope Agent .exe—Use this file to uninstall the Java Agent on Windows systems.
Contents of the wily\readme and wily\versions directories
Depending on what you chose to enable at installation, two other directories may be present in your file structure. The readme directory contains readme information for any extensions you enabled at installation. The version directory contains version information for any extensions you enabled at installation.

Configuring the JVM to use the Java Agent
48 Java Agent Guide
Configuring the JVM to use the Java Agent
You must change the configuration of the JVM you are instrumenting to locate the Java Agent code and configurations.
CA Technologies recommends using the JVM AutoProbe command line parameter –javaagent with a value of <PathToAgentJar>. It is recommended that <PathToAgentJar> be specified as an absolute path to the Introscope agent.jar file, though a relative path from the directory which was the ‘current’ directory when JVM started may also be used. For more information, see AutoProbe and ProbeBuilding Options (see page 61) for JVM AutoProbe configuration requirements for WebSphere on z/OS and OS/400, and specific application server environments such as WebSphere 6.1 running under IBM JVM 1.5 on any platform.
To specify which agent configuration to use, CA Technologies recommends using the Java system property com.wily.introscope.agentProfile with JVM command line option -Dcom.wily.introscope.agentProfile=<PathToAgentProfile>. It is recommended that <PathToAgentProfile> be specified as an absolute path, though a relative path from the directory which was the "current" directory when JVM started may also be used. If the property com.wily.introscope.agentProfile is not defined, the agent will attempt to locate the configuration file named IntroscopeAgent.profile in the directory the agent.jar file resides in.
Starting the Java Agent
To collect data about your applications, the Java Agent must be included in the application server's startup configuration. You must then restart the application server to start the Java Agent and instrument the classes discovered.
To report the collected data, the Java Agent must be connected to the Enterprise Manager. For more information about connecting to the Enterprise Manager, see Connecting to the Enterprise Manager (see page 48).
Connecting to the Enterprise Manager
To report metrics, the Java Agent must connect to an Enterprise Manager. You configure how the agent connects to the Enterprise Manager by changing properties in the IntroscopeAgent.profile, located in the <Agent_Home>/wily directory. CA Technologies recommends putting the Enterprise Manager on a system separate from the agent systems. For more information about sizing and performance recommendations, see the CA Wily APM Sizing and Performance Guide.

Connecting to the Enterprise Manager
Chapter 2: Installing and Configuring the Java Agent 49
The default communications settings in the IntroscopeAgent.profile enable an agent to connect to an Enterprise Manager located on the same system as the agent. To comply with the recommended deployment (different systems), you must modify the IntroscopeAgent.profile to connect the agent to a remote Enterprise Manager.
To configure Java Agent connection to the Enterprise Manager:
1. Open the IntroscopeAgent.profile.
2. Modify the following properties to specify the location of your remote Enterprise Manager:
■ introscope.agent.enterprisemanager.transport.tcp.host.DEFAULT
Defines the host name or IP address of the target Enterprise Manager.
■ introscope.agent.enterprisemanager.transport.tcp.port.DEFAULT
Defines the Enterprise Manager listening port, which should be the same port specified in the Enterprise Manager property introscope.enterprisemanager.port.DEFAULT. By default, this port is 5001.
Note: To change Enterprise Manager properties, open the IntroscopeEnterpriseManager.properties file on the Enterprise Manager machine, located in the <EM_Home>/config directory and modify the desired properties. Save the file for your changes to be implemented.
■ introscope.agent.enterprisemanager.transport.tcp.socketfactory.DEFAULT
Defines the socket factory used for connections to the Enterprise Manager.
The default value of this property is com.wily.isengard.postofficehub.link.net.DefaultSocketFactory, for plain socket communication.
3. Save the IntroscopeAgent.profile and start (or restart) the Java Agent.
For more information about connection properties, see Agent to Enterprise Manager connection (see page 258).
You can also configure alternate Enterprise Managers for the Java Agent to connect to, should the connection to the primary Enterprise Manager be lost. For more information on how to configure these Enterprise Managers, see Configuring Java Agent Failover (see page 173).
Connecting to the Enterprise Manager with HTTP tunneling
You can configure agents to communicate with an Enterprise Manager over HTTP. This allows communication to pass through firewalls that only permit HTTP traffic.
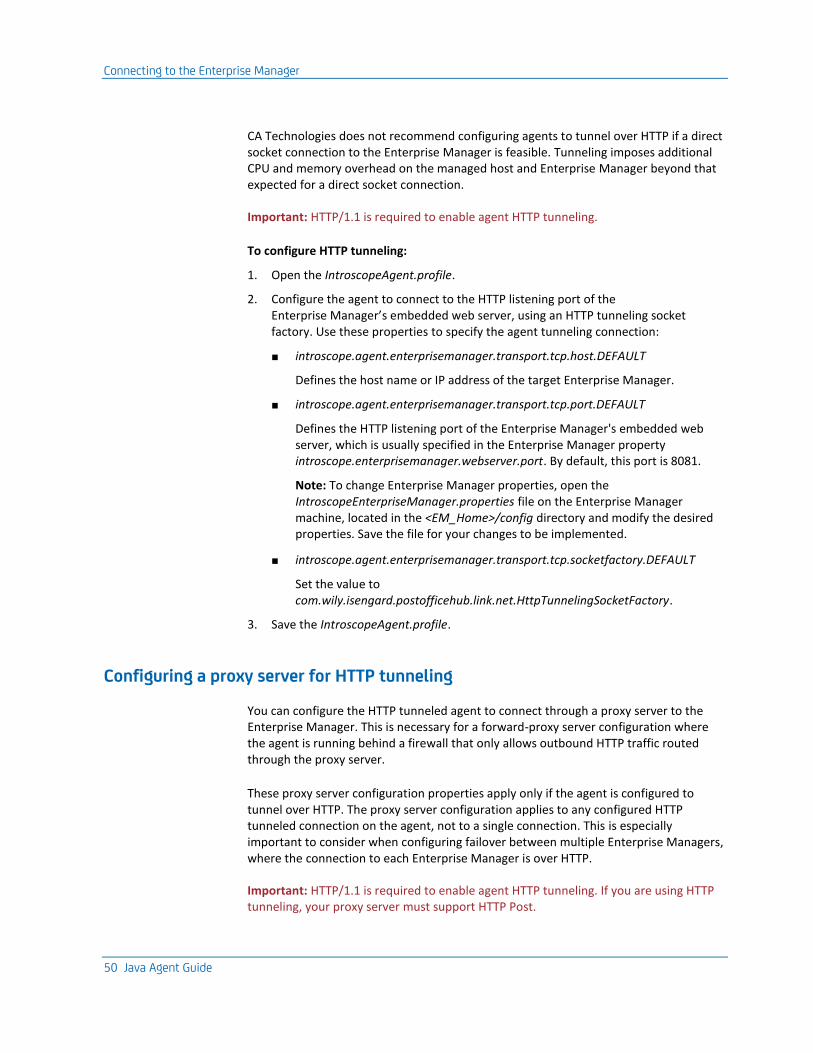
Connecting to the Enterprise Manager
50 Java Agent Guide
CA Technologies does not recommend configuring agents to tunnel over HTTP if a direct socket connection to the Enterprise Manager is feasible. Tunneling imposes additional CPU and memory overhead on the managed host and Enterprise Manager beyond that expected for a direct socket connection.
Important: HTTP/1.1 is required to enable agent HTTP tunneling.
To configure HTTP tunneling:
1. Open the IntroscopeAgent.profile.
2. Configure the agent to connect to the HTTP listening port of the Enterprise Manager’s embedded web server, using an HTTP tunneling socket factory. Use these properties to specify the agent tunneling connection:
■ introscope.agent.enterprisemanager.transport.tcp.host.DEFAULT
Defines the host name or IP address of the target Enterprise Manager.
■ introscope.agent.enterprisemanager.transport.tcp.port.DEFAULT
Defines the HTTP listening port of the Enterprise Manager's embedded web server, which is usually specified in the Enterprise Manager property introscope.enterprisemanager.webserver.port. By default, this port is 8081.
Note: To change Enterprise Manager properties, open the IntroscopeEnterpriseManager.properties file on the Enterprise Manager machine, located in the <EM_Home>/config directory and modify the desired properties. Save the file for your changes to be implemented.
■ introscope.agent.enterprisemanager.transport.tcp.socketfactory.DEFAULT
Set the value to com.wily.isengard.postofficehub.link.net.HttpTunnelingSocketFactory.
3. Save the IntroscopeAgent.profile.
Configuring a proxy server for HTTP tunneling
You can configure the HTTP tunneled agent to connect through a proxy server to the Enterprise Manager. This is necessary for a forward-proxy server configuration where the agent is running behind a firewall that only allows outbound HTTP traffic routed through the proxy server.
These proxy server configuration properties apply only if the agent is configured to tunnel over HTTP. The proxy server configuration applies to any configured HTTP tunneled connection on the agent, not to a single connection. This is especially important to consider when configuring failover between multiple Enterprise Managers, where the connection to each Enterprise Manager is over HTTP.
Important: HTTP/1.1 is required to enable agent HTTP tunneling. If you are using HTTP tunneling, your proxy server must support HTTP Post.

Connecting to the Enterprise Manager
Chapter 2: Installing and Configuring the Java Agent 51
To configure a proxy server for HTTP tunneling:
1. Open the IntroscopeAgent.profile.
2. Specify the proxy server properties:
introscope.agent.enterprisemanager.transport.http.proxy.host (see page 241)
introscope.agent.enterprisemanager.transport.http.proxy.port (see page 242)
3. If the proxy server requires the agent to authenticate with it, set these properties:
introscope.agent.enterprisemanager.transport.http.proxy.username (see
page 242)
introscope.agent.enterprisemanager.transport.http.proxy.password (see
page 242)
4. Save the IntroscopeAgent.profile.
Connecting to the Enterprise Manager with HTTPS tunneling
The agent can connect to the Enterprise Manager using HTTP over Secure Sockets Layer (SSL) by configuring properties in the IntroscopeAgent.profile.
To configure a connection through HTTPS:
1. Open the IntroscopeAgent.profile.
2. Configure the agent to connect to the HTTPS listening port of the Enterprise Manager’s embedded web server, using an HTTP tunneling socket factory.
■ introscope.agent.enterprisemanager.transport.tcp.host.DEFAULT
Defines the host name or IP address of the target Enterprise Manager.
■ introscope.agent.enterprisemanager.transport.tcp.port.DEFAULT
Defines the HTTPS listening port of the Enterprise Manager's embedded web server. For example:
introscope.agent.enterprisemanager.transport.tcp.port.DEFAULT=8444
■ introscope.agent.enterprisemanager.transport.tcp.socketfactory.DEFAULT
Set the value to the socket factory. For example:
introscope.agent.enterprisemanager.transport.tcp.socketfactory.DEFAULT=co
m.wily.isengard.postofficehub.link.net.HttpsTunnelingSocketFactory
3. Save the IntroscopeAgent.profile.
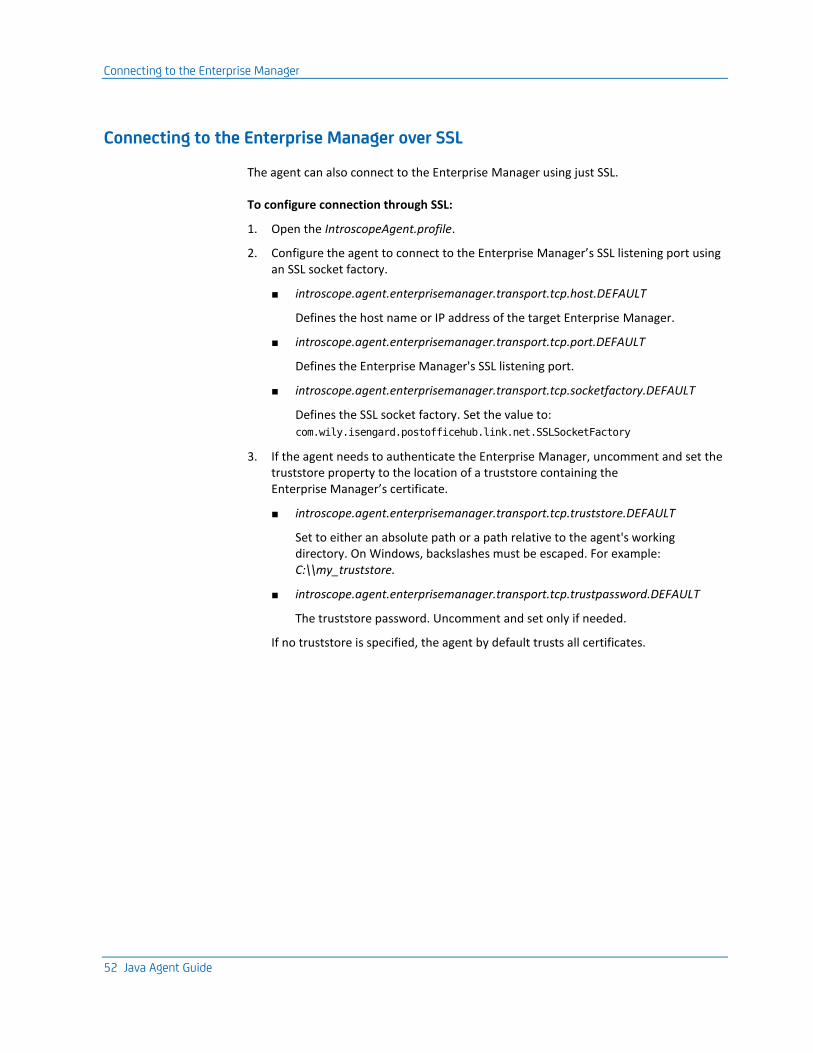
Connecting to the Enterprise Manager
52 Java Agent Guide
Connecting to the Enterprise Manager over SSL
The agent can also connect to the Enterprise Manager using just SSL.
To configure connection through SSL:
1. Open the IntroscopeAgent.profile.
2. Configure the agent to connect to the Enterprise Manager’s SSL listening port using an SSL socket factory.
■ introscope.agent.enterprisemanager.transport.tcp.host.DEFAULT
Defines the host name or IP address of the target Enterprise Manager.
■ introscope.agent.enterprisemanager.transport.tcp.port.DEFAULT
Defines the Enterprise Manager's SSL listening port.
■ introscope.agent.enterprisemanager.transport.tcp.socketfactory.DEFAULT
Defines the SSL socket factory. Set the value to:
com.wily.isengard.postofficehub.link.net.SSLSocketFactory
3. If the agent needs to authenticate the Enterprise Manager, uncomment and set the truststore property to the location of a truststore containing the Enterprise Manager’s certificate.
■ introscope.agent.enterprisemanager.transport.tcp.truststore.DEFAULT
Set to either an absolute path or a path relative to the agent's working directory. On Windows, backslashes must be escaped. For example: C:\\my_truststore.
■ introscope.agent.enterprisemanager.transport.tcp.trustpassword.DEFAULT
The truststore password. Uncomment and set only if needed.
If no truststore is specified, the agent by default trusts all certificates.

Java Agent configuration overview
Chapter 2: Installing and Configuring the Java Agent 53
4. If the Enterprise Manager requires client authentication, the agent must be configured with a keystore. Set the keystore property to the location of a keystore containing the agent's certificate:
■ introscope.agent.enterprisemanager.transport.tcp.keystore.DEFAULT
Set to either an absolute path or a path relative to the agent's working directory. On Windows, backslashes must be escaped. For example: C:\\keystore.
■ introscope.agent.enterprisemanager.transport.tcp.keypassword.DEFAULT
The keystore password. Uncomment and set only if needed. By default no keystore is specified.
■ introscope.agent.enterprisemanager.transport.tcp.ciphersuites.DEFAULT
To restrict the enabled cipher suites, set this property to a comma-separated list of cipher suites.
If not specified, the default enabled cipher suites are used.
5. Save the IntroscopeAgent.profile.
Java Agent configuration overview
After you install the Java Agent, you can configure it to collect as many or as few metrics as you want. The Java Agent is a highly configurable tool, able to monitor many different aspects of your application and environment health. There are three overall sets of configurations to perform on the Java Agent:
■ Operational configurations are required for the Java Agent to report data at a basic level. See Operational configurations (see page 53).
■ Optional operational configurations augment the operations of the Java Agent, but are not required for the agent to run at a basic level. See Optional operational configurations (see page 54).
■ Data collection configurations enable the Java Agent to collect additional metrics not collected by default using the out-of-the-box ProbeBuilder Directive (PBD) and ProbeBuilder List (PBL) file settings. See Data collection configurations (see page 55).
Operational configurations
For you to be able to see and respond to metric information, the Java Agent must be able to communicate with the Enterprise Manager, the applications you are monitoring must be instrumented, and to aid in verifying your configuration, you must configure the logging options for the agent.
Java Agent configuration overview
54 Java Agent Guide
Communicating with the Enterprise Manager
Without a connection to the Enterprise Manager, the Java Agent cannot report metrics. By default, the agent will attempt to connect to an Enterprise Manager on localhost port 5001.
You can change this port designation, configure the Java Agent to connect to a cluster of Enterprise Managers, or enable the agent to failover to a secondary Enterprise Manager by configuring properties in the IntroscopeAgent.profile file. For more information, see Connecting to the Enterprise Manager (see page 48).
Instrumenting applications to be monitored
The Java Agent uses a mechanism called JVM AutoProbe (AutoProbe) to insert probes into the bytecode of the applications you want to monitor. AutoProbe uses PBD and PBL files to determine which probes are inserted. After the probes are inserted, the application is considered instrumented, allowing metric data to be collected.
You can use the default PBD and PBL files included with the Java Agent to provide a basic level of metric collection. You can also modify these default files to better tune metric collection for your environment. For more information on how to tailor PBDs and PBL files to your specific needs, see ProbeBuilder Directives (see page 56).
Note that it is the settings in the PBDs and PBL files that define what to monitor in your applications and environment, and how you configure these files determines what gets instrumented in your applications but not how they are instrumented. The most common way to instrument applications is using JVM AutoProbe, but there are other methods you can use to instrument applications. For most applications and environments, CA Technologies recommends using JVM AutoProbe. For more information about other ways to instrument applications, see AutoProbe and ProbeBuilding Options (see page 61).
Setting monitoring and logging options
You can configure the Java Agent to monitor its own interactions with your environment. This makes it easier to tune the agent for optimal performance as well as troubleshoot any issues you may encounter when configuring the agent.
By default, the Java Agent writes information log messages to log files. For more information, see Configuring logging options (see page 162).
Optional operational configurations
There are also optional Java Agent configurations you may want to set.
Java Agent configuration overview
Chapter 2: Installing and Configuring the Java Agent 55
Java Agent naming
The Java Agent profile provides default values for the agent name and Custom Process name, which appear as nodes in the Workstation Investigator hierarchy of metrics reported by the Java Agent.
Depending on your environment, you may wish to configure the Java Agent to obtain a name automatically. For more information about agent naming, and autonaming capabilities, see Java Agent Naming (see page 147).
If desired, you can define the agent name and process name using these properties in IntroscopeAgent.profile.
■ introscope.agent.agentName—Name of the application server that the Java Agent is monitoring.The agentName value must start with an alphabetical character, and cannot contain a percent (%) character. See introscope.agent.agentName (see page 253) for a description.
■ introscope.agent.customProcessName—Name of the process being monitored. See introscope.agent.customProcessName (see page 254) for a description.
You can define a Java Agent’s name explicitly or configure an automated mechanism for agent naming. By default, the Java Agent profile explicitly assigns an agent name, for instance "WebLogic Agent". For more information, see Java Agent Naming (see page 147).
Virtual Agents
If you want multiple agents to monitor separate instances of a clustered application, you must configure those agents as Virtual Agents which allow you to aggregate metrics at the application level. For more information, see Using Virtual Agents to Aggregate Metrics (see page 169).
Domains
Unless you assign a Java Agent to a custom Introscope Domain, it is part of the SuperDomain by default. For information about Domains and their use in configuring user permission, see the Introscope Installation and Upgrade Guide.
Data collection configurations
Data collection is controlled by the ProbeBuilder Directive (PBD) and ProbeBuilder List (PBL) files. PBD files contain properties that, when configured, determine what metrics are gathered by the Java Agent and reported to the Enterprise Manager. PBLs only contain lists of multiple PBDs to be implemented by the Java Agent.

Java Agent configuration overview
56 Java Agent Guide
To expand the data collection of your Java Agent, you will configure one or more of the following:
■ ProbeBuilder Directives (PBDs) (see page 56)
■ Data collection and reporting options (see page 56)
ProbeBuilder Directives (PBDs)
The ProbeBuilder Directives (PBDs) used during the ProbeBuilding process determine the metrics that the agent reports. You can configure each PBD to monitor different aspects of your application. You can then configure a list of the desired PBDs or PBLs (lists of PBDs) in the agent profile.
The default list specified in the profile results in the typical level of monitoring, appropriate for production environments where overhead is at a premium. You can generally configure more detailed probe building to obtain more metrics in development or QA environments in the agent profile. You can further control the ProbeBuilding process by customizing PBDs to skip classes or packages, or to instrument custom classes and custom or private methods that the default PBDs do not specify. For more information, see ProbeBuilder Directives (see page 56).
Data collection and reporting options
Deciding how you are going to configure your Java Agent to monitor your applications and environments is an important process. The following are the different types of metrics you can gather from your applications and environments, most of which are configured using the IntroscopeAgent.profile file.
■ Socket and SSL Metrics—By default, the Java Agent collects socket and SSL metrics, but does not report input and output bandwidth rate metrics for individual sockets. For more information, see Socket metrics (see page 158).
■ URL Groups for Blame Reporting—You can configure URL groups to control the the way that metrics for front-ends are aggregated and presented in the Investigator in WebView and the Workstation. To use URL groups, however, you must manually configure them using properties in the Java Agent profile. For more information, see Using URL groups (see page 196).
■ Stall Event Reporting—By default, the Java Agent reports stalls as events, and stores them in the Transaction Event Database. You can disable this behavior, or tailor the stall reporting behavior. For more information, see Disabling the capture of stalls as Events (see page 208).
■ JMX and JSR-77—You can optionally configure the Java Agent to report JMX metrics, JSR-77 metrics, or WebLogic Diagnostic Framework metrics. For more information, see Enabling JMX Reporting (see page 221) and Configuring WebLogic Diagnostic Framework. (see page 82)
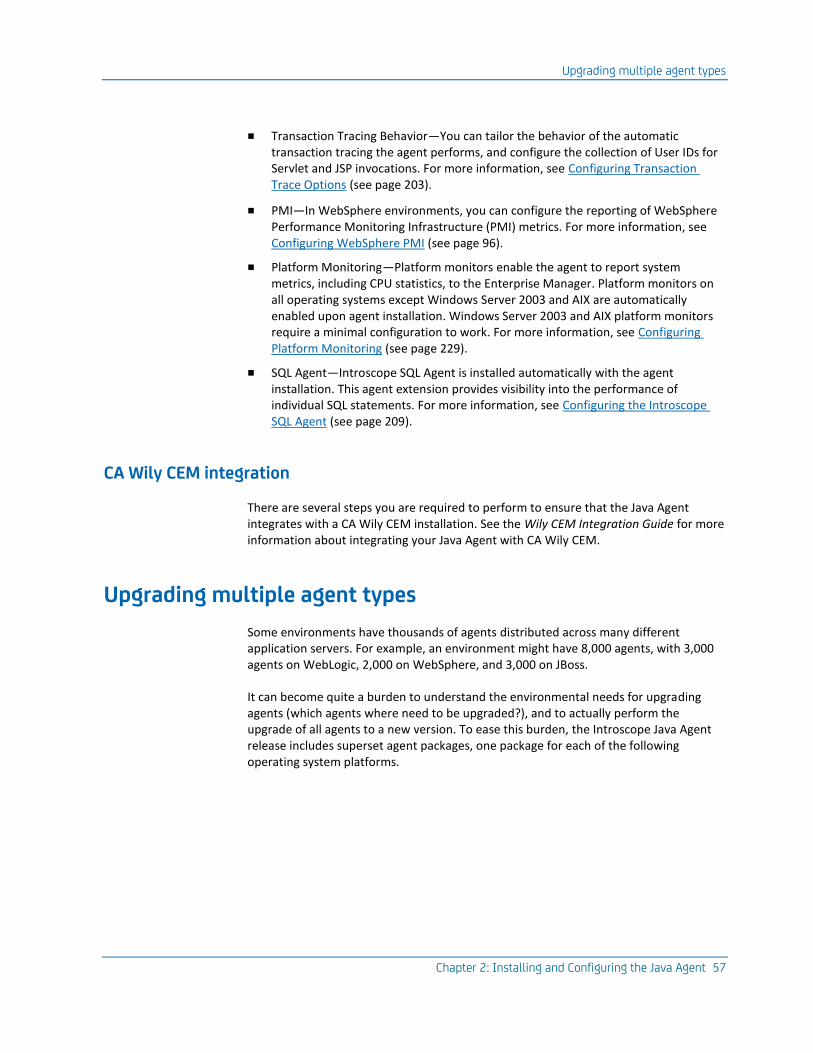
Upgrading multiple agent types
Chapter 2: Installing and Configuring the Java Agent 57
■ Transaction Tracing Behavior—You can tailor the behavior of the automatic transaction tracing the agent performs, and configure the collection of User IDs for Servlet and JSP invocations. For more information, see Configuring Transaction Trace Options (see page 203).
■ PMI—In WebSphere environments, you can configure the reporting of WebSphere Performance Monitoring Infrastructure (PMI) metrics. For more information, see Configuring WebSphere PMI (see page 96).
■ Platform Monitoring—Platform monitors enable the agent to report system metrics, including CPU statistics, to the Enterprise Manager. Platform monitors on all operating systems except Windows Server 2003 and AIX are automatically enabled upon agent installation. Windows Server 2003 and AIX platform monitors require a minimal configuration to work. For more information, see Configuring Platform Monitoring (see page 229).
■ SQL Agent—Introscope SQL Agent is installed automatically with the agent installation. This agent extension provides visibility into the performance of individual SQL statements. For more information, see Configuring the Introscope SQL Agent (see page 209).
CA Wily CEM integration
There are several steps you are required to perform to ensure that the Java Agent integrates with a CA Wily CEM installation. See the Wily CEM Integration Guide for more information about integrating your Java Agent with CA Wily CEM.
Upgrading multiple agent types
Some environments have thousands of agents distributed across many different application servers. For example, an environment might have 8,000 agents, with 3,000 agents on WebLogic, 2,000 on WebSphere, and 3,000 on JBoss.
It can become quite a burden to understand the environmental needs for upgrading agents (which agents where need to be upgraded?), and to actually perform the upgrade of all agents to a new version. To ease this burden, the Introscope Java Agent release includes superset agent packages, one package for each of the following operating system platforms.
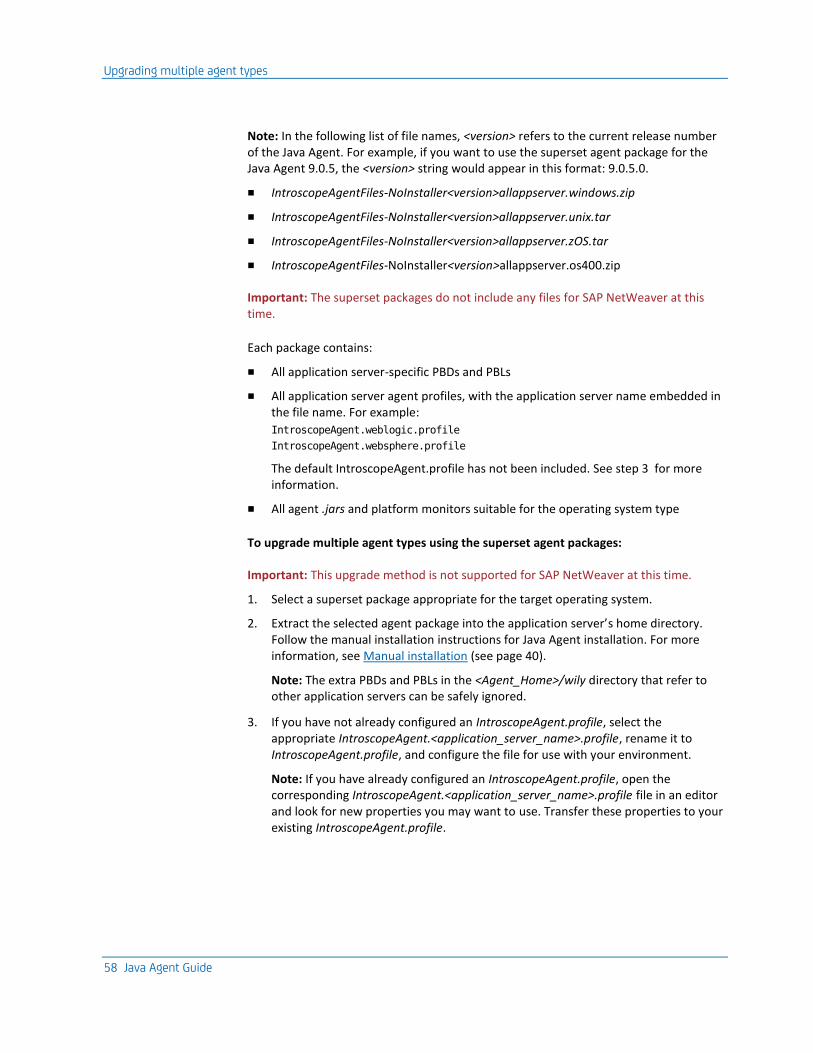
Upgrading multiple agent types
58 Java Agent Guide
Note: In the following list of file names, <version> refers to the current release number of the Java Agent. For example, if you want to use the superset agent package for the Java Agent 9.0.5, the <version> string would appear in this format: 9.0.5.0.
■ IntroscopeAgentFiles-NoInstaller<version>allappserver.windows.zip
■ IntroscopeAgentFiles-NoInstaller<version>allappserver.unix.tar
■ IntroscopeAgentFiles-NoInstaller<version>allappserver.zOS.tar
■ IntroscopeAgentFiles-NoInstaller<version>allappserver.os400.zip
Important: The superset packages do not include any files for SAP NetWeaver at this time.
Each package contains:
■ All application server-specific PBDs and PBLs
■ All application server agent profiles, with the application server name embedded in the file name. For example:
IntroscopeAgent.weblogic.profile
IntroscopeAgent.websphere.profile
The default IntroscopeAgent.profile has not been included. See step 3 for more information.
■ All agent .jars and platform monitors suitable for the operating system type
To upgrade multiple agent types using the superset agent packages:
Important: This upgrade method is not supported for SAP NetWeaver at this time.
1. Select a superset package appropriate for the target operating system.
2. Extract the selected agent package into the application server’s home directory. Follow the manual installation instructions for Java Agent installation. For more information, see Manual installation (see page 40).
Note: The extra PBDs and PBLs in the <Agent_Home>/wily directory that refer to other application servers can be safely ignored.
3. If you have not already configured an IntroscopeAgent.profile, select the appropriate IntroscopeAgent.<application_server_name>.profile, rename it to IntroscopeAgent.profile, and configure the file for use with your environment.
Note: If you have already configured an IntroscopeAgent.profile, open the corresponding IntroscopeAgent.<application_server_name>.profile file in an editor and look for new properties you may want to use. Transfer these properties to your existing IntroscopeAgent.profile.
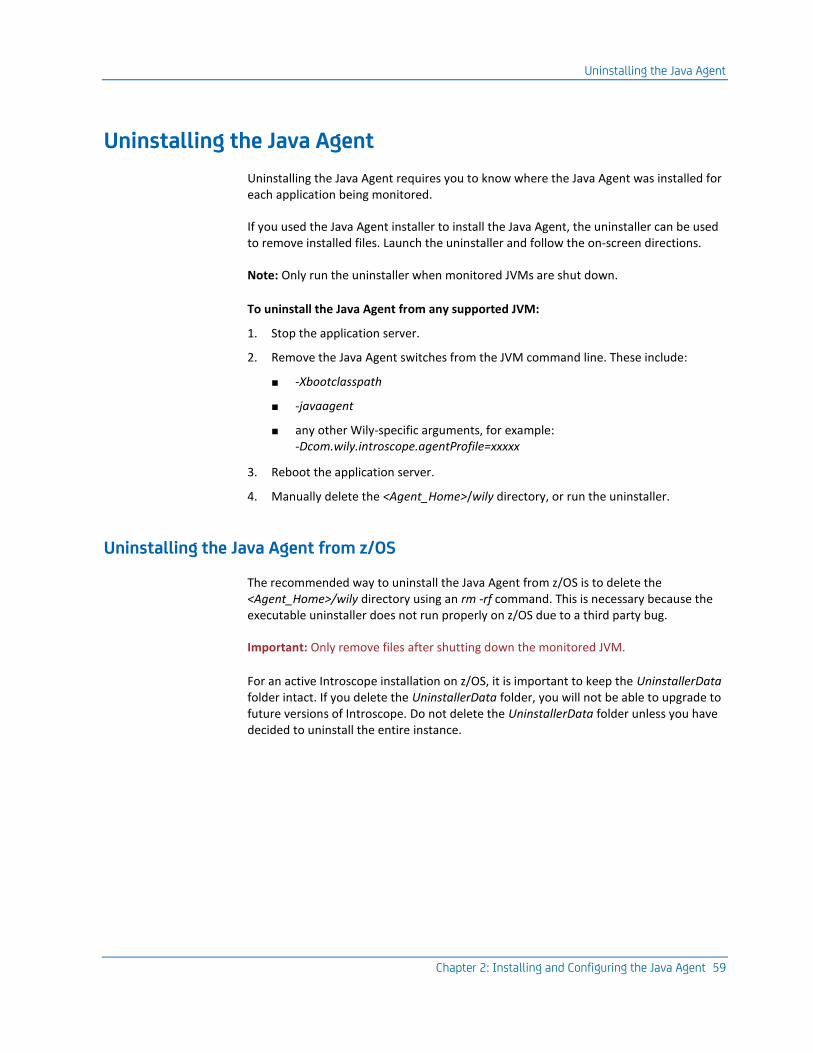
Uninstalling the Java Agent
Chapter 2: Installing and Configuring the Java Agent 59
Uninstalling the Java Agent
Uninstalling the Java Agent requires you to know where the Java Agent was installed for each application being monitored.
If you used the Java Agent installer to install the Java Agent, the uninstaller can be used to remove installed files. Launch the uninstaller and follow the on-screen directions.
Note: Only run the uninstaller when monitored JVMs are shut down.
To uninstall the Java Agent from any supported JVM:
1. Stop the application server.
2. Remove the Java Agent switches from the JVM command line. These include:
■ -Xbootclasspath
■ -javaagent
■ any other Wily-specific arguments, for example: -Dcom.wily.introscope.agentProfile=xxxxx
3. Reboot the application server.
4. Manually delete the <Agent_Home>/wily directory, or run the uninstaller.
Uninstalling the Java Agent from z/OS
The recommended way to uninstall the Java Agent from z/OS is to delete the <Agent_Home>/wily directory using an rm -rf command. This is necessary because the executable uninstaller does not run properly on z/OS due to a third party bug.
Important: Only remove files after shutting down the monitored JVM.
For an active Introscope installation on z/OS, it is important to keep the UninstallerData folder intact. If you delete the UninstallerData folder, you will not be able to upgrade to future versions of Introscope. Do not delete the UninstallerData folder unless you have decided to uninstall the entire instance.


Chapter 3: AutoProbe and ProbeBuilding Options 61
Chapter 3: AutoProbe and ProbeBuilding Options
This section contains the following topics:
AutoProbe and ProbeBuilding overview (see page 61) Configuring JVM AutoProbe (see page 62) Configuring ProbeBuilding (see page 67)
AutoProbe and ProbeBuilding overview
The Java Agent inserts probes into the bytecode of applications you want to monitor. ProbeBuilding is the process by which you choose which probes to insert into applications using ProbeBuilder Directives (PBDs) and ProbeBuilder Lists (PBLs). The default PBD and PBL files included with the Java Agent provide a basic level of metric collection. In most cases, you will want to modify the default settings in these files to better tune metric collection specifically for your environment.
After you have configured PBDs and PBLs to insert the probes for the metrics you want to collect in your applications and environment, you use these files to instrument applications automatically using JVM AutoProbe or manually using ProbeBuilder. In most cases, you should use JVM AutoProbe to instrument applications. Configuring JVM AutoProbe, however, depends on the the application environment.
To instrument your applications on JVMs 1.5 and higher, use the following methods:
■ JVM AutoProbe, with -javaagent property. CA Technologies highly recommends using JVM AutoProbe to instrument applications on JVMs 1.5 or higher.
■ For more information about configuring JVM AutoProbe for most application server environments, see JVM AutoProbe (see page 62).
■ For information about using JVM AutoProbe on OS/400, see JVM AutoProbe on OS/400 (see page 63).
■ For information about using JVM AutoProbe on z/OS platforms, see JVM AutoProbe for WAS 7 on z/OS (see page 63).
■ Manual ProbeBuilding. For more information, see Manual ProbeBuilding (see page 355). This is an advanced instrumentation technique. Contact CA Support before using this method.
Important: When instrumenting your applications, use only one method of instrumentation.
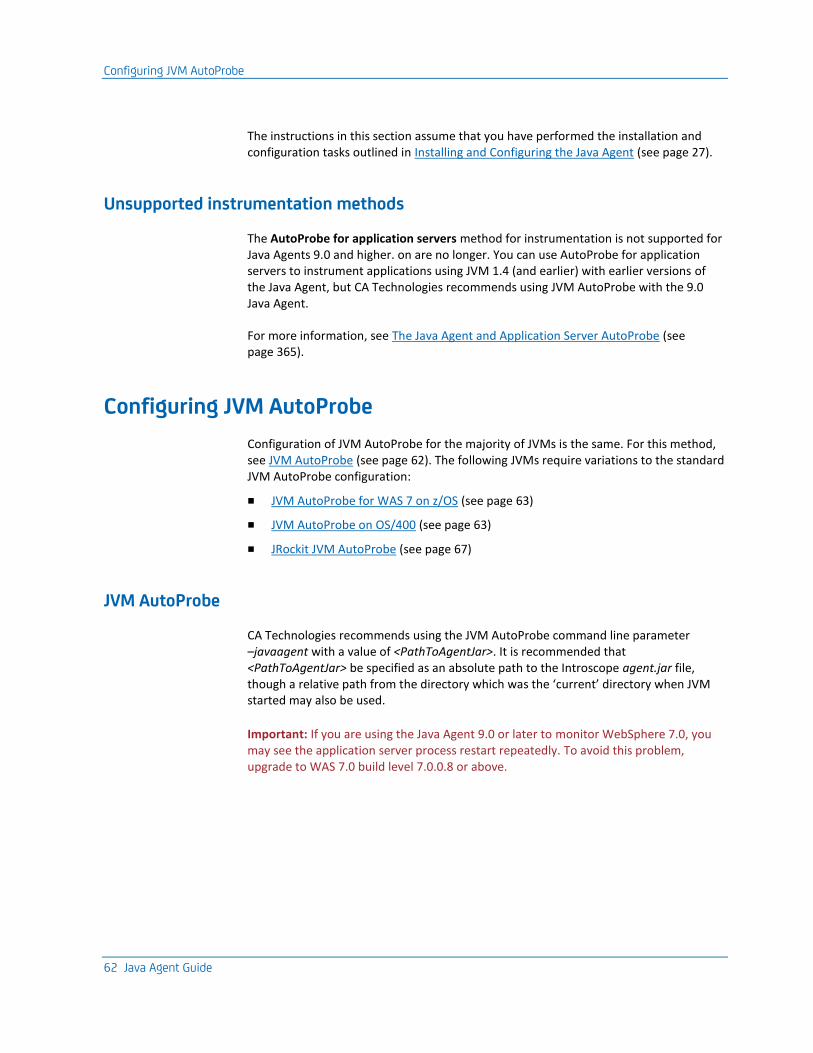
Configuring JVM AutoProbe
62 Java Agent Guide
The instructions in this section assume that you have performed the installation and configuration tasks outlined in Installing and Configuring the Java Agent (see page 27).
Unsupported instrumentation methods
The AutoProbe for application servers method for instrumentation is not supported for Java Agents 9.0 and higher. on are no longer. You can use AutoProbe for application servers to instrument applications using JVM 1.4 (and earlier) with earlier versions of the Java Agent, but CA Technologies recommends using JVM AutoProbe with the 9.0 Java Agent.
For more information, see The Java Agent and Application Server AutoProbe (see page 365).
Configuring JVM AutoProbe
Configuration of JVM AutoProbe for the majority of JVMs is the same. For this method, see JVM AutoProbe (see page 62). The following JVMs require variations to the standard JVM AutoProbe configuration:
■ JVM AutoProbe for WAS 7 on z/OS (see page 63)
■ JVM AutoProbe on OS/400 (see page 63)
■ JRockit JVM AutoProbe (see page 67)
JVM AutoProbe
CA Technologies recommends using the JVM AutoProbe command line parameter –javaagent with a value of <PathToAgentJar>. It is recommended that <PathToAgentJar> be specified as an absolute path to the Introscope agent.jar file, though a relative path from the directory which was the ‘current’ directory when JVM started may also be used.
Important: If you are using the Java Agent 9.0 or later to monitor WebSphere 7.0, you may see the application server process restart repeatedly. To avoid this problem, upgrade to WAS 7.0 build level 7.0.0.8 or above.

Configuring JVM AutoProbe
Chapter 3: AutoProbe and ProbeBuilding Options 63
To specify which agent configuration to use, CA Technologies recommends using the Java system property com.wily.introscope.agentProfile with JVM command line option -Dcom.wily.introscope.agentProfile=<PathToAgentProfile>. It is recommended that <PathToAgentProfile> be specified as an absolute path, though a relative path from the directory which was the ‘current’ directory when JVM started may also be used. If the property com.wily.introscope.agentProfile is not defined, the agent will attempt to locate the configuration file named IntroscopeAgent.profile in the directory the agent.jar file resides in. For example:
-javaagent:<PathToAgentJar>
-Dcom.wily.introscope.agentProfile=<PathToAgentProfile>
JVM AutoProbe for WAS 7 on z/OS
For WAS 7 on z/OS, configure JVM AutoProbe by adding these options to the JVM command line:
-Xbootclasspath/a:<Agent_Home>/Agent.jar
-javaagent:<Agent_Home>/Agent.jar
-Dcom.wily.introscope.agentProfile=<Agent_Home>/IntroscopeAgent.profile
For more information on WAS 7 on z/OS, see AutoProbe for WebSphere 6.1 and 7.0 for z/OS (see page 89).
Important: If you are using the Java Agent 9.0 or later to monitor WebSphere 7.0 on z/OS , you may see the application server process restart repeatedly. To avoid this problem, upgrade to WAS 7.0 build level 7.0.0.8 or above.
JVM AutoProbe on OS/400
The following JVM versions are supported by the 9.0 Java Agent on OS/400:
■ IBM JVM 1.5 J9 32-bit
■ IBM JVM 1.5 J9 64-bit
■ IBM JVM 1.6 J9 32-bit
■ IBM JVM 1.6 J9 64-bit
The following application servers are supported on OS/400:
■ WebSphere Application Server 6.1
■ WebSphere Application Server 7.0
For more information on how to configure WAS 6.1 and WAS 7, see Deploying the Java Agent on WebSphere (see page 85).
Configuring JVM AutoProbe
64 Java Agent Guide
WebSphere or WebLogic
For information about configuring AutoProbe on WebSphere and WebLogic, see Deploying the Java Agent on WebSphere (see page 85) and Deploying the Java Agent on WebLogic (see page 77).
Creating an AutoProbe connector file
The depreciated JVM AutoProbe method requires a connector .jar file to correctly operate. This section details how to create the AutoProbe Connector. If your JVM is v1.5, follow the instructions in JVM AutoProbe (see page 62).
For information on how to run an AutoProbe Connector, see Running the AutoProbe Connector for a Sun, IBM, or HP JVM (see page 64).
To create an AutoProbe Connector
1. Change the working directory to wily/connectors under the installation directory.
2. Run the Create AutoProbe Connector tool using one of these commands:
■ to specify the JVM using the JVM that is running the tool: java -jar CreateAutoProbeConnector.jar -current
■ to specify the JVM by passing the JVM directory on the command line: java -jar CreateAutoProbeConnector.jar -jvm <directory>
The output is a file with the form: wily/connectors/AutoProbeConnector.jar
3. You may want to rename the created .jar file to be more manageable and universally accepted. For example:
■ wily/connectors/AutoProbeConnector131_02_Sun.jar
OR
■ wily/connectors/AutoProbeConnector130_IBM.jar
Running the AutoProbe Connector for a Sun, IBM, or HP JVM
After you create the AutoProbe Connector for the Sun or IBM JVM, you run the created file to instrument your applications. The way you run the Connector depends on the application server you use. For more information, see the appropriate section for your application server.
To run the AutoProbe Connector for SAP J2EE 6.20:
1. Open the file:
<drive>:\usr\sap\<J2EE_ENGINE_ID>\j2ee\j2ee_<INSTANCE>\cluster\
server\cmdline.properties

Configuring JVM AutoProbe
Chapter 3: AutoProbe and ProbeBuilding Options 65
2. Append these commands to JavaParameters section:
-Xbootclasspath/p:PathToAutoProbeConnectorJar;PathToAgentJar
-Dcom.wily.introscope.agentProfile=<path-to-IntroscopeAgent.profile>
-Dcom.wily.introscope.agent.agentName=<yourAgentName>
For example:
-Xbootclasspath/p:C:\usr\sap\P602\j2ee\j2ee_00\ccms\wily\connectors\AutoProbe
Connector.jar;C:\usr\sap\P602\j2ee\j2ee_00\ccms\wily\Agent.jar
-Dcom.wily.introscope.agentProfile=C:\usr\sap\P602\j2ee\
j2ee_00\ccms\wily\IntroscopeAgent.profile
3. Restart the SAP server.
To run the AutoProbe Connector for NetWeaver 04/SAP J2EE 6.40:
1. Run the SAP J2EE Configtool.
2. Select the server to modify.
3. Add these new java parameters in the Java Parameters field:
-Xbootclasspath/p:PathToAutoProbeConnectorJar;PathToAgentJar
-Dcom.wily.introscope.agentProfile=<path-to-IntroscopeAgent.profile>
For example:
-Xbootclasspath/p:D:/usr/sap/ccms/wily/connectors/AutoProbeConnector.jar;D:/u
sr/sap/ccms/wily/Agent.jar
-Dcom.wily.introscope.agentProfile=D:/usr/sap/ccms/wily/IntroscopeAgent.profi
le
Note: For NetWeaver 6.40 on Windows, the slashes for these java parameters must be forward slashes.
4. Click Disk to save.
5. Repeat steps 2 - 4 for each server.
6. Restart the SAP server.
7. To verify that Configtool changes were made, open the file: <drive>:\usr\sap\ccms\P66\JC00\j2ee\cluster\instance.properties
8. Look for a line beginning with ID<server_id>.JavaParameters, and confirm that it contains the lines you entered.
To run the AutoProbe Connector for Sun ONE:
1. Log in as Administrator or Root.
You must be logged in with Administrator or Root permissions to add Introscope information to startup scripts for Sun ONE 7.0.
2. Open the server.xml file, located at: <SunONE install dir>/domains/domain1/server1/config/

Configuring JVM AutoProbe
66 Java Agent Guide
3. Add this line to the server.xml file:
<jvm-options>
-Xbootclasspath/p:PathToAutoProbeConnectorJar:PathToAgentJar
</jvm-options>
The item separator is a colon (:). For example:
<jvm-options>
-Xbootclasspath/p:/sw/sun/sunone7/wily/connectors/AutoProbeConnector.jar:/sw/
sun/sunone7/wily/Agent.jar
</jvm-options>
To run the AutoProbe Connector for Oracle 10g:
■ To run the AutoProbe Connector, modify the bootstrap classpath:
-Xbootclasspath/p:wily/connectors/AutoProbeConnector.jar:PathToAgentJar
Users running Oracle 10g Release 2 using Sun JDK 1.42 must use the ^ (caret) character to escape a forward slash when issuing commands. For example:
-Xbootclasspath^/p:<IntroscopeAgent.jar path>
Different versions of WebLogic use different versions of Java to run. If you use Java 1.4 or earlier, you will use the following steps to run the AutoProbe connector. If you use Java 1.5 or later, see JVM AutoProbe (see page 62) for more information.
To run the AutoProbe Connector for WebLogic:
1. Edit the bootstrap classpath in the application startup script to include the AutoProbeConnector.jar you created (such as startMedRecServer.cmd) using this command:
-Xbootclasspath/p:PathToAutoProbeConnectorJar:PathToAgentJar
add the -X switch to the final start command at the end of the script, after the JAVA_VM and JAVA_OPTIONS. The excerpt below shows the correct place to insert the switch:
"$JAVA_HOME/bin/java" ${JAVA_VM} ${MEM_ARGS} ${JAVA_OPTIONS}
-Xbootclasspath/p:${WL_HOME}/wily/connectors/AutoProbeConnector.jar:${WL_HOME
}/wily/Agent.jar
-Dweblogic.Name=${SERVER_NAME}
-Dweblogic.management.username=${WLS_USER}
-Dweblogic.management.password=${WLS_PW}
-Dweblogic.ProductionModeEnabled=${PRODUCTION_MODE}
-Djava.security.policy="${WL_HOME}/server/lib/weblogic.policy"
weblogic.Server
2. If you are using something other than the default bootstrap classpath, add the Agent.jar and AutoProbeConnector.jar files to the beginning of your customized bootstrap classpath.

Configuring ProbeBuilding
Chapter 3: AutoProbe and ProbeBuilding Options 67
To run the AutoProbe Connector for other application servers:
■ To run the AutoProbe Connector, add the Agent.jar and the AutoProbe Connector to the Application Server bootstrap classpath using this command:
-Xbootclasspath/p:wily/connectors/AutoProbeConnector.jar:PathToAgentJar
JRockit JVM AutoProbe
To configure the JRockit JVM for AutoProbe, create a connector file, then start the JRockit JVM using these command-line options. For more information on how to create a connector file, see Creating an AutoProbe connector file (see page 64).
■ For WebLogic pre-9.0 with JRockit JVM:
-Xbootclasspath/a:PathToAgentJar
-Xmanagement:class=com.wily.introscope.api.jrockit.
AutoProbeLoader
■ For WebLogic 9.0 with JRockit 5.0:
JAVA_VENDOR=Bea
JAVA_OPTIONS=%JAVA_OPTIONS% -javaagent:PathToAgentJar
-Dcom.wily.introscope.agentProfile=PathToIntroscopeAgent.profile
Configuring ProbeBuilding
The instrumenting process is performed using ProbeBuilding technology, in which probes defined in ProbeBuilder Directive (PBD) files identify the metrics an agent will gather from web applications and virtual machines at run-time.
By default, AutoProbe will use the typical PBD set provided with the Java Agent, which results in the collection of a moderate number of metrics. The following sections have instructions on how to customize the metric collection level and how to configure optional ProbeBuilding behaviors.
■ Full or typical tracing options (see page 68)
■ Dynamic ProbeBuilding (see page 68)
■ ProbeBuilding class hierarchies (JVM 1.5) (see page 72)
■ Removing line numbers in bytecode (see page 75)
Configuring ProbeBuilding
68 Java Agent Guide
Full or typical tracing options
In Introscope, ProbeBuilder List (PBL) files govern which tracer groups are used in the instrumentation process. The introscope.autoprobe.directivesFile property specifies one or more PBL files.
Introscope provides two versions of each default PBL—a full version which enables a larger set of Tracer Groups than the typical version which results in more detailed metric reporting, and a typical version that enables a smaller set of Tracer Groups. This results in less detailed metric reporting and reduced overhead. By default, introscope.autoprobe.directivesFile specifies the typical version of the default PBL file.
To change the tracing level between full and typical:
1. Stop the managed application.
2. Open the IntroscopeAgent.profile, located in the <Agent_Home>/wily directory.
3. Specify the name of the PBL file you wish to use in this property: introscope.autoprobe.directivesFile.
For example, to use the Full version of the standard PBL for WebLogic Server, set the property to:
introscope.autoprobe.directivesFile=weblogic-full.pbl
4. Restart the managed application.
For more information on full and typical system directives files and customizing the TYPICAL settings, see ProbeBuilder Directives overview (see page 56).
Dynamic ProbeBuilding
Introscope uses dynamic ProbeBuilding to implement new and changed PBDs without restarting managed applications or the agent itself. This is useful for making corrections to PBDs, or to temporarily change data collection levels during triage or diagnosis without interrupting application service.
Important: Dynamic ProbeBuilding is only available for use with Java 1.5 or higher. Dynamic ProbeBuilding is dependant on Java 1.5 capabilities, so previous versions of Java are not able to use this Introscope function. Dynamic ProbeBuilding is also dependant on the -javaagent command.
Note: In Introscope 9.0, the Workstation allows you to perform dynamic instrumentation through the Transaction Trace viewer. For more information, see Dynamic ProbeBuilding vs. dynamic instrumentation (see page 71), and the CA Wily Introscope Workstation User Guide.

Configuring ProbeBuilding
Chapter 3: AutoProbe and ProbeBuilding Options 69
When dynamic ProbeBuilding is enabled, Introscope periodically checks for new and changed PBDs. To minimize overhead, Introscope selectively re-instruments classes affected by the modified PBDs. To improve performance, the scope of dynamic agent re-instrumentation is limited to reloading only those classes whose instrumentation has changed when PBDs were edited.
When a PBD is edited or added to the hotdeploy directory, only user directives (such as adding or removing directives for a class, or toggling tracer groups) are re-instrumented. System directives (such as adding a tracer or changing a new tracer mapping) are not re-instrumented. Arrays, interfaces, and classes specified in Skip directives are not re-instrumented, as well as any transformations. In addition, you can exclude all classes loaded by particular classloaders from the re-instrumentation process and limit the scope of the re-instrumentation process to specific class packages.
For more information about the hotdeploy directory, see Contents of the wily\hotdeploy directory (see page 46).
Note: Dynamic ProbeBuilding is not enabled by default.
If a class is re-instrumented so that it no longer reports data for a metric, the metric is still displayed in the Introscope Investigator. Existing metrics do not disappear from the Investigator window if their classes are re-instrumented.
Important: Due to a limitation in Java 1.5, access to some class bytes is not available, with the following effects:
■ Modifications to the j2ee.pbd file may not be picked up, and metrics may continue to be published under old names.
■ Some exceptions may appear in the agent log.
To avoid this issue, restart the application server after modifying the j2ee.pbd file.
When configuring dynamic ProbeBuilding, CA Technologies recommends that you base your changes on tracer groups. For example, if you want to control the level of instrumentation for the tracer group XYZ, you should create two tracer groups:
■ XYZTracing - regular tracing options
■ XYZTracingLite - fewer components are traced
Once these two tracer groups have been created, you can toggle between them, turning off XYZTracing and turning on XYZTracingLite. By toggling between the two tracer groups, you can view the impact that dynamic ProbeBuilding has on your environmental performance and adjust the tracing groups accordingly. This would affect all classes being traced as part of each tracer group.

Configuring ProbeBuilding
70 Java Agent Guide
Important: Changes to directives not using tracer groups are not supported. For example, changes in any directive like TraceAllMethods that does not have an IfFlagged switch are not supported. However, Introscope does not ship any out of the box directives without tracer groups or flags. Changes to skips or transformations are also not supported.
For more information on tracer groups, see Default tracer groups and toggles files (see page 114), Turning tracer groups on or off (see page 125), and Adding classes to a tracer group (see page 126).
To configure dynamic ProbeBuilding:
1. Open the IntroscopeAgent.profile file, usually located in the <Agent_Home>/wily directory.
2. Verify that the property, introscope.autoprobe.enable, is set to true.
3. Uncomment and set the following properties:
■ introscope.autoprobe.dynamicinstrument.enabled=true
This property enables dynamic ProbeBuilding. You must restart the managed application before changes to this property take effect.
■ introscope.autoprobe.dynamicinstrument.pollIntervalMinutes=1
The polling interval in minutes to check for PBD changes. The default is set to one minute intervals. You must restart the managed application before changes to this property take effect.
■ introscope.autoprobe.dynamicinstrument.classFileSizeLimitInMegs=1
Some classloader implementations have been observed to return huge class files. This is to prevent memory errors. You must restart the managed application before changes to this property take effect.
■ introscope.autoprobe.dynamic.limitRedefinedClassesPerBatchTo=10
Re-defining too many classes at a time might be very CPU intensive. In cases where the changes in PBDs trigger a re-definition of a large number of classes, this property attempts to batch the process at a comfortable rate.
Important: The following properties are no longer available for use and have been removed from the IntroscopeAgent.profile: introscope.autoprobe.dynamicinstrument.instrumentList introscope.autoprobe.dynamicinstrument.avoidClassLoaders.
4. Save changes to the IntroscopeAgent.profile.
5. Restart the managed applications (if appropriate).

Configuring ProbeBuilding
Chapter 3: AutoProbe and ProbeBuilding Options 71
Dynamic ProbeBuilding vs. dynamic instrumentation
Dynamic ProbeBuilding and dynamic instrumentation are not the same thing.
As outlined in Dynamic ProbeBuilding (see page 68), dynamic ProbeBuilding is based on manual changes you make to PBD files and manual configurations you make in the IntroscopeAgent.profile. If you update or change a PBD file and save it in the correct location, dynamic ProbeBuilding picks up the changes and implements them. Dynamic ProbeBuilding requires you to make configuration changes in the IntroscopeAgent.profile, as well as all changes to the PBD files you want updated, and all changes are permanent (until you manually update or change the files again).
Dynamic instrumentation is performed from the Introscope Workstation transaction trace viewer. The changes to instrumentation you select using the interface are made automatically for you, and are often only temporary. Instrumenting a method dynamically means inserting the instrumentation during runtime. You can dynamically instrument one, more, or all of the methods during a transaction trace session, and subsequently view metrics returned by the newly instrumented methods. This allows you to do dynamic application performing tuning. Dynamic instrumentation does not require any changes to the IntroscopeAgent.profile, and if you decide to make instrumentation changes permanent, a new PBD is created and saved in the correct location for you.
For more information on how to use dynamic instrumentation from the Introscope Workstation transaction trace viewer, see the CA WIly Introscope Workstation User Guide.
Important: To use dynamic instrumentation, you (the user) must have write access to the <Agent_Home> directory as well as the <Agent_Home>/logs directory. Since you must sign in to the Workstation to perform dynamic instrumentation, your permissions must allow you write access to the directories above. If you do not have write access to these directories, dynamic instrumentation cannot create the <Agent_Home>/Dynamic directory or create the dynamic instrumentation cache which it needs to function.
Dynamic instrumentation requires class redefinition support. Use of class redefinition can significantly impact performance when running on IBM JDK version 5. IBM has provided technical information on this performance overhead in the Java Diagnostics Guide.
Configuring ProbeBuilding
72 Java Agent Guide
CA Wily Introscope and IBM JDK version 5 customers that would like to take advantage of dynamic instrumentation should keep this performance overhead in mind, and when employing this configuration, CA Technologies recommends using the dynamic instrumentation feature only in a QA environment. The CA Wily Introscope documentation contains details about configuring CA Wily Introscope on IBM JDK Version 5 with class redefinition both enabled and disabled. For more information see:
■ AutoProbe for WebSphere 6.1 (see page 85)
■ Socket metrics (see page 158)
Note: There is no performance overhead with the use of class redefinition when using CA Wily Introscope with IBM JDK version 6.
ProbeBuilding class hierarchies (JVM 1.5)
In pre-1.5 JVMs, Introscope does not automatically instrument classes in the deeper levels of class hierarchy—only the classes that explicitly extend a probed class. For more information, see Instrumenting and inheritance (see page 142).
With a 1.5 JVM and higher, you can configure Introscope to instrument multiple levels of subclasses of a probed class—the tracer groups in the associated internal directive are updated appropriately and the classes are dynamically instrumented. Directive changes are written to a log file as well.
If you prefer to update your PBDs manually, you can disable directive updates and use the log file to determine appropriate updates.
Enable instrumentation of multiple levels of subclasses
Follow these steps to configure Introscope to dynamically update internal directives.
To enable instrumentation of multiple levels of subclasses:
1. Verify that dynamic instrumentation is enabled as described in Dynamic ProbeBuilding (see page 68).
2. Open the IntroscopeAgent.profile.
3. To enable instrumentation of multiple levels of subclasses, uncomment this property setting:
introscope.autoprobe.hierarchysupport.enabled=true
4. Save the IntroscopeAgent.profile.

Configuring ProbeBuilding
Chapter 3: AutoProbe and ProbeBuilding Options 73
Support for multiple inheritance, interfaces, and abstract methods
The Java Agent supports instrumentation by interface as well as multiple inheritance. This ability has been extended to dynamic instrumentation in Introscope 9.0.
In addition, the 9.0 Java Agent also supports the instrumentation of methods through a call to subclasses by using the Introscope API getMethodCalls. When used, getMethodCalls allows you to better understand the consequences of instrumentation of inherited methods or interface methods by providing the following information:
■ if the class defining the method is an interface.
■ the number of classes affected by a possible instrumentation of the method. This is the number of subclasses or the number of implementing classes.
■ if the method is called within a specific stack trace.
In addition, Introscope 9.0 also supports the instrumentation of methods through a call to subclasses by using the Introscope API getMethodCalls. When used, getMethodCalls allows you to better understand the consequences of instrumentation of inherited methods or interface methods by providing the following information:
■ if the class defining the method is an interface.
■ the number of classes affected by a possible instrumentation of the method. This is the number of subclasses or the number of implementing classes.
■ if the method is called within a specific stack trace.
A new tracer to instrument interfaces and abstract methods is available with the 9.0 Java Agent, using the following syntax:
TraceOneMethodWithlabelIfInherits: <class> <method> <Label> <Tracer Group> <Tracer
Type> <Resource>
This tracer instruments a method of any class implementing interface or extending superclass if the method is either defined in the interface or is abstract in the superclass
Important: Using this tracer could have a heavy impact on the performance of your system. You should test the impact of this tracer during your system startup and instrumentation processes before deploying to a larger agent configuration.
For more information on tracers and creating customs tracers, see Creating custom tracers (see page 132).

Configuring ProbeBuilding
74 Java Agent Guide
Configure periodic polling for uninstrumented subclasses
When multi-level subclass instrumentation is enabled, Introscope will check for uninstrumented subclasses at application startup.
To configure Introscope to poll for uninstrumented subclasses:
1. Open the IntroscopeAgent.profile.
2. Uncomment this property setting:
introscope.autoprobe.hierarchysupport.runOnceOnly=false
3. To change the frequency with which Introscope polls for uninstrumented subclasses from its default value of 5, uncomment this property and set it to the desired polling frequency:
introscope.autoprobe.hierarchysupport.pollIntervalMinutes
4. Optionally, you can limit the number of times Introscope polls uninstrumented subclasses by uncommenting this property and setting it to the desired limit:
introscope.autoprobe.hierarchysupport.executionCount
The default of this property is 3 minutes.
5. Save the IntroscopeAgent.profile.
Disable directive updates
If multi-level subclass instrumentation is enabled, when Introscope detects uninstrumented subclasses, by default, it updates internal directives appropriately to ensure the classes are instrumented. If you prefer to update PBDs manually, you can disable internal directive updates by uncommenting this property in the IntroscopeAgent.profile:
introscope.autoprobe.hierarchysupport.disableDirectivesChange=true

Configuring ProbeBuilding
Chapter 3: AutoProbe and ProbeBuilding Options 75
Controlling directive logging
When multi-level subclass instrumentation is enabled, you must uncomment the following properties in the IntroscopeAgent.profile to have multi-level subclass instrumentation logs created. When these properties are configured, a log file named pbdupdate.log is created in the <Agent_Home>/wily directory (by default), or in the custom location (if specified). The multi-level instrumentation details are written to the agent logs.
log4j.additivity.IntroscopeAgent.inheritance=false
log4j.logger.IntroscopeAgent.inheritance=INFO,pbdlog
log4j.appender.pbdlog.File=pbdupdate.log
log4j.appender.pbdlog=com.wily.introscope.agent.AutoNamingRollingFileAppender
log4j.appender.pbdlog.layout=com.wily.org.apache.log4j.PatternLayout
log4j.appender.pbdlog.layout.ConversionPattern=%d{M/dd/yy hh:mm:ss a z} [%-3p] [%c]
%m%n_
You must restart the managed application before changes to these properties take effect.
Removing line numbers in bytecode
When you instrument application bytecode, the bytecode line numbers are preserved by default. Preserving bytecode line number information is helpful when using debuggers or when obtaining stack trace information.
You can turn off this feature by adding a system property on the Java command line. Turning off this feature removes all line numbers when AutoProbe or ProbeBuilder instruments the application code.
To remove line numbers in bytecode when using AutoProbe or ProbeBuilder:
■ Define this system property on the Java command line with the -D option:
com.wily.probebuilder.removeLineNumbers=true

Chapter 4: Deploying the Java Agent on WebLogic 77
Chapter 4: Deploying the Java Agent on WebLogic
This section contains specific information for deploying the Java Agent on a WebLogic Server.
This section contains the following topics:
Before you begin (see page 77) Configuring AutoProbe for WebLogic Server (see page 77) Application server management data (see page 78) Configuring the SQL Agent for WebLogic Server (see page 79) Configuring WebLogic Diagnostic Framework (WLDF) (see page 82) Cross-process Transaction Tracing in WebLogic (see page 83) Introscope Java Agent JMX support (see page 84)
Before you begin
The instructions in this section are configurations specific to deploying your Java Agent in a WebLogic Server environment. You should consult the Java Agent configuration overview (see page 53) to view other configuration options for the Java Agent that have no WebLogic-specific configurations.
This section assumes you have followed the instructions for Installing the Java Agent (see page 29) and JVM AutoProbe (see page 62).
Configuring AutoProbe for WebLogic Server
To monitor WebLogic you need to configure the WebLogic Server to use AutoProbe to instrument applications. The Introscope Java Agent 9.0 only supports WebLogic Server 9.0 and higher.
To configure WebLogic Server 9.0, 9.1, 10.0, or 10.3 to use AutoProbe:
■ Edit the application startup script (such as startMedRecServer.cmd) to include these options to the JVM command line:
-javaagent:<PathToAgentJar>
-Dcom.wily.introscope.agentProfile=<PathToAgentProfile>

Application server management data
78 Java Agent Guide
Application server management data
In WebLogic Server environments, the Java Agent can obtain and report management information from the application server, above and beyond the metrics resulting from instrumenting your applications. For example, you can configure an agent to:
■ report JMX metrics from the application server
■ report WebLogic Diagnostic Framework (WLDF) data from WebLogic 9.0
■ obtain its name from the application server
The Application Overview in the Workstation (available in Introscope v7.0 and later) uses JMX metrics, if available, in application health heuristics. Enabling the Java Agent to access application server management information is not required, but it enhances the visibility provided by the Application Overview.
To enable the Java Agent to obtain and use data from the application server you configure an Introscope startup class or service in the application server, and target it at application server instances, or to an application server cluster.
Configuring a startup class for WebLogic 9.0 or higher
This section describes how to create a startup class for WebLogic 9.0 or higher. For information about creating a startup class in other versions of WebLogic Server, or for more information about WebLogic Server, consult your WebLogic Server documentation.
To configure a startup class for WebLogic 9.0 or higher:
1. Open the WebLogic Administrative Console.
2. In the left pane, expand the Environments folder.
3. Click the Startup & Shutdown folder.
The Startup and Shutdown page opens.
4. Click Configure a New Startup Class.
The Configuration tab is shown.
5. In the Name field, enter:
Introscope Startup Class
6. In the ClassName field, enter:
com.wily.introscope.api.weblogic.IntroscopeStartupClass
7. Click Create.
The Target and Deploy tab appears.

Configuring the SQL Agent for WebLogic Server
Chapter 4: Deploying the Java Agent on WebLogic 79
8. Check the box(es) for the server(s) you’d like to make this startup class available to.
9. Click Apply. Select the "Run before application deployments" option.
10. Add the location of the WebAppSupport.jar to the application startup classpath.
11. Restart the application server.
Configuring the SQL Agent for WebLogic Server
The configuration procedures in this section only apply to you if you used Application Server AutoProbe or Manual ProbeBuilder to instrument your application.
If you used JVM AutoProbe, no further configuration is required to use the SQL Agent.
For more information about the SQL Agent, see Configuring the Introscope SQL Agent (see page 209).
Supported JDBC drivers and datasources
The SQL Agent supports the following JDBC drivers and JDBC DataSources. Configuration instructions have been simplified to apply to both a JDBC driver and a JDBC datasource.
Supported JDBC drivers
The SQL Agent supports the following JDBC drivers:
■ Oracle—classes111.zip, classes12.zip, classes111_g.zip, classes12_g.zip
■ DB2—db2java.zip
■ Sybase—jconn2.jar
■ WebLogic jDriver for Oracle—jDriver 6.1
The SQL Agent fully supports the JDBC 1.0 and 2.0 specifications, including support for all JDBC driver types, I through IV.
Supported JDBC datasources for WebSphere
In db2java.zip:
■ COM.ibm.db2.jdbc.DB2ConnectionPoolDataSource
■ COM.ibm.db2.jdbc.DB2XADataSource
In classes12.zip and classes12_g.zip:
■ oracle.jdbc.pool.OracleConnectionPoolDataSource
■ oracle.jdbc.xa.client.OracleXADataSource
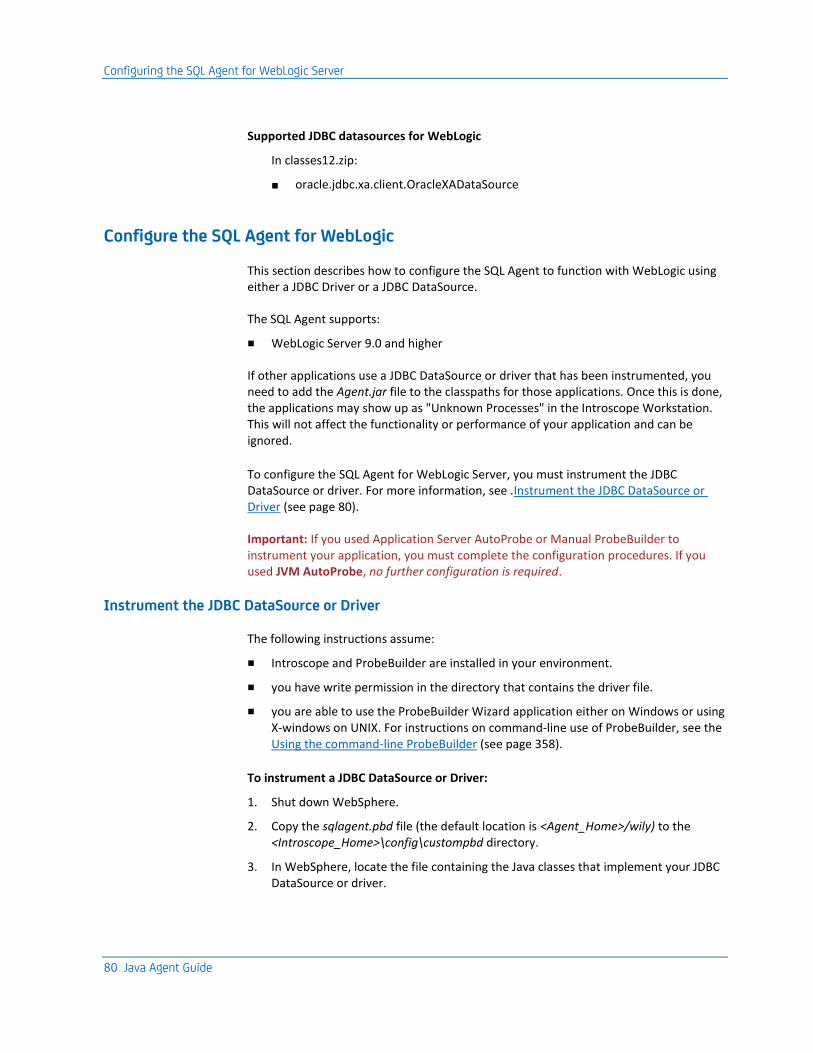
Configuring the SQL Agent for WebLogic Server
80 Java Agent Guide
Supported JDBC datasources for WebLogic
In classes12.zip:
■ oracle.jdbc.xa.client.OracleXADataSource
Configure the SQL Agent for WebLogic
This section describes how to configure the SQL Agent to function with WebLogic using either a JDBC Driver or a JDBC DataSource.
The SQL Agent supports:
■ WebLogic Server 9.0 and higher
If other applications use a JDBC DataSource or driver that has been instrumented, you need to add the Agent.jar file to the classpaths for those applications. Once this is done, the applications may show up as "Unknown Processes" in the Introscope Workstation. This will not affect the functionality or performance of your application and can be ignored.
To configure the SQL Agent for WebLogic Server, you must instrument the JDBC DataSource or driver. For more information, see .Instrument the JDBC DataSource or Driver (see page 80).
Important: If you used Application Server AutoProbe or Manual ProbeBuilder to instrument your application, you must complete the configuration procedures. If you used JVM AutoProbe, no further configuration is required.
Instrument the JDBC DataSource or Driver
The following instructions assume:
■ Introscope and ProbeBuilder are installed in your environment.
■ you have write permission in the directory that contains the driver file.
■ you are able to use the ProbeBuilder Wizard application either on Windows or using X-windows on UNIX. For instructions on command-line use of ProbeBuilder, see the Using the command-line ProbeBuilder (see page 358).
To instrument a JDBC DataSource or Driver:
1. Shut down WebSphere.
2. Copy the sqlagent.pbd file (the default location is <Agent_Home>/wily) to the <Introscope_Home>\config\custompbd directory.
3. In WebSphere, locate the file containing the Java classes that implement your JDBC DataSource or driver.

Configuring the SQL Agent for WebLogic Server
Chapter 4: Deploying the Java Agent on WebLogic 81
4. Run the ProbeBuilder Wizard, located in the <Introscope_Home> directory:
■ Introscope ProbeBuilder Wizard.exe on Windows
■ IntroscopeProbeBuilderWizard on UNIX
5. At the Welcome screen, click Next.
6. On the Select Original Java Bytecode screen, select the file containing the JDBC DataSource to instrument. For example, if using a file containing an Oracle JDBC DataSource, the name of the file would be classes12.zip.
Note: Before instrumenting any file, save a backup copy in another location.
7. On the Destination Location screen, click Next to name the resulting instrumented file. For example, if using the file containing an Oracle JDBC DataSource, the name of the resulting file would be classes12.isc.zip. Accept the default save location for the resulting file.
8. On the System Directives screen, select the SYSTEM directives for either WebSphere or WebLogic, depending on which system you are configuring. Click Next.
9. On the Custom Directives screen, select the sqlagent.pbd along with any other custom PBDs used in your deployment.
10. Click Add Probes. This creates a copy of the file containing the JDBC DataSource, instrumenting the JDBC DataSource in the copy. The new copy will be located in the same directory as the original.
11. On the Finished screen, click Exit.
In your JDBC driver directory you should find the file containing the instrumented JDBC DataSource or driver. To use this file to see the JDBC metrics in Introscope do one of the following:
■ Set the original file aside and rename the instrumented one, as in the following example:
c:\> rename classes12.zip classes12.orig.zip
c:\> rename classes12.isc.zip classes12.zip
Note: If the file to be renamed is in use, do not attempt to rename it until you first shut down any application or database that is actively using the file containing the JDBC DataSource.
■ Change your application server’s CLASSPATH setting to point to the new instrumented file.
Note: If other applications use this same JDBC DataSource or driver file, you will need to put the Agent.jar (located in <WebSphere_Home>\wily or <WebLogic_Home>/wily) in the classpath for those applications. Otherwise, applications that reference the JDBC DataSource will fail at runtime.
12. Restart your administration or application server.

Configuring WebLogic Diagnostic Framework (WLDF)
82 Java Agent Guide
Configuring WebLogic Diagnostic Framework (WLDF)
The WebLogic Diagnostic Framework (WLDF) is a monitoring and diagnostic framework that defines and implements a set of services that run within the WebLogic Server process and participate in the standard server life cycle. Using WLDF, you can create, collect, analyze, archive and access diagnostic data generated by a running server and the applications deployed within its containers. This data provides insight into the run-time performance of servers and applications and enables you to isolate and diagnose faults when they occur.
WLDF is a new feature in WebLogic 9.0. In previous releases of WebLogic Server, access to diagnostic data by monitoring agents—which were developed by customers or third-party tools vendors—was limited to JMX attributes, and changes to monitoring agents required server shutdown and restart. However, WLDF enables dynamic access to server data through standard interfaces and the volume of data accessed at any given time can be modified without shutting down and restarting the server.
For more information on WLDF, see the WebLogic Server documentation.
Understanding WLDF metric conversion
Introscope WLDF metric conversion is similar to that in JMX metric conversion. Where JMX MBeans have multiple Attributes (metrics), WLDF has a set of Data Accessors, each with multiple Columns (metrics). Introscope converts WLDF Columns to Introscope metrics.
Information in the Data Accessors is defined by a domain name and one or more key/value pairs. Introscope converts this WLDF information into Introscope-specific metric format and displays it in the Investigator under the following node:
<Domain>|<Host>|<Process>|AgentName|WLDF|
Introscope converts Data Accessor Columns using the following method:
■ key and value information is displayed
■ key/value pairs are placed in alphabetical order in the Introscope-generated metrics.
The following example shows the syntax used:
<Domain>|<Host>|<Process>|AgentName|WLDF|<domain
name>|<key1>=<value1>|<key2>=<value2>:<metric>
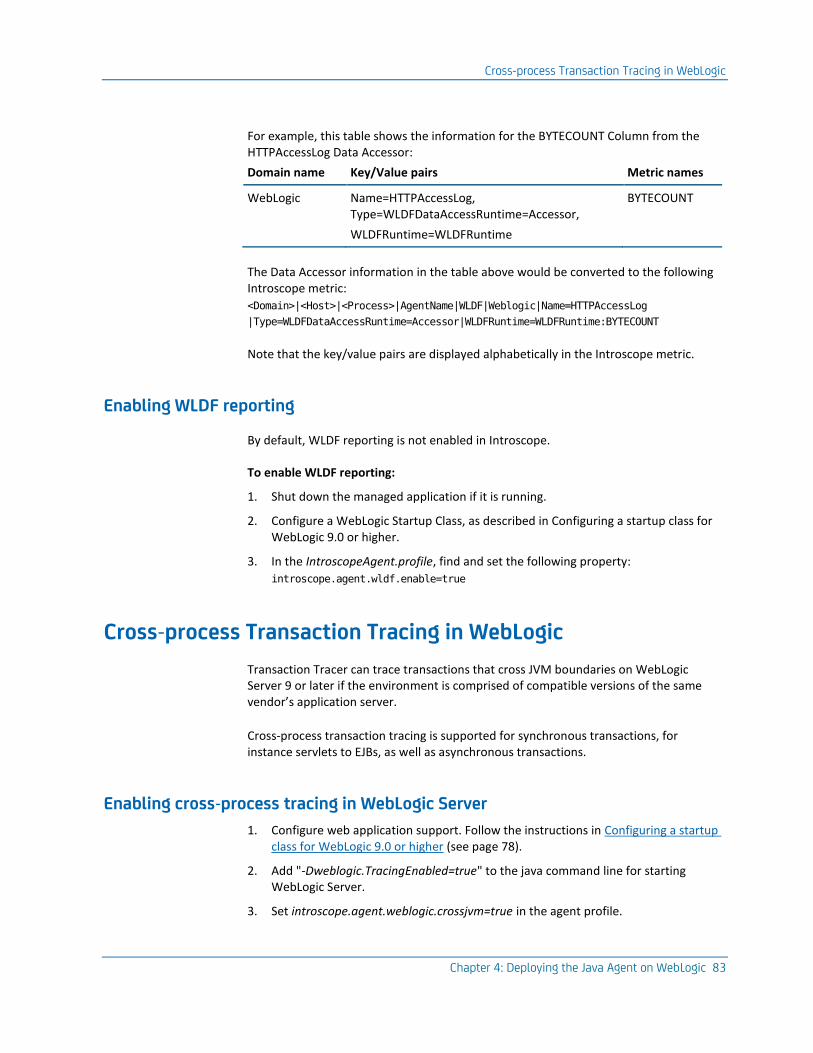
Cross-process Transaction Tracing in WebLogic
Chapter 4: Deploying the Java Agent on WebLogic 83
For example, this table shows the information for the BYTECOUNT Column from the HTTPAccessLog Data Accessor:
Domain name Key/Value pairs Metric names
WebLogic Name=HTTPAccessLog, Type=WLDFDataAccessRuntime=Accessor,
WLDFRuntime=WLDFRuntime
BYTECOUNT
The Data Accessor information in the table above would be converted to the following Introscope metric:
<Domain>|<Host>|<Process>|AgentName|WLDF|Weblogic|Name=HTTPAccessLog
|Type=WLDFDataAccessRuntime=Accessor|WLDFRuntime=WLDFRuntime:BYTECOUNT
Note that the key/value pairs are displayed alphabetically in the Introscope metric.
Enabling WLDF reporting
By default, WLDF reporting is not enabled in Introscope.
To enable WLDF reporting:
1. Shut down the managed application if it is running.
2. Configure a WebLogic Startup Class, as described in Configuring a startup class for WebLogic 9.0 or higher.
3. In the IntroscopeAgent.profile, find and set the following property:
introscope.agent.wldf.enable=true
Cross-process Transaction Tracing in WebLogic
Transaction Tracer can trace transactions that cross JVM boundaries on WebLogic Server 9 or later if the environment is comprised of compatible versions of the same vendor’s application server.
Cross-process transaction tracing is supported for synchronous transactions, for instance servlets to EJBs, as well as asynchronous transactions.
Enabling cross-process tracing in WebLogic Server
1. Configure web application support. Follow the instructions in Configuring a startup class for WebLogic 9.0 or higher (see page 78).
2. Add "-Dweblogic.TracingEnabled=true" to the java command line for starting WebLogic Server.
3. Set introscope.agent.weblogic.crossjvm=true in the agent profile.

Introscope Java Agent JMX support
84 Java Agent Guide
Introscope Java Agent JMX support
Introscope can collect management data that application servers or Java applications expose as JMX-compliant MBeans, and present the JMX data in the Investigator metric tree.
Introscope supports any MBean built to the Sun JMX specification. For more information on the Sun JMX specification, see http://java.sun.com/products/JavaManagement/.
Introscope converts the JMX data to Introscope metric format and displays it in the Investigator under the following Resource:
<Domain>|<Host>|<Process>|AgentName|JMX|
Introscope support for WebLogic 9.0 JMX metrics
WebLogic versions prior to WebLogic 9.0 provided only a single MBeanServer as a source of JMX metrics. WebLogic 9.0 provides three:
■ RuntimeServiceMBean: per-server runtime metrics, including active effective configuration
■ DomainRuntimeServiceMBean: domain-wide runtime metrics
■ EditServiceMBean: allows user to edit persistent configuration
Introscope polls only the RuntimeServiceMBean, because it is the only one that supports local access (an efficiency issue), and because it contains most of the data expected to be relevant.
JMX filters for WebLogic
In the IntroscopeAgent.profile file for WebLogic, the following keywords are already defined and enabled:
■ ActiveConnectionsCurrentCount
■ WaitingForConnectionCurrentCount
■ PendingRequestCurrentCount
■ ExecuteThreadCurrentIdleCount
■ OpenSessionsCurrentCount
For more information see Enabling JMX Reporting (see page 221).

Chapter 5: Deploying the Java Agent on WebSphere 85
Chapter 5: Deploying the Java Agent on WebSphere
This section contains specific information for deploying the Java Agent on a WebSphere application server.
This section contains the following topics:
Before you begin (see page 85) AutoProbe for WebSphere 6.1 (see page 85) AutoProbe for WebSphere 7.0 (see page 88) AutoProbe for WebSphere 6.1 and 7.0 for z/OS (see page 89) Modifying Java2 Security Policy (see page 91) Disable agent naming for WebSphere (see page 91) WebSphere application server management data (see page 91) The SQL Agent for WebSphere (see page 93) WebSphere PMI (see page 96) Logging considerations on WebSphere for z/OS (see page 98) Cross-process Transaction Tracing in WebSphere (see page 99)
Before you begin
The instructions in this section are specific configurations for the Java Agent in a WebSphere Application Server (WAS) or WebSphere for z/OS environment. You should consult the Java Agent configuration overview (see page 53) to view other configuration options for the Java Agent that have no WebSphere-specific configurations.
This section assumes you have followed the instructions for Installing the Java Agent (see page 29).
AutoProbe for WebSphere 6.1
CA Wily Introscope's dynamic instrumentation feature requires class redefinition support. Use of class redefinition can significantly impact performance when running on IBM JDK version 5. IBM has provided technical information on this performance overhead in the Java Diagnostics Guide (http://publib.boulder.ibm.com/infocenter/javasdk/v5r0/index.jsp?topic=/com.ibm.java.doc.diagnostics.50/diag/tools/jvmti.html).

AutoProbe for WebSphere 6.1
86 Java Agent Guide
CA Wily Introscope and IBM JDK version 5 customers that would like to take advantage of dynamic instrumentation should keep this performance overhead in mind, and when employing this configuration, CA Technologies recommends using the dynamic instrumentation feature only in a QA environment. The CA Wily Introscope documentation contains details about configuring CA Wily Introscope on IBM JDK version 5 with class redefinition both enabled and disabled.
Note: There is no performance overhead with the use of class redefinition when using CA Wily Introscope with IBM JDK version 6.
For more information on dynamic instrumentation, see Dynamic ProbeBuilding vs. dynamic instrumentation (see page 71).
If you are running WebSphere 6.1 using an IBM JVM 1.5, you must use the alternate versions of the Java Agent .jar file and Java Agent profile. These files, named AgentNoRedef.jar and IntroscopeAgent.NoRedef.profile, are located in the <Agent_Home>/wily directory.
Note: If you are using the AllAppServer agent distribution, the alternate profile is named IntroscopeAgent.websphere.NoRedef.profile.
As a result of using the above files and syntax, metrics are no longer reported for:
■ System classes
■ NIO (Sockets and Datagrams)
■ SSL
In addition, instrumentation on sockets reverts to pre-Introscope 9.0 ManagedSocket style, remote dynamic instrumentation is disabled, changes to PBD files require the instrumented JVM to be restarted before being applied, and deep inheritance and hierarchy support instrumentation is disabled.
When using the above files and syntax, the agent reports class redefinition status by:
■ Adding a metric called 'Agent Class Redefinition Enabled' under the agent node in the Investigator. Metric values are true or false.
■ Writing a log message to agent log file.
■ When class redefinition is enabled, the log message is written at the WARN level and reads:
Introscope Agent Class Redefinition is enabled. Enabling class redefinition
on IBM 1.5 JVMs is known to incur significant overhead.
■ When class redefinition is disabled, the log message is written at INFO level and reads:
Introscope Agent Class Redefinition is disabled.
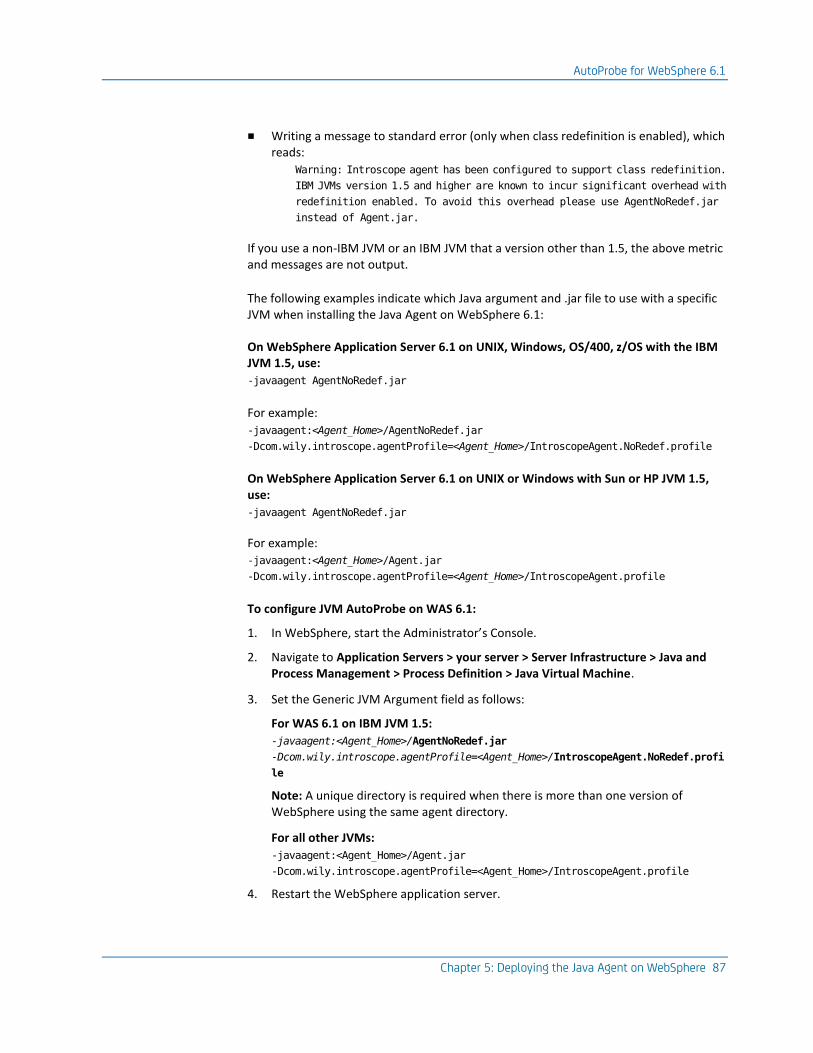
AutoProbe for WebSphere 6.1
Chapter 5: Deploying the Java Agent on WebSphere 87
■ Writing a message to standard error (only when class redefinition is enabled), which reads:
Warning: Introscope agent has been configured to support class redefinition.
IBM JVMs version 1.5 and higher are known to incur significant overhead with
redefinition enabled. To avoid this overhead please use AgentNoRedef.jar
instead of Agent.jar.
If you use a non-IBM JVM or an IBM JVM that a version other than 1.5, the above metric and messages are not output.
The following examples indicate which Java argument and .jar file to use with a specific JVM when installing the Java Agent on WebSphere 6.1:
On WebSphere Application Server 6.1 on UNIX, Windows, OS/400, z/OS with the IBM JVM 1.5, use:
-javaagent AgentNoRedef.jar
For example:
-javaagent:<Agent_Home>/AgentNoRedef.jar
-Dcom.wily.introscope.agentProfile=<Agent_Home>/IntroscopeAgent.NoRedef.profile
On WebSphere Application Server 6.1 on UNIX or Windows with Sun or HP JVM 1.5, use:
-javaagent AgentNoRedef.jar
For example:
-javaagent:<Agent_Home>/Agent.jar
-Dcom.wily.introscope.agentProfile=<Agent_Home>/IntroscopeAgent.profile
To configure JVM AutoProbe on WAS 6.1:
1. In WebSphere, start the Administrator’s Console.
2. Navigate to Application Servers > your server > Server Infrastructure > Java and Process Management > Process Definition > Java Virtual Machine.
3. Set the Generic JVM Argument field as follows:
For WAS 6.1 on IBM JVM 1.5:
-javaagent:<Agent_Home>/AgentNoRedef.jar
-Dcom.wily.introscope.agentProfile=<Agent_Home>/IntroscopeAgent.NoRedef.profi
le
Note: A unique directory is required when there is more than one version of WebSphere using the same agent directory.
For all other JVMs:
-javaagent:<Agent_Home>/Agent.jar
-Dcom.wily.introscope.agentProfile=<Agent_Home>/IntroscopeAgent.profile
4. Restart the WebSphere application server.

AutoProbe for WebSphere 7.0
88 Java Agent Guide
Note: For AutoProbe to run correctly in WebSphere environments with Java2 Security enabled, it may be necessary to add permissions to your Java2 Security Policy. If Java2 Security is enabled, follow the instructions in Modifying Java2 Security Policy (see page 91).
AutoProbe for WebSphere 7.0
This section details how to configure WebSphere 7.0 installations to use JVM AutoProbe to instrument applications. For more information about AutoProbe, see AutoProbe and ProbeBuilding Options (see page 61).
Important: If you are using the Java Agent 9.0 or later to monitor WebSphere 7.0, you may see the application server process restart repeatedly. To avoid this problem, upgrade to WAS 7.0 build level 7.0.0.8 or above.
The following examples indicate which Java argument and .jar file to use with a specific JVM when installing the Java Agent on WebSphere 7.0 on different platforms:
On WebSphere Application Server 7.0 on UNIX, Windows, or OS/400 with the IBM JVM 1.6, use:
-javaagent Agent.jar
For example:
-javaagent:<Agent_Home>/Agent.jar
-Dcom.wily.introscope.agentProfile=<Agent_Home>/IntroscopeAgent.profile
On WebSphere Application Server 7.0 on UNIX, Windows, or OS/400 with IBM JVM 1.6, use:
-javaagent Agent.jar
For example:
-javaagent:<Agent_Home>/Agent.jar
-Dcom.wily.introscope.agentProfile=<Agent_Home>/IntroscopeAgent.profile
On WebSphere Application Server 7.0 on z/OS with IBM JVM 1.6, use:
-Xbootclasspath -javaagent Agent.jar
For example:
-Xbootclasspath/a:<Agent_Home>/Agent.jar -javaagent:<Agent_Home>/Agent.jar
-Dcom.wily.introscope.agentProfile=<Agent_Home>/IntroscopeAgent.profile
To configure JVM AutoProbe on WAS 7.0:
1. In WebSphere, start the Administrator’s Console.
2. Navigate to Application Servers > your server > Server Infrastructure > Java and Process Management > Process Definition > Java Virtual Machine.
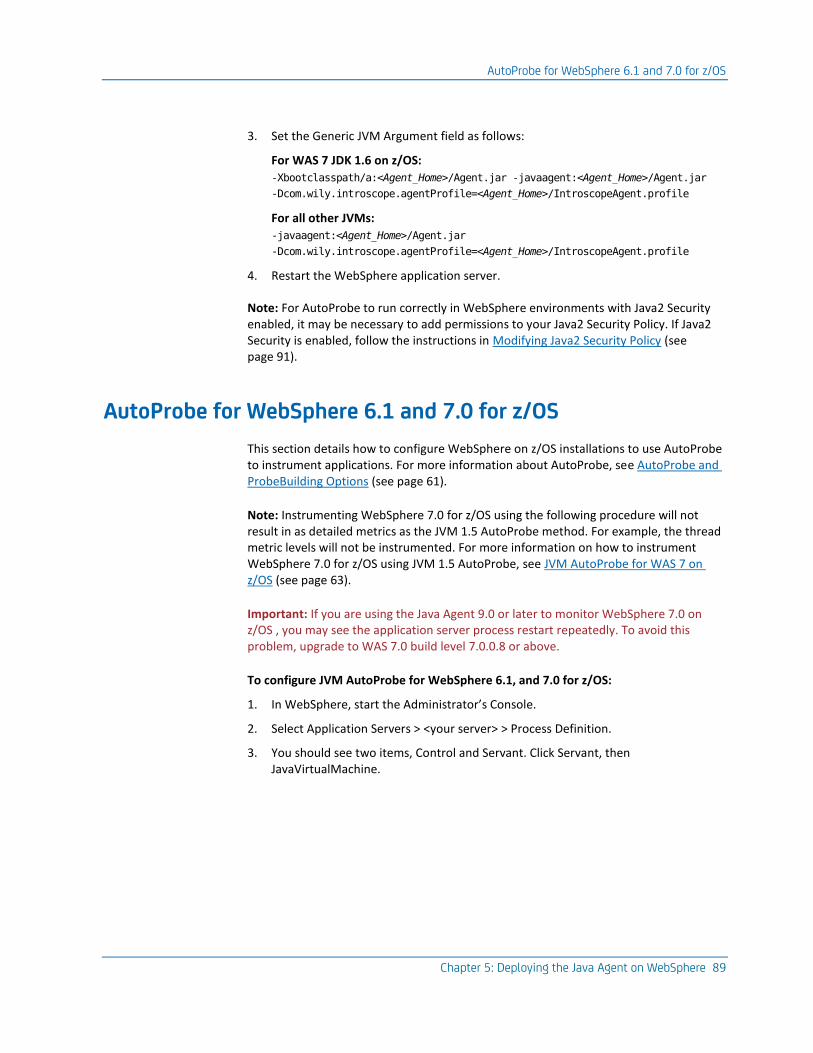
AutoProbe for WebSphere 6.1 and 7.0 for z/OS
Chapter 5: Deploying the Java Agent on WebSphere 89
3. Set the Generic JVM Argument field as follows:
For WAS 7 JDK 1.6 on z/OS:
-Xbootclasspath/a:<Agent_Home>/Agent.jar -javaagent:<Agent_Home>/Agent.jar
-Dcom.wily.introscope.agentProfile=<Agent_Home>/IntroscopeAgent.profile
For all other JVMs:
-javaagent:<Agent_Home>/Agent.jar
-Dcom.wily.introscope.agentProfile=<Agent_Home>/IntroscopeAgent.profile
4. Restart the WebSphere application server.
Note: For AutoProbe to run correctly in WebSphere environments with Java2 Security enabled, it may be necessary to add permissions to your Java2 Security Policy. If Java2 Security is enabled, follow the instructions in Modifying Java2 Security Policy (see page 91).
AutoProbe for WebSphere 6.1 and 7.0 for z/OS
This section details how to configure WebSphere on z/OS installations to use AutoProbe to instrument applications. For more information about AutoProbe, see AutoProbe and ProbeBuilding Options (see page 61).
Note: Instrumenting WebSphere 7.0 for z/OS using the following procedure will not result in as detailed metrics as the JVM 1.5 AutoProbe method. For example, the thread metric levels will not be instrumented. For more information on how to instrument WebSphere 7.0 for z/OS using JVM 1.5 AutoProbe, see JVM AutoProbe for WAS 7 on z/OS (see page 63).
Important: If you are using the Java Agent 9.0 or later to monitor WebSphere 7.0 on z/OS , you may see the application server process restart repeatedly. To avoid this problem, upgrade to WAS 7.0 build level 7.0.0.8 or above.
To configure JVM AutoProbe for WebSphere 6.1, and 7.0 for z/OS:
1. In WebSphere, start the Administrator’s Console.
2. Select Application Servers > <your server> > Process Definition.
3. You should see two items, Control and Servant. Click Servant, then JavaVirtualMachine.

AutoProbe for WebSphere 6.1 and 7.0 for z/OS
90 Java Agent Guide
4. Set the Generic JVM Argument field to specify the classloader plug-in, and the location of the IntroscopeAgent.profile file. You will set one of the following:
com.wily.introscope.agentProfile
OR
com.wily.introscope.agentResource
The argument will then have the following value (there are several properties set in one argument):
-Dcom.ibm.websphere.classloader.plugin=com.wily.introscope.api
.websphere.WASAutoProbe
-Dcom.wily.introscope.agentProfile=<path to IntroscopeAgent.profile>
OR
-Dcom.ibm.websphere.classloader.plugin=com.wily.introscope.api
.websphere.WASAutoProbe
-Dcom.wily.introscope.agentResource=<path to Resource containing
IntroscopeAgent.profile>
5. Place the Agent.jar file in the <WebSphere Instance dir>/lib/ext directory.
Note: Do not place the Agent.jar file in the WebSphere installation directory.
The following shows examples of the wrong and right directory:
WRONG: /usr/lpp/zWebSphere/V5R0M0/lib/ext
RIGHT: /WebSphere/V5R0M0/AppServer/lib/ext
6. Confirm that all newly created Introscope files and directories within the ./wily directory are read-accessible by the WebSphere process.
7. Confirm that all *.log files (written by the Java Agent and ProbeBuilder) in the ./wily folder have write-access to the WebSphere process. These include:
■ all the Introscope files and directories
■ the Introscope files inside <WAS instance dir>/lib/ext
8. Restart WebSphere application server.
9. When WebSphere says "open for e-business," open the Administrator’s Console. Metrics should start reporting.
10. For AutoProbe to run correctly in WebSphere environments with Java2 Security enabled, it may be necessary to add permissions to your Java2 Security Policy. If Java2 Security is enabled, follow the instructions in Modifying Java2 Security Policy (see page 91).
11. Configure Tracer Groups to collect servlet data. For more information, see Configuring HTTP servlet tracing (see page 368).

Modifying Java2 Security Policy
Chapter 5: Deploying the Java Agent on WebSphere 91
Modifying Java2 Security Policy
If you have Java2 Security enabled, you may need to add the following permissions to your Java2 Security Policy.
To add permissions to your Java2 Security Policy:
■ Edit the file <WebSphere home>/properties/server.policy to include the following:
// permissions for Introscope AutoProbe
grant codeBase "file:${was.install.root}/-" {
permission java.io.FilePermission "${was.install.root}${/
}wily${/}-", "read";
permission java.net.SocketPermission "*", "connect,resolve";
permission java.lang.RuntimePermission "setIO";
permission java.lang.RuntimePermission "getClassLoader";
permission java.lang.RuntimePermission "modifyThread";
permission java.lang.RuntimePermission "modifyThreadGroup";
permission java.lang.RuntimePermission "loadLibrary.*";
permission java.lang.RuntimePermission "accessClassInPackage.*";
permission java.lang.RuntimePermission "accessDeclaredMembers";
};
grant {
permission java.util.PropertyPermission "*", "read,write";
};
Note: Line breaks are shown for user readability and are not needed when adding the permissions to the server.policy file.
Disable agent naming for WebSphere
Agent automatic naming is enabled by default for all WebSphere platforms. For more general information on Java Agent naming, see Java Agent Naming (see page 147).
Note: A custom service must be configured.
WebSphere application server management data
In WebSphere environments, the Java Agent can obtain and report management information from the application server above and beyond the metrics from instrumenting your applications. For example, you can configure an agent to:
■ report JMX metrics from the application server
■ report Performance Monitoring Infrastructure (PMI) from WebSphere
■ obtain its name from the application server

WebSphere application server management data
92 Java Agent Guide
The Application Overview in the Workstation (available in Introscope v7.0 and later) uses JMX and PMI metrics, if available, in application health heuristics. Enabling the Java Agent to access application server management information is not required, but it enhances the visibility provided by the Application Overview.
To enable the Java Agent to obtain and use data from the application server, you configure an Introscope startup class or service in the application server and target it at application server instances, or to an application server cluster.
Configuring a custom service in WebSphere 6.1
This section describes how to create a custom service in WebSphere 6.1. To create a custom service in previous versions, or for more information, consult your WebSphere documentation.
To configure a custom service in WebSphere 6.1:
1. Open the WebSphere Administrative Console.
2. Select the server you'd like to configure, then navigate to Server Infrastructure > Administration > Custom Services.
3. Click New to add a new Custom Service.
4. In the Classname field, enter:
com.wily.introscope.api.websphere.IntroscopeCustomService
5. In the Display Name field, enter:
Introscope Custom Service
6. In the Classpath field, enter:
<WebSphere_Home>/wily/WebAppSupport.jar
7. Click OK.
8. Restart the application server.
WAS 6.1 on AIX platform
In some cases, customers running WebSphere Application Server (WAS) 6.1 on the AIX platform may see the following error thrown by the non-instrumented applications:
java.lang.NoClassDefFoundError:com.wily.introscope.agent.probe.io.ManagedFileInpu
tStream
This stems from having both instrumented and non-instrumented applications on the same machine. To avoid this problem, include the following JVM flag in the Generic JVM Arguments field when configuring your WAS application for Introscope:
-Xshareclasses:none
The SQL Agent for WebSphere
Chapter 5: Deploying the Java Agent on WebSphere 93
The SQL Agent for WebSphere
The configuration procedures in this section only apply to you if you used Application Server AutoProbe or Manual ProbeBuilder to instrument your application.
If you used JVM AutoProbe, no further configuration is required to use the SQL Agent.
For more information about the SQL Agent, see Configuring the Introscope SQL Agent (see page 209).
Supported JDBC drivers and DataSources
The SQL Agent supports the following JDBC drivers and JDBC DataSources. Configuration instructions have been simplified to apply to both a JDBC driver and a JDBC DataSource.
Supported JDBC drivers
The SQL Agent supports the following JDBC drivers:
■ Oracle—classes111.zip, classes12.zip, classes111_g.zip, classes12_g.zip
■ DB2—db2java.zip
■ Sybase—jconn2.jar
■ WebLogic jDriver for Oracle—jDriver 6.1
The SQL Agent fully supports the JDBC 1.0 and 2.0 specifications, including support for all JDBC driver types, I through IV.
Supported JDBC datasources for WebSphere
In db2java.zip:
■ COM.ibm.db2.jdbc.DB2ConnectionPoolDataSource
■ COM.ibm.db2.jdbc.DB2XADataSource
In classes12.zip and classes12_g.zip:
■ oracle.jdbc.pool.OracleConnectionPoolDataSource
■ oracle.jdbc.xa.client.OracleXADataSource
Supported JDBC datasources for WebLogic
In classes12.zip:
■ oracle.jdbc.xa.client.OracleXADataSource
The SQL Agent for WebSphere
94 Java Agent Guide
Configuring the SQL Agent for WebSphere Application Server (WAS)
This section describes how to configure the SQL Agent to function with WebSphere using either a JDBC Driver or a JDBC DataSource. For more information about the SQL Agent, see Configuring the Introscope SQL Agent (see page 209).
Note: The SQL Agent supports WebSphere Application Server (WAS) 6.1 and higher.
If other applications use a JDBC DataSource or driver that has been instrumented, you need to add the Agent.jar file to the classpaths for those applications. Once this is done, the applications may show up as "Unknown Processes" in the Workstation. This will not affect the functionality or performance of your application and can be ignored.
To configure the SQL Agent for WebSphere Application Server (WAS):
1. Configure the JDBC DataSource or driver in WebSphere. See Configure the JDBC DataSource or Driver in WebSphere (see page 94).
2. Instrument the JDBC DataSource or Driver. See Instrument the JDBC DataSource or Driver (see page 80).
Important: If you used Application Server AutoProbe or Manual ProbeBuilder to instrument your application, you must complete the configuration procedures. If you used JVM AutoProbe, no further configuration is required.
Configure the JDBC DataSource or Driver in WebSphere
In your WebSphere environment, configure your JDBC DataSource or driver to work with SQL Agent and WebSphere. For more information, refer to your WebSphere documentation.
Instrument the JDBC DataSource or Driver
The following instructions assume:
■ Introscope and ProbeBuilder are installed in your environment.
■ you have write permission in the directory that contains the driver file.
■ you are able to use the ProbeBuilder Wizard application either on Windows or using X-windows on UNIX. For instructions on command-line use of ProbeBuilder, see the Using the command-line ProbeBuilder (see page 358).
The SQL Agent for WebSphere
Chapter 5: Deploying the Java Agent on WebSphere 95
To instrument a JDBC DataSource or Driver:
1. Shut down WebSphere.
2. Copy the sqlagent.pbd file (the default location is <Agent_Home>/wily) to the <Introscope_Home>\config\custompbd directory.
3. In WebSphere, locate the file containing the Java classes that implement your JDBC DataSource or driver.
4. Run the ProbeBuilder Wizard, located in the <Introscope_Home> directory:
■ Introscope ProbeBuilder Wizard.exe on Windows
■ IntroscopeProbeBuilderWizard on UNIX
5. At the Welcome screen, click Next.
6. On the Select Original Java Bytecode screen, select the file containing the JDBC DataSource to instrument. For example, if using a file containing an Oracle JDBC DataSource, the name of the file would be classes12.zip.
Note: Before instrumenting any file, save a backup copy in another location.
7. On the Destination Location screen, click Next to name the resulting instrumented file. For example, if using the file containing an Oracle JDBC DataSource, the name of the resulting file would be classes12.isc.zip. Accept the default save location for the resulting file.
8. On the System Directives screen, select the SYSTEM directives for either WebSphere or WebLogic, depending on which system you are configuring. Click Next.
9. On the Custom Directives screen, select the sqlagent.pbd along with any other custom PBDs used in your deployment.
10. Click Add Probes. This creates a copy of the file containing the JDBC DataSource, instrumenting the JDBC DataSource in the copy. The new copy will be located in the same directory as the original.

WebSphere PMI
96 Java Agent Guide
11. On the Finished screen, click Exit.
In your JDBC driver directory you should find the file containing the instrumented JDBC DataSource or driver. To use this file to see the JDBC metrics in Introscope do one of the following:
■ Set the original file aside and rename the instrumented one, as in the following example:
c:\> rename classes12.zip classes12.orig.zip
c:\> rename classes12.isc.zip classes12.zip
Note: If the file to be renamed is in use, do not attempt to rename it until you first shut down any application or database that is actively using the file containing the JDBC DataSource.
■ Change your application server’s CLASSPATH setting to point to the new instrumented file.
Note: If other applications use this same JDBC DataSource or driver file, you will need to put the Agent.jar (located in <WebSphere_Home>\wily or <WebLogic_Home>/wily) in the classpath for those applications. Otherwise, applications that reference the JDBC DataSource will fail at runtime.
12. Restart your administration or application server.
WebSphere PMI
Introscope can provide WebSphere performance data by extracting WebSphere Performance Monitoring Infrastructure (PMI) metrics via the PMI interface provided with WebSphere 6.1 and higher.
You must first enable PMI data collection in WebSphere before the data will be available to Introscope. In WebSphere, all performance monitoring settings are off by default.
To enable PMI reporting:
1. Enable PMI in WebSphere. For more information, see Enabling PMI in WebSphere (see page 97).
2. Enable PMI in the IntroscopeAgent.profile. For more information, see Configuring WebSphere PMI in Introscope (see page 97).
3. Configure an Introscope Custom Service in WebSphere. For more information, see Configuring a custom service in WebSphere 6.1 (see page 92).
After you have enabled PMI data collection in WebSphere, the PMI data can then be displayed as Introscope metrics. Users can filter which metric categories to bring into Introscope, depending on their needs.
If you are using WebSphere on z/OS, see Using WebSphere PMI with Introscope on z/OS (see page 97), for a better method of recording WebSphere PMI data.
WebSphere PMI
Chapter 5: Deploying the Java Agent on WebSphere 97
Using WebSphere PMI with Introscope on z/OS
There are several ways to obtain additional WebSphere-specific performance metrics on z/OS. CA Technologies recommends using the PowerPack for z/OS WebSphere product, which provides WebSphere-specific PBDs and metrics. This product uses tracer technology which has a low overhead method of obtaining WebSphere-specific metrics, and does not require you to enable PMI in WebSphere for z/OS.
You can also enable PMI reporting on WebSphere for z/OS, as outlined in WebSphere PMI (see page 96), but this approach consumes more system resources.
Enabling PMI in WebSphere
This section describes how to turn on WebSphere performance monitor settings.
To enable PMI in WebSphere 6.1:
■ See your WebSphere 6.1 and higher documentation for instructions on enabling Performance Monitoring Settings, and enabling Performance Monitoring for each desired metric category.
Configuring WebSphere PMI in Introscope
After you turn on Performance Monitoring Settings in WebSphere, you must enable PMI data collection in Introscope, and enable the metric categories you’d like to see reported.
To configure PMI collection:
1. Shut down your managed application.
2. Open the IntroscopeAgent.profile.
3. Locate the property, introscope.agent.pmi.enable, under the WebSphere PMI Configurations heading, and verify it is set to true.
4. Introscope can report data from the following high-level PMI metric categories. These categories are represented by commented-out properties under the WebSphere PMI Configuration heading. Four categories—threadPool, servletSessions, connectionPool, and j2c—are set to true by default.
You can comment out categories to decrease the amount of metrics reported.
5. Save the changes.
6. Restart the managed application.

Logging considerations on WebSphere for z/OS
98 Java Agent Guide
Viewing WebSphere PMI data
After you’ve enabled PMI collections in Introscope, available PMI metrics will be displayed in the WebSpherePMI node under the agent nodes in the Investigator tree.
Logging considerations on WebSphere for z/OS
There are some things to consider when logging in a WebSphere z/OS environment. For more information about Java Agent logging options, see Java Agent Monitoring and Logging (see page 157).
Tagging log output as EBCDIC
WebSphere for z/OS changed its default encoding from EBCDIC CP1047 to ASCII ISO8859-1. Because z/OS is normally an EBCDIC machine, any logging data written by the Java Agent or AutoProbe must be tagged to use EBCDIC as the final output stream, instead of ASCII.
To tag data as EBCDIC instead of ASCII:
1. Open the IntroscopeAgent.profile, located in the <Agent_Home>\wily directory.
2. Add these properties to the IntroscopeAgent.profile:
log4j.appender.console.encoding=IBM-1047
log4j.appender.logfile.encoding=IBM-1047
3. Save the IntroscopeAgent.profile.
Eliminating startup timing issues with logging facilities
A new property has been added for WebSphere for z/OS 6.1 and later, which is used to eliminate any startup timing window exposures that can occur with the Introscope logging facilities.
To eliminate the timing window exposures:
1. Open the IntroscopeAgent.profile, located in the <Agent_Home>\wily directory.
2. Add this property to the IntroscopeAgent.profile:
introscope.agent.logger.delay=100000
The value is in milliseconds, so the default delay in this example is 100 seconds.
3. Save the IntroscopeAgent.profile.

Cross-process Transaction Tracing in WebSphere
Chapter 5: Deploying the Java Agent on WebSphere 99
Cross-process Transaction Tracing in WebSphere
Transaction Tracer can trace transactions that cross JVM boundaries on WebSphere 6.1 if the environment is comprised of compatible versions of the same vendor’s application server.
Cross-process transaction tracing is supported for synchronous transactions, for instance servlets to EJBs, as well as asynchronous transactions.
For more information about Transaction Tracing, see Configuring Transaction Trace Options (see page 203).
To enable cross-process tracing in WebSphere:
1. Configure web application support. Follow the instructions in Configuring a custom service in WebSphere 6.1 (see page 92).
2. Turn on the work area service.
From the administration page, servers->application servers, click on server1, click on Business Process Services, click on Work Area Service, check the "Enable service at server startup" box.
3. Set introscope.agent.websphere.crossjvm=true in the agent profile.


Chapter 6: Deploying the Java Agent on other application servers using JVM AutoProbe 101
Chapter 6: Deploying the Java Agent on other application servers using JVM AutoProbe
This section provides instructions for deploying the Java Agent on other application servers.
This section contains the following topics:
Deploying the Java Agent on other application servers using JVM AutoProbe (see page 101) Configuring Apache Tomcat (see page 102) Configuring JBoss (see page 105) Configuring Oracle Application Server 10g (see page 107) Configuring GlassFish 2.1 (see page 108) Configuring SAP Netweaver 7.1 (see page 108)
Deploying the Java Agent on other application servers using JVM AutoProbe
You should use JVM AutoProbe if you are running JVM 1.5 or higher.
■ Apache Tomcat
If you installed the Java Agent on an Apache Tomcat application server, there are several configurations you need to perform to have AutoProbe function correctly on the application server. See Configuring Apache Tomcat (see page 102).
■ JBoss
If you installed the Java Agent on a JBoss system, there are further configurations you must perform to enable the reporting of JBoss metrics to Introscope. See Configuring JBoss (see page 105).

Configuring Apache Tomcat
102 Java Agent Guide
■ Oracle Application Server 10g
For more information, see Configuring Oracle Application Server 10g (see page 107).
■ GlassFish 2.1
For more information see Configuring GlassFish 2.1 (see page 108).
■ SAP Netweaver 7.1
For more information see Configuring SAP Netweaver 7.1 (see page 108).
When starting the application server, avoid using the hyphen (-) character as an identifier for a classname. Introscope does not parse this character, and using it might lead to class loading errors in the agent logs. For more information, see Hyphen Character Not Allowed in Java Identifier Names (KB 1331).
Configuring Apache Tomcat
You can install the Java Agent on an Apache Tomcat application server. Depending on which method you used to install the Java Agent on the Tomcat application server, there are further configurations you must make to ensure the Java Agent operates and reports metrics correctly.
If you used the Java Agent installer:
1. Follow the installer instructions. See The Java Agent installer (see page 30) for more information.
2. Edit the IntroscopeAgent.profile as desired. There are multiple ways to configure the profile - see Java Agent configuration overview (see page 53) for more information.
3. Configure the Tomcat PBD with your tracing decisions. See Tomcat PBD tracing options (see page 103) for more information.
4. Edit the Tomcat startup script to add Wily-specific code. See Editing the startup script (see page 104) for more information.
If you manually installed the Java Agent:
1. Follow the manual installation instructions. See Manual installation (see page 40) for more information.
2. Edit the IntroscopeAgent.profile as desired. There are multiple ways to configure the profile - see Java Agent configuration overview (see page 53) for more information.
3. Configure the Tomcat PBD with your tracing decisions. See Tomcat PBD tracing options (see page 103) for more information.

Configuring Apache Tomcat
Chapter 6: Deploying the Java Agent on other application servers using JVM AutoProbe 103
4. If you are using Application Server AutoProbe, create the AutoProbeConnector. jar. See Creating an AutoProbe connector file (see page 64) for more information.
5. Copy the WebAppSupport.jar from the <Agent_Home>/wily root directory into <Agent_Home>/wily/ext directories.
Important: If you have the WebAppSupport.jar file present under the tomcat_root/common/endorsed directory from the previous releases of the Java Agent, make sure to remove it.
6. Edit the Tomcat startup script to add Wily specific code. See Editing the startup script (see page 104) for more information.
Tomcat PBD tracing options
Once you have installed the Java Agent on an Apache Tomcat application server, there are some tracing options that must be configured. You must determine if:
■ you want to use unformatted or formatted session tracing (see step 2 below).
■ you want to trace Apache sessions or HTTP sessions (see step 3 below).
Once you have determined the above, you configure the PBD for your Apache Tomcat version.
To configure your Tomcat PBDs:
1. Open the PBD for the version of your Apache Tomcat application server from the wily directory. The following PBDs are available for configuration:
■ tomcat41x.pbd
■ tomcat50x.pbd
■ tomcat55x.pbd
Note: Configure only one of the PBDs, and delete the ones you are not using.
2. In the HTTP Session Configuration section of the toggles-full.pbd or toggles-typical.pbd, select and uncomment the formatting option you want to use. Use one of the following:
■ FormattedSessionTracing produces metrics that are easier to read, but may not work on all Tomcat installations.
■ UnformattedSessionTracing produces metrics that may not be as easy to read, but this option functions in all Tomcat installations. This option is enabled by default.
Note: Use one of the formatting options, not both.
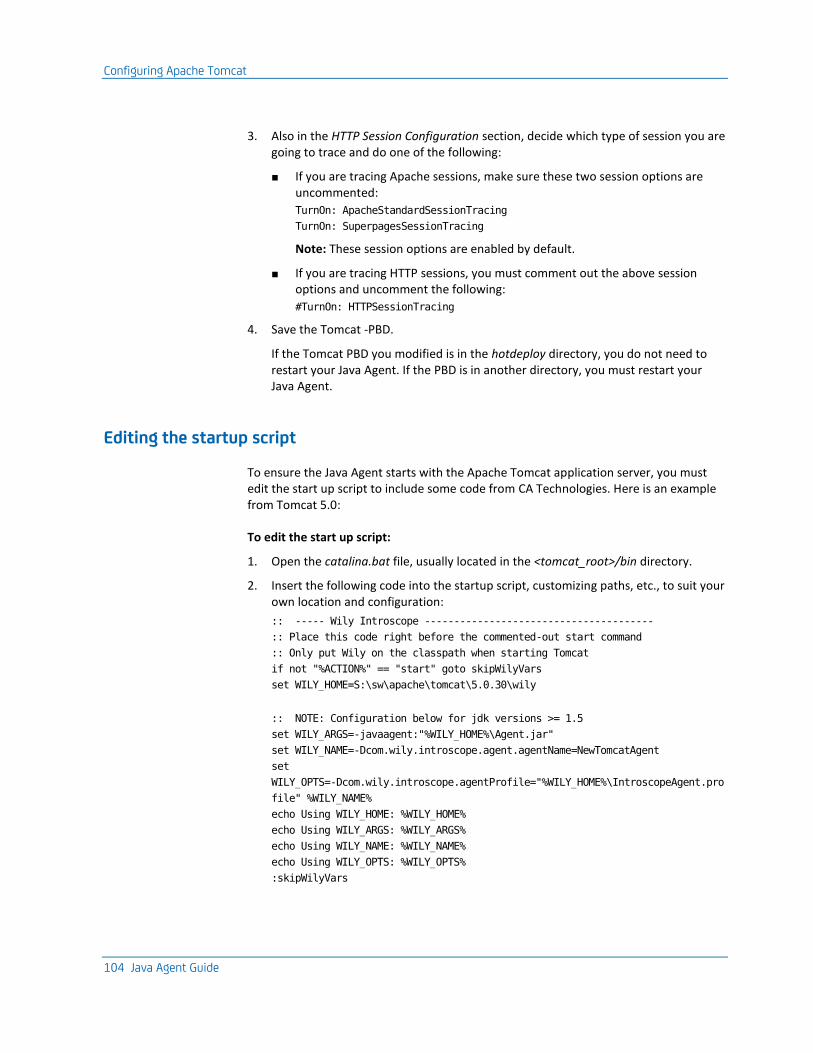
Configuring Apache Tomcat
104 Java Agent Guide
3. Also in the HTTP Session Configuration section, decide which type of session you are going to trace and do one of the following:
■ If you are tracing Apache sessions, make sure these two session options are uncommented:
TurnOn: ApacheStandardSessionTracing
TurnOn: SuperpagesSessionTracing
Note: These session options are enabled by default.
■ If you are tracing HTTP sessions, you must comment out the above session options and uncomment the following:
#TurnOn: HTTPSessionTracing
4. Save the Tomcat -PBD.
If the Tomcat PBD you modified is in the hotdeploy directory, you do not need to restart your Java Agent. If the PBD is in another directory, you must restart your Java Agent.
Editing the startup script
To ensure the Java Agent starts with the Apache Tomcat application server, you must edit the start up script to include some code from CA Technologies. Here is an example from Tomcat 5.0:
To edit the start up script:
1. Open the catalina.bat file, usually located in the <tomcat_root>/bin directory.
2. Insert the following code into the startup script, customizing paths, etc., to suit your own location and configuration:
:: ----- Wily Introscope ---------------------------------------
:: Place this code right before the commented-out start command
:: Only put Wily on the classpath when starting Tomcat
if not "%ACTION%" == "start" goto skipWilyVars
set WILY_HOME=S:\sw\apache\tomcat\5.0.30\wily
:: NOTE: Configuration below for jdk versions >= 1.5
set WILY_ARGS=-javaagent:"%WILY_HOME%\Agent.jar"
set WILY_NAME=-Dcom.wily.introscope.agent.agentName=NewTomcatAgent
set
WILY_OPTS=-Dcom.wily.introscope.agentProfile="%WILY_HOME%\IntroscopeAgent.pro
file" %WILY_NAME%
echo Using WILY_HOME: %WILY_HOME%
echo Using WILY_ARGS: %WILY_ARGS%
echo Using WILY_NAME: %WILY_NAME%
echo Using WILY_OPTS: %WILY_OPTS%
:skipWilyVars

Configuring JBoss
Chapter 6: Deploying the Java Agent on other application servers using JVM AutoProbe 105
::Comment out the original start command
::%_EXECJAVA% %JAVA_OPTS% %CATALINA_OPTS% %DEBUG_OPTS%
-Djava.endorsed.dirs="%JAVA_ENDORSED_DIRS%" -classpath "%CLASSPATH%"
-Dcatalina.base="%CATALINA_BASE%" -Dcatalina.home="%CATALINA_HOME%"
-Djava.io.tmpdir="%CATALINA_TMPDIR%" %MAINCLASS% %CMD_LINE_ARGS% %ACTION%
::Print the command line before executing it
echo About to execute command: %_EXECJAVA% %WILY_ARGS% %WILY_OPTS% %JAVA_OPTS%
%CATALINA_OPTS% %DEBUG_OPTS% -Djava.endorsed.dirs="%JAVA_ENDORSED_DIRS%"
-classpath "%CLASSPATH%" -Dcatalina.base="%CATALINA_BASE%"
-Dcatalina.home="%CATALINA_HOME%" -Djava.io.tmpdir="%CATALINA_TMPDIR%"
%MAINCLASS% %CMD_LINE_ARGS% %ACTION%
%_EXECJAVA% %WILY_ARGS% %WILY_OPTS% %JAVA_OPTS% %CATALINA_OPTS% %DEBUG_OPTS%
-Djava.endorsed.dirs="%JAVA_ENDORSED_DIRS%" -classpath "%CLASSPATH%"
-Dcatalina.base="%CATALINA_BASE%" -Dcatalina.home="%CATALINA_HOME%"
-Djava.io.tmpdir="%CATALINA_TMPDIR%" %MAINCLASS% %CMD_LINE_ARGS% %ACTION%
3. Save the catalina.bat file.
Configuring JBoss
If you installed the Java Agent on a JBoss system, there are further configurations you must perform to enable the reporting of JBoss JMX metrics to Introscope. You must configure JBoss for Introscope and deploy web application support for JBoss. When deploying web application support for JBoss, the Introscope service is deployed as a stand alone XML service descriptor.
This functionality requires Introscope 8.0 or higher. It is compatible with JBoss 4.0.3 SP1, 4.0.2, 4.2x, and 5.0.
To configure JBoss for Introscope:
1. Modify the run.bat file in the bin directory of your JBoss installation by adding the following:
rem =====================================================================
rem Enable Introscope
rem =====================================================================
rem Use this for Java 1.5 or higher
set JAVA_OPTS= -javaagent:%JBOSS_HOME%\wily\Agent.jar
-Dcom.wily.introscope.agentProfile=%JBOSS_HOME%\wily\IntroscopeAgent.profile
%JAVA_OPTS%
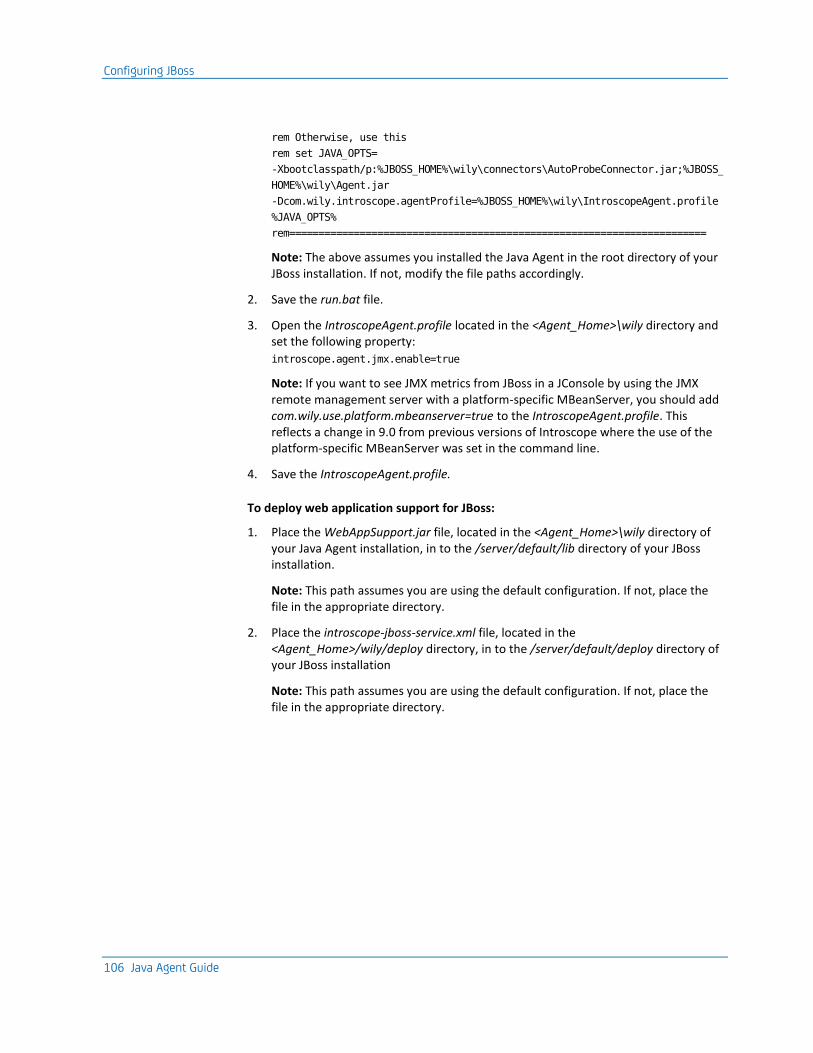
Configuring JBoss
106 Java Agent Guide
rem Otherwise, use this
rem set JAVA_OPTS=
-Xbootclasspath/p:%JBOSS_HOME%\wily\connectors\AutoProbeConnector.jar;%JBOSS_
HOME%\wily\Agent.jar
-Dcom.wily.introscope.agentProfile=%JBOSS_HOME%\wily\IntroscopeAgent.profile
%JAVA_OPTS%
rem=======================================================================
Note: The above assumes you installed the Java Agent in the root directory of your JBoss installation. If not, modify the file paths accordingly.
2. Save the run.bat file.
3. Open the IntroscopeAgent.profile located in the <Agent_Home>\wily directory and set the following property:
introscope.agent.jmx.enable=true
Note: If you want to see JMX metrics from JBoss in a JConsole by using the JMX remote management server with a platform-specific MBeanServer, you should add com.wily.use.platform.mbeanserver=true to the IntroscopeAgent.profile. This reflects a change in 9.0 from previous versions of Introscope where the use of the platform-specific MBeanServer was set in the command line.
4. Save the IntroscopeAgent.profile.
To deploy web application support for JBoss:
1. Place the WebAppSupport.jar file, located in the <Agent_Home>\wily directory of your Java Agent installation, in to the /server/default/lib directory of your JBoss installation.
Note: This path assumes you are using the default configuration. If not, place the file in the appropriate directory.
2. Place the introscope-jboss-service.xml file, located in the <Agent_Home>/wily/deploy directory, in to the /server/default/deploy directory of your JBoss installation
Note: This path assumes you are using the default configuration. If not, place the file in the appropriate directory.
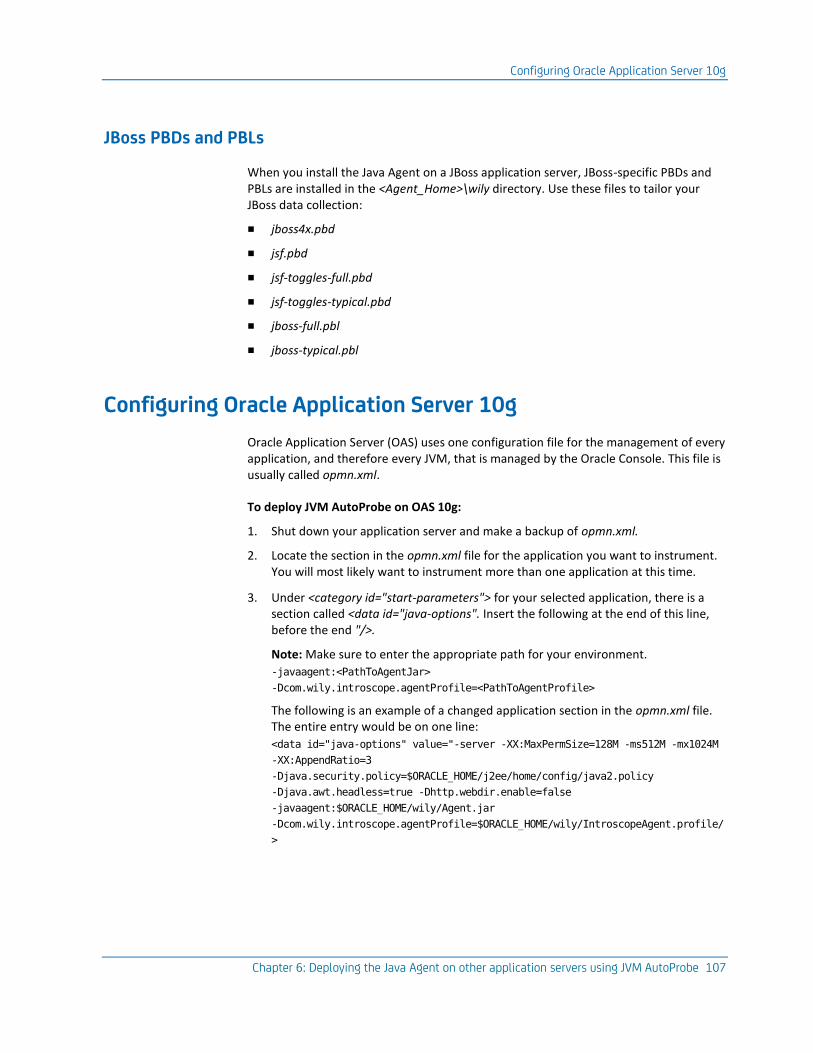
Configuring Oracle Application Server 10g
Chapter 6: Deploying the Java Agent on other application servers using JVM AutoProbe 107
JBoss PBDs and PBLs
When you install the Java Agent on a JBoss application server, JBoss-specific PBDs and PBLs are installed in the <Agent_Home>\wily directory. Use these files to tailor your JBoss data collection:
■ jboss4x.pbd
■ jsf.pbd
■ jsf-toggles-full.pbd
■ jsf-toggles-typical.pbd
■ jboss-full.pbl
■ jboss-typical.pbl
Configuring Oracle Application Server 10g
Oracle Application Server (OAS) uses one configuration file for the management of every application, and therefore every JVM, that is managed by the Oracle Console. This file is usually called opmn.xml.
To deploy JVM AutoProbe on OAS 10g:
1. Shut down your application server and make a backup of opmn.xml.
2. Locate the section in the opmn.xml file for the application you want to instrument. You will most likely want to instrument more than one application at this time.
3. Under <category id="start-parameters"> for your selected application, there is a section called <data id="java-options". Insert the following at the end of this line, before the end "/>.
Note: Make sure to enter the appropriate path for your environment.
-javaagent:<PathToAgentJar>
-Dcom.wily.introscope.agentProfile=<PathToAgentProfile>
The following is an example of a changed application section in the opmn.xml file. The entire entry would be on one line:
<data id="java-options" value="-server -XX:MaxPermSize=128M -ms512M -mx1024M
-XX:AppendRatio=3
-Djava.security.policy=$ORACLE_HOME/j2ee/home/config/java2.policy
-Djava.awt.headless=true -Dhttp.webdir.enable=false
-javaagent:$ORACLE_HOME/wily/Agent.jar
-Dcom.wily.introscope.agentProfile=$ORACLE_HOME/wily/IntroscopeAgent.profile/
>
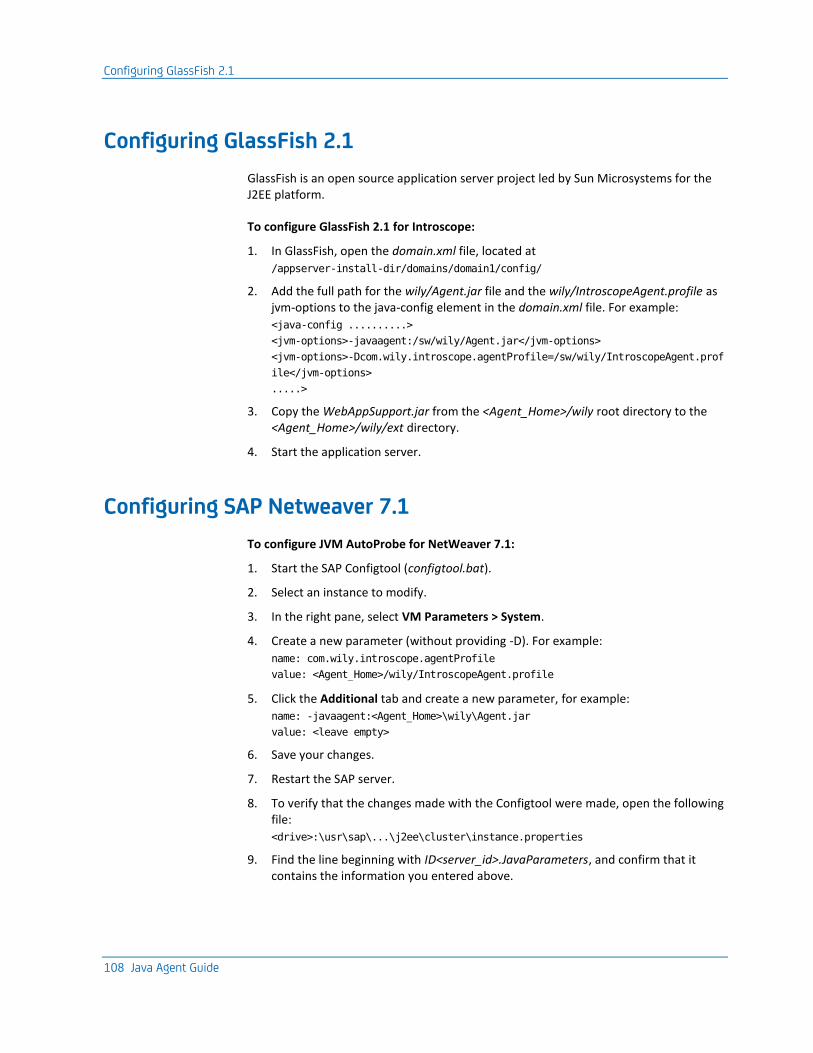
Configuring GlassFish 2.1
108 Java Agent Guide
Configuring GlassFish 2.1
GlassFish is an open source application server project led by Sun Microsystems for the J2EE platform.
To configure GlassFish 2.1 for Introscope:
1. In GlassFish, open the domain.xml file, located at
/appserver-install-dir/domains/domain1/config/
2. Add the full path for the wily/Agent.jar file and the wily/IntroscopeAgent.profile as jvm-options to the java-config element in the domain.xml file. For example:
<java-config ..........>
<jvm-options>-javaagent:/sw/wily/Agent.jar</jvm-options>
<jvm-options>-Dcom.wily.introscope.agentProfile=/sw/wily/IntroscopeAgent.prof
ile</jvm-options>
.....>
3. Copy the WebAppSupport.jar from the <Agent_Home>/wily root directory to the <Agent_Home>/wily/ext directory.
4. Start the application server.
Configuring SAP Netweaver 7.1
To configure JVM AutoProbe for NetWeaver 7.1:
1. Start the SAP Configtool (configtool.bat).
2. Select an instance to modify.
3. In the right pane, select VM Parameters > System.
4. Create a new parameter (without providing -D). For example:
name: com.wily.introscope.agentProfile
value: <Agent_Home>/wily/IntroscopeAgent.profile
5. Click the Additional tab and create a new parameter, for example:
name: -javaagent:<Agent_Home>\wily\Agent.jar
value: <leave empty>
6. Save your changes.
7. Restart the SAP server.
8. To verify that the changes made with the Configtool were made, open the following file:
<drive>:\usr\sap\...\j2ee\cluster\instance.properties
9. Find the line beginning with ID<server_id>.JavaParameters, and confirm that it contains the information you entered above.

Chapter 7: ProbeBuilder Directives 109
Chapter 7: ProbeBuilder Directives
This section describes how to create and modify ProbeBuilder Directives.
This section contains the following topics:
ProbeBuilder Directives overview (see page 109) Using the IntroscopeAgent.profile, PBLs, and PBDs together (see page 129) Applying ProbeBuilder Directives (see page 129) Creating custom tracers (see page 132) Using Blame Tracers to mark blame points (see page 143) Supplementary directives and tracers information (see page 146)
ProbeBuilder Directives overview
ProbeBuilder Directive (PBD) files tell the Introscope ProbeBuilder how to add probes, such as timers and counters, to instrument an application. PBD files govern what metrics your agents report to the Introscope Enterprise Manager.
Note: All metrics are calculated using the time set by your system clock. If the system clock is reset during a transaction, the elapsed time reported for that transaction may be misleading.
Introscope includes a set of default PBD files. You can also create custom Introscope PBD files to track any classes or methods to obtain specific information about your applications. See Default PBD files (see page 111), Default PBL files (see page 114), and Creating advanced custom tracers for more information.
There are two kinds of files used to specify ProbeBuilder Directives:
■ ProbeBuilder Directive (PBD) files
A ProbeBuilder Directive (PBD) file contains directives used by ProbeBuilder to instrument your applications. This determines which metrics the agents report to the Enterprise Manager.
■ ProbeBuilder List (PBL) files
A ProbeBuilder List (PBL) file contains a list of multiple PBD filenames. Different PBL files can refer to the same PBD files.
Important: PBDs and PBLs only support ASCII characters. Placing other characters (such as Unicode characters) in PBDs or PBLs could result in problems with AutoProbe.
If you are using Introscope AutoProbe, the relevant PBD and PBL files for your specific application server are placed in the <ApplicationServer_Home>/wily directory when you install the Java Agent.

ProbeBuilder Directives overview
110 Java Agent Guide
Components traced by the default PBDs
The default Introscope PBD files implement tracing of the following Java components:
■ Oracle JDBC
■ JSP Tag Libraries
■ JSP IO Tag Libraries
■ JSP DB Tag Libraries
■ Struts
■ Servlets
■ Java Server Pages (JSPs)
■ Enterprise JavaBeans (EJBs)
■ Java Database Connectivity (JDBC)
■ Network Sockets
■ Remote Method Invocation (RMI)
■ Extensible Markup Language (XML)
■ Java Transaction API (JTA)
■ Java Naming and Directory Interface (JNDI)
■ Java Message Service (JMS)
■ Common Object Request Broker Architecture (CORBA)
■ User Datagram Protocol (UDP)
■ File Systems
■ Threads
■ System Logs
■ Thrown and Caught Exceptions (off by default)
Occasionally, too many Java classes are selected for monitoring in a ProbeBuilder Directive (PBD) file, causing the Java Agent to start incorrectly, or to experience a "hang". If this happens, use the AutoProbe.log file to identify the classes that caused the Java Agent to hang and add a skip directive to the PBD file, skipping the classes that may have caused the problem. For more information about adding skip directives to your custom PBD files, see Skip directives (see page 68).

ProbeBuilder Directives overview
Chapter 7: ProbeBuilder Directives 111
Default PBD files
The Java Agent includes the following default PBD files:
appmap.pbd
This file provides tracer directives for application triage map instrumentation.
appmap-ejb.pbd
This file provides tracer directives for application triage map EJB instrumentation.
appmap-soa.pbd
This file provides tracer directives for application triage map SOA instrumentation for SPM supported Java SOAP stacks. See the CA Wily SOA Performance Management Guide for more information.
bizrecording.pbd
This file provide tracer definitions and directives to setup agent business recording.
biz-trx-http.pbd
This file provides tracer directives for business-centric HTTP instrumentation.
di.pbd
These directives tell ProbeBuilder to not instrument Apache Derby implementation classes.
errors.pbd
This file configures Error Detector by specifying what code-level events constitute serious errors. By default, only front- and back-end errors are considered serious. That is, only errors that will be manifest as a user-facing error page or that indicate a problem with a backend system (ADO.NET, Messaging, etc.).
j2ee.pbd
This file provides tracer groups for common Java Enterprise Edition components. Use either toggles-full.pbd or toggles-typical.pbd to TurnOn specific tracing.
java2.pbd
This file provides tracer groups for common Java 2 components. Use either toggles-full.pbd or toggles-typical.pbd to TurnOn specific tracing.
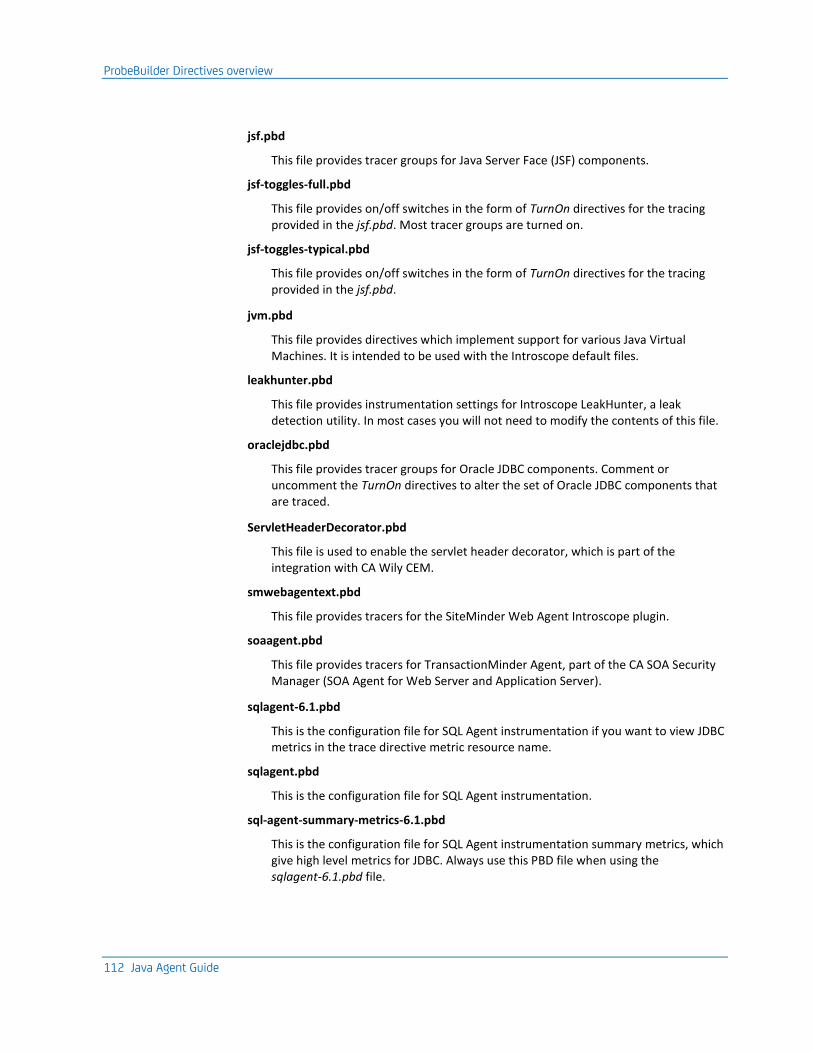
ProbeBuilder Directives overview
112 Java Agent Guide
jsf.pbd
This file provides tracer groups for Java Server Face (JSF) components.
jsf-toggles-full.pbd
This file provides on/off switches in the form of TurnOn directives for the tracing provided in the jsf.pbd. Most tracer groups are turned on.
jsf-toggles-typical.pbd
This file provides on/off switches in the form of TurnOn directives for the tracing provided in the jsf.pbd.
jvm.pbd
This file provides directives which implement support for various Java Virtual Machines. It is intended to be used with the Introscope default files.
leakhunter.pbd
This file provides instrumentation settings for Introscope LeakHunter, a leak detection utility. In most cases you will not need to modify the contents of this file.
oraclejdbc.pbd
This file provides tracer groups for Oracle JDBC components. Comment or uncomment the TurnOn directives to alter the set of Oracle JDBC components that are traced.
ServletHeaderDecorator.pbd
This file is used to enable the servlet header decorator, which is part of the integration with CA Wily CEM.
smwebagentext.pbd
This file provides tracers for the SiteMinder Web Agent Introscope plugin.
soaagent.pbd
This file provides tracers for TransactionMinder Agent, part of the CA SOA Security Manager (SOA Agent for Web Server and Application Server).
sqlagent-6.1.pbd
This is the configuration file for SQL Agent instrumentation if you want to view JDBC metrics in the trace directive metric resource name.
sqlagent.pbd
This is the configuration file for SQL Agent instrumentation.
sql-agent-summary-metrics-6.1.pbd
This is the configuration file for SQL Agent instrumentation summary metrics, which give high level metrics for JDBC. Always use this PBD file when using the sqlagent-6.1.pbd file.

ProbeBuilder Directives overview
Chapter 7: ProbeBuilder Directives 113
struts.pbd
This file provides directives which monitor Apache struts. It is intended to be used with the Introscope default files.
summary-metrics-6.1.pbd
This file provides directives necessary for JSP tracing, Servlet tracing, and EJB tracing in pre-7.0 Introscope instances.
taglibs.pbd
This file provides directives that monitor classes which should be traced as JSP tag libraries, as well as Jakarta I/O and DGTags tag libraries.
TIBCO pbd
The Java Agent is installed with several PBDs related to monitoring TIBCO through the SOA extension. See the CA Wily SOA Performance Management Guide for more information.
toggles-full.pbd
This file provides on/off switches in the form of TurnOn directives for the tracing provided in other directives files. Most tracer groups are turned on.
For more information about turning tracers on or off, see Default tracer groups and toggles files (see page 114) and Turning tracer groups on or off (see page 125).
toggles-typical.pbd
This file provides on/off switches in the form of TurnOn directives for the tracing provided in other directives files. Only a small section of tracer groups are turned on.
For more information about turning tracers on or off, see Default tracer groups and toggles files (see page 114) and Turning tracer groups on or off (see page 125).
webMethods pbds
The Java Agent is installed with several PBDs related to monitoring webMethods through the Introscope SOA Extension For WebMethods. See the CA Wily SOA Performance Management Guide for more information.
WebSphere MQ pbds
The Java Agent is installed with several PBDs related to monitoring WebSphere MQ connectors and messaging system through the PowerPack for WebSphere MQ. See the CA Wily PowerPack for WebSphere MQ User Guide for more information.
The Java Agent also installs application server-specific PBDs, which vary depending on the application server you are monitoring.
ProbeBuilder Directives overview
114 Java Agent Guide
Default PBL files
There are two PBL files available with each agent:
default-full.pbl (default)
References PBD files in which most tracer groups are turned on. Introscope uses this set by default to demonstrate full Introscope functionality.
default-typical.pbl
A subset of tracer groups in the referenced PBD files are turned on. The typical set includes common settings, and is the set you can customize for a particular environment.
The Java Agent also installs application server-specific PBLs, which vary depending on the application server you are monitoring.
Default tracer groups and toggles files
Tracer groups are defined in PBD files. They cause the reporting of information about a set of classes. In PBD files, tracer group information is referred to by the term flag. For example, TraceOneMethodIfFlagged or SetFlag are defining tracer group information.
A tracer group consists of a set of tracers that is applied to a set of classes. For example, there are tracer groups which report the response times and rates for all RMI classes.
You can refine the gathering of metrics on your systems by turning on or off certain tracer groups. This affects overhead usage, either increasing or decreasing it, depending on how you configure the tracer groups.

ProbeBuilder Directives overview
Chapter 7: ProbeBuilder Directives 115
Tracer groups are modified in the toggles-full.pbd and the toggles-typical.pbd files, which are referred to by the default-full.pbl and default-typical.pbl files. This table lists default tracer groups and their default configurations:
AgentInitialization
Agent Initialization Configuration
Full: on
Typical: on
ApacheStandardSessionTracing
HTTP Session Configuration
Full: on
Typical: on
AuthenticationTracing
Authentication Configuration
Full: on
Typical: on
CorbaTracing
CORBA method invocations
Full: on
Typical: on
DBCPTracing
DBCP Configuration
Full: on
Typical: on
DBCPv55Tracing
DBCP Configuration
Full: on
Typical: on

ProbeBuilder Directives overview
116 Java Agent Guide
EJB2StubTracing
EJB 2.0 Configuration
Full: on
Typical: on
EJB3StubTracing
EJB 3.0 Configuration
Full: on
Typical: on
EntityBean3Tracing
Entity EJB 3.0 method invocations
Full: on
Typical: on
EntityBeanTracing
Entity EJB method invocations
Full: on
Typical: on
HTTPServletTracing
HTTP servlet service responses
Full: on
Typical: on
If you are using Application Server AutoProbe, turn on this tracer group: HTTPAppServerAutoProbeServletTracing.
InstanceCounts
Counts number of instances of object type identified with tracer group.
Full: on
Typical: on
Nothing will be traced until classes are identified with this tracer group.

ProbeBuilder Directives overview
Chapter 7: ProbeBuilder Directives 117
J2eeConnectorTracing
J2EE connector information
Full: on
Typical: on
JavaMailTransportTracing
Mail sending times
Full: on
Typical: on
JDBCQueryTracing
JDBC queries
Full: on
Typical: on
JDBCUpdateTracing
JDBC updates
Full: on
Typical: on
JMSConsumerTracing
JMS message processing times
Full: on
Typical: on
JMSListenerTracing
JMS message processing times
Full: on
Typical: on
ProbeBuilder Directives overview
118 Java Agent Guide
JMSPublisherTracing
JMS message broadcast times
Full: on
Typical: on
JMSSenderTracing
JMS message broadcast times
Full: on
Typical: on
JSPTracing
JSP service responses
Full: on
Typical: on
MessageDrivenBean3Tracing
Message-driven EJB 3.0 method invocations
Full: on
Typical: on
MessageDrivenBeanTracing
Message-driven EJB method invocations
Full: on
Typical: on
NIOSocketTracing
Generates a set of metrics for each socket connection under the NIO|Channels|Sockets node, with additional metrics under the Backends node.
Full: on
Typical: on

ProbeBuilder Directives overview
Chapter 7: ProbeBuilder Directives 119
NIOSocketSummaryTracing
Generates a single set of metrics covering all NIO socket connections
Full: on
Typical: on
Included in these metrics are connections that were excluded from NIOSocketTracing metrics by agent properties, as well as some internal NIO sockets which are always excluded from NIOSocketTracing metrics.
NIODatagramTracing
Generates a set of metrics for each datagram "connection".
Full: on
Typical: on
See NIODatagramTracing metrics on page 269 for more information.
NIODatagramSummaryTracing
Generates a single set of metrics measuring all NIO datagram activity.
Full: on
Typical: on
Included in these metrics are connections that were excluded from NIODatagramTracing metrics by agent properties, as well as some internal NIO sockets which are always excluded from NIODatagramTracing metrics.
PersistentSessionTracing
HTTP session configuration
Full: on
Typical: on
RMIClientTracing
RMI client method invocations
Full: on
Typical: on
RMIServerTracing
RMI server method invocations
Full: on
Typical: on
ProbeBuilder Directives overview
120 Java Agent Guide
ServerInfoTracing
Server info configuration
Full: on
Typical: on
SessionBean3Tracing
Session EJB 3.0 method invocations
Full: on
Typical: on
SessionBeanTracing
Session EJB method invocations
Full: on
Typical: on
SocketTracing
Network socket bandwidth as well as SSL tracking
Full: on
Typical: on
StrutsTracing
Execution times of actions in the Struts framework
Full: on
Typical: on
SuperpagesSessionTracing
HTTP Session Configuration
Full: on
Typical: on

ProbeBuilder Directives overview
Chapter 7: ProbeBuilder Directives 121
ThreadPoolTracing
Thread Pool Configuration
Full: on
Typical: on
UDPTracing
Network socket bandwidth
Full: on
Typical: on
UnformattedSessionTracing
HTTP Session Configuration
Full: on
Typical: on
EJB3MethodLevelTracing
EJB 3.0 activity at method level
Full: on
Typical: off
EJBMethodLevelTracing
EJB activity at method level
Full: on
Typical: off
FileSystemTracing
File system bytes written and read
Full: on
Typical: off

ProbeBuilder Directives overview
122 Java Agent Guide
JAXMListenerTracing
JAXM message sends
Full: on
Typical: off
JNDITracing
JNDI lookup times
Full: on
Typical: off
off
JSPDBTagsTagLibraryTracing
Jakarta DB Tags custom tag library for reading and writing from a SQL database
Full: on
Typical: off
JSPIOTagLibraryTracing
Jakarta IO custom tag library for a variety of input and output tasks
Full: on
Typical: off
JTACommitTracing
Commit times using JTA
Full: on
Typical: off
ThreadTracing
Number of active threads by class
Full: on
Typical: off

ProbeBuilder Directives overview
Chapter 7: ProbeBuilder Directives 123
XMLSAXTracing
Time spent parsing XML document
Full: on
Typical: off
XSLTTracing
XML transformation time
Full: on
Typical: off
CatchException
Exception configuration
Full: off
Typical: off
FormattedSessionTracing
HTTP Session configuration
Full: off
Typical: off
HTTPAppServerAutoProbeServletTracing
HTTP Servlets configuration
Full: off
Typical: off
HTTPSessionTracing
HTTP Session configuration
Full: off
Typical: off

ProbeBuilder Directives overview
124 Java Agent Guide
JSPTagLibraryTracing
Processing time of custom JSP tags
Full: off
Typical: off
ManagedSocketTracing
Network configuration
Full: off
Typical: off
ThrowException
Exception configuration
Full: off
Typical: off
Generally, the default toggles PBD files should not be edited. However, you can refine the gathering of metrics by turning on or off certain tracer groups. Tracer groups can be modified in the toggles files by:
■ Turning on/off tracer groups to save on system overhead
■ Adding classes to a tracer group
Tracer groups report information only when turned on (uncommented) and are activated with the keyword TurnOn.
Note: The Java Agent 9.0 supports EJB 2.0 and 3.0 instrumentation. Turn on or off the tracer groups associated with EJB 2.0 or 3.0 to tailor your metric collection. Support for EJBs in the application triage map extends only to Session and Entity beans. Message Driven beans are not supported yet.
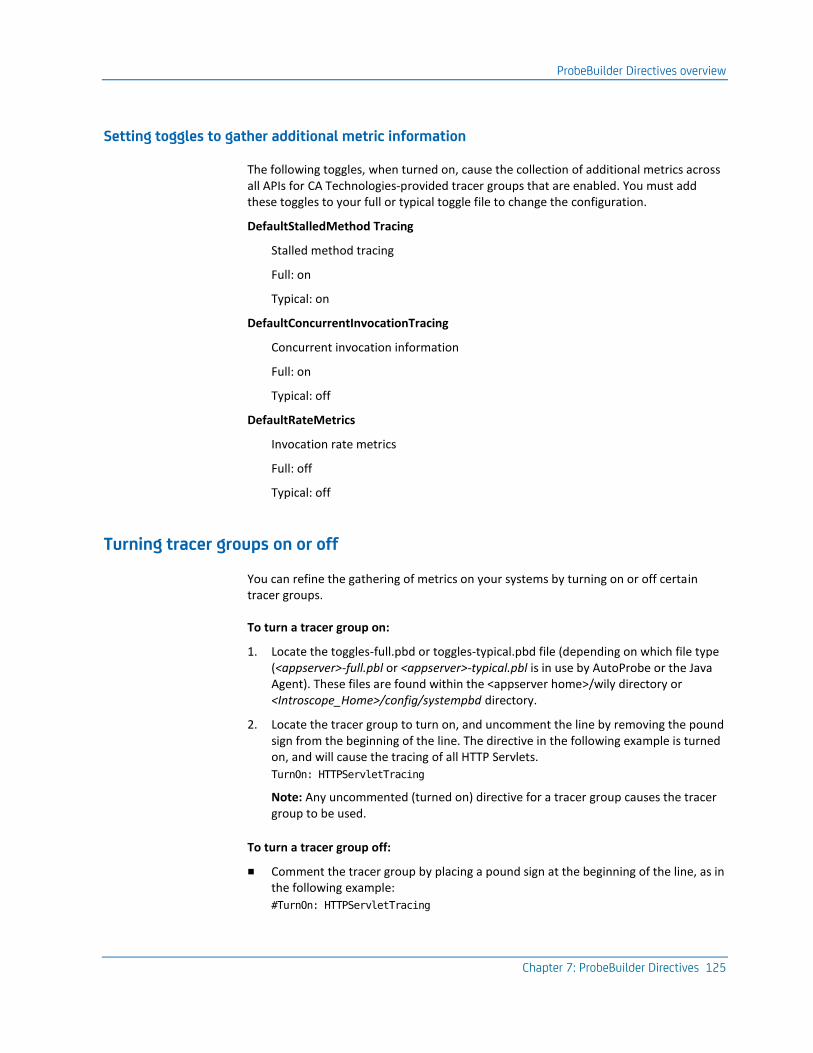
ProbeBuilder Directives overview
Chapter 7: ProbeBuilder Directives 125
Setting toggles to gather additional metric information
The following toggles, when turned on, cause the collection of additional metrics across all APIs for CA Technologies-provided tracer groups that are enabled. You must add these toggles to your full or typical toggle file to change the configuration.
DefaultStalledMethod Tracing
Stalled method tracing
Full: on
Typical: on
DefaultConcurrentInvocationTracing
Concurrent invocation information
Full: on
Typical: off
DefaultRateMetrics
Invocation rate metrics
Full: off
Typical: off
Turning tracer groups on or off
You can refine the gathering of metrics on your systems by turning on or off certain tracer groups.
To turn a tracer group on:
1. Locate the toggles-full.pbd or toggles-typical.pbd file (depending on which file type (<appserver>-full.pbl or <appserver>-typical.pbl is in use by AutoProbe or the Java Agent). These files are found within the <appserver home>/wily directory or <Introscope_Home>/config/systempbd directory.
2. Locate the tracer group to turn on, and uncomment the line by removing the pound sign from the beginning of the line. The directive in the following example is turned on, and will cause the tracing of all HTTP Servlets.
TurnOn: HTTPServletTracing
Note: Any uncommented (turned on) directive for a tracer group causes the tracer group to be used.
To turn a tracer group off:
■ Comment the tracer group by placing a pound sign at the beginning of the line, as in the following example:
#TurnOn: HTTPServletTracing

ProbeBuilder Directives overview
126 Java Agent Guide
Adding classes to a tracer group
You can turn on tracing for a particular class by adding the class to an existing tracer group. To identify a class as being part of a tracer group, use one of the Identify keywords.
For example, to add the class, com.myCo.ejbentity.myEJB1, to the tracer group, EntityBeanTracing:
IdentifyClassAs: com.myCo.ejbentity.myEJB1 EntityBeanTracing
The identify keywords are:
■ IdentifyInheritedAs
■ IdentifyClassAs
■ IdentifyCorbaAs
For a list of identify keywords, see Supplementary directives and tracers information (see page 146).
EJB subclass tracing
By default, entity and session EJB-related directives add probes only for EJBs that directly and explicitly implement the entity, session, or message-driven EJB interfaces.
Often, an application’s EJBs are subclasses of classes which directly and explicitly implement the entity or session EJB interface. These are not tracked by default by Introscope.
For EJB subclasses to be tracked by Introscope, they must be added to the appropriate tracer group. To do this, add entries that refer to the direct ancestors of the EJB subclasses to be tracked.
From these models, replace <entity.bean.ancestor.class> or <session.bean.ancestor.class> with the fully-qualified class name of the immediate ancestor of the EJBs to be instrumented.
For entity EJBs:
IdentifyInheritedAs: <entity.bean.ancestor.class> EntityBeanTracing
For session EJBs:
IdentifyInheritedAs: <session.bean.ancestor.class> SessionBeanTracing

ProbeBuilder Directives overview
Chapter 7: ProbeBuilder Directives 127
The examples below are based on this class hierarchy:
mySessionEJB implements javax.ejb.SessionBean
mySessionEJBsubclass1 extends mySessionEJB
mySessionEJBsubclass1a extends mySessionEJBsubclass1
mySessionEJBsubclass1b extends mySessionEJBsubclass1
mySessionEJBsubclass2 extends mySessionEJB
The tracer group, SessionBeanTracing, causes the tracking of mySessionEJB:
The following tracer traces mySessionEJBsubclass1 and mySessionEJBsubclass2.
IdentifyInheritedAs: mySessionEJB SessionBeanTracing
The following tracer traces mySessionEJBsubclass1a and mySessionEJBsubclass1b.
IdentifyInheritedAs: mySessionEJBsubclass1 SessionBeanTracing
Note: This example does not use packages. If your code is in a package, it needs to include the package name with the class name. See Supplementary directives and tracers information (see page 146) for more information.
EJB 3.0 annotations
The following directive allows you to group any class containing the given class-level annotation into tracer groups. This directive supports EJB 3.0. EJBs conforming to the 3.0 specifications do not explicitly implement any well-known interface, but instead are entirely enabled via annotations. To easily identify EJB 3.0 classes, use this directive:
IdentifyAnnotatedClass <annotation-name> <flag-name>
To use this directive, create a directive class and directive parser class for the new directive. You must then add a matcher class to examine your bytecode to determine if a class contains a given annotation.
Note: This directive does not support method-level annotations.
EJB 2.0 and 3.0 support for the application triage map
Introscope 9.0 supports out-of-the-box tracing of EJB 2.0 and 3.0 session and entity beans, specifically for use in the Workstation application triage map. CA Technologies recommends using this out-of-the-box functionality in test environments only, as this configuration affects the start-up time of the agent.
If deploying this functionality to your production environments, it is best that you configure EJB 2.0 and 3.0 tracers for more specific things, as the out-of-the-box functionality may be too broad.

ProbeBuilder Directives overview
128 Java Agent Guide
Use the following directive to instruct ProbeBuilder to flag a class that is inheriting from, or implementing, the superclass or interface:
IdentifyDeepInheritedAs
For EJB 2.0 application triage map support, the following directives have been added the j2ee.pbd file:
IdentifyDeepInheritedAs: javax.ejb.EJBObject EJB2StubTracing
IdentifyDeepInheritedAs: javax.ejb.SessionBean SessionBeanTracing
IdentifyDeepInheritedAs: javax.ejb.EntityBean EntityBeanTracing
IdentifyDeepInheritedAs: javax.ejb.MessageBean MessageBeanTracing
These directives allow the ProbeBuilder to identify the EJB stubs on the client side, and beans on the server side to be used in the application triage map.
For EJB 3.0 application triage map support, the following directive has been added to the j2ee.pbd file:
IdentifyInheritedAnnotatedClassAs
The directive matches all classes that implement interfaces directly, or through a super interface.
In the context of the application triage map, the following additional directive is set in j2ee.pbd:
IdentifyInheritedAnnotatedClassAs: javax.ejb.Remote EJB3StubTracing
EJB naming
Introscope 9.0 introduces a new way to name called backends, generic frontends, and monitored components that deal with EJBs. The name formatter allows you to configure a suitable name for EJB 2.0 and 3.0 client stubs and bean implementations.
Use the EjbNameFormatter classes to define an EJB-related metric name, application triage map application name, or node name using following place holders:
■ For EJB client stubs: {classname}, {interface}, and {method}
■ For EJB beans: {classname}, {bean}, {interface}, and {method}
Using the IntroscopeAgent.profile, PBLs, and PBDs together
Chapter 7: ProbeBuilder Directives 129
The out-of-the-box following metric names are used:
■ EJB Bean frontend: EJB|{interface}
■ EJB Client stub backend: EJB|{interface}
■ Application triage map owner name for EJB bean: {interface}
■ Application triage map node name for EJB Client Stub: Client {interface}
■ Application triage map node name for EJB Bean: Server {interface}
These are out-of-the-box EJB name formatters. They are used in the j2ee.pbd and appmap-ejb.pbd files. You will use the same name formatters, but different metric names. For example, you could modify existing tracer directives to use a more appropriate name, but keep the same flags:
...
# Default commented out:
#TraceComplexMethodsIfFlagged: EJB2StubTracing EJB2BackendTracer "{interface}"
#Add the EJB application name to backend marker as well as called method
TraceComplexMethodsIfFlagged: EJB2StubTracing EJB2BackendTracer
"MyCustomerBeanApp-{interface}-{method}"
...
SetTracerClassMapping: EJB2BackendTracer
com.wily.introscope.agent.trace.BackendTracer
com.wily.introscope.probebuilder.validate.ResourceNameValidator
SetTracerParameter: EJB2BackendTracer nameformatter
com.wily.introscope.agent.trace.ejb.Ejb2StubNameFormatter
Note: The EJB context tracer is set on setContext() method of EJB 2.0 beans. This is an internal Introscope tracer for the EJB 2.0 bean name formatter, which allows the name formatter to function correctly.
Using the IntroscopeAgent.profile, PBLs, and PBDs together
When the Java Agent is first installed, you set an instrumentation level, either full or typical. This setting refers to the ProbeBuilder List (PBL) files default-typical.pbl and default-full.pbl (see Default PBL files (see page 114) for more information).
Applying ProbeBuilder Directives
The way in which you apply PBDs depends on the method you choose to use. CA Technologies recommends you use JVM AutoProbe to implement your PBDs. You can also use the ProbeBuilder Wizard or the command line ProbeBuilder to implement your PBDs.
Applying ProbeBuilder Directives
130 Java Agent Guide
Using JVM AutoProbe
When you are ready to implement a PBD file, add it to the hotdeploy directory. AutoProbe looks for PBD files in the directory that contains the IntroscopeAgent.profile file (by default, this is the <Agent_Home>/wily directory), and the <Agent_Home>/wily/hotdeploy directory. AutoProbe resolves file names relative to these directories. If you have moved the location of your wily directory, be sure to map the file path to the correct directory.
To implement PBDs using AutoProbe:
1. Save modified standard PBD or PBLs to the <Agent_Home>/wily directory.
2. Copy custom PBDs into the <Agent_Home>/wily/hotdeploy directory. Any PBDs added to this directory will be implemented without having to update or modify the introscope.autoprobe.directivesFile property in the IntroscopeAgent.profile.
Note: If you have enabled dynamic instrumentation, the PBDs in the hotdeploy directory are picked up live from the folder—no reboot is required. For more information about dynamic instrumentation, see Dynamic ProbeBuilding (see page 68).
3. Save the IntroscopeAgent.profile.
4. Restart the application.
Using the ProbeBuilder Wizard or command-line ProbeBuilder
When you are ready to implement a PBD file, add it to the hotdeploy directory. The Command-line ProbeBuilder looks for any custom directive files in the same directory where ProbeBuilder is run from, and the <Agent_Home>/wily/hotdeploy directory. The Command-line ProbeBuilder resolves file names relative to these directories.
The steps to implement ProbeBuilder Directives using the ProbeBuilder Wizard or command-line ProbeBuilder are the same as using JVM AutoProbe. See Using JVM AutoProbe (see page 130) for more information.
Instrumenting with new and changed PBDs
For new or changed directives to take effect, your applications must be instrumented using the latest PBDs. This process varies depending on the ProbeBuilding method you use.

Applying ProbeBuilder Directives
Chapter 7: ProbeBuilder Directives 131
JVM 1.5 systems using JVM AutoProbe via -javaagent
You can configure dynamic instrumentation, allowing changed PBDs to take effect without application or Java Agent restart. This enables you to perform PBD corrections, or perform triage-driven instrumentation without interrupting application service. For more information see Dynamic ProbeBuilding (see page 68).
Pre-JVM 1.5 systems or installations using –Xbootclasspath
New and changed ProbeBuilder Directive files or ProbeBuilder List files take effect the next time the application server loads the application classes.
If your managed applications are not running when you add or change directives, when you next start the applications, they will be instrumented using the updated directives.
If your managed applications are running, it is necessary to load, or reload, the managed application classes.
How you cause the classes to reload depends upon the application server you use. For instance, on SAP NetWeaver 6.40, a redeploy is sufficient. Most application servers require a restart.
Using the ProbeBuilder Wizard
To use the ProbeBuilder Wizard:
1. The Custom Directives screen will list the PBD files you placed in the hotdeploy directory described in Using the ProbeBuilder Wizard or command-line ProbeBuilder (see page 130).
2. Select the custom directives files to use. For more information on running ProbeBuilder Wizard, see Using the ProbeBuilder wizard (see page 356).
Using the command-line ProbeBuilder
Important: CA Technologies recommends using the command-line ProbeBuilder as your last option for Introscope-enabling your latest PBDs.
To use the command-line ProbeBuilder:
1. Stop your managed application.
2. Run the command-line ProbeBuilder or the ProbeBuilder Wizard, supplying the custom PBD and PBL files in the command line. For more information on the command-line ProbeBuilder, see Using the command-line ProbeBuilder (see page 358).
3. Configure the application to use the new files.
4. Start the managed application.
5. If they are not already running, start the Enterprise Manager and the Workstation.
Creating custom tracers
132 Java Agent Guide
Creating custom tracers
You can further refine your metric collection by creating custom PBD files. Creating custom directives, by creating tracers to track application specific measurements, require the use of specific syntax and keywords. To write custom tracers, you must define:
■ The directive type (indicating generically how many class(es) or method(s) to trace)
■ The specific class(es) or method(s) to trace
■ The type of information to trace in the class(es) or method(s) (for example, a time, a rate, or a count)
■ The fully-qualified metric name (including the resource path) under which to present this information
Custom PBDs are stored in the <Agent_Home>/wily/hotdeploy directory. Any PBDs added to this directory will be implemented without having to update or modify the introscope.autoprobe.directivesFile property in the IntroscopeAgent.profile. If you have enabled dynamic instrumentation, the PBDs in the hotdeploy directory are picked up live from the folder — no reboot is required. For more information about dynamic instrumentation, see Dynamic ProbeBuilding (see page 68).
Once a custom PBD is created, Introscope treats it as if it is an out-of-the-box PBD. You can set alerts on the metrics created, save them to SmartStor, or use them in the creation of custom dashboards in the Introscope Workstation.
Note: Be sure to choose methods to trace carefully, as more methods traced means more overhead.
Using a custom BlamePointTracer tracer for common metrics
A BlamePointTracer is the most commonly used tracer. This tracer generates five separate metrics for associated methods or classes:
■ Average Response Time (ms)
■ Concurrent Invocations
■ Errors Per Interval
■ Responses Per Interval
■ Stall Count

Creating custom tracers
Chapter 7: ProbeBuilder Directives 133
The following is an example of a BlamePointTracer. A BlamePointTracer has been set for a method called search in class petshop.catalog.Catalog. PetShop|Catalog|search is the name of the node under which the BlamePoint metrics will be displayed in the Introscope Investigator.
TraceOneMethodOfClass: petshop.catalog.Catalog search BlamePointTracer
"PetShop|Catalog|search"
Directive names and arguments used in tracer syntax
In addition to simple keywords that associate tracers into groups or enable/disable groups, PBD files contain tracer definitions. For Introscope to recognize and process your tracers, you must use a specific syntax when constructing custom tracers. A tracer is composed of a directive and information about the method or class to trace, in the following format:
<directive>: [arguments]
where [arguments] is a list, and is directive-specific. Arguments used in trace directives include <Tracer-Group>, <class>, <method>, <Tracer-name>, and <metric-name>.
Note: Depending on the directive used, only a subset of these parameters are required.

Creating custom tracers
134 Java Agent Guide
<directive>
There are six main directives available for custom tracing:
■ TraceOneMethodOfClass—traces a specified method in the specified class.
■ TraceAllMethodsOfClass—traces all methods in the specified class.
■ TraceOneMethodIfInherits—traces one method in all direct subclasses or direct interface implementations of the specified class or interface.
■ TraceAllMethodsIfInherits—traces all methods in all direct subclasses or direct interface implementations of the specified class or interface.
■ TraceOneMethodIfFlagged—traces one method if the specified class is included in a tracer group that has been enabled with the TurnOn keyword.
■ TraceAllMethodsIfFlagged—traces all methods if the specified class is included in a tracer group that has been enabled with the TurnOn keyword.
Note: Only concrete, implemented methods can be traced and report metric data while running. An abstract method specified in a custom tracer results in no metric data being reported.
<Tracer-Group>
The group to which the tracer is associated.
<class>
A fully qualified class or interface name to trace. Fully qualified classes include the full assembly name of the class as well as the name, for example:
[MyAssembly]com.mycompany.myassembly.MyClass
The assembly name must be enclosed in [] brackets.
<method>
The method name (e.g. MyMethod)
OR
the full method signature with return type and parameters (for example, myMethod;[mscorlib]System.Void([mscorlib] System.Int32). For more information on method signatures, see Signature differentiation (see page 138).)
<Tracer-name>
Specifies the tracer type to be used. For example, BlamePointTracer. See the Tracer name table below for descriptions of tracer names.
<metric-name>
Controls how the collected data is displayed in the Introscope Workstation.
The following examples describe three ways to specify the name and location of a metric at different levels of the metrics tree.
metric-name—the metric appears immediately inside the agent node.

Creating custom tracers
Chapter 7: ProbeBuilder Directives 135
resource:metric-name—the metric appears inside one resource (folder) below the agent node.
resource|sub-resource|sub-sub-resource:metric-name—the metric appears more than one resource (folder) level deep below the agent node. Use pipe characters (|) to separate the resources.
Commonly used tracer names and examples
The following list describes the most commonly used tracer names and what they trace.
BlamePointTracer
Provides a standard set of metrics including average response time, per interval counts, concurrency, stalls, and errors for a blamed component.
ConcurrentInvocationCounter
Reports the number of times a method has started but not yet finished. The result is reported under the metric name specified in the tracer, <metric-name>, in the Investigator tree. An example use of this tracer would be counting the number of simultaneous database queries.
DumpStackTraceTracer
Dumps a stack trace to the instrumented application's standard error for methods to which it is applied. The exception stack trace thrown by the Dump Stack Tracer is not a true exception—it is a mechanism for printing the method stack trace.
This feature is useful for determining callpaths to a method.
Warning: This feature imposes heavy system overhead. It is strongly recommended that this tracer only be used in a diagnostic context where a sharp increase in overhead is acceptable.
MethodCPUTimer
Average CPU time (in milliseconds) used during method execution and reports it under <metricname> in the metrics tree.
Note: This tracer requires a platform monitor on the supported platform - either AIX 5.2 or RedHat Enterprise Linux 3.0.
MethodTimer
Average method execution time in milliseconds and reports it under the metric name specified in the tracer, <metric-name>, in the metrics tree.
PerIntervalCounter
Number of invocations per interval. This interval will change based on the view period of the consumer of the data (for example, the View pane in the Investigator). It is reported under the metric name specified in the tracer, <metric-name>, in the Investigator tree.

Creating custom tracers
136 Java Agent Guide
Using quotes in custom tracer definitions
Custom tracers can contain metric names with spaces in them. When using spaces in your custom metric names, CA Technologies recommends putting quotes ("") around all metric names.
Important: Do not place quotes around class names. This causes the custom tracers to malfunction. For example:
Correct
IdentifyClassAs: MyClass MyTracers
Incorrect
IdentifyClassAs: "MyClass" MyTracers
If you create a metric name that contains a class name, you must use quotes around the whole metric name. Metric names are allowed to have spaces, and all spaces in metric names must be contained within quotes. For example, the metric name "{classname}|Test One Node" should be represented as follows:
Correct
TraceOneMethodIfFlagged: MyTracers AMethod BlamePointTracer "{classname}|Test One
Node"
Incorrect
TraceOneMethodIfFlagged: MyTracers AMethod BlamePointTracer {classname}|Test One
Node
Warning: Introscope will not monitor classes having invalid class file names. For example, in the class file name:
org/jboss/seam/example/seambay/AuctionImage$JaxbAccessorM_getData_setData_[B:
the _[B: cause the class file name to be invalid. You cannot use an open square brackets ([) as part of the Java class file name. When Introscope encounters such classes having invalid class names, it fails to instrument them and reports them as an error message in the agent logs.
The following sections are examples of method tracers. In the following example, quotes ("") are used around the metric names. CA Technologies highly recommends putting quotes around all metric names when you create custom metric names.
Average tracer example
This tracer tracks the average execution time of the given method in milliseconds.
TraceOneMethodOfClass: com.sun.petstore.catalog.Catalog search BlamedMethodTimer
"Petstore|Catalog|search:Average Method Invocation Time (ms)"

Creating custom tracers
Chapter 7: ProbeBuilder Directives 137
Rate tracer example
This tracer counts the number of times the method is called per second, and reports this rate under the specified metric name.
TraceOneMethodOfClass: com.sun.petstore.catalog.Catalog search
BlamedMethodRateTracer "Petstore|Catalog|search:Method Invocations Per Second"
Per interval counter tracer example
This method tracer counts the number of times the method is called per interval, and reports the per interval count under the specified metric name.
TraceOneMethodOfClass: com.sun.petstore.catalog.Catalog search PerIntervalCounter
"Petstore|Catalog|search:Method Invocations Per Interval"
The interval is determined by the monitoring logic in the Enterprise Manager, such as the Graph frequency.
The preview pane in the Investigator defaults to 15 second intervals.
Counter tracer example
This tracer counts the total number of times the method is called.
TraceOneMethodOfClass: com.sun.petstore.cart.ShoppingCart placeOrder
BlamedMethodTraceIncrementor "Petstore|ShoppingCart|placeOrder:Total Order Count"
Combined counter tracers example
These tracers combine incrementor and decrementor Tracers to keep a running count.
TraceOneMethodOfClass: com.sun.petstore.account.LoginEJB login
MethodTraceIncrementor "Petstore|Account:Logged In Users"
TraceOneMethodOfClass: com.sun.petstore.account.LogoutEJB logout
MethodTraceDecrementor "Petstore|Account:Logged In Users"
Advanced single-metric tracers
Directives and tracers track methods, classes, and sets of classes. A single-metric tracer reports a specific metric for a specific method, which is the smallest unit that Introscope can track. Single-metric tracers can be created in several ways: through the method signature, by substituting keywords, or by manipulating the metric name parameters.

Creating custom tracers
138 Java Agent Guide
Signature differentiation
Tracers can be applied to a method based on the method signature.
To trace a single instance of a method with a specific signature, append the signature to the method name (including return type) specified using the internal method descriptor format.
For example, myMethod(Ljava/lang/String;)V traces the instance of the method with a string argument and void return type.
For complete information about this format, see the Sun Java Virtual Machine Specification.
Metric name keyword-based substitution
Keyword-based substitution allows runtime substitution of values into the metric name.
The parameters in the metric name in the tracer are substituted at runtime for the actual values into the metric name. This feature can be used with any directive.
{method}
Name of the method being traced
{classname}
Runtime class name of the class being traced
{packagename}
Runtime package name of the class being traced
{packageandclassname}
Runtime package and class name of the class being traced
Note: If Introscope processes a class which does not have a package, it will replace {packagename} with the string "<Unnamed Package>".
Keyword-based substitution: Example 1
If the metric name for a tracer in the pbd file is:
"{packagename}|{classname}|{method}:Response Time (ms)"
and the tracer is applied to method myMethod with a runtime class of myClass that is in package myPackage, the resulting metric name would be:
"myPackage|myClass|myMethod:Response Time (ms)"
Creating custom tracers
Chapter 7: ProbeBuilder Directives 139
Keyword-based substitution: Example 2
If a tracer with a metric name in the .pbd file of
"{packageandclassname}|{method}:Response Time (ms)"
was applied to the same method, the resulting metric name would be
"myPackage.myClass|myMethod:Response Time(ms)"
Note the . between the package and class instead of the | in the first example.
Metric-name-based parameters
You can create a single-method tracer that creates a metric name based on parameters passed to a method using the TraceOneMethodWithParametersOfClass keyword, using this format:
TraceOneMethodWithParametersOfClass: <class-name> <method> <tracer-name> <metric-name>
Parameters can be used in the metric name. This is accomplished by substituting the value of parameters for placeholder strings in the metric name. The placeholder strings to use are "{#}" where # is the index of the parameter to substitute. The indices start counting at zero. Any number of parameter substitutions can be used in any order. All parameters are converted to strings before substitution into the metric name. Object parameters other than strings should be used with caution because they are converted using the toString() method.
Warning: If you are unclear about what string the parameter will be converted to, do not use it in the metric name.
Creating custom tracers
140 Java Agent Guide
Metric-name-based example
A Web site uses a class named order, with a method named process. The method has parameters for different kinds of orders, either book or music.
You can create a tracer like this:
TraceOneMethodWithParametersOfClass: order process(LJava/lang/string;)V
MethodTimer "Order|{0}Order:Average Response Time (ms)"
This tracer produces metrics like these:
Order
BookOrder
■ Average Response Time (ms)
MusicOrder
■ Average Response Time (ms)
You can also use the TraceOneMethodWithParametersIfInherits keyword. For more information on both keywords, see Supplementary directives and tracers information (see page 146).
Skip directives
Certain packages, classes, or methods can be skipped by AutoProbe or ProbeBuilder by using skip directives. By default, the Java Agent and fundamental Java classes and packages are skipped by AutoProbe or ProbeBuilder. For more information, see Supplementary directives and tracers information (see page 146).
For a complete list of skip directives used with the Java Agent, see the Directive & Tracer Type Definitions guide. See Supplementary directives and tracers information (see page 146) for more information about this guide.

Creating custom tracers
Chapter 7: ProbeBuilder Directives 141
Counting object instances
The InstanceCounts tracer group counts the number of instances of the particular object types associated with it (for information on associating object types with the InstanceCounts tracer group using the standard IdentifyClassAs and IdentifyInheritedAs directives, see Adding classes to a tracer group (see page 126)). Any instances explicitly allocated in your code will be counted. Subtypes will also be counted. Objects created through different mechanisms, such as deserialization or cloning, might not be counted. Tracing using this tracer group could potentially incur incremental performance (and memory) impact, depending entirely on the number of instances counted.
Note: CA Technologies testing has shown that in practice, the number of instances has to be quite large for an impact to be noticeable.
Turning on InstrumentPoint directives
There are two types of directives identified by the keyword, InstrumentPoint: those that trace exceptions, and one that causes agent initialization when the application starts up (instead of when the first Probe is run).
Exceptions
The following directives are used to turn on tracing of exceptions either where thrown or caught. They can cause performance degradation so they are not turned on by default. To turn either of these on, uncomment the appropriate line:
#InstrumentPoint: ThrowException
#InstrumentPoint: CatchException
Agent initialization
The agent initialization instrument point directive does not cause additional overhead and is turned on by default in both full and typical PBD sets.
InstrumentPoint: AgentInitialization
If multiple ProbeBuilder Directive files are used, any settings (such as tracer groups, Skips, InstrumentPoints, Custom Method Tracers) turned on in any file take effect.

Creating custom tracers
142 Java Agent Guide
Combining custom tracers
You can use multiple tracers that affect the same metric, in effect combining them. This is most commonly used with incrementors and decrementors.
This example creates a metric named Total Purchases. With a class cart and methods buyBook and buyCD, create the following tracers:
TraceOneMethodOfClass cart buyBook PerIntervalCounter "Total Purchases"
TraceOneMethodOfClass cart buyCD PerIntervalCounter "Total Purchases"
This increments the metric Total Purchases when someone buys a piece of merchandise.
Instrumenting and inheritance
Introscope does not automatically instrument classes in the deeper levels of a class hierarchy in pre-1.5 JVMs.
When subclasses of a probed class more than one level deep are loaded, the new and overridden methods are not automatically instrumented. Likewise, classes that do not explicitly name a probed interface as being implemented, even though they implement the interface indirectly, will not be instrumented either.
For example, assume a class hierarchy in which ClassB extends ClassA, and ClassC extends ClassB, like so:
Interface/ClassA
ClassB
ClassC
When you instrument ClassA, ClassB is also instrumented because it explicitly extends ClassA. However, Introscope does not instrument ClassC because ClassC does not explicitly extend ClassA. To instrument ClassC you must explicitly identify ClassC.
In pre-1.5 Java environments, to ensure that subclasses are instrumented, follow the instructions in EJB subclass tracing (see page 126).
If you run under JVM 1.5, you can configure Introscope to instrument multiple levels of subclasses of a probed class. For instructions, see ProbeBuilding class hierarchies (JVM 1.5). (see page 72)
If you wish to instrument a private method, you may need to use more specific tracers. For more information about directives and tracers for custom PBDs, please see the Directive & Tracer Type Definitions document on the CA Wily community site.
Using Blame Tracers to mark blame points
Chapter 7: ProbeBuilder Directives 143
Java 1.5 annotations
Introscope 8.0 and higher allows the use of Java 1.6 annotations introduced in Java 1.5 when creating custom metrics. For more information on Java annotations, see the following articles:
■ http://java.sun.com/docs/books/tutorial/java/javaOO/annotations.html
■ http://www.developer.com/java/other/article.php/3556176
Use IdentifyAnnotatedClassAs to place the class in a tracer group, then use TraceAllMethodsIfFlagged directives to instrument the methods in the class. For example:
SetFlag: AnnotationTracing TurnOn: AnnotationTracing
IdentifyAnnotatedClassAs: com.test.MyAnnotation AnnotationTracing
TraceAllMethodsIfFlagged: AnnotationTracing BlamePointTracer
"Target|MyTarget|{classname}"
In the example, com.test.MyAnnotation is the annotation name. When creating your own annotations, use a term in your code. Classes containing the annotation name are identified.
Using Blame Tracers to mark blame points
Introscope’s Blame Technology works in a managed Java application to enable you to view metrics at the application tiers: the frontends and backends of your application. This capability, referred to as boundary blame, allows users to triage problems to an application frontend or backend. This information is also used in the Workstation application triage map to mark the edges of your applications.
For information about how Introscope determines frontends and backends, and about options for configuring URL Groups to control how metrics for frontends are aggregated, see Configuring Boundary Blame (see page 195).
The following sections describe how you can use tracers to explicitly mark the frontends and backends in your application.
Blame Tracers
Introscope provides tracers for capturing front and backend metrics: FrontendMarker and BackendMarker. These tracers explicitly mark a frontend and backend, respectively.
You can use FrontendMarker and BackendMarker to instrument your own code, for instance code that accesses a backend, to cause Introscope to capture and present metrics for custom components in the Investigator tree.

Using Blame Tracers to mark blame points
144 Java Agent Guide
If no components are instrumented with the FrontendMarker tracer (or its subclasses HttpServletTracer and PageInfoTracer), no frontend metrics are generated and no component will be marked as a frontend for transactions.
When more than one component within a transaction is instrumented with the FrontendMarker tracer (or its subclasses), only the first designated component will generate Frontend metrics.
Note: When using frontend tracers, the name of the application given in the frontend tracer must match the name given for the application triage map tracers, keeping in mind that both are case-sensitive. For example, if you name the frontend tracer AppOne and the application triage map tracer refers to this tracer as APPONE, information about AppOne will not be displayed correctly in the Workstation application triage map.
To prevent specific classes from being marked as frontend, the PBD parameter is.frontend.unless can be specified. For information on the PBD directive is.frontend.unless, see the Custom FrontendMarker directive (see page 145).
If no BackendMarker is configured, Introscope will infer a backend—any component that opens a client socket will be a default backend if none is explicitly marked.
It is useful to use BackendMarker:
■ to assign a desired name to an item that Introscope detects as a backend.
■ to mark custom Java sockets that Introscope does not instrument.
■ for native sockets that are called through the Java Native Interface (JNI), to identify a Java/JNI bridging method as the backend.
FrontendMarker and BackendMarker are instances of BlamePointTracer which provides metrics such as average response time, per interval counts, concurrency, stalls, and errors for a blamed component. A BlamePointTracer can be applied to middle components for a more granular Blame Stack.
High agent CPU overhead from deep nested frontend transactions
Servlets are configured by Introscope to be seen as frontends. A typical transaction starts with a servlet, which may call an EJB, which calls a back-end. It’s possible for servlets to call other servlets in a nested way, which Introscope sees as nested frontends. In most cases, this does not add to agent CPU overhead.
However, deep transactions having nested frontend levels (for example 40 levels deep) may result in high CPU overhead. For example, if a servlet repeatedly calls itself in a transaction (continuous recurring calls) or calls multiple other servlets, you may see an increase in agent CPU overhead. If the overhead is unacceptable, contact CA Support.

Using Blame Tracers to mark blame points
Chapter 7: ProbeBuilder Directives 145
Custom FrontendMarker directive
Introscope 9.0 introduces the PBD parameter is.frontend.unless. This parameter enables some classes instrumented by the FrontendMarker (or its subclasses, such as HttpServletTracer) to not be marked as a frontend component. The parameter should be set as a comma-separated list of absolute class names. This may be useful when the initial component is a generic 'dispatcher' which forwards the request to a more specific component designed to handle the type of request received. The second component would therefore be a better frontend marker. The default is an empty list. PBD parameters are not dynamic, so a restart of the instrumented application server is required if the value of this parameter is changed.
Important: Class names should only be separated by a comma, not spaces. Use of spaces will invalidate the SetTracerParameter directive.
Any classes designated in the parameter list that are instrumented by the tracer to which this parameter is applied will not be designated as frontends and will not generate metrics under the Frontends node in the Introscope Investigator.
For example, to prevent the classes NotAFrontend and AnotherNonFrontend from being treated as frontends in the package com.ABCCorp, that are instrumented with a FrontendMarker named MyFrontendTracer, you would use the following PDB directive:
SetTracerParameter: MyFrontendTracer is.frontend.unless
com.ABCCorp.NotAFrontend,com.ABCCorp.AnotherNonFrontend
Blame Tracers in standard PBDs
Two of the standard PBDs provided with Introscope, j2ee.pbd and sqlagent.pbd, implement Boundary Blame Tracing.
■ HttpServletTracer in j2ee.pbd is an instance of FrontendMarker.
■ SQLBackendTracer in sqlagent.pbd is an instance of BackendMarker.
The following Blame Tracers used in previous versions of Introscope still exist, but are not typically used in Introscope PBDs:
■ BlamedMethodTimer
■ BlamedMethodRateTracer
■ BlamedMethodTraceIncrementor
■ BlamedMethodTraceDecrementor

Supplementary directives and tracers information
146 Java Agent Guide
Boundary Blame and Oracle backends
In the current version of Introscope, Oracle databases are not detected based on the socket connection—SQL Agent must be available for Introscope to automatically detect Oracle backends.
To enable Introscope to detect Oracle backends in the absence of SQL Agent, make the following modification to oraclejdbc.pbd:
In this portion of oraclejdbc.pbd:
#Socket data from the Oracle driver reports too many metrics SkipPackagePrefixForFlag: oracle.jdbc. SocketTracing SkipPackagePrefixForFlag: oracle.net. SocketTracing
comment out the skips, as shown below:
#Socket data from the Oracle driver reports too many metrics #SkipPackagePrefixForFlag: oracle.jdbc. SocketTracing #SkipPackagePrefixForFlag: oracle.net. SocketTracing
For more information, see Disabling Database Name Formatting in 7.1 (KB 1240).
Supplementary directives and tracers information
For a complete list of the tracers and directives used with the Introscope Java Agent, see the Directive & Tracer Type Definitions Guide (https://community.wilytech.com/entry!default.jspa?categoryID=414&externalID=1927), available on the CA Wily Community site.
To access the CA Wily Community site, you first need to register for an account using your corporate email address.
Once you have completed the account information, CA Technologies will contact you within 3-5 business days to confirm your registration. If you do not register with a corporate email address, your request for access will be denied.

Chapter 8: Java Agent Naming 147
Chapter 8: Java Agent Naming
This section has information about agent naming, related environmental and deployment considerations, and options for automatically naming your agents.
This section contains the following topics:
Understanding the Java Agent name (see page 147) Agent naming considerations for clustered applications (see page 150) Specifying an agent name using a Java system property (see page 150) Specifying an agent name using a system property key (see page 151) Obtaining an agent name from the application server (see page 151) Automatic agent naming (see page 152) Enabling cloned agent naming in clustered environments (see page 155) Application triage map and the agent name (see page 156)
Understanding the Java Agent name
Each Java Agent running in your Introscope environment has a name, whether you assigned one explicitly, configured a method of automatically assigning a name, or simply started an instrumented application that the Java Agent monitors. The -Java Agent name is central to many views in the Introscope Workstation and Investigator, and it is key to the process of associating monitoring logic with target applications.
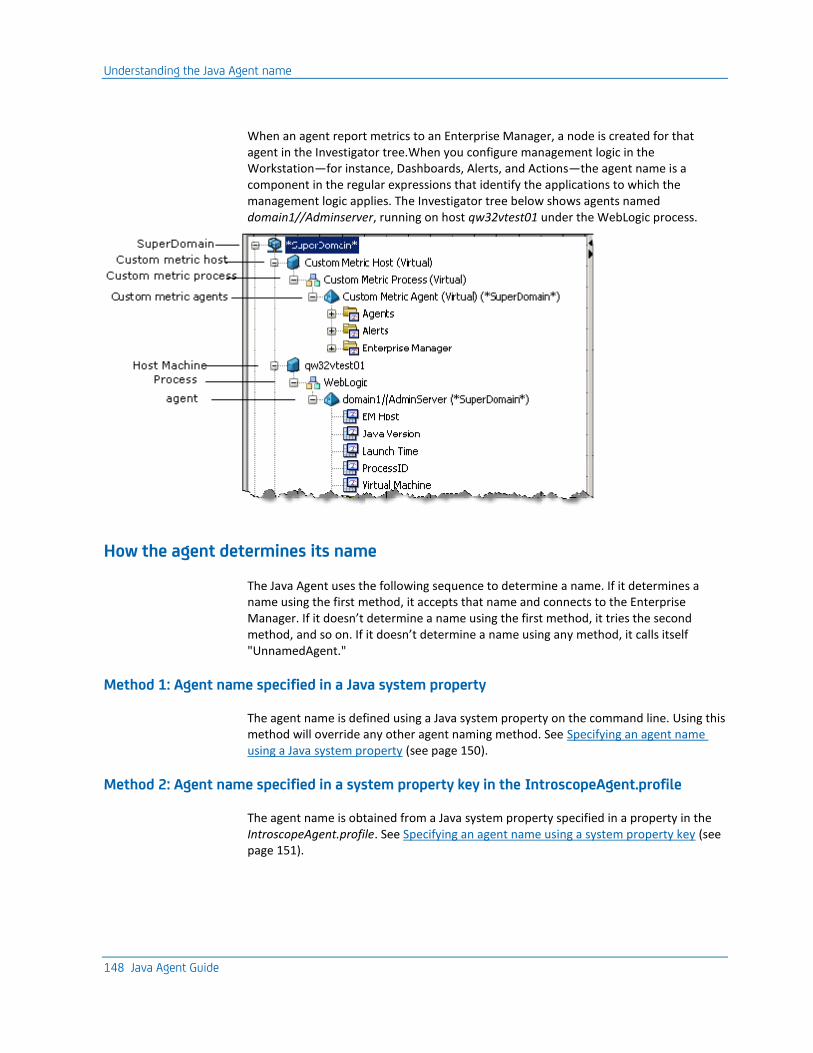
Understanding the Java Agent name
148 Java Agent Guide
When an agent report metrics to an Enterprise Manager, a node is created for that agent in the Investigator tree.When you configure management logic in the Workstation—for instance, Dashboards, Alerts, and Actions—the agent name is a component in the regular expressions that identify the applications to which the management logic applies. The Investigator tree below shows agents named domain1//Adminserver, running on host qw32vtest01 under the WebLogic process.
How the agent determines its name
The Java Agent uses the following sequence to determine a name. If it determines a name using the first method, it accepts that name and connects to the Enterprise Manager. If it doesn’t determine a name using the first method, it tries the second method, and so on. If it doesn’t determine a name using any method, it calls itself "UnnamedAgent."
Method 1: Agent name specified in a Java system property
The agent name is defined using a Java system property on the command line. Using this method will override any other agent naming method. See Specifying an agent name using a Java system property (see page 150).
Method 2: Agent name specified in a system property key in the IntroscopeAgent.profile
The agent name is obtained from a Java system property specified in a property in the IntroscopeAgent.profile. See Specifying an agent name using a system property key (see page 151).
Understanding the Java Agent name
Chapter 8: Java Agent Naming 149
Method 3: Agent name obtained automatically from the application server
If you use certain versions of WebLogic or WebSphere, the agent name can be automatically obtained from the application server using automatic agent naming functionality. You can configure a time delay, to give the agent as much time as necessary to determine its name before connecting to the Enterprise Manager. See Obtaining an agent name from the application server (see page 151).
Method 4: Agent name specified explicitly in the agent profile
The agent name is defined in the IntroscopeAgent.profile, in the property introscope.agent.agentName. This was the standard method for naming agents in early Introscope versions. Use this option if you already have an agent profile for every application.
Method 5: Agent name determined to be "Unknown agent"
If the agent is unable to determine a name using one of the methods listed above, then the agent names itself "UnnamedAgent".
How Introscope resolves agent naming conflicts
The fully qualified agent name—comprised of host name, process name and agent name—is typically unique to each agent in an Introscope environment. Agents with the same agent name usually have a unique fully-qualified agent name because their host name and process names are likely to be different. Multiple agents will have the same fully-qualified agent name only if they reside on the same host, monitor the same process, and have the same agent name.
If an agent tries to connect to an Enterprise Manager to which an agent with the same fully-qualified agent name is already connected, the Enterprise Manager appends a unique identifier to the name of the newly connecting agent. The identifier consists of a percent (%) character and a digit. This mechanism ensures that multiple agents that connect using the same fully-qualified name can be uniquely identified for the duration of the connection. The Enterprise Manager renames the first duplicate agent to connect by appending "%1" to its agent name.
For instance, assume that two agents with the fully qualified agent name:
hostPA|processNIM|PodAgent
connect to the Enterprise Manager, one after the other. The Enterprise Manager renames the second agent:
PodAgent%1
If other agents with the same fully qualified name connect, they are renamed, in succession, PodAgent%2, PodAgent%3, PodAgent%4, and so on, where the digit following the percent character is the next number in sequence.
Agent naming considerations for clustered applications
150 Java Agent Guide
When a renamed agent disconnects, the suffix it was assigned can be re-used. For example, if PodAgent%1 disconnects while PodAgent remains connected, the next agent with the fully qualified name hostPA|processNIM|PodAgent to connect will be renamed PodAgent%1.
Reuse of the suffix identifier makes it possible that the Enterprise Manager might assign the same suffix to a particular agent’s name from connection to connection. However, on subsequent connections, a given agent could just as well be renamed differently. Having an agent’s name vary from connection to connection is problematic when querying historical data—it is preferable to configure a naming strategy that avoids the Enterprise Manager renaming agents.
Agent naming considerations for clustered applications
If you run multiple instances of the same application, Introscope attempts to resolve identical agent names, including custom metric agents, by appending the agent name with a character and a random number. CA Technologies recommends, however, that you tell Introscope how to resolve the naming.
The options for resolving identical agent naming are:
■ Tell Introscope that the agents in question are cloned agents by enabling cloned agent naming (described in Enabling cloned agent naming in clustered environments (see page 155).)
■ Define unique agent names yourself and make separate agent profiles for each agent (described in Configuring unique names for application instances (see page 155).)
■ Let Introscope uniquely name each agent using its own naming scheme (described in How Introscope resolves agent naming conflicts (see page 149).)
Specifying an agent name using a Java system property
To specify an agent name using Java system property:
■ On the Java command line, supply the desired name using this property:
-Dcom.wily.introscope.agent.agentName=

Specifying an agent name using a system property key
Chapter 8: Java Agent Naming 151
Specifying an agent name using a system property key
This method is the second the agent uses to look for its name. Use this method if you want the agent to be named from the value of an existing Java system property in your deployment.
To specify an agent name using the System Property Key:
1. Open the IntroscopeAgent.profile.
2. Under the Agent Name section, specify the Java system property that will provide the agent name in this property:
introscope.agent.agentNameSystemPropertyKey
Note: If the Java system property specified here doesn’t exist, this property will be ignored.
3. Restart the application server.
Obtaining an agent name from the application server
You can configure the agent to extract the application server instance name automatically from the application server, and use that information to name itself. This eliminates the need to configure individual agent names in a separate agent profile file. The agent can also rename itself if there are changes in the application server environment. This enables you to deploy an agent profile across a large number of environments that might consist of a mix of application server platforms.
Application servers that support agent naming
Automatic agent Naming is supported when you use Introscope with these supported application server versions:
■ WebLogic 9.x
■ WebSphere 6.1.x distributed
■ WebLogic 10.0
■ WebSphere 7.0.x distributed
■ WebLogic 10.3
■ Jboss 4.0.x
■ Jboss4.2x

Automatic agent naming
152 Java Agent Guide
The name of the application server displayed in the Introscope Workstation is determined by a Java J2EE API. This sometimes causes the name of the application servers to display differently in the Workstation because all application servers implement the API differently. The names of multiple application servers may be formatted differently in the Workstation, and even the same application server name may be formatted differently from release to release.
Automatic agent naming
When automatic agent naming is enabled, the agent starts and looks for name information from the application server. The agent waits until an agent name is obtained before attempting to connect to the Enterprise Manager.
When the agent locates naming information, Introscope edits the information to make the agent name compliant with Introscope agent naming rules.
Agent names on supported application servers are comprised of several pieces of information, which differ according to application server.
■ For WebLogic, the agent name is comprised of:
Domain (data center) + cluster + instance (of WLS)
■ For WebSphere, the agent name is comprised of:
cell (domain) + process (instance of WAS)
When information is obtained, segments are separated by forward slashes—for example:
medrec/MyCluster/MedRecServer
Any forward slashes in the segment name are converted to underscores. For example, if a Domain is named Petstore/West, it will be converted to Petstore_West.
Note: When constructing the agent name that appears in Introscope, Introscope edits the information to make the agent name compliant with the following Introscope agent naming rules:
■ characters such as pipes, colons, or percentage signs are replaced by underscores
■ names that begin with any character other than a letter will have the letter "A" prepended to them
■ empty names are replaced by "UnnamedAgent" (so as to be distinguishable from the "UnknownAgent" condition)

Automatic agent naming
Chapter 8: Java Agent Naming 153
To enable automatic agent naming:
1. In the IntroscopeAgent.profile, set introscope.agent.agentAutoNamingEnabled to true.
2. Make these application server-specific changes:
■ For WebLogic, create an Introscope Startup Class. See Configuring a startup class for WebLogic 9.0 or higher (see page 78).
■ For WebSphere, create an Introscope Custom Service. See Configuring a custom service in WebSphere 6.1 (see page 92).
■ For JBoss, create an XML file. See Configuring JBoss (see page 105).
Automatic agent naming and renamed agents
Using automatic agent naming, the agent always tries to obtain the most current application-server-specific agent name. The agent periodically checks for a new name.
If a change to the application server configuration results in an agent name change, the agent automatically renames itself. In the Investigator tree, the agent appears to disconnect. The disconnected agent remains in the Investigator tree, and unmounts automatically after the unmount time period has elapsed, or can be unmounted manually.
The renamed agent reconnects to the Enterprise Manager and appears in the Investigator tree. The agent logs these changes.
See Advanced automatic agent naming options (see page 153), for information on configuring automatic agent naming properties for Enterprise Manager connection delay, and rename checking interval time.
Advanced automatic agent naming options
There are several properties you can change to control automatic agent naming for your environment.

Automatic agent naming
154 Java Agent Guide
Initial Enterprise Manager Connection Delay
When using the automatic agent naming feature, the agent waits up to a configurable amount of time before connecting to the Enterprise Manager while trying to find agent name information. The default delay is 120 seconds.
To change the delay value:
1. Open the IntroscopeAgent.profile.
2. Under the Agent Name section, configure the desired delay in the property introscope.agent.agentAutoNamingMaximumConnectionDelayInSeconds.
3. Restart the application server.
Agent Rename Check Interval
When using the automatic agent naming feature, the agent periodically checks to see if the naming information from the application server has changed. The default interval is ten minutes.
To change this interval:
1. Open the IntroscopeAgent.profile.
2. Under the Agent Name section, configure the desired interval in the introscope.agent.agentAutoRenamingIntervalInMinutes property.
3. Restart the application server.
Turning Off Agent Log File Automatic Naming
By default, when the agent name is found automatically, either by information provided by a Java system property or application server, the log files associated with that agent are named automatically using that same information. However, you can turn off this automatic log naming, and continue to use the agent log name specified in the IntroscopeAgent.profile.
To turn off agent log file automatic naming:
1. Open the IntroscopeAgent.profile.
2. Set the property, introscope.agent.disableLogFileAutoNaming, to a value of true.
3. Save the IntroscopeAgent.profile.
4. Restart the application server.
Enabling cloned agent naming in clustered environments
Chapter 8: Java Agent Naming 155
Enabling cloned agent naming in clustered environments
If two agents exist with the same name monitoring the same host and process and are not uniquely named by a user, the name is appended with a number. Cloned agent naming enables you to correlate an agent with a particular application instance in a clustered application.
You are running cloned agents if you:
■ are running agents that share a host, process, or Java Agent name with one or more other agents, or
■ are running two or more agents that are using the same agent profile.
To enable cloned agent naming:
1. Stop your managed application and the Java Agent.
2. Open the IntroscopeAgent.profile and set the following property to true:
introscope.agent.clonedAgent=true
3. Save the IntroscopeAgent.profile.
4. Restart your managed application and the Java Agent.
Cloned agent naming scenario
With the Java Agent cloning property turned on, if you have four Java Agents, all named AgentX, the Enterprise Manager names the agents AgentX-1, AgentX-2, AgentX-3 and AgentX-4. If AgentX-1 disconnects and then reconnects, it will still use AgentX-1 as its name. With this naming, you will never have more Java Agent names in the database than the number of Java Agents originally cloned.
Configuring unique names for application instances
If you monitor multiple instances of the an application on the same machine, you can configure unique agent names explicitly.
To configure unique agent names:
1. Create a separate agent profile for each application.
2. Uniquely name each agent in the agent profile.
3. Specify which agent profile each application should use.

Application triage map and the agent name
156 Java Agent Guide
Application triage map and the agent name
The application triage map in the Workstation uses the agent name as part of several unique identifiers when defining the front- and backends of applications, as well as for storing information about application components in Introscope databases. If agent names change some aspects of the application triage map may also change. For example, during initial registration of an agent, the Enterprise Manager may assign a duplicated agent name a unique name by appending %<sequence number> to the agent name (e.g. MyAgent%1). If parts of the application triage map are relying on the duplicated agent name for information, aspects of the map could change.
While this does not affect the proper functioning of either the agent or the Enterprise Manager, it may reduce the overall capacity of your system; as such, CA Technologies recommends users be aware of the naming conventions employed in their Introscope environments. Users may want to designate specific agent names to sidestep this issue.

Chapter 9: Java Agent Monitoring and Logging 157
Chapter 9: Java Agent Monitoring and Logging
While Introscope monitors your applications, Introscope can also monitor the health and activity of the Java Agent itself. This section contains information on monitoring the agents health, as well as logging options for the Java Agent.
This section contains the following topics:
Configuring agent connection metrics (see page 157) Socket metrics (see page 158) Configuring logging options (see page 162) Managing ProbeBuilder Logs (see page 167)
Configuring agent connection metrics
By default, Introscope generates metrics on the connection status of agents connected to an Enterprise Manager, which you can monitor. You can monitor agent connection metrics to determine the current state of the connection between an agent and the Enterprise Manager.
Agent connection metrics appear in the Workstation Investigator under the Enterprise Manager process (the custom metric host):
Custom Metric Host (Virtual) \ Custom Metric Process(Virtual) \ Custom Metric Agent
(Virtual) (*SuperDomain*) \ Agents \ <HostName> \ <Agent Process Name> \ <Agent Name>
\ ConnectionStatus
Connection metrics have these values:
■ 0—No data about the agent is available
■ 1—agent is connected
■ 2—agent is slow to report
■ 3—agent is disconnected
An agent disconnecting also generates a "What’s Interesting" event. As with other events, users can query for agent disconnects using the historical query interface. Agent disconnect events are part of the data used in assessing application health in the Overview tab in the Workstation Console.

Socket metrics
158 Java Agent Guide
Once an agent disconnects from the Enterprise Manager, Introscope continues to generate disconnected state metrics until the agent is timed out. When an agent times out, no additional connection metrics are generated or reported to the Enterprise Manager.
To configure the agent connection time out:
1. On the machine that the Enterprise Manager is installed on, open the IntroscopeEnterpriseManager.properties file located in the <Introscope_Home>/config directory.
2. Modify this property:
introscope.enterprisemanager.agentconnection.metrics.agentTimeoutInMinutes
The time increment is in minutes.
3. Save the IntroscopeEnterpriseManager.properties
For information about Enterprise Manager properties, see the Introscope Configuration and Administration Guide.
Socket metrics
Socket and Secure Sockets Layer (SSL) metric collection is enabled by default in the agent.
Note: JVMs using the Agent.NoRedef.jar do not have socket metrics reported. See AutoProbe for WebSphere 6.1 (see page 85) for more information.

Socket metrics
Chapter 9: Java Agent Monitoring and Logging 159
Restricting socket and SSL metric collection
Socket and SSL metric collection is enabled by default, but you can restrict some metric collection to target more relevant information or scale back on overhead.
To restrict socket and SSL metric collection:
1. Open the IntroscopeAgent.profile, located in the <Agent_Home>/wily directory.
2. In the Agent I/O Socket Metrics section, edit the property values to contain the list of those hosts or ports for which metrics are required:
If an invalid host or port is included in the parameter values, a warning message is written to the agent log and that value is ignored. If, as a result, the list contains no entries, no restriction will apply.
■ introscope.agent.io.socket.client.hosts A comma separated list of hosts; only 'client' socket metrics for specified hosts will be generated. Hosts may be specified by name or textual representation of IP address (in either IPv4 or IPv6 forms).
Note: Duplicate host names are discarded. In cases where multiple host names map to a single IP, only one of the names is retained. The property will, however, match client connections with any of the set of synonymous names.
■ introscope.agent.io.socket.client.ports A comma separated list of port numbers; only 'client' socket metrics for specified ports will be generated.
Note: Duplicate ports are discarded.
■ introscope.agent.io.socket.server.ports Comma separated list of port numbers, only 'server' socket metrics for specified ports will be generated.
The above properties are dynamic; you do not need to restart your applications for changes to take effect.
3. Save the IntroscopeAgent.profile.
Fine-tuning socket and SSL metric collection
While you can restrict socket and SSL metric collection, as detailed in Restricting socket and SSL metric collection (see page 159), you can further refine your metric collection by turning on and off specific tracer groups. This helps to target the information you want as well as reduce overhead costs.

Socket metrics
160 Java Agent Guide
To fine-tune socket and SSL metric collection:
1. Open the java2.pbd file, located in the <Agent_Home>/wily directory.
2. In the I/O Socket Tracer Group or Network Tracer Group sections of java2.pbd, determine the tracers you want to turn on or off, and comment or uncomment them. For example, to suppress the metrics for input bandwidth, you comment out the following:
#TraceOneMethodWithParametersIfFlagged: SocketTracing read
InputStreamBandwidthTracer "Input Bandwidth (Bytes Per Second)"
Note: Tracers with names ending with MappingTracer must not be commented out.
3. Save the java2.pbd file.
SSL, NIO, and socket tracing in the application triage map
The application triage map introduced in the Introscope 9.0 Workstation Investigator has the ability to display instrumented client socket connections. The agent records details about external systems being used in transactions, sends this information to the Enterprise Manager, and then this information is displayed graphically in the application triage map.
The tracers contained in the AppMap.pbd, located in the <Agent_Home>/wily directory, extend existing SSL, NIO, and socket instrumentation, allowing the agent to send more component information to the application triage map. The tracers are enabled by default, but can be disabled by commenting out specific tracers in the Trace Sockets and Trace NIO Sockets sections of the AppMap.pbd.
Component names, when displayed in the application triage map, include destination host and port identities, in the same way socket client metric names are displayed. The host identity in a component name can be configured to either a host name or a host IP address. The default is the host name.
Socket metrics
Chapter 9: Java Agent Monitoring and Logging 161
To change the displayed component name:
1. Open AppMap.pbd, located in the <Agent_Home>/wily directory.
2. In the Trace Sockets and Trace NIO Sockets sections, select the tracers you want to modify. Change {hostname} to {hostip} in the relevant tracers.
For example, the original tracers use the default {hostname}:
TraceOneMethodWithParametersIfFlagged: SocketTracing read AppMapSocketTracerBT
"System {hostname} on port {port}"
TraceOneMethodWithParametersIfFlagged: SocketTracing write
AppMapSocketTracerBT "System {hostname} on port {port}"
To display the host IP, use {hostip} instead:
TraceOneMethodWithParametersIfFlagged: SocketTracing read AppMapSocketTracerBT
"System {hostip} on port {port}"
TraceOneMethodWithParametersIfFlagged: SocketTracing write
AppMapSocketTracerBT "System {hostip} on port {port}"
3. Save the AppMap.pbd file.
Turning off socket and SSL metric collection
If collecting socket and SSL metrics is not required, they can be turned off entirely.
To turn off socket and SSL metric collection:
1. Open either toggles-full.pbd or toggles-typical.pbd files (open the file you are using in your deployment).
2. Comment out (place a pound or hash sign,#, at the beginning of the line) SocketTracing:
#TurnOn: SocketTracing
3. Save the file you modified.
For more information about turning on and off tracer groups, in the toggles-full.pbd and toggles-typical.pbd files, see Default tracer groups and toggles files (see page 114) and Turning tracer groups on or off (see page 125).
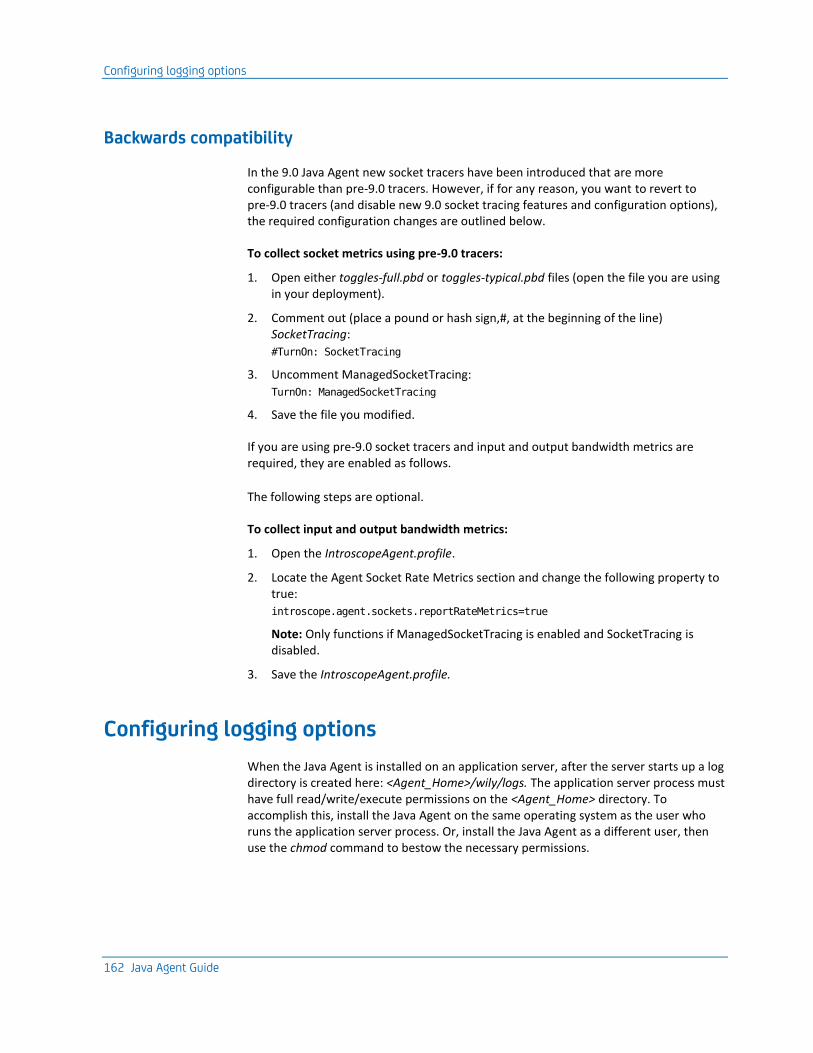
Configuring logging options
162 Java Agent Guide
Backwards compatibility
In the 9.0 Java Agent new socket tracers have been introduced that are more configurable than pre-9.0 tracers. However, if for any reason, you want to revert to pre-9.0 tracers (and disable new 9.0 socket tracing features and configuration options), the required configuration changes are outlined below.
To collect socket metrics using pre-9.0 tracers:
1. Open either toggles-full.pbd or toggles-typical.pbd files (open the file you are using in your deployment).
2. Comment out (place a pound or hash sign,#, at the beginning of the line) SocketTracing:
#TurnOn: SocketTracing
3. Uncomment ManagedSocketTracing:
TurnOn: ManagedSocketTracing
4. Save the file you modified.
If you are using pre-9.0 socket tracers and input and output bandwidth metrics are required, they are enabled as follows.
The following steps are optional.
To collect input and output bandwidth metrics:
1. Open the IntroscopeAgent.profile.
2. Locate the Agent Socket Rate Metrics section and change the following property to true:
introscope.agent.sockets.reportRateMetrics=true
Note: Only functions if ManagedSocketTracing is enabled and SocketTracing is disabled.
3. Save the IntroscopeAgent.profile.
Configuring logging options
When the Java Agent is installed on an application server, after the server starts up a log directory is created here: <Agent_Home>/wily/logs. The application server process must have full read/write/execute permissions on the <Agent_Home> directory. To accomplish this, install the Java Agent on the same operating system as the user who runs the application server process. Or, install the Java Agent as a different user, then use the chmod command to bestow the necessary permissions.
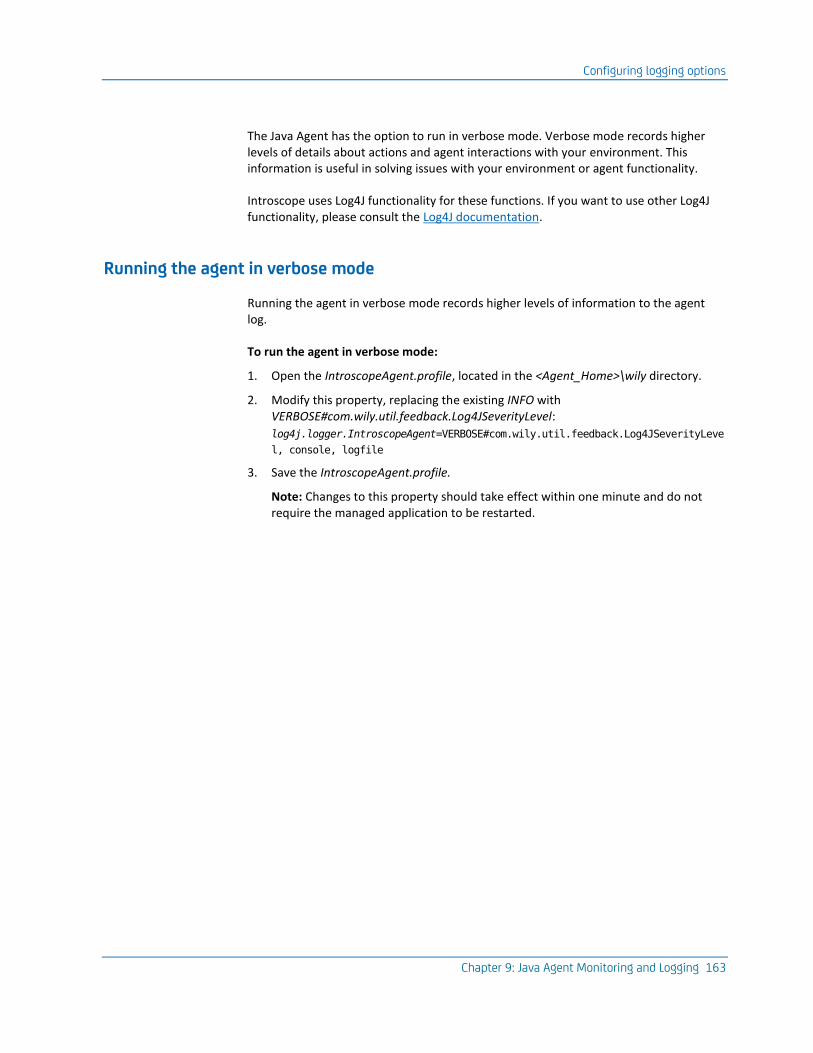
Configuring logging options
Chapter 9: Java Agent Monitoring and Logging 163
The Java Agent has the option to run in verbose mode. Verbose mode records higher levels of details about actions and agent interactions with your environment. This information is useful in solving issues with your environment or agent functionality.
Introscope uses Log4J functionality for these functions. If you want to use other Log4J functionality, please consult the Log4J documentation.
Running the agent in verbose mode
Running the agent in verbose mode records higher levels of information to the agent log.
To run the agent in verbose mode:
1. Open the IntroscopeAgent.profile, located in the <Agent_Home>\wily directory.
2. Modify this property, replacing the existing INFO with VERBOSE#com.wily.util.feedback.Log4JSeverityLevel:
log4j.logger.IntroscopeAgent=VERBOSE#com.wily.util.feedback.Log4JSeverityLeve
l, console, logfile
3. Save the IntroscopeAgent.profile.
Note: Changes to this property should take effect within one minute and do not require the managed application to be restarted.

Configuring logging options
164 Java Agent Guide
Redirecting agent output to a file
The property that controls the agent logging in verbose mode also controls where the agent log is output and the location of this log file (see Running the agent in verbose mode (see page 163) for more information).
To redirect agent output to a file:
1. Open the IntroscopeAgent.profile, located in the <Agent_Home>\wily directory.
2. Find the property: log4j.logger.IntroscopeAgent
The options for this property are:
■ console: the information in the logfile is sent to the console
■ logfile: the information in the logfile is sent to a logfile. If this is selected, the location of the log file is configured using the log4j.appender.logfile.File property. See Changing the name or location of the agent logfile (see page 165).
For example, if you wanted the agent to report in verbose mode to just a logfile, the property would be set to:
log4j.logger.IntroscopeAgent=VERBOSE#com.wily.util.feedback.Log4JSeverityLeve
l,logfile
If you wanted the agent to report to both a logfile and console, you would include both logfile and console in the property.
Note: By default the agent log, IntroscopeAgent.log is written to the <Agent_Home>\wily\logs directory. If you configured agent autonaming options, the agent log files are also automatically named, as described in Agent log files and automatic agent naming (see page 165).
3. Save the IntroscopeAgent.profile.
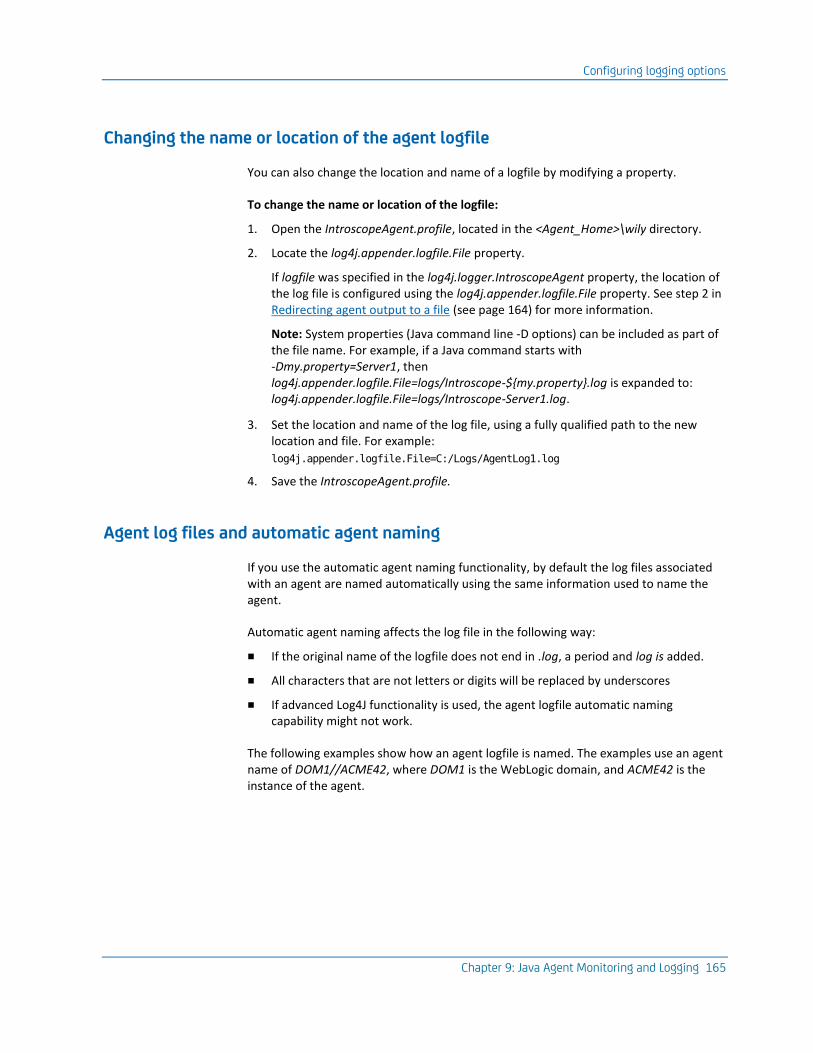
Configuring logging options
Chapter 9: Java Agent Monitoring and Logging 165
Changing the name or location of the agent logfile
You can also change the location and name of a logfile by modifying a property.
To change the name or location of the logfile:
1. Open the IntroscopeAgent.profile, located in the <Agent_Home>\wily directory.
2. Locate the log4j.appender.logfile.File property.
If logfile was specified in the log4j.logger.IntroscopeAgent property, the location of the log file is configured using the log4j.appender.logfile.File property. See step 2 in Redirecting agent output to a file (see page 164) for more information.
Note: System properties (Java command line -D options) can be included as part of the file name. For example, if a Java command starts with -Dmy.property=Server1, then log4j.appender.logfile.File=logs/Introscope-${my.property}.log is expanded to: log4j.appender.logfile.File=logs/Introscope-Server1.log.
3. Set the location and name of the log file, using a fully qualified path to the new location and file. For example:
log4j.appender.logfile.File=C:/Logs/AgentLog1.log
4. Save the IntroscopeAgent.profile.
Agent log files and automatic agent naming
If you use the automatic agent naming functionality, by default the log files associated with an agent are named automatically using the same information used to name the agent.
Automatic agent naming affects the log file in the following way:
■ If the original name of the logfile does not end in .log, a period and log is added.
■ All characters that are not letters or digits will be replaced by underscores
■ If advanced Log4J functionality is used, the agent logfile automatic naming capability might not work.
The following examples show how an agent logfile is named. The examples use an agent name of DOM1//ACME42, where DOM1 is the WebLogic domain, and ACME42 is the instance of the agent.

Configuring logging options
166 Java Agent Guide
When an agent log file is created (named AutoProbe.log by default), if the agent name is not yet available, a timestamp is included in the filename:
AutoProbe.20040416-175024.log
Once the agent name becomes available, the logfile is renamed using the agent’s automatic name:
AutoProbe.DOM1_ACME42.log
You can disable automatic log naming - see Advanced automatic agent naming options (see page 153) for more information.
Rolling up logs by date or size
You can roll up logs based on size or date, retaining a specified number of days of information and purging the rest.
To roll up log files:
1. Open the IntroscopeAgent.profile, and locate the Logging Configuration section.
2. Modify the following properties:
log4j.logger.IntroscopeAgent
log4j.appender.logfile.File
log4j.appender.console.layout
log4j.appender.console.layout.ConversionPattern
log4j.appender.logfile
log4j.appender.logfile.MaxFileSize
log4j.appender.logfile.MaxBackupIndex
Note: You must restart the managed application before changes to this property take effect.
3. Save the IntroscopeAgent.profile.
For example, the following configuration will keep up to three backup/rolled logs, and each will be up to 2 kilobytes in size:
log4j.logger.IntroscopeAgent=VERBOSE#com.wily.util.feedback.Log4JSeverityLeve
l, console, logfile
log4j.appender.logfile.File=logs/IntroscopeAgent.log
log4j.appender.console.layout=com.wily.org.apache.log4j.PatternLayout
log4j.appender.console.layout.ConversionPattern=%d{M/dd/yy hh:mm:ss a z} [%-3p]
[%c] %m%n
log4j.appender.logfile=com.wily.introscope.agent.AutoNamingRollingFileAppende
r
log4j.appender.logfile.MaxFileSize=2KB
log4j.appender.logfile.MaxBackupIndex=3

Managing ProbeBuilder Logs
Chapter 9: Java Agent Monitoring and Logging 167
Managing ProbeBuilder Logs
ProbeBuilder logs all the classes it sees, all the classes it instruments, as well as all the classes it does not add instrumentation for.
the probes it added during the instrumentation process and the PBDs it used. In addition, it logs the classes it did not instrument due to skips.
Command-line ProbeBuilder and ProbeBuilder Wizard log name and location
The command-line ProbeBuilder and ProbeBuilder Wizard log file location is determined by where you specify Java classes with the ProbeBuilder Wizard or with the Command-Line ProbeBuilder. For a directory, the log file is located inside the destination directory. For a file, the log file is located next to the destination file.
The ProbeBuilder log file is called:
<original-directory-or-original-file>.probebuilder.log
<original-directory> or <original-file> is the Java class location that you specify with the ProbeBuilder Wizard or with the Command-Line ProbeBuilder.
Only the most recent log is kept; all previous log files are overwritten.
AutoProbe log name and location
AutoProbe will always attempt to log the changes it makes. By default the AutoProbe log file is named AutoProbe.log.
To change the name or location of the AutoProbe log:
1. Open the IntroscopeAgent.profile, located in the <Agent_Home>\wily directory.
2. Locate the introscope.autoprobe.logfile property and modify the log name and location, using a fully qualified file path. Non-absolute names are resolved relative to the location of the IntroscopeAgent.profile file.
Note: When loading the agent profile from a resource on a classpath, AutoProbe is unable to write to the AutoProbe log file, because the IntroscopeAgent.profile file is located within a resource.
You must restart the managed application before changes to this property take effect.
3. Save the IntroscopeAgent.profile.


Chapter 10: Using Virtual Agents to Aggregate Metrics 169
Chapter 10: Using Virtual Agents to Aggregate Metrics
This section has information about configuring and using Virtual Agents.
This section contains the following topics:
Understanding Virtual Agents (see page 169) Virtual Agent requirements (see page 169) Configuring Virtual Agents (see page 170)
Understanding Virtual Agents
You can configure multiple physical agents into a single Virtual Agent. A Virtual Agent enables an aggregated, logical view of the metrics reported by multiple Java Agents.
A Virtual Agent is useful if you manage clustered applications with Introscope—a Virtual Agent is comprised of the agents that monitor different instances of the same clustered application, and appears in the Introscope Workstation as a single agent. This allows metrics from multiple instances of a clustered application to be presented at a logical, application level, as opposed to separately for each application instance.
You can view performance and availability data for a specific application instance, by scoping your views and interactions in terms of a single agent.
Virtual Agent requirements
If you have multiple stand-alone Enterprise Managers, a Virtual Agent can contain only agents that report to the same Enterprise Manager.
In an Enterprise Manager cluster, agents that report to Enterprise Managers within a single cluster can belong to the same Virtual Agent, regardless of the Collector Enterprise Manager to which they report. See the CA Wily Introscope Configuration and Administration Guide for more information about clustering.
Consider these conditions when configuring Virtual Agents:
■ An agent can be assigned to multiple Virtual Agents.
■ Virtual Agents cannot include other Virtual Agents.
■ If you define multiple Virtual Agents, they must have unique names, including custom metric agents—all agents in a cluster must have unique names.
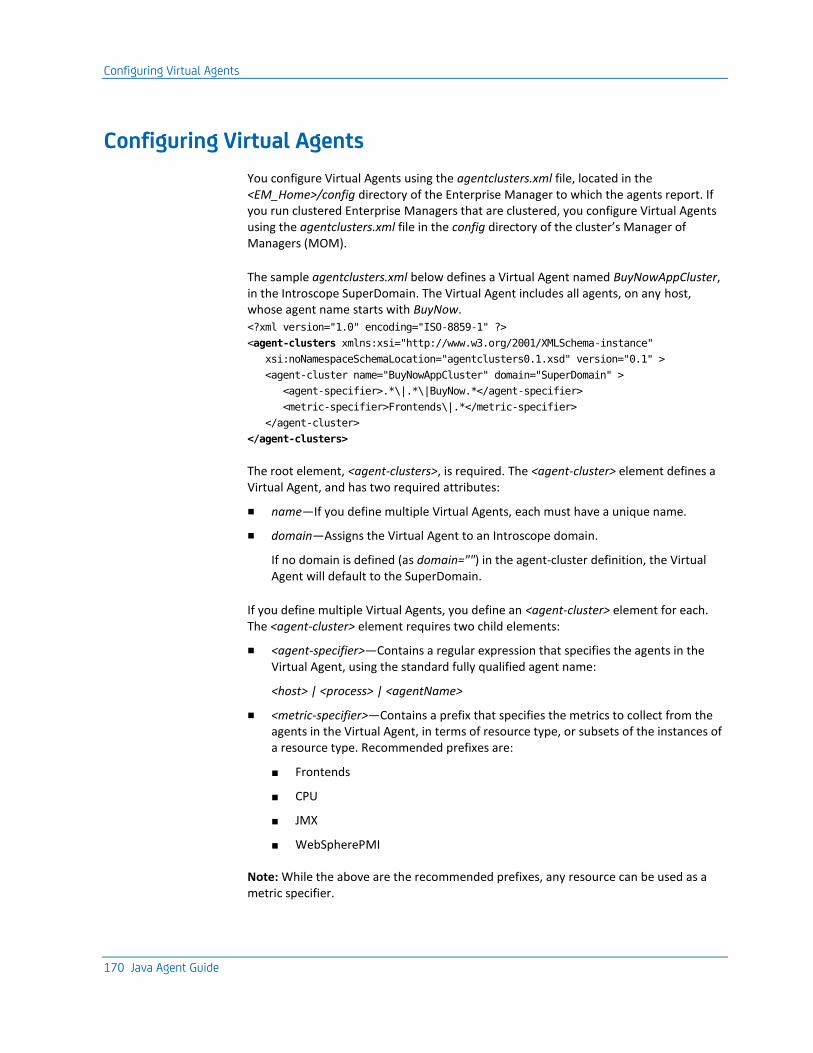
Configuring Virtual Agents
170 Java Agent Guide
Configuring Virtual Agents
You configure Virtual Agents using the agentclusters.xml file, located in the <EM_Home>/config directory of the Enterprise Manager to which the agents report. If you run clustered Enterprise Managers that are clustered, you configure Virtual Agents using the agentclusters.xml file in the config directory of the cluster’s Manager of Managers (MOM).
The sample agentclusters.xml below defines a Virtual Agent named BuyNowAppCluster, in the Introscope SuperDomain. The Virtual Agent includes all agents, on any host, whose agent name starts with BuyNow.
<?xml version="1.0" encoding="ISO-8859-1" ?>
<agent-clusters xmlns:xsi="http://www.w3.org/2001/XMLSchema-instance"
xsi:noNamespaceSchemaLocation="agentclusters0.1.xsd" version="0.1" >
<agent-cluster name="BuyNowAppCluster" domain="SuperDomain" >
<agent-specifier>.*\|.*\|BuyNow.*</agent-specifier>
<metric-specifier>Frontends\|.*</metric-specifier>
</agent-cluster>
</agent-clusters>
The root element, <agent-clusters>, is required. The <agent-cluster> element defines a Virtual Agent, and has two required attributes:
■ name—If you define multiple Virtual Agents, each must have a unique name.
■ domain—Assigns the Virtual Agent to an Introscope domain.
If no domain is defined (as domain="") in the agent-cluster definition, the Virtual Agent will default to the SuperDomain.
If you define multiple Virtual Agents, you define an <agent-cluster> element for each. The <agent-cluster> element requires two child elements:
■ <agent-specifier>—Contains a regular expression that specifies the agents in the Virtual Agent, using the standard fully qualified agent name:
<host> | <process> | <agentName>
■ <metric-specifier>—Contains a prefix that specifies the metrics to collect from the agents in the Virtual Agent, in terms of resource type, or subsets of the instances of a resource type. Recommended prefixes are:
■ Frontends
■ CPU
■ JMX
■ WebSpherePMI
Note: While the above are the recommended prefixes, any resource can be used as a metric specifier.

Configuring Virtual Agents
Chapter 10: Using Virtual Agents to Aggregate Metrics 171
The <agent-cluster> element can contain multiple <metric-specifier> stanzas. Note that a higher volume of matching metrics imposes high overhead on the Enterprise Manager, and can ultimately have an effect on Enterprise Manager capacity.
Important: Regular expressions and wildcard metric specifiers such as ".*" and "(.*)" are allowed, but should be used with caution, if at all. Use of wildcards can result in a high volume of metrics and a performance impact.
A sample agentclusters.xml is available in your <EM_Home>\config directory.


Chapter 11: Configuring Java Agent Failover 173
Chapter 11: Configuring Java Agent Failover
This section has information about agent failover.
This section contains the following topics:
Understanding agent failover (see page 173) Defining backup Enterprise Managers (see page 174) Defining failover connection order (see page 175) Configuring failback to primary Enterprise Manager (see page 175) Configuring domain/user information (see page 176)
Understanding agent failover
An agent that cannot connect to its Enterprise Manager, or loses connection with it, can failover to an alternative Enterprise Manager. To enable failover, you specify a list of alternative Enterprise Managers in the IntroscopeAgent.profile file.
When an agent configured for failover cannot connect to its default Enterprise Manager, it tries to connect to the next Enterprise Manager on the list of failover hosts. If the agent does not connect with a failover host, it cycles through the Enterprise Managers on the list until it succeeds in connecting. If the agent goes through the list without connecting to an Enterprise Manager, it waits 10 seconds before cycling through the list again.
In a basic Introscope configuration, you define the host and port settings for one Enterprise Manager. To enable agent failover, you define connection properties for backup Enterprise Managers, and a list that specifies the failover order.
Defining backup Enterprise Managers
174 Java Agent Guide
Defining backup Enterprise Managers
To enable agent failover, you must define a list of backup Enterprise Managers, creating an alternate communication channel for each as described in Connecting to the Enterprise Manager (see page 48).
To define backup Enterprise Managers:
1. Open the IntroscopeAgent.profile file, located in the <Agent_Home>\wily directory.
2. Locate the Enterprise Manager Locations and Names section of the profile.
3. Add Enterprise Managers and their connection information to this section. The following example contains the primary Enterprise Manager connection information, as well as two backup Enterprise Managers.
Note: Be sure to assign each additional Enterprise Manager communication channel a unique name—do not use the name DEFAULT or the name of an existing channel when creating a new one.
This is the primary Enterprise Manager connection information:
introscope.agent.enterprisemanager.transport.tcp.host.DEFAULT=enterprise
introscope.agent.enterprisemanager.transport.tcp.port.DEFAULT=5001
introscope.agent.enterprisemanager.transport.tcp.socketfactory.DEFAULT=com.wi
ly.isengard.postofficehub.link.net.DefaultSocketFactory
This is an example of defining the first backup Enterprise Manager:
introscope.agent.enterprisemanager.transport.tcp.host.BackupEM1=voyager
introscope.agent.enterprisemanager.transport.tcp.port.BackupEM1=5002
introscope.agent.enterprisemanager.transport.tcp.socketfactory.BackupEM1=
com.wily.isengard.postofficehub.link.net.DefaultSocketFactory
This is an example of defining a second backup Enterprise Manager:
introscope.agent.enterprisemanager.transport.tcp.host.BackupEM2=space9
introscope.agent.enterprisemanager.transport.tcp.port.BackupEM2=5003
introscope.agent.enterprisemanager.transport.tcp.socketfactory.BackupEM2=
com.wily.isengard.postofficehub.link.net.DefaultSocketFactory
4. Save the IntroscopeAgent.profile.

Defining failover connection order
Chapter 11: Configuring Java Agent Failover 175
Defining failover connection order
After specifying the connection properties for your backup Enterprise Managers, define the order in which the agents will attempt to connect to the backup Enterprise Manager.
To specify the connection order:
1. In the IntroscopeAgent.profile file, locate the introscope.agent.enterprisemanager.connectionorder property.
2. List the Enterprise Manager communication channels—for the agent’s primary Enterprise Manager as well as the backups. Put the primary Enterprise Manager first in the list. For the Enterprise Manager communication channels specified Defining backup Enterprise Managers (see page 174), the connection order could be specified like this:
introscope.agent.enterprisemanager.connectionorder=DEFAULT,BackupEM1,BackupEM
2
3. Save the IntroscopeAgent.profile.
In a clustered configuration with a MOM, you can also use agent load balancing to handle Collector downtime scenarios.
Configuring failback to primary Enterprise Manager
In the default agent failover scenario, if the agent loses connection to its primary Enterprise Manager, it tries to connect to the next Enterprise Manager defined in the agent profile. You can also configure the agent to periodically try to reconnect to the primary Enterprise Manager.
To configure attempts to reconnect to the primary Enterprise Manager:
1. In the IntroscopeAgent.profile, locate the Enterprise Manager Failback Retry Interval section.
2. Uncomment this property:
introscope.agent.enterprisemanager.failbackRetryIntervalInSeconds
and set the interval in which the agent will attempt to reconnect to its primary Enterprise Manager. The default interval is 120 seconds.
3. Save the IntroscopeAgent.profile.
4. Restart the application.
Note: You must restart the managed application before changes to this property take effect.

Configuring domain/user information
176 Java Agent Guide
Configuring domain/user information
To use agent failover and also have users, domains, and authentication settings defined, you must ensure that this information is in sync across the specified failover Enterprise Managers. For more information on domain and user permissions, see the CA Wily Introscope Configuration and Administration Guide.

Chapter 12: Configuring LeakHunter and ErrorDetector 177
Chapter 12: Configuring LeakHunter and ErrorDetector
This section describes how to enable and configure LeakHunter and ErrorDetector.
This section contains the following topics:
LeakHunter (see page 177) Enabling and disabling LeakHunter (see page 180) Configuring LeakHunter properties (see page 181) Running LeakHunter (see page 183) Identifying potential leaks with collection IDs (see page 183) LeakHunter log file (see page 184) Using LeakHunter (see page 186) ErrorDetector (see page 187) Enabling ErrorDetector in the Java Agent (see page 189) Configuring ErrorDetector options (see page 189) Advanced error data capture (see page 190) Defining new error types (see page 190) More help (see page 192) Using ErrorDetector (see page 193)
LeakHunter
Introscope LeakHunter is an add-on component designed to help locate the source of potential memory leaks by watching for collection instances that appear to be increasing in size over time—that is, if the number of objects stored in the collection increases over time.
Memory leaks that occur in programs that run for short periods (minutes or hours) might not present a major issue. However, for applications that are running 24 hours a day (like a web site), a small memory leak can soon escalate into a big problem.
Introscope LeakHunter is designed to track information about a noticed memory leak by being turned on, discovering collection classes, and then being turned off after information is gathered. This method of using LeakHunter creates only a small, temporary amount of overhead.

LeakHunter
178 Java Agent Guide
How LeakHunter works
After you have enabled LeakHunter, you also define a timeout period during which LeakHunter looks for new potential leaks. If you use AutoProbe, you simply restart the managed application. If you use ProbeBuilder Wizard or Command-line ProbeBuilder, you must re-instrument the application using the leakhunter.pbd (in addition to any previously used PBD files).
If LeakHunter finds a collection that is growing in size over time, it:
■ identifies the collection with a unique ID
■ reports information about the collection to the Enterprise Manager as metric data
■ reports information about the collection to a log file on the agent machine
■ continues to track and report data for that collection
Should LeakHunter notice that a collection no longer appears to be leaking, it reports that fact to both the Enterprise Manager and the log file, but continues tracking and reporting data for that collection.
LeakHunter continues looking for potential leaks and monitors already identified potential leaks until the timeout period expires. After a timeout period expires, LeakHunter stops looking for potential leaks in newly allocated collections, and only continues checking collections that are already identified as potential leaks. This significantly reduces LeakHunter overhead and allows additional monitoring of the potential leaks. LeakHunter continues monitoring the identified potential leaks until the managed application is shut down.
To find the source of a memory leak, you can either browse the metric data in the Introscope Investigator, or view the log file.
LeakHunter
Chapter 12: Configuring LeakHunter and ErrorDetector 179
What LeakHunter tracks in Java
Introscope LeakHunter tracks these collections in a Java implementation:
■ Implementations of java.util.Collection:
■ java.util.ArrayList
■ java.util.LinkedList
■ java.util.TreeSet
■ java.util.HashSet
■ java.util.LinkedHashSet
■ java.util.Vector
■ java.util.Stack
■ Implementations of java.util.Map:
■ java.util.Map
■ java.util.SortedMap
■ java.util.HashMap
■ java.util.TreeMap
■ java.util.IdentityHashMap
■ java.util.Hashtable
■ java.util.Properties
■ java.util.LinkedHashMap
What LeakHunter does not track
Introscope LeakHunter does not track:
■ a leak not caused by a collection.
■ custom collection implementations or other data structures with an increasing number of references.
■ a leaking collection that is not instrumented.

Enabling and disabling LeakHunter
180 Java Agent Guide
In addition to the above, LeakHunter does not track the following in a Java implementation:
■ any subclasses created for collections described in What LeakHunter tracks in Java (see page 179). However, you can update the ProbeBuilder Directive (PBD) file to get this information. See the leakhunter.pbd file for more information.
Note: If you are using Application Server AutoProbe, LeakHunter does not automatically track collections allocated by the application server. To track these collections, you must statically instrument the application server, or use JVM AutoProbe.
System and version requirements
Introscope LeakHunter has the same system requirements as the Java Agent.
By default, LeakHunter is not enabled after installation. You must enable LeakHunter to use its functionality.
Enabling and disabling LeakHunter
LeakHunter is run as an agent extension, so no class paths need to be updated. By default, LeakHunter is not enabled after installation. You must enable LeakHunter to use its functionality.
To enable LeakHunter:
1. Open the agent profile, IntroscopeAgent.profile.
2. Under the LeakHunter Configuration heading, locate the property introscope.agent.leakhunter.enable, and enter a value of true.
3. Save the agent profile.
4. Open *.typical.pbl or *.full.pbl (open the file you have listed in the IntroscopeAgent.profile property introscope.autoprobe.directivesFile ) and uncomment leakhunter.pbd.
Note: When using ProbeBuilder Wizard, copy the leakhunter.pbd file to the <Agent_Home>\wily\hotdeploy directory.
5. Restart the application.
Important: By default, agent extensions such as LeakHunter are located and referenced from the <Agent_Home>\wily\ext directory. However, you can change the location of the agent extension directory in the agent profile. If you change the location of the \ext directory, be sure to move the contents of the \ext directory as well.

Configuring LeakHunter properties
Chapter 12: Configuring LeakHunter and ErrorDetector 181
To disable LeakHunter:
1. Open the agent profile, IntroscopeAgent.profile.
2. Under the LeakHunter Configuration heading, locate the property introscope.agent.leakhunter.enable, and enter a value of false.
3. Save the agent profile.
4. Restart the application.
Configuring LeakHunter properties
LeakHunter configuration properties are located in the agent profile, IntroscopeAgent.profile, located in the <Agent_Home>/wily directory.
To configure LeakHunter:
1. Open the agent profile, IntroscopeAgent.profile.
2. Configure the following LeakHunter properties as desired:
introscope.agent.leakhunter.logfile.location
Specifies the location of LeakHunter.log file. The file name is relative to the <Agent_Home> directory. If the property is commented out or left blank, no log file is written.
The default value is logs/LeakHunter.log.
introscope.agent.leakhunter.logfile.append
Specifies whether to replace the log file (value of false) or append an existing log file (value of true) on application restart.
The default value is false.
introscope.agent.leakhunter.leakSensitivity
Specifies the sensitivity level for detecting memory leaks. A higher leak sensitivity setting will result in more potential leaks being reported and a lower sensitivity will result in fewer potential leaks reported.
The property value must be an integer from 1-10.
The default sensitivity level is 5.
introscope.agent.leakhunter.timeoutInMinutes
Specifies the period of time in minutes during which LeakHunter looks for new potential leaks. The property value must be a non-negative integer. A value of zero means no timeout.
The default value is 120 minutes.
Configuring LeakHunter properties
182 Java Agent Guide
introscope.agent.leakhunter.collectAllocationStackTraces
Specifies whether to collect allocation stack trace information. Turning on this option has the potential to create higher system CPU usage and memory. Changes to this property take effect immediately and do not require the managed application to be restarted.
The default value is false.
introscope.agent.leakhunter.ignore.n
Specifies the particular collections that you want LeakHunter to ignore.
For Generic collections, use a syntax that includes the generic type qualification, for example: System.Collections.Generic.List`1
Changes to this property take effect immediately and do not require the managed application to be restarted.
The default values for these properties (where n=0-4) are:
introscope.agent.leakhunter.ignore.0=org.apache.taglibs.standard.lang.jst
l.*
introscope.agent.leakhunter.ignore.1=com.bea.medrec.entities.RecordEJB_xw
cp6o__WebLogic_CMP_RDBMS
introscope.agent.leakhunter.ignore.2=net.sf.hibernate.collection.*
introscope.agent.leakhunter.ignore.3=org.jnp.interfaces.FastNamingPropert
ies
introscope.agent.leakhunter.ignore.4=java.util.SubList
3. Save changes to the agent profile.
Important: The IntroscopeAgent.profile contains properties that control which packages are ignored by LeakHunter. These properties are enabled by default. If you comment out these properties, exceptions are reported in the agent logs.
Ignoring collections that cause poor performance
Collections whose size() method executes in time proportional to the number of objects in the Collection will have poor performance. In other words, if the collection is such that the size() method takes longer and longer to execute (for example, a badly implemented LinkedList where to get the size of the list we traverse through each element of the list and count), this will have negative effects on application performance.
Such collections should be ignored, using the ignore property in IntroscopeAgent.profile, as shown in Configuring LeakHunter properties.

Running LeakHunter
Chapter 12: Configuring LeakHunter and ErrorDetector 183
Running LeakHunter
LeakHunter is run as an agent extension.
To run LeakHunter:
■ Using JVM AutoProbe: after LeakHunter has been enabled, restart the application.
■ Using Command-Line ProbeBuilder: re-instrument the managed application using the leakhunter.pbd (and any previously used .pbds). Restart the managed application.
■ Using ProbeBuilder Wizard: run ProbeBuilder Wizard and select the leakhunter.pbd from the custom pbd list. Restart the managed application after implementing new .jars for use.
Identifying potential leaks with collection IDs
LeakHunter identifies each potential leak with a unique collection ID that can be used to correlate metric data from the Investigator tree with data in the log file, as well as provide stable names across applications.
The unique collection IDs have a specific syntax, based on one of these types:
<method>-<4 digit hash code>#<unique number>
<field>-<4 digit hash code>#<unique number>
■ <method>: the name of the method where the collection was allocated
■ <field>: name of field to which the collection was assigned
■ <4 digit hash code>: the hash code of the full name of the class containing the method or field name
■ #<unique number>: number appended to potential leaks with the same method and hash code to ensure unique collection IDs during the run of the agent.
The collection ID for a potential leak will be stable across runs of the application.
Examples of these collection IDs are:
theLookupTable-6314#1
getLoginID-1234#1
getLoginID-1234#2
getLoginID-1234#3
verifyCart-5678#1
verifyCart-0012#1

LeakHunter log file
184 Java Agent Guide
LeakHunter log file
The LeakHunter log file contains information about potential leaks identified by Introscope LeakHunter in your managed application. Each entry contains information about a potential leak. The LeakHunter log file includes entries for four scenarios:
■ when a potential leak is first identified—see Potential leak first identified log entry (see page 184)
■ when an identified leak appears to have stopped leaking—see Identified potential leak stops leaking log entry (see page 185)
■ when a previously identified leak appears to have started leaking again—see Identified potential leak is leaking again log entry
■ when a LeakHunter timeout has occurred—see LeakHunter timeout log entry
Potential leak first identified log entry
This type of LeakHunter log entry contains information about a potential leak when it is first identified:
■ Current timestamp (when written to the log)
■ Collection ID
■ Class of the collection
■ Allocation Method of the collection
■ Allocation time of the collection
■ Allocation stack trace of the collection
■ Field name to which the collection was assigned
■ Current size of the collection
LeakHunter log file
Chapter 12: Configuring LeakHunter and ErrorDetector 185
Example: Log file entry if a potential leak is detected
The following example illustrates an entry in the Java log file when a potential leak is first identified:
5/2/09 9:55:06 AM PDT
Potential leak identified
Assigned ID: testInst-2604#1
Collection Class: java.util.Vector
Allocation Method: sonOfLH_test.testInst()
Allocation Timestamp: 5/2/09 9:54:21 AM PDT
Allocation Stack Trace:
Unknown
Field Name(s):
sonOfLH_test.v3
sonOfLH_test.v4
sonOfLH_test.v5
Current Size: 44
Identified potential leak stops leaking log entry
This type of LeakHunter log entry contains information about a potential leak that has stopped leaking:
■ Current timestamp (when written to the log)
■ Collection ID
■ Class of the collection
■ Current size of the collection
Example: Log file entry if a potential leak stops leaking
The following example illustrates an entry in the Java log file when a potential leak appears to have stopped leaking:
4/27/10 1:18:12 PM PDT
Potential leak no longer appears to be leaking
Assigned ID: createNewInstance-2815#3
Collection Class: java.util.HashMap
Current Size: 70
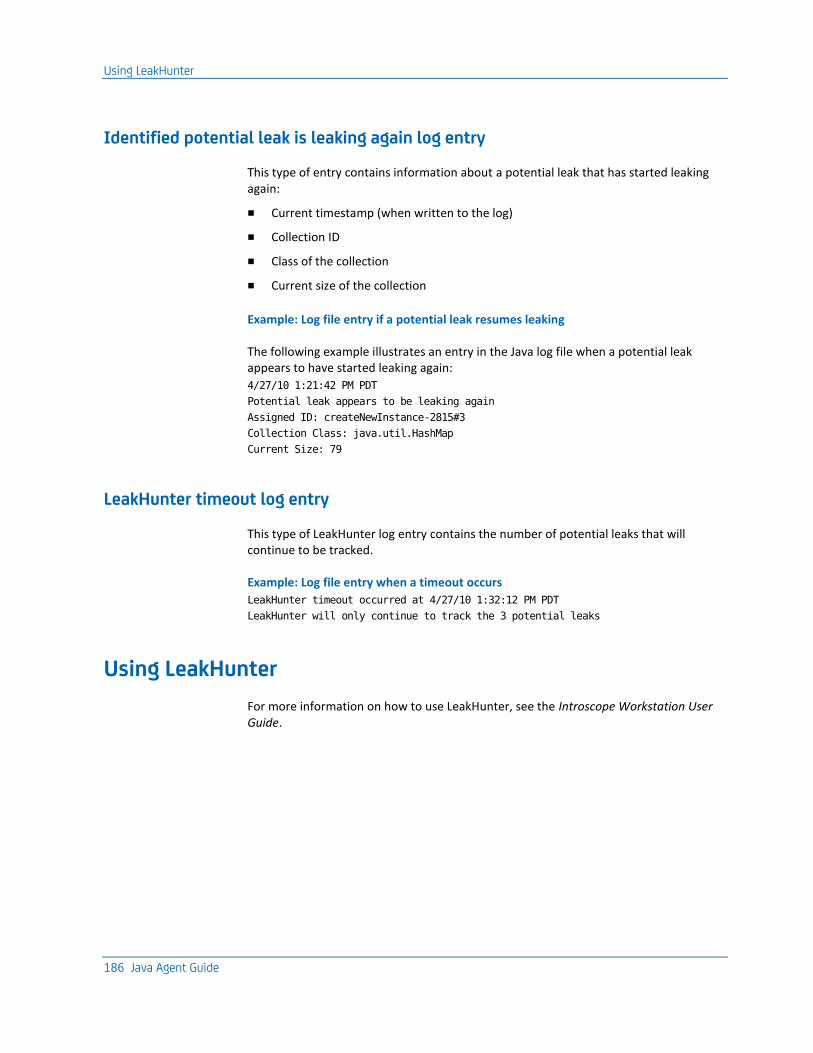
Using LeakHunter
186 Java Agent Guide
Identified potential leak is leaking again log entry
This type of entry contains information about a potential leak that has started leaking again:
■ Current timestamp (when written to the log)
■ Collection ID
■ Class of the collection
■ Current size of the collection
Example: Log file entry if a potential leak resumes leaking
The following example illustrates an entry in the Java log file when a potential leak appears to have started leaking again:
4/27/10 1:21:42 PM PDT
Potential leak appears to be leaking again
Assigned ID: createNewInstance-2815#3
Collection Class: java.util.HashMap
Current Size: 79
LeakHunter timeout log entry
This type of LeakHunter log entry contains the number of potential leaks that will continue to be tracked.
Example: Log file entry when a timeout occurs
LeakHunter timeout occurred at 4/27/10 1:32:12 PM PDT
LeakHunter will only continue to track the 3 potential leaks
Using LeakHunter
For more information on how to use LeakHunter, see the Introscope Workstation User Guide.

ErrorDetector
Chapter 12: Configuring LeakHunter and ErrorDetector 187
ErrorDetector
Introscope ErrorDector allows application support personnel to detect and diagnose the cause of serious errors, which can prevent users from completing web transactions. These kinds of application availability issues typically result in error messages to the user such as "404 Not Found" and others, yet the error message lacks specific information that IT personnel need to isolate the root cause of the problem. Introscope ErrorDetector allows you to monitor these serious errors as they occur in live applications, determine the frequency and nature of the errors, and deliver specific information about the root cause to developers.
ErrorDetector is the only application management solution that helps ensure superior user experiences and improves transaction integrity by enabling root cause analysis of serious application errors.
Introscope ErrorDetector allows IT teams to:
■ Determine the frequency of anomalous transactions
■ Determine whether logged exceptions affect users
■ See exactly where errors occurred within the transaction path
■ Obtain the information needed to reproduce, diagnose and eliminate serious errors
Introscope ErrorDetector is integrated with Introscope, allowing you to monitor errors in the Introscope Workstation. When application errors do occur, you can also use the Live Error Viewer to examine detailed information about each error.
Types of errors
CA Technologies has defined a set of criteria to describe "serious" errors, based on information contained in the J2EE specifications. ErrorDetector considers both errors and exceptions to be errors. The most common type of error is a thrown exception.
Some examples of common errors are:
■ HTTP errors (404, 500, etc.)
Note: Occasionally, HTTP 404 errors originate in a web server instead of an application server. If this occurs, ErrorDetector cannot detect the web server error through the agent.
■ SQL statement errors
■ network connectivity errors (timeout errors)
■ backend errors (for example, can’t send a message through JMS, can't write a message to the message queue)
ErrorDetector
188 Java Agent Guide
What CA Technologies considers to be important errors might differ from what you consider important errors. If you do not consider some of the errors ErrorDetector tracks to be important, you can choose to ignore them. If there are additional errors you want to track, you can use error tracers to create new directives to trace them.
How ErrorDetector works
Introscope includes a ProbeBuilder Directive (PBD) file called errors.pbd with the agent installation. The tracers in this PBD capture serious errors.
ErrorDetector is installed automatically with your agent installation. Once ErrorDetector is installed, you configure Introscope to use the errors.pbd and enable ErrorDetector functionality. If you are using ProbeBuilder Wizard or Command-line ProbeBuilder, you must re-instrument the application using the errors.pbd (in addition to any previously used PBD files).
The Introscope agent collects error information as defined in the errors.pbd file.
From the Workstation, you can view:
■ error metric data in the Investigator
■ live errors in the Live Error Viewer
■ error details in the Error Snapshot, which shows component-level information on how the error occurred
ErrorDetector is integrated with Transaction Tracer, enabling you to see exactly why and how serious errors occurred within the context of the transaction path. Moreover, all errors and transactions are persisted to Transaction Event Database, enabling you to spot trends through analysis of historical data.
Introscope defines a transaction as the invocation and processing of a service. In the context of a web application, it is the invocation and processing of a URL sent from a web browser. In the context of a web service, it is the invocation and processing of a SOAP message.

Enabling ErrorDetector in the Java Agent
Chapter 12: Configuring LeakHunter and ErrorDetector 189
Enabling ErrorDetector in the Java Agent
The property introscope.agent.errorsnapshots.enable should be set to true in the IntroscopeAgent.profile to enable the Java Agent to capture error data. By default, the Java Agent is enabled to capture error data.
To enable/disbale ErrorDetector data capture in the Java Agent:
1. Open the agent profile, IntroscopeAgent.profile.
2. Confirm the introscope.agent.errorsnapshots.enable property to true.
Note: To disable ErrorDetector, set this property to false.
3. If using ProbeBuilder Wizard, copy the errors.pbd file to the <EM_Home>/config/custompbd directory, and re-instrument your applications. For more information on ProbeBuilder Wizard, see Using the ProbeBuilder wizard (see page 356).
4. Save the agent profile.
Configuring ErrorDetector options
You can configure ErrorDetector to limit the maximum number of errors the agent sends to the Enterprise Manager, or specify the errors to ignore.
Enabling ErrorDetector captures error data without incurring much overhead. The out-of-the-box throttle is set at 10 errors per 15 seconds. If you want to capture more errors during this time period, you can increase the throttle, but be prepared to incur more overhead.
To change the ErrorDetector throttle (optional):
1. Open the agent profile, IntroscopeAgent.profile.
2. Enter a new value for the introscope.agent.errorsnapshots.throttle property.
3. Save the agent profile.
Note: Changes to this property take effect immediately and do not require the managed application to be restarted.
You can configure the agent to ignore errors you don’t want to track. The information you specify to "tag" the error can be the exact error message, or any portion of the message, along with the "wildcard" asterisk character.

Advanced error data capture
190 Java Agent Guide
To ignore certain errors (optional):
1. Open the agent profile, IntroscopeAgent.profile.
2. For the introscope.agent.errorsnapshots.ignore property, define the value to be whatever information you think will identify that type of error.
For example, the following ignore property would ignore any errors with the term "IOException" found anywhere within it:
introscope.agent.errorsnapshots.ignore.0=*IOException*
3. To ignore additional errors, add additional ignore properties sequentially. For example, to ignore two types of errors, the properties would look like this:
introscope.agent.errorsnapshots.ignore.0=*IOException*
introscope.agent.errorsnapshots.ignore.1=*HTTP Error Code *500*
4. Save changes to the agent profile.
Note: Changes to this property take effect immediately and do not require the managed application to be restarted.
Advanced error data capture
Although ErrorDetector captures many common error types by default, CA Technologies provides options for customizing the error detection mechanism to suit your needs.
There are four tracers related to error data that can be used to create new ProbeBuilder Directive (PBDs) to track error data.
■ ExceptionErrorReporter reports standard exceptions. For more information, see ExceptionErrorReporter.
■ ThisErrorReporter reports current object as an error. For more information, see ThisErrorReporter.
■ HTTPErrorCodeReporter captures HTTP error codes and associated error messages. For more information, see HTTPErrorCodeReporter.
■ MethodCalledErrorReporter reports if specific methods get called. For more information, see MethodCalledErrorReporter.
You can use these tracers to create new directives for tracing errors. New directives should be placed in the errors.pbd file, located in the <Agent_Home>/wily directory.
Defining new error types
Errors are defined for ErrorDetector using PBDs. There are several special tracers that check for the presence of an error and capture (or construct) the error message. By placing these tracers at the right points, you can teach ErrorDetector about a new kind of error in your application or its infrastructure.

Defining new error types
Chapter 12: Configuring LeakHunter and ErrorDetector 191
ExceptionErrorReporter
The ExceptionErrorReporter tracer is used to check for exceptions being thrown from the instrumented method. If an exception is thrown, this tracer treats it as an error and gets the error message from the exception. This is by far the most common definition of an error.
In order to capture error messages, the ExceptionErrorReporter tracer must be used with a "...WithParameters" directive. Otherwise, the tracer will only increment the Errors Per Interval metric. For example:
TraceOneMethodWithParametersOfClass: com.bank.CustomerAccount getBalance ExceptionErrorReporter "CustomerAccount:Errors Per Interval"
This directive specifies that any exception that is thrown from the getBalance() method on the CustomerAccount constitutes an error.
MethodCalledErrorReporter
The MethodCalledErrorReporter tracer is used on methods where the very act of the method being called means that an error has occurred. For example:
TraceOneMethodOfClass: com.bank.CheckingAccount cancelCheck MethodCalledErrorReporter "CustomerAccount:Canceled Checks Per Interval"
This directive specifies that whenever the cancelCheck() method is called (for any reason), this is an error. The error message simply states the class and method that was called.
If you do not know which methods may throw an exception or error, try using the ThisErrorReporter tracer.
ThisErrorReporter
The ThisErrorReporter tracer is similar to the MethodCalledErrorReporter, but it constructs the error message by calling toString() on the instrumented objects. This tracer is most useful to put on the constructor of an exception class. For example:
In Java:
TraceOneMethodWithParametersOfClass: ezfids.util.exception.EasyFidsException [set
the init variable for your book] ThisErrorReporter
"Exceptions|{packageandclassname}:Errors Per Interval"
Note: In order to capture error messages, the ThisErrorReporter tracer must be used with a "...WithParameters" directive.

More help
192 Java Agent Guide
The directives specify that whenever the constructor ("init" or ".ctor") of an InvalidPINException is called, this constitutes an error. The error message is determined by calling toString() on the InvalidPINException which generally returns the error message that the application developer specified.
This tracer is good to use when you have a custom error management system based on your own exception types.
Note: Introscope cannot instrument any code in the java.* packages so placing this tracer on java.lang.Exception or java.sql.SQLException will not work.
HTTPErrorCodeReporter
The HTTPErrorCodeTracer tracer reports error codes from Servlets and JSPs. It is a per interval counter that counts incidents of:
■ HTTP response codes 400 or higher.
■ javax.servlet.http.HttpServletResponse subclass invocations of sendError or setStatus, for codes 400 or higher in Java environments.
See errors.pbd for example usage.
Using error tracer directives with caution
Be judicious in using the tracers described in the previous sections. The best practice is to incur the overhead associated with error tracing to report only the most serious problems, such as unrecoverable problems arising from backend systems.
The default errors.pbd is designed to report serious errors, while minimizing overhead as much as possible. Overuse of error tracing, for instance, applying ExceptionErrorReporter to every monitored method can result in a high volume of "false positives." For example, if a user enters "California" in a numeric field, this may cause a NumberFormatException, which you would not want to report as a serious problem.
More help
CA Professional Services can create new directives to trace specific errors or exceptions in your environment. Contact CA Support for more information.
If you are the registered support contact for your company, you can access the support Web site directly at www.ca.com/wily/support.

Using ErrorDetector
Chapter 12: Configuring LeakHunter and ErrorDetector 193
Using ErrorDetector
For more information on how to use ErrorDetector, see the Introscope Workstation User Guide.


Chapter 13: Configuring Boundary Blame 195
Chapter 13: Configuring Boundary Blame
This section describes default Java Agent blame reporting behaviors, and related configuration options.
This section contains the following topics:
Understanding Boundary Blame (see page 195) Using URL groups (see page 196) Using Blame tracers (see page 201) Disabling Boundary Blame (see page 201)
Understanding Boundary Blame
Introscope’s Blame Technology works in a managed Java Application to enable you to view metrics at the front and backends of your application. This capability, referred to as boundary blame, allows users to triage problems to something in to one of the application’s backends.
How Introscope detects backends varies depending on the application . For database activity, Introscope uses the SQL Agent to automatically detect backends. If the SQL Agent is unavailable, Introscope will likely still detect backend activity because backends such as client/server databases, JMS servers, and LDAP servers are accessed through a socket. If you have Oracle backends and do not use the Introscope SQL Agent, see Boundary Blame and Oracle backends (see page 146).
For information about how boundary blame is presented in the Introscope Investigator, see the Introscope Workstation User Guide.

Using URL groups
196 Java Agent Guide
Using URL groups
You can use URL Groups to monitor browser response time for sets of requests whose path prefix begins with a string you define. The path prefix is the portion of the URL that follows the hostname. For example, in this URL:
http://burger1.com/testWar/burgerServlet?ViewItem&category=
11776&item=5550662630&rd=1
the path prefix is:
/testWar
You can define a URL group for any useful category of requests that can be derived from a URL’s path prefix. For example, depending on the form of your application URLs, you could define URL groups for each customer your application supports, for each major application, or for sub-applications. This enables you to monitor performance in the context of committed service levels, or for mission-critical portions of your application.
Example: How URL group properties are defined
The following example is an excerpt from a Java Agent profile, showing how URL Groups are defined:
introscope.agent.urlgroup.keys=alpha,beta,gamma
introscope.agent.urlgroup.group.alpha.pathprefix=/testWar
introscope.agent.urlgroup.group.alpha.format=foo {host} bar {protocol} baz {port}
quux {query_param:foo} red {path_substring:2:5} yellow {path_delimited:/:0:1} green
{path_delimited:/:1:4} blue {path_substring:0:0}
introscope.agent.urlgroup.group.beta.pathprefix=/nofilterWar
introscope.agent.urlgroup.group.beta.format=nofilter foo {host} bar {protocol} baz
{port} quux {query_param:foo} red {path_substring:2:5} yellow {path_delimited:/:0:1}
green {path_delimited:/:1:4} blue {path_substring:0:0}
introscope.agent.urlgroup.group.gamma.pathprefix=/examplesWebApp
introscope.agent.urlgroup.group.gamma.format=Examples Web App
Defining keys for URL groups
The property introscope.agent.urlgroup.keys defines a list of the IDs, or keys, of all of your URL Groups. The key for a URL Group is referenced in other property definitions that declare an attribute of the URL group. The following example defines the keys for three URL Groups:
introscope.agent.urlgroup.keys=alpha,beta,gamma
If you define URL Groups so some URLs fall into multiple groups, the order in which you list the keys for the URL Groups in the property is important. The URL Group with the narrower membership should precede the URL Group with broader membership. For example, if the IP Group with key alpha has the path prefix /examplesWebApp and the URL Group with key delta has the path prefix /examplesWebApp/cleverones, delta should precede alpha in the keys parameter
Using URL groups
Chapter 13: Configuring Boundary Blame 197
Defining membership of each URL group
The property introscope.agent.urlgroup.group.groupKey.pathprefix specifies a pattern against which the path prefix of a URL is matched, defining which requests fall within the URL Group.
Example: Mapping a group key to a URL path prefix
This property definition assigns all requests in which the path portion of the URL starts with /testWar to the URL Group whose key is alpha:
introscope.agent.urlgroup.group.alpha.pathprefix=/testWar
Requests that match the specified pathprefix include:
http://burger1.com/testWar/burgerServlet?ViewItem&category=
11776&item=5550662630&rd=1
http://burger1.com/testWar/burgerServlet?Command=Order&item=5550662630
Example: Creating URL groups by application path
A company that provides call center services could monitor response time for functional areas by setting up a URL Group for each application function. If customers access services with this URL:
http://genesystems/us/application_function/
where application_function corresponds to applications such as OrderEntry, AcctService, and Support, the pathprefix property for each URL group would specify the appropriate application_function.
Note: You can use the asterisk symbol (*) as a wildcard in pathprefix properties.
Define the name for a URL group
The property introscope.agent.urlgroup.group.groupKey.format determines the names under which response time metrics for a URL group whose key is groupKey appear in the Introscope Workstation.
Typically, the format property is used to assign a text string as the name for a URL. The following example causes metrics for the URL Group with key alpha to appear in the Workstation under the name Alpha Group:
introscope.agent.urlgroup.group.alpha.format=Alpha Group

Using URL groups
198 Java Agent Guide
Advanced naming techniques for URL groups (optional)
You can derive a URL Group name from request elements such as the server port, the protocol, or from a substring of the request URL. This is useful if your application modules are easily differentiated by inspecting the request. This section describes advanced forms of the format property.
Using host as a URL group name
To organize metrics for a URL group under names that reflect the hostname of the HTTP server associated with requests, define the format parameter like this:
introscope.agent.urlgroup.group.alpha.format={host}
When format={host}, statistics for these requests would appear under the metric names us.mybank.com and uk.mybank.com respectively:
https://us.mybank.com/mifi/loanApp......
https://uk.mybank.com/mifi/loanApp.....
Using protocol as a URL group name
To organize statistics for a URL group under names that reflect the protocol associated with requests, define the format parameter like this:
introscope.agent.urlgroup.group.alpha.format={protocol}
When format={protocol} statistics are grouped in the Investigator under metric names that correspond to the protocol portion of request URLs. For example, statistics for these requests would appear under the metric name https:
https://us.mybank.com/cgi-bin/mifi/scripts......
https://uk.mybank.com/cgi-bin/mifi/scripts......
Using URL groups
Chapter 13: Configuring Boundary Blame 199
Using port as a URL group name
To organize statistics for a URL group under names that reflect the port associated with requests, define the format parameter like this:
introscope.agent.urlgroup.group.alpha.format={port}
When format={port}, statistics are grouped under names that correspond to the port portion of request URLs. For example, statistics for these requests would appear under the name 9001.
https://us.mybank.com:9001/cgi-bin/mifi/scripts......
https://uk.mybank.com:9001/cgi-bin/mifi/scripts......
Using parameter as a URL group name
To organize statistics for a URL group in Investigator under metric names that reflect the value of a parameter associated with requests, define the format parameter like this:
introscope.agent.urlgroup.group.alpha.format={query_param:param}
When format={query_param:param} statistics are grouped in Investigator under metric names that correspond to value of the parameter specified. Requests without parameters are listed under <empty>. For example, given this parameter definition:
introscope.agent.urlgroup.group.alpha.format=
{query_param:category}
Statistics for these requests would appear under the metric name "734"
http://ubuy.com/ws/shoppingServlet?ViewItem&category=734
&item=3772&tc=photo
http://ubuy.com/ws/shoppingServlet?ViewItem&category=734
&item=8574&tc=photo
Using a substring of the request path as a URL group name
To organize statistics for a URL group under names that reflect a substring of the path portion of request URLs, define the format parameter like this:
introscope.agent.urlgroup.group.alpha.format=
{path_substring:m:n}
where m is the index of the first character, and n is one greater than the index of the last character. String selection operates like the java.lang.String.substring() method. For example, given this setting:
introscope.agent.urlgroup.group.alpha.format=
{path_substring:0:3}
Statistics for the following request would appear under the metric node /ht:
http://research.com/htmldocu/WebL-12.html

Using URL groups
200 Java Agent Guide
Using a delimited portion of the request path as a URL group name
To organize statistics for a URL group under names that reflect a character-delimited portion request URL path, define the format parameter like this:
introscope.agent.urlgroup.group.alpha.format=
{path_delimited:delim_char:m:n}
where delim_char is the character that delimits the segments in the path, m is the index of the first segment to select, and n is one greater than the index of the last segment to select. For example, given this setting:
introscope.agent.urlgroup.group.alpha.format={path_delimited:/:2:4}
statistics for the requests of this form:
http://www.buyitall.com/userid,sessionid/pageid
would appear under the metric name /pageid
Note that:
■ a delimiter character, in this example, the forward slash (/) counts as a segment
■ the segment count starts at 0
The segments as delimited by the slash character in the URL example are:
0=/, 1=userid,sessionid, 2=/, and 3=pageid
You can specify multiple delimiters as necessary. For example, given this setting:
introscope.agent.urlgroup.group.alpha.format={path_delimited:/,:3:4}
statistics for requests of the form shown above would appear under the metric name sessionid with he segments as delimited by the slash and the comma in the URL example are:
0=/, 1=userid, 2=, 3=sessionid, 4=/, and 5=pageid
Using multiple naming methods for URL groups
You can combine multiple naming methods in a single format string, as shown below:
introscope.agent.urlgroup.group.alpha.format=red {host} orange {protocol} yellow
{port} green {query_param:foo} blue {path_substring:2:5} indigo
{path_delimited:/:0:1} violet {path_delimited:/:1:4} ultraviolet
{path_substring:0:0} friend computer
Using Blame tracers
Chapter 13: Configuring Boundary Blame 201
Running the URLGrouper
URLGrouper is a command-line utility that analyzes a web server log file in Common format. Using URLGrouper gives you a starting point for defining your own URL Groups.
Note: You can use the URLGRouper utility to analyze your Web server log file. URLGrouper outputs a set of property settings for potential URL Groups, based on the contents of the Web server log file. The asterisk symbol (*) can be used with URLGrouper as a wildcard.
To run URLGrouper:
1. Open a command shell.
2. Enter this command
java -jar urlgrouper.jar logfile
where logfile is the full path to your web server log file.
3. Property definitions for a set of URL Groups are output to STDOUT.
4. To configure the proposed URL Groups, copy the property statements produced by URL Grouper into the IntroscopeAgent.profile.
Using Blame tracers
You can use tracers to explicitly mark the frontends and backends in your application. For more information, see Using Blame Tracers to mark blame points (see page 143).
Disabling Boundary Blame
By default, Boundary Blame is enabled. To disable boundary blame in favor of the component-level blame implemented in Introscope versions earlier than 7.0, use the introscope.agent.blame.type (see page 272) property described in introscope.agent.blame.type.


Chapter 14: Configuring Transaction Trace Options 203
Chapter 14: Configuring Transaction Trace Options
This section has information about default Transaction Tracing behaviors and related configuration options.
This section contains the following topics:
Controlling automatic Transaction Tracing behavior (see page 203) Configuring cross-process Transaction Tracing (see page 205) Extending transaction trace data collection (see page 205) Disabling the capture of stalls as Events (see page 208)
Controlling automatic Transaction Tracing behavior
Automatic Transaction Tracing enables historical analysis of potentially problematic transaction types without explicitly running Transaction Traces. Introscope offers two types of automatic Transaction Tracing:
■ Transaction Trace sampling that is enabled by default, based on your URL groupings
■ Configurable automatic trace sampling that gathers trace information regardless of URL groupings
Transaction Trace component clamp
Introscope now sets a clamp (set by default to 5,000 components) to limit the size of traces. When this limit is reached, warnings appear in the log, and the trace stops.
This allows you to clamp a component heavy transaction the grows beyond expected component counts—for example when a servlet executes hundreds of object interactions and backend SQL calls. Without the clamp, Transaction Tracer views this as one transaction, continuing infinitely. Without a clamp in place in certain extreme situations, the JVM can run out of memory before the trace completes.
The property for clamping transactions is located in the IntroscopeAgent.profile file:
■ introscope.agent.transactiontrace.componentCountClamp=5000

Controlling automatic Transaction Tracing behavior
204 Java Agent Guide
For traces producing clamped components—those exceeding the CountClamp—traces are marked with an asterisk and have a tool tip assiociated with them that provides more information about the clamped metrics. For more information about viewing these traces, see the Introscope Workstation User Guide.
Warning: If the Transaction Trace component clamp size is increased, the memory required for Transaction Traces may increase. In rare instances, the maximum heap size for the JVM may need to be adjusted accordingly, or else the managed application may run out of memory. See the Introscope Configuration and Administration Guide for more information.
Transaction trace sampling
Transaction trace sampling is enabled by default. As appropriate you can disable this behavior. For more information on Transaction Trace properties, see Transaction tracing (see page 326).
When you configure automatic trace sampling, you specify the number of transactions to trace, during a time interval you specify.
Note: These properties are located in the Enterprise Manager properties file. Before changing the defaults for the sampling.perinterval and sampling.interval properties, consider the potential for increased load in the Enterprise Manager with higher sampling rates. The Enterprise Manager will push this configuration to all agents connected to it. You can also configure these properties in an agent. Configuring these properties in the agent will overwrite the configuration set by the Enterprise Manager for an individual agent.
To configure automatic trace sampling, modify these properties:
■ introscope.agent.transactiontracer.sampling.enabled
Set to false to disable Transaction Trace sampling. The default value is true.
■ introscope.agent.transactiontracer.sampling.perinterval.count
Specifies the number of transactions to trace, during the interval you specify.
The default number of transactions is 1.
■ introscope.agent.transactiontracer.sampling.interval.seconds
Specifies the length of time to trace the number of transactions you specify.
The default interval is every 2 minutes.

Configuring cross-process Transaction Tracing
Chapter 14: Configuring Transaction Trace Options 205
Agent heap sizing
The agent uses Java heap memory to store collected data. If your application’s heap is highly utilized, you may need to increase the heap allocation when you install the agent. For example, the 8.0 agent, on average, uses slightly more memory than the 7.x agent because of performance improvements to CPU and response times overhead. You may see an increase of up to 100 MB over your 7.x average runtime heap usage.
If monitored applications are characterized by very deep or long lasting transactions, the agent’s Transaction Trace sampling may require more heap memory than previous Introscope versions. For more information, see Transaction Trace component clamp (see page 203) and Transaction trace sampling (see page 204).
You can view the agent CG heap usage in the CG Heap overview. See the Introscope Workstation User Guide.
If you are operating a high-performance Introscope environment, contact CA Professional Services for the appropriate agent JVM heap settings.
Configuring cross-process Transaction Tracing
The Introscope Java Agent can trace transactions that cross JVM boundaries on WebLogic Server 9 or later, or WebSphere 6.1—if the environment is comprised of compatible versions of the same vendor’s application server.
Cross-process transaction tracing is supported for synchronous transactions, for instance servlets to EJBs, as well as asynchronous transactions. For more information about cross-process transaction tracing, see:
■ Cross-process Transaction Tracing in WebLogic (see page 83)
■ Cross-process Transaction Tracing in WebSphere (see page 99)
Important: Cross-process transaction tracing is available only with Introscope 9.0 agents. Cross-process transaction tracing does not function between 9.0 and pre-9.0 agents.
Extending transaction trace data collection
cts basic Transaction Trace data such as Domain/Host/Process/Agent, timestamp, duration, URL, and so forth, by default.
You can configure the Introscope Transaction Tracer to obtain additional information, including User ID data for Servlet and JSP invocations, and other transaction trace data such as HTTP request headers, request parameters, and session attributes. To capture this information, you must define the criteria in the IntroscopeAgent.profile.
Extending transaction trace data collection
206 Java Agent Guide
About User ID data
To configure the Java Agent to identify User IDs for Servlet and JSP invocations, you must first obtain information on how your managed application specifies user IDs. The Application Architect who developed the managed application can probably provide this information.
Introscope Transaction Tracer can identify User IDs from managed applications that store User IDs in one of these ways:
■ HttpServletRequest.getRemoteUser()
■ HttpServletRequest.getHeader (String key)
■ HttpSession.getValue (String key), where returned object is either a String representing the UserID, or an Object whose toString() returns to the UserID
If your managed application stores User IDs using one of these methods, see Configuring Agent to collect additional transaction trace data (see page 207), to configure Java Agent settings to collect User ID data.
About servlet request data
Using Introscope, you can collect transaction trace data that matches user-configurable parameters. For example, you can specify the Introscope Agent to collect transaction trace data for transactions that contain the User-Agent HTTP request header.
Introscope can record this servlet request information:
■ request headers
■ request parameters
■ session attributes
To record this servlet request information for your managed application, see Configuring Agent to collect additional transaction trace data (see page 207) to configure Java Agent settings to collect this data.

Extending transaction trace data collection
Chapter 14: Configuring Transaction Trace Options 207
Configuring Agent to collect additional transaction trace data
You can configure the Java Agent to collect additional transaction trace data such as User ID, HTTP request headers, HTTP request parameters, or HTTP session attributes.
To configure the Java Agent to collect additional transaction trace data:
1. Open the agent profile, IntroscopeAgent.profile.
2. Locate the Transaction Tracer properties under the Transaction Tracer Configuration heading.
Collecting user id data
To configure the Java Agent to identify User IDs
■ Configure the properties that correspond to the method your managed application uses to store User IDs.
Note: Ensure that only one set of properties are not commented, or the wrong properties might be used.
■ For HttpServletRequest.getRemoteUser(), uncomment the property:
introscope.agent.transactiontracer.userid.method=HttpServletRequest.getRe
moteUser
■ For HttpServletRequest.getHeader (String key), uncomment the following pair of properties, and define a key string for the second property:
introscope.agent.transactiontracer.userid.method=HttpServletRequest.getHe
ader
introscope.agent.transactiontracer.userid.key=<application defined key
string>
■ For HttpSession.getValue (String key), uncomment the following pair of properties, and define a key string for the second property:
introscope.agent.transactiontracer.userid.method=HttpServletRequest.getVa
lue
introscope.agent.transactiontracer.userid.key=<application defined key
string>

Disabling the capture of stalls as Events
208 Java Agent Guide
Collecting servlet request data
To record servlet request information such as HTTP request headers and parameters:
1. To specify the HTTP request headers for which to collect transaction trace data, uncomment this property, and specify the HTTP request header(s) to track, in a comma-separated list:
#introscope.agent.transactiontracer.parameter.httprequest.headers=User-Agent
2. To specify the HTTP request parameters for which to collect transaction trace data, uncomment this property and specify the HTTP request parameter(s) to track, in a comma-separated list:
#introscope.agent.transactiontracer.parameter.httprequest.parameters=paramete
r1,parameter2
3. To specify the HTTP session attributes for which to trace data, uncomment this property and specify the HTTP session attribute(s) to track, in a comma-separated list, for example:
#introscope.agent.transactiontracer.parameter.httpsession.attributes=cartID,d
eptID
4. Restart the managed application.
Disabling the capture of stalls as Events
By default, Introscope captures transaction stalls as events in the Transaction Event database, and generates stall metrics from the detected events. Stall metrics are generated for the first and last method in the transaction. Users can view stall Events and associated metrics in the Workstation’s Historical Event Viewer.
Note: Generated stall metrics are always available, but stall events are only visible if Introscope Error Detector is installed. Stalls are stored as ordinary errors, and will be visible in the Errors TypeView, or in the historical query viewer by querying for "type:errorsnapshot".
You can disable the capture of stalls as events, change the stall threshold, or change the frequency with which the agent checks for stalls using these properties:
■ introscope.agent.stalls.thresholdseconds specifies the minimum threshold response time at which time a transaction is considered stalled.
■ introscope.agent.stalls.resolutionseconds specifies the frequency that the agent checks for stalls.
Note: By default, the introscope.agent.stalls.resolutionseconds property is set to 30 seconds. CA Technologies has had great success with this default value and recommends no change unless there is a good reason. Because of timing complications, it is generally not effective to set stall resolution below 15 seconds.

Chapter 15: Configuring the Introscope SQL Agent 209
Chapter 15: Configuring the Introscope SQL Agent
This section has instructions for configuring Introscope SQL Agent.
This section contains the following topics:
The SQL Agent overview (see page 209) The SQL Agent files (see page 210) SQL statement normalization (see page 210) Turning off statement metrics (see page 218) Turning off Blame metrics (see page 218) SQL metrics (see page 219)
The SQL Agent overview
The Introscope SQL Agent reports detailed database performance data to the Enterprise Manager. The SQL Agent provides visibility into the performance of individual SQL statements in your application by tracking the interaction between your managed application and your database.
In the same way that the Java Agent monitors applications, the SQL Agent monitors SQL statements. The SQL Agent is non-intrusive, monitoring the application or database with very low overhead.
To provide meaningful performance measurements down to the individual SQL statement level, the SQL Agent summarizes performance data by stripping out transaction-specific data and converting the original SQL statements into Introscope-specific normalized statements. Since normalized statements do not include sensitive information, such as credit card numbers, this process also protects the security of your data.
For example, the SQL Agent converts this SQL query:
SELECT * FROM BOOKS WHERE AUTHOR = 'Atwood'
to this normalized statement:
SELECT * FROM BOOKS WHERE AUTHOR = ?

The SQL Agent files
210 Java Agent Guide
Similarly, SQL Agent converts this SQL update statement:
INSERT INTO BOOKS (AUTHOR, TITLE) VALUES ('Atwood', 'The Robber Bride')
to this normalized statement:
INSERT INTO BOOKS (AUTHOR, TITLE) VALUES (?, ?)
Note: Only text within quotation marks ('xyz') is normalized.
Metrics for normalized statements are aggregated and can be viewed in the JDBC node of the Workstation Investigator.
The SQL Agent files
The SQL Agent is included in all agent installations. The files providing SQL Agent functionality are:
■ wily/ext/SQLAgent.jar
■ wily/sqlagent.pbd
Note: By default, agent extensions like the SQLAgent.jar file are installed in the wily/ext directory. You can change the location of the agent extension directory with the introscope.agent.extensions.directory property in the agent profile. If you change the location of the /ext directory, be sure to move the contents of the /ext directory as well.
SQL statement normalization
Some applications may generate an extremely large number of unique SQL statements. If technologies like EJB 3.0 are in use, the likelihood of long unique SQL statements increases. Long SQL statements can contribute to a metric explosion in the agent, leading to poor performance as well as other system problems.
How poorly written SQL statements create metric explosions
In general, the number of SQL Agent metrics should approximate the number of unique SQL statements. If your SQL Agent is showing a large and increasing number of unique SQL metrics even though your application uses a small set of SQL statements, the problem could be in how the SQL statement was written.
There are several common situations in which SQL statements can cause metric explosions.

SQL statement normalization
Chapter 15: Configuring the Introscope SQL Agent 211
Example: Comments in SQL statements
One common reason for metric explosion is caused by how comments are used in SQL statements. For example, if you have a SQL statement like this:
"/* John Doe, user ID=?, txn=? */ select * from table..."
the SQL Agent creates a metric with the comment as part of the metric name:
"/* John Doe, user ID=?, txn=? */ select * from table..."
The comment embedded in the SQL statement is useful for the database administrator to see who is executing what query and the database executing the query ignores them. The SQL Agent, however, does not parse the comment string when it captures the SQL statement. Therefore, for each unique user ID, the SQL Agent creates a unique metric, potentially causing a metric explosion.
This problem can be avoided is by putting the SQL comment in single quotes, as shown:
"/*' John Doe, user ID=?, txn=? '*/ select * from table..."
The SQL Agent then creates the following metric where the comment no longer causes a unique metric name:
"/* ? */ select * from table..."
Example: Temporary tables or automatically generated table names
Another potential cause of metric explosion can be the result of applications that reference temporary tables or tables that have automatically generated names in SQL statements. For example, if you open the Investigator to view the metrics under Backends|{backendName}|SQL|{sqlType}|sql. you might see a metric similar to this:
SELECT * FROM TMP_123981398210381920912 WHERE ROW_ID = ?
This SQL statement is accessing a temporary table that has a unique identifier appended to the table name. The additional digits that are appended to the TMP_ table name create a unique metric name each time the statement is executed, causing a metric explosion.

SQL statement normalization
212 Java Agent Guide
Example: Statements that generate lists of values or insert values
Another common cause of metric explosion are SQL statements that generate lists of values or do mass modification of values. For example, assume tou have been alerted to a potential metric explosion and your investigation brings you to a review of this SQL statement:
#1 INSERT INTO COMMENTS (COMMENT_ID, CARD_ID, CMMT_TYPE_ID,
CMMT_STATUS_ID,CMMT_CATEGORY_ID, LOCATION_ID, CMMT_LIST_ID, COMMENTS_DSC,
USER_ID,LAST_UPDATE_TS) VALUES (?, ?, ?, ?, ?, ?, ?, "CHANGE CITY FROM CARROLTON,TO
CAROLTON, _ ", ?, CURRENT)
In studying the code, you notice that "CHANGE CITY FROM CARROLTON, TO CAROLTON, _ " recurs as a dizzying array of cities.
Similarly, if you are investigating a potential metric explosion, you might review a SQL statement similar to this:
CHANGE COUNTRY FROM US TO CA _ CHANGE EMAIL ADDRESS FROM TO BRIGGIN @ COM _ "
In studying the code, you notice CHANGE COUNTRY results in a long list of countries. In addition, the placement of the quotes for countries results in people's e-mail addresses getting inserted into SQL statements, creating unique metrics that could be the source of the metric explosion.
SQL statement normalization options
To address long SQL statements, the SQL Agent includes the following normalizers for use:
■ Default SQL statement normalizer (see page 212)
■ Custom SQL statement normalizer (see page 213)
■ Regular expression SQL statement normalizer (see page 214)
■ Command-line SQL statement normalizer (see page 218)
Default SQL statement normalizer
The standard SQL statement normalizer is on by default in the SQL Agent. It normalizes text within single quotation marks ('xyz'). For example, the SQL Agent converts this SQL query:
SELECT * FROM BOOKS WHERE AUTHOR = 'Atwood'
to this normalized statement:
SELECT * FROM BOOKS WHERE AUTHOR = ?
Metrics for normalized statements are aggregated and can be viewed in the Workstation Investigator.

SQL statement normalization
Chapter 15: Configuring the Introscope SQL Agent 213
Custom SQL statement normalizer
The SQL Agent allows users to add extensions for performing custom normalization. To do so, you create a JAR file containing a normalization scheme that is implemented by the SQL Agent.
To apply a SQL statement normalizer extension:
1. Create an extension JAR file.
Note: The entry point class for the SQL normalizer extension file has to implement com.wily.introscope.agent.trace.ISqlNormalizer interface.
Making a JAR extension file involves creating a manifest file that contains specific keys for the SQL normalizer extension, which are detailed in step 2 below. However, for your extension to work, other general keys are required. These keys are the type you would use to construct any extension file. The extension file you create relates to database SQL statement text normalization, for example metrics under the Backends|{backendName}|SQL|{sqlType}|{actualSQLStatement} node. The {actualSQLStatement} is normalized by the SQL normalizer.
2. Place the following keys in the manifest of the created extension:
■ com-wily-Extension-Plugins-List:testNormalizer1
Note: The value of this key can be anything. In this instance, testNormalizer1 is used as an example. Whatever you specify as the value of this key, use it in the following keys as well.
■ com-wily-Extension-Plugin-testNormalizer1-Type: sqlnormalizer
■ com-wily-Extension-Plugin-testNormalizer1-Version: 1
■ com-wily-Extension-Plugin-testNormalizer1-Name: normalizer1
Should contain the unique name of your normalizer, for example normalizer1.
■ com-wily-Extension-Plugin-testNormalizer1-Entry-Point-Class: <Thefully-qualified classname of your implementation of ISQLNormalizer>
3. Place the extension file you created in the <Agent_Home>/wily/ext directory.
4. In the IntroscopeAgent.profile, locate and set the following property:
introscope.agent.sqlagent.normalizer.extension
Set the property to the com-wily-Extension-Plugin-{plugin}-Name from your created extension’s manifest file. The value of this property is not case sensitive. For example:
introscope.agent.sqlagent.normalizer.extension=normalizer1
Important: This is a hot property. Changes to the extension name will result in re-registration of the extension.
SQL statement normalization
214 Java Agent Guide
5. In the IntroscopeAgent.profile, you can optionally add the following property to set the error throttle count:
introscope.agent.sqlagent.normalizer.extension.errorCount
For more information about errors and exceptions, see Exceptions (see page 214).
Note: If the errors thrown by the custom normalizer extension exceeds the error throttle count, the extension is disabled.
6. Save the IntroscopeAgent.profile.
7. Restart your application.
Exceptions
If the extension you created throws an exception for one query, the default SQL statement normalizer uses the default normalization scheme for that query. When this happens, an ERROR message is logged, saying an exception was thrown by the extension, and a DEBUG message is logged with stack trace information. However, after five such exceptions are thrown, the default SQL statement normalizer disables your created extension and stops attempting to use the created extension for future queries until the normalizer is changed.
Null or empty strings
If the extension you created returns a null string or empty string for a query, the StatementNormalizer uses the default normalization scheme for that query and logs an INFO message saying the extension returned a null value. However, after five such null or empty strings have been returned, the StatementNormalizer stops logging messages, but will attempt to continue to use the extension.
Regular expression SQL statement normalizer
The SQL Agent ships with an extension that normalizes SQL statements based on configurable regular expressions (regex). This file, RegexNormalizerExtension.jar, is located in the <Agent_Home>/wily/ext directory.
For examples on how to use the regular expression SQL statement normalizer, see Regular expression SQL statement normalizer examples (see page 216).
To apply the regular expressions extension:
1. Open the IntroscopeAgent.profile.
2. Locate and set the following properties:
■ introscope.agent.sqlagent.normalizer.extension=RegexSqlNormalizer
Specifies the name of the SQL normalizer extension that will be used to override the preconfigured normalization scheme. When enabling the regular expressions extension, set this property to RegexSqlNormalizer.

SQL statement normalization
Chapter 15: Configuring the Introscope SQL Agent 215
■ introscope.agent.sqlagent.normalizer.regex.keys=key1
This property specifies the regex group keys, which are evaluated in the order they are listed. This property is required to enable the regular expressions extension. There is no default value.
■ introscope.agent.sqlagent.normalizer.regex.key1.pattern=A
This property specifies the regex pattern that is used to match against the SQL statements. All valid regular expressions allowed by the java.util.Regex package classes can be used here. This property is required to enable the regular expressions extension. There is no default value.
■ introscope.agent.sqlagent.normalizer.regex.key1.replaceFormat=B
This property specifies the replacement string format. All valid regex allowed by the java.util.Regex package classes can be used here. This property is required to enable the regular expressions extension. There is no default value.
■ introscope.agent.sqlagent.normalizer.regex.matchFallThrough=false
If this property is set to true, SQL strings are evaluated against all the regex key groups. The implementation is chained. Hence, if the SQL strings match multiple key groups, the normalized SQL output from group1 is fed as input to group2, and so on.
If the property is set to false, as soon as a key group matches the SQL string, the normalized SQL output from that group is returned. The MatchFallThrough property does not enable or disable the extension.
For example, if you had a SQL string like: Select * from A where B, you would set the following properties:
introscope.agent.sqlagent.normalizer.regex.keys=key1,key2
introscope.agent.sqlagent.normalizer.regex.key1.pattern=A
introscope.agent.sqlagent.normalizer.regex.key1.replaceFormat=X
introscope.agent.sqlagent.normalizer.regex.key2.pattern=B
introscope.agent.sqlagent.normalizer.regex.key2.replaceFormat=Y
If introscope.agent.sqlagent.normalizer.regex.matchFallThrough is false, then the SQL is normalized against key1 regex. Output from that regex will be Select * from X where B. This SQL will be returned.
If introscope.agent.sqlagent.normalizer.regex.matchFallThrough is true, then the SQL is normalized against key1 regex first. The output from that regex is Select * from X where B. This output is then fed to key2 regex. The output from key2 regex is Select * from X where Y. This will be the SQL returned.
Note: This property is not required to enable the regular expressions extension.
■ introscope.agent.sqlagent.normalizer.regex.key1.caseSensitive=false
This property specifies whether the pattern match is case sensitive. The default value is false. This property is not required to enable the regular expressions extension.

SQL statement normalization
216 Java Agent Guide
■ introscope.agent.sqlagent.normalizer.regex.key1.replaceAll=false
If this property is set to false, it will replace the first occurrence of the matching pattern in the SQL with the replacement string. If this property is set to true, it will replace all occurrences of the matching pattern in the SQL with the replacement string.
For example, if you have a SQL statement like Select * from A where A like Z, you would set the properties as follows:
introscope.agent.sqlagent.normalizer.regex.key1.pattern=A
introscope.agent.sqlagent.normalizer.regex.key1.replaceFormat=X
If introscope.agent.sqlagent.normalizer.regex.key1.replaceAl is false, it will result in a normalized SQL statement: Select * from X where A like Z.
If introscope.agent.sqlagent.normalizer.regex.key1.replaceAl is true, it will result in a normalized SQL statement: Select * from X where X like Z.
The default value is false. This property is not required to enable the regular expressions extension.
Note: If none of the regular expression patterns match the input SQL, the RegexNormalizer will return a null string. The statement normalizer will then use the default normalization scheme.
3. Save the IntroscopeAgent.profile.
Important: All properties listed above are hot, meaning changes to these properties take effect once you have saved the IntroscopeAgent.profile.
Regular expression SQL statement normalizer examples
The three examples below can help you understand how to implement the regular expression SQL statement normalizer.
Example 1
Here is a SQL query before regular expression SQL statement normalization:
INSERT INTO COMMENTS (COMMENT_ID, CARD_ID, CMMT_TYPE_ID,CMMT_STATUS_ID,
CMMT_CATEGORY_ID, LOCATION_ID, CMMT_LIST_ID,COMMENTS_DSC, USER_ID, LAST_UPDATE_TS)
VALUES(?, ?, ?, ?, ?, ?,?, ‘’CHANGE CITY FROM CARROLTON, TO CAROLTON, _ ", ?, CURRENT)
Here is the desired normalized SQL statement:
INSERT INTO COMMENTS (COMMENT_ID, ...) VALUES (?, ?, ?, ?, ?, ?,?, CHANGE CITY FROM
( )
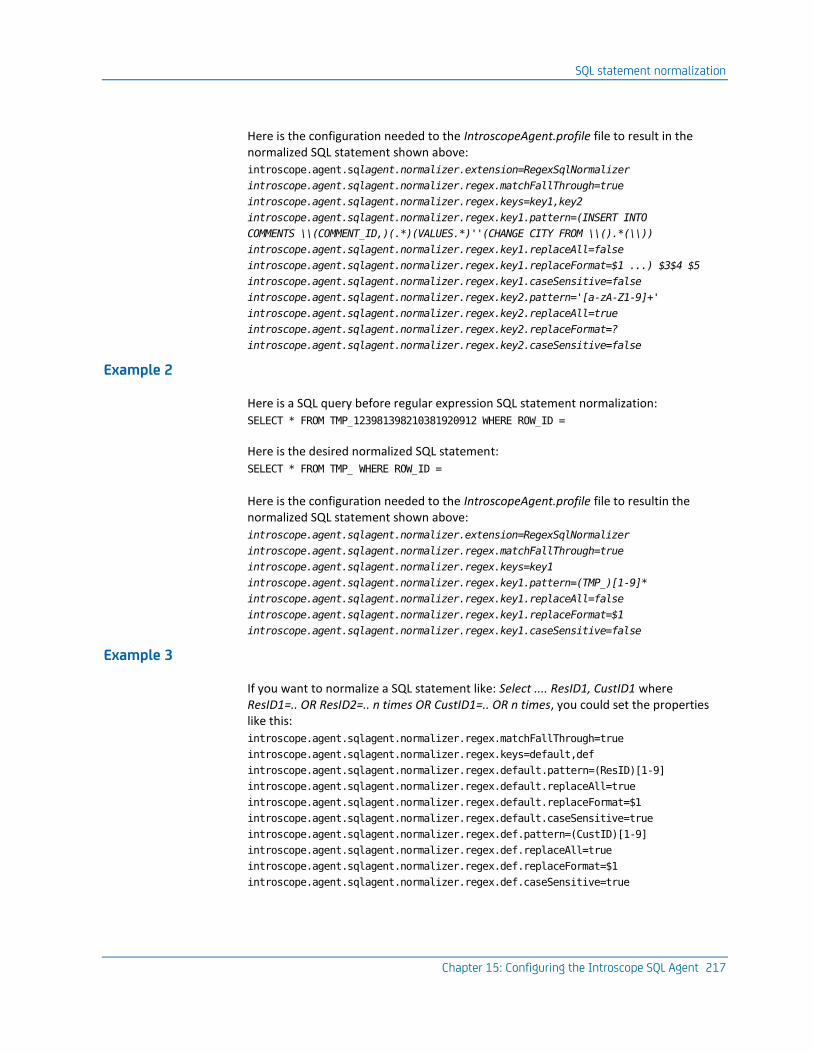
SQL statement normalization
Chapter 15: Configuring the Introscope SQL Agent 217
Here is the configuration needed to the IntroscopeAgent.profile file to result in the normalized SQL statement shown above:
introscope.agent.sqlagent.normalizer.extension=RegexSqlNormalizer
introscope.agent.sqlagent.normalizer.regex.matchFallThrough=true
introscope.agent.sqlagent.normalizer.regex.keys=key1,key2
introscope.agent.sqlagent.normalizer.regex.key1.pattern=(INSERT INTO
COMMENTS \\(COMMENT_ID,)(.*)(VALUES.*)''(CHANGE CITY FROM \\().*(\\))
introscope.agent.sqlagent.normalizer.regex.key1.replaceAll=false
introscope.agent.sqlagent.normalizer.regex.key1.replaceFormat=$1 ...) $3$4 $5
introscope.agent.sqlagent.normalizer.regex.key1.caseSensitive=false
introscope.agent.sqlagent.normalizer.regex.key2.pattern='[a-zA-Z1-9]+'
introscope.agent.sqlagent.normalizer.regex.key2.replaceAll=true
introscope.agent.sqlagent.normalizer.regex.key2.replaceFormat=?
introscope.agent.sqlagent.normalizer.regex.key2.caseSensitive=false
Example 2
Here is a SQL query before regular expression SQL statement normalization:
SELECT * FROM TMP_123981398210381920912 WHERE ROW_ID =
Here is the desired normalized SQL statement:
SELECT * FROM TMP_ WHERE ROW_ID =
Here is the configuration needed to the IntroscopeAgent.profile file to resultin the normalized SQL statement shown above:
introscope.agent.sqlagent.normalizer.extension=RegexSqlNormalizer
introscope.agent.sqlagent.normalizer.regex.matchFallThrough=true
introscope.agent.sqlagent.normalizer.regex.keys=key1
introscope.agent.sqlagent.normalizer.regex.key1.pattern=(TMP_)[1-9]*
introscope.agent.sqlagent.normalizer.regex.key1.replaceAll=false
introscope.agent.sqlagent.normalizer.regex.key1.replaceFormat=$1
introscope.agent.sqlagent.normalizer.regex.key1.caseSensitive=false
Example 3
If you want to normalize a SQL statement like: Select .... ResID1, CustID1 where ResID1=.. OR ResID2=.. n times OR CustID1=.. OR n times, you could set the properties like this:
introscope.agent.sqlagent.normalizer.regex.matchFallThrough=true
introscope.agent.sqlagent.normalizer.regex.keys=default,def
introscope.agent.sqlagent.normalizer.regex.default.pattern=(ResID)[1-9]
introscope.agent.sqlagent.normalizer.regex.default.replaceAll=true
introscope.agent.sqlagent.normalizer.regex.default.replaceFormat=$1
introscope.agent.sqlagent.normalizer.regex.default.caseSensitive=true
introscope.agent.sqlagent.normalizer.regex.def.pattern=(CustID)[1-9]
introscope.agent.sqlagent.normalizer.regex.def.replaceAll=true
introscope.agent.sqlagent.normalizer.regex.def.replaceFormat=$1
introscope.agent.sqlagent.normalizer.regex.def.caseSensitive=true

Turning off statement metrics
218 Java Agent Guide
Command-line SQL statement normalizer
If the regular expression SQL normalizer is not in use, and you have SQL statements that enclose values in the where clause with double quotes (" "), use the following command-line command to normalize your SQL statements:
-DSQLAgentNormalizeDoubleQuoteString=true
Important: You can use the regular expressions SQL normalizer instead of this command to normalize SQL statements in double quotes. See Regular expression SQL statement normalizer (see page 214) for more information.
Turning off statement metrics
Some applications may generate an extremely large number of unique SQL statements, causing a metric explosion in the SQL Agent. You can turn off SQL statement metrics in the SQL Agent.
Note: You will not lose backend or top-level JDBC metrics if you turn off statement metrics.
To turn off statement metrics:
1. Open the sqlagent.pbd file.
2. Remove {sql} from the trace directives you wish to turn off.
3. Save the sqlagent.pbd file.
Turning off Blame metrics
In a standard deployment of the SQL Agent, Blame metric data is collected by default. However, to reduce data overhead and reduce the number of metrics generated, you can turn Blame metric data off for the SQL Agent.
Note: If Blame metric generation is turned off, the SQL Agent data will not appear in Transaction Tracer viewer.
To turn off Blame metric data generation:
1. Open the IntroscopeAgent.profile.
2. Locate the property, introscope.agent.sqlagent.useblame.
3. Change the value to false:
introscope.agent.sqlagent.useblame=false
4. Save your changes to the IntroscopeAgent.profile.
5. Restart the managed application.

SQL metrics
Chapter 15: Configuring the Introscope SQL Agent 219
SQL metrics
The SQL Agent metrics appear under the Backends node in the Introscope Workstation Investigator. SQL statement metrics can be found under the Backends|<backendName>|SQL node.
Note: Average Response Time (ms) will only display queries that return a data reader, i.e. queries executed via the ExecuteReader() method. This metric represents the average time spent in the data reader’s Close() method.
Metric types specific to SQL data include:
■ Connection Count—The number of live connection objects in memory.
A connection is opened when a driver’s connect() method is invoked, and closed when the connection invocation is closed via the close() method. The SQL Agent maintains weak references to Connections in a Set. When the Connection objects are garbage collected, the counts reflect the changes.
■ Average Result Processing Time (ms)—The average processing time of a query.
This metric represents the average time spent processing a ResultSet from the end of the executeQuery() call to the invocation of the ResultSet's close() method.
Note: Instrumented XADataSources may not report commit or rollback metrics. Other instrumented DataSources may not report commit or rollback metrics unless those metrics contain data.

Chapter 16: Enabling JMX Reporting 221
Chapter 16: Enabling JMX Reporting
This section contains information about enabling the Java Agent to report JMX data.
This section contains the following topics:
Introscope Java Agent JMX support (see page 221) Default JMX metric conversion process (see page 222) Using primary key conversion to streamline JMX metrics (see page 223) Managing metric volume with JMX filters (see page 224) Configuring JMX reporting (see page 225) Enabling JSR-77 data for WAS 6.x (see page 226)
Introscope Java Agent JMX support
Introscope can collect management data that application servers or Java applications expose as JMX-compliant MBeans, and present the JMX data in the Investigator metric tree. Introscope supports the collection of JMX information on the following application servers:
■ Glassfish
■ JBoss
■ Tomcat
■ WebLogic
■ WebSphere
Introscope supports any MBean built to the Sun JMX specification. For more information on the Sun JMX specification, see Java Management Extensions.
Introscope converts the JMX data to the Introscope metric format and displays it in the Investigator under the following node:
<Domain>|<Host>|<Process>|AgentName|JMX|

Default JMX metric conversion process
222 Java Agent Guide
Introscope support for WebLogic 9.0 JMX metrics
WebLogic versions prior to WebLogic 9.0 provided only a single MBeanServer as a source of JMX metrics. WebLogic 9.0 provides three:
■ RuntimeServiceMBean: per-server runtime metrics, including active effective configuration
■ DomainRuntimeServiceMBean: domain-wide runtime metrics
■ EditServiceMBean: allows user to edit persistent configuration
Introscope polls only the RuntimeServiceMBean, because it is the only one that supports local access (an efficiency issue), and because it contains most of the data expected to be relevant.
Default JMX metric conversion process
This section describes the process Introscope uses, by default, to convert JMX Metrics for display in the Investigator. This method is used to convert an MBean if:
■ You use WebLogic 9.0, or
■ You have not configured valid primary keys, as described in Using primary key conversion to streamline JMX metrics (see page 223).
Note: If you specify primary keys that no MBeans match, Introscope will use the default conversion method.
In the default conversion method, Introscope displays both the name and the value of the attribute, and lists the pairs alphabetically in the metric tree.
Domain>|<Host>|<Process>|AgentName|JMX|<domain name>| <key1>=<value1>|<key2>=<value2>:<metric>
For example, given a WebLogic MBean with these characteristics:
■ Domain name: WebLogic
■ Key/Value pairs: category=server, type=jdbc
■ Metric names: connections
If no primary keys are specified in the IntroscopeAgent.profile property introscope.agent.jmx.name.primarykeys, the MBean attributes above would be converted to the following Introscope metric:
<Domain>|<Host>|<Process>|AgentName|JMX|Weblogic|category=server|type=jdbc:connections
Note that the key/value pairs are displayed alphabetically in the Introscope metric.
Using primary key conversion to streamline JMX metrics
Chapter 16: Enabling JMX Reporting 223
Using primary key conversion to streamline JMX metrics
You can optionally configure the order in which metrics appear under the JMX node by defining, in the agent profile, a Primary Key—those parts of an MBean’s ObjectName that uniquely identify it.
If you do not configure primary key conversion, Introscope converts the JMX data as described in Default JMX metric conversion process (see page 222). With the default conversion, metrics are listed alphabetically under the JMX node in Investigator.
This method of converting JMX data to Introscope metrics results in streamlined metric names, and allows you to control order of key/value pair information in the generated metrics.
The behavior is configured in the introscope.agent.jmx.name.primarykeys property in the agent profile. Values in the primarykeys property should specify the parts of an MBeans JMX ObjectName that uniquely identify an MBean. For example, a WebLogic MBean’s ObjectName contains a Type key that specifies the kind of MBean, and a Name key that specifies the name of the resource the MBean represents. The key/value pairs in an ObjectName can vary for different types of MBeans.
Introscope converts and presents the MBeans identified by value of the introscope.agent.jmx.name.primarykeys property according to these rules:
■ Only the key value information is displayed, not the key name.
■ Values are ordered in the sequence defined in the primarykeys property.
■ Values are case-sensitive.
For example, given a WebLogic MBean with these characteristics:
■ Domain name: WebLogic
■ MBean ObjectName key/value pairs: category=server, type=jdbc
■ Metric names: connections
If you configure:
introscope.agent.jmx.name.primarykeys=type,category the connections attribute appears in the Investigator tree in this structure:
<IntroscopeDomain>|<Host>|<Process>|AgentName|JMX|Weblogic|jdbc|server:connection
s
Note: WebLogic 9.0 does not have universally available primary keys, so for WebLogic 9.0 Introscope uses the key/value pair metric naming convention found in the Default Conversion Method described in Default JMX metric conversion process (see page 222). As a result, the JMX Metric tree for WebLogic 9.0 will have a different structure than the metric tree for other WebLogic versions.

Managing metric volume with JMX filters
224 Java Agent Guide
Managing metric volume with JMX filters
Defining JMX filters determines what JMX MBean information will be collected and displayed in Introscope. If no filters are set, all JMX MBean information will be reported by the agent to the Enterprise Manager, increasing system overhead.
Filters are set in the introscope.agent.jmx.name.filter property in the agent profile, IntroscopeAgent.profile. Filters are keywords, entered as comma-separated strings in the property. Introscope 6.1 and higher supports filter strings that contain the asterisk (*) and question mark (?) wildcard characters.
Introscope matches the filter strings to JMX-generated Introscope metrics. If it finds a match, the metrics that match are reported to Introscope.
To limit the volume of metrics returned, define filter strings as narrowly as possible. For instance, if you define a filter string that matches an MBean attribute that exists on multiple MBeans, metrics from each of those MBeans will be reported. If you are only interested in an attribute on selected MBeans, you can qualify the attribute name with the MBean name in your filter string.
For example, assume you wish to capture the MessagesCurrentCount attribute value for the JMSDestinationRuntime MBean.
If the fully qualified metric name for MessagesCurrentCount is:
*SuperDomain*|host-name|Process|Agent-name|JMX|comp-1|
JMSDestinationRuntime|comp-2:MessagesCurrentCount
define introscope.agent.jmx.name.filter in the IntroscopeAgent.profile as:
JMX|comp-1|JMSDestinationRuntime|comp-2:MessagesCurrentCount
JMX filters for WebLogic
In the IntroscopeAgent.profile file for WebLogic, the following keywords are already defined:
■ ActiveConnectionsCurrentCount
■ WaitingForConnectionCurrentCount
■ PendingRequestCurrentCount
■ ExecuteThreadCurrentIdleCount
■ OpenSessionsCurrentCount
Configuring JMX reporting
Chapter 16: Enabling JMX Reporting 225
Configuring JMX reporting
How you configure Introscope to support JMX depends upon the application server you use. This section describes how to configure Introscope to collect and present JMX data from WebLogic Server and WebSphere.
To configure JMX reporting, you must complete the following steps in this order:
1. Enable JMX support in the agent profile.
2. Define primary keys for JMX data conversion.
3. Define JMX filters.
4. Configure startup class or service.
Enable JMX support in the agent profile
1. Shut down the managed application if it is running.
2. For WebSphere agents only, in IntroscopeAgent.profile set introscope.agent.jmx.enable to true. (The default value is false in the WebSphere agent profile.)
Define primary keys for JMX data conversion
1. In IntroscopeAgent.profile, configure primary keys.
■ For WebLogic 9.0, comment out:
introscope.agent.jmx.name.primarykeys
■ For other WebLogic versions, uncomment:
introscope.agent.jmx.name.primarykeys
2. If you modify the value of the property, values must be case-sensitive, and multiple keys must be separated by commas.
3. Continue to the next step, Define JMX filters.
Define JMX filters
1. In IntroscopeAgent.profile, make sure the introscope.agent.jmx.name.filter property is uncommented.
2. Enter desired strings, separated by commas, in the property.
In order for Introscope to properly match filtered strings, the strings must be spelled exactly and case sensitive.
3. Save changes.
4. Restart the managed application.

Enabling JSR-77 data for WAS 6.x
226 Java Agent Guide
Configure startup class or service
■ To enable JMX data, you must configure an Introscope startup class in WebLogic Server, or a custom service in WebSphere. For instructions, see Configuring a startup class for WebLogic 9.0 or higher (see page 78), or Configuring a custom service in WebSphere 6.1 (see page 92).
Enabling JSR-77 data for WAS 6.x
This section provides instructions for configuring Introscope to collect, retain, and report metrics for JSR-77 JMX MBean objects under WebSphere 6.1 and later.
JSR-77, the J2EE Management Specification, abstracts the manageable parts of the J2EE architecture and defines an interface for accessing management information.
JSR-77 support requires a JVM version 1.4 or later. If the JVM is 1.4, the application server must also support JSR-77.
To enable JSR-77 support:
1. Shut down the managed application if it is running.
2. Configure a WebSphere Custom Service, as described in Configuring a custom service in WebSphere 6.1 (see page 92).
3. In the IntroscopeAgent.profile, verify that:
introscope.agent.jmx.enable=true
4. In the IntroscopeAgent.profile, enable JSR-77 by setting:
introscope.agent.jmx.name.jsr77.disable=false
5. Configure the primary keys method of metric conversion by uncommenting this property in the IntroscopeAgent.profile:
introscope.agent.jmx.name.primaryKeys=J2EEServer,Application,
j2eeType,JDBCProvider,name,mbeanIdentifier
Note: Only the IntroscopeAgent.profile provided with Introscope for WebSphere contains this property definition.
For more information see Using primary key conversion to streamline JMX metrics (see page 223).

Enabling JSR-77 data for WAS 6.x
Chapter 16: Enabling JMX Reporting 227
6. To specify the JSR-77 Metrics to report, uncomment and set this property to identify desired metrics:
introscope.agent.jmx.name.filter
Although filtering is not required, it is highly recommended. For more information see Managing metric volume with JMX filters (see page 224).
7. To specify specific Mbean attributes to exclude in JSR-77 metrics, uncomment this property, and update as desired to exclude additional attributes:
introscope.agent.jmx.ignore.attributes=server


Chapter 17: Configuring Platform Monitoring 229
Chapter 17: Configuring Platform Monitoring
This section has instructions for configuring Introscope Platform Monitors.
This section contains the following topics:
Understanding platform monitors (see page 229) Enabling platform monitors on Windows Server 2003 (see page 231) Enabling platform monitors on AIX (see page 231) Disabling platform monitors (see page 232) Troubleshooting platform monitoring (see page 234)
Understanding platform monitors
Platform monitors enable the Java Agent to report system metrics, including CPU statistics, to the Enterprise Manager. Platform monitors are included with the Introscope Agent installers.
Platform monitors on all operating systems except Windows Server 2003 and AIX are automatically enabled upon Java Agent installation. Windows Server 2003 and AIX platform monitors require minimal configuration to work.
Note: Platform monitor binaries are independent of application server and operating system bit modes. Also, platform monitor binaries are purely dependent on JVM architecture.
Introscope can monitor CPU usage on these operating systems:
■ Solaris
Important: Platform monitoring is not supported on 64 bit Solaris using 64 bit BEA JRockit JVM.
■ Windows Server 2003
■ Windows 2000 Professional/Server/Advanced Server/Datacenter Server
■ Windows XP Professional
Important: Introscope does not monitor platform monitors on 64-bit Windows XP Professional.
Understanding platform monitors
230 Java Agent Guide
■ AIX 4.0, 5.0, or 6.0
Important: AIX 5.3 64 bit Platform Monitor binaries work only on AIX machines which have Technology Level equal or greater than TL6 (5300-06). You should ensure that your AIX machine is no less than TL6.
■ RedHat 3.0, 4.0, or 5.0
■ SUSE Linux 9.0, or 10.0
■ HP-UX
Note: HP-UX Platform Monitor binaries (both PA-RISC and IA 64) work on 32 bit kernel with 32 bit JVM.
HP-UX Platform Monitor binaries (both PA-RISC and IA 64) work on 64 bit kernel with 32 bit JVM. (HP-UX binaries support 64 bit OS but not 64 bit JVM).
The Java Agent platform monitor for HP-UX reports the percentage use of CPUs when more than one process is present. For example, if you have 4 processes, the maximum use of the CPU would be 400% (4 processes using 100% of the CPU). If one process takes 110%, this means it is using 1.1 CPUs.
The following JVMs are supported by platform monitors:
■ Sun JVM
■ HP Hotspot JVM
■ IBM JVM (Both Classic and J9)
■ BEA JRocket JVM
Note: 32-bit Platform Monitor binaries can be installed on a 64-bit machine, provided a 32-bit JVM is installed.
The platform metrics generated are:
■ ProcessID
■ Processor Count - the number of CPUs
■ Utilization % (process) - for the Java Agent process, the percentage of total capacity of all processors this process is using. Regardless of how many processors there are, this metric generates only one number.
■ Utilization % (aggregate) - for this processor, its total utilization (as a percentage) by all processes in the system. Each processor is shown as a Resource in the Investigator tree.
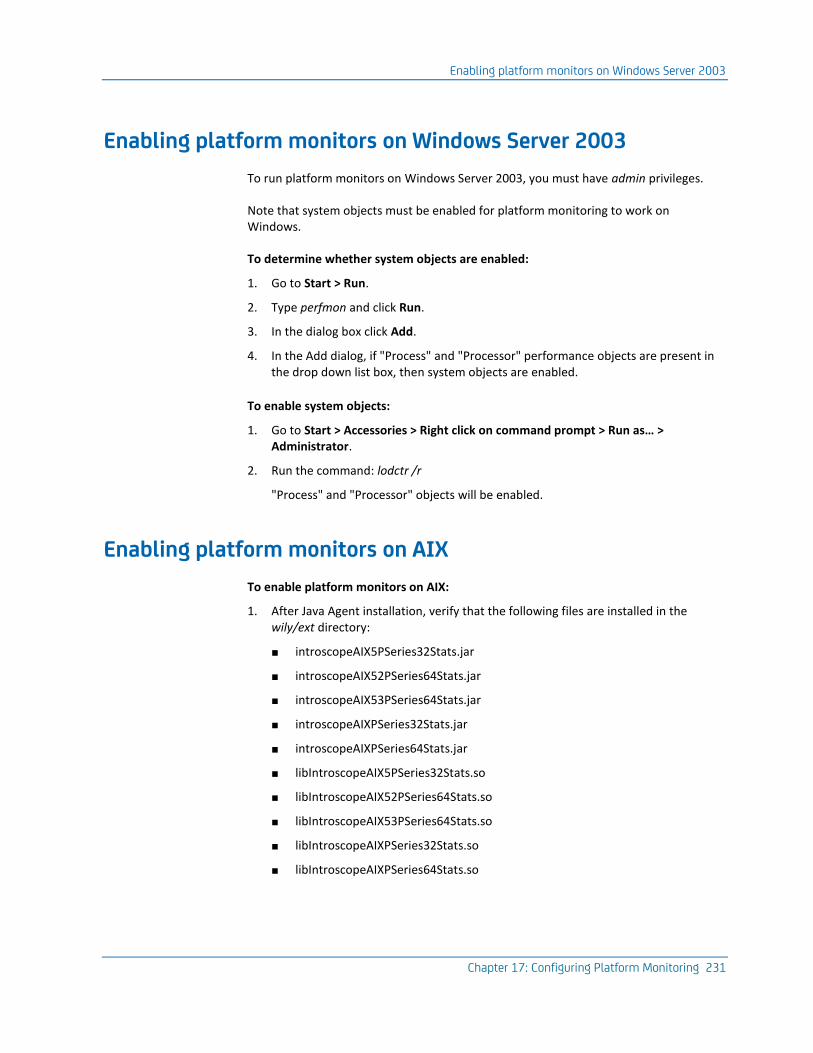
Enabling platform monitors on Windows Server 2003
Chapter 17: Configuring Platform Monitoring 231
Enabling platform monitors on Windows Server 2003
To run platform monitors on Windows Server 2003, you must have admin privileges.
Note that system objects must be enabled for platform monitoring to work on Windows.
To determine whether system objects are enabled:
1. Go to Start > Run.
2. Type perfmon and click Run.
3. In the dialog box click Add.
4. In the Add dialog, if "Process" and "Processor" performance objects are present in the drop down list box, then system objects are enabled.
To enable system objects:
1. Go to Start > Accessories > Right click on command prompt > Run as… > Administrator.
2. Run the command: lodctr /r
"Process" and "Processor" objects will be enabled.
Enabling platform monitors on AIX
To enable platform monitors on AIX:
1. After Java Agent installation, verify that the following files are installed in the wily/ext directory:
■ introscopeAIX5PSeries32Stats.jar
■ introscopeAIX52PSeries64Stats.jar
■ introscopeAIX53PSeries64Stats.jar
■ introscopeAIXPSeries32Stats.jar
■ introscopeAIXPSeries64Stats.jar
■ libIntroscopeAIX5PSeries32Stats.so
■ libIntroscopeAIX52PSeries64Stats.so
■ libIntroscopeAIX53PSeries64Stats.so
■ libIntroscopeAIXPSeries32Stats.so
■ libIntroscopeAIXPSeries64Stats.so

Disabling platform monitors
232 Java Agent Guide
2. Install the Perfstat Library.
■ AIX 4.3.3 and higher: A Perfstat Library has been created to work with AIX 4.3.3. Install the following packages from the IBM FTP site:
■ bos.perf.libperfstat
■ bos.perf.perfstat
■ AIX 4: Bring your system up to 4.3.3 and then install the above packages.
3. Restart your machine to ensure the patches have taken effect.
Disabling platform monitors
To disable platform monitors on any platform, move the .jar file from the /wily/ext directory to another directory.
This table shows the location of platform monitor files installed with a Java Agent installer. All files listed below are located in the <Agent_Home>wily/ext/ directory.
Solaris
The platform monitor files are:
■ introscopeSolarisAmd32Stats.jar
■ introscopeSolarisAmd64Stats.jar
■ introscopeSolarisSparc32Stats.jar
■ introscopeSolarisSparc64Stats.jar
■ libIntroscopeSolarisAmd32Stats.so
■ libIntroscopeSolarisAmd64Stats.so
■ libIntroscopeSolarisSparc32Stats.so
■ libIntroscopeSolarisSparc64Stats.so
Windows Server 2003, Windows 2000 (all), and XP Professional
The platform monitor files are:
■ introscopeWindowsIntelAmd32Stats.dll
■ introscopeWindowsIntelAmd64Stats.dll
■ introscopeWindowsIntelAmd32Stats.jar
■ introscopeWindowsIntelAmd64Stats.jar

Disabling platform monitors
Chapter 17: Configuring Platform Monitoring 233
AIX
The platform monitor files are:
■ introscopeAIX5PSeries32Stats.jar
■ introscopeAIX52PSeries64Stats.jar
■ introscopeAIX53PSeries64Stats.jar
■ introscopeAIXPSeries32Stats.jar
■ introscopeAIXPSeries64Stats.jar
■ libIntroscopeAIX5PSeries32Stats.so
■ libIntroscopeAIX52PSeries64Stats.so
■ libIntroscopeAIX53PSeries64Stats.so
■ libIntroscopeAIXPSeries32Stats.so
■ libIntroscopeAIXPSeries64Stats.so
RedHat Enterprise Linux
The platform monitor files are:
■ introscopeRedHatStats.jar
■ libIntroscopeRedHatStats.so
Linux
The platform monitor files are:
■ introscopeLinuxIntelAmd32Stats.jar
■ introscopeLinuxIntelAmd64Stats.jar
■ libIntroscopeLinuxIntelAmd32Stats.so
■ libIntroscopeLinuxIntelAmd64Stats.so
HP-UX
The platform monitor files are:
■ introscopeHpuxItaniumStats.jar
■ introscopeHpuxParisc32Stats.jar
■ introscopeHpuxItanium64Stats.jar
■ libIntroscopeHpuxItaniumStats.so
■ libIntroscopeHpuxParisc32Stats.so
■ libIntroscopeHpuxItanium64Stats.so

Troubleshooting platform monitoring
234 Java Agent Guide
Troubleshooting platform monitoring
In most cases, the platform monitor successfully detects the operating system and runs if the operating system is supported. In rare cases where this does not occur, you can explicitly specify your operating system in the Java Agent profile to ensure that the platform monitor runs.
To specify your operating system in the IntroscopeAgent.profile:
1. Open IntroscopeAgent.profile.
2. Under the Platform Monitor Configuration heading, locate the exact matching value for your operating system and uncomment the property. The available values are:
#introscope.agent.platform.monitor.system=SolarisAmd32
#introscope.agent.platform.monitor.system=SolarisAmd64
#introscope.agent.platform.monitor.system=SolarisSparc32
#introscope.agent.platform.monitor.system=SolarisSparc64
#introscope.agent.platform.monitor.system=AIXPSeries32
#introscope.agent.platform.monitor.system=AIXPSeries64
#introscope.agent.platform.monitor.system=HP-UXItanium
#introscope.agent.platform.monitor.system=HP-UXParisc32
#introscope.agent.platform.monitor.system=WindowsIntelAmd32
#introscope.agent.platform.monitor.system=WindowsIntelAmd64
#introscope.agent.platform.monitor.system=LinuxIntelAmd32
#introscope.agent.platform.monitor.system=LinuxIntelAmd64
3. Restart the managed application.
Troubleshooting platform monitoring on Windows
On Windows platforms, the Java Agent logfile will sometimes contain an error similar to the following:
11/28/06 08:29:55 AM PST [ERROR] [IntroscopeAgent] An error occurred polling for
platform data
If the error is infrequent, it is likely caused by a transient error originating from Windows itself, and is harmless. On platforms other than Windows, or in the case that the error happens all the time, this error indicates something more serious and should be reported to CA Support for Introscope.

Troubleshooting platform monitoring
Chapter 17: Configuring Platform Monitoring 235
SAP Netweaver
Platform monitors may not function correctly on SAP Netweaver due to the lack of permissions for SAP user accounts.
By default, SAP user accounts are not registered under Performance Monitor Users, which is located by navigating to Computer Management > System Tools > Local Users and Groups > Groups > Performance Monitor Users . Users registered under Performance Monitor Users have access to Perfmon related data (HKEY_PERFORMANCE_DATA).
If you are experiencing problems with SAP Netweaver and Introscope performance monitoring, this issue can be resolved by adding SAP user account to the Performance Monitor Users group, then restarting the Windows machine.

Appendix A: Java Agent Properties 237
Appendix A: Java Agent Properties
This section contains the following topics:
Configuring the IntroscopeAgent.profile location (see page 238) Command-line property overrides (see page 239) Agent failover (see page 239) Agent HTTP tunneling (see page 241) Agent memory overhead (see page 244) Agent metric aging (see page 244) Agent metric clamp (see page 249) Agent naming (see page 250) Agent recording (business recording) (see page 256) Agent thread priority (see page 257) Agent to Enterprise Manager connection (see page 258) Application triage map (see page 260) Application triage map business transaction POST parameters (see page 263) Application triage map managed socket configuration (see page 265) Application triage map transaction sampling (see page 268) AutoProbe (see page 270) Blame (see page 272) Bootstrap Classes Instrumentation Manager (see page 272) CA Wily CEM integration (see page 274) ChangeDetector (see page 274) Cross-process tracing in WebLogic Server (see page 278) Cross-process transaction trace (see page 279) Dynamic ProbeBuilding (see page 280) ErrorDetector (see page 282) Extensions (see page 284) Java NIO (see page 285) JMX (see page 292) LeakHunter (see page 297) Logging (see page 301) Metric count (see page 306) Multiple inheritance (see page 307) Platform monitoring (see page 310) Remote configuration (see page 311) Security (see page 312) Servlet header decorator (see page 313) Socket metrics (see page 313) SQL Agent (see page 316) SSL communication (see page 321) Stall metrics (see page 324) Transaction tracing (see page 326) URL grouping (see page 336) WebSphere PMI (see page 338) WLDF metrics (see page 349)
Configuring the IntroscopeAgent.profile location
238 Java Agent Guide
Configuring the IntroscopeAgent.profile location
The agent refers to properties in the IntroscopeAgent.profile for its basic connection and naming properties. When you install an agent, the agent profile is installed in the <Agent_Home>/wily directory.
Introscope looks for the agent profile in these locations, in this sequence:
■ location defined in the system property com.wily.introscope.agentProfile
■ location defined in com.wily.introscope.agentResource
■ <working directory>/wily directory
Note: When adding a path on a Windows machine, you must escape a backslash (\) with another backslash (each one doubled), such as C:\\Introscope\\lib\\Agent.jar.
To change the location of the IntroscopeAgent.profile:
1. Define the new location using one of these methods:
■ define a system property on the Java command line with the -D option to specify the full path to the location of the IntroscopeAgent.profile file:
■ -D com.wily.introscope.agentProfile
■ Make the IntroscopeAgent.profile available in a resource on the classpath. Set com.wily.introscope.agentResource to specify the path to the resource containing the agent profile.
Note: If you change the location of the IntroscopeAgent.profile, the AutoProbe log location will also have to be changed. For more infomation, see Managing ProbeBuilder Logs (see page 167).
2. Move your ProbeBuilder directives (PBD and PBL files) to the same location as the agent profile—they are referenced relative to the profile location.
If you use Sun ONE, you must add the new location of the agent profile to the Sun ONE server.xml file
To change the location of the IntroscopeAgent.profile for Sun ONE:
1. To add Introscope information to startup scripts for Sun ONE 7.0, log in as Administrator or Root.
2. Open the server.xml file, in <SunOne_Home>/domains/domain1/server1/config/
3. Add a line to the jvm-options stanza in server.xml:
<jvm-options>
-Dcom.wily.introscope.agentProfile=SunOneHome/wily/IntroscopeAgent.profile
</jvm-options>

Command-line property overrides
Appendix A: Java Agent Properties 239
Command-line property overrides
In Introscope 9.0, you can override specific properties of the Enterprise Manager, agents, Workstation, and WebView using the command line. With regard to the Java Agent, this is useful when you have a clustered environment with multiple copies of an agent being shared and you want to tailor some of the agent settings for each application being monitored.
These steps assume you have installed and configured an agent on the application server to be monitored, and that the agent successfully connects to the Enterprise Manager.
To override agent properties using the command line:
1. Open the file where you modified the Java command to start the agent.
The location of this file varies depending on the application server you use in your environment.
2. Add a -D command to override a property. For example, you can add the following command to make the agent also use the weblogic-full.pbl file:
-Dintroscope.autoprobe.directivesFile=weblogic-full.pbl
Place this command next to other -D commands in the open file.
Note: When you use this command to override hot deployable properties, the property is no longer hot deployable. Also, if you modify the property at a later time in the configuration file, you will receive a warning message in the Workstation stating you modified an overridden property and your change will have no effect. To avoid this, remove the override command before modifying the property in a configuration file.
3. Save the file.
4. Restart the agent.
In the example used above, you would now see the additional WebLogic metrics in the agent node in the Workstation.
Important: System properties become part of the property space of Introscope properties, allowing things like java.io.tmpdir to be visible to anything using IndexedProperties.
Agent failover
If the Java Agent loses connection with its primary Enterprise Manager, these properties specify which Enterprise Manager the agent will failover to, and how often it will try to reconnect to its primary Enterprise Manager:
■ introscope.agent.enterprisemanager.connectionorder (see page 240)
■ introscope.agent.enterprisemanager.failbackRetryIntervalInSeconds (see page 240)
Agent failover
240 Java Agent Guide
introscope.agent.enterprisemanager.connectionorder
Specifies the connection order of backup Enterprise Managers the agent uses if it is disconnected from its default Enterprise Manager.
Property settings
Names of other Enterprise Managers the agent can connect to.
Default
default
Example
introscope.agent.enterprisemanager.connectionorder=DEFAULT
Notes
■ Use a comma separated list.
■ You must restart the managed application before changes to this property take effect.
introscope.agent.enterprisemanager.failbackRetryIntervalInSeconds
Specifies the number of seconds between attempts by the agent to reconnect to its primary Enterprise Manager.
Default
Commented out; 120
Example
introscope.agent.enterprisemanager.failbackRetryIntervalInSeconds=120
Notes
You must restart the managed application before changes to this property take effect.

Agent HTTP tunneling
Appendix A: Java Agent Properties 241
Agent HTTP tunneling
You can configure agents to send information using tunneling technology, enabling agents to connect to an Enterprise Manager remotely. To do this, the agent must be configured to connect to the Enterprise Manager’s embedded Web server, where the HTTP tunneling Web service is hosted.
To configure HTTP tunneled communication in IntroscopeAgent.profile as a new agent connection, specify:
■ The host name of machine running the Enterprise Manager—see introscope.agent.enterprisemanager.transport.tcp.host.DEFAULT (see page 258).
■ The connection port to the Enterprise Manager Web server. This is the value for the introscope.enterprisemanager.webserver.port property specified in the IntroscopeEnterpriseManager.properties for the Enterprise Manager to which the agent will connect. See the Introscope Properties Files section of the Introscope Configuration and Administration Guide for information about introscope.enterprisemanager.webserver.port.
■ The HTTP tunneling socket factory. Specify this client socket factory:
com.wily.isengard.postofficehub.link.net.HttpTunnelingSocketFactory
Agent HTTP tunneling for proxy servers
The following properties only apply to agents configured to tunnel over HTTP and must connect to an Enterprise Manager using a proxy server:
■ introscope.agent.enterprisemanager.transport.http.proxy.host (see page 241)
■ introscope.agent.enterprisemanager.transport.http.proxy.port (see page 242)
■ introscope.agent.enterprisemanager.transport.http.proxy.username (see page 242)
■ introscope.agent.enterprisemanager.transport.http.proxy.password (see page 242)
For more information, see Configuring a proxy server for HTTP tunneling (see page 50).
introscope.agent.enterprisemanager.transport.http.proxy.host
Specifies the proxy server host name.
Default
Commented out; not specified.
Notes
You must restart the managed application before changes to this property take effect.

Agent HTTP tunneling
242 Java Agent Guide
introscope.agent.enterprisemanager.transport.http.proxy.port
Specifies the proxy server port number.
Default
Commented out; not specified.
Notes
You must restart the managed application before changes to this property take effect.
introscope.agent.enterprisemanager.transport.http.proxy.username
If the proxy server requires the agent to authenticate it, specifies the user name for authentication.
Default
Commented out; not specified.
Notes
You must restart the managed application before changes to this property take effect.
introscope.agent.enterprisemanager.transport.http.proxy.password
If the proxy server requires the agent to authenticate it, specifies the password for authentication.
Default
Commented out; not specified.
Notes
You must restart the managed application before changes to this property take effect.
Agent HTTPS tunneling
You can configure agents to send information using HTTPS, enabling agents to connect to an Enterprise Manager remotely:
■ introscope.agent.enterprisemanager.transport.tcp.host.DEFAULT (see page 243)
■ introscope.agent.enterprisemanager.transport.tcp.port.DEFAULT (see page 243)
■ introscope.agent.enterprisemanager.transport.tcp.socketfactory.DEFAULT (see page 243)

Agent HTTP tunneling
Appendix A: Java Agent Properties 243
introscope.agent.enterprisemanager.transport.tcp.host.DEFAULT
Specifies the settings the agent uses to find the Enterprise Manager and names given to host and port combinations.
Default
localhost
Example
introscope.agent.enterprisemanager.transport.tcp.host.DEFAULT=localhost
Notes
You must restart the managed application before changes to this property take effect.
introscope.agent.enterprisemanager.transport.tcp.port.DEFAULT
Settings the agent uses to find the Enterprise Manager and names given to host and port combinations.
Default
8444
Example
introscope.agent.enterprisemanager.transport.tcp.port.
DEFAULT=8444
Notes
You must restart the managed application before changes to this property take effect.
introscope.agent.enterprisemanager.transport.tcp.socketfactory.DEFAULT
Settings the agent uses to find the Enterprise Manager and names given to host and port combinations.
Default
com.wily.isengard.postofficehub.link.net.HttpsTunnelingSocketFactory
Example
introscope.agent.enterprisemanager.transport.tcp.socketfactory.DEFAULT=com.wily.i
sengard.postofficehub.link.net.HttpsTunnelingSocketFactory
Notes
You must restart the managed application before changes to this property take effect.

Agent memory overhead
244 Java Agent Guide
Agent memory overhead
Significant agent memory overhead only occurs in certain extreme cases. Setting the following property to true may reduce an agent’s overhead:
■ introscope.agent.reduceAgentMemoryOverhead (see page 244)
The trade-off for the possible lower memory consumption is a possible increase in response time. Each application is unique and will experience different variations in memory vs. response time trade-offs.
introscope.agent.reduceAgentMemoryOverhead
Uncomment if you want to attempt to reduce the agent memory overhead introduced by architectural improvements to the 8.x agent. This property is set to true by default and out of the box is commented out.
Property settings
True or False
Default
True
Example
introscope.agent.reduceAgentMemoryOverhead=true
Notes
You must restart the managed application before changes to this property take effect.
Agent metric aging
Agent metric aging periodically removes dead metrics from the agent memory cache. A dead metric is a metric that has no new data reported in a configured amount of time. This helps the agent improve performance and avoid potential metric explosions.
Note: A metric explosion happens when an agent is inadvertently set up to report more metrics than the system can handle. In this case, Introscope is bombarded with such a large number of metrics that performance gets very slow or the system cannot function at all.

Agent metric aging
Appendix A: Java Agent Properties 245
Metrics that are in a group are removed only if all metrics in the group are considered candidates for removal. Currently, only BlamePointTracer group and MetricRecordingAdministrator metrics are removed as a unit; other metrics are removed individually.
The MetricRecordingAdministrator metric has APIs that can create a metric group. These APIs are:
■ getAgent().IAgent_getMetricRecordingAdministrator.addMetricGroup
String component, collection metrics. The component name is the metric resource name of the metric group. The metrics must be under the same metric node in order to qualify as a group. The metrics are a collection of com.wily.introscope.spec.metric.AgentMetric data structures. You can only add AgentMetric data structures to this Collection.
■ getAgent().IAgent_getMetricRecordingAdministrator.getMetricGroup
String component. Based on the component name which is the metric resource name, you can get the Collection of metrics.
■ getAgent().IAgent_getMetricRecordingAdministrator.removeMetricGroup
String component. The metric group is removed based on the component which is the metric resource name.
■ getAgent().IAgent_getDataAccumulatorFactory.isRemoved
Checks if the metric is removed. You use this API if you keep an instance of an accumulator in your extension. If the accumulator is removed because of metric aging then you will be holding onto a dead reference.
Important: If you create an extension that uses a MetricRecordingAdministrator API (for example, for use with CA Technologies products), be sure to delete your own instance of an accumulator. When a metric ages out because it has not been invoked, and then after a time data does become available for that metric, if you are using an old accumulator instance, the accumulator will not create new metric data points for that metric. To avoid this situation, do not delete your own instance of an accumulator and use instead the getDataAccumulatorFactory API.
Configuring agent metric aging
Agent metric aging is on by default. You can choose to turn off this capability using the property introscope.agent.metricAging.turnOn (see page 247). If you remove this property from the IntroscopeAgent.profile, agent metric aging is turned off by default.
Agent metric aging runs on a heartbeat in the agent. The heartbeat is configured using the property introscope.agent.metricAging.heartbeatInterval (see page 247). Be sure to keep the frequency of the heartbeat low. A higher heartbeat will impact the performance of the agent and Introscope.

Agent metric aging
246 Java Agent Guide
During each heartbeat, a certain set of metrics are checked. This is configurable using the property introscope.agent.metricAging.dataChunk (see page 248). It is also important to keep this value low, as a higher value will impact performance. The default value is 500 metrics to be checked per heartbeat. Each of the 500 metrics is checked to see if it is a candidate for removal. For example, if you set this property to check chunks of 500 metrics per heartbeat, and you have a total of 10,000 metrics in the agent memory, then it will take longer with lower impact on performance to check all 10,000 metrics. However, if you set this property to a higher number, you would check all 10,000 metrics faster, but with possibly high overhead.
A metric is a candidate for removal if the metric has not received new data after certain period of time. You can configure this period of time using the property introscope.agent.metricAging.numberTimeslices (see page 248). This property is set to 3000 by default. If a metric meets the condition for removal, then a check is performed to see if all the metrics in its group are candidates for metric removal. If this requirement has also been met then the metric is removed.
Note: For metrics that do not have a metric group then the rule does not apply.
Based on the rules outlined above, it may take a significant amount of time for metrics to be removed.
Use the following properties to configure agent metric aging:
■ introscope.agent.metricAging.turnOn (see page 247)
■ introscope.agent.metricAging.heartbeatInterval (see page 247)
■ introscope.agent.metricAging.dataChunk (see page 248)
■ introscope.agent.metricAging.numberTimeslices (see page 248)
■ introscope.agent.metricAging.metricExclude.ignore.0 (see page 249)
In all of the properties, if any unrecognised values are used, the default value will be used instead.

Agent metric aging
Appendix A: Java Agent Properties 247
introscope.agent.metricAging.turnOn
Turns on or off agent metric aging.
Property settings
True or False
Default
True
Example
introscope.agent.metricAging.turnOn=true
Notes
Changes to this property take effect immediately and do not require the managed application to be restarted.
introscope.agent.metricAging.heartbeatInterval
Specifies the time interval when metrics are checked for removal, in seconds.
Default
1800
Example
introscope.agent.metricAging.heartbeatInterval=1800
Notes
You must restart the managed application before changes to this property take effect.

Agent metric aging
248 Java Agent Guide
introscope.agent.metricAging.dataChunk
Specifies the number of metrics that are checked during each interval.
Default
500
Example
introscope.agent.metricAging.dataChunk=500
Notes
Changes to this property take effect immediately and do not require the managed application to be restarted.
introscope.agent.metricAging.numberTimeslices
Specifies the number of intervals to check without any new data before making it a candidate for removal.
Default
3000
Example
introscope.agent.metricAging.numberTimeslices=3000
Notes
Changes to this property take effect immediately and do not require the managed application to be restarted.
Agent metric clamp
Appendix A: Java Agent Properties 249
introscope.agent.metricAging.metricExclude.ignore.0
Excludes specified metrics from being removed. Add the metric name or metric filter to the list.
Property settings
Comma seperated list of metrics. You can use the an asterisk (*) as a wildcard in metric names.
Default
None.
Example
introscope.agent.metricAging.metricExclude.ignore.0=Threads*
Notes
Changes to this property take effect immediately and do not require the managed application to be restarted.
Agent metric clamp
The following property allows you to configure the Java Agent to approximately clamp the number of metrics sent to the Enterprise Manager:
■ introscope.agent.metricClamp (see page 250)
If the number of metrics pass this metric clamp value then no new metrics will be created.

Agent naming
250 Java Agent Guide
introscope.agent.metricClamp
Configures the agent to approximately clamp the number of metrics sent to the Enterprise Manager.
Default
5000
Example
introscope.agent.metricClamp=5000
Notes
■ If the property is not set then no metric clamping will occur. Old metrics will still report values.
■ Changes to this property take effect immediately and do not require the managed application to be restarted.
Agent naming
The following are Java Agent naming properties:
■ introscope.agent.agentAutoNamingEnabled (see page 251)
■ introscope.agent.agentAutoNamingMaximumConnectionDelayInSeconds (see page 251)
■ introscope.agent.agentAutoRenamingIntervalInMinutes (see page 252)
■ introscope.agent.disableLogFileAutoNaming (see page 252)
■ introscope.agent.agentName (see page 253)
■ introscope.agent.agentNameSystemPropertyKey (see page 253)
■ introscope.agent.clonedAgent (see page 254)
■ introscope.agent.customProcessName (see page 254)
■ introscope.agent.defaultProcessName (see page 255)
■ introscope.agent.disableLogFileAutoNaming (see page 255)
■ introscope.agent.display.hostName.as.fqdn (see page 256)
For more information on Java Agent naming, see Java Agent Naming (see page 147).

Agent naming
Appendix A: Java Agent Properties 251
introscope.agent.agentAutoNamingEnabled
Specifies whether agent autonaming will be used to obtain the Java Agent name for supported application servers.
Property settings
True or False
Default
Varies by application server, see Notes below.
Example
introscope.agent.agentAutoNamingEnabled=false
Notes
■ Agent autonaming is enabled in the following application servers: WebLogic, WebSphere, and JBoss
■ This property requires the Startup Class to be specified for WebLogic, and requires the Custom Service to be specified for WebSphere.
■ Agent auto naming is disabled in the following application servers: Oracle application server, Interstage, Sun ONE, and Tomcat.
■ You must restart the managed application before changes to this property take effect.
Important: For WebLogic, WebSphere, and JBoss, the property introscope.agent.agentAutoNamingEnabled is set to TRUE by default.
introscope.agent.agentAutoNamingMaximumConnectionDelayInSeconds
Specifies the amount of time in seconds the agent waits for naming information before connecting to the Enterprise Manager.
Default
120
Example
introscope.agent.agentAutoNamingMaximumConnectionDelayInSeconds=120
Notes
You must restart the managed application before changes to this property take effect.

Agent naming
252 Java Agent Guide
introscope.agent.agentAutoRenamingIntervalInMinutes
Specifies the time interval in minutes during which the agent will check to see if it has been renamed.
Default
10
Example
introscope.agent.agentAutoRenamingIntervalInMinutes=10
Notes
You must restart the managed application before changes to this property take effect.
introscope.agent.disableLogFileAutoNaming
Auto name of log files (Agent, AutoProbe and LeakHunter) with the agent name, or a timestamp, can be disabled by setting this property to 'true'.
Property settings
True or False
Default
False
Example
introscope.agent.disableLogFileAutoNaming=false
Notes
■ Log file auto naming only takes effect when the agent name can be determined using a Java System Property or an Application Server custom service.
■ You must restart the managed application before changes to this property take effect.

Agent naming
Appendix A: Java Agent Properties 253
introscope.agent.agentName
Uncomment this property to provide a default agent name if other agent naming methods fail.
Property settings
For any installation, if the value of this property is invalid or if this property is deleted from the profile, the agent name will be UnnamedAgent.
Example
#introscope.agent.agentName=AgentName
Notes
■ You must restart the managed application before changes to this property take effect.
■ In the agent profile provided with application server-specific agent installers, the default reflects the application server, for instance WebLogic Agent.
■ In the agent profile provided with the default agent installer, the property value is AgentName, and the line is commented out.
introscope.agent.agentNameSystemPropertyKey
Use this property if you want to specify the agent name using the value of a java system property.
Default
Not specified.
Example
introscope.agent.agentNameSystemPropertyKey
Notes
You must restart the managed application before changes to this property take effect.

Agent naming
254 Java Agent Guide
introscope.agent.clonedAgent
Set to true when running identical copies of an Application on the same machine.
Property settings
True or False
Default
False
Example
introscope.agent.clonedAgent=false
Notes
You must restart the managed application before changes to this property take effect.
introscope.agent.customProcessName
Specify the process name as it should appear in the Introscope Enterprise Manager and Workstation.
Default
Varies by application server.
Example
introscope.agent.customProcessName=CustomProcessName
Notes
■ You must restart the managed application before changes to this property take effect.
■ In the agent profile provided with application server-specific agent installers, the default reflects the application server, for instance "WebLogic."
■ In the agent profile provided with default agent installer, the property is commented out.

Agent naming
Appendix A: Java Agent Properties 255
introscope.agent.defaultProcessName
If no custom process name is provided and the agent is unable to determine the name of the main application class, this value is used for the process name.
Default
UnknownProcess
Example
introscope.agent.defaultProcessName=UnknownProcess
Notes
You must restart the managed application before changes to this property take effect.
introscope.agent.disableLogFileAutoNaming
Specifies whether to disable automatic naming of agent log files when using AutoNaming options.
Setting this property to true disables the auto-naming of log files for the agent, AutoProbe and LeakHunter with the agent name or a timestamp.
Property settings
True or False
Default
False
Example
introscope.agent.disableLogFileAutoNaming=false
Notes
■ You must restart the managed application before changes to this property take effect.
■ Log file auto-naming only takes effect when the agent name can be determined using a Java system property or an application server custom service.

Agent recording (business recording)
256 Java Agent Guide
introscope.agent.display.hostName.as.fqdn
A fully qualified domain name (fqdn) can be enabled by setting this property value to 'true'. By default (false) it will display the HostName.
Property settings
True or False
Default
False
Example
introscope.agent.display.hostName.as.fqdn=false
Notes
You must restart the managed application before changes to this property take effect.
Agent recording (business recording)
The following properties configure how the Java Agent handles business recording:
■ introscope.agent.bizRecording.enabled (see page 257)
For more information on agent business recording, see the CA Wily APM Transaction Definition Guide.

Agent thread priority
Appendix A: Java Agent Properties 257
introscope.agent.bizRecording.enabled
This property enables or disables agent business recording.
Property settings
True or False
Default
True
Example
introscope.agent.bizRecording.enabled=true
Notes
You must restart the managed application before changes to this property take effect.
To further configure agent business recording, see Application triage map (see page 260), Application triage map business transaction POST parameters (see page 263), Application triage map managed socket configuration (see page 265), and Application triage map transaction sampling (see page 268).
Agent thread priority
The following property controls the priority of agent threads:
■ introscope.agent.thread.all.priority (see page 258)

Agent to Enterprise Manager connection
258 Java Agent Guide
introscope.agent.thread.all.priority
Controls the priority of agent threads.
Property settings
You can set this from 1 (low) to 10 (high).
Default
Commented out;5.
Example
introscope.agent.thread.all.priority=5
Notes
You must restart the managed application before changes to this property take effect.
Agent to Enterprise Manager connection
The following properties controls the agent connection to the Enterprise Manager:
■ introscope.agent.enterprisemanager.transport.tcp.host.DEFAULT (see page 258)
■ introscope.agent.enterprisemanager.transport.tcp.port.DEFAULT (see page 259)
■ introscope.agent.enterprisemanager.transport.tcp.socketfactory.DEFAULT (see page 259)
introscope.agent.enterprisemanager.transport.tcp.host.DEFAULT
The host name of machine running the Enterprise Manager.
Default
localhost
Example
introscope.agent.enterprisemanager.transport.tcp.host.DEFAULT=localhost
Notes
You must restart the managed application before changes to this property take effect.

Agent to Enterprise Manager connection
Appendix A: Java Agent Properties 259
introscope.agent.enterprisemanager.transport.tcp.port.DEFAULT
The port on the Enterprise Manager machine that listens for the agent.
Default
5001
Example
introscope.agent.enterprisemanager.transport.tcp.port.DEFAULT=5001
Notes
You must restart the managed application before changes to this property take effect.
introscope.agent.enterprisemanager.transport.tcp.socketfactory.DEFAULT
Change this property to use a different client socket factory.
Default
com.wily.isengard.postofficehub.link.net.DefaultSocketFactory
Example
introscope.agent.enterprisemanager.transport.tcp.socketfactory.DEFAULT=com.wily.i
sengard.postofficehub.link.net.DefaultSocketFactory
Notes
You must restart the managed application before changes to this property take effect.
Application triage map
260 Java Agent Guide
Application triage map
The following properties configure application triage map data:
■ introscope.agent.appmap.enabled (see page 260)
■ introscope.agent.appmap.metrics.enabled (see page 261)
■ introscope.agent.appmap.catalystIntegration.enabled (see page 261)
■ introscope.agent.appmap.queue.size (see page 262)
■ introscope.agent.appmap.queue.period (see page 262)
■ introscope.agent.appmap.intermediateNodes.enabled (see page 263)
See the CA Wily Introscope Workstation User Guide for more information on how to use the application triage map. See Application triage map business transaction POST parameters (see page 263) for more triage map properties.
introscope.agent.appmap.enabled
Enables or disables the tracking of monitored code for the application triage map.
Property settings
True or False
Default
True
Example
introscope.agent.appmap.enabled=true
Notes
Enabled by default.

Application triage map
Appendix A: Java Agent Properties 261
introscope.agent.appmap.metrics.enabled
Enables or disables the tracking of metrics for application triage map nodes.
Property settings
True or False
Default
False
Example
introscope.agent.appmap.metrics.enabled=false
Notes
This property is commented out by default.
introscope.agent.appmap.catalystIntegration.enabled
Enables or disables the agents ability to send additional information for integration with Catalyst.
Property settings
True or False
Default
False
Example
introscope.agent.appmap.catalystIntegration.enabled=false
Notes
This property is commented out by default.
Application triage map
262 Java Agent Guide
introscope.agent.appmap.queue.size
Sets the buffer size for the application triage map.
Property settings
Positive integers.
Default
1000
Example
introscope.agent.appmap.queue.size=1000
Notes
■ The value must be a positive integer.
■ If the value is set to 0, the buffer is unbounded.
■ This property is commented out by default.
introscope.agent.appmap.queue.period
Sets the frequency in milliseconds for sending application triage map data to the Enterprise Manager.
Property settings
Positive integers.
Default
1000
Example
#introscope.agent.appmap.queue.period=1000
Notes
■ Must be a positive integer.
■ If the value is set to 0, the default value is used.
■ This property is commented out by default.

Application triage map business transaction POST parameters
Appendix A: Java Agent Properties 263
introscope.agent.appmap.intermediateNodes.enabled
Enables or disables sending additional intermediate nodes between application frontend and backend nodes.
Property settings
True or False
Default
False
Example
#introscope.agent.appmap.intermediateNodes.enabled=true
Notes
■ Changes to this property takes effect immediately and do not require the managed application to be restarted.
■ If you set this property to true, you may experience a slow down of agent performance.
Application triage map business transaction POST parameters
The following property, located in the default IntroscopeAgent.profile, allows you to configure your Local Product Shorts to perform more complex monitoring by matching POST parameters:
■ introscope.agent.bizdef.matchPost (see page 264)

Application triage map business transaction POST parameters
264 Java Agent Guide
introscope.agent.bizdef.matchPost
This property determines when POST parameters are matched.
Property settings
The valid settings for this property are never, before, or after.
■ Set the property to never for full agent functionality and better performance. This allows your application to identify all business transactions using URLs, cookies and/or header parameters, but will fail to match any business transactions that are identified solely through POST parameters.
■ Set the property to before to get full agent performance. This setting allows applications to use POST parameters to identify some or all business transactions, but never access the servlet stream directly for HTTP form requests. New applications deployed must also conform to standard API when this property is set to before.
Important: Setting this property to before could have potentially hazardous repercussions for your applications. Review this property setting with a CA Technologies representative before implementation.
■ Set the property to after to safely match business transactions with POST parameters, but with limited agent functionality. When this property is set to after, the agent will not be able to map business transactions that are identified by POST parameters across processes, or produce full sets of metrics for them. This setting also consumes slightly more CPU time compared to the other options, but is considered the safest setting if one needs the POST parameter functionality. It allows applications to use POST parameters to identify some or all business transactions and cannot guarantee that the servlet stream is never accessed directly.
Example
introscope.agent.bizdef.matchPost=after
Notes
■ never - never attempt to match POST parameters. This is the fastest option but may result in inaccurate business transaction component matching.
■ before - matches POST parameters before the servlets execute.
Note: Setting this parameter to before could have potentially hazardous repercussion to your applications. Do not set this parameter to before unless you have consulted with your CA Technologies representative or CA Support.
■ after - matches POST parameter patterns after the servlet has executed. Cross process mapping and some metrics will not be available. Default setting for the parameter.
Application triage map managed socket configuration
Appendix A: Java Agent Properties 265
Known limitations
The metrics defined using agent recording are displayed in the application triage map in the Investigator. When configuring agent recording, there are some known limitations when using regular expressions. Most of the limitations have to do with POST parameters.
The known limitations are:
■ Line terminators (.) are not supported for POST parameter values.
■ If POST parameter definitions are dependent on the business transaction definition, only three metrics will be provided for the business transaction component. These metrics are:
■ Average Response Time
■ Responses Per Interval
■ Errors Per Interval
■ If POST parameter definitions are dependent on the business transaction definition, then the business component name in the transaction trace component will have a generic name and not the specific name of the business service, business transaction, and business transaction component. This also applies to business transaction definitions that are dependent on POST parameter definitions that do not match.
■ Some versions of JBoss and Tomcat might save header keys as lower case values which makes the caseSensitiveName attribute not work properly for HEADER_TYPEs.
For more information on agent recording, see the CA Wily APM Transaction Definition Guide.
Application triage map managed socket configuration
The following properties allow you to enable or disable the appearance of socket metrics in the application triage map:
■ introscope.agent.sockets.managed.reportToAppmap (see page 266)
■ introscope.agent.sockets.managed.reportClassAppEdge (see page 266)
■ introscope.agent.sockets.managed.reportMethodAppEdge (see page 267)
■ introscope.agent.sockets.managed.reportClassBTEdge (see page 267)
■ introscope.agent.sockets.managed.reportMethodBTEdge (see page 268)
See the Introscope Workstation User Guide for more information on how to use the application triage map.

Application triage map managed socket configuration
266 Java Agent Guide
introscope.agent.sockets.managed.reportToAppmap
Enables managed sockets to appear in application triage map.
Property settings
True or False
Default
True
Example
introscope.agent.sockets.managed.reportToAppmap=true
Notes
You must restart the managed application before changes to this property take effect.
introscope.agent.sockets.managed.reportClassAppEdge
Enables managed sockets to report class level application edges to the application triage map.
Property settings
True or False
Default
False
Example
introscope.agent.sockets.managed.reportClassAppEdge=false
Notes
You must restart the managed application before changes to this property take effect.
Application triage map managed socket configuration
Appendix A: Java Agent Properties 267
introscope.agent.sockets.managed.reportMethodAppEdge
Enables managed sockets to report method level application edges to the application triage map.
Property settings
True or False
Default
True
Example
introscope.agent.sockets.managed.reportMethodAppEdge=true
Notes
You must restart the managed application before changes to this property take effect.
introscope.agent.sockets.managed.reportClassBTEdge
Enables managed sockets to report class level business transaction edges to the application triage map.
Property settings
True or False
Default
False
Example
introscope.agent.sockets.managed.reportClassBTEdge=false
Notes
You must restart the managed application before changes to this property take effect.

Application triage map transaction sampling
268 Java Agent Guide
introscope.agent.sockets.managed.reportMethodBTEdge
Enables managed sockets to report method level business transaction edges to the application triage map.
Property settings
True or False
Default
True
Example
introscope.agent.sockets.managed.reportMethodBTEdge=true
Notes
You must restart the managed application before changes to this property take effect.
Application triage map transaction sampling
The following properties configure application triage map transaction sampling:
■ introscope.agent.tracer.sampling.maxrate (see page 269)
■ introscope.agent.tracer.sampling.initial.period (see page 269)
■ introscope.agent.tracer.sampling.reset.period (see page 270)
Introscope uses transaction sampling to provide data to support the application triage map display. After an agent is started, Introscope takes (by default) the first one hundred transactions to draw an initial map of the frontend and its dependencies. Subsequently, it gradually reduces the number of transactions it samples until it reaches a level where only every tenth transaction provides continuing data support to the map. After each ten thousand transactions, this pattern repeats.
Be aware that adjusting the following properties to increase the amount of transactions supporting the map display may increase agent overhead.
See the Introscope Workstation User Guide for more information on how to use the application triage map.

Application triage map transaction sampling
Appendix A: Java Agent Properties 269
introscope.agent.tracer.sampling.maxrate
Use this property to set the maximum sampling rate. By default 1 out 10 transactions are monitored.
Default
10
Example
introscope.agent.tracer.sampling.maxrate=10
Notes
■ Set the value to 0 to disable sampling and monitor all transactions.
■ Changes to this property take effect immediately and do not require the managed application to be restarted.
introscope.agent.tracer.sampling.initial.period
This property sets the initial number of transactions the agent will sample at the begining of the sampling process.
Default
100
Example
introscope.agent.tracer.sampling.initial.period=100
Notes
Changes to this property take effect immediately and do not require the managed application to be restarted.
AutoProbe
270 Java Agent Guide
introscope.agent.tracer.sampling.reset.period
After the agent has sampled a set number of transactions, this property sets the number of transactions the agent will not sample. After the set number of not sampled transactions have passed, the agent begins the sampling process over again.
Default
10000
Example
introscope.agent.tracer.sampling.reset.period=10000
Notes
Changes to this property take effect immediately and do not require the managed application to be restarted.
AutoProbe
The following properties configure AutoProbe:
■ introscope.autoprobe.directivesFile (see page 270)
■ introscope.autoprobe.enable (see page 271)
introscope.autoprobe.directivesFile
Specifies ProbeBuilder directives files for AutoProbe. For more information, see ProbeBuilder Directives (see page 56).
Default
Varies by installer.
Notes
■ You must restart the managed application before changes to this property take effect.
■ If this property includes one or more directories, and dynamic instrumentation is enabled, the agent will load directives files from the specified directories without an application restart.

AutoProbe
Appendix A: Java Agent Properties 271
introscope.autoprobe.enable
Enables or disables inserting probes into bytecode automatically.
Property settings
True or False
Default
True
Example
introscope.autoprobe.enable=true
Notes
When this property is set to false, it turns off the automatic insertion of Probes into an application’s bytecode. It does not turn off the agent or agent reporting.
introscope.autoprobe.logfile
Introscope AutoProbe always attempts to log the changes it makes. Set this property to move the location of the log file to something other than the default.
Property settings
Absolute file paths, or non-absolute paths. Non-absolute names are resolved relative to the location of this properties file
Default
logs/AutoProbe.log
Example
introscope.autoprobe.logfile=logs/AutoProbe.log
Notes
You must restart the managed application before changes to this property take effect.

Blame
272 Java Agent Guide
Blame
The following property configures Boundary Blame:
■ introscope.agent.blame.type (see page 272)
For more information about Boundary Blame, see Configuring Boundary Blame (see page 195).
introscope.agent.blame.type
Add this property with a value of standard to turn off boundary blame. For information about boundary blame, see the Introscope Workstation User Guide.
Property settings
standard, boundary
Default
boundary
Example
introscope.agent.blame.type=boundary
Notes
You must restart the managed application before changes to this property take effect.
Bootstrap Classes Instrumentation Manager
The following properties configure the Bootstrap Classes Instrumentation Manager:
■ introscope.bootstrapClassesManager.enabled (see page 273)
■ introscope.bootstrapClassesManager.waitAtStartup (see page 273)
The Bootstrap Classes Instrumentation Manager instruments a set of classes after the agent bootstrap, allowing easy implementation of tracers for Java NIO and Secure Sockets Layer (SSL), as well as improving agent performance. You can disable this property by commenting it out in the IntroscopeAgent.profile.

Bootstrap Classes Instrumentation Manager
Appendix A: Java Agent Properties 273
introscope.bootstrapClassesManager.enabled
Enables or disables the bootstrap manager.
Property settings
True or False
Default
True
Example
introscope.bootstrapClassesManager.enabled=true
Notes
■ This property only functions with JVMs running Java 1.5 or higher.
■ If set to false, no system classes will be instrumented.
■ If the property is not set, the default value is false.
■ You must restart the managed application before changes to this property take effect.
introscope.bootstrapClassesManager.waitAtStartup
Sets the time, in seconds, for how long the agent waits after startup to instrument bootstrap classes.
Property settings
Time, in seconds
Default
■ 240 seconds when used with HP-UX, Interstage, WebLogic, or WebSphere Application Server.
■ 5 seconds when used with JBoss, Oracle, Sun, or Tomcat.
Example
introscope.bootstrapClassesManager.waitAtStartup=5
CA Wily CEM integration
274 Java Agent Guide
Notes
■ This property only functions with JVMs running Java 1.5 or higher.
■ When this property is active, it can overrule classes that have been designated as skipped. If skipped classes are being instrumented, please contact your CA Technologies representative, or CA Support.
CA Wily CEM integration
For information on configuring Java Agents for Wily CEM Integration, see the CA Wily CEM Integration Guide.
ChangeDetector
The following properties configure aspects of ChangeDetector:
■ introscope.changeDetector.enable (see page 275)
■ introscope.changeDetector.rootDir (see page 275)
■ introscope.changeDetector.isengardStartupWaitTimeInSec (see page 276)
■ introscope.changeDetector.waitTimeBetweenReconnectInSec (see page 276)
■ introscope.changeDetector.agentID (see page 276)
■ introscope.changeDetector.profile (see page 277)
■ introscope.changeDetector.profileDir (see page 277)
■ introscope.changeDetector.compressEntries.enable (see page 278)
■ introscope.changeDetector.compressEntries.batchSize (see page 278)
For more information about ChangeDetector, see the CA Wily Introscope ChangeDetector User Guide.
ChangeDetector
Appendix A: Java Agent Properties 275
introscope.changeDetector.enable
When set to true, this property enables Introscope ChangeDetector. It is set to false by default.
Property settings
True or False
Default
False
Example
introscope.changeDetector.enable=false
Notes
You must restart the managed application before changes to this property take effect.
introscope.changeDetector.rootDir
This property sets where the root directory for ChangeDetector is created. The root directory is the folder where ChangeDetector creates its local cache files.
Default
c:\\sw\\AppServer\\wily\\change_detector
Example
introscope.changeDetector.rootDir=c:\\sw\\AppServer\\wily\\change_detector
Notes
Use a backslash to escape the backslash character, as in the example.

ChangeDetector
276 Java Agent Guide
introscope.changeDetector.isengardStartupWaitTimeInSec
This property sets the time to wait after the agent starts before ChangeDetector tries to connect to the Enterprise Manager.
Default
15
Example
introscope.changeDetector.isengardStartupWaitTimeInSec=15
introscope.changeDetector.waitTimeBetweenReconnectInSec
Specifies the number of seconds ChangeDetector waits before retrying a connection to the Enterprise Manager.
Default
10
Example
introscope.changeDetector.waitTimeBetweenReconnectInSec=10
introscope.changeDetector.agentID
A string used by ChangeDetector to identify the Java Agent.
Default
SampleApplicationName
Example
introscope.changeDetector.agentID=SampleApplicationName

ChangeDetector
Appendix A: Java Agent Properties 277
introscope.changeDetector.profile
The absolute or relative path to the ChangeDetector datasources configuration file.
Default
ChangeDetector-config.xml
Example
introscope.changeDetector.profile=ChangeDetector-config.xml
Notes
Use a backslash to escape the backslash character.
introscope.changeDetector.profileDir
The absolute or relative path to the datasource configuration file(s) directory. All datasource configuration file(s) from this directory will be used in addition to any file specified by the introscope.changeDetector.profile property (above)
Default
changeDetector_profiles
Example
introscope.changeDetector.profileDir=changeDetector_profiles
Notes
Use a backslash to escape the backslash character.

Cross-process tracing in WebLogic Server
278 Java Agent Guide
introscope.changeDetector.compressEntries.enable
This property allows compression on the ChangeDetector data buffer. This could be useful if you experience memory consumption at start-up.
Property settings
True or False
Default
True
Example
introscope.changeDetector.compressEntries.enable=true
Notes
You must restart the managed application before changes to this property take effect.
introscope.changeDetector.compressEntries.batchSize
This property defines the batch size for the compression job, set in introscope.changeDetector.compressEntries.enable above.
Default
1000
Example
introscope.changeDetector.compressEntries.batchSize=1000
Notes
You must restart the managed application before changes to this property take effect.
Cross-process tracing in WebLogic Server
The following property configures cross-process tracing in WebLogic Server:
■ introscope.agent.weblogic.crossjvm (see page 279)

Cross-process transaction trace
Appendix A: Java Agent Properties 279
introscope.agent.weblogic.crossjvm
Property settings
True or False
Default
Commented out; True
Example
introscope.agent.weblogic.crossjvm=true
Cross-process transaction trace
Uncomment the following property to enable automatic collection of downstream traces due to tail filter.
■ introscope.agent.transactiontracer.tailfilterPropagate.enable (see page 279)
Enabling this property and running long periods of Transaction Trace session with tail filters can cause large numbers of unwanted traces to be sent to the Enterprise Manager.
introscope.agent.transactiontracer.tailfilterPropagate.enable
This property controls whether the presence of a tail filter triggers automatic collection of traces from downstream agents or not. This property does not affect collection of automatic downstream traces due to passing of head filters.
Property settings
True or False
Default
False; commented out.
Example
introscope.agent.transactiontracer.tailfilterPropagate.enable=false
Notes
Changes to this property take effect immediately and do not require the managed application to be restarted.

Dynamic ProbeBuilding
280 Java Agent Guide
Dynamic ProbeBuilding
The following properties enable changes to PBDs to take effect without restarting the application server or the agent process:
■ introscope.autoprobe.dynamicinstrument.enabled (see page 280)
■ autoprobe.dynamicinstrument.pollIntervalMinutes (see page 281)
■ introscope.autoprobe.dynamicinstrument.classFileSizeLimitInMegs (see page 281)
■ introscope.autoprobe.dynamic.limitRedefinedClassesPerBatchTo (see page 281)
■ introscope.agent.remoteagentdynamicinstrumentation.enabled (see page 282)
■ introscope.autoprobe.dynamicinstrument.pollIntervalMinutes (see page 282)
This is a very CPU intensive operation, and it is highly recommended to use configurations to minimize the classes that are being redefined. PBD editing is all that is required to trigger this process.
introscope.autoprobe.dynamicinstrument.enabled
Enables dynamic ProbeBuilding for agents that run under JDK 1.5, and use AutoProbe.
Property settings
True or False
Default
False
Example
introscope.autoprobe.dynamicinstrument.enabled=false
Notes
For more information about dynamic ProbeBuilding, see Dynamic ProbeBuilding (see page 68).
Dynamic ProbeBuilding
Appendix A: Java Agent Properties 281
autoprobe.dynamicinstrument.pollIntervalMinutes
For agents that run under JDK 1.5 using AutoProbe and dynamic ProbeBuilding, this property determines the frequency with which the agent polls for new and changed PBDs.
Default
1
Example
autoprobe.dynamicinstrument.pollIntervalMinutes=1
introscope.autoprobe.dynamicinstrument.classFileSizeLimitInMegs
Some classloader implementations have been observed to return huge class files.This is to prevent memory errors.
Default
1
Example
introscope.autoprobe.dynamicinstrument.classFileSizeLimitInMegs=1
Notes
You must restart the managed application before changes to this property take effect.
introscope.autoprobe.dynamic.limitRedefinedClassesPerBatchTo
Re-defining too many classes at a time might be very CPU intensive. In cases where the changes in PBDs trigger a re-definition of a large number of classes, this batches the process at a comfortable rate.
Default
10
Example
introscope.autoprobe.dynamic.limitRedefinedClassesPerBatchTo=10

ErrorDetector
282 Java Agent Guide
introscope.agent.remoteagentdynamicinstrumentation.enabled
This property enables or disables remote management of dynamic instrumentation.
Property settings
True or False
Default
True
Example
introscope.agent.remoteagentdynamicinstrumentation.enabled=true
Notes
You must restart the managed application before changes to this property take effect.
introscope.autoprobe.dynamicinstrument.pollIntervalMinutes
Defines the polling interval in minutes to poll for PBD changes.
Default
1
Example
introscope.autoprobe.dynamicinstrument.pollIntervalMinutes=1
Notes
You must restart the managed application before changes to this property take effect.
ErrorDetector
The following properties configure interaction with ErrorDetector:
■ introscope.agent.errorsnapshots.enable (see page 283)
■ introscope.agent.errorsnapshots.throttle (see page 283)
■ introscope.agent.errorsnapshots.ignore.<index> (see page 284)
ErrorDetector
Appendix A: Java Agent Properties 283
introscope.agent.errorsnapshots.enable
Enable the agent to captures transaction details about serious errors.
Property settings
True or False
Default
True
Notes
This property is dynamic. You can change the configuration of this property during run time and the change will be picked up automatically.
Requires Introscope Error Detector.
introscope.agent.errorsnapshots.throttle
The maximum number of error snapshots that the agent can send in a 15-second period.
Default
10
Example
introscope.agent.errorsnapshots.throttle=10
Notes
■ This property is dynamic. You can change the configuration of this property during run time and the change will be picked up automatically.
■ Requires Introscope Error Detector.

Extensions
284 Java Agent Guide
introscope.agent.errorsnapshots.ignore.<index>
This indexed property allows you to specify error messages to ignore. Error snapshots will not be generated or sent for errors with messages matching these filters. You may specify as many as you like (using .0, .1, .2 ...). You may use wildcards (*).
Default
Example definitions are provided, and commented out, as shown below. The following are examples only.
Example
introscope.agent.errorsnapshots.ignore.0=*com.company.HarmlessException*
introscope.agent.errorsnapshots.ignore.1=*HTTP Error Code: 404*
Notes
This property is dynamic. You can change the configuration of this property during run time and the change will be picked up automatically.
Requires Introscope Error Detector.
Extensions
The following property configures agent extensions:
■ introscope.agent.extensions.directory (see page 284)
introscope.agent.extensions.directory
Specifies the location of all extensions to be loaded by the agent.
Default
ext
Example
introscope.agent.extensions.directory=ext
Notes
Non-absolute names are resolved relative to the location of the IntroscopeAgent.properties file.

Java NIO
Appendix A: Java Agent Properties 285
Java NIO
The Java Agent supports the Java New I/O (Java NIO, or NIO) capabilities introduced in Java 1.4. Java NIO is a collection of APIs designed to provide access to the low-level I/O operations of modern operating systems. Java NIO metrics capture information about how instrumented applications use Java NIO.
Note: Introscope Java NIO metrics are only available on Java 1.5 JVMs or higher. Metric collection of Java NIO information is not available for JVM versions prior to Java 1.5.
The Introscope Java Agent collects metrics for NIO channels. For more information, see Channels (see page 286).
You can restrict the generation of certain NIO metrics. For more information, see Restricting Java NIO metrics (see page 287).
Java NIO tracer groups have been enabled by default. You can turn off these tracer groups to further restrict metric generation. For more information on turning on and off Java NIO tracer groups, see Default tracer groups and toggles files (see page 114).
Buffers
Java NIO data transfer is based on buffers. Buffer classes represent memory in a continuous block, together with a small number of data transfer operations. There are buffer classes for all of Java's primitive types, except boolean, which can share memory with byte buffers and allow arbitrary interpretation of the underlying bytes.
Metrics for the following buffer types are collected separately and displayed in the Workstation Investigator:
■ Byte Buffer
■ Int Buffer
■ Double Buffer
■ Long Buffer
■ Float Buffer
■ Short Buffer
These groupings are further divided into different buffer types. Since buffers may overlap, the Total Capacity (bytes) metric may overestimate the amout of memory allocated to NIO buffers.

Java NIO
286 Java Agent Guide
Direct and non-direct buffers are collected separately because of their differences in memory location and relative costs for creation. Direct buffers are allocated outside the JVM heap used for Java objects, so are not subject to Java garbage collection and relocation. This makes direct buffers optimal for I/O, but they may take more resources to create. Non-direct buffers, by constrast, are allocated as any normal Java object within the JVM heap.
Note: All buffer types may be either direct or non direct, except memory mapped files which are only direct buffers.
Channels
Java NIO channels provide bulk data transfers to and from NIO buffers, as well as external systems. This is a low-level data transfer mechanism that was specifically designed to address performance and scalability issues within standard Java I/O.
Channels provide mechanisms for moving bytes between buffers and external systems. Introscope channel metrics characterise data flow rates through channels. Collected NIO channel metrics correspond to metrics currently created for file and socket I/O using standard Java I/O techniques. Metrics for the following channel types are collected separately and displayed in the Workstation Investigator:
■ Datagram Channels
■ Socket Channels
NIODatagramTracing metrics
Although UDP is a connection-less protocol, the term "connection" is used in the description of NIODatagramTracing to describe how the Java Agent collects datagram metrics. The Java Agent collects metrics separately for each remote endpoint datagrams that are ‘sent to’ or ‘received from’. Connections are classified as client or server depending on the direction of the first datagram observed from each ‘to’ or ‘from’ endpoint.
For example, if the first datagram is ‘from’ the endpoint, the Java Agent classifies all further datagrams to or from that endpoint under NIO|Channels|Datagrams|Server|Port {PORT}, where {PORT} is the local port.
If the first datagram is ‘to’ the endpoint, all further datagrams to or from that endpoint are classified under NIO|Channels|Datagrams|Client|{HOST}|Port {PORT}, where {HOST} and {PORT} are the remote endpoint.

Java NIO
Appendix A: Java Agent Properties 287
The Java Agent also generates backend metrics for client "connections", except in the case of datagrams read by the 'receive' method. Datagram channels created using DatagramChannel connect method are considered client connections irrespective of direction of first datagram observed.
Note: Datagram channels created using a UDP connection (with a connect method) are considered client connections.
Restricting Java NIO metrics
Configure the properties for Java NIO instrumentation in the IntroscopeAgent.profile file, found in the <Agent_Home>\wily folder of your Java Agent installation. You can restrict generation of datagram and socket metrics by setting the following agent profile properties:
■ introscope.agent.nio.datagram.client.hosts (see page 288)
■ introscope.agent.nio.datagram.client.ports (see page 289)
■ introscope.agent.nio.datagram.server.ports (see page 290)
■ introscope.agent.nio.socket.client.hosts (see page 290)
■ introscope.agent.nio.socket.client.ports (see page 291)
■ introscope.agent.nio.socket.server.ports (see page 291)
These properties only affect the detail metrics generated by NIOSocketTracing and NIODatagramTracing tracer groups. For more information, see Default tracer groups and toggles files (see page 114).
Java NIO
288 Java Agent Guide
introscope.agent.nio.datagram.client.hosts
Restricts metric reporting to 'client' UDP "connections" with specified host(s).
Property settings
Comma separated list of hosts.
Default
undefined (no value)
Example
introscope.agent.nio.datagram.client.hosts=hostA,hostB
Notes
■ If the list is left empty, no host restriction will apply.
■ Hosts may be specified by name or textual representation of IP address (in either IPv4 or IPv6 forms).
■ Invalid host names will be reported in the agent log and ignored.
■ This property is dynamic. You can change the configuration of this property during run time and the change will be picked up automatically.
■ Duplicate host names are discarded. In cases where multiple host names map to a single IP, only one of the names is retained. The property will, however, match client connections with any of the set of synonymous names.

Java NIO
Appendix A: Java Agent Properties 289
introscope.agent.nio.datagram.client.ports
Lists the ports that will report NIO metrics. Only 'client' datagram metrics for specified ports will be generated.
Property settings
Comma separated list of port numbers. Port is the remote port to/from which datagrams are sent/received.
Default
undefined (no value)
Example
introscope.agent.nio.datagram.client.ports=123,456,789
Notes
■ If the list is empty, no port restriction will apply.
■ Invalid port numbers will be reported in the agent log and ignored.
■ This property is dynamic. You can change the configuration of this property during run time and the change will be picked up automatically.
■ Duplicate ports are discarded. In cases where multiple ports map to a single IP, only one of the ports is retained.

Java NIO
290 Java Agent Guide
introscope.agent.nio.datagram.server.ports
Lists the ports that will report NIO metrics. Only 'server' datagram metrics for specified ports will be generated.
Property settings
Comma separated list of port numbers. Port is the local port through which datagrams are sent/received.
Default
undefined (no value)
Example
introscope.agent.nio.datagram.server.ports=123,456,789
Notes
■ If the list is empty, no port restriction will apply.
■ Invalid port numbers will be reported in the agent log and ignored.
■ This property is dynamic. You can change the configuration of this property during run time and the change will be picked up automatically.
introscope.agent.nio.socket.client.hosts
Restricts metric reporting to 'client' TCP "connections" with specified host(s).
Property settings
Comma separated list of hosts.
Default
undefined (no value)
Example
introscope.agent.nio.socket.client.hosts=hostA, hostB
Notes
■ If the list is empty, no host restriction will apply.
■ Hosts may be specified by name or textual representation of IP address (in either IPv4 or IPv6 forms).
■ Invalid host names will be reported in the agent log and ignored.
■ This property is dynamic. You can change the configuration of this property during run time and the change will be picked up automatically.

Java NIO
Appendix A: Java Agent Properties 291
introscope.agent.nio.socket.client.ports
Lists the ports that will report NIO metrics. Only 'client' socket metrics for specified ports will be generated.
Property settings
Comma separated list of port numbers. Port is the remote port to/from which datagrams are sent/received.
Default
undefined (no value)
Example
introscope.agent.nio.socket.client.ports=123,456,789
Notes
■ If list is empty, no port restriction will apply.
■ Invalid port numbers will be reported in the agent log and ignored.
■ This property is dynamic. You can change the configuration of this property during run time and the change will be picked up automatically.
introscope.agent.nio.socket.server.ports
Lists the ports that will report NIO metrics. Only 'server' socket metrics for specified ports will be generated.
Property settings
Comma separated list of port numbers. Port is the local port through which datagrams are sent/received.
Default
undefined (no value)
Example
introscope.agent.nio.socket.client.ports=123,456,789
Notes
■ If list is empty, no port restriction will apply.
■ Invalid port numbers will be reported in the agent log and ignored.
■ This property is dynamic. You can change the configuration of this property during run time and the change will be picked up automatically.

JMX
292 Java Agent Guide
Java NIO metrics appear under the NIO node under the agent's top level node in the Workstation Investigator. Additional NIO metrics for any 'client' connections will appear under the Backends node.
Individual NIO metrics may be suppressed by commenting out the TraceOneMethodIfFlagged or TraceOneMethodWithParametersIfFlagged directives for the metric(s) to be suppressed. However, no tracers whose name ends with BackendTracer or MappingTracer should be commented out.
For example, to suppress the Concurrent Readers metric for Datagrams, comment out:
TraceOneMethodWithParametersIfFlagged: NIODatagramTracing read
NIODatagramConcurrentInvocationCounter "Concurrent Readers"
JMX
The following properties configure JMX metrics:
■ introscope.agent.jmx.enable (see page 292)
■ introscope.agent.jmx.ignore.attributes (see page 293)
■ introscope.agent.jmx.name.filter (see page 294)
■ introscope.agent.jmx.name.jsr77.disable (see page 295)
■ introscope.agent.jmx.name.primarykeys (see page 296)
■ introscope.agent.jmx.excludeStringMetrics (see page 297)
introscope.agent.jmx.enable
Enables collection of JMX Metrics.
Property settings
True or False.
Default
Varies by agent version.
Example
introscope.agent.jmx.enable=false
Notes
You must restart the managed application before changes to this property take effect.

JMX
Appendix A: Java Agent Properties 293
introscope.agent.jmx.ignore.attributes
Controls which (if any) JMX MBean attributes are to be ignored.
Property settings
A comma-separated list of keywords.
Default
Commented out; server.
Example
introscope.agent.jmx.ignore.attributes=server
Notes
■ If an MBean attribute name matches one on the list, the attribute will be ignored.
■ Leave the list empty to include all MBean attributes.
■ You must restart the managed application before changes to this property take effect.

JMX
294 Java Agent Guide
introscope.agent.jmx.name.filter
Specifies a comma-separated list of filter strings to determine what JMX data Introscope collects and displays.
Introscope reports JMX-generated metrics that match a filter string. Filter strings can contain the asterisk (*) and question mark (?) wildcard characters:
■ * matches zero or more characters
■ ? matches a single character.
To match a literal * or ?, escape the character with \\.
Examples:
■ ab\\*c matches a metric name that contains ab*c
■ ab*c matches a metric name that contains abc, abxc, abxxc etc.
■ ab?c matches a metric name that contains abxc
■ ab\\?c matches a metric names that contains ab?c
Default
Commented out.
For WebLogic:
ActiveConnectionsCurrentCount,WaitingForConnectionCurrentCount,PendingRequestCurr
entCount,ExecuteThreadCurrentIdleCount,OpenSessionsCurrentCount,j2eeType
Example
#introscope.agent.jmx.name.filter=ActiveConnectionsCurrentCount,WaitingForConnect
ionCurrentCount,PendingRequestCurrentCount,ExecuteThreadCurrentIdleCount,OpenSess
ionsCurrentCount,j2eeType
Notes
■ Leave empty to include all MBean data available in the system.
■ You must restart the managed application before changes to this property take effect.
JMX
Appendix A: Java Agent Properties 295
introscope.agent.jmx.name.jsr77.disable
This property controls whether or not Introscope collects and reports full JSR77 data, including complex JMX data.
This property is only available for use in the WebLogic and WebSphere IntroscopeAgent.profile files.
Property settings
True or False
Default
True
Notes
■ JSR-77 Management support must be provided by the application server in order for this property to have any effect.
■ You must restart the managed application before changes to this property take effect.
■ The property introscope.agent.jmx.name.jsr77.enable was removed in Introscope 6.1.

JMX
296 Java Agent Guide
introscope.agent.jmx.name.primarykeys
User-defined order of MBean information, and simplifies name conversion.
Property settings
A comma-separated, ordered list of keys which should uniquely identify a particular MBean.
Default
Commented out in default IntroscopeAgent.profile file.
Example
introscope.agent.jmx.name.primarykeys=J2EEServer
Notes
■ Property settings for WebLogic:
■ Type
■ Name
■ Comment out this property if using WebLogic Server 9.0.
■ Property settings for WebSphere:
■ J2EEServer
■ Application
■ j2eeType
■ JDBCProvider
■ name
■ mbeanIdentifier
■ You must restart the managed application before changes to this property take effect.
LeakHunter
Appendix A: Java Agent Properties 297
introscope.agent.jmx.excludeStringMetrics
Controls whether or not to include string-valued metrics. To enable string-valued metrics, set this property value to false.
Property settings
True or False
Default
True
Example
introscope.agent.jmx.excludeStringMetrics=true
Notes
■ Excluding string-valued metrics reduces the overall metric count, improving agent and EM performance.
■ You must restart the managed application before changes to this property take effect.
LeakHunter
The following properties configure agent interaction with LeakHunter:
■ introscope.agent.leakhunter.collectAllocationStackTraces (see page 298)
■ introscope.agent.leakhunter.enable (see page 298)
■ introscope.agent.leakhunter.leakSensitivity (see page 299)
■ introscope.agent.leakhunter.logfile.append (see page 299)
■ introscope.agent.leakhunter.logfile.location (see page 300)
■ introscope.agent.leakhunter.timeoutInMinutes (see page 300)

LeakHunter
298 Java Agent Guide
introscope.agent.leakhunter.collectAllocationStackTraces
Controls whether LeakHunter generates allocation stack traces for potential leaks. Turning this on gives you more precise data about the potential leak's allocation, but requires additional memory and CPU overhead.
Property settings
True or False
Default
False
Example
introscope.agent.leakhunter.collectAllocationStackTraces=
false
Notes
■ Turning on this option has the potential to create higher system overhead, in CPU usage and memory.
■ This property is dynamic. You can change the configuration of this property during run time and the change will be picked up automatically.
introscope.agent.leakhunter.enable
Enables LeakHunter functionality.
Property settings
True or False
Default
False
Example
introscope.agent.leakhunter.enable=false
Notes
■ Turning on this option has the potential to create higher system overhead, in CPU usage and memory.
■ You must restart the managed application before changes to this property take effect.
LeakHunter
Appendix A: Java Agent Properties 299
introscope.agent.leakhunter.leakSensitivity
Controls the sensitivity level of LeakHunter.
Property settings
Must be integer value from 1-10.
A higher sensitivity setting will result in more potential leaks reported and a lower sensitivity will result in fewer potential leaks reported.
Default
5
Example
introscope.agent.leakhunter.leakSensitivity=5
Notes
You must restart the managed application before changes to this property take effect.
introscope.agent.leakhunter.logfile.append
Specifies whether to replace the log file or add information to an existing log file on application restart.
Property settings
True or False
■ False replaces the log file.
■ True adds information to an existing log file.
Default
False
Example
introscope.agent.leakhunter.logfile.append=false
Notes
You must restart the managed application before changes to this property take effect.
LeakHunter
300 Java Agent Guide
introscope.agent.leakhunter.logfile.location
Location of the LeakHunter.log file. Relative file names are relative to the application working directory.
Default
logs/LeakHunter.log
This locates the log file in the logs directory of the agent.
Example
introscope.agent.leakhunter.logfile.location=logs/LeakHunter.log
Notes
■ If this property is commented out or left blank, no log file will be written.
■ You must restart the managed application before changes to this property take effect.
introscope.agent.leakhunter.timeoutInMinutes
Controls the length of time (in minutes) LeakHunter spends looking for new potential leaks. After the time-out, LeakHunter will stop looking for new potential leaks and just continue tracking the previously identified potential leaks.
Property settings
Must be a positive integer (no negative numbers).
Default
120
Example
introscope.agent.leakhunter.timeoutInMinutes=120
Notes
■ Set the value to zero if you want LeakHunter to always look for new potential leaks.
■ You must restart the managed application before changes to this property take effect.

Logging
Appendix A: Java Agent Properties 301
introscope.agent.leakhunter.ignore.<number>
Use this to ignore any class matching any supplied patterns. Ten classes have been supplied by default - comment out any you want to use.
Property settings
A comma-separated list of class matching patterns.
Default
None
Example
introscope.agent.leakhunter.ignore.4=java.util.SubList
introscope.agent.leakhunter.ignore.5=com.sun.faces.context.BaseContextMap$EntrySe
t
introscope.agent.leakhunter.ignore.6=com.sun.faces.context.BaseContextMap$Key
Notes
■ Some collections cannot be used with LeakHunter. In order for a collection to be LeakHunter-safe, it must be safe to call size() at any time, from any thread.
■ This property is dynamic. You can change the configuration of this property during run time and the change will be picked up automatically.
■ You can used the "*" wildcard.
Logging
The following properties configure agent logging options:
■ log4j.logger.IntroscopeAgent (see page 302)
■ log4j.appender.logfile.File (see page 303)
■ log4j.logger.IntroscopeAgent.inheritance (see page 303)
■ log4j.appender.pbdlog.File (see page 304)
■ log4j.appender.pbdlog (see page 304)
■ log4j.appender.pbdlog.layout (see page 305)
■ log4j.appender.pbdlog.layout.ConversionPattern (see page 305)
■ log4j.additivity.IntroscopeAgent.inheritance (see page 306)
Logging
302 Java Agent Guide
log4j.logger.IntroscopeAgent
This property controls both the logging level and the output location for log information.
Property settings
Level of detail value can be:
■ INFO
■ VERBOSE#com.wily.util.feedback.Log4JSeverityLevel
Destination value can be:
■ console
■ logfile
■ both console and logfile
Default
INFO, console, logfile
Example
log4j.logger.IntroscopeAgent=INFO,console,logfile
Notes
Changes to this property take effect immediately and do not require the managed application to be restarted.

Logging
Appendix A: Java Agent Properties 303
log4j.appender.logfile.File
Specifies the name and location of IntroscopeAgent.log file if logfile is specified in log4j.logger.IntroscopeAgent . The filename is relative to the directory that contains the agent profile.
Default
IntroscopeAgent.log
Example
log4j.appender.logfile.File=logs/IntroscopeAgent.log
Notes
System properties (Java command line -D options) are expanded as part of the file name. For example, if Java is started with -Dmy.property=Server1, then log4j.appender.logfile.File=logs/Introscope-${my.property}.log is expanded to: log4j.appender.logfile.File=logs/Introscope-Server1.log.
log4j.logger.IntroscopeAgent.inheritance
Controls log level and destination for log messages about classes that require instrumentation.
Property settings
To configure logging of classes that have not been instrumented because they extend a supertype or interface, set this property to: INFO, pbdlog
For information about inheritance class logging see Controlling directive logging (see page 75).
Default
None
Example
log4j.logger.IntroscopeAgent.inheritance=INFO,pbdlog
Logging
304 Java Agent Guide
log4j.appender.pbdlog.File
Identifies a log file for messages about classes that require instrumentation.
Property settings
To configure logging of classes that have not been instrumented because they extend a supertype or interface set to: pbdupdate.log
Default
None
Example
log4j.appender.pbdlog.File=pbdupdate.log
log4j.appender.pbdlog
Specifies a package for logging messages about classes that require instrumentation.
Property settings
To configure logging of classes that have not been instrumented because they extend a supertype or interface, set this property to: com.wily.introscope.agent.AutoNamingRollingFileAppender
Default
None
Example
log4j.appender.pbdlog=com.wily.introscope.agent.AutoNamingRollingFileAppender

Logging
Appendix A: Java Agent Properties 305
log4j.appender.pbdlog.layout
Specifies rules for logging messages about classes that require instrumentation.
Property settings
To configure logging of classes that have not been instrumented because they extend a supertype or interface, set this property to: com.wily.org.apache.log4j.PatternLayout
Default
None
Example
log4j.appender.pbdlog.layout=com.wily.org.apache.log4j.PatternLayout
log4j.appender.pbdlog.layout.ConversionPattern
Specifies rules for logging messages about classes that require instrumentation.
Property settings
To configure logging of classes that have not been instrumented because they extend a supertype or interface, set this property to:
%d{M/dd/yy hh:mm:ss a z} [%-3p] [%c] %m%n
Default
None
Example
log4j.appender.pbdlog.layout.ConversionPattern=%d{M/dd/yy hh:mm:ss a z} [%-3p] [%c]
%m%n

Metric count
306 Java Agent Guide
log4j.additivity.IntroscopeAgent.inheritance
Causes the directives for multiple level inheritance to be logged only in the pbdupdate.log file.
Property settings
True or False
Default
True
Example
log4j.additivity.IntroscopeAgent.inheritance=true
Notes
To configure the logging of multiple level inheritance directives in the pbdupdate.log only, add this property to the agent profile and set to false.
Metric count
The following property affects where you will see the Metric Count metric in the Investigator:
■ introscope.ext.agent.metric.count (see page 307)
Multiple inheritance
Appendix A: Java Agent Properties 307
introscope.ext.agent.metric.count
Controls where you will see the Metric Count metric in the Investigator. By default, the Metric Count is displayed as under the Custom Metric Agent node. If you want to see the Metric Count metric under the Agent Stats node, add this property to the IntroscopeAgent.profile.
Property settings
True or False
Default
Not present in the IntroscopeAgent.profile; False
Example
introscope.ext.agent.metric.count=true
Notes
Add this property to the IntroscopeAgent.profile and set it to true to see the ‘Metric Count’ metric under the ‘Agent Stats’ node.
Multiple inheritance
For directives based on interfaces or super classes, the agent is unable to detect multiple inheritance and hence those classes are not instrumented. Enable the following properties to determine those cases after the application server or the agent process starts up. These properties log classes which need to be instrumented but have not been and relies on dynamic instrumentation to affect the changes.
■ introscope.autoprobe.hierarchysupport.enabled (see page 308)
■ introscope.autoprobe.hierarchysupport.runOnceOnly (see page 308)
■ introscope.autoprobe.hierarchysupport.pollIntervalMinutes (see page 309)
■ introscope.autoprobe.hierarchysupport.executionCount (see page 309)
■ introscope.autoprobe.hierarchysupport.disableLogging (see page 310)
■ introscope.autoprobe.hierarchysupport.disableDirectivesChange (see page 310)

Multiple inheritance
308 Java Agent Guide
introscope.autoprobe.hierarchysupport.enabled
For agents that run under JDK 1.5 using AutoProbe and dynamic instrumentation, you can use this property to enable instrumentation of classes that extend a supertype or interface.
Property settings
True or False
Default
True
Example
introscope.autoprobe.hierarchysupport.enabled=true
Notes
You must restart the managed application before changes to this property take effect.
introscope.autoprobe.hierarchysupport.runOnceOnly
If you have enabled instrumentation of classes that extend a supertype or interface, you can use this property to control whether the utility that enables the feature runs only once, or at a specified interval.
Change this property to true only if you need detection on a periodic basis.
Property settings
True or False
Default
False
Example
introscope.autoprobe.hierarchysupport.enabled=false
Notes
■ Logging properties related to dynamic instrumentation are defined in Logging.
■ You must restart the managed application before changes to this property take effect.
Multiple inheritance
Appendix A: Java Agent Properties 309
introscope.autoprobe.hierarchysupport.pollIntervalMinutes
The polling interval to check for classes which could not be instrumented due to multiple inheritance. In most cases this happens only once; however, a conservative value is recommended to account for application server initialization.
Default
5
Example
introscope.autoprobe.hierarchysupport.pollIntervalMinutes=5
Notes
You must restart the managed application before changes to this property take effect.
introscope.autoprobe.hierarchysupport.executionCount
If you need the polling interval to run a finite times instead of running it only once or running it periodically, use this property to specify the exact number of times the polling interval is run. Always use this property to specify the exact number of times it should run.
Using this property overrides the run once only setting.
Property settings
A positive integer.
Default
3
Example
introscope.autoprobe.hierarchysupport.executionCount=3
Notes
You must restart the managed application before changes to this property take effect.

Platform monitoring
310 Java Agent Guide
introscope.autoprobe.hierarchysupport.disableLogging
Uncomment this property if you do not need to log the classes being detected. Only uncomment this property if dynamic instrumentation is enabled.
Property settings
True or False
Default
True
Example
#introscope.autoprobe.hierarchysupport.disableLogging=true
Notes
You must restart the managed application before changes to this property take effect.
introscope.autoprobe.hierarchysupport.disableDirectivesChange
Uncomment this property to only log the changes and disable the triggering of dynamic instrumentation.
Property settings
True or False
Default
True
Example
introscope.autoprobe.hierarchysupport.disableDirectivesChange=true
Notes
You must restart the managed application before changes to this property take effect.
Platform monitoring
The following property configures platform monitoring metrics:
■ introscope.agent.platform.monitor.system (see page 311)

Remote configuration
Appendix A: Java Agent Properties 311
introscope.agent.platform.monitor.system
Name of operating system to load a platform monitor for.
Property settings
See Troubleshooting platform monitoring (see page 234) for more information about the options for this property.
Default
Commented out; varies by platform.
Example
introscope.agent.platform.monitor.system=Solaris
Notes
You must restart the managed application before changes to this property take effect.
Remote configuration
The following properties allow remote configuration of the Java Agent:
■ introscope.agent.remoteagentconfiguration.enabled (see page 311)
■ introscope.agent.remoteagentconfiguration.allowedFiles (see page 312)
introscope.agent.remoteagentconfiguration.enabled
This property enables or disables remote configuration of the agent.
Property settings
True or False
Default
True
Example
introscope.agent.remoteagentconfiguration.enabled=true
Notes
Changes to this property take effect immediately and do not require the managed application to be restarted.
Security
312 Java Agent Guide
introscope.agent.remoteagentconfiguration.allowedFiles
This property lists the exact list of files that are allowed to be remotely transferred to this agent.
Property settings
domainconfig.xml
Default
domainconfig.xml
Example
introscope.agent.remoteagentconfiguration.allowedFiles=domainconfig.xml
Notes
Changes to this property take effect immediately and do not require the managed application to be restarted.
Security
The following property configures security of HTTP headers being sent to CA Wily CEM:
■ introscope.agent.decorator.security (see page 312)
introscope.agent.decorator.security
This property determines the format of decorated HTTP response headers, which are sent to CA Wily CEM.
Property settings
Clear: clear text encoding
Encrypted: header data is encrypted
Default
Clear
Example
introscope.agent.decorator.security=clear

Servlet header decorator
Appendix A: Java Agent Properties 313
Servlet header decorator
The following property enables correlation of transactions between Wily CEM and Wily Introscope:
■ introscope.agent.decorator.enabled (see page 313)
introscope.agent.decorator.enabled
If this Boolean value is set to true, it configures the agent to add additional performance monitoring information to HTTP response headers. ServletHeaderDecorator attaches the GUID to each transaction and inserts the GUID into an HTTP header, for example: x-wily-info
Property settings
True or False
Default
False
Example
introscope.agent.decorator.enabled=false
Socket metrics
Generation of I/O Socket metrics may be restricted by the following parameters:
■ introscope.agent.sockets.reportRateMetrics (see page 314)
■ introscope.agent.io.socket.client.hosts (see page 314)
■ introscope.agent.io.socket.client.ports (see page 315)
■ introscope.agent.io.socket.server.ports (see page 315)

Socket metrics
314 Java Agent Guide
introscope.agent.sockets.reportRateMetrics
Enables reporting of individual socket's input/output (I/O) bandwidth rate metrics.
Property settings
True or False
Default
False
Example
introscope.agent.sockets.reportRateMetrics=false
Notes
■ Only functions if ManagedSocketTracing is enabled and SocketTracing is disabled. See Backwards compatibility (see page 162) for more information.
■ You must restart the managed application before changes to this property take effect.
introscope.agent.io.socket.client.hosts
Restrict socket client connections instrumented to those with specified remote hosts.
Property settings
A comma-separate list of values.
Example
introscope.agent.io.socket.client.hosts=
Notes
■ If any individual value is invalid, it will be ignored.
■ If any parameter is not defined, or after exclusion of any invalid values is an empty list, no restriction will apply to that parameter.
■ This property is dynamic. You can change the configuration of this property during run time and the change will be picked up automatically.

Socket metrics
Appendix A: Java Agent Properties 315
introscope.agent.io.socket.client.ports
Restrict socket client connections instrumented to those with specified remote ports
Property settings
A comma-separate list of values.
Example
introscope.agent.io.socket.client.ports=
Notes
■ If any individual value is invalid, it will be ignored.
■ If any parameter is not defined, or after exclusion of any invalid values is an empty list, no restriction will apply to that parameter.
■ This property is dynamic. You can change the configuration of this property during run time and the change will be picked up automatically.
introscope.agent.io.socket.server.ports
Restrict socket client connections instrumented to those using specified local ports.
Property settings
A comma-separate list of values.
Example
introscope.agent.io.socket.server.ports=
Notes
■ If any individual value is invalid, it will be ignored.
■ If any parameter is not defined, or after exclusion of any invalid values is an empty list, no restriction will apply to that parameter.
■ This property is dynamic. You can change the configuration of this property during run time and the change will be picked up automatically.

SQL Agent
316 Java Agent Guide
SQL Agent
The following properties configure aspects of the SQL Agent:
■ introscope.agent.sqlagent.useblame (see page 316)
■ introscope.agent.sqlagent.normalizer.extension (see page 317)
■ introscope.agent.sqlagent.normalizer.regex.matchFallThrough (see page 318)
■ introscope.agent.sqlagent.normalizer.regex.keys (see page 318)
■ introscope.agent.sqlagent.normalizer.regex.key1.pattern (see page 319)
■ introscope.agent.sqlagent.normalizer.regex.key1.replaceAll (see page 319)
■ introscope.agent.sqlagent.normalizer.regex.key1.replaceFormat (see page 320)
■ introscope.agent.sqlagent.normalizer.regex.key1.caseSensitive (see page 320)
For more information, see Configuring the Introscope SQL Agent.
introscope.agent.sqlagent.useblame
This property configures the SQL Agent to optionally participate in the Introscope blame stack, thus creating blame metrics.
Property settings
True or False
Default
True
Example
introscope.agent.sqlagent.useblame=true
Notes
You must restart the managed application before changes to this property take effect.
The following property is used to set the custom SQL Agent normalizer extension:
SQL Agent
Appendix A: Java Agent Properties 317
introscope.agent.sqlagent.normalizer.extension
Specifies the name of the SQL normalizer extension that will be used to override the preconfigured normalization scheme.
To make custom normalization extension work, the value of its manifest attribute com-wily-Extension-Plugin-{pluginName}-Name should match the value given in this property.
If you specify a comma separated list of names, only the first name will be used. For example:
introscope.agent.sqlagent.normalizer.extension=ext1, ext2
Only ext1 will be used for normalization. Limits how much of a SQL statement appears in the Investigator tree for SQL Agent metrics, in bytes.
Property settings
The name of the SQL normalizer extension that is used to override the preconfigured normalization scheme.
Default
RegexSqlNormalizer
Example
introscope.agent.sqlagent.normalizer.extension=RegexSqlNormalizer
Notes
If you use the default setting, you also must configure the regular expressions SQL statement normalizer properties:
■ introscope.agent.sqlagent.normalizer.regex.matchFallThrough (see page 318)
■ introscope.agent.sqlagent.normalizer.regex.keys (see page 318)
■ introscope.agent.sqlagent.normalizer.regex.key1.pattern (see page 319)
■ introscope.agent.sqlagent.normalizer.regex.key1.replaceAll (see page 319)
■ introscope.agent.sqlagent.normalizer.regex.key1.replaceFormat (see page 320)
■ introscope.agent.sqlagent.normalizer.regex.key1.caseSensitive (see page 320)
Changes to this property take effect immediately and do not require the managed application to be restarted.

SQL Agent
318 Java Agent Guide
introscope.agent.sqlagent.normalizer.regex.matchFallThrough
Use this property in conjunction with introscope.agent.sqlagent.normalizer.extension (see page 317) to set the regular expressions SQL statement normalizer. When this property is set to true, it will evaluate SQL strings against all regex key groups.
The implementation is chained. For example, if SQL matches multiple key groups, the normalized SQL output from group1 is fed as input to group2, and so on.
If the property is set to false, as soon as a key group matches, the normalized SQL output from that group is returned.
Property settings
True or False
Default
false
Example
introscope.agent.sqlagent.normalizer.regex.matchFallThrough=false
Notes
Changes to this property take effect immediately and do not require the managed application to be restarted.
introscope.agent.sqlagent.normalizer.regex.keys
Use this property in conjunction with introscope.agent.sqlagent.normalizer.extension (see page 317) to set the regular expressions SQL statement normalizer. This property specifies the regex group keys. They are evaluated in order.
Default
key1
Example
introscope.agent.sqlagent.normalizer.regex.keys=key1
Notes
Changes to this property take effect immediately and do not require the managed application to be restarted.

SQL Agent
Appendix A: Java Agent Properties 319
introscope.agent.sqlagent.normalizer.regex.key1.pattern
Use this property in conjunction with introscope.agent.sqlagent.normalizer.extension (see page 317) to set the regular expressions SQL statement normalizer. This property specifies the regex pattern that will be used to match against the SQL.
Property settings
All valid regex entries allowed by java.util.Regex package can be used here.
Default
.*call(.*\)\.FOO(.*\)
Example
introscope.agent.sqlagent.normalizer.regex.key1.pattern=.*call(.*\)\.FOO(.*\)
Notes
Changes to this property take effect immediately and do not require the managed application to be restarted.
introscope.agent.sqlagent.normalizer.regex.key1.replaceAll
Use this property in conjunction with introscope.agent.sqlagent.normalizer.extension (see page 317) to set the regular expressions SQL statement normalizer. When this property is set to false, it will replace the first occurrence of the matching pattern in the SQL query with the replacement string. If set to true, it will replace all occurrences of the matching pattern in the SQL query with replacement the string.
Property settings
True or False
Default
false
Example
introscope.agent.sqlagent.normalizer.regex.key1.replaceAll=false
Notes
Changes to this property take effect immediately and do not require the managed application to be restarted.

SQL Agent
320 Java Agent Guide
introscope.agent.sqlagent.normalizer.regex.key1.replaceFormat
Use this property in conjunction with introscope.agent.sqlagent.normalizer.extension (see page 317) to set the regular expressions SQL statement normalizer. This property specifies the replacement string format.
Property settings
All valid regex entries allowed by the java.util.Regex package and java.util.regex.Matcher class can be used here.
Default
$1
Example
introscope.agent.sqlagent.normalizer.regex.key1.replaceFormat=$1
Notes
Changes to this property take effect immediately and do not require the managed application to be restarted.
introscope.agent.sqlagent.normalizer.regex.key1.caseSensitive
Use this property in conjunction with introscope.agent.sqlagent.normalizer.extension (see page 317) to set the regular expressions SQL statement normalizer. This property specifies whether the pattern match is sensitive to case.
Property settings
true or false
Default
false
Example
introscope.agent.sqlagent.normalizer.regex.key1.caseSensitive=false
Notes
Changes to this property take effect immediately and do not require the managed application to be restarted.
SSL communication
Appendix A: Java Agent Properties 321
SSL communication
The agent can connect to the Enterprise Manager over SSL. Use the following properties to configure that communication:
■ introscope.agent.enterprisemanager.transport.tcp.host.DEFAULT
■ introscope.agent.enterprisemanager.transport.tcp.port.DEFAULT
■ introscope.agent.enterprisemanager.transport.tcp.socketfactory.DEFAULT
■ introscope.agent.enterprisemanager.transport.tcp.truststore.DEFAULT
■ introscope.agent.enterprisemanager.transport.tcp.trustpassword.DEFAULT
■ introscope.agent.enterprisemanager.transport.tcp.keystore.DEFAULT
■ introscope.agent.enterprisemanager.transport.tcp.keypassword.DEFAULT
■ introscope.agent.enterprisemanager.transport.tcp.ciphersuites.DEFAULT
introscope.agent.enterprisemanager.transport.tcp.host.DEFAULT
Settings the Java Agent uses to find the Enterprise Manager and names given to host and port combinations.
Default
localhost
Example
introscope.agent.enterprisemanager.transport.tcp.host.DEFAULT=localhost
Notes
You must restart the managed application before changes to this property take effect.
SSL communication
322 Java Agent Guide
introscope.agent.enterprisemanager.transport.tcp.port.DEFAULT
Settings the Java Agent uses to find the Enterprise Manager and names given to host and port combinations.
Default
5443
Example
introscope.agent.enterprisemanager.transport.tcp.port.DEFAULT=5443
Notes
You must restart the managed application before changes to this property take effect.
introscope.agent.enterprisemanager.transport.tcp.socketfactory.DEFAULT
Settings the Java Agent uses to find the Enterprise Manager and names given to host and port combinations.
Default
com.wily.isengard.postofficehub.link.net.SSLSocketFactory
Example
ntroscope.agent.enterprisemanager.transport.tcp.socketfactory.DEFAULT=com.wily.is
engard.postofficehub.link.net.SSLSocketFactory
Notes
You must restart the managed application before changes to this property take effect.

SSL communication
Appendix A: Java Agent Properties 323
introscope.agent.enterprisemanager.transport.tcp.truststore.DEFAULT
Location of a truststore containing trusted Enterprise Manager certificates. If no truststore is specified, the agent trusts all certificates.
Property settings
Either an absolute path or a path relative to the agent's working directory.
Example
introscope.agent.enterprisemanager.transport.tcp.truststore.DEFAULT=/var/trustedc
erts
Notes
On Windows, backslashes must be escaped. For example: C:\\keystore
introscope.agent.enterprisemanager.transport.tcp.trustpassword.DEFAULT
The password for the truststore.
Example
introscope.agent.enterprisemanager.transport.tcp.trustpassword.DEFAULT=
introscope.agent.enterprisemanager.transport.tcp.keystore.DEFAULT
Location of a keystore containing the agent's certificate. A keystore is needed if the Enterprise Manager requires client authentication.
Property settings
Either an absolute path or a path relative to the agent's working directory.
Example
introscope.agent.enterprisemanager.transport.tcp.keystore.DEFAULT=c:\\keystore
Notes
On Windows, backslashes must be escaped. For example: C:\\keystore

Stall metrics
324 Java Agent Guide
introscope.agent.enterprisemanager.transport.tcp.keypassword.DEFAULT
The password for the keystore.
Example
introscope.agent.enterprisemanager.transport.tcp.keypassword.DEFAULT=MyPassword76
8
introscope.agent.enterprisemanager.transport.tcp.ciphersuites.DEFAULT
Set the enabled cipher suites.
Property settings
A comma-separated list of cipher suites.
Example
introscope.agent.enterprisemanager.transport.tcp.
ciphersuites.DEFAULT=SSL_DH_anon_WITH_RC4_128_MD5
Notes
If not specified, use the default enabled cipher suites.
Stall metrics
The following properties are for stall metrics:
■ introscope.agent.stalls.thresholdseconds (see page 325)
■ introscope.agent.stalls.resolutionseconds (see page 325)
For more information on stall metric properties, see Disabling the capture of stalls as Events (see page 208).

Stall metrics
Appendix A: Java Agent Properties 325
introscope.agent.stalls.thresholdseconds
Specifies the minimum threshold response time at which time a transaction is considered stalled.
Default
30
Example
introscope.agent.stalls.thresholdseconds=30
Notes
This property is dynamic. You can change the configuration of this property during run time and the change will be picked up automatically.
introscope.agent.stalls.resolutionseconds
Specifies the frequency that the agent checks for stalls.
Default
10
Example
introscope.agent.stalls.resolutionseconds=10
Notes
This property is dynamic. You can change the configuration of this property during run time and the change will be picked up automatically.
Transaction tracing
326 Java Agent Guide
Transaction tracing
The following properties are for transaction tracing and sampling:
■ introscope.agent.transactiontracer.parameter.httprequest.headers (see page 326)
■ introscope.agent.transactiontracer.parameter.httprequest.parameters (see page 327)
■ introscope.agent.transactiontracer.parameter.httpsession.attributes (see page 327)
■ introscope.agent.transactiontracer.userid.key (see page 328)
■ introscope.agent.transactiontracer.userid.method (see page 329)
■ introscope.agent.transactiontrace.componentCountClamp (see page 330)
■ introscope.agent.crossprocess.compression (see page 331)
■ introscope.agent.crossprocess.compression.minlimit (see page 332)
■ introscope.agent.crossprocess.correlationid.maxlimit (see page 333)
■ introscope.agent.transactiontracer.sampling.enabled (see page 333)
■ introscope.agent.transactiontracer.sampling.perinterval.count (see page 334)
■ introscope.agent.transactiontracer.sampling.interval.seconds (see page 334)
■ introscope.agent.transactiontrace.headFilterClamp (see page 335)
For more information, see Configuring Transaction Trace Options (see page 203).
introscope.agent.transactiontracer.parameter.httprequest.headers
Specifies (in comma-separated list) HTTP request header data to capture. Use a comma separated list.
Default
Commented out; User-Agent
Example
introscope.agent.transactiontracer.parameter.httprequest.headers=User-Agent
Notes
The IntroscopeAgent.profile contains a commented out statement that sets the value of this property to a null value. The user may optionally uncomment the statement and supply the desired header names.

Transaction tracing
Appendix A: Java Agent Properties 327
introscope.agent.transactiontracer.parameter.httprequest.parameters
Specifies (in comma-separated list) HTTP request parameter data to capture.
Default
Commented out; generic parameters.
Example
introscope.agent.transactiontracer.parameter.httprequest.parameters=parameter1,pa
rameter2
Notes
The IntroscopeAgent.profile contains a commented out statement that sets the value of this property to a null value. The user may optionally uncomment the statement and supply the desired parameter names.
introscope.agent.transactiontracer.parameter.httpsession.attributes
Specifies (in comma-separated list) HTTP session attribute data to capture.
Default
Commented out; generic parameters.
Example
introscope.agent.transactiontracer.parameter.httpsession.attributes=attribute1,at
tribute2
Notes
The IntroscopeAgent.profile contains a commented out statement that sets the value of this property to a null value. The user may optionally uncomment the statement and supply the desired parameter names.
Transaction tracing
328 Java Agent Guide
introscope.agent.transactiontracer.userid.key
User-defined key string.
Default
Commented out; generic parameters.
Example
#introscope.agent.transactiontracer.parameter.httpsession.attributes=attribute1,a
ttribute2
Notes
The IntroscopeAgent.profile contains a commented out statement that sets the value of this property to a null value. The user may optionally uncomment the statement and supply the correct value if, in your environment, user IDs are accessed using HttpServletRequest.getHeader or HttpServletRequest.getValue.
For more information, see introscope.agent.transactiontracer.userid.method (see page 329).

Transaction tracing
Appendix A: Java Agent Properties 329
introscope.agent.transactiontracer.userid.method
Specifies the method that returns User IDs. The Agent profile includes a commented out property definition for each of the three allowable values.
Uncomment the appropriate statement, based on whether user ID is accessed by getRemoteUser, getHeader, or getValue.
Property settings
Allowable values are:
■ HttpServletRequest.getRemoteUser
■ HttpServletRequest.getHeader
■ HttpServletRequest.getValue
Default
Commented out; see options above.
Example
The IntroscopeAgent.profile includes a commented out property definition for each of the three allowable values. You can uncomment the property you want to use.
introscope.agent.transactiontracer.userid.method=HttpServletRequest.getRemoteUser
#introscope.agent.transactiontracer.userid.method=HttpServletRequest.getHeader
#introscope.agent.transactiontracer.userid.method=HttpSession.getValue

Transaction tracing
330 Java Agent Guide
introscope.agent.transactiontrace.componentCountClamp
Limits the number of components allowed in a transaction trace.
Default
5000
Warning: If the clamp size is increased, the requirements on memory are higher. In extreme cases, the maximum heap size for the JVM may need to be adjusted or the managed application could run out of memory.
Example
introscope.agent.transactiontrace.componentCountClamp=5000
Notes
■ Any Transaction Trace exceeding the clamp is discarded at the agent and a warning message is logged in the agent log file.
■ This property is dynamic. You can change the configuration of this property during run time and the change will be picked up automatically.
■ When the set limit is reached, warnings appear in the log, and the trace stops.

Transaction tracing
Appendix A: Java Agent Properties 331
introscope.agent.crossprocess.compression
Use this property to reduce the size of cross process transaction tracing data.
Property settings
lzma, gzip, none
Default
lzma
Example
introscope.agent.crossprocess.compression=lzma
Notes
■ This option will increase agent CPU overhead, but reduce the size of interprocess headers.
■ lzma compression is more efficient than gzip, but may use more CPU.
■ .NET Agents do not support the gzip option, so if interoperability is required, do not use gzip.
■ This property is dynamic. You can change the configuration of this property during run time and the change will be picked up automatically.

Transaction tracing
332 Java Agent Guide
introscope.agent.crossprocess.compression.minlimit
Use this property to set the minimum length of cross process parameter data length for which to apply compression.
Property settings
Can be set from 0 to twice the total maximum limit, set in the introscope.agent.crossprocess.correlationid.maxlimit (see page 333).
If set below the default of 1500, the compression will run more frequently and consume more CPU overhead. The default setting of 1500 usually results in no impact to CPU overhead in normal conditions.
Default
1500
Example
introscope.agent.crossprocess.compression.minlimit=1500
Notes
■ Used with the introscope.agent.crossprocess.compression property above.
■ This property is dynamic. You can change the configuration of this property during run time and the change will be picked up automatically.

Transaction tracing
Appendix A: Java Agent Properties 333
introscope.agent.crossprocess.correlationid.maxlimit
Maximum size of cross process parameter data allowed.
If the total size of cross process parameter data is more than this limit, even after applying compression, some data will be dropped and some cross process correlation functionality will not work properly.
However, this settings will protect user transactions from failing in network transmission due to too large header size.
Default
4096
Example
introscope.agent.crossprocess.correlationid.maxlimit=4096
Notes
■ Used with the introscope.agent.crossprocess.compression and introscope.agent.crossprocess.compression.minlimit properties above
■ This property is dynamic. You can change the configuration of this property during run time and the change will be picked up automatically.
introscope.agent.transactiontracer.sampling.enabled
Uncomment the following property to disable Transaction Tracer Sampling.
Property settings
True or False
Default
False
Example
introscope.agent.transactiontracer.sampling.enabled=false
Notes
Changes to this property take effect immediately and do not require the managed application to be restarted.

Transaction tracing
334 Java Agent Guide
introscope.agent.transactiontracer.sampling.perinterval.count
This property is normally configured in the Enterprise Manager. Configuring this property in the agent disables the configuration in the Enterprise Manager. See the Introscope Configuration and Administration Guide for more information.
Default
1
Example
introscope.agent.transactiontracer.sampling.perinterval.count=1
Notes
You must restart the managed application before changes to this property take effect.
introscope.agent.transactiontracer.sampling.interval.seconds
This property is normally configured in the Enterprise Manager. Configuring this property in the agent disables the configuration in the Enterprise Manager. See the Introscope Configuration and Administration Guide for more information.
Default
120
Example
introscope.agent.transactiontracer.sampling.interval.seconds=120
Notes
You must restart the managed application before changes to this property take effect.

Transaction tracing
Appendix A: Java Agent Properties 335
introscope.agent.transactiontrace.headFilterClamp
Uncomment this property to specify the maximum depth of components allowed in head filtering, which is the process of examining the start of a transaction for the purpose of potentially collecting the entire transaction. Head filtering checks until the first blamed component exits, which can be a problem on very deep call stacks when no clamping is done. The clamp value limits the memory and CPU utilization impact of this behavior by forcing the agent to only look up to a fixed depth.
Default
30
Warning: If the clamp size is increased, the requirement on memory is higher. Garbage collection behavior will be affected, which will have an application-wide performance impact.
Example
introscope.agent.transactiontrace.headFilterClamp=30
Notes
■ Changes to this property take effect immediately and do not require the managed application to be restarted.
■ Any Transaction Trace whose depth exceeds the clamp will no longer be examined for possible collection UNLESS some other mechanism, such as sampling or user-initiated transaction tracing, is active to select the transaction for collection.

URL grouping
336 Java Agent Guide
introscope.agent.ttClamp
This property limits the number of transactions that are reported by the agent per reporting cycle.
Property settings
Integers.
Default
50
Example
introscope.agent.ttClamp=50
Notes
■ You must restart the managed application before changes to this property take effect.
■ If the property is not set (left blank), the value defaults to 200.
URL grouping
The following properties are for configuring URL Groups for frontend metrics:
■ introscope.agent.urlgroup.keys (see page 337)
■ introscope.agent.urlgroup.group.default.pathprefix (see page 337)
■ introscope.agent.urlgroup.group.default.format (see page 337)
For more information, see Using URL groups (see page 196).
URL grouping
Appendix A: Java Agent Properties 337
introscope.agent.urlgroup.keys
Configuration settings for Frontend naming.
Default
Default
Example
introscope.agent.urlgroup.keys=default
Notes
If a URL address belongs to two URL Groups, the order in which you list the keys for the URL Groups in this property is important. The URL Group defined by the narrower pattern should precede the URL Group specified by the broader pattern.
For example, if the URL Group with key alpha contains a single address, and the URL Group with key beta includes all addresses on the network segment that contains the address in the first URL Group, alpha should precede beta in the keys parameter.
introscope.agent.urlgroup.group.default.pathprefix
Configuration settings for frontend naming.
Default
*
Example
introscope.agent.urlgroup.group.default.pathprefix=*
introscope.agent.urlgroup.group.default.format
Configuration settings for Frontend naming.
Default
Default
Example
introscope.agent.urlgroup.group.default.format=default

WebSphere PMI
338 Java Agent Guide
WebSphere PMI
The following properties configure WebSphere PMI metrics:
■ introscope.agent.pmi.enable (see page 339)
■ introscope.agent.pmi.enable.alarmManager (see page 339)
■ introscope.agent.pmi.enable.bean (see page 340)
■ introscope.agent.pmi.enable.cache (see page 340)
■ introscope.agent.pmi.enable.connectionPool (see page 341)
■ introscope.agent.pmi.enable.hamanager (see page 341)
■ introscope.agent.pmi.enable.j2c (see page 342)
■ introscope.agent.pmi.enable.jvmpi (see page 342)
■ introscope.agent.pmi.enable.jvmRuntime (see page 343)
■ introscope.agent.pmi.enable.objectPool (see page 343)
■ introscope.agent.pmi.enable.orbPerf (see page 344)
■ introscope.agent.pmi.enable.scheduler (see page 344)
■ introscope.agent.pmi.enable.servletSessions (see page 345)
■ introscope.agent.pmi.enable.system (see page 345)
■ introscope.agent.pmi.enable.threadPool (see page 346)
■ introscope.agent.pmi.enable.transaction (see page 346)
■ introscope.agent.pmi.enable.webApp (see page 347)
■ introscope.agent.pmi.enable.webServices (see page 347)
■ introscope.agent.pmi.enable.wlm (see page 348)
■ introscope.agent.pmi.enable.wsgw (see page 348)
■ introscope.agent.pmi.filter.objref (see page 349)
These properties are found in the IntroscopeAgent.websphere.profile file, or the default agent profile for a WebSphere installation.

WebSphere PMI
Appendix A: Java Agent Properties 339
introscope.agent.pmi.enable
Enables collection of data from WebSphere PMI.
Property settings
True or False
Default
True
Example
introscope.agent.pmi.enable=true
Notes
You must restart the managed application before changes to this property take effect.
introscope.agent.pmi.enable.alarmManager
Enables collection of PMI alarm manager data when set to true.
Property settings
True or False
Default
False
Example
introscope.agent.pmi.enable.alarmManager=false
Notes
■ The alarm manager data category must be turned on in WebSphere to be visible as Introscope data.
■ You must restart the managed application before changes to this property take effect.

WebSphere PMI
340 Java Agent Guide
introscope.agent.pmi.enable.bean
Enables collection of PMI bean data.
Property settings
True or False
Default
False
Example
introscope.agent.pmi.enable.bean=false
introscope.agent.pmi.enable.cache
Enables collection of PMI cache data when set to true.
Property settings
True or False
Default
False
Example
introscope.agent.pmi.enable.cache=false
Notes
■ The cache data category must be turned on in WebSphere to be visible as Introscope data.
■ You must restart the managed application before changes to this property take effect.

WebSphere PMI
Appendix A: Java Agent Properties 341
introscope.agent.pmi.enable.connectionPool
Enables collection of PMI connectionPool data.
Property settings
True or False
Default
True
Example
introscope.agent.pmi.enable.connectionPool=true
introscope.agent.pmi.enable.hamanager
Enables collection of PMI manager data when set to true.
Property settings
True or False
Default
False
Example
introscope.agent.pmi.enable.hamanager=false
Notes
■ The manager data category must be turned on in WebSphere to be visible as Introscope data.
■ You must restart the managed application before changes to this property take effect.
WebSphere PMI
342 Java Agent Guide
introscope.agent.pmi.enable.j2c
Enables collection of PMI J2C data when set to true.
Property settings
True or False
Default
True
Example
introscope.agent.pmi.enable.j2c=true
Notes
■ The J2C data category must be turned on in WebSphere to be visible as Introscope data.
■ You must restart the managed application before changes to this property take effect.
introscope.agent.pmi.enable.jvmpi
Enables collection of PMI JVM PI data.
Property settings
True or False
Default
False
Example
introscope.agent.pmi.enable.jvmpi=false
Notes
For data to be provided to this module, JVMPI must be turned on in WebSphere.
WebSphere PMI
Appendix A: Java Agent Properties 343
introscope.agent.pmi.enable.jvmRuntime
Enables collection of PMI JVM runtime data.
Property settings
True or False
Default
False
Example
introscope.agent.pmi.enable.jvmRuntime=false
Notes
■ For data to be provided to this module, JVMPI must be turned on in WebSphere.
■ You must restart the managed application before changes to this property take effect.
introscope.agent.pmi.enable.objectPool
Enables collection of PMI object pool data when set to true.
Property settings
True or False
Default
False
Example
introscope.agent.pmi.enable.objectPool=false
Notes
■ The object pool data category must be turned on in WebSphere to be visible as Introscope data.
■ You must restart the managed application before changes to this property take effect.

WebSphere PMI
344 Java Agent Guide
introscope.agent.pmi.enable.orbPerf
Enables collection of PMI orbPerf data when set to true.
Property settings
True or False
Default
False
Example
introscope.agent.pmi.enable.orbPerf=false
Notes
■ The orbPerf data category must be turned on in WebSphere to be visible as Introscope data.
■ You must restart the managed application before changes to this property take effect.
introscope.agent.pmi.enable.scheduler
Enables collection of PMI scheduler data when set to true.
Property settings
True or False
Default
False
Example
introscope.agent.pmi.enable.scheduler=false
Notes
■ The scheduler data category must be turned on in WebSphere to be visible as Introscope data.
■ You must restart the managed application before changes to this property take effect.
WebSphere PMI
Appendix A: Java Agent Properties 345
introscope.agent.pmi.enable.servletSessions
Enables collection of PMI servletSessions data.
Property settings
True or False
Default
True
Example
introscope.agent.pmi.enable.servletSessions=true
Notes
You must restart the managed application before changes to this property take effect.
introscope.agent.pmi.enable.system
Enables collection of PMI system data when set to true.
Property settings
True or False
Default
False
Example
introscope.agent.pmi.enable.system=false
Notes
■ The system data category must be turned on in WebSphere to be visible as Introscope data.
■ You must restart the managed application before changes to this property take effect.

WebSphere PMI
346 Java Agent Guide
introscope.agent.pmi.enable.threadPool
Enables collection of PMI thread pool data when set to true.
Property settings
True or False
Default
True
Example
introscope.agent.pmi.enable.threadPool=true
Notes
■ The thread pool data category must be turned on in WebSphere to be visible as Introscope data.
■ You must restart the managed application before changes to this property take effect.
introscope.agent.pmi.enable.transaction
Enables collection of PMI transaction data.
Property settings
True or False
Default
False
Example
introscope.agent.pmi.enable.transaction=false
Notes
You must restart the managed application before changes to this property take effect.
WebSphere PMI
Appendix A: Java Agent Properties 347
introscope.agent.pmi.enable.webApp
Enables collection of PMI webApp data.
Property settings
True or False
Default
False
Example
introscope.agent.pmi.enable.webApp=false
Notes
You must restart the managed application before changes to this property take effect.
introscope.agent.pmi.enable.webServices
Enables collection of PMI web services data when set to true.
Property settings
True or False
Default
False
Example
introscope.agent.pmi.enable.webServices=false
Notes
■ The web services data category must be turned on in WebSphere to be visible as Introscope data.
■ You must restart the managed application before changes to this property take effect.

WebSphere PMI
348 Java Agent Guide
introscope.agent.pmi.enable.wlm
Enables collection of PMI WLM data when set to true.
Property settings
True or False
Default
False
Example
introscope.agent.pmi.enable.wlm=false
Notes
■ The WLM data category must be turned on in WebSphere to be visible as Introscope data.
■ You must restart the managed application before changes to this property take effect.
introscope.agent.pmi.enable.wsgw
Enables collection of PMI WSGW data when set to true.
Property settings
True or False
Default
False
Example
introscope.agent.pmi.enable.wsgw=false
Notes
■ The WSGW data category must be turned on in WebSphere to be visible as Introscope data.
■ You must restart the managed application before changes to this property take effect.

WLDF metrics
Appendix A: Java Agent Properties 349
introscope.agent.pmi.filter.objref
Controls for hard-coded filters.
The objref filter filters out names ending with "@xxxxx" where "xxxxx" is a numeric string.
Property settings
True or False
Default
False
Example
introscope.agent.pmi.filter.objref=false
Notes
You must restart the managed application before changes to this property take effect
WLDF metrics
The following properties configure WLDF metrics:
■ introscope.agent.wldf.enable (see page 350)

WLDF metrics
350 Java Agent Guide
introscope.agent.wldf.enable
Enables collection of WLDF metrics.
Property settings
True or False
Default
False
Example
introscope.agent.wldf.enable=false
Notes
For WebLogic 9.x and above only.

Appendix B: Using the CA Wily PBD Generator 351
Appendix B: Using the CA Wily PBD Generator
You can use the CA Wily PBD Generator tool to instrument custom Java class files for use by Java Agents.
This section contains the following topics:
About the CA Wily PBD Generator (see page 351) Configuring the CA Wily PBD Generator (see page 352) Using the CA Wily PBD Generator (see page 352)
About the CA Wily PBD Generator
The Wily PBD Generator utility can create a PBD file from Javadoc tags with which you have annotated your Java code, to facilitate the instrumentation of custom Java class files for use by the Java Agent.
The PBD Generator examines a set of Java source files, and instruments the methods in the classes that contain the Javadoc tag @instrument.
Using the PBD Generator tool, you can:
■ automate building of PBD files, to eliminate potential for errors that might be introduced by creating PBD files manually.
■ integrate PBD generation into your build systems to create and update PBD files automatically and incorporate any changes to the Java source.
You configure the PBD Generator by integrating it into an Apache Ant target using the WilyPBDGenerator.jar file, then running it as an Ant Javadoc task.

Configuring the CA Wily PBD Generator
352 Java Agent Guide
Configuring the CA Wily PBD Generator
This tool is intended to be incorporated into Ant-based build systems, as a Javadoc task in an Ant target.
This sample Javadoc task illustrates the use of this tool in Ant:
<javadoc sourcepath="/src/engineering/products/introscope/source"
destdir="/src/engineering/products/introscope/source/generatedpbd"
maxmemory="512m"
packagenames="com.wily.introscope.console.thornhill.ui.util"
verbose="false"
private="true">
<doclet name="com.wily.util.build.javadoc.PBDInstrumentDoclet"
path="/Wily/tools/WilyPBDGenerator.jar">
<param name="-d"
value="/src/engineering/products/introscope/source/generatedpbd"/>
</doclet>
</javadoc>
Required PBD Generator parameters
These key PBD Generator parameters are required:
sourcepath
the root directory of the Java source tree
destdir
the directory path of the PBD file that will be output from the tool
packagenames
a comma-separated list of the Java packages to be examined for instrumentation
doclet path
the path to find the PBD Generator jar file, which contains this tool
param name="-d"
this must contain the same value as destdir
Using the CA Wily PBD Generator
Before you can use the PBD Generator, you insert special Javadoc tags into the Java source files to be instrumented.

Using the CA Wily PBD Generator
Appendix B: Using the CA Wily PBD Generator 353
The syntax for the JavaDoc tag is:
@instrument <valid metric prefix> <optional tracer name>
where:
<valid metric prefix> is any valid Introscope metric prefix—a string without a colon character (:). Pipe characters (|) are acceptable.
<optional tracer name> can be BlamePointTracer, FrontendMarker or BackendMarker. The default is BlamePointTracer if the tracer name is missing.


Appendix C: Manual ProbeBuilding 355
Appendix C: Manual ProbeBuilding
This section provides instructions for manually instrumenting your applications. Manual ProbeBuilding is a non-dynamic method of instrumenting your applications.
This section contains the following topics:
Before you begin (see page 355) Using the ProbeBuilder wizard (see page 356) Using the command-line ProbeBuilder (see page 358) Running instrumented code (see page 361) Switching back to non-instrumented code (see page 362) The ProbeBuilder Wizard.lax file (see page 362)
Before you begin
When you run ProbeBuilder manually, it instruments classes on disk before the application server is run. You use manual ProbeBuilding when your environment does not support AutoProbe, or you prefer not to use AutoProbe.
Warning: Introscope supports other methods of instrumenting applications. CA Technologies recommends you use these other methods before using manual ProbeBuilding. These methods are:
■ Using JVM AutoProbe. See AutoProbe and ProbeBuilding Options (see page 61) for more information.
■ Using AutoProbe for application servers. See The Java Agent and Application Server AutoProbe (see page 365) for more information.
Manual ProbeBuilding should not be used with other methods of instrumentation, and should be used as a last resort.
Contact CA Support if you are not sure you should use manual ProbeBuilding.

Using the ProbeBuilder wizard
356 Java Agent Guide
The instructions for manual ProbeBuilding assume you have performed the following installation and configuration tasks:
1. Installed the Java Agent. See Installing the Java Agent (see page 29) for more information.
2. Configured Java Agent connection properties. See Connecting to the Enterprise Manager (see page 48) for more information.
3. Configured the Java Agent name. See Java Agent Naming (see page 147) for more information.
4. Configured options for ProbeBuilder. See AutoProbe and ProbeBuilding Options (see page 61) for more information.
Manual ProbeBuilding options
There are two ways to instrument your bytecode manually:
■ The ProbeBuilder Wizard—a GUI dialog for running ProbeBuilder. Follow the instructions in Using the ProbeBuilder wizard (see page 356).
■ The Command-line ProbeBuilder—A command-line interface for environments without a windowing system. Follow the instructions in Using the command-line ProbeBuilder (see page 358).
Using the ProbeBuilder wizard
If your machine has a windowing environment, use the instructions in this section to add probes to your bytecode. These instructions assume that you have:
■ Installed the Java Agent. See Installing the Java Agent (see page 29) for more information.
■ Selected the ProbeBuilder Wizard option from the Enterprise Manager installation process. See the Introscope Configuration and Administration Guide for information on how to install the Enterprise Manager.
■ Configured basic agent settings as described in Installing and Configuring the Java Agent (see page 27).
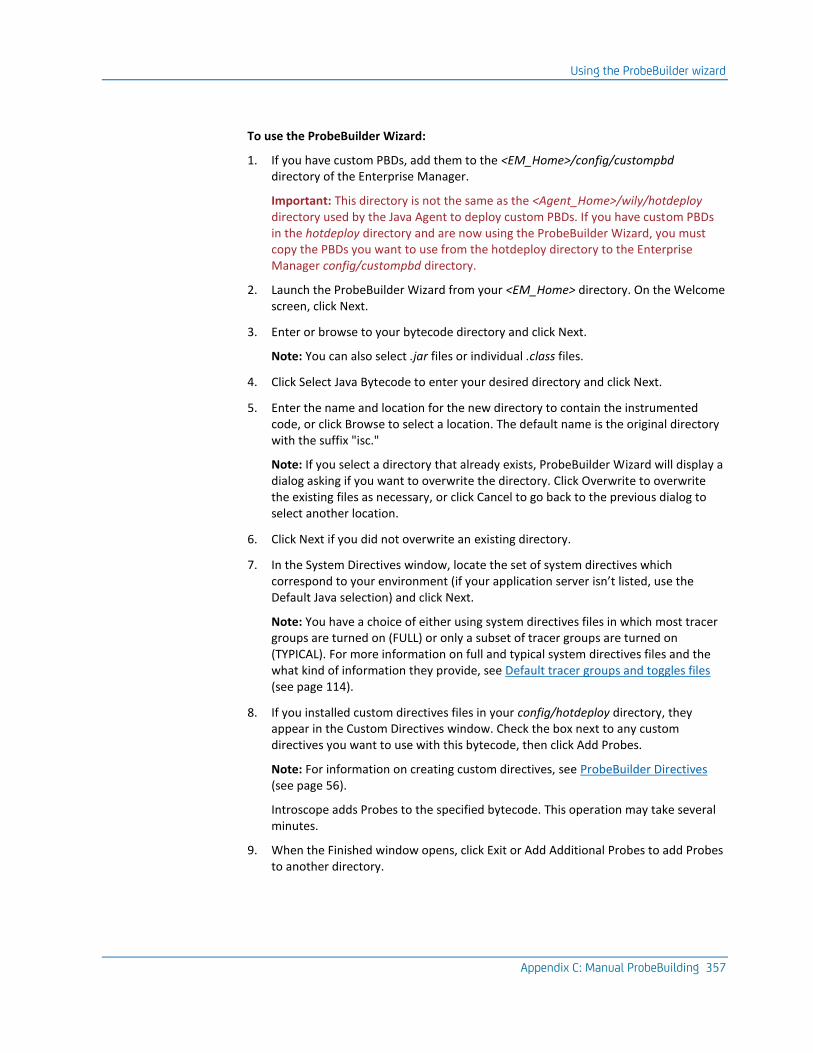
Using the ProbeBuilder wizard
Appendix C: Manual ProbeBuilding 357
To use the ProbeBuilder Wizard:
1. If you have custom PBDs, add them to the <EM_Home>/config/custompbd directory of the Enterprise Manager.
Important: This directory is not the same as the <Agent_Home>/wily/hotdeploy directory used by the Java Agent to deploy custom PBDs. If you have custom PBDs in the hotdeploy directory and are now using the ProbeBuilder Wizard, you must copy the PBDs you want to use from the hotdeploy directory to the Enterprise Manager config/custompbd directory.
2. Launch the ProbeBuilder Wizard from your <EM_Home> directory. On the Welcome screen, click Next.
3. Enter or browse to your bytecode directory and click Next.
Note: You can also select .jar files or individual .class files.
4. Click Select Java Bytecode to enter your desired directory and click Next.
5. Enter the name and location for the new directory to contain the instrumented code, or click Browse to select a location. The default name is the original directory with the suffix "isc."
Note: If you select a directory that already exists, ProbeBuilder Wizard will display a dialog asking if you want to overwrite the directory. Click Overwrite to overwrite the existing files as necessary, or click Cancel to go back to the previous dialog to select another location.
6. Click Next if you did not overwrite an existing directory.
7. In the System Directives window, locate the set of system directives which correspond to your environment (if your application server isn’t listed, use the Default Java selection) and click Next.
Note: You have a choice of either using system directives files in which most tracer groups are turned on (FULL) or only a subset of tracer groups are turned on (TYPICAL). For more information on full and typical system directives files and the what kind of information they provide, see Default tracer groups and toggles files (see page 114).
8. If you installed custom directives files in your config/hotdeploy directory, they appear in the Custom Directives window. Check the box next to any custom directives you want to use with this bytecode, then click Add Probes.
Note: For information on creating custom directives, see ProbeBuilder Directives (see page 56).
Introscope adds Probes to the specified bytecode. This operation may take several minutes.
9. When the Finished window opens, click Exit or Add Additional Probes to add Probes to another directory.

Using the command-line ProbeBuilder
358 Java Agent Guide
Update the application startup script
After adding probes to the bytecode, update the application startup script to specify the location of the instrumented code and the Java Agent.
To specify the location of the instrumented code:
1. Edit the classpath of the application startup script to include locations of the directories containing the instrumented code created with the ProbeBuilder. Make sure this reference precedes the reference to the original code in the classpath.
2. Edit the classpath in the application startup script to include the path to the <EM_Home>/lib/Agent.jar.
For example, edit an existing classpath:
<your_application_path>/classes:/<your_application_path>/lib/app.jar
MainClass
to look like this:
<your-applicationpath>.isc/classes:/<your-applicationpath>.isc/lib/app.jar:/<
EM_Home>/lib/Agent.jar MainClass
3. Save the changes.
4. Start your application with the new startup script.
Using the command-line ProbeBuilder
If your machine does not have a windowing environment, use the instructions in this section to add probes to your bytecode.
In Introscope 8.0, the command-line ProbeBuilder was migrated to Java Development Kit (JDK) 1.4.2. This affects users who:
■ have a managed application running under JDK 1.3.
■ cannot run their applications with AutoProbe.
■ have never instrumented their applications before OR need to upgrade the Java Agent to 8.0 or later.
■ cannot install JDK 1.4 or later on their servers.
If one or more of the above conditions apply to your environment, use a version of ProbeBuilder from Introscope 7.1 or earlier.
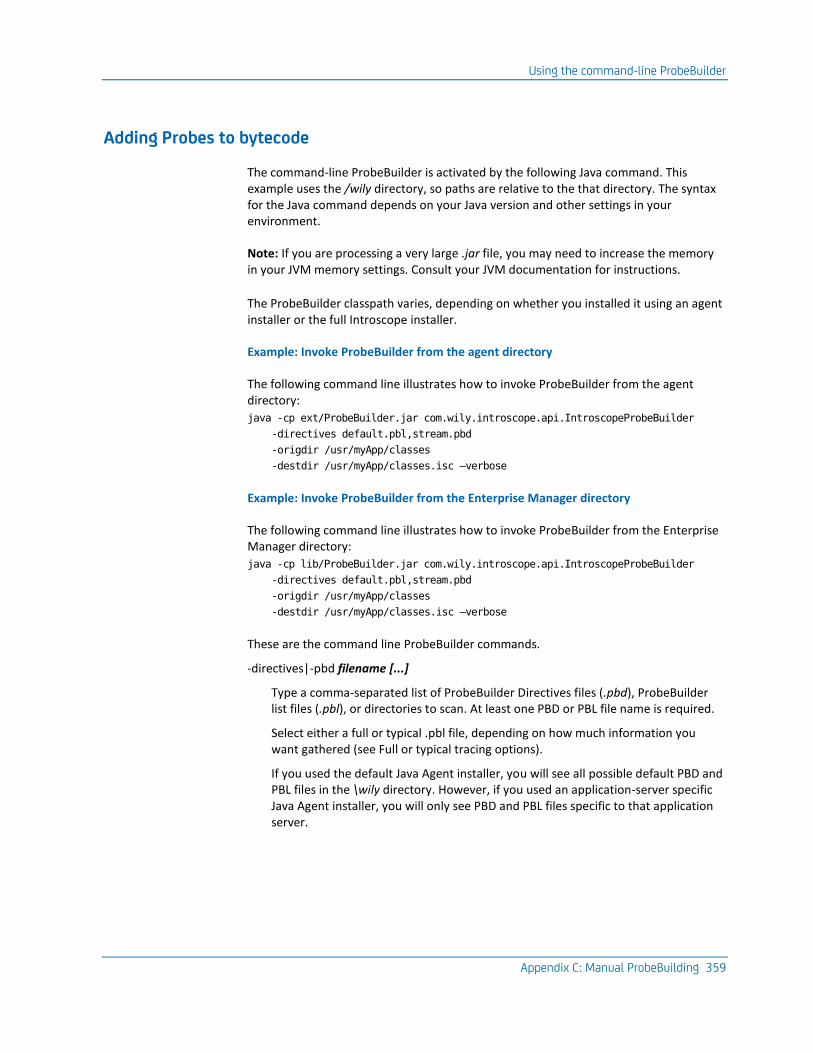
Using the command-line ProbeBuilder
Appendix C: Manual ProbeBuilding 359
Adding Probes to bytecode
The command-line ProbeBuilder is activated by the following Java command. This example uses the /wily directory, so paths are relative to the that directory. The syntax for the Java command depends on your Java version and other settings in your environment.
Note: If you are processing a very large .jar file, you may need to increase the memory in your JVM memory settings. Consult your JVM documentation for instructions.
The ProbeBuilder classpath varies, depending on whether you installed it using an agent installer or the full Introscope installer.
Example: Invoke ProbeBuilder from the agent directory
The following command line illustrates how to invoke ProbeBuilder from the agent directory:
java -cp ext/ProbeBuilder.jar com.wily.introscope.api.IntroscopeProbeBuilder
-directives default.pbl,stream.pbd
-origdir /usr/myApp/classes
-destdir /usr/myApp/classes.isc –verbose
Example: Invoke ProbeBuilder from the Enterprise Manager directory
The following command line illustrates how to invoke ProbeBuilder from the Enterprise Manager directory:
java -cp lib/ProbeBuilder.jar com.wily.introscope.api.IntroscopeProbeBuilder
-directives default.pbl,stream.pbd
-origdir /usr/myApp/classes
-destdir /usr/myApp/classes.isc –verbose
These are the command line ProbeBuilder commands.
-directives|-pbd filename [...]
Type a comma-separated list of ProbeBuilder Directives files (.pbd), ProbeBuilder list files (.pbl), or directories to scan. At least one PBD or PBL file name is required.
Select either a full or typical .pbl file, depending on how much information you want gathered (see Full or typical tracing options).
If you used the default Java Agent installer, you will see all possible default PBD and PBL files in the \wily directory. However, if you used an application-server specific Java Agent installer, you will only see PBD and PBL files specific to that application server.
Using the command-line ProbeBuilder
360 Java Agent Guide
Select one set of the next three pairs to specify your original code location and your instrumented code destination, using directories, jar files, or classes.
-origdir directory -destdir directory
Specifies the original directory name (including subdirectories) and the destination directory.
-origjar filename -destjar filename
Specifies the original archive file name, including .jar, .zip, .war, .rar and .ear archives and the destination archive file name.
-origclass filename -destclass filename
Specifies the original class file name and the destination class file name.
The following command line settings are optional.
-skipitems
Skips any files that are not Java bytecode files or archive files (.jar and .zip files). If -skipitems is not set, the non-Java bytecode files are copied to the destination, unchanged.
-help -h -?
Displays a help screen
-prompt
Turns on an interactive text UI when problems arise.
-verbose
Displays informational messages about each operation being performed by the ProbeBuilder program.

Running instrumented code
Appendix C: Manual ProbeBuilding 361
Editing the classpath
After adding probes to the bytecode, update the classpath of the application startup script to reflect the locations of the instrumented code and the Java Agent.
To update the classpath:
1. Edit the classpath of the application startup script to include locations of the directories containing the instrumented code created with the ProbeBuilder. Make sure this reference precedes the reference to the original code in the classpath.
2. Edit the classpath in the application startup script to include the path to the Agent.jar file.
For example, you might edit a classpath that looks like this:
<your_application_path>/lib/app.jar MainClass
to look like this:
<your-applicationpath>.isc/lib/app.jar:/<ApplicationServer_Home>/wily/Agent.j
ar MainClass
3. Save the changes.
4. Start your application with the new startup script.
Running instrumented code
There are three ways to point to instrumented code instead of your original code:
■ In classpaths, replace original class paths with instrumented code paths.
The instructions in this section directed you to perform this process when you instrumented your application for the first time.
■ Prepend paths to classpaths.
If only part of the application’s code was instrumented, you could place the instrumented code paths before the original-code paths (prepend) in the classpath.
If you do this, instrumented code loads and reports performance data. Non-instrumented code still loads and works normally, but does not report performance data.

Switching back to non-instrumented code
362 Java Agent Guide
■ Place instrumented code in original classpath.
Use this method when classpaths are set in many places, or to conduct an evaluation. Be careful using this method in a production environment. With this method, it is easy to forget whether you are using the original or the instrumented code.
■ Move the original code to a new location. Leave the classpaths unchanged. Then move the instrumented code to the original location.
■ On a UNIX machine, you could also create a symbolic link from the current location of the instrumented code to the original location.
Switching back to non-instrumented code
If you want to switch back to using non-instrumented code, undo the steps of modifying classpaths to run instrumented code, as described below:
■ If you put the paths to your instrumented code into the Java classpaths, then replace paths to the instrumented code in Java classpaths with original paths.
■ If you added paths to the instrumented code in front of the paths to the original code, remove prepended paths to classpaths
Remove the prepended portion of the classpath so that only the original classpath remains.
■ If you put instrumented code in the original classpath, then remove the Instrumented code from the original path and place the original code in the original classpath.
If you used symbolic links on a UNIX system, point the symbolic link to the original directory or remove the link and move the code into the original classpath.
The ProbeBuilder Wizard.lax file
The ProbeBuilder Wizard.lax file is located here:
<Introscope home>/Introscope ProbeBuilder Wizard.lax
lax.nl.current.vm
VM to use the next time the ProbeBuilder is started. Can be set to any installed JDK.
Default: JRE version 1.6.0_11 (varies by operating system)
lax.stderr.redirect
Standard Error Output. Leave blank for no output, console to send to a console window, or any path to a file to save to the file.
Default: blank

The ProbeBuilder Wizard.lax file
Appendix C: Manual ProbeBuilding 363
lax.stdin.redirect
Standard Input. Leave blank for no input, console to read from the console window, or any path to a file to read from that file.
Default: blank
lax.stdout.redirect
Standard Output. Leave blank for no output, console to send to a console window, or any path to a file to save to the file.
Default: blank


Appendix D: The Java Agent and Application Server AutoProbe 365
Appendix D: The Java Agent and Application Server AutoProbe
This section provides instructions for deploying the Java Agent on other application servers.
This section contains the following topics:
Deploying the Java Agent on other application servers (see page 365) Configuring Sun ONE 7.0 (see page 366) Configuring Oracle 10g 10.0.3 (see page 367) Configuring WebLogic Server (see page 368) Configuring HTTP servlet tracing (see page 368)
Deploying the Java Agent on other application servers
JVM AutoProbe (see Configuring JVM AutoProbe (see page 62)) is the most commonly used method for instrumenting applications. CA Technologies highly recommends using JVM AutoProbe to instrument your applications.
However, you can use Application Server AutoProbe if you are running JVMs 1.4 or lower on the following application servers:
■ Sun ONE 7.0
Application Server AutoProbe is only supported on Sun ONE version 7 application server. See Configuring Sun ONE 7.0 (see page 366).
■ Oracle 10g 10.0.3
Application Server AutoProbe is only supported on Oracle version 10g 10.0.3 application server. See Configuring Oracle 10g 10.0.3 (see page 367).
■ WebSphere or WebLogic
For information about configuring AutoProbe on WebSphere and WebLogic, see Deploying the Java Agent on WebSphere (see page 85) and Deploying the Java Agent on WebLogic (see page 77).
Important: Application Server AutoProbe is not supported on:
■ any JVM 1.5 and above platforms
■ OS/400
Warning: Use only one method to instrument your applications. If you have already started using JVM AutoProbe, do not use Application Server AutoProbe.

Configuring Sun ONE 7.0
366 Java Agent Guide
When starting the application server, avoid using the hyphen (-) character as an identifier for a classname. Introscope does not parse this character, and using it might lead to class loading errors in the agent logs.
Configuring Sun ONE 7.0
The following steps detail how to configure Sun ONE installations to use AutoProbe to instrument applications.
To configure Sun ONE 7.0 to use AutoProbe:
Note: The use of "..." in the .xml examples below indicates that there is additional information in the .xml code (not relevant to the example) that is not shown.
1. In order to add Introscope information to startup scripts for Sun ONE 7.0, you must be logged in as Administrator or Root.
2. Open the server.xml file, located at:
<Sun ONE install dir>/domains/domain1/server1/config/
Note: The item separator is a colon (:).
3. Add the full path of wily/Agent.jar to the "server-classpath" property of the java-config element in the server.xml file. For example:
<java-config ... server-classpath="/sw/sun/sunone7/wily/Agent.jar:..." ...>
4. Add the following to the java-config element:
■ Add the bytecode-preprocessors property and set it to the value com.wily.introscope.api.sun.appserver.SunONEAutoProbe.
For example:
<java-config ...
bytecode-preprocessors="com.wily.introscope.api.sun.appserver.SunONEAutoP
robe">
■ Add a jvm-options element to define the location of the agent profile. Define either com.wily.introscope.agentProfile, or com.wily.introscope.agentResource.
The following is an example of com.wily.introscope.agentProfile:
<java-config ...>
...
<jvm-options>-Dcom.wily.introscope.agentProfile=/sw/sun/sunone7/wily/Intr
oscopeAgent.profile </jvm-options>
</java-config>

Configuring Oracle 10g 10.0.3
Appendix D: The Java Agent and Application Server AutoProbe 367
The following is an example of com.wily.introscope.agentResource:
<java-config ...>
...
<jvm-options>-Dcom.wily.introscope.agentResource=<virtual path
to>/IntroscopeAgent.profile</jvm-options>
</java-config>
■ OPTIONAL: If you configured com.wily.introscope.agentResource, add the resource file to the server classpath.
5. Configure Tracer Groups to collect servlet data. For more information, see Configuring HTTP servlet tracing (see page 368).
Configuring Oracle 10g 10.0.3
The following steps detail how to configure Oracle 10g installations to use AutoProbe to instrument applications.
To configure Oracle 10g 10.0.3 to use AutoProbe:
1. Add Agent.jar to the application server classpath.
2. Set the system property oracle.classpreprocessor.classes with the value of com.wily.introscope.api.oracle.OracleAutoProbe.
3. Set the system property oracle.j2ee.class.preprocessing with the value of true.
4. Run this command at the command line:
-Dcom.wily.introscope.probebuilder.oracle.enable=true
5. Restart the Oracle Application Server 10g, using this command:
java
-Doracle.classpreprocessor.classes=com.wily.introscope.api.oracle.OracleAutoP
robe -Doracle.j2ee.class.preprocessing=true
-Dcom.wily.introscope.probebuilder.oracle.enable=true -classpath
oc4j.jar:<path to wily install dir>/wily/Agent.jar
com.evermind.server.OC4JServer -config <path to oracle install
dir>/config/server.xml
Important: Users running Oracle 10g Release 2 using Sun JDK 1.42 must use the ^ (caret) character to escape a forward slash when issuing commands. For example:
-Xbootclasspath^/p:<IntroscopeAgent.jar path>
6. Configure Tracer Groups to collect servlet data. For more information, see Configuring HTTP servlet tracing (see page 368).
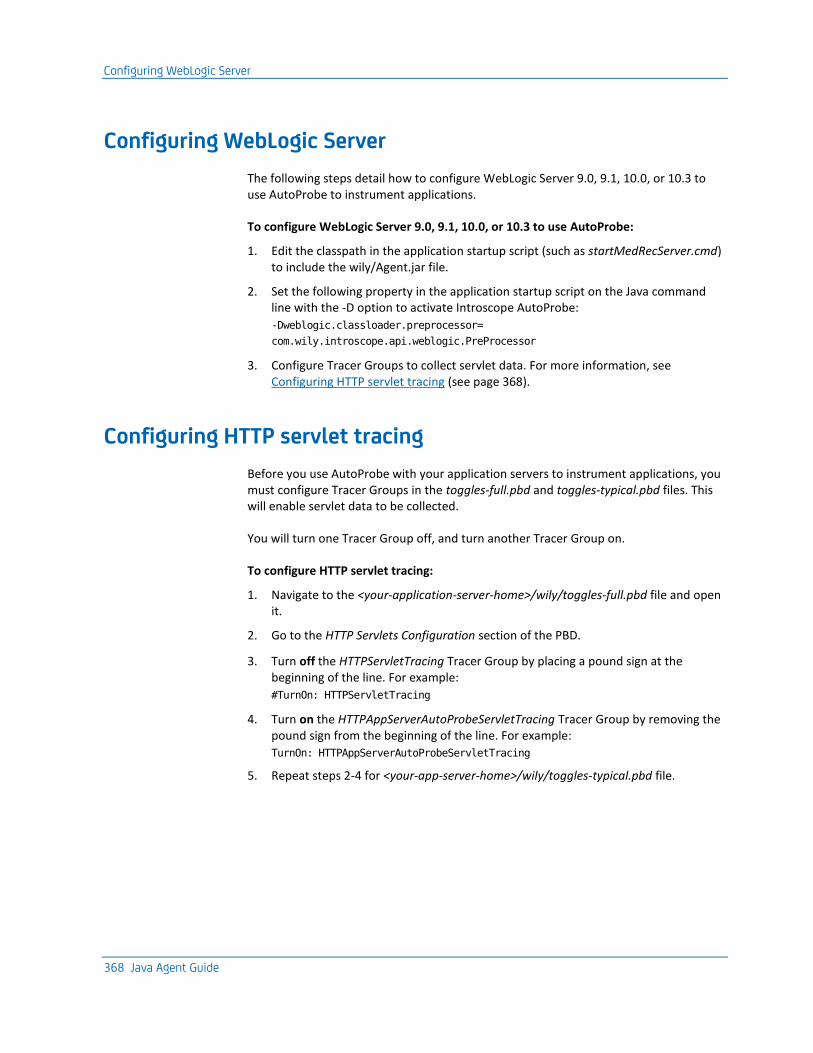
Configuring WebLogic Server
368 Java Agent Guide
Configuring WebLogic Server
The following steps detail how to configure WebLogic Server 9.0, 9.1, 10.0, or 10.3 to use AutoProbe to instrument applications.
To configure WebLogic Server 9.0, 9.1, 10.0, or 10.3 to use AutoProbe:
1. Edit the classpath in the application startup script (such as startMedRecServer.cmd) to include the wily/Agent.jar file.
2. Set the following property in the application startup script on the Java command line with the -D option to activate Introscope AutoProbe:
-Dweblogic.classloader.preprocessor=
com.wily.introscope.api.weblogic.PreProcessor
3. Configure Tracer Groups to collect servlet data. For more information, see Configuring HTTP servlet tracing (see page 368).
Configuring HTTP servlet tracing
Before you use AutoProbe with your application servers to instrument applications, you must configure Tracer Groups in the toggles-full.pbd and toggles-typical.pbd files. This will enable servlet data to be collected.
You will turn one Tracer Group off, and turn another Tracer Group on.
To configure HTTP servlet tracing:
1. Navigate to the <your-application-server-home>/wily/toggles-full.pbd file and open it.
2. Go to the HTTP Servlets Configuration section of the PBD.
3. Turn off the HTTPServletTracing Tracer Group by placing a pound sign at the beginning of the line. For example:
#TurnOn: HTTPServletTracing
4. Turn on the HTTPAppServerAutoProbeServletTracing Tracer Group by removing the pound sign from the beginning of the line. For example:
TurnOn: HTTPAppServerAutoProbeServletTracing
5. Repeat steps 2-4 for <your-app-server-home>/wily/toggles-typical.pbd file.

Index 369
Index
A
agent architectural overview • 21 before installing • 27 configuration options • 53 configuration profile • 24 data collection configuration • 55 default name • 55 depolyment process • 23, 25 directory structure • 43 domain configuration • 55 Enterprise Manager connection • 28 evaluating performance • 25 installation options • 29 interactive installer • 30 logging messages • 54 manual installation • 40 naming propertiies • 55 planning data collection • 24 removing from z/OS • 59 silent installation • 36 specifying the path to • 48 starting • 48 uninstalling • 59 upgrading • 57 validated configuration • 25
application management instrumenting bytecode • 54 introduction • 23 virtual agents • 55
application server permission requirements • 27 supported environments • 27 upgrading multiple agents • 57
C
CA Wily CEM integration • 57
E
Enterprise Manager agent profile settings • 54 architectural overview • 21 configuring the connection • 48
connecting to • 28 HTTP tunneling • 49 HTTPS connections • 51 proxy server • 50 using SSL • 52
I
installation archive files • 41 console mode • 34 directory structure • 43 GUI mode • 31 interactive installer • 30 manual • 40 operating system specific program • 30 silent • 36 types of • 29
instrumentation defined • 54 full and typical tracing • 68
Introscope application lifecycle • 24 architectural overview • 21 discover functionality • 23
IntroscopeAgent.profile deployment process • 25 introduction • 24
J
javaagent property • 61 JBoss
supported environments • 27 JVM AutoProbe
configuring the agent location • 48 connector file • 64 creating a connector • 64 default metric collection • 61 instrumenting applications • 54 introduction • 29 JRockit • 67 OS/400 • 63 other options • 29 path to the agent.jar and profile • 62 running connectors • 64 supported JVMs • 29
370 Java Agent Guide
WAS 7 on z/OS • 63
M
manual ProbeBuilding • 61
O
Oracle AutoProbe connector • 64 supported environments • 27
P
ProbeBuilder Directive (PBD) files configuring data collection • 55 introduction • 21 typical configuration • 56
ProbeBuilding customizing • 67 dynamic • 68 methods available • 61 support for older agents • 62
production environment production environment, evaluating overhead •
25
S
SAP NetWeaver AutoProbe connector • 64 supported environments • 27
socket metrics default data collection • 56
SSL metrics default data collection • 56
stall reporting default behavior • 56
Sun ONE AutoProbe connector • 64 supported environments • 27
SuperDomain • 55 superset agent packages • 57 SYSVIEW support • 44
T
Tomcat supported environments • 27
tracer groups default configuration options • 68
U
URL groups introduction • 56
W
WebLogic AutoProbe connector • 64 supported environments • 27
WebSphere running JVM AutoProbe on z/OS • 63 supported environments • 27
wily directory • 43 wily/connectors • 44 wily/deploy • 44 wily/examples directory • 44 wily/ext directory • 44 wily/hotdeploy directory
introduction • 46 wily/install directory • 47 wily/readme directory • 47 wily/tools directory • 47 wily/UninstallerData directory • 47 Workstation
architectural overview • 21


