24
Financial Projections for Presentations September 19, 2013
| Date post: | 12-Jul-2015 |
| Category: |
Business |
| Upload: | the-capital-network |
| View: | 696 times |
| Download: | 1 times |

Financial Projections for Presentations September 19, 2013
Heather Onsto,
Today’s Speakers
• Senior Controller Consultant, Venture Advisors
• CPA
• Prior Controller, Accoun>ng Manager at several area startups/high growth companies
• BS, UVM; MSA/MBA Northeastern
• Venture Partner, former Director of Small Business with LaunchCapital
• Interim CEO of the Nanny Caddy, a LaunchCapital porMolio company
• Over 20 years experience in small business finance
• BA, Wofford College; MBA, Dartmouth
Heather Shanahan
Financial Projec>ons: WIFM?
Today’s presenta>on will focus on the how and why of building and pitching financial projec>ons
• How: Crea>ng financial projec>ons using a spreadsheet and some common accoun>ng knowledge shows you where to focus your resources
• Why: Crea>ng financial projec>ons shows investors that you have carefully considered all financial implica>ons
Financial Projec>ons: 3 Objec>ves
1. Force discipline and objec>vity through crea>ng a methodical approach
2. Demonstrate thorough understanding of your company’s business model
3. Provide answers to “what if?”
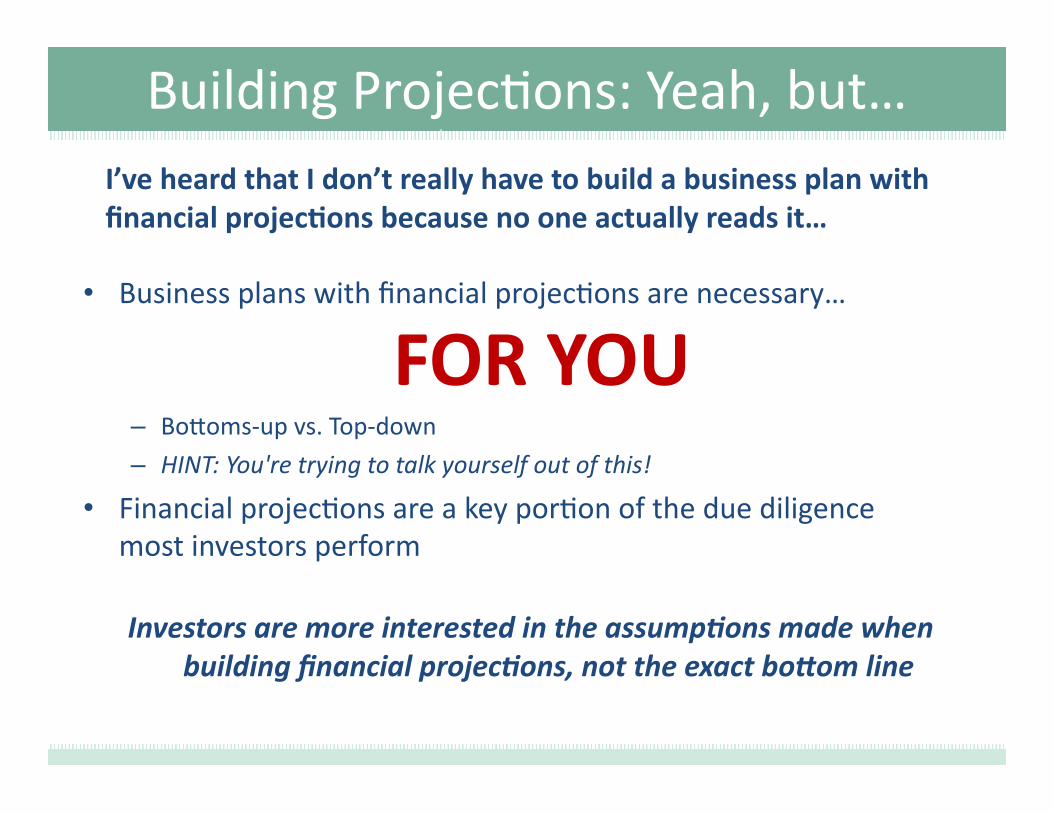
Building Projec>ons: Yeah, but… I’ve heard that I don’t really have to build a business plan with financial projec8ons because no one actually reads it…
• Business plans with financial projec>ons are necessary…
– Bo,oms-‐up vs. Top-‐down
– HINT: You're trying to talk yourself out of this! • Financial projec>ons are a key por>on of the due diligence
most investors perform
FOR YOU
Investors are more interested in the assump1ons made when building financial projec1ons, not the exact bo;om line
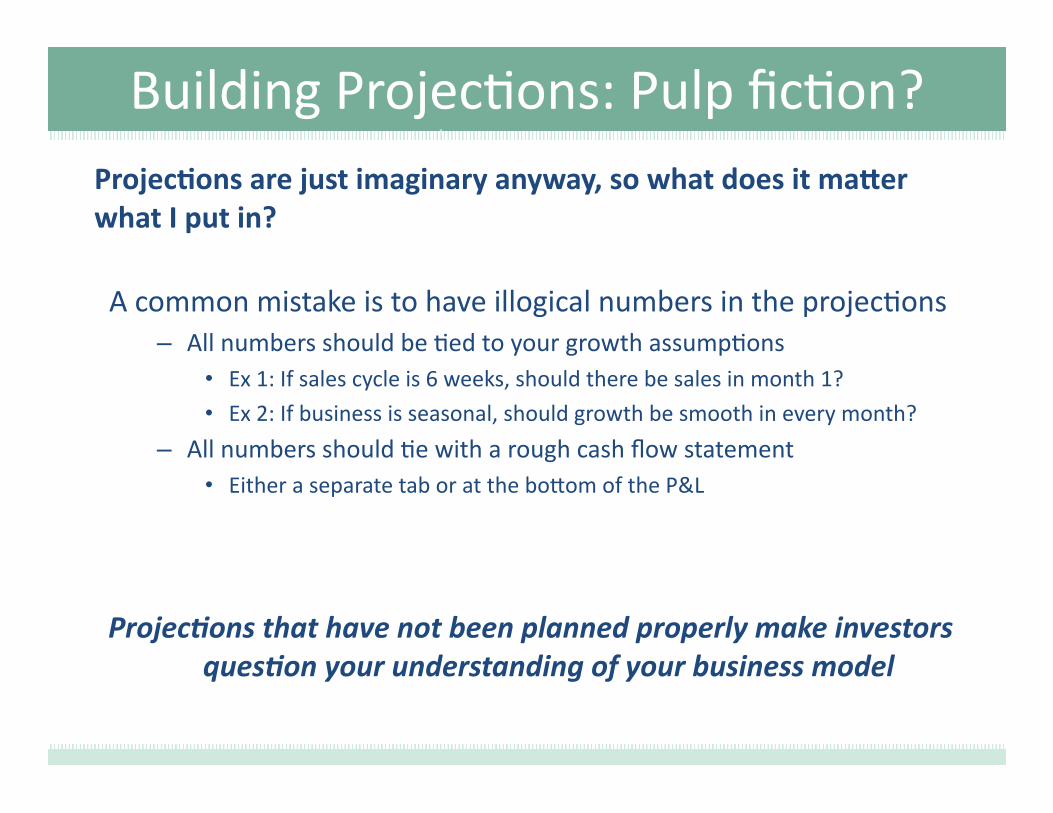
Building Projec>ons: Pulp fic>on? Projec8ons are just imaginary anyway, so what does it maCer what I put in?
A common mistake is to have illogical numbers in the projec>ons – All numbers should be >ed to your growth assump>ons
• Ex 1: If sales cycle is 6 weeks, should there be sales in month 1?
• Ex 2: If business is seasonal, should growth be smooth in every month?
– All numbers should >e with a rough cash flow statement • Either a separate tab or at the bo,om of the P&L
Projec1ons that have not been planned properly make investors ques1on your understanding of your business model
Building Projec>ons: What if…
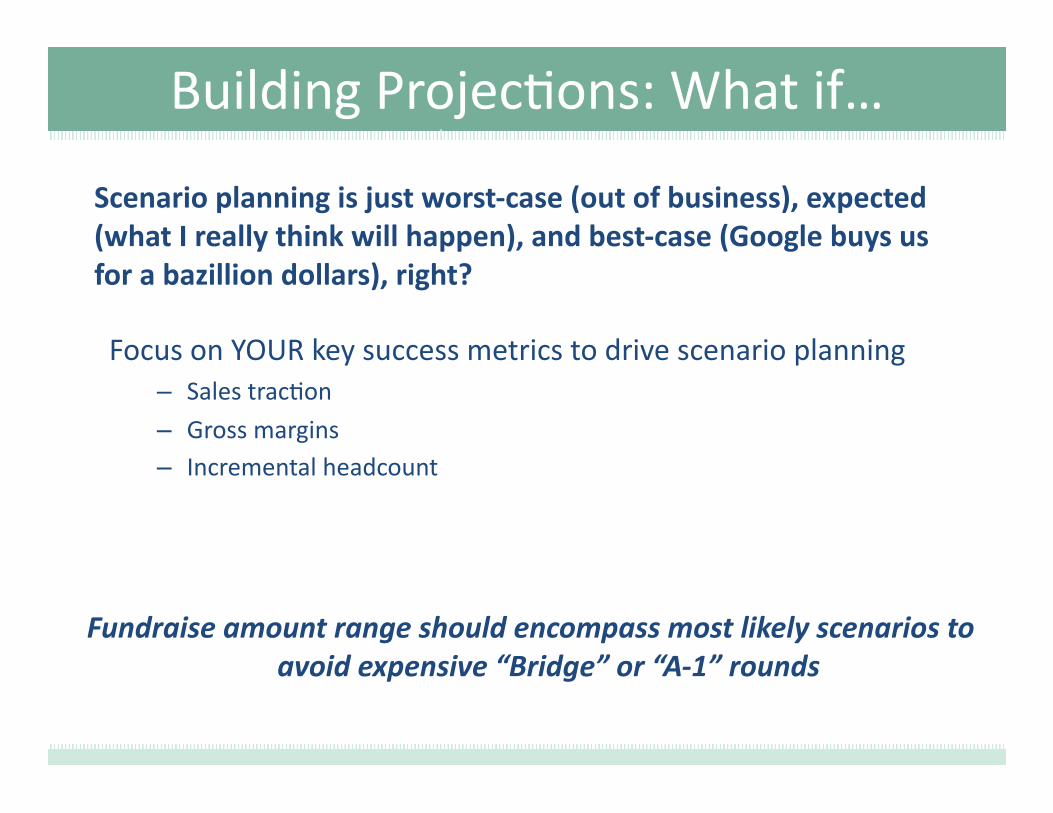
Scenario planning is just worst-‐case (out of business), expected (what I really think will happen), and best-‐case (Google buys us for a bazillion dollars), right?
Focus on YOUR key success metrics to drive scenario planning – Sales trac>on – Gross margins – Incremental headcount
Fundraise amount range should encompass most likely scenarios to avoid expensive “Bridge” or “A-‐1” rounds
More on Scenario Planning…
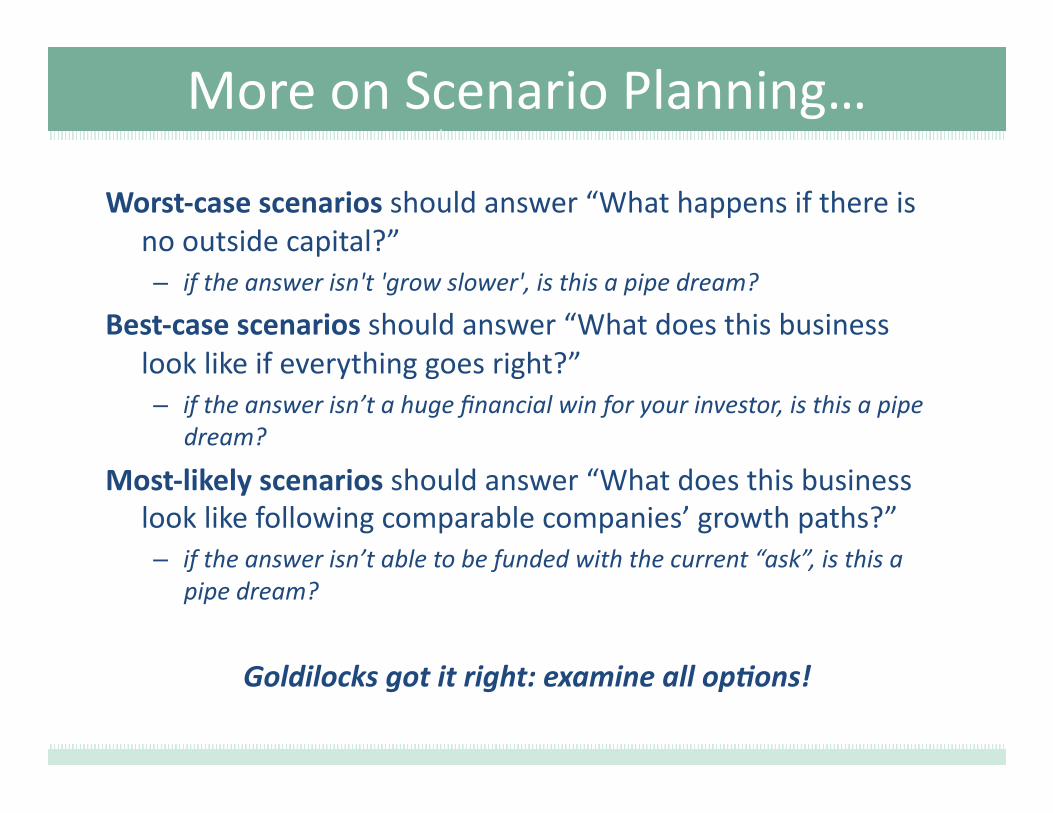
Worst-‐case scenarios should answer “What happens if there is no outside capital?” – if the answer isn't 'grow slower', is this a pipe dream?
Best-‐case scenarios should answer “What does this business look like if everything goes right?” – if the answer isn’t a huge financial win for your investor, is this a pipe
dream?
Most-‐likely scenarios should answer “What does this business look like following comparable companies’ growth paths?” – if the answer isn’t able to be funded with the current “ask”, is this a
pipe dream?
Goldilocks got it right: examine all op1ons!
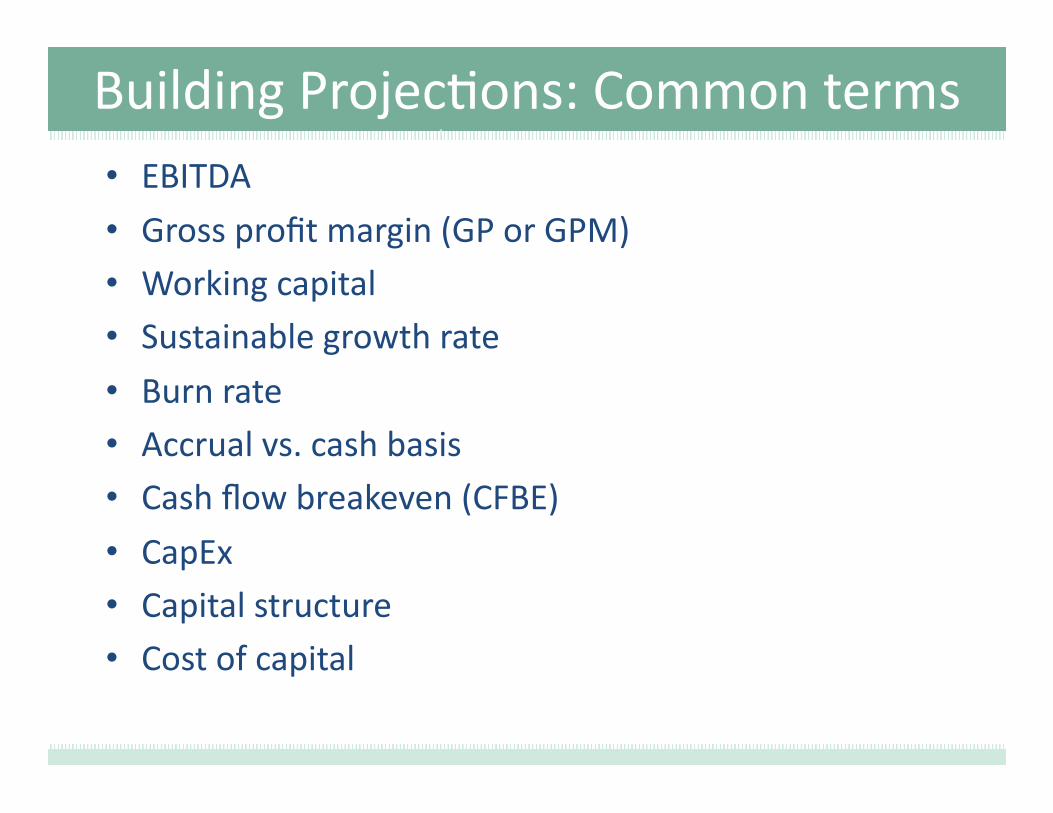
Building Projec>ons: Common terms • EBITDA • Gross profit margin (GP or GPM) • Working capital • Sustainable growth rate • Burn rate • Accrual vs. cash basis • Cash flow breakeven (CFBE) • CapEx • Capital structure • Cost of capital
Building Projec>ons: How it works
• Have an assump8ons page and reference cells for your P&L (don’t hard code anything)
• A separate assump>ons page allows flexibility – change them for different growth scenarios
• Assump>ons are the backbone of your projec>ons, so you should know them COLD
Excel is your friend, but be careful with cell references – it’s easy to make a mistake!
Building Projec>ons: Proper start…?
Es>mate 1% of $100 bazillion market
share
Building Projec>ons: Proper start…?
Es>mate 1% of $100 bazillion market
share JUST
KIDDING!
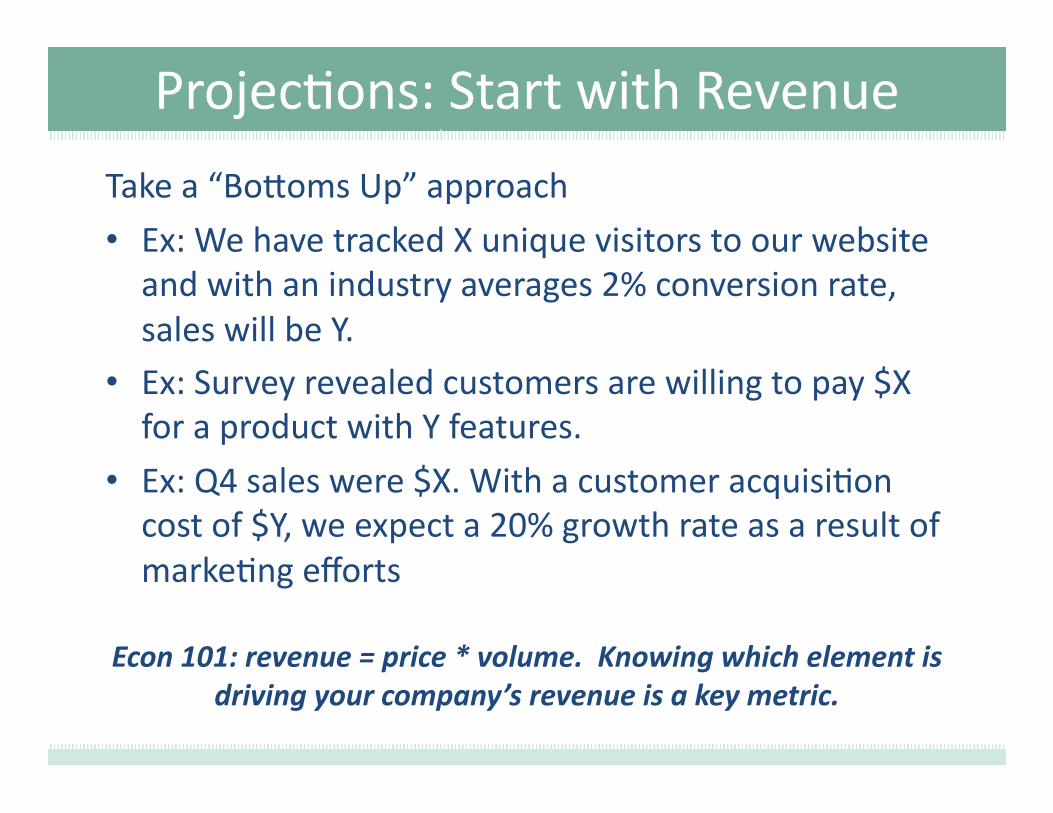
Projec>ons: Start with Revenue
Take a “Bo,oms Up” approach
• Ex: We have tracked X unique visitors to our website and with an industry averages 2% conversion rate, sales will be Y.
• Ex: Survey revealed customers are willing to pay $X for a product with Y features.
• Ex: Q4 sales were $X. With a customer acquisi>on cost of $Y, we expect a 20% growth rate as a result of marke>ng efforts
Econ 101: revenue = price * volume. Knowing which element is driving your company’s revenue is a key metric.
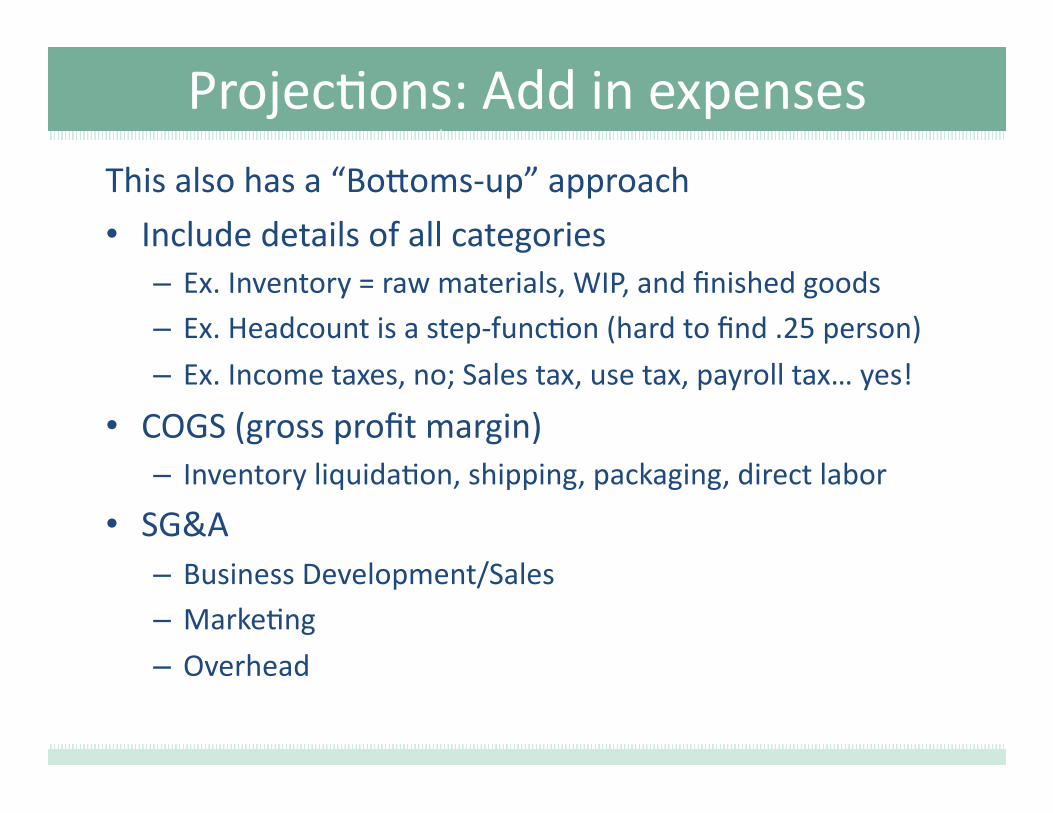
Projec>ons: Add in expenses This also has a “Bo,oms-‐up” approach
• Include details of all categories – Ex. Inventory = raw materials, WIP, and finished goods – Ex. Headcount is a step-‐func>on (hard to find .25 person) – Ex. Income taxes, no; Sales tax, use tax, payroll tax… yes!
• COGS (gross profit margin) – Inventory liquida>on, shipping, packaging, direct labor
• SG&A – Business Development/Sales – Marke>ng
– Overhead
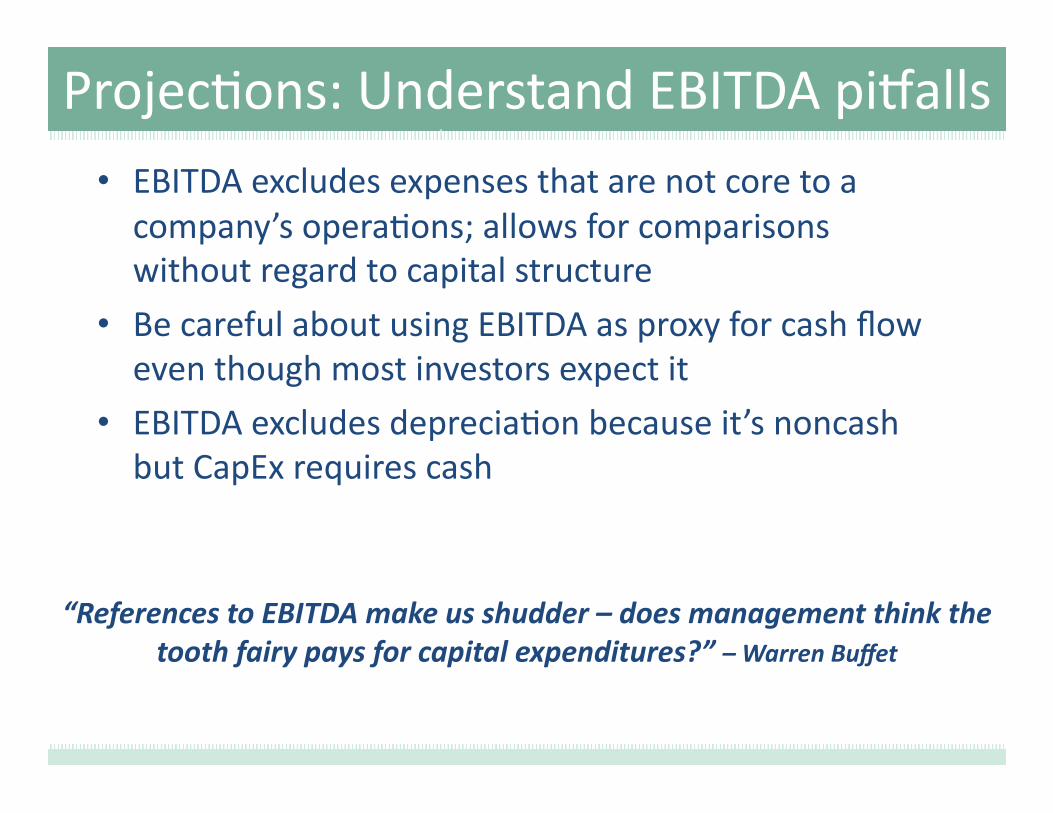
Projec>ons: Understand EBITDA piMalls
• EBITDA excludes expenses that are not core to a company’s opera>ons; allows for comparisons without regard to capital structure
• Be careful about using EBITDA as proxy for cash flow even though most investors expect it
• EBITDA excludes deprecia>on because it’s noncash but CapEx requires cash
“References to EBITDA make us shudder – does management think the tooth fairy pays for capital expenditures?” – Warren Buffet
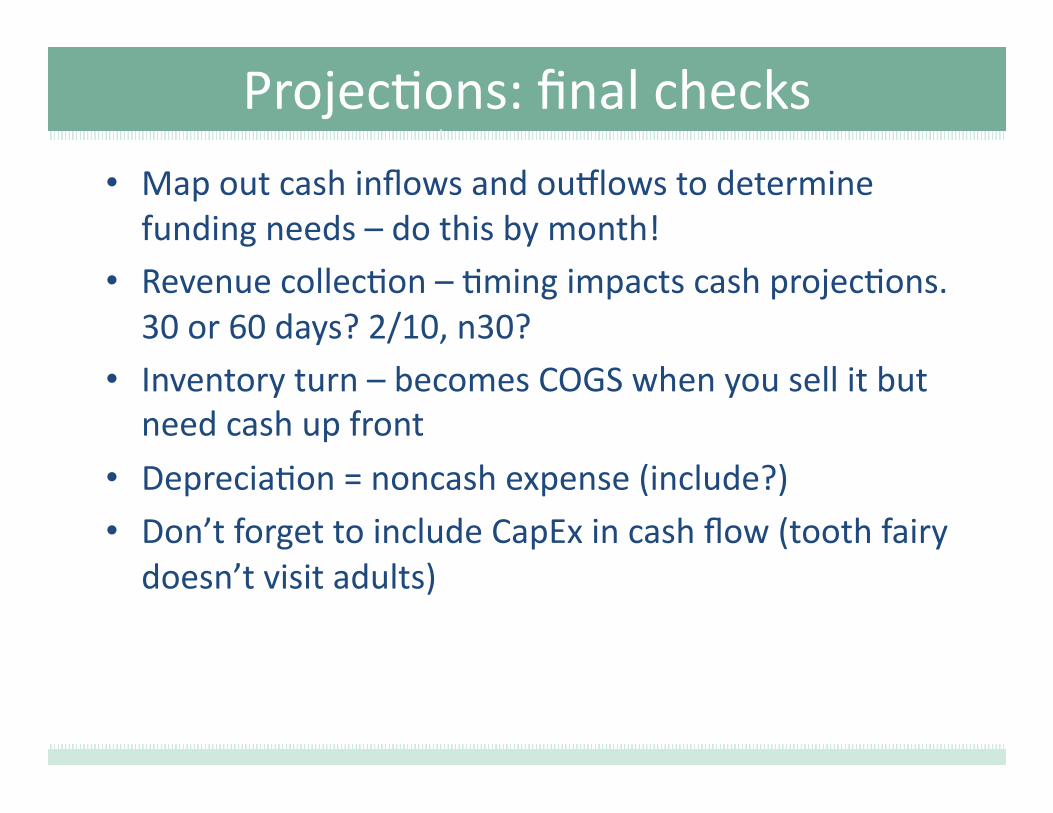
Projec>ons: final checks
• Map out cash inflows and ouMlows to determine funding needs – do this by month!
• Revenue collec>on – >ming impacts cash projec>ons. 30 or 60 days? 2/10, n30?
• Inventory turn – becomes COGS when you sell it but need cash up front
• Deprecia>on = noncash expense (include?) • Don’t forget to include CapEx in cash flow (tooth fairy doesn’t visit adults)
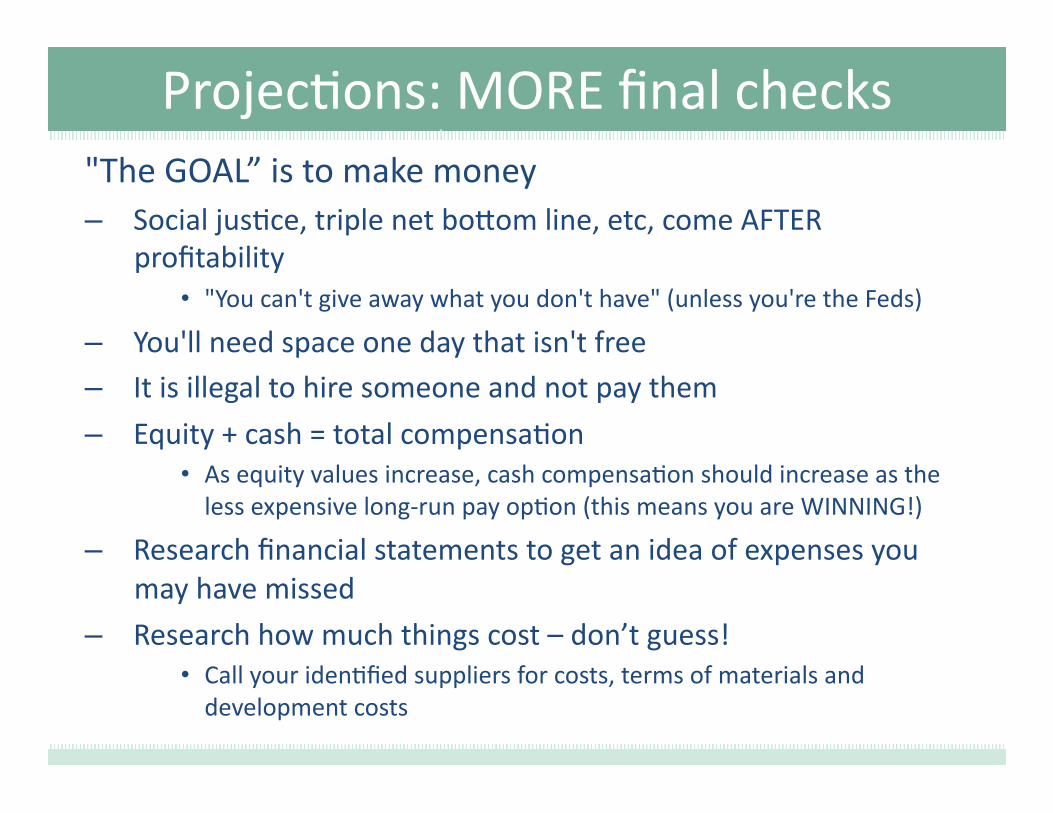
"The GOAL” is to make money – Social jus>ce, triple net bo,om line, etc, come AFTER
profitability • "You can't give away what you don't have" (unless you're the Feds)
– You'll need space one day that isn't free – It is illegal to hire someone and not pay them
– Equity + cash = total compensa>on • As equity values increase, cash compensa>on should increase as the less expensive long-‐run pay op>on (this means you are WINNING!)
– Research financial statements to get an idea of expenses you may have missed
– Research how much things cost – don’t guess! • Call your iden>fied suppliers for costs, terms of materials and development costs
Projec>ons: MORE final checks
Pitching projec>ons: What’s the “ask”?
Fin projec>ons need to >e to the amount of the raise – Fundraising takes >me, so 12-‐18 months of cash per raise – Iden>fy milestones to be hit and cost of each one
– The sum of those milestone costs is the raise amount – The "cushion" in the raise is not X%, it's the cost difference in the most likely scenarios
The secret to life is “t” – “t” is the variable for “>me” in mathema>cal equa>ons… and >me in projec>ons is everything
Pitching Projec>ons: Rookie moves
– CTRL+C+P en>re excel model into a slide
– Using anything less than 18-‐point font – Li,ering clipart from 1995… or 2013
– Sta>ng projec>ons to the $.01 – Failing to summarize projec>ons
– Using ANY of the following phrases: • “conserva>vely es>mated…” • “at only X% of the market…”
• “with no compe>>on…”
– Forgexng to explain what the amount you raise achieves
– Expec>ng a short-‐term exit at a high mul>ple
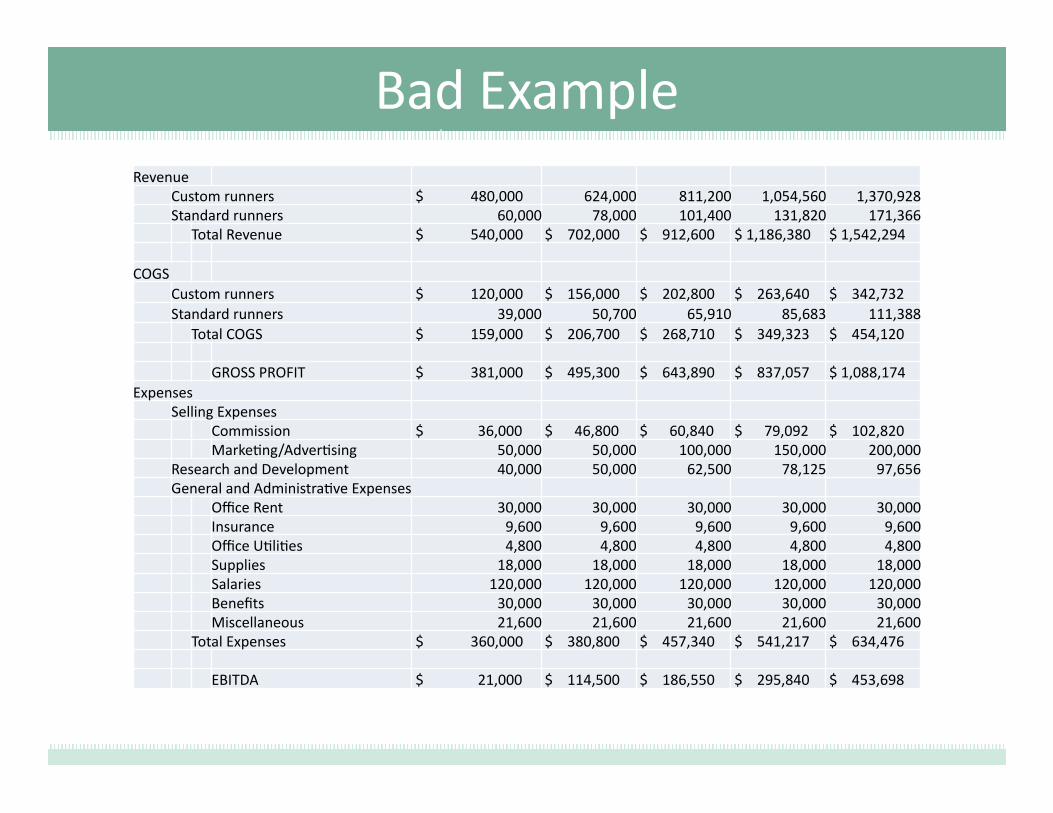
Bad Example Revenue
Custom runners $ 480,000 624,000 811,200 1,054,560 1,370,928 Standard runners 60,000 78,000 101,400 131,820 171,366
Total Revenue $ 540,000 $ 702,000 $ 912,600 $ 1,186,380 $ 1,542,294
COGS Custom runners $ 120,000 $ 156,000 $ 202,800 $ 263,640 $ 342,732 Standard runners 39,000 50,700 65,910 85,683 111,388
Total COGS $ 159,000 $ 206,700 $ 268,710 $ 349,323 $ 454,120
GROSS PROFIT $ 381,000 $ 495,300 $ 643,890 $ 837,057 $ 1,088,174 Expenses
Selling Expenses Commission $ 36,000 $ 46,800 $ 60,840 $ 79,092 $ 102,820 Marke>ng/Adver>sing 50,000 50,000 100,000 150,000 200,000
Research and Development 40,000 50,000 62,500 78,125 97,656 General and Administra>ve Expenses
Office Rent 30,000 30,000 30,000 30,000 30,000 Insurance 9,600 9,600 9,600 9,600 9,600 Office U>li>es 4,800 4,800 4,800 4,800 4,800 Supplies 18,000 18,000 18,000 18,000 18,000 Salaries 120,000 120,000 120,000 120,000 120,000 Benefits 30,000 30,000 30,000 30,000 30,000 Miscellaneous 21,600 21,600 21,600 21,600 21,600
Total Expenses $ 360,000 $ 380,800 $ 457,340 $ 541,217 $ 634,476
EBITDA $ 21,000 $ 114,500 $ 186,550 $ 295,840 $ 453,698
Pitching Projec>ons: Expert moves
• Know your audience – The earlier you are, the more interested in your assump>ons the investors are – so know you’ll be discussing them in detail. Painstaking detail.
• Be rich, not king – Does a new hire cut costs or increase revenue? This will drive the >ming of a new hire.
• Don’t forget that headcount is a step-‐func>on • What is B/E expecta>on for a new hire?
– Good metric for HC is sales/employee – these numbers are benchmarked and available with some research.
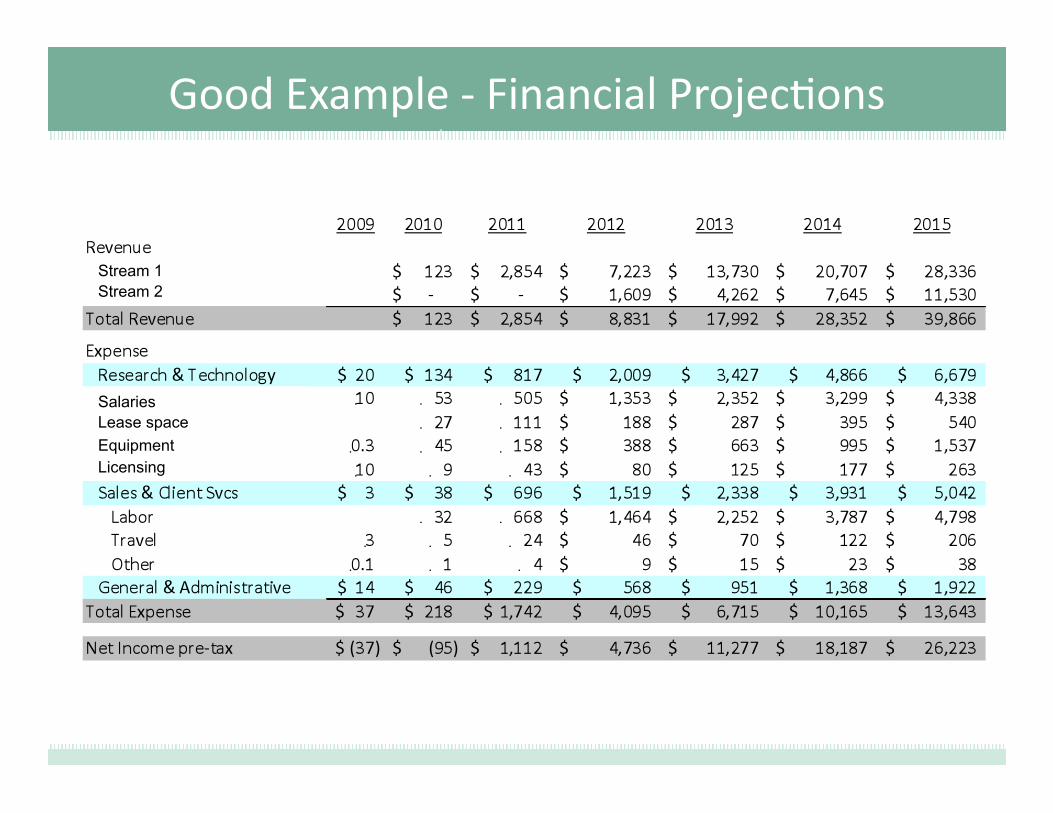
Good Example -‐ Financial Projec>ons
Stream 2
Licensing
Stream 1
Equipment Lease space Salaries
23
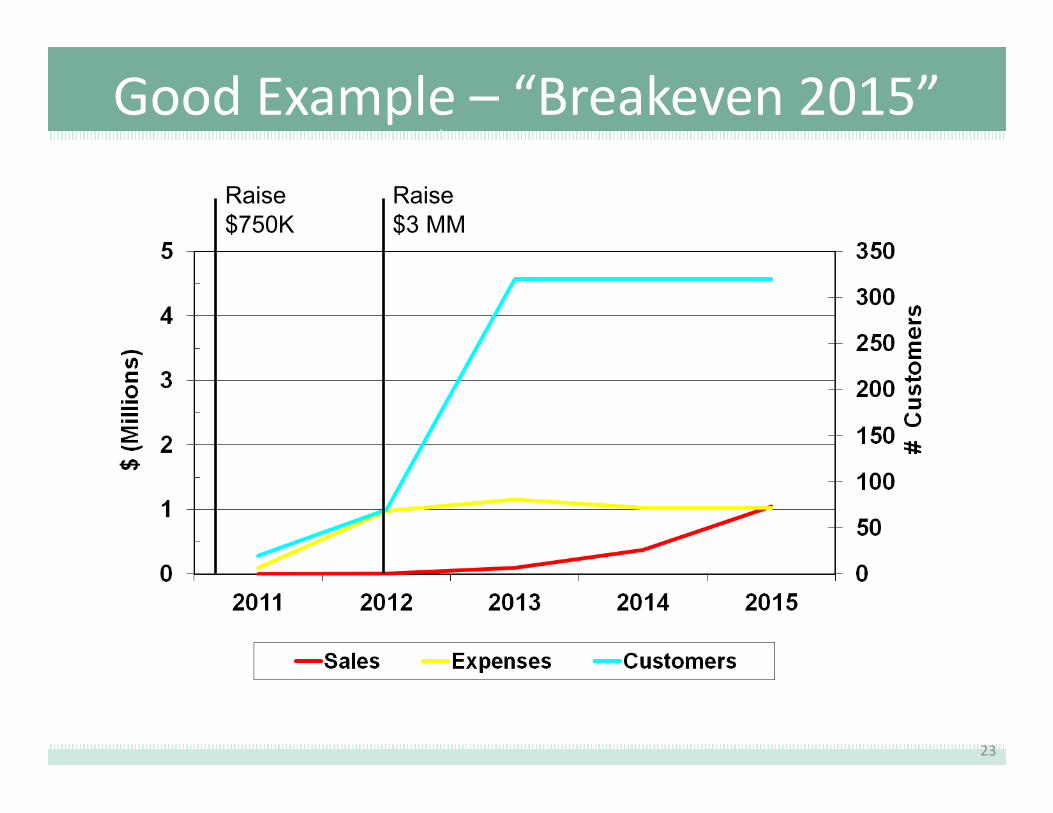
Good Example – “Breakeven 2015”
Raise $750K
Raise $3 MM