23
Calculating & Reporting Healthcare Statistics Second Edition Chapter 9 Statistics Computed within the Health Information Management Department
| Date post: | 19-Dec-2015 |
| Category: |
Documents |
| View: | 250 times |
| Download: | 27 times |

Calculating & Reporting Healthcare Statistics
Second Edition
Chapter 9Statistics Computed within the
Health Information Management Department
©2006 All rights reserved.
Health Information Statistics
• Usually relate to– Unit labor cost– Productivity– Staffing

©2006 All rights reserved.
Health Information Statistics
• Annual compensation for each employee– Calculated by multiplying the number of hours
worked per year (2,080 for a full-time employee) by the hourly wage and then multiplying that number by the benefits received

©2006 All rights reserved.
Health Information Statistics
• Annual compensation for each employee– Formula for full time equivalent (FTE)
• 2080 hours x hourly wage = Annual salary x amount of benefits = annual compensation
©2006 All rights reserved.
Health Information Statistics
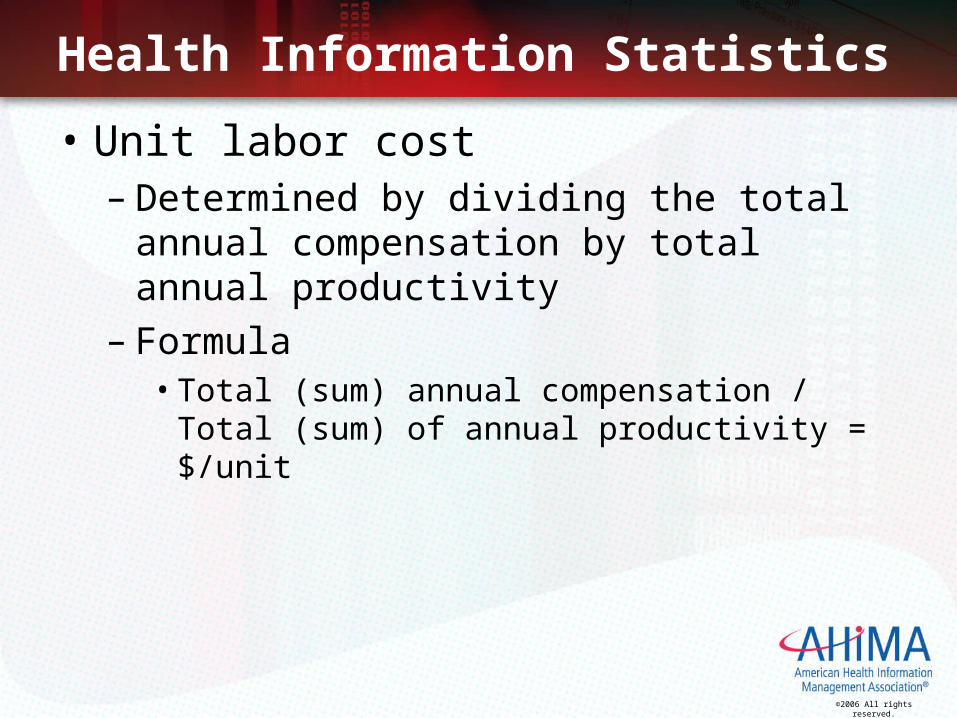
• Unit labor cost– Determined by dividing the total annual
compensation by total annual productivity– Formula
• Total (sum) annual compensation / Total (sum) of annual productivity = $/unit

©2006 All rights reserved.
Health Information Statistics
• Productivity– Defined as a unit of performance defined by management in
quantitative standards– A ratio to measure how well an organization converts input into
output– Most health information departments have productivity standards
for different areas in the department• For example, in the coding section, a productivity standard may be
that employees should code 4 inpatient records per hour• In a 7.5 hour work day (taking into account breaks that the
employee will take) that would be 30 inpatient records per day• Factors that influence this decision
– Other tasks for coder such as abstracting, answer the phone, getting additional information
– Types of records coded – long LOS, difficult clinical cases

©2006 All rights reserved.
Health Information Statistics
• Productivity– Two simple formulas that accurately calculate
labor productivity
– First• Completed work = Total work output – Defective
work
– And, second• Labor productivity = Completed work/hours worked
to produce total work output

©2006 All rights reserved.
Health Information Statistics
• Productivity– Determining the total work output and the
hours worked is clear– Determining the defective work involves
auditing work to determine if any work is defective

©2006 All rights reserved.
Health Information Statistics
• Productivity– Three ways to audit records
• Perform a 100% review of records coded• Perform a review of records coded chosen through a random
sample• Use a fixed percent random sample audit
– It requires the manager to select a fixed percent of total records for each employee to review
– There is a predetermined quality standard then work is checked and classified as completed work or defective work
– Additional records could be reviewed if the manager needs additional information to determine the type of defect or until all the records have been reviewed

©2006 All rights reserved.
Health Information Statistics
• Staffing Levels – There are a variety of methods to determine
staff• Patient encounters per Full Time Equivalent (FTE)
per month– A patient encounter is any personal contact between a
patient and a physician or other person who is authorized to furnish healthcare services for the diagnosis or treatment of the patient
» These may include laboratory services, x-ray, and others

©2006 All rights reserved.
Health Information Statistics
• Staffing Levels• This is determined by dividing the number of
patient encounters by the productivity– An FTE is the total number of workers, including part-
time, in an area as the equivalent of full-time positions» The number of FTEs does not always equal the
actual number of employees, as two or more part-time employees might equal one FTE
– Formula• Patient encounters /Productivity = Number of
FTEs needed

©2006 All rights reserved.
Health Information Statistics
• Budgets – A plan that converts the organization’s goals
and objectives into targets for revenue and spending
– Planning of the budget begins several months before the facility’s fiscal year begins

©2006 All rights reserved.
Health Information Statistics• Budgets
– Estimates are made of expenses for the department • Including wages and benefits for employees• Supplies • Travel and education • Membership dues• Subscriptions• Postage• Copying• Equipment maintenance contracts, etc.
– If there is revenue in the health information department these are also this should be estimated
– Estimates may include release of information• Outsourced coding, etc.• Transcription

©2006 All rights reserved.
Health Information Statistics
• Budgets– Operational Budgets
• The amount of money needed to run the business• Variance
– Differences between what was budgeted and the actual expenses
» A disagreement between two parts– This information can be used to monitor the activities of
the department

©2006 All rights reserved.
Health Information Statistics
• Budgets– Operational Budgets
• Variance– Formula
» Actual amount spent – amount budgeted = variance

©2006 All rights reserved.
Health Information Statistics
• Budgets– Capital Budget
• The major assets that will be purchased during the fiscal year
– For example, equipment for the health information department
– Usually “high-dollar “purchases– A facility will define what “high-dollar” means
» For example, purchases over $500 – The item usually has a “life” of more than one year
©2006 All rights reserved.
Health Information Statistics
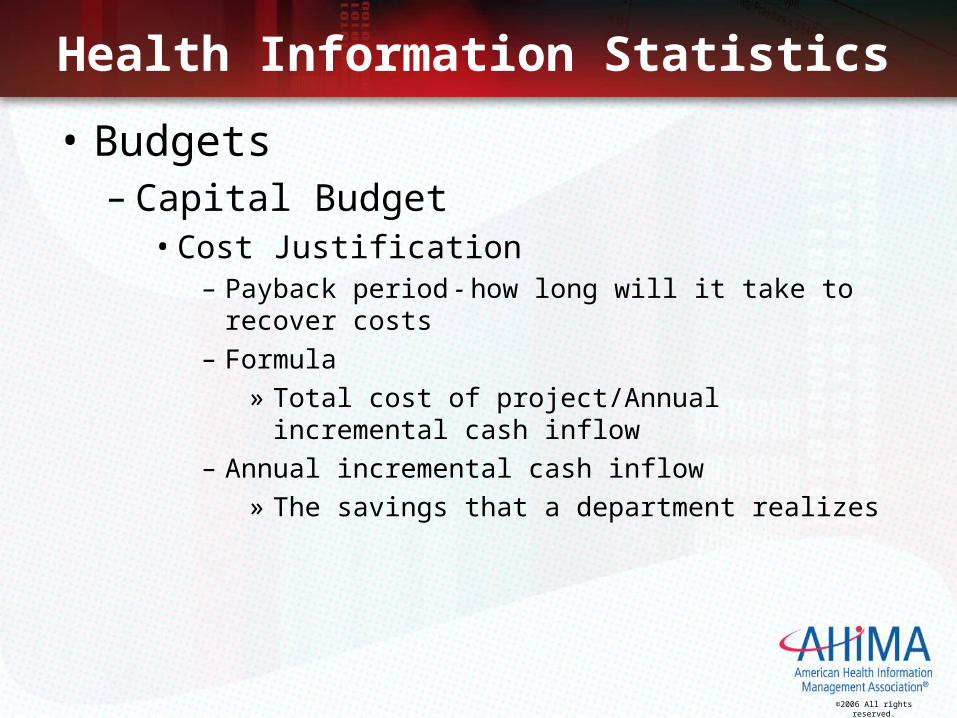
• Budgets– Capital Budget
• Cost Justification– Payback period - how long will it take to recover costs– Formula
» Total cost of project/Annual incremental cash inflow– Annual incremental cash inflow
» The savings that a department realizes

©2006 All rights reserved.
Health Information Statistics
• Budgets– Capital Budget
• Cost Justification– Return on investment - the rate at which cash is
recovered from an investment project – Formula
» Average annual incremental cast inflow/Total cost of the project

©2006 All rights reserved.
Health Information Statistics• Verification of Statistical Reports
• Standardization of terminology, data elements, and formulas will result in reliable and useful data
• When a computerized statistical report is received, the HIM practitioner should examine it carefully – Verify the total number of discharges listed in a report from coded
records and compare it to the total number of discharges according to the census data
– The HIM practitioner may need to calculate certain statistics (for example, death rates) and carry them out to the second decimal place to make the information more valuable to administration or the medical staff
– Tables or graphs can be created to display a portion of a computerized statistical report

©2006 All rights reserved.
Health Information Statistics
• Examples of Reports Used– Discharge Reports– Financial Statistical Reports– Readmission Reports– Case Mix Reports

©2006 All rights reserved.
Health Information Statistics
• Case Mix– The average relative weight of all cases treated at a
given facility or by a given physician– Reflects the resource intensity or clinical severity of a
specific group in relation to the other groups in the classification system
– Always reported with four decimal points– Formula
• Sum of the weights of diagnosis-related groups for patients discharged during a given period/ Total number of patients discharged

©2006 All rights reserved.
Health Information Statistics
• Profiling– A measurement of the quality, utilization, and cost of
medical resources provided by physicians that is made by employers, third-party payors, governmental entities, and other purchasers of health care
– Important to the facility’s administration• Are physician services are increasing or decreasing
– If increasing then the question of additional equipment or staff needs to be addressed
– If decreasing, the question of why becomes paramount

©2006 All rights reserved.
Health Information Statistics
• Spreadsheets– Allow the user to enter text, number and
formulas to assist in calculations– Consists of columns lettered across the top of
the document and rows numbered down the left side of the document
– Software packages perform basic arithmetic functions as well as data sorting, formatting for printing and graph creation


