87

JANUARY 19, 2018California Department of Food and Agriculture
CaliforniaCounty Agricultural Commissioners’
REPORTSCrop Year 2015-2016

San Francisco
San Mateo
Sierra
Siskiyou Modoc
Humboldt
Trinity Shasta
Lassen
Del Norte
Mendocino
Plumas
Butte Glenn
Colusa Lake
Tehama
Nevada
Yuba
Sutter
Placer
Yolo
Napa Sonoma
El Dorado
Alpine
Marin Contra Costa
Solano
Amador Sacra- mento
Alameda
Tuolumne
Calaveras
San Joaquin
Mono
Inyo
Mariposa Stanislaus
Santa Clara
San Bernardino
Santa Cruz
Kern
Merced
Fresno
Kings
Madera
San Benito
Monterey Tulare
San Luis Obispo
Santa Barbara
Ventura
Los Angeles
Orange Riverside
San Diego Imperial
30
40
51
80
20
10
50
60
10 = NORTH COAST
50 = SACRAMENTO VALLEY 51 = SAN JOAQUIN VALLEY 60 = SIERRA NEVADA
40 = CENTRAL COAST 30 = NORTHEAST MOUNTAIN 20 = NORTH MOUNTAIN
80 = SOUTHERN CALIFORNIA
California Agricultural Statistics Districts
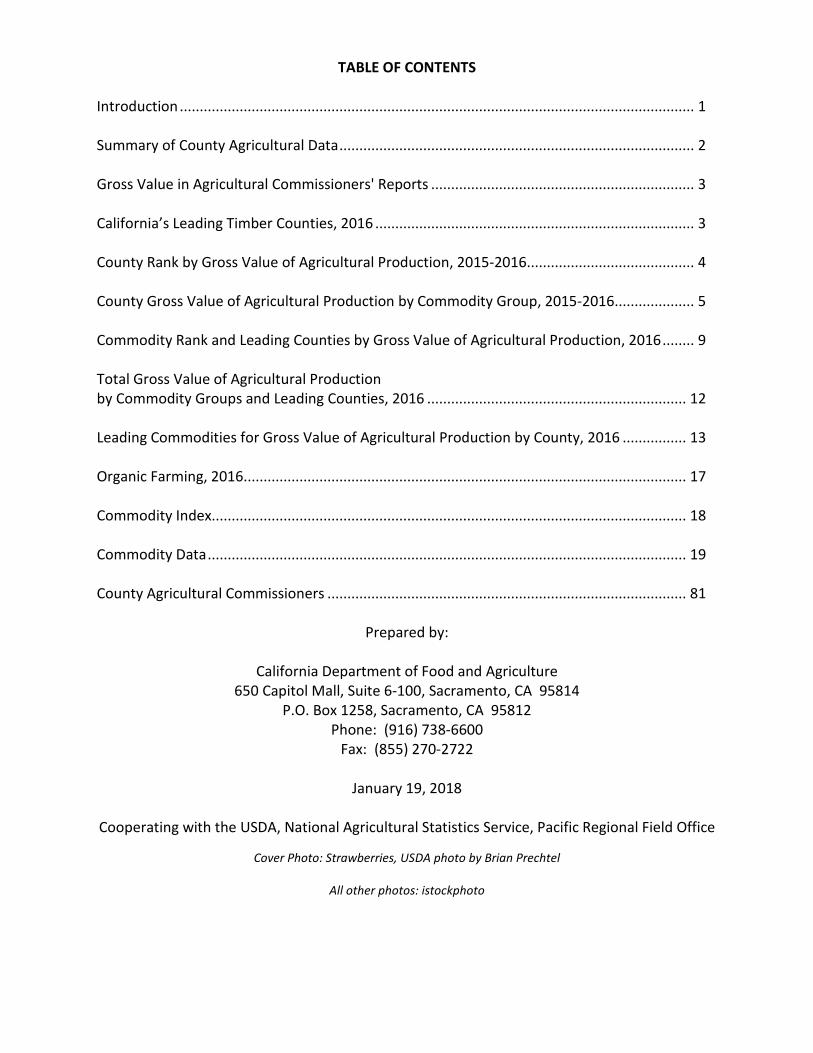
TABLE OF CONTENTS Introduction ................................................................................................................................. 1 Summary of County Agricultural Data ......................................................................................... 2 Gross Value in Agricultural Commissioners' Reports .................................................................. 3 California’s Leading Timber Counties, 2016 ................................................................................ 3 County Rank by Gross Value of Agricultural Production, 2015-2016 .......................................... 4 County Gross Value of Agricultural Production by Commodity Group, 2015-2016 .................... 5 Commodity Rank and Leading Counties by Gross Value of Agricultural Production, 2016 ........ 9 Total Gross Value of Agricultural Production by Commodity Groups and Leading Counties, 2016 ................................................................. 12 Leading Commodities for Gross Value of Agricultural Production by County, 2016 ................ 13 Organic Farming, 2016 ............................................................................................................... 17 Commodity Index....................................................................................................................... 18 Commodity Data ........................................................................................................................ 19 County Agricultural Commissioners .......................................................................................... 81
Prepared by:
California Department of Food and Agriculture 650 Capitol Mall, Suite 6-100, Sacramento, CA 95814
P.O. Box 1258, Sacramento, CA 95812 Phone: (916) 738-6600
Fax: (855) 270-2722
January 19, 2018
Cooperating with the USDA, National Agricultural Statistics Service, Pacific Regional Field Office
Cover Photo: Strawberries, USDA photo by Brian Prechtel
All other photos: istockphoto
COUNTY AGRICULTURAL COMMISSIONERS' REPORTS
Copies of individual County Agricultural Commissioners' Reports may be requested or obtained directly from each
County Agricultural Commissioner’s Office.
For your convenience, a listing is included at the end of this report. Many of the counties publish the reports on their websites free-of-charge.
USDA's National Agricultural Statistics Service, Pacific Region-California publications are available free-of-charge on the Internet at:
www.nass.usda.gov/ca.
CDFA 1 California County Agricultural Commissioners’ Reports, 2016
Introduction This publication is based on the annual Crop Reports compiled by the California County Agricultural Commissioners. These reports provided detailed annual data available on agricultural production by county. In order to curb costs and increase efficiency, there will no longer be two separate books. Rather, one publication will serve as a one stop resource for reported County Agricultural crop data. The detailed Data will follow the Summary, and County Agricultural Commissioners’ addresses will still be found at the end of the publication. Reports were received from 49 of 58 counties for 2016. Nine County Agricultural Commissioners’ Reports, Del Norte, Lassen, Los Angeles, Modoc, Mariposa, Mendocino, Plumas, San Francisco, and Sierra, were not available at publication. Therefore, the 2015 reports were used for all but Modoc. Modoc was not published this year as the last report received from Modoc County was from 2008. Copies of individual County Agricultural Commissioners’ Reports may be requested or obtained directly from each County Agricultural Commissioner’s office. Many of the counties publish the report on their websites. Basic data collected by the Agricultural Commissioners and their staff members are compiled from many sources. Sources vary from county to county. Examples of data sources include grower surveys, regulatory and inspection data, shipment data, industry assessments, etc. The amount of detail varies by county. For instance, one county may list all grapes; another may show grapes by raisin, table, and wine; and another may list a further breakdown, such as canned, crushed, dried, fresh, and juice. The data were coded at the detail level. The Sum of Others, in the detailed table, includes only those counties that provide the California Department of Food and Agriculture a listing of commodities that cannot be published at the county level due to disclosure of confidential information. However, data can be published when combined with other counties. Please be aware that the count is shown as one in those cases. Credit is due the County Agricultural Commissioners and their staff members for preparing the annual county Crop Reports upon which this compilation is based.

CDFA 2 California County Agricultural Commissioners’ Reports, 2016
Summary of County Agricultural Data California's counties reported a decrease of 3.9 percent in the value of agricultural production for 2016. Six counties reported agricultural production exceeding $3.0 billion each. Fourteen counties reported a value of production in excess of $1.0 billion. Kern County became the leading county with an agricultural production value of $7.19 billion, an increase of 4.5 percent from the 2015 value. Tulare County was second in value of production with $6.37 billion, an 8.8 percent decrease from 2015. Fresno County was third in value, with a decrease of 7.5 percent in production to $6.18 billion. Monterey remained fourth in value with $4.26 billion, a decrease of 9.5 percent from 2015.
CALIFORNIA’S TOP 10 COUNTIES CHANGE IN AGRICULTURAL PRODUCTION, 2015 - 2016
Top 15 Commodities in California Highlights by Rank and County Percentage of State Total, 2015-2016
Grapes, All Kern leads at over 25 percent followed by Napa at 11.2 and Fresno at 11.0 percent 1 Almonds Kern has over 20 percent followed by Fresno at 18.9 and Stanislaus at 14.6 percent 2 Milk and Cream Tulare leads with nearly 27 percent of the State total followed by Merced and then Kings 3 Cattle & Calves Tulare leads with 18 percent of total, Fresno is ranked 2nd with nearly 12 percent 4 Nursery Products San Diego continues to lead with over 23 percent of state total 5 Berries, Strawberries Monterey and Ventura lead with nearly 60 percent of the total 6 Lettuce Monterey leads with about 64 percent, Imperial follows with almost 16 percent 7 Pistachios Kern leads with over 42 percent followed by Tulare with over 18 percent 8 Walnuts San Joaquin leads with 18 percent of the State total then Butte with over 15 percent 9 Oranges Tulare leads with nearly 56 percent of the State total 10 Chickens Fresno leads with over 37 percent, Merced follows with nearly 35 percent 11 Tangerines Kern and Tulare with each over 35 percent of state total 12 Tomatoes, Processing Fresno leads with almost 35 percent, followed by Yolo and Kings both with over 12 percent 13 Silage, All Tulare leads with 36 percent of the State total with Merced following at 15 percent 14 Alfalfa Hay Imperial leads with over 18 percent followed by Kern with over 11 percent 15
-0.9%
10.0%
4.0%
-14.9%
-15.9%
-4.0%
-9.5%
-7.5%
-8.8%
4.5%
Kings
Imperial
Ventura
San Joaquin
Stanislaus
Merced
Monterey
Fresno
Tulare
Kern
2016
2015
CDFA 3 California County Agricultural Commissioners’ Reports, 2016
Gross Value in Agricultural Commissioners’ Reports The gross value of production published in this report includes all farm production, whether sold into usual marketing channels or used on the farm where it is produced. Values placed on pasture and range feed are included and fresh fruit and vegetable crop values are based on the Free-On-Board (F.O.B.) packed price. Values are recorded for all products grown during the calendar year, regardless of when they are marketed. The California County Agricultural Commissioners' Reports publication also provides statistics on a broader range of commodities than estimates prepared by other agencies. Because of these concepts, the State total for gross dollar values summarized in this report differs from the cash receipts to farmers estimated by USDA's National Agricultural Statistics Service, Pacific Region-California. The larger total value reported by Agricultural Commissioners results from the different definitions used in estimating total value of production rather than cash receipts to producers. Some counties include timber as a part of their crop report, following the pattern set by the California County Agricultural Commissioners and Sealers Association (CACASA). Since it is not comparable to earlier county summaries, timber has not been made a part of the main tables of this summary. The total 2016 value of production reported by the counties, including timber, is $57.0 billion, down 3.9 percent from last year. At $70.4 million, Humboldt County leads the State with 23 percent of the State’s total timber value.
California’s Leading Timber Counties, 2016 1/
Timber Rank County
Timber Volume
Total Agricultural Value
Timber Value
Timber Percentage of
Total Agricultural
Value Within County
(Including Timber)
Million Bd. Ft. $1,000 $1,000 Percent 1 Humboldt 231,607 326,072 70,391 21.6 2 Mendocino 106,727 177,527 39,342 22.2 3 Siskiyou 199,787 318,305 37,491 11.8 4 Shasta 169,333 118,138 37,005 31.3 5 Plumas 105,726 49,219 19,994 40.6
1/ Timber volume and value data are from the State Board of Equalization, Timber Tax Division.

CDFA 4 California County Agricultural Commissioners' Reports, 2016
2016 Timber Value 2016
$1,000 Rank $1,000 Rank $1,000 $1,000 Rank $1,000 RankKern 6,880,495 (2) 7,187,938 (1) 4.5 62 6,880,658 (2) 7,188,000 (1) 4.5Tulare 6,980,772 (1) 6,369,926 (2) -8.8 194 6,980,978 (1) 6,370,120 (2) -8.8Fresno 6,680,287 (3) 6,182,541 (3) -7.5 1,382 6,680,953 (3) 6,183,923 (3) -7.4Monterey 4,705,143 (4) 4,256,073 (4) -9.5 0 4,705,143 (4) 4,256,073 (4) -9.5Merced 3,589,900 (6) 3,447,830 (5) -4.0 10 3,589,909 (6) 3,447,840 (5) -4.0Stanislaus 3,879,333 (5) 3,261,412 (6) -15.9 0 3,879,333 (5) 3,261,412 (6) -15.9San Joaquin 2,732,900 (7) 2,337,899 (7) -14.5 0 2,732,900 (7) 2,337,899 (7) -14.5Ventura 2,198,555 (8) 2,110,187 (8) -4.0 12 2,198,571 (8) 2,110,199 (8) -4.0Imperial 1,875,158 (11) 2,063,215 (9) 10.0 0 1,875,158 (11) 2,063,215 (9) 10.0Kings 2,021,052 (9) 2,002,192 (10) -0.9 0 2,021,052 (9) 2,002,192 (10) -0.9Madera 2,016,726 (10) 1,819,093 (11) -9.8 396 2,017,447 (10) 1,819,489 (11) -9.8San Diego 1,701,762 (12) 1,746,619 (12) 2.6 14 1,701,778 (12) 1,746,633 (12) 2.6Santa Barbara 1,479,093 (13) 1,426,662 (13) -3.5 0 1,479,093 (13) 1,426,662 (13) -3.5Riverside 1,301,552 (14) 1,275,776 (14) -2.0 0 1,301,552 (14) 1,275,776 (14) -2.0San Luis Obispo 828,173 (16) 914,724 (15) 10.5 7 828,180 (16) 914,731 (15) 10.5Sonoma 766,272 (17) 898,129 (16) 17.2 3,417 770,876 (18) 901,546 (16) 17.0Colusa 901,809 (15) 791,663 (17) -12.2 0 901,809 (15) 791,663 (17) -12.2Glenn 748,988 (19) 748,513 (18) -0.1 9 748,988 (19) 748,522 (18) -0.1Napa 553,347 (22) 737,298 (19) 33.2 3 553,347 (22) 737,301 (19) 33.2Butte 759,835 (18) 697,419 (20) -8.2 8,518 773,552 (17) 705,937 (20) -8.7Yolo 664,738 (20) 662,392 (21) -0.4 0 664,738 (20) 662,392 (21) -0.4Santa Cruz 620,531 (21) 632,794 (22) 2.0 4,538 625,438 (21) 637,332 (22) 1.9Sutter 537,404 (23) 514,408 (23) -4.3 0 537,404 (23) 514,408 (23) -4.3Sacramento 463,666 (25) 507,064 (24) 9.4 17 463,688 (25) 507,081 (24) 9.4San Bernardino 463,773 (24) 456,453 (25) -1.6 0 463,783 (24) 456,453 (25) -1.6San Benito 360,598 (26) 367,453 (26) 1.9 0 360,598 (26) 367,453 (26) 1.9Tehama 321,006 (28) 336,133 (27) 4.7 9,733 324,202 (29) 345,866 (27) 6.7Solano 353,869 (27) 327,751 (28) -7.4 10 353,880 (27) 327,761 (28) -7.4Santa Clara 279,113 (30) 312,311 (29) 11.9 42 279,163 (31) 312,353 (31) 11.9Siskiyou 293,392 (29) 280,814 (30) -4.3 37,491 346,728 (28) 318,305 (30) -8.2Humboldt 233,443 (31) 255,681 (31) 9.5 70,391 304,781 (30) 326,072 (29) 7.0Yuba 230,446 (32) 210,512 (32) -8.7 4,422 231,821 (32) 214,934 (32) -7.3Los Angeles 3/ 192,519 (33) 192,519 (33) 0.0 0 192,519 (33) 192,519 (33) 0.0Mendocino 3/ 138,185 (34) 138,185 (34) 0.0 39,342 179,336 (34) 177,527 (34) -1.0San Mateo 130,275 (35) 130,837 (35) 0.4 4,604 132,458 (35) 135,441 (35) 2.3Contra Costa 128,506 (36) 128,056 (36) -0.4 0 128,506 (37) 128,056 (37) -0.4Lassen 3/ 117,055 (38) 117,055 (37) 0.0 11,064 126,750 (38) 128,119 (36) 1.1Orange 125,476 (37) 114,797 (38) -8.5 26 125,501 (39) 114,823 (39) -8.5Lake 101,106 (40) 108,730 (39) 7.5 5,101 101,135 (41) 113,831 (40) 12.6Marin 111,061 (39) 96,506 (40) -13.1 0 111,061 (40) 96,506 (41) -13.1Shasta 90,597 (41) 81,133 (41) -10.4 37,005 130,836 (36) 118,138 (38) -9.7Placer 58,593 (42) 61,106 (42) 4.3 4,100 64,314 (42) 65,206 (42) 1.4El Dorado 50,736 (43) 56,593 (43) 11.5 5,268 63,917 (43) 61,861 (43) -3.2Alameda 49,902 (44) 48,023 (44) -3.8 17 49,917 (45) 48,040 (46) -3.8Del Norte 3/ 47,643 (45) 47,644 (45) 0.0 9,599 60,451 (44) 57,243 (44) -5.3Mariposa 3/ 42,218 (46) 42,218 (46) 0.0 656 42,468 (47) 42,874 (47) 1.0Amador 35,448 (47) 36,976 (47) 4.3 499 35,838 (49) 37,475 (48) 4.6Tuolumne 30,124 (49) 29,851 (48) -0.9 5,591 37,340 (48) 35,442 (49) -5.1Plumas 3/ 29,225 (50) 29,225 (49) 0.0 19,994 47,677 (46) 49,219 (45) 3.2Mono 31,242 (48) 27,784 (50) -11.1 3 31,242 (50) 27,787 (50) -11.1Calaveras 23,840 (51) 19,868 (51) -16.7 4,802 25,559 (51) 24,670 (51) -3.5Nevada 19,126 (52) 19,076 (52) -0.3 1,801 21,471 (52) 20,877 (52) -2.8Inyo 18,512 (53) 16,368 (53) -11.6 0 18,520 (53) 16,368 (53) -11.6Sierra 3/ 9,980 (54) 9,980 (54) 0.0 3,073 11,807 (55) 13,053 (55) 10.6Alpine 5,656 (55) 5,515 (55) -2.5 0 5,656 (57) 5,515 (56) -2.5Trinity 4,124 (56) 4,913 (56) 19.1 10,020 13,137 (54) 14,933 (54) 13.7San Francisco 3/ 299 (57) 299 (57) 0.0 0 299 (58) 299 (58) 0.0Modoc 4/ -- -- 3,989 -- (56) -- (57) -58.4
Grand Total 59,014,579 56,702,131 -3.9 307,222 59,344,804 57,009,354 -3.9
2/ Totals may not add due to rounding.3/ Agricultural production value is from crop year 2015. Data for crop year 2016 was not available at time of publication.4/ No recent data is available.
Source: County Agricultural Commissioners' Reports and State Board of Equalization, Timber Tax Division.
County Rank by Gross Value of Agricultural Production, 2015-2016 1/
Percent Change
Percent Change
2015
1/ Totals vary slightly from totals published by counties due to classification differences between county and State reports.
Rank With Timber
2015
Rank Without Timber
County
CDFA 5 California County Agricultural Commissioners' Reports, 2016
2015 2016 2015 2016 2015 2016
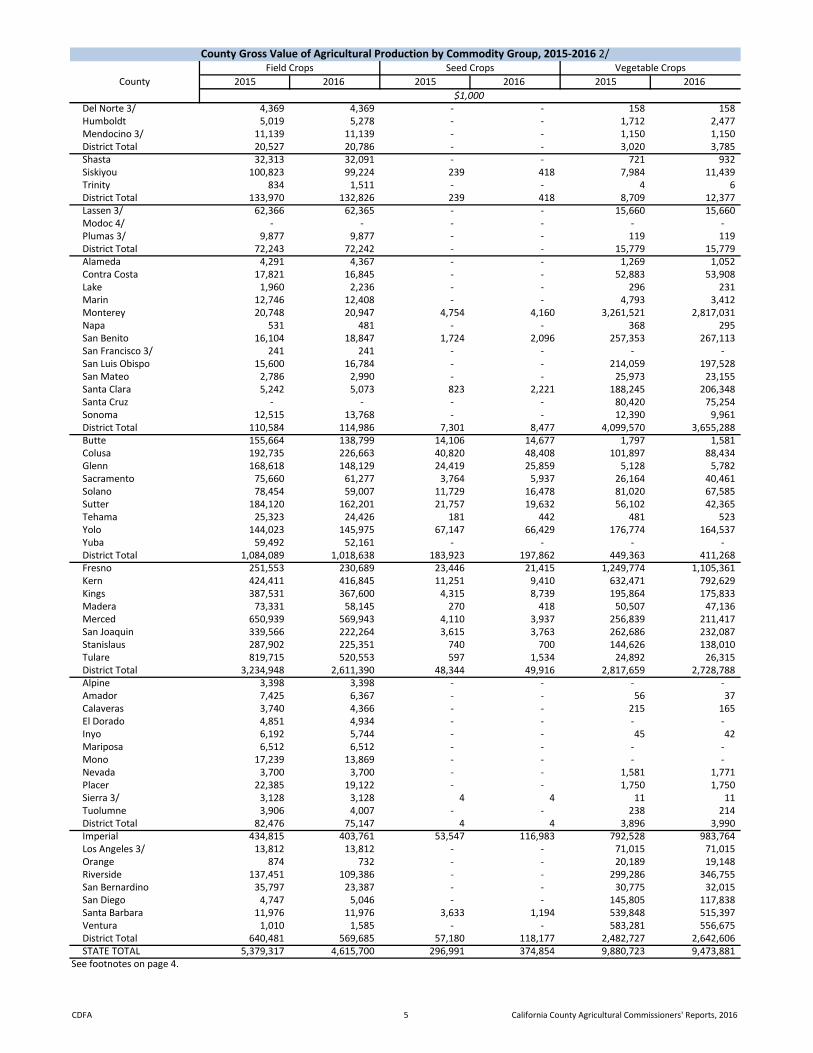
Del Norte 3/ 4,369 4,369 - - 158 158 Humboldt 5,019 5,278 - - 1,712 2,477 Mendocino 3/ 11,139 11,139 - - 1,150 1,150 District Total 20,527 20,786 - - 3,020 3,785 Shasta 32,313 32,091 - - 721 932 Siskiyou 100,823 99,224 239 418 7,984 11,439 Trinity 834 1,511 - - 4 6 District Total 133,970 132,826 239 418 8,709 12,377 Lassen 3/ 62,366 62,365 - - 15,660 15,660 Modoc 4/ - - - - - - Plumas 3/ 9,877 9,877 - - 119 119 District Total 72,243 72,242 - - 15,779 15,779 Alameda 4,291 4,367 - - 1,269 1,052 Contra Costa 17,821 16,845 - - 52,883 53,908 Lake 1,960 2,236 - - 296 231 Marin 12,746 12,408 - - 4,793 3,412 Monterey 20,748 20,947 4,754 4,160 3,261,521 2,817,031 Napa 531 481 - - 368 295 San Benito 16,104 18,847 1,724 2,096 257,353 267,113 San Francisco 3/ 241 241 - - - - San Luis Obispo 15,600 16,784 - - 214,059 197,528 San Mateo 2,786 2,990 - - 25,973 23,155 Santa Clara 5,242 5,073 823 2,221 188,245 206,348 Santa Cruz - - - - 80,420 75,254 Sonoma 12,515 13,768 - - 12,390 9,961 District Total 110,584 114,986 7,301 8,477 4,099,570 3,655,288 Butte 155,664 138,799 14,106 14,677 1,797 1,581 Colusa 192,735 226,663 40,820 48,408 101,897 88,434 Glenn 168,618 148,129 24,419 25,859 5,128 5,782 Sacramento 75,660 61,277 3,764 5,937 26,164 40,461 Solano 78,454 59,007 11,729 16,478 81,020 67,585 Sutter 184,120 162,201 21,757 19,632 56,102 42,365 Tehama 25,323 24,426 181 442 481 523 Yolo 144,023 145,975 67,147 66,429 176,774 164,537 Yuba 59,492 52,161 - - - - District Total 1,084,089 1,018,638 183,923 197,862 449,363 411,268 Fresno 251,553 230,689 23,446 21,415 1,249,774 1,105,361 Kern 424,411 416,845 11,251 9,410 632,471 792,629 Kings 387,531 367,600 4,315 8,739 195,864 175,833 Madera 73,331 58,145 270 418 50,507 47,136 Merced 650,939 569,943 4,110 3,937 256,839 211,417 San Joaquin 339,566 222,264 3,615 3,763 262,686 232,087 Stanislaus 287,902 225,351 740 700 144,626 138,010 Tulare 819,715 520,553 597 1,534 24,892 26,315 District Total 3,234,948 2,611,390 48,344 49,916 2,817,659 2,728,788 Alpine 3,398 3,398 - - - - Amador 7,425 6,367 - - 56 37 Calaveras 3,740 4,366 - - 215 165 El Dorado 4,851 4,934 - - - - Inyo 6,192 5,744 - - 45 42 Mariposa 6,512 6,512 - - - - Mono 17,239 13,869 - - - - Nevada 3,700 3,700 - - 1,581 1,771 Placer 22,385 19,122 - - 1,750 1,750 Sierra 3/ 3,128 3,128 4 4 11 11 Tuolumne 3,906 4,007 - - 238 214 District Total 82,476 75,147 4 4 3,896 3,990 Imperial 434,815 403,761 53,547 116,983 792,528 983,764 Los Angeles 3/ 13,812 13,812 - - 71,015 71,015 Orange 874 732 - - 20,189 19,148 Riverside 137,451 109,386 - - 299,286 346,755 San Bernardino 35,797 23,387 - - 30,775 32,015 San Diego 4,747 5,046 - - 145,805 117,838 Santa Barbara 11,976 11,976 3,633 1,194 539,848 515,397 Ventura 1,010 1,585 - - 583,281 556,675 District Total 640,481 569,685 57,180 118,177 2,482,727 2,642,606 STATE TOTAL 5,379,317 4,615,700 296,991 374,854 9,880,723 9,473,881
See footnotes on page 4.
Field Crops Seed Crops Vegetable CropsCounty Gross Value of Agricultural Production by Commodity Group, 2015-2016 2/
County$1,000

CDFA 6 California County Agricultural Commissioners' Reports, 2016
2015 2016 2015 2016 2015 2016
Del Norte 3/ - - 10,237 10,237 - - Humboldt 1,740 1,798 56,714 55,945 - - Mendocino 3/ 107,006 107,006 1,577 1,577 - - District Total 108,746 108,804 68,529 67,759 - - Shasta 5,518 4,010 6,579 14,347 7,900 8,777 Siskiyou 324 347 149,580 140,085 - - Trinity 110 153 2 4 9 12 District Total 5,952 4,510 156,161 154,436 7,909 8,789 Lassen 3/ - - - - - - Modoc 4/ - - - - - - Plumas 3/ 55 55 13 13 16 16 District Total 55 55 13 13 16 16 Alameda 15,394 18,959 6,853 7,262 - - Contra Costa 17,724 25,673 6,405 6,649 454 414 Lake 94,978 103,278 1,474 925 - - Marin 347 867 365 360 - - Monterey 1,012,977 1,056,777 313,689 276,423 226 269 Napa 547,506 730,349 2,517 2,133 - - San Benito 41,446 49,432 11,383 7,686 - - San Francisco 3/ - - - - 58 58 San Luis Obispo 428,344 568,129 99,511 86,933 - - San Mateo 2,484 2,617 94,954 97,922 241 321 Santa Clara 10,931 11,115 67,635 83,292 - - Santa Cruz 413,702 456,525 119,120 93,612 - - Sonoma 451,142 593,286 32,585 32,699 97 263 District Total 3,036,974 3,617,007 756,491 695,896 1,076 1,324 Butte 549,051 505,424 14,545 12,091 10,587 9,106 Colusa 520,975 395,539 - - 15,909 17,418 Glenn 419,637 449,459 7,862 5,698 17,967 27,051 Sacramento 186,313 243,389 23,778 30,702 76 116 Solano 87,741 107,668 37,648 39,754 2,337 2,266 Sutter 216,704 243,924 39,597 35,651 4,264 4,955 Tehama 206,260 224,461 18,767 18,186 16,851 21,892 Yolo 231,270 237,659 13,277 18,303 7,183 9,115 Yuba 142,670 134,582 - - 415 565 District Total 2,560,621 2,542,105 155,474 160,385 75,589 92,484 Fresno 3,404,609 3,247,838 46,773 116,186 70,745 90,378 Kern 4,622,539 4,841,434 83,274 102,318 82,772 88,778 Kings 513,301 525,113 - - 9,376 10,457 Madera 1,402,031 1,244,538 26,725 29,977 46,542 49,183 Merced 753,116 787,133 58,026 74,189 32,354 39,211 San Joaquin 1,383,288 1,221,731 104,820 107,387 20,532 24,428 Stanislaus 1,733,250 1,342,019 169,887 204,797 74,795 76,768 Tulare 3,256,386 3,289,831 76,002 75,618 47,527 55,911 District Total 17,068,520 16,499,636 565,507 710,472 384,643 435,114 Alpine - - - - - - Amador 15,113 18,720 139 192 - - Calaveras 4,572 4,906 190 185 210 235 El Dorado 28,835 35,155 4,799 4,975 902 780 Inyo 203 333 1,620 1,032 315 331 Mariposa 436 436 69 69 70 70 Mono 39 43 - 20 - - Nevada 1,034 2,120 393 502 252 369 Placer 9,047 9,779 8,405 8,313 113 62 Sierra 3/ 1 1 4 4 - - Tuolumne 179 322 276 272 117 101 District Total 59,458 71,815 15,895 15,564 1,980 1,948 Imperial 83,277 80,099 4,147 6,074 4,779 4,357 Los Angeles 3/ 5,755 5,755 92,399 92,399 1,556 1,556 Orange 40,268 38,345 63,961 55,685 - - Riverside 435,858 433,745 158,648 150,426 4,897 5,082 San Bernardino 18,736 20,965 23,335 48,073 14 490 San Diego 320,688 328,402 1,146,814 1,233,942 4,051 3,632 Santa Barbara 688,300 698,358 195,881 160,268 - - Ventura 1,357,101 1,286,534 244,339 254,882 2,108 2,786 District Total 2,949,983 2,892,202 1,929,524 2,001,749 17,404 17,903 STATE TOTAL 25,790,310 25,736,134 3,647,593 3,806,273 488,617 557,579
See footnotes on page 4.
Fruit and Nut Crops Nursery, Flowers and Foliage Apiary ProductsCounty Gross Value of Agricultural Production by Commodity Group, 2015-2016 2/
County$1,000
CDFA 7 California County Agricultural Commissioners' Reports, 2016
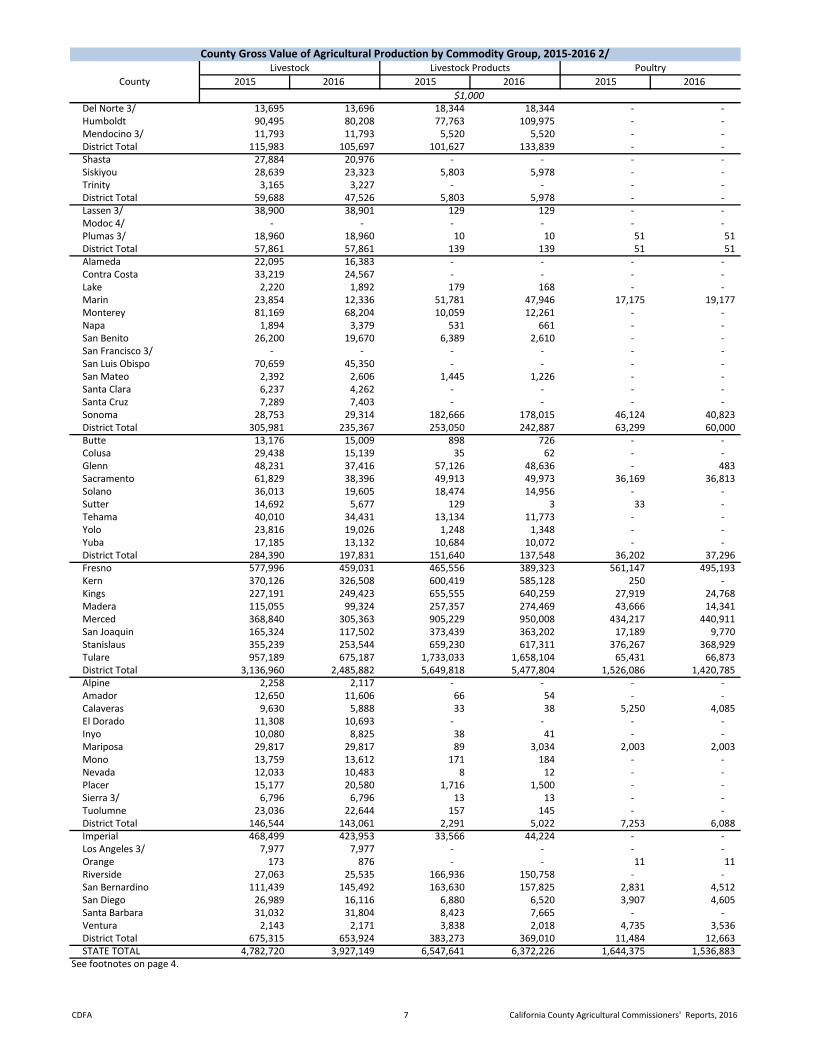
2015 2016 2015 2016 2015 2016
Del Norte 3/ 13,695 13,696 18,344 18,344 - - Humboldt 90,495 80,208 77,763 109,975 - - Mendocino 3/ 11,793 11,793 5,520 5,520 - - District Total 115,983 105,697 101,627 133,839 - - Shasta 27,884 20,976 - - - - Siskiyou 28,639 23,323 5,803 5,978 - - Trinity 3,165 3,227 - - - - District Total 59,688 47,526 5,803 5,978 - - Lassen 3/ 38,900 38,901 129 129 - - Modoc 4/ - - - - - - Plumas 3/ 18,960 18,960 10 10 51 51 District Total 57,861 57,861 139 139 51 51 Alameda 22,095 16,383 - - - - Contra Costa 33,219 24,567 - - - - Lake 2,220 1,892 179 168 - - Marin 23,854 12,336 51,781 47,946 17,175 19,177 Monterey 81,169 68,204 10,059 12,261 - - Napa 1,894 3,379 531 661 - - San Benito 26,200 19,670 6,389 2,610 - - San Francisco 3/ - - - - - - San Luis Obispo 70,659 45,350 - - - - San Mateo 2,392 2,606 1,445 1,226 - - Santa Clara 6,237 4,262 - - - - Santa Cruz 7,289 7,403 - - - - Sonoma 28,753 29,314 182,666 178,015 46,124 40,823 District Total 305,981 235,367 253,050 242,887 63,299 60,000 Butte 13,176 15,009 898 726 - - Colusa 29,438 15,139 35 62 - - Glenn 48,231 37,416 57,126 48,636 - 483 Sacramento 61,829 38,396 49,913 49,973 36,169 36,813 Solano 36,013 19,605 18,474 14,956 - - Sutter 14,692 5,677 129 3 33 - Tehama 40,010 34,431 13,134 11,773 - - Yolo 23,816 19,026 1,248 1,348 - - Yuba 17,185 13,132 10,684 10,072 - - District Total 284,390 197,831 151,640 137,548 36,202 37,296 Fresno 577,996 459,031 465,556 389,323 561,147 495,193 Kern 370,126 326,508 600,419 585,128 250 - Kings 227,191 249,423 655,555 640,259 27,919 24,768 Madera 115,055 99,324 257,357 274,469 43,666 14,341 Merced 368,840 305,363 905,229 950,008 434,217 440,911 San Joaquin 165,324 117,502 373,439 363,202 17,189 9,770 Stanislaus 355,239 253,544 659,230 617,311 376,267 368,929 Tulare 957,189 675,187 1,733,033 1,658,104 65,431 66,873 District Total 3,136,960 2,485,882 5,649,818 5,477,804 1,526,086 1,420,785 Alpine 2,258 2,117 - - - - Amador 12,650 11,606 66 54 - - Calaveras 9,630 5,888 33 38 5,250 4,085 El Dorado 11,308 10,693 - - - - Inyo 10,080 8,825 38 41 - - Mariposa 29,817 29,817 89 3,034 2,003 2,003 Mono 13,759 13,612 171 184 - - Nevada 12,033 10,483 8 12 - - Placer 15,177 20,580 1,716 1,500 - - Sierra 3/ 6,796 6,796 13 13 - - Tuolumne 23,036 22,644 157 145 - - District Total 146,544 143,061 2,291 5,022 7,253 6,088 Imperial 468,499 423,953 33,566 44,224 - - Los Angeles 3/ 7,977 7,977 - - - - Orange 173 876 - - 11 11 Riverside 27,063 25,535 166,936 150,758 - - San Bernardino 111,439 145,492 163,630 157,825 2,831 4,512 San Diego 26,989 16,116 6,880 6,520 3,907 4,605 Santa Barbara 31,032 31,804 8,423 7,665 - - Ventura 2,143 2,171 3,838 2,018 4,735 3,536 District Total 675,315 653,924 383,273 369,010 11,484 12,663 STATE TOTAL 4,782,720 3,927,149 6,547,641 6,372,226 1,644,375 1,536,883
See footnotes on page 4.
Livestock Livestock Products PoultryCounty Gross Value of Agricultural Production by Commodity Group, 2015-2016 2/
County$1,000
CDFA 8 California County Agricultural Commissioners' Reports, 2016
2015 2016 2015 2016 2015 2016
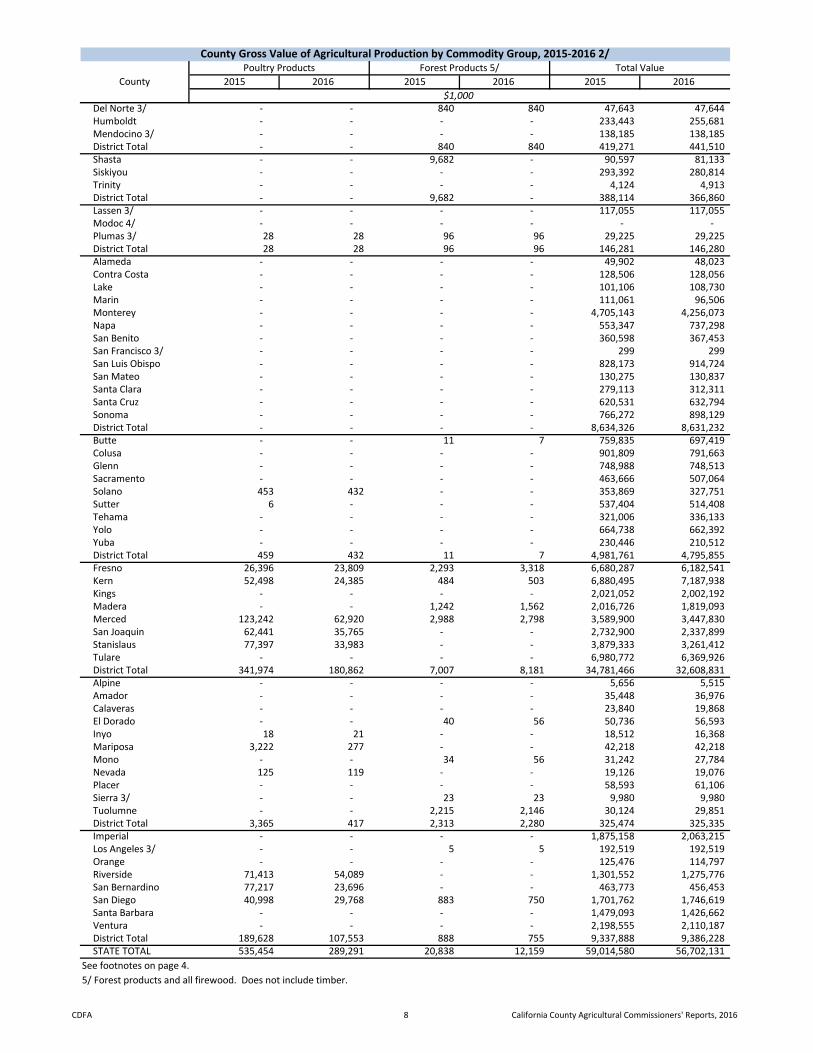
Del Norte 3/ - - 840 840 47,643 47,644 Humboldt - - - - 233,443 255,681 Mendocino 3/ - - - - 138,185 138,185 District Total - - 840 840 419,271 441,510 Shasta - - 9,682 - 90,597 81,133 Siskiyou - - - - 293,392 280,814 Trinity - - - - 4,124 4,913 District Total - - 9,682 - 388,114 366,860 Lassen 3/ - - - - 117,055 117,055 Modoc 4/ - - - - - - Plumas 3/ 28 28 96 96 29,225 29,225 District Total 28 28 96 96 146,281 146,280 Alameda - - - - 49,902 48,023 Contra Costa - - - - 128,506 128,056 Lake - - - - 101,106 108,730 Marin - - - - 111,061 96,506 Monterey - - - - 4,705,143 4,256,073 Napa - - - - 553,347 737,298 San Benito - - - - 360,598 367,453 San Francisco 3/ - - - - 299 299 San Luis Obispo - - - - 828,173 914,724 San Mateo - - - - 130,275 130,837 Santa Clara - - - - 279,113 312,311 Santa Cruz - - - - 620,531 632,794 Sonoma - - - - 766,272 898,129 District Total - - - - 8,634,326 8,631,232 Butte - - 11 7 759,835 697,419 Colusa - - - - 901,809 791,663 Glenn - - - - 748,988 748,513 Sacramento - - - - 463,666 507,064 Solano 453 432 - - 353,869 327,751 Sutter 6 - - - 537,404 514,408 Tehama - - - - 321,006 336,133 Yolo - - - - 664,738 662,392 Yuba - - - - 230,446 210,512 District Total 459 432 11 7 4,981,761 4,795,855 Fresno 26,396 23,809 2,293 3,318 6,680,287 6,182,541 Kern 52,498 24,385 484 503 6,880,495 7,187,938 Kings - - - - 2,021,052 2,002,192 Madera - - 1,242 1,562 2,016,726 1,819,093 Merced 123,242 62,920 2,988 2,798 3,589,900 3,447,830 San Joaquin 62,441 35,765 - - 2,732,900 2,337,899 Stanislaus 77,397 33,983 - - 3,879,333 3,261,412 Tulare - - - - 6,980,772 6,369,926 District Total 341,974 180,862 7,007 8,181 34,781,466 32,608,831 Alpine - - - - 5,656 5,515 Amador - - - - 35,448 36,976 Calaveras - - - - 23,840 19,868 El Dorado - - 40 56 50,736 56,593 Inyo 18 21 - - 18,512 16,368 Mariposa 3,222 277 - - 42,218 42,218 Mono - - 34 56 31,242 27,784 Nevada 125 119 - - 19,126 19,076 Placer - - - - 58,593 61,106 Sierra 3/ - - 23 23 9,980 9,980 Tuolumne - - 2,215 2,146 30,124 29,851 District Total 3,365 417 2,313 2,280 325,474 325,335 Imperial - - - - 1,875,158 2,063,215 Los Angeles 3/ - - 5 5 192,519 192,519 Orange - - - - 125,476 114,797 Riverside 71,413 54,089 - - 1,301,552 1,275,776 San Bernardino 77,217 23,696 - - 463,773 456,453 San Diego 40,998 29,768 883 750 1,701,762 1,746,619 Santa Barbara - - - - 1,479,093 1,426,662 Ventura - - - - 2,198,555 2,110,187 District Total 189,628 107,553 888 755 9,337,888 9,386,228 STATE TOTAL 535,454 289,291 20,838 12,159 59,014,580 56,702,131
See footnotes on page 4.5/ Forest products and all firewood. Does not include timber.
County Gross Value of Agricultural Production by Commodity Group, 2015-2016 2/
CountyPoultry Products Forest Products 5/ Total Value
$1,000

CDFA 9 California County Agricultural Commissioners' Reports, 2016
Value$1,000
Grapes (All) 1 6,520,431 Kern Napa Fresno Tulare Sonoma Percent of Value 25.4 11.2 11.0 9.2 9.0
Almonds 2 6,199,479 Kern Fresno Stanislaus Merced Madera Percent of Value 20.6 18.9 14.6 9.3 9.3
Milk and Cream 3 6,165,638 Tulare Merced Kings Stanislaus Kern Percent of Value 26.7 15.2 10.3 9.9 9.4
Cattle & Calves (All) 4 3,647,643 Tulare Fresno Imperial Kern Merced Percent of Value 18.1 11.6 11.2 8.5 8.1
Nursery Products 5 3,023,340 San Diego Monterey Ventura Stanislaus Riverside Percent of Value 23.6 8.2 6.8 6.8 5.0
Berries, Strawberries 6 2,315,164 Monterey Ventura Santa Barbara San Luis Obispo Santa Cruz Percent of Value 31.3 28.3 17.9 10.4 9.9
Lettuce 7 2,034,895 Monterey Imperial Santa Barbara San Benito Fresno Percent of Value 63.8 15.9 5.2 4.3 3.9
Pistachios 8 1,822,870 Kern Tulare Fresno Madera Kings Percent of Value 42.2 18.6 14.0 12.8 9.8
Walnuts (English) 9 1,507,705 San Joaquin Butte Glenn Tulare Stanislaus Percent of Value 18.2 15.6 9.9 9.1 8.9
Oranges 10 1,502,552 Tulare Kern Fresno San Diego Madera Percent of Value 55.8 23.7 13.6 2.7 1.4
Chickens 11 1,094,256 Fresno Merced Stanislaus San Diego San Bernardino Percent of Value 37.3 34.8 27.0 0.4 0.2
Tangerines 12 969,736 Kern Tulare Fresno Madera Riverside Percent of Value 35.6 35.4 19.7 4.2 2.1
Tomatoes (Processing) 13 968,427 Fresno Yolo Kings San Joaquin Merced Percent of Value 34.8 12.5 12.3 9.3 8.7
Silage, All 14 883,687 Tulare Merced Stanislaus Kern Kings Percent of Value 36.1 15.0 13.0 10.4 8.5
Alfalfa Hay 15 814,961 Imperial Kern Merced Tulare Riverside Percent of Value 18.3 11.3 9.4 8.4 8.4
Lemons 16 805,190 Ventura Riverside Tulare Kern San Diego Percent of Value 33.2 15.7 14.6 9.1 7.1
Broccoli 17 787,404 Monterey Santa Barbara Imperial San Luis Obispo Fresno Percent of Value 49.8 18.9 15.3 5.6 3.8
Flowers and Foliage 18 778,270 San Diego Santa Barbara Ventura Santa Cruz San Luis Obispo Percent of Value 66.9 9.7 6.2 4.6 3.8
Rice (Excl. Seed) 19 661,215 Colusa Butte Sutter Glenn Yolo Percent of Value 30.8 18.6 18.5 15.5 6.5
Carrots 20 578,323 Kern Imperial Monterey Riverside Fresno Percent of Value 76.1 10.7 5.9 5.4 0.6
Peaches (All) 21 572,566 Fresno Tulare Stanislaus Sutter Kings Percent of Value 34.5 20.1 11.9 9.9 5.6
Celery 22 454,490 Ventura Monterey Santa Barbara Imperial San Benito Percent of Value 44.5 35.6 9.0 4.8 2.0
Cotton Lint 23 429,084 Kings Fresno Merced Kern Tulare Percent of Value 44.1 21.0 15.0 11.3 5.2
Avocados 24 421,314 San Diego Ventura Santa Barbara San Luis Obispo Riverside Percent of Value 32.3 30.6 15.1 10.6 7.9
Berries, Raspberries 25 386,661 Ventura Santa Cruz Monterey Santa Barbara San Bernardino Percent of Value 44.3 40.9 10.6 4.1 0.0
Commodity Rank and Leading Counties by Gross Value of Agricultural Production, 2016
1 3Commodity
State Five Leading Counties by Rank and Percentage of State Total
Rank 42 5

CDFA 10 California County Agricultural Commissioners' Reports, 2016
Value$1,000
Commodity Rank and Leading Counties by Gross Value of Agricultural Production, 2016
1 3Commodity
State Five Leading Counties by Rank and Percentage of State Total
Rank 42 5
Cauliflower 26 326,949 Monterey Santa Barbara Imperial San Luis Obispo Riverside Percent of Value 58.0 21.6 11.0 5.0 3.4
Onions 27 311,784 Imperial Fresno Kern Monterey San Benito Percent of Value 41.2 29.9 11.2 6.8 4.1
Garlic 28 304,922 Fresno Kern Riverside Santa Clara Madera Percent of Value 72.6 20.9 3.4 2.1 0.5
Spinach 29 303,859 Monterey Imperial San Benito Santa Clara Santa Barbara Percent of Value 43.7 31.8 8.3 5.5 3.8
Eggs (Chicken) 30 289,291 Merced Riverside San Joaquin Stanislaus San Diego Percent of Value 21.7 18.7 12.4 11.7 10.3
Cherries 31 276,242 Kern San Joaquin Fresno Tulare Kings Percent of Value 38.3 21.2 11.6 9.3 6.3
Nectarines 32 267,265 Fresno Tulare Kings Kern Contra Costa Percent of Value 46.8 43.2 8.1 1.6 0.2
Bell Peppers 33 265,519 Riverside Ventura Kern San Benito Santa Clara Percent of Value 29.6 23.0 15.5 12.4 7.5
Plums 34 262,905 Fresno Tulare Kings Kern Madera Percent of Value 50.3 39.3 8.9 0.7 0.3
Potatoes, Sweet 35 262,684 Merced Stanislaus Kern Percent of Value 88.5 10.6 0.9
Tomatoes (Fresh Market) 36 253,000 Fresno Merced San Diego Kern Santa Clara Percent of Value 28.6 26.6 17.0 8.4 6.1
Other Pasture and Range 37 240,680 Kern Monterey Tulare Fresno Merced Percent of Value 9.0 7.7 6.2 5.9 5.4
Turkeys 38 235,334 Fresno Stanislaus Merced Kings San Joaquin Percent of Value 30.6 29.7 24.8 10.5 3.4
Potatoes (Incl. Seed) 39 205,404 Kern San Joaquin Imperial Siskiyou Riverside Percent of Value 53.5 23.4 10.5 6.5 5.9
Mushrooms 40 187,577 Monterey Santa Clara San Diego Percent of Value 49.3 42.1 8.5
Plums, Dried 41 177,540 Tulare Butte Yuba Sutter Tehama Percent of Value 20.6 17.5 14.1 13.8 10.2
Olives 42 153,896 Tehama Tulare Glenn San Joaquin Yolo Percent of Value 27.1 25.9 24.1 8.3 3.6
Berries, Blueberries 43 139,056 Tulare Kern San Joaquin Ventura Fresno Percent of Value 32.7 23.6 19.1 12.4 5.7
Wheat (Excl. Seed) 44 135,908 Imperial Kings Tulare Yolo Kern Percent of Value 22.8 9.7 9.3 7.2 6.6
Cantaloupes 45 134,415 Fresno Imperial Merced Riverside Kern Percent of Value 62.8 16.2 11.0 8.8 1.1
Pears 46 118,631 Sacramento Fresno Lake Mendocino Tulare Percent of Value 34.8 24.7 17.6 14.7 4.8
Cabbage 47 117,126 Monterey Ventura Imperial Santa Barbara Kern Percent of Value 39.3 25.2 12.6 11.2 5.7
Corn (sweet) 48 109,020 Imperial Contra Costa Fresno Riverside Santa Clara Percent of Value 37.8 21.3 12.9 10.3 8.3
Watermelon 49 108,048 San Joaquin Kern Riverside Fresno Imperial Percent of Value 38.7 18.6 18.5 16.7 7.0
Irrigated Pasture 50 102,747 Tulare Stanislaus Siskiyou Lassen Merced Percent of Value 26.3 9.2 6.7 5.4 4.2

CDFA 11 California County Agricultural Commissioners' Reports, 2016
Value$1,000
Commodity Rank and Leading Counties by Gross Value of Agricultural Production, 2016
1 3Commodity
State Five Leading Counties by Rank and Percentage of State Total
Rank 42 5
Corn (For Grain) 51 101,321 San Joaquin Sacramento Glenn Sutter Merced Percent of Value 33.8 14.1 12.3 10.3 8.3
Alfalfa seed 52 100,201 Imperial Fresno Madera Percent of Value 84.7 15.2 0.0
Sheep and Lambs 53 93,134 Fresno Kern Solano Sonoma Imperial Percent of Value 22.6 17.4 10.0 9.1 4.9
Salad Greens NEC 54 87,175 Monterey Imperial Santa Clara Kern Los Angeles Percent of Value 50.1 43.7 4.8 1.3 0.2
Berries, Blackberries 55 80,307 Santa Cruz Santa Barbara Monterey Fresno Kern Percent of Value 63.5 29.0 5.6 1.5 0.3
Grapefruit 56 79,308 Riverside San Diego Tulare Kern Imperial Percent of Value 35.7 24.1 21.7 11.9 5.5
Honeydew Melons 57 78,902 Fresno Riverside Imperial Sutter San Bernardino Percent of Value 67.9 17.0 10.5 4.7 0.0
Veg and Vinecrop Seeds 58 78,483 Colusa Glenn Imperial Kern Sutter Percent of Value 27.7 21.0 14.6 11.9 9.5
Apricots 59 74,647 Stanislaus Fresno Kings Tulare San Joaquin Percent of Value 32.1 22.1 18.2 15.0 5.4
Dry Beans 60 73,246 Stanislaus Tulare San Joaquin Fresno Sutter Percent of Value 23.4 17.6 11.4 9.7 7.6
Apples 61 71,885 El Dorado San Joaquin Santa Cruz Fresno Sonoma Percent of Value 26.8 23.0 17.8 10.6 7.6
Cottonseed 62 70,139 Kings Fresno Kern Tulare Merced Percent of Value 46.1 18.7 18.4 7.1 4.9
Grain Hay 63 64,761 Merced Fresno San Benito Stanislaus Kern Percent of Value 30.7 9.6 8.6 5.6 5.5
Cilantro 64 62,331 Ventura Imperial Monterey Kern San Bernardino Percent of Value 39.4 38.0 17.6 4.9 0.1
Kiwifruit 65 62,045 Tulare Yuba Butte Fresno Sutter Percent of Value 73.7 14.4 6.2 2.1 2.1
Dates 66 59,416 Riverside Imperial Percent of Value 67.9 32.1
Honey 67 56,511 Tulare Stanislaus Kern Fresno Merced Percent of Value 41.8 15.7 12.3 10.4 4.0
Sugar Beets 68 51,732 Imperial Percent of Value 100.0
Sudan Hay 69 50,974 Imperial Tulare Merced Stanislaus Solano Percent of Value 72.0 7.1 6.6 5.8 4.7
Asparagus 70 43,679 Fresno Monterey San Joaquin Kern Imperial Percent of Value 36.9 29.2 26.7 7.0 0.2
CDFA 12 California County Agricultural Commissioners' Reports, 2016
Value Portion of State Total$1,000 $1,000 Percent
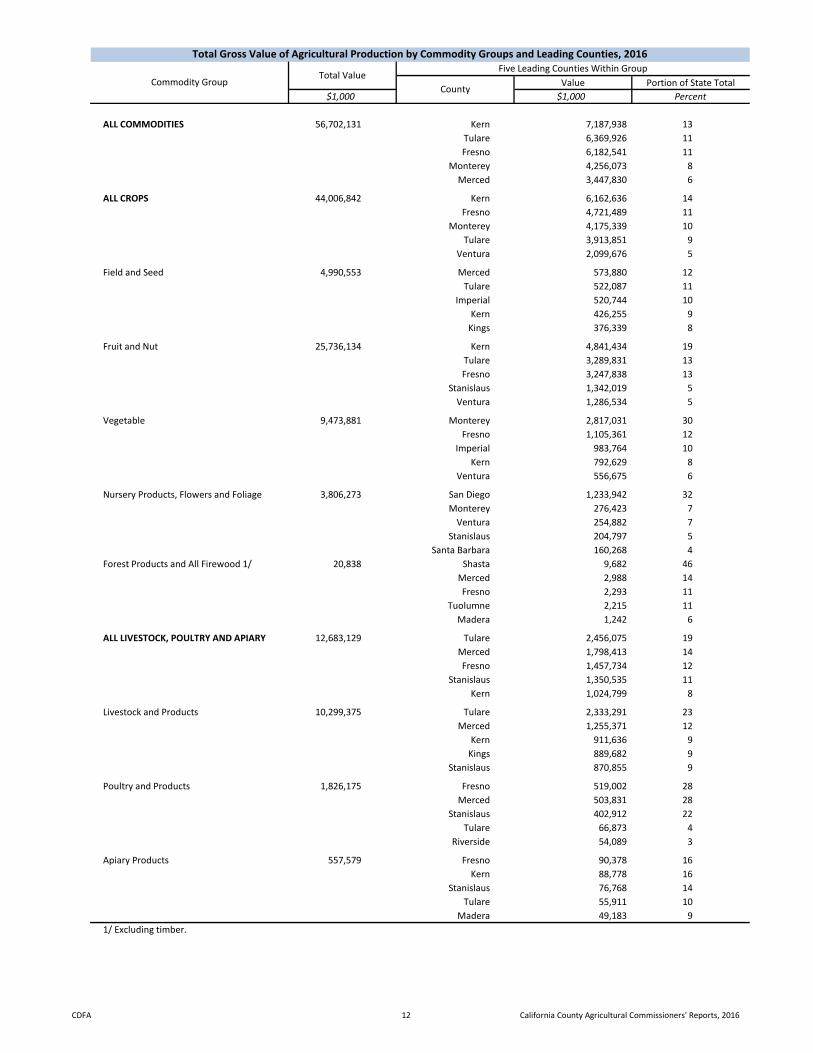
ALL COMMODITIES 56,702,131 Kern 7,187,938 13 Tulare 6,369,926 11 Fresno 6,182,541 11 Monterey 4,256,073 8 Merced 3,447,830 6
ALL CROPS 44,006,842 Kern 6,162,636 14 Fresno 4,721,489 11 Monterey 4,175,339 10 Tulare 3,913,851 9 Ventura 2,099,676 5
Field and Seed 4,990,553 Merced 573,880 12 Tulare 522,087 11 Imperial 520,744 10 Kern 426,255 9 Kings 376,339 8
Fruit and Nut 25,736,134 Kern 4,841,434 19 Tulare 3,289,831 13 Fresno 3,247,838 13 Stanislaus 1,342,019 5 Ventura 1,286,534 5
Vegetable 9,473,881 Monterey 2,817,031 30 Fresno 1,105,361 12 Imperial 983,764 10 Kern 792,629 8 Ventura 556,675 6
Nursery Products, Flowers and Foliage 3,806,273 San Diego 1,233,942 32 Monterey 276,423 7 Ventura 254,882 7 Stanislaus 204,797 5 Santa Barbara 160,268 4Forest Products and All Firewood 1/ 20,838 Shasta 9,682 46
Merced 2,988 14Fresno 2,293 11
Tuolumne 2,215 11Madera 1,242 6
ALL LIVESTOCK, POULTRY AND APIARY 12,683,129 Tulare 2,456,075 19 Merced 1,798,413 14 Fresno 1,457,734 12 Stanislaus 1,350,535 11 Kern 1,024,799 8
Livestock and Products 10,299,375 Tulare 2,333,291 23 Merced 1,255,371 12 Kern 911,636 9 Kings 889,682 9 Stanislaus 870,855 9
Poultry and Products 1,826,175 Fresno 519,002 28 Merced 503,831 28 Stanislaus 402,912 22 Tulare 66,873 4 Riverside 54,089 3
Apiary Products 557,579 Fresno 90,378 16 Kern 88,778 16 Stanislaus 76,768 14 Tulare 55,911 10 Madera 49,183 91/ Excluding timber.
Commodity GroupFive Leading Counties Within Group
Total Value
Total Gross Value of Agricultural Production by Commodity Groups and Leading Counties, 2016
County
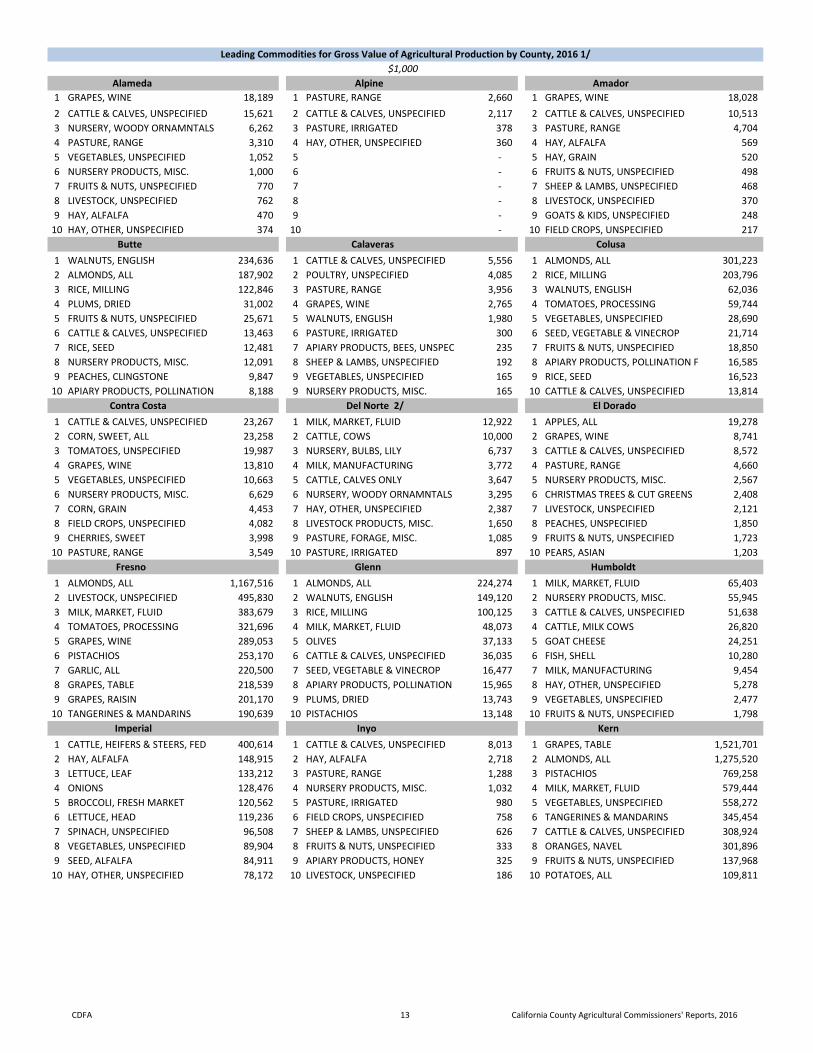
CDFA 13 California County Agricultural Commissioners' Reports, 2016
Alameda Alpine Amador 1 GRAPES, WINE 18,189 1 PASTURE, RANGE 2,660 1 GRAPES, WINE 18,028 2 CATTLE & CALVES, UNSPECIFIED 15,621 2 CATTLE & CALVES, UNSPECIFIED 2,117 2 CATTLE & CALVES, UNSPECIFIED 10,513 3 NURSERY, WOODY ORNAMNTALS 6,262 3 PASTURE, IRRIGATED 378 3 PASTURE, RANGE 4,704 4 PASTURE, RANGE 3,310 4 HAY, OTHER, UNSPECIFIED 360 4 HAY, ALFALFA 569 5 VEGETABLES, UNSPECIFIED 1,052 5 - 5 HAY, GRAIN 520 6 NURSERY PRODUCTS, MISC. 1,000 6 - 6 FRUITS & NUTS, UNSPECIFIED 498 7 FRUITS & NUTS, UNSPECIFIED 770 7 - 7 SHEEP & LAMBS, UNSPECIFIED 468 8 LIVESTOCK, UNSPECIFIED 762 8 - 8 LIVESTOCK, UNSPECIFIED 370 9 HAY, ALFALFA 470 9 - 9 GOATS & KIDS, UNSPECIFIED 248
10 HAY, OTHER, UNSPECIFIED 374 10 - 10 FIELD CROPS, UNSPECIFIED 217 Butte Calaveras Colusa 1 WALNUTS, ENGLISH 234,636 1 CATTLE & CALVES, UNSPECIFIED 5,556 1 ALMONDS, ALL 301,223 2 ALMONDS, ALL 187,902 2 POULTRY, UNSPECIFIED 4,085 2 RICE, MILLING 203,796 3 RICE, MILLING 122,846 3 PASTURE, RANGE 3,956 3 WALNUTS, ENGLISH 62,036 4 PLUMS, DRIED 31,002 4 GRAPES, WINE 2,765 4 TOMATOES, PROCESSING 59,744 5 FRUITS & NUTS, UNSPECIFIED 25,671 5 WALNUTS, ENGLISH 1,980 5 VEGETABLES, UNSPECIFIED 28,690 6 CATTLE & CALVES, UNSPECIFIED 13,463 6 PASTURE, IRRIGATED 300 6 SEED, VEGETABLE & VINECROP 21,714 7 RICE, SEED 12,481 7 APIARY PRODUCTS, BEES, UNSPEC 235 7 FRUITS & NUTS, UNSPECIFIED 18,850 8 NURSERY PRODUCTS, MISC. 12,091 8 SHEEP & LAMBS, UNSPECIFIED 192 8 APIARY PRODUCTS, POLLINATION F 16,585 9 PEACHES, CLINGSTONE 9,847 9 VEGETABLES, UNSPECIFIED 165 9 RICE, SEED 16,523
10 APIARY PRODUCTS, POLLINATION 8,188 9 NURSERY PRODUCTS, MISC. 165 10 CATTLE & CALVES, UNSPECIFIED 13,814 Contra Costa Del Norte 2/ El Dorado 1 CATTLE & CALVES, UNSPECIFIED 23,267 1 MILK, MARKET, FLUID 12,922 1 APPLES, ALL 19,278 2 CORN, SWEET, ALL 23,258 2 CATTLE, COWS 10,000 2 GRAPES, WINE 8,741 3 TOMATOES, UNSPECIFIED 19,987 3 NURSERY, BULBS, LILY 6,737 3 CATTLE & CALVES, UNSPECIFIED 8,572 4 GRAPES, WINE 13,810 4 MILK, MANUFACTURING 3,772 4 PASTURE, RANGE 4,660 5 VEGETABLES, UNSPECIFIED 10,663 5 CATTLE, CALVES ONLY 3,647 5 NURSERY PRODUCTS, MISC. 2,567 6 NURSERY PRODUCTS, MISC. 6,629 6 NURSERY, WOODY ORNAMNTALS 3,295 6 CHRISTMAS TREES & CUT GREENS 2,408 7 CORN, GRAIN 4,453 7 HAY, OTHER, UNSPECIFIED 2,387 7 LIVESTOCK, UNSPECIFIED 2,121 8 FIELD CROPS, UNSPECIFIED 4,082 8 LIVESTOCK PRODUCTS, MISC. 1,650 8 PEACHES, UNSPECIFIED 1,850 9 CHERRIES, SWEET 3,998 9 PASTURE, FORAGE, MISC. 1,085 9 FRUITS & NUTS, UNSPECIFIED 1,723
10 PASTURE, RANGE 3,549 10 PASTURE, IRRIGATED 897 10 PEARS, ASIAN 1,203 Fresno Glenn Humboldt 1 ALMONDS, ALL 1,167,516 1 ALMONDS, ALL 224,274 1 MILK, MARKET, FLUID 65,403 2 LIVESTOCK, UNSPECIFIED 495,830 2 WALNUTS, ENGLISH 149,120 2 NURSERY PRODUCTS, MISC. 55,945 3 MILK, MARKET, FLUID 383,679 3 RICE, MILLING 100,125 3 CATTLE & CALVES, UNSPECIFIED 51,638 4 TOMATOES, PROCESSING 321,696 4 MILK, MARKET, FLUID 48,073 4 CATTLE, MILK COWS 26,820 5 GRAPES, WINE 289,053 5 OLIVES 37,133 5 GOAT CHEESE 24,251 6 PISTACHIOS 253,170 6 CATTLE & CALVES, UNSPECIFIED 36,035 6 FISH, SHELL 10,280 7 GARLIC, ALL 220,500 7 SEED, VEGETABLE & VINECROP 16,477 7 MILK, MANUFACTURING 9,454 8 GRAPES, TABLE 218,539 8 APIARY PRODUCTS, POLLINATION 15,965 8 HAY, OTHER, UNSPECIFIED 5,278 9 GRAPES, RAISIN 201,170 9 PLUMS, DRIED 13,743 9 VEGETABLES, UNSPECIFIED 2,477
10 TANGERINES & MANDARINS 190,639 10 PISTACHIOS 13,148 10 FRUITS & NUTS, UNSPECIFIED 1,798 Imperial Inyo Kern 1 CATTLE, HEIFERS & STEERS, FED 400,614 1 CATTLE & CALVES, UNSPECIFIED 8,013 1 GRAPES, TABLE 1,521,701 2 HAY, ALFALFA 148,915 2 HAY, ALFALFA 2,718 2 ALMONDS, ALL 1,275,520 3 LETTUCE, LEAF 133,212 3 PASTURE, RANGE 1,288 3 PISTACHIOS 769,258 4 ONIONS 128,476 4 NURSERY PRODUCTS, MISC. 1,032 4 MILK, MARKET, FLUID 579,444 5 BROCCOLI, FRESH MARKET 120,562 5 PASTURE, IRRIGATED 980 5 VEGETABLES, UNSPECIFIED 558,272 6 LETTUCE, HEAD 119,236 6 FIELD CROPS, UNSPECIFIED 758 6 TANGERINES & MANDARINS 345,454 7 SPINACH, UNSPECIFIED 96,508 7 SHEEP & LAMBS, UNSPECIFIED 626 7 CATTLE & CALVES, UNSPECIFIED 308,924 8 VEGETABLES, UNSPECIFIED 89,904 8 FRUITS & NUTS, UNSPECIFIED 333 8 ORANGES, NAVEL 301,896 9 SEED, ALFALFA 84,911 9 APIARY PRODUCTS, HONEY 325 9 FRUITS & NUTS, UNSPECIFIED 137,968
10 HAY, OTHER, UNSPECIFIED 78,172 10 LIVESTOCK, UNSPECIFIED 186 10 POTATOES, ALL 109,811
Leading Commodities for Gross Value of Agricultural Production by County, 2016 1/$1,000

CDFA 14 California County Agricultural Commissioners' Reports, 2016
Leading Commodities for Gross Value of Agricultural Production by County, 2016 1/$1,000
Kings Lake Lassen 2/ 1 MILK, MARKET, FLUID 631,937 1 GRAPES, WINE 78,644 1 HAY, OTHER, UNSPECIFIED 31,572 2 CATTLE & CALVES, UNSPECIFIED 220,137 2 PEARS, BARTLETT 19,412 2 HAY, ALFALFA 19,496 3 PISTACHIOS 178,588 3 WALNUTS, ENGLISH 3,675 3 VEGETABLES, UNSPECIFIED 15,660 4 COTTON LINT, PIMA 176,028 4 CATTLE & CALVES, UNSPECIFIED 1,851 4 CATTLE, STEERS 12,996 5 ALMONDS, ALL 119,295 5 PEARS, UNSPECIFIED 1,438 5 CATTLE, HEIFERS 9,558 6 TOMATOES, PROCESSING 119,216 6 FIELD CROPS, UNSPECIFIED 1,401 6 CATTLE, CALVES ONLY 6,295 7 VEGETABLES, UNSPECIFIED 56,617 7 NURSERY PRODUCTS, MISC. 925 7 CATTLE, MILK COWS 6,217 8 WALNUTS, ENGLISH 56,276 8 PASTURE, RANGE 765 8 PASTURE, IRRIGATED 5,520 9 CORN, SILAGE 45,525 9 VEGETABLES, UNSPECIFIED 231 9 HAY, GRAIN 2,125
10 COTTONSEED 32,368 10 LIVESTOCK PRODUCTS, MISC. 168 10 CATTLE, BULLS 1,923 Los Angeles 2/ Madera Marin 1 VEGETABLES, UNSPECIFIED 70,108 1 ALMONDS, ALL 573,495 1 MILK, MARKET, FLUID 43,135 2 NURSERY, WOODY ORNAMNTALS 47,960 2 MILK, MARKET, FLUID 271,483 2 POULTRY, UNSPECIFIED 19,177 3 NURSERY PLANTS, BEDDING 21,588 3 PISTACHIOS 233,621 3 PASTURE, RANGE 11,088 4 NURSERY PRODUCTS, MISC. 13,382 4 GRAPES, WINE 131,571 4 CATTLE & CALVES, UNSPECIFIED 10,543 5 HAY, ALFALFA 11,236 5 GRAPES, RAISIN 81,828 5 FISH, SHELL 4,760 6 LIVESTOCK, UNSPECIFIED 7,977 6 FRUITS & NUTS, UNSPECIFIED 71,461 6 VEGETABLES, UNSPECIFIED 3,412 7 FRUITS & NUTS, UNSPECIFIED 4,234 7 CATTLE & CALVES, UNSPECIFIED 62,377 7 SHEEP & LAMBS, UNSPECIFIED 1,793 8 FLOWERS, FOLIAGE PLANTS 3,663 8 GRAPES, TABLE 57,199 8 GRAPES, WINE 867 9 NURSERY PLANTS, POTTED, UNSPE 2,505 9 APIARY PRODUCTS, POLLINATION 48,006 9 HAY, OTHER, UNSPECIFIED 673
10 NURSERY PLANTS, VEGETABLE BED 2,448 10 CATTLE, DAIRY HEIFERS, REPLACEM 32,400 10 SILAGE 647 Mariposa 2/ Mendocino 2/ Merced 1 CATTLE & CALVES, UNSPECIFIED 28,557 1 GRAPES, WINE 88,287 1 MILK, MARKET, FLUID 858,441 2 PASTURE, RANGE 6,072 2 PEARS, BARTLETT 13,797 2 ALMONDS, ALL 578,581 3 LIVESTOCK PRODUCTS, MISC. 3,285 3 CATTLE & CALVES, UNSPECIFIED 10,704 3 CHICKENS, BROILERS 381,036 4 POULTRY, UNSPECIFIED 2,003 4 PASTURE, FORAGE, MISC. 4,950 4 CATTLE & CALVES, UNSPECIFIED 296,508 5 LIVESTOCK, UNSPECIFIED 999 5 MILK, MARKET, FLUID 3,967 5 POTATOES, SWEET 232,399 6 FRUITS & NUTS, UNSPECIFIED 388 6 PEARS, UNSPECIFIED 3,591 6 CORN, SILAGE 98,842 7 SHEEP & LAMBS, UNSPECIFIED 261 7 PASTURE, RANGE 2,769 7 TOMATOES, PROCESSING 84,611 8 HAY, OTHER, UNSPECIFIED 229 8 FIELD CROPS, UNSPECIFIED 2,600 8 MILK, MANUFACTURING 80,601 9 FIELD CROPS, UNSPECIFIED 151 9 NURSERY PRODUCTS, MISC. 1,560 9 GRAPES, WINE 79,891
10 NURSERY PRODUCTS, MISC. 69 10 LIVESTOCK PRODUCTS, MISC. 1,500 10 HAY, ALFALFA 77,003 Napa Mono Monterey 1 GRAPES, WINE 729,507 1 CATTLE & CALVES, UNSPECIFIED 8,603 1 BERRIES, STRAWBERRIES, FRESH MA 706,875 2 CATTLE & CALVES, UNSPECIFIED 2,744 2 HAY, ALFALFA 8,496 2 LETTUCE, ROMAINE 558,760 3 NURSERY PRODUCTS, MISC. 2,133 3 LIVESTOCK, UNSPECIFIED 2,570 3 LETTUCE, HEAD 478,172 4 LIVESTOCK PRODUCTS, MISC. 661 4 SHEEP & LAMBS, UNSPECIFIED 2,439 4 BROCCOLI, FRESH MARKET 312,000 5 SHEEP & LAMBS, UNSPECIFIED 615 5 FIELD CROPS, UNSPECIFIED 2,063 5 GRAPES, WINE 238,892 6 OLIVES 457 6 PASTURE, IRRIGATED 1,820 6 LETTUCE, LEAF 219,620 7 PASTURE, RANGE 404 7 PASTURE, RANGE 1,490 7 CAULIFLOWER, FRESH MARKET 166,896 8 FRUITS & NUTS, UNSPECIFIED 385 8 WOOL 184 8 VEGETABLES, UNSPECIFIED 158,350 9 VEGETABLES, UNSPECIFIED 295 9 FOREST PRODUCTS, FIREWOOD 56 9 CELERY, FRESH MARKET 149,600
10 HAY, GRAIN 77 10 FRUITS & NUTS, UNSPECIFIED 43 10 SPINACH, FOOD SERVICE 109,836 Placer Nevada Orange 1 RICE, MILLING 12,635 1 CATTLE, HEIFERS & STEERS, FED 5,996 1 NURSERY, WOODY ORNAMNTALS 54,551 2 LIVESTOCK, UNSPECIFIED 10,765 2 CATTLE, MILK COWS, CULL 4,109 2 BERRIES, STRAWBERRIES, UNSPECIF 21,777 3 CATTLE & CALVES, UNSPECIFIED 8,330 3 GRAPES, WINE 1,927 3 VEGETABLES, UNSPECIFIED 19,025 4 NURSERY PRODUCTS, MISC. 8,154 4 PASTURE, RANGE 1,900 4 FRUITS & NUTS, UNSPECIFIED 16,568 5 WALNUTS, ENGLISH 5,629 5 PASTURE, IRRIGATED 1,800 5 NURSERY PRODUCTS, MISC. 1,049 6 PASTURE, IRRIGATED 2,700 6 VEGETABLES, UNSPECIFIED 1,771 6 LIVESTOCK, UNSPECIFIED 876 7 PASTURE, RANGE 2,600 7 APIARY PRODUCTS, BEES, UNSPEC 268 7 FIELD CROPS, UNSPECIFIED 732 8 VEGETABLES, UNSPECIFIED 1,750 8 NURSERY PRODUCTS, MISC. 261 8 TOMATOES, UNSPECIFIED 123 9 TANGERINES & MANDARINS 1,589 9 LIVESTOCK, UNSPECIFIED 213 9 NURSERY PLANTS, POTTED, UNSPEC 85
10 LIVESTOCK PRODUCTS, MISC. 1,500 10 FRUITS & NUTS, UNSPECIFIED 193 10 POULTRY, UNSPECIFIED 11

CDFA 15 California County Agricultural Commissioners' Reports, 2016
Leading Commodities for Gross Value of Agricultural Production by County, 2016 1/$1,000
Sacramento Plumas 2/ Riverside 1 GRAPES, WINE 184,202 1 CATTLE, STEERS 9,074 1 MILK, MARKET, FLUID 149,019 2 MILK, MARKET, FLUID 48,897 2 CATTLE, HEIFERS 6,277 2 GRAPES, TABLE 139,319 3 PEARS, BARTLETT 41,229 3 PASTURE, IRRIGATED 3,510 3 LEMONS, ALL 126,230 4 POULTRY, UNSPECIFIED 36,813 4 HAY, ALFALFA 2,987 4 NURSERY, WOODY ORNAMNTALS 122,346 5 NURSERY PRODUCTS, MISC. 30,702 5 CATTLE, STOCKERS, FEEDERS 1,882 5 PEPPERS, BELL 78,470 6 VEGETABLES, UNSPECIFIED 27,437 6 HAY, WILD 1,406 6 HAY, ALFALFA 68,267 7 CATTLE & CALVES, UNSPECIFIED 21,635 7 PASTURE, FORAGE, MISC. 1,035 7 EGGS, CHICKEN, MARKET 54,089 8 FISH 16,576 8 CATTLE, BULLS 929 8 DATES 40,347 9 CORN, GRAIN 14,281 9 PASTURE, RANGE 571 9 AVOCADOS, ALL 33,392
10 HAY, ALFALFA 13,346 10 CATTLE, BEEF COWS, CULL 555 10 CARROTS, UNSPECIFIED 30,975 San Diego San Benito San Bernardino 1 NURSERY, WOODY ORNAMNTALS 436,817 1 VEGETABLES, UNSPECIFIED 55,016 1 MILK, MARKET, FLUID 154,211 2 FLOWERS, FOLIAGE PLANTS 362,925 2 LETTUCE, BULK SALAD PRODUCTS 43,874 2 CATTLE & CALVES, UNSPECIFIED 68,032 3 NURSERY PLANTS, BEDDING 239,070 3 PEPPERS, BELL 32,973 3 CATTLE, MILK COWS, CULL 42,508 4 AVOCADOS, ALL 136,226 4 LETTUCE, ROMAINE 32,895 4 CATTLE, DAIRY HEIFERS, REPLACEM 34,952 5 FLOWERS, CACTI, SUCCULENTS 82,958 5 GRAPES, WINE 31,117 5 EGGS, CHICKEN, UNSPECIFIED 23,595 6 LEMONS, ALL 56,875 6 SPINACH, UNSPECIFIED 25,326 6 NURSERY, WOODY ORNAMNTALS 18,494 7 FLOWERS, CUT, UNSPECIFIED 56,082 7 KALE 19,057 7 FLOWERS, FOLIAGE PLANTS 15,757 8 VEGETABLES, UNSPECIFIED 45,725 8 BROCCOLI, UNSPECIFIED 13,116 8 VEGETABLES, UNSPECIFIED 14,694 9 TOMATOES, FRESH MARKET 43,030 9 ONIONS 12,929 9 HAY, ALFALFA 14,093
10 ORANGES, UNSPECIFIED 40,414 10 PASTURE, RANGE 12,649 10 CABBAGE, CHINESE & SPECIALTY 9,119 San Luis Obispo San Francisco 2/ San Joaquin 1 GRAPES, WINE 242,900 1 FIELD CROPS, UNSPECIFIED 241 1 GRAPES, WINE 425,781 2 BERRIES, STRAWBERRIES, FRESH M 197,388 2 APIARY PRODUCTS, HONEY 58 2 MILK, MARKET, FLUID 362,196 3 VEGETABLES, UNSPECIFIED 101,469 3 - 3 ALMONDS, ALL 348,819 4 AVOCADOS, ALL 44,628 4 - 4 WALNUTS, ENGLISH 273,965 5 BERRIES, STRAWBERRIES, PROCESS 43,894 5 - 5 CATTLE & CALVES, UNSPECIFIED 106,251 6 BROCCOLI, UNSPECIFIED 43,878 6 - 6 TOMATOES, PROCESSING 90,241 7 CATTLE & CALVES, UNSPECIFIED 39,984 7 - 7 CHERRIES, SWEET 58,541 8 NURSERY PLANTS, VEGETABLE BED 34,195 8 - 8 POTATOES, ALL 47,978 9 FLOWERS, CUT, UNSPECIFIED 29,547 9 - 9 HAY, ALFALFA 46,796
10 FRUITS & NUTS, UNSPECIFIED 22,173 10 - 10 MELONS, WATERMELON 41,859 Santa Clara San Mateo Santa Barbara 1 MUSHROOMS 79,020 1 NURSERY PLANTS, POTTED, UNSPE 72,893 1 BERRIES, STRAWBERRIES, UNSPECIF 413,999 2 NURSERY PRODUCTS, MISC. 36,344 2 NURSERY PRODUCTS, MISC. 14,340 2 GRAPES, WINE 151,630 3 NURSERY, WOODY ORNAMNTALS 28,659 3 BRUSSELS SPROUTS 12,951 3 BROCCOLI, UNSPECIFIED 148,729 4 PEPPERS, BELL 19,822 4 FLOWERS, FOLIAGE, CUT, ALL 6,740 4 VEGETABLES, UNSPECIFIED 117,981 5 SPINACH, UNSPECIFIED 16,617 5 VEGETABLES, UNSPECIFIED 6,573 5 LETTUCE, HEAD 71,236 6 NURSERY PLANTS, BEDDING 16,212 6 FLOWERS, CUT, UNSPECIFIED 3,106 6 CAULIFLOWER, UNSPECIFIED 70,477 7 TOMATOES, FRESH MARKET 15,493 7 CATTLE & CALVES, UNSPECIFIED 1,980 7 FLOWERS, CUT, UNSPECIFIED 66,522 8 LETTUCE, UNSPECIFIED 14,731 8 FRUITS & NUTS, UNSPECIFIED 1,914 8 AVOCADOS, ALL 63,483 9 PEPPERS, CHILI, HOT 10,569 9 BEANS, FAVA 1,863 9 NURSERY PRODUCTS, MISC. 49,464
10 CORN, SWEET, ALL 8,996 10 LEEKS 1,778 10 CELERY, UNSPECIFIED 40,923 Sierra 2/ Santa Cruz Shasta 1 CATTLE, STEERS 3,460 1 BERRIES, STRAWBERRIES, UNSPEC 229,107 1 NURSERY PRODUCTS, MISC. 14,083 2 CATTLE, HEIFERS 2,593 2 BERRIES, RASPBERRIES 158,330 2 HAY, OTHER, UNSPECIFIED 11,368 3 PASTURE, IRRIGATED 1,300 3 NURSERY PRODUCTS, MISC. 57,972 3 RICE, WILD 8,630 4 HAY, ALFALFA 960 4 BERRIES, BLACKBERRIES 51,031 4 CATTLE, STOCKERS, FEEDERS 8,567 5 CATTLE, STOCKERS, FEEDERS 455 5 VEGETABLES, UNSPECIFIED 40,911 5 CATTLE, BEEF COW, BREEDING 5,270 6 PASTURE, FORAGE, MISC. 315 6 FLOWERS, CUT, UNSPECIFIED 35,640 6 PASTURE, RANGE 4,330 7 PASTURE, RANGE 234 7 BRUSSELS SPROUTS 14,165 7 PASTURE, IRRIGATED 3,920 8 HAY, GRAIN 219 8 LETTUCE, LEAF 12,951 8 APIARY PRODUCTS, BEES, QUEEN 3,831 9 CATTLE & CALVES, UNSPECIFIED 160 9 APPLES, ALL 12,784 9 WALNUTS, ENGLISH 3,376
10 HAY, WILD 96 10 LIVESTOCK, UNSPECIFIED 7,403 10 APIARY PRODUCTS, POLLINATION F 3,235

CDFA 16 California County Agricultural Commissioners' Reports, 2016
Leading Commodities for Gross Value of Agricultural Production by County, 2016 1/$1,000
Sonoma Siskiyou Solano 1 GRAPES, WINE 586,518 1 NURSERY PLANTS, STRAWBERRY 130,496 1 WALNUTS, ENGLISH 44,822 2 MILK, MARKET, FLUID 146,475 2 HAY, ALFALFA 47,689 2 NURSERY PRODUCTS, MISC. 39,754 3 POULTRY, UNSPECIFIED 40,823 3 CATTLE, HEIFERS & STEERS, FED 14,438 3 ALMONDS, ALL 35,917 4 LIVESTOCK PRODUCTS, MISC. 31,299 4 HAY, OTHER, UNSPECIFIED 14,024 4 TOMATOES, PROCESSING 33,843 5 CATTLE & CALVES, UNSPECIFIED 20,562 5 POTATOES, ALL 13,115 5 VEGETABLES, UNSPECIFIED 33,742 6 NURSERY, WOODY ORNAMNTALS 14,322 6 NURSERY PRODUCTS, MISC. 9,375 6 HAY, ALFALFA 22,267 7 NURSERY PRODUCTS, MISC. 13,002 7 WHEAT, ALL 8,401 7 GRAPES, WINE 19,560 8 VEGETABLES, UNSPECIFIED 9,961 8 ONIONS 7,298 8 LIVESTOCK PRODUCTS, MISC. 14,635 9 SHEEP & LAMBS, UNSPECIFIED 8,481 9 PASTURE, IRRIGATED 6,854 9 SUNFLOWER SEED, PLANTING 11,414
10 PASTURE, RANGE 6,461 10 CATTLE, COWS 6,512 10 SHEEP & LAMBS, UNSPECIFIED 9,339 Tehama Stanislaus Sutter 1 WALNUTS, ENGLISH 104,926 1 ALMONDS, ALL 907,200 1 RICE, MILLING 122,061 2 ALMONDS, ALL 46,459 2 MILK, MARKET, FLUID 566,842 2 WALNUTS, ENGLISH 118,750 3 OLIVES 41,748 3 CHICKENS, UNSPECIFIED 295,132 3 PEACHES, CLINGSTONE 56,801 4 NURSERY PRODUCTS, MISC. 18,186 4 NURSERY, FRUIT/VINE/NUT, NON- 162,685 4 NURSERY, FRUIT/VINE/NUT, NON-B 35,196 5 PLUMS, DRIED 18,069 5 WALNUTS, ENGLISH 134,505 5 TOMATOES, PROCESSING 34,889 6 APIARY PRODUCTS, BEES, UNSPEC 17,537 6 CATTLE, DAIRY HEIFERS, REPLACEM 132,580 6 ALMONDS, ALL 31,435 7 CATTLE, STOCKERS, FEEDERS 13,510 7 FRUITS & NUTS, UNSPECIFIED 97,081 7 PLUMS, DRIED 24,569 8 PASTURE, RANGE 11,480 8 CORN, SILAGE 94,770 8 CORN, GRAIN 10,427 9 FRUITS & NUTS, UNSPECIFIED 11,128 9 TURKEYS, UNSPECIFIED 69,910 9 SEED, VEGETABLE & VINECROP 7,429
10 MILK, MARKET, FLUID 9,491 10 APIARY PRODUCTS, POLLINATION 66,006 10 SUNFLOWER SEED, PLANTING 5,959 Tuolumne Trinity Tulare 1 LIVESTOCK, UNSPECIFIED 12,405 1 CATTLE & CALVES, UNSPECIFIED 3,227 1 MILK, MARKET, FLUID 1,641,339 2 CATTLE, CALVES ONLY 9,711 2 PASTURE, RANGE 1,258 2 ORANGES, NAVEL 686,145 3 PASTURE, RANGE 3,706 3 PASTURE, IRRIGATED 165 3 CATTLE & CALVES, UNSPECIFIED 660,400 4 FOREST PRODUCTS, FIREWOOD 1,140 4 GRAPES, WINE 147 4 GRAPES, TABLE 478,048 5 FOREST PRODUCTS, UNSPECIFIED 1,006 5 HAY, OTHER, UNSPECIFIED 88 5 TANGERINES & MANDARINS 343,380 6 CATTLE, BEEF COWS, CULL 330 6 APIARY PRODUCTS, HONEY 12 6 PISTACHIOS 339,208 7 FRUITS & NUTS, UNSPECIFIED 322 7 FRUITS & NUTS, UNSPECIFIED 6 7 ALMONDS, ALL 292,160 8 NURSERY PRODUCTS, MISC. 272 7 VEGETABLES, UNSPECIFIED 6 8 CORN, SILAGE 180,752 9 VEGETABLES, UNSPECIFIED 214 9 NURSERY PRODUCTS, MISC. 4 9 ORANGES, VALENCIA 152,448
10 SHEEP & LAMBS, UNSPECIFIED 198 10 - 10 SILAGE 138,677 Yuba Ventura Yolo 1 WALNUTS, ENGLISH 65,901 1 BERRIES, STRAWBERRIES, FRESH M 595,282 1 TOMATOES, PROCESSING 121,513 2 RICE, MILLING 38,682 2 LEMONS, ALL 266,977 2 ALMONDS, ALL 99,234 3 PLUMS, DRIED 24,977 3 CELERY, UNSPECIFIED 202,363 3 GRAPES, WINE 81,264 4 PEACHES, CLINGSTONE 23,741 4 BERRIES, RASPBERRIES 171,163 4 FIELD CROPS, UNSPECIFIED 57,794 5 CATTLE & CALVES, UNSPECIFIED 12,432 5 AVOCADOS, ALL 129,000 5 VEGETABLES, UNSPECIFIED 43,024 6 MILK, MARKET, FLUID 10,055 6 NURSERY, WOODY ORNAMNTALS 98,513 6 RICE, MILLING 43,016 7 KIWIFRUIT 8,940 7 PEPPERS, BELL 61,078 7 SUNFLOWER SEED, PLANTING 34,354 8 FRUITS & NUTS, UNSPECIFIED 6,476 8 BERRIES, STRAWBERRIES, PROCESS 59,620 8 WALNUTS, ENGLISH 34,176 9 FIELD CROPS, UNSPECIFIED 6,328 9 VEGETABLES, UNSPECIFIED 48,669 9 HAY, ALFALFA 23,290
10 ALMONDS, ALL 4,491 10 TOMATOES, UNSPECIFIED 47,987 10 SEED, OTHER (NO FLOWERS) 21,171
2/
1/ The data rankings were extracted from County Agricultural Commissioners' Reports where published. Those not ranked by the counties were ranked by USDA's National Agricultural Statistics Service, Pacific Regional Office. Timber was omitted in rankings.
Agricultural production value is from crop year 2015. Data for crop year 2016 was not available at time of publication.

CDFA 17 California County Agricultural Commissioners' Reports, 2016
Total Value (Dollars)
Alameda 11 175 ---Amador 6 --- ---Butte 86 10,868 23,759,940Calaveras 6 100 ---Colusa 38 16,389 12,444,000Humboldt 145 115,760 ---Imperial 48 33,505 242,404,000Kern 1/ 63 --- ---Kings 35 26,472 ---Lake 109 2,412 7,120,257Lassen --- 86,910 2,773,072Los Angeles 39 583 ---Madera 63 --- 43,119,000Marin 65 46,321 66,123,269Mariposa 1 --- ---Mendocino --- 15,856 ---Merced 69 28,813 400,000,000Monterey 179 32,947 365,199,000Napa 139 4,013 ---Nevada 37 --- ---Placer 26 5,054 ---Riverside 202 --- ---Sacramento 101 --- ---San Benito 78 --- 93,225,000San Diego 392 7,448 ---San Joaquin 47 1,930 34,987,000San Luis Obispo 130 54,448 ---San Mateo 29 689 6,815,000Santa Barbara 159 >6,200 ---Santa Clara 39 1,885 ---Santa Cruz >100 6,859 115,528,000Shasta 40 10,672 ---Siskiyou --- 31,430 19,611,876Solano 41 7,011 ---Sonoma 1/ 521 44,748 191,735,771Stanislaus --- 8,507 99,696,000Sutter 33 15,220 26,272,857Tehama 30 80,089 ---Trinity 5 53 ---Tulare 97 18,871 ---Tuolumne 7 1,029 ---Ventura 155 7,543 177,014,000Yolo 109 45,504 58,863,000Yuba 14 1,099 ---1/ Includes producers and handlers.
Organic Farming, 2016
County Number of Farms Estimated Acres
CDFA, 18 California County Agricultural Commissioners’ Reports, 2016
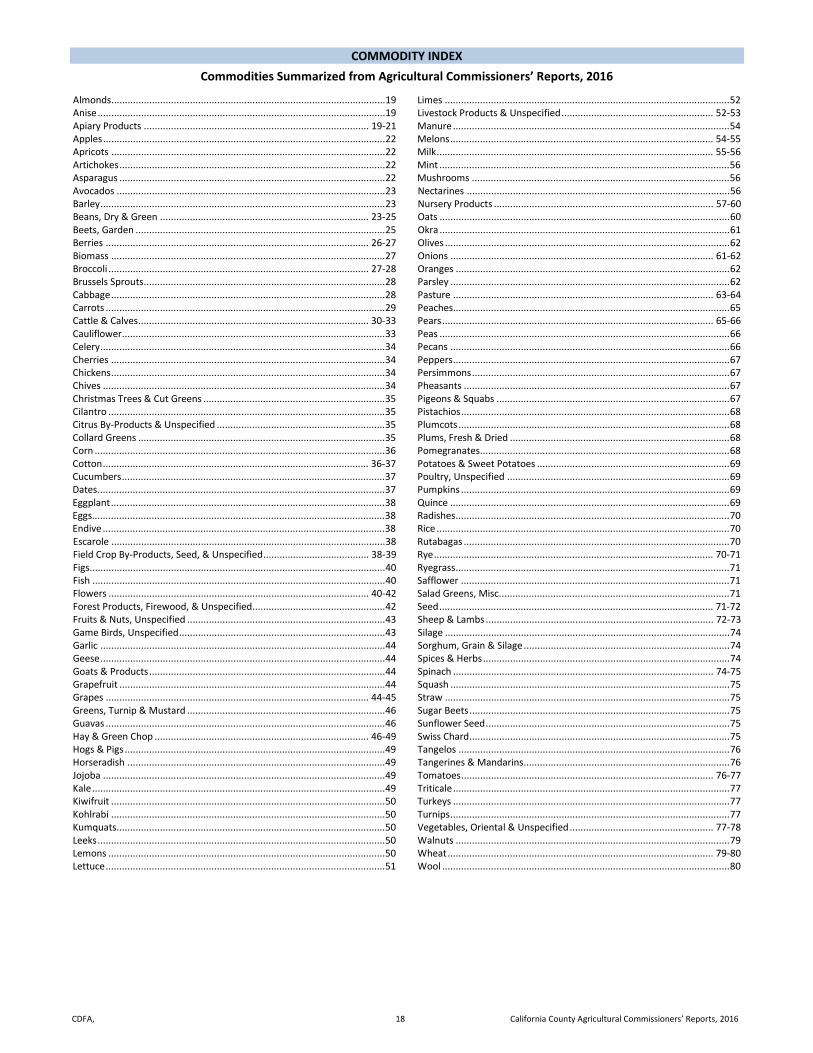
COMMODITY INDEX Commodities Summarized from Agricultural Commissioners’ Reports, 2016
Almonds ..................................................................................................... 19 Anise .......................................................................................................... 19 Apiary Products ................................................................................... 19-21 Apples ........................................................................................................ 22 Apricots ..................................................................................................... 22 Artichokes .................................................................................................. 22 Asparagus .................................................................................................. 22 Avocados ................................................................................................... 23 Barley ......................................................................................................... 23 Beans, Dry & Green ............................................................................. 23-25 Beets, Garden ............................................................................................ 25 Berries ................................................................................................. 26-27 Biomass ..................................................................................................... 27 Broccoli ................................................................................................ 27-28 Brussels Sprouts......................................................................................... 28 Cabbage ..................................................................................................... 28 Carrots ....................................................................................................... 29 Cattle & Calves ..................................................................................... 30-33 Cauliflower................................................................................................. 33 Celery ......................................................................................................... 34 Cherries ..................................................................................................... 34 Chickens ..................................................................................................... 34 Chives ........................................................................................................ 34 Christmas Trees & Cut Greens ................................................................... 35 Cilantro ...................................................................................................... 35 Citrus By-Products & Unspecified .............................................................. 35 Collard Greens ........................................................................................... 35 Corn ........................................................................................................... 36 Cotton .................................................................................................. 36-37 Cucumbers ................................................................................................. 37 Dates.......................................................................................................... 37 Eggplant ..................................................................................................... 38 Eggs............................................................................................................ 38 Endive ........................................................................................................ 38 Escarole ..................................................................................................... 38 Field Crop By-Products, Seed, & Unspecified ....................................... 38-39 Figs ............................................................................................................. 40 Fish ............................................................................................................ 40 Flowers ................................................................................................ 40-42 Forest Products, Firewood, & Unspecified................................................. 42 Fruits & Nuts, Unspecified ......................................................................... 43 Game Birds, Unspecified ............................................................................ 43 Garlic ......................................................................................................... 44 Geese ......................................................................................................... 44 Goats & Products ....................................................................................... 44 Grapefruit .................................................................................................. 44 Grapes ................................................................................................. 44-45 Greens, Turnip & Mustard ......................................................................... 46 Guavas ....................................................................................................... 46 Hay & Green Chop ............................................................................... 46-49 Hogs & Pigs ................................................................................................ 49 Horseradish ............................................................................................... 49 Jojoba ........................................................................................................ 49 Kale ............................................................................................................ 49 Kiwifruit ..................................................................................................... 50 Kohlrabi ..................................................................................................... 50 Kumquats ................................................................................................... 50 Leeks .......................................................................................................... 50 Lemons ...................................................................................................... 50 Lettuce ....................................................................................................... 51
Limes ......................................................................................................... 52 Livestock Products & Unspecified ........................................................ 52-53 Manure ...................................................................................................... 54 Melons ................................................................................................. 54-55 Milk ...................................................................................................... 55-56 Mint ........................................................................................................... 56 Mushrooms ............................................................................................... 56 Nectarines ................................................................................................. 56 Nursery Products ................................................................................. 57-60 Oats ........................................................................................................... 60 Okra ........................................................................................................... 61 Olives ......................................................................................................... 62 Onions ................................................................................................. 61-62 Oranges ..................................................................................................... 62 Parsley ....................................................................................................... 62 Pasture ................................................................................................ 63-64 Peaches...................................................................................................... 65 Pears .................................................................................................... 65-66 Peas ........................................................................................................... 66 Pecans ....................................................................................................... 66 Peppers ...................................................................................................... 67 Persimmons ............................................................................................... 67 Pheasants .................................................................................................. 67 Pigeons & Squabs ...................................................................................... 67 Pistachios ................................................................................................... 68 Plumcots .................................................................................................... 68 Plums, Fresh & Dried ................................................................................. 68 Pomegranates ............................................................................................ 68 Potatoes & Sweet Potatoes ....................................................................... 69 Poultry, Unspecified .................................................................................. 69 Pumpkins ................................................................................................... 69 Quince ....................................................................................................... 69 Radishes..................................................................................................... 70 Rice ............................................................................................................ 70 Rutabagas .................................................................................................. 70 Rye ....................................................................................................... 70-71 Ryegrass ..................................................................................................... 71 Safflower ................................................................................................... 71 Salad Greens, Misc..................................................................................... 71 Seed ..................................................................................................... 71-72 Sheep & Lambs .................................................................................... 72-73 Silage ......................................................................................................... 74 Sorghum, Grain & Silage ............................................................................ 74 Spices & Herbs ........................................................................................... 74 Spinach ................................................................................................ 74-75 Squash ....................................................................................................... 75 Straw ......................................................................................................... 75 Sugar Beets ................................................................................................ 75 Sunflower Seed .......................................................................................... 75 Swiss Chard ................................................................................................ 75 Tangelos .................................................................................................... 76 Tangerines & Mandarins ............................................................................ 76 Tomatoes ............................................................................................. 76-77 Triticale ...................................................................................................... 77 Turkeys ...................................................................................................... 77 Turnips ....................................................................................................... 77 Vegetables, Oriental & Unspecified ..................................................... 77-78 Walnuts ..................................................................................................... 79 Wheat .................................................................................................. 79-80 Wool .......................................................................................................... 80

CDFA 19 California County Agricultural Commissioners' Reports, 2016
Price Per Total Value
ALMOND HULLS (Tons) (Tons)
Butte 40,000 90.00 3,600,000Colusa 57,100 45.01 2,570,000Fresno 407,000 64.00 26,048,000Glenn 54,200 74.94 4,062,000Kern 282,000 72.71 20,503,000Kings 49,500 73.64 3,645,000Madera 250,000 79.97 19,992,000Merced 231,000 56.85 13,132,000San Joaquin 145,000 68.15 9,882,000Stanislaus 378,000 60.00 22,680,000Sutter 7,090 100.00 709,000Tulare 133,000 73.00 9,709,000Yolo 30,600 100.00 3,060,000Yuba 802 69.83 56,000Sum of Others 162,610 10.85 1,765,000STATE TOTAL 2,227,902 63.47 141,413,000Counties Reporting -- 15
ALMONDS, ALL (Tons) (Tons)
Butte 39,500 0.85 33,600 5,592.32 187,902,000Colusa 57,100 1.03 58,800 5,122.84 301,223,000Fresno 215,000 1.17 252,000 4,633.00 1,167,516,000Glenn 48,600 0.89 43,200 5,191.53 224,274,000Kern 217,000 1.19 259,000 4,924.79 1,275,520,000Kings 23,100 1.07 24,800 4,810.28 119,295,000Madera 125,000 1.02 128,000 4,480.43 573,495,000Merced 104,000 1.13 118,000 4,903.23 578,581,000San Joaquin 71,100 1.02 72,700 4,798.06 348,819,000Solano 9,000 0.89 8,020 4,478.43 35,917,000Stanislaus 182,000 1.04 189,000 4,800.00 907,200,000Sutter 9,450 0.60 5,670 5,544.09 31,435,000Tehama 12,200 0.79 9,610 4,834.44 46,459,000Tulare 60,900 1.09 66,400 4,400.00 292,160,000Yolo 25,500 0.87 22,200 4,470.00 99,234,000Yuba 1,280 0.50 642 6,995.33 4,491,000Sum of Others 1,363 0.52 707 8,427.19 5,958,020STATE TOTAL 1,202,093 1.08 1,292,349 4,797.06 6,199,479,020Counties Reporting -- 17
ANISE (FENNEL) (Tons) (Tons)
Monterey 789 16.35 12,900 745.04 9,611,000Sum of Others 342 11.87 4,060 547.54 2,223,000STATE TOTAL 1,131 15.00 16,960 697.76 11,834,000Counties Reporting -- 2
APIARY PRODUCTS, BEES, PACKAGED (Lbs) (Lbs)
Colusa 2,500 80.00 200,000Glenn 150,000 22.63 3,394,000Merced 55,500 23.91 1,327,000STATE TOTAL 208,000 23.66 4,921,000Counties Reporting -- 3
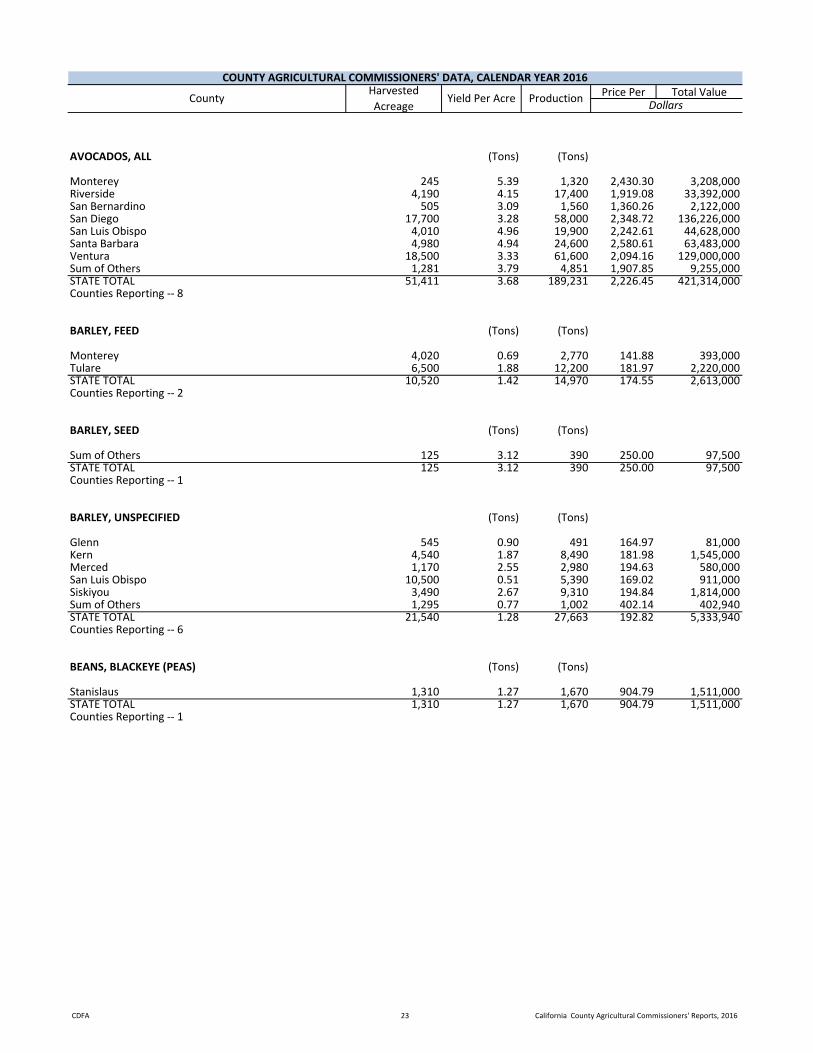
COUNTY AGRICULTURAL COMMISSIONERS' DATA, CALENDAR YEAR 2016
CountyHarvested Acreage
Yield Per Acre Production Dollars

CDFA 20 California County Agricultural Commissioners' Reports, 2016
Price Per Total ValueCOUNTY AGRICULTURAL COMMISSIONERS' DATA, CALENDAR YEAR 2016
CountyHarvested Acreage
Yield Per Acre Production Dollars
APIARY PRODUCTS, BEES, QUEEN (Each) (Each)
Colusa 21,000 25.00 525,000Glenn 354,000 21.58 7,641,000Merced 37,700 13.40 505,000Shasta 171,000 22.40 3,831,000STATE TOTAL 583,700 21.42 12,502,000Counties Reporting -- 4
APIARY PRODUCTS, BEES, UNSPECIFIED (N/A) (N/A)
Butte 918,000Calaveras 235,000Contra Costa 414,000Inyo 5,600Los Angeles 169,000Nevada 268,000Placer 62,000Sacramento 116,000San Joaquin 486,000Shasta 1,472,000Solano 687,000Sonoma 263,000Sutter 1,190,000Tehama 17,537,000Tuolumne 101,000Yolo 9,115,000Sum of Others 3,680STATE TOTAL 33,042,280Counties Reporting -- 17
APIARY PRODUCTS, BEESWAX (Lbs) (Lbs)
Fresno 101,000 3.88 392,000Imperial 23,900 3.81 91,000Kern 420,000 3.17 1,332,000Kings 2,740 2.35 6,450Los Angeles 12,400 4.74 58,800Madera 44,100 3.40 150,000Merced 24,700 3.81 94,000Monterey 320 4.50 1,440Plumas 19 4.26 81Riverside 14,000 2.70 37,800San Diego 27,000San Mateo 879 5.12 4,500Stanislaus 559,000 3.37 1,885,000Tulare 100,000 3.38 338,000Ventura 17,200 3.95 68,000Sum of Others 1,980 8.65 17,120STATE TOTAL 1,322,238 3.39 4,503,191Counties Reporting -- 16
CDFA 21 California County Agricultural Commissioners' Reports, 2016
Price Per Total ValueCOUNTY AGRICULTURAL COMMISSIONERS' DATA, CALENDAR YEAR 2016
CountyHarvested Acreage
Yield Per Acre Production Dollars
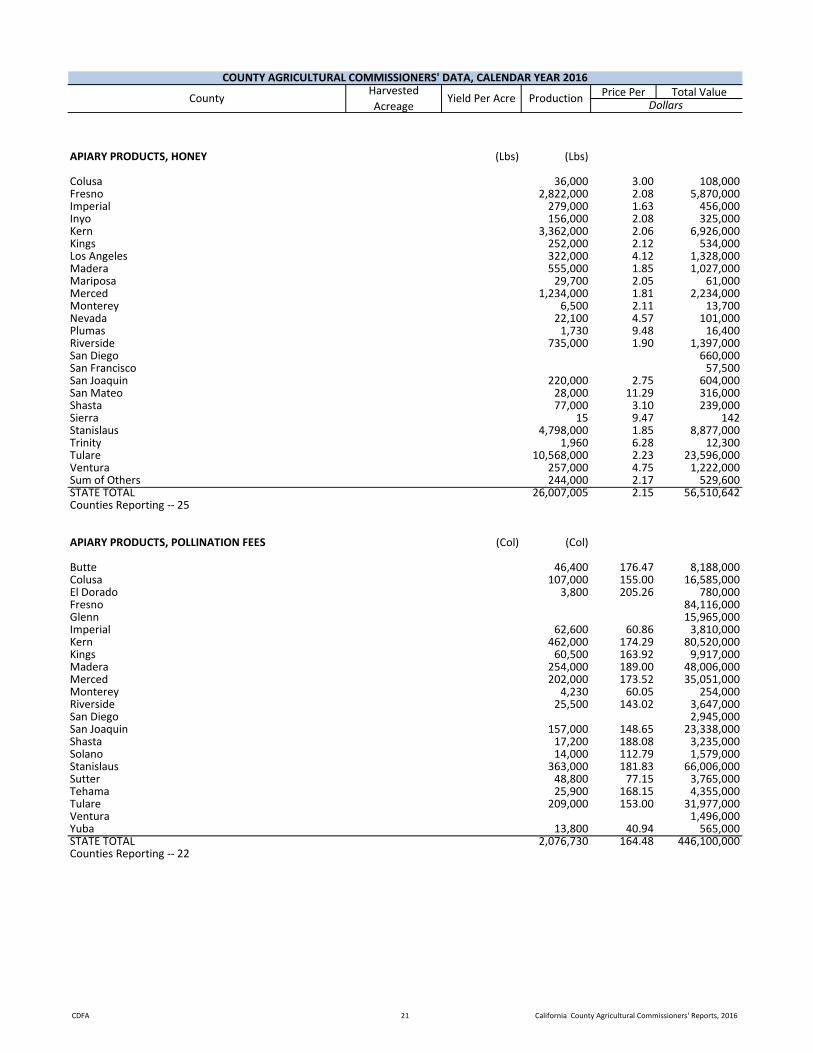
APIARY PRODUCTS, HONEY (Lbs) (Lbs)
Colusa 36,000 3.00 108,000Fresno 2,822,000 2.08 5,870,000Imperial 279,000 1.63 456,000Inyo 156,000 2.08 325,000Kern 3,362,000 2.06 6,926,000Kings 252,000 2.12 534,000Los Angeles 322,000 4.12 1,328,000Madera 555,000 1.85 1,027,000Mariposa 29,700 2.05 61,000Merced 1,234,000 1.81 2,234,000Monterey 6,500 2.11 13,700Nevada 22,100 4.57 101,000Plumas 1,730 9.48 16,400Riverside 735,000 1.90 1,397,000San Diego 660,000San Francisco 57,500San Joaquin 220,000 2.75 604,000San Mateo 28,000 11.29 316,000Shasta 77,000 3.10 239,000Sierra 15 9.47 142Stanislaus 4,798,000 1.85 8,877,000Trinity 1,960 6.28 12,300Tulare 10,568,000 2.23 23,596,000Ventura 257,000 4.75 1,222,000Sum of Others 244,000 2.17 529,600STATE TOTAL 26,007,005 2.15 56,510,642Counties Reporting -- 25
APIARY PRODUCTS, POLLINATION FEES (Col) (Col)
Butte 46,400 176.47 8,188,000Colusa 107,000 155.00 16,585,000El Dorado 3,800 205.26 780,000Fresno 84,116,000Glenn 15,965,000Imperial 62,600 60.86 3,810,000Kern 462,000 174.29 80,520,000Kings 60,500 163.92 9,917,000Madera 254,000 189.00 48,006,000Merced 202,000 173.52 35,051,000Monterey 4,230 60.05 254,000Riverside 25,500 143.02 3,647,000San Diego 2,945,000San Joaquin 157,000 148.65 23,338,000Shasta 17,200 188.08 3,235,000Solano 14,000 112.79 1,579,000Stanislaus 363,000 181.83 66,006,000Sutter 48,800 77.15 3,765,000Tehama 25,900 168.15 4,355,000Tulare 209,000 153.00 31,977,000Ventura 1,496,000Yuba 13,800 40.94 565,000STATE TOTAL 2,076,730 164.48 446,100,000Counties Reporting -- 22
CDFA 22 California County Agricultural Commissioners' Reports, 2016
Price Per Total ValueCOUNTY AGRICULTURAL COMMISSIONERS' DATA, CALENDAR YEAR 2016
CountyHarvested Acreage
Yield Per Acre Production Dollars
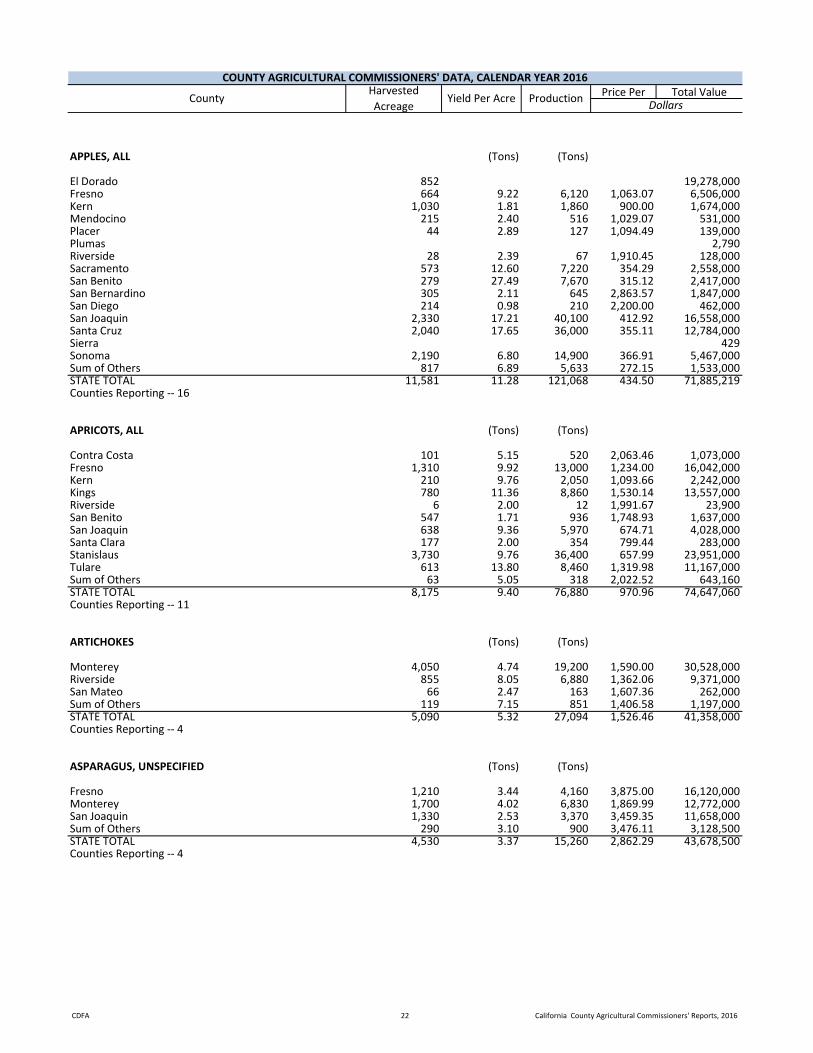
APPLES, ALL (Tons) (Tons)
El Dorado 852 19,278,000Fresno 664 9.22 6,120 1,063.07 6,506,000Kern 1,030 1.81 1,860 900.00 1,674,000Mendocino 215 2.40 516 1,029.07 531,000Placer 44 2.89 127 1,094.49 139,000Plumas 2,790Riverside 28 2.39 67 1,910.45 128,000Sacramento 573 12.60 7,220 354.29 2,558,000San Benito 279 27.49 7,670 315.12 2,417,000San Bernardino 305 2.11 645 2,863.57 1,847,000San Diego 214 0.98 210 2,200.00 462,000San Joaquin 2,330 17.21 40,100 412.92 16,558,000Santa Cruz 2,040 17.65 36,000 355.11 12,784,000Sierra 429Sonoma 2,190 6.80 14,900 366.91 5,467,000Sum of Others 817 6.89 5,633 272.15 1,533,000STATE TOTAL 11,581 11.28 121,068 434.50 71,885,219Counties Reporting -- 16
APRICOTS, ALL (Tons) (Tons)
Contra Costa 101 5.15 520 2,063.46 1,073,000Fresno 1,310 9.92 13,000 1,234.00 16,042,000Kern 210 9.76 2,050 1,093.66 2,242,000Kings 780 11.36 8,860 1,530.14 13,557,000Riverside 6 2.00 12 1,991.67 23,900San Benito 547 1.71 936 1,748.93 1,637,000San Joaquin 638 9.36 5,970 674.71 4,028,000Santa Clara 177 2.00 354 799.44 283,000Stanislaus 3,730 9.76 36,400 657.99 23,951,000Tulare 613 13.80 8,460 1,319.98 11,167,000Sum of Others 63 5.05 318 2,022.52 643,160STATE TOTAL 8,175 9.40 76,880 970.96 74,647,060Counties Reporting -- 11
ARTICHOKES (Tons) (Tons)
Monterey 4,050 4.74 19,200 1,590.00 30,528,000Riverside 855 8.05 6,880 1,362.06 9,371,000San Mateo 66 2.47 163 1,607.36 262,000Sum of Others 119 7.15 851 1,406.58 1,197,000STATE TOTAL 5,090 5.32 27,094 1,526.46 41,358,000Counties Reporting -- 4
ASPARAGUS, UNSPECIFIED (Tons) (Tons)
Fresno 1,210 3.44 4,160 3,875.00 16,120,000Monterey 1,700 4.02 6,830 1,869.99 12,772,000San Joaquin 1,330 2.53 3,370 3,459.35 11,658,000Sum of Others 290 3.10 900 3,476.11 3,128,500STATE TOTAL 4,530 3.37 15,260 2,862.29 43,678,500Counties Reporting -- 4
CDFA 23 California County Agricultural Commissioners' Reports, 2016
Price Per Total ValueCOUNTY AGRICULTURAL COMMISSIONERS' DATA, CALENDAR YEAR 2016
CountyHarvested Acreage
Yield Per Acre Production Dollars
AVOCADOS, ALL (Tons) (Tons)
Monterey 245 5.39 1,320 2,430.30 3,208,000Riverside 4,190 4.15 17,400 1,919.08 33,392,000San Bernardino 505 3.09 1,560 1,360.26 2,122,000San Diego 17,700 3.28 58,000 2,348.72 136,226,000San Luis Obispo 4,010 4.96 19,900 2,242.61 44,628,000Santa Barbara 4,980 4.94 24,600 2,580.61 63,483,000Ventura 18,500 3.33 61,600 2,094.16 129,000,000Sum of Others 1,281 3.79 4,851 1,907.85 9,255,000STATE TOTAL 51,411 3.68 189,231 2,226.45 421,314,000Counties Reporting -- 8
BARLEY, FEED (Tons) (Tons)
Monterey 4,020 0.69 2,770 141.88 393,000Tulare 6,500 1.88 12,200 181.97 2,220,000STATE TOTAL 10,520 1.42 14,970 174.55 2,613,000Counties Reporting -- 2
BARLEY, SEED (Tons) (Tons)
Sum of Others 125 3.12 390 250.00 97,500STATE TOTAL 125 3.12 390 250.00 97,500Counties Reporting -- 1
BARLEY, UNSPECIFIED (Tons) (Tons)
Glenn 545 0.90 491 164.97 81,000Kern 4,540 1.87 8,490 181.98 1,545,000Merced 1,170 2.55 2,980 194.63 580,000San Luis Obispo 10,500 0.51 5,390 169.02 911,000Siskiyou 3,490 2.67 9,310 194.84 1,814,000Sum of Others 1,295 0.77 1,002 402.14 402,940STATE TOTAL 21,540 1.28 27,663 192.82 5,333,940Counties Reporting -- 6
BEANS, BLACKEYE (PEAS) (Tons) (Tons)
Stanislaus 1,310 1.27 1,670 904.79 1,511,000STATE TOTAL 1,310 1.27 1,670 904.79 1,511,000Counties Reporting -- 1

CDFA 24 California County Agricultural Commissioners' Reports, 2016
Price Per Total ValueCOUNTY AGRICULTURAL COMMISSIONERS' DATA, CALENDAR YEAR 2016
CountyHarvested Acreage
Yield Per Acre Production Dollars
BEANS, DRY EDIBLE, UNSPECIFIED (Tons) (Tons)
Butte 849 1.96 1,660 1,044.58 1,734,000Colusa 2,930 1.22 3,580 874.86 3,132,000Glenn 985 0.63 621 937.20 582,000Kern 2,840 1.30 3,690 800.00 2,952,000Monterey 385 1.67 643 2,079.32 1,337,000San Joaquin 4,960 1.17 5,800 982.24 5,697,000San Mateo 74 0.99 73 5,027.40 367,000Santa Barbara 1,880 2,134,000Solano 2,430 1.12 2,720 1,207.35 3,284,000Stanislaus 289 1.10 318 839.62 267,000Sutter 6,600 0.92 6,080 915.13 5,564,000Tulare 11,400 1.27 14,500 888.00 12,876,000Ventura 455 1,318,000Sum of Others 6,720 1.47 9,866 857.08 8,456,000STATE TOTAL 42,797 1.22 49,551 933.34 49,700,000Counties Reporting -- 14
BEANS, FAVA (Tons) (Tons)
San Mateo 340 3.56 1,210 1,539.67 1,863,000STATE TOTAL 340 3.56 1,210 1,539.67 1,863,000Counties Reporting -- 1
BEANS, FRESH, UNSPECIFIED (Tons) (Tons)
Riverside 771 5.67 4,370 1,629.29 7,120,000Stanislaus 2,030 1.25 2,540 870.08 2,210,000Ventura 1,850 1.86 3,450 1,255.36 4,331,000Sum of Others 742 6.47 4,800 831.67 3,992,000STATE TOTAL 5,393 2.81 15,160 1,164.45 17,653,000Counties Reporting -- 4
BEANS, GARBANZO (Tons) (Tons)
Sum of Others 398 0.97 386 495.34 191,200STATE TOTAL 398 0.97 386 495.34 191,200Counties Reporting -- 1
BEANS, LIMA, BABY DRY (Tons) (Tons)
Stanislaus 508 1.45 737 819.54 604,000STATE TOTAL 508 1.45 737 819.54 604,000Counties Reporting -- 1

CDFA 25 California County Agricultural Commissioners' Reports, 2016
Price Per Total ValueCOUNTY AGRICULTURAL COMMISSIONERS' DATA, CALENDAR YEAR 2016
CountyHarvested Acreage
Yield Per Acre Production Dollars
BEANS, LIMA, LARGE DRY (Tons) (Tons)
Merced 2,300 1.15 2,640 1,373.11 3,625,000Stanislaus 8,910 1.14 10,200 1,450.00 14,790,000STATE TOTAL 11,210 1.15 12,840 1,434.19 18,415,000Counties Reporting -- 2
BEANS, LIMA, UNSPECIFIED (Tons) (Tons)
San Joaquin 1,570 1.34 2,100 1,249.05 2,623,000Sum of Others 500 0.19 94 2,148.94 202,000STATE TOTAL 2,070 1.06 2,194 1,287.60 2,825,000Counties Reporting -- 2
BEANS, SEED (Tons) (Tons)
Glenn 1,130 0.75 850 1,240.00 1,054,000Monterey 692 1.25 865 3,109.83 2,690,000San Joaquin 821 1.21 993 1,033.23 1,026,000Santa Barbara 378 1,194,000STATE TOTAL 3,021 1.02 2,708 1,761.45 5,964,000Counties Reporting -- 4
BEANS, SNAP, UNSPECIFIED (Tons) (Tons)
San Bernardino 24 12.42 298 630.87 188,000San Mateo 56 3.20 179 1,849.16 331,000Santa Clara 1,120 5.02 5,620 1,072.06 6,025,000Sum of Others 1,126 6.41 7,218 1,528.96 11,036,000STATE TOTAL 2,326 5.72 13,315 1,320.32 17,580,000Counties Reporting -- 4
BEETS, GARDEN (Tons) (Tons)
Ventura 109 20.18 2,200 949.09 2,088,000Sum of Others 1,252 10.41 13,039 1,003.35 13,082,630STATE TOTAL 1,361 11.20 15,239 995.51 15,170,630Counties Reporting -- 2
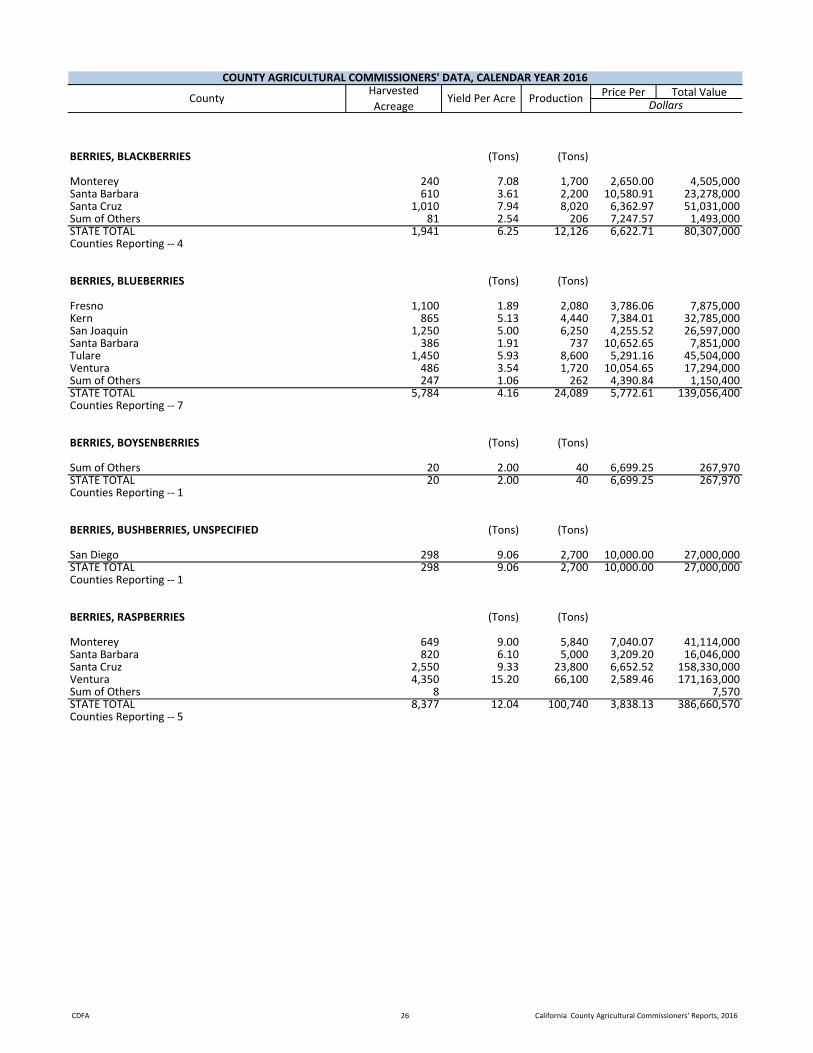
CDFA 26 California County Agricultural Commissioners' Reports, 2016
Price Per Total ValueCOUNTY AGRICULTURAL COMMISSIONERS' DATA, CALENDAR YEAR 2016
CountyHarvested Acreage
Yield Per Acre Production Dollars
BERRIES, BLACKBERRIES (Tons) (Tons)
Monterey 240 7.08 1,700 2,650.00 4,505,000Santa Barbara 610 3.61 2,200 10,580.91 23,278,000Santa Cruz 1,010 7.94 8,020 6,362.97 51,031,000Sum of Others 81 2.54 206 7,247.57 1,493,000STATE TOTAL 1,941 6.25 12,126 6,622.71 80,307,000Counties Reporting -- 4
BERRIES, BLUEBERRIES (Tons) (Tons)
Fresno 1,100 1.89 2,080 3,786.06 7,875,000Kern 865 5.13 4,440 7,384.01 32,785,000San Joaquin 1,250 5.00 6,250 4,255.52 26,597,000Santa Barbara 386 1.91 737 10,652.65 7,851,000Tulare 1,450 5.93 8,600 5,291.16 45,504,000Ventura 486 3.54 1,720 10,054.65 17,294,000Sum of Others 247 1.06 262 4,390.84 1,150,400STATE TOTAL 5,784 4.16 24,089 5,772.61 139,056,400Counties Reporting -- 7
BERRIES, BOYSENBERRIES (Tons) (Tons)
Sum of Others 20 2.00 40 6,699.25 267,970STATE TOTAL 20 2.00 40 6,699.25 267,970Counties Reporting -- 1
BERRIES, BUSHBERRIES, UNSPECIFIED (Tons) (Tons)
San Diego 298 9.06 2,700 10,000.00 27,000,000STATE TOTAL 298 9.06 2,700 10,000.00 27,000,000Counties Reporting -- 1
BERRIES, RASPBERRIES (Tons) (Tons)
Monterey 649 9.00 5,840 7,040.07 41,114,000Santa Barbara 820 6.10 5,000 3,209.20 16,046,000Santa Cruz 2,550 9.33 23,800 6,652.52 158,330,000Ventura 4,350 15.20 66,100 2,589.46 171,163,000Sum of Others 8 7,570STATE TOTAL 8,377 12.04 100,740 3,838.13 386,660,570Counties Reporting -- 5
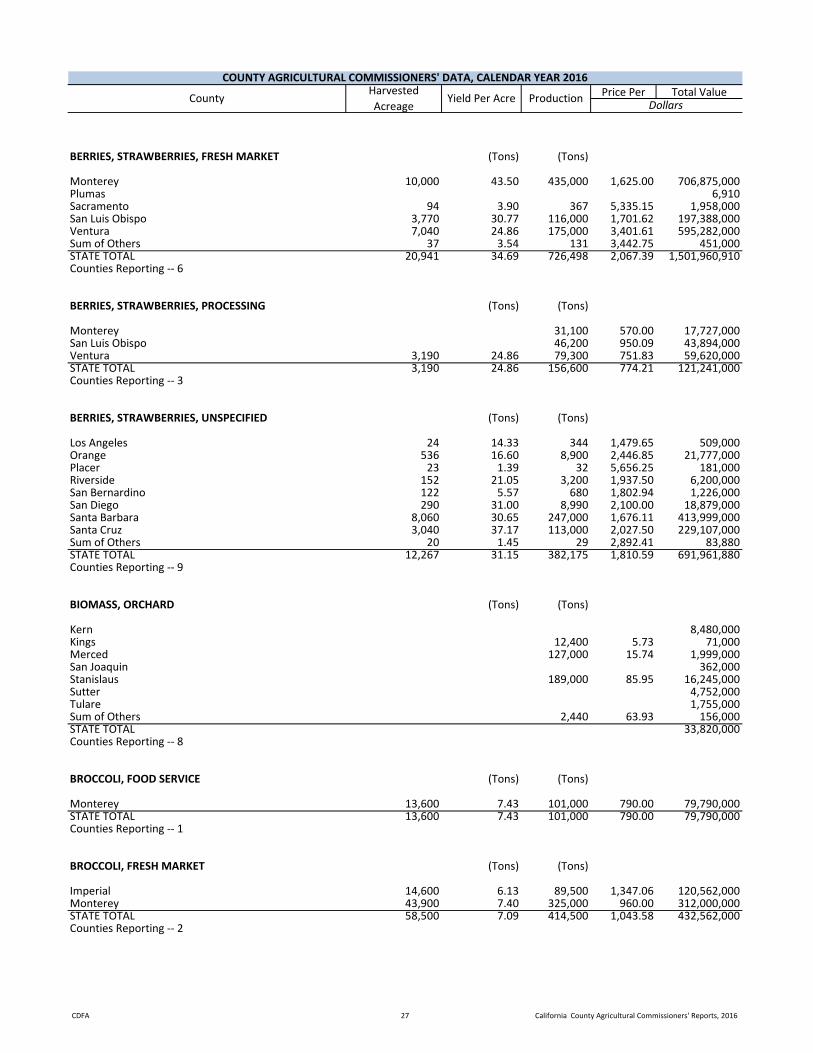
CDFA 27 California County Agricultural Commissioners' Reports, 2016
Price Per Total ValueCOUNTY AGRICULTURAL COMMISSIONERS' DATA, CALENDAR YEAR 2016
CountyHarvested Acreage
Yield Per Acre Production Dollars
BERRIES, STRAWBERRIES, FRESH MARKET (Tons) (Tons)
Monterey 10,000 43.50 435,000 1,625.00 706,875,000Plumas 6,910Sacramento 94 3.90 367 5,335.15 1,958,000San Luis Obispo 3,770 30.77 116,000 1,701.62 197,388,000Ventura 7,040 24.86 175,000 3,401.61 595,282,000Sum of Others 37 3.54 131 3,442.75 451,000STATE TOTAL 20,941 34.69 726,498 2,067.39 1,501,960,910Counties Reporting -- 6
BERRIES, STRAWBERRIES, PROCESSING (Tons) (Tons)
Monterey 31,100 570.00 17,727,000San Luis Obispo 46,200 950.09 43,894,000Ventura 3,190 24.86 79,300 751.83 59,620,000STATE TOTAL 3,190 24.86 156,600 774.21 121,241,000Counties Reporting -- 3
BERRIES, STRAWBERRIES, UNSPECIFIED (Tons) (Tons)
Los Angeles 24 14.33 344 1,479.65 509,000Orange 536 16.60 8,900 2,446.85 21,777,000Placer 23 1.39 32 5,656.25 181,000Riverside 152 21.05 3,200 1,937.50 6,200,000San Bernardino 122 5.57 680 1,802.94 1,226,000San Diego 290 31.00 8,990 2,100.00 18,879,000Santa Barbara 8,060 30.65 247,000 1,676.11 413,999,000Santa Cruz 3,040 37.17 113,000 2,027.50 229,107,000Sum of Others 20 1.45 29 2,892.41 83,880STATE TOTAL 12,267 31.15 382,175 1,810.59 691,961,880Counties Reporting -- 9
BIOMASS, ORCHARD (Tons) (Tons)
Kern 8,480,000Kings 12,400 5.73 71,000Merced 127,000 15.74 1,999,000San Joaquin 362,000Stanislaus 189,000 85.95 16,245,000Sutter 4,752,000Tulare 1,755,000Sum of Others 2,440 63.93 156,000STATE TOTAL 33,820,000Counties Reporting -- 8
BROCCOLI, FOOD SERVICE (Tons) (Tons)
Monterey 13,600 7.43 101,000 790.00 79,790,000STATE TOTAL 13,600 7.43 101,000 790.00 79,790,000Counties Reporting -- 1
BROCCOLI, FRESH MARKET (Tons) (Tons)
Imperial 14,600 6.13 89,500 1,347.06 120,562,000Monterey 43,900 7.40 325,000 960.00 312,000,000STATE TOTAL 58,500 7.09 414,500 1,043.58 432,562,000Counties Reporting -- 2
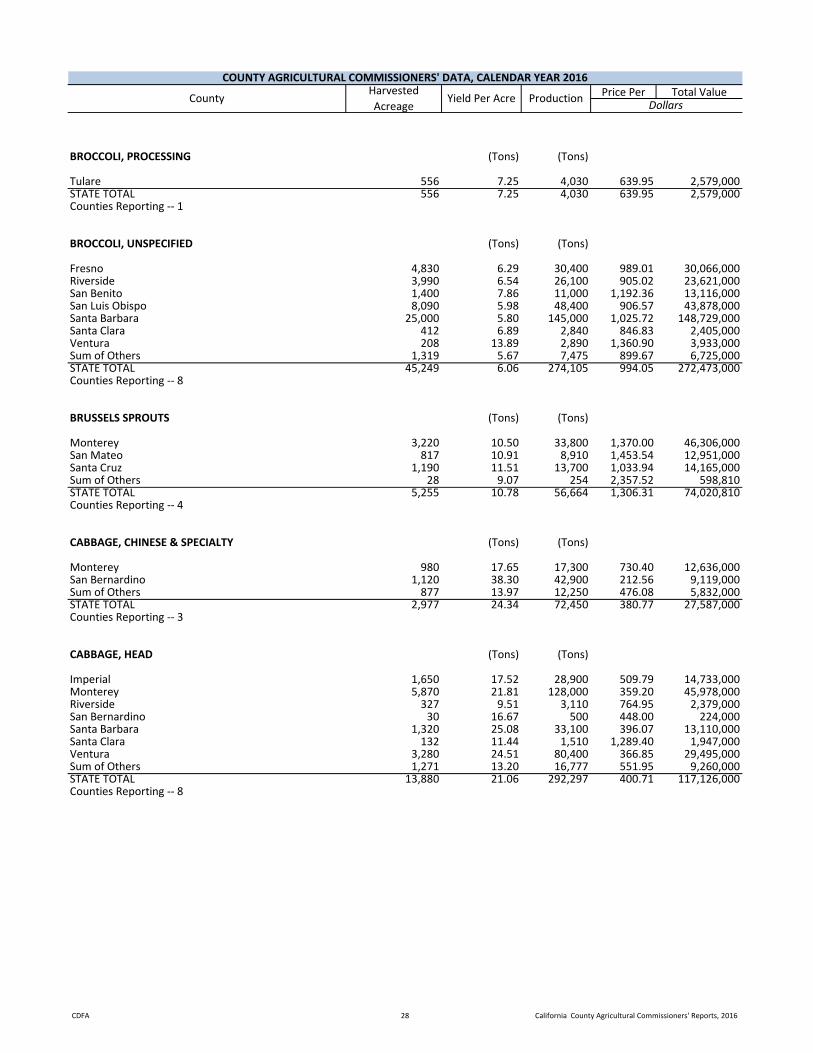
CDFA 28 California County Agricultural Commissioners' Reports, 2016
Price Per Total ValueCOUNTY AGRICULTURAL COMMISSIONERS' DATA, CALENDAR YEAR 2016
CountyHarvested Acreage
Yield Per Acre Production Dollars
BROCCOLI, PROCESSING (Tons) (Tons)
Tulare 556 7.25 4,030 639.95 2,579,000STATE TOTAL 556 7.25 4,030 639.95 2,579,000Counties Reporting -- 1
BROCCOLI, UNSPECIFIED (Tons) (Tons)
Fresno 4,830 6.29 30,400 989.01 30,066,000Riverside 3,990 6.54 26,100 905.02 23,621,000San Benito 1,400 7.86 11,000 1,192.36 13,116,000San Luis Obispo 8,090 5.98 48,400 906.57 43,878,000Santa Barbara 25,000 5.80 145,000 1,025.72 148,729,000Santa Clara 412 6.89 2,840 846.83 2,405,000Ventura 208 13.89 2,890 1,360.90 3,933,000Sum of Others 1,319 5.67 7,475 899.67 6,725,000STATE TOTAL 45,249 6.06 274,105 994.05 272,473,000Counties Reporting -- 8
BRUSSELS SPROUTS (Tons) (Tons)
Monterey 3,220 10.50 33,800 1,370.00 46,306,000San Mateo 817 10.91 8,910 1,453.54 12,951,000Santa Cruz 1,190 11.51 13,700 1,033.94 14,165,000Sum of Others 28 9.07 254 2,357.52 598,810STATE TOTAL 5,255 10.78 56,664 1,306.31 74,020,810Counties Reporting -- 4
CABBAGE, CHINESE & SPECIALTY (Tons) (Tons)
Monterey 980 17.65 17,300 730.40 12,636,000San Bernardino 1,120 38.30 42,900 212.56 9,119,000Sum of Others 877 13.97 12,250 476.08 5,832,000STATE TOTAL 2,977 24.34 72,450 380.77 27,587,000Counties Reporting -- 3
CABBAGE, HEAD (Tons) (Tons)
Imperial 1,650 17.52 28,900 509.79 14,733,000Monterey 5,870 21.81 128,000 359.20 45,978,000Riverside 327 9.51 3,110 764.95 2,379,000San Bernardino 30 16.67 500 448.00 224,000Santa Barbara 1,320 25.08 33,100 396.07 13,110,000Santa Clara 132 11.44 1,510 1,289.40 1,947,000Ventura 3,280 24.51 80,400 366.85 29,495,000Sum of Others 1,271 13.20 16,777 551.95 9,260,000STATE TOTAL 13,880 21.06 292,297 400.71 117,126,000Counties Reporting -- 8

CDFA 29 California County Agricultural Commissioners' Reports, 2016
Price Per Total ValueCOUNTY AGRICULTURAL COMMISSIONERS' DATA, CALENDAR YEAR 2016
CountyHarvested Acreage
Yield Per Acre Production Dollars
CARROTS, FOOD SERVICE (Tons) (Tons)
Monterey 1,600 30.06 48,100 352.00 16,931,000STATE TOTAL 1,600 30.06 48,100 352.00 16,931,000Counties Reporting -- 1
CARROTS, FRESH MARKET (Tons) (Tons)
Imperial 4,640 17.65 81,900 131.62 10,780,000Monterey 1,500 20.47 30,700 565.99 17,376,000STATE TOTAL 6,140 18.34 112,600 250.05 28,156,000Counties Reporting -- 2
CARROTS, PROCESSING (Tons) (Tons)
Imperial 10,800 29.17 315,000 162.72 51,258,000STATE TOTAL 10,800 29.17 315,000 162.72 51,258,000Counties Reporting -- 1
CARROTS, UNSPECIFIED (Tons) (Tons)
Riverside 5,240 33.78 177,000 175.00 30,975,000San Bernardino 9 38.56 347 576.37 200,000Siskiyou 630 33.81 21,300 99.81 2,126,000Ventura 257 40.86 10,500 165.33 1,736,000Sum of Others 37,388 28.36 1,060,505 421.44 446,940,500STATE TOTAL 43,524 29.17 1,269,652 379.61 481,977,500Counties Reporting -- 5

CDFA 30 California County Agricultural Commissioners' Reports, 2016
Price Per Total ValueCOUNTY AGRICULTURAL COMMISSIONERS' DATA, CALENDAR YEAR 2016
CountyHarvested Acreage
Yield Per Acre Production Dollars
CATTLE & CALVES, UNSPECIFIED (N/A) (N/A)
Alameda 15,621,000Alpine 2,117,000Amador 10,513,000Butte 13,463,000Calaveras 5,556,000Colusa 13,814,000Contra Costa 23,267,000El Dorado 8,572,000Glenn 36,035,000Humboldt 51,638,000Inyo 8,013,000Kern 308,924,000Kings 220,137,000Lake 1,851,000Madera 62,377,000Marin 10,543,000Mariposa 28,557,000Mendocino 10,704,000Merced 296,508,000Mono 8,603,000Monterey 24,752,000Napa 2,744,000Placer 8,330,000Plumas 190,000Riverside 18,370,000Sacramento 21,635,000San Bernardino 68,032,000San Diego 15,841,000San Joaquin 106,251,000San Luis Obispo 39,984,000San Mateo 1,980,000Santa Barbara 30,017,000Sierra 160,000Solano 9,192,000Sonoma 20,562,000Sutter 2,669,000Trinity 3,227,000Tulare 660,400,000Yolo 15,730,000Yuba 12,432,000STATE TOTAL 2,199,311,000Counties Reporting -- 40
CATTLE, BEEF BULLS, BREEDING (N/A) (N/A)
Fresno 1,400,000STATE TOTAL 1,400,000Counties Reporting -- 1

CDFA 31 California County Agricultural Commissioners' Reports, 2016
Price Per Total ValueCOUNTY AGRICULTURAL COMMISSIONERS' DATA, CALENDAR YEAR 2016
CountyHarvested Acreage
Yield Per Acre Production Dollars
CATTLE, BEEF COW, BREEDING (N/A) (N/A)
Fresno 2,689,000Shasta 5,270,000STATE TOTAL 7,959,000Counties Reporting -- 2
CATTLE, BEEF COWS, CULL (N/A) (N/A)
Plumas 555,000Shasta 2,281,000Sierra 87,200Stanislaus 17,344,000Tuolumne 330,000STATE TOTAL 20,597,200Counties Reporting -- 5
CATTLE, BULLS (N/A) (N/A)
Lassen 1,923,000Plumas 929,000San Benito 299,000Sierra 12,400Siskiyou 926,000STATE TOTAL 4,089,400Counties Reporting -- 5
CATTLE, CALVES EXCLUDED, UNSPECIFIED (N/A) (N/A)
Tehama 3,534,000STATE TOTAL 3,534,000Counties Reporting -- 1
CATTLE, CALVES ONLY (N/A) (N/A)
Del Norte 3,647,000Fresno 12,192,000Lassen 6,295,000San Benito 11,991,000Tehama 4,096,000Tuolumne 9,711,000STATE TOTAL 47,932,000Counties Reporting -- 6
CATTLE, CALVES, VEAL (N/A) (N/A)
Fresno 30,310,000STATE TOTAL 30,310,000Counties Reporting -- 1
CATTLE, COWS (N/A) (N/A)
Del Norte 10,000,000San Benito 2,411,000Siskiyou 6,512,000STATE TOTAL 18,923,000Counties Reporting -- 3

CDFA 32 California County Agricultural Commissioners' Reports, 2016
Price Per Total ValueCOUNTY AGRICULTURAL COMMISSIONERS' DATA, CALENDAR YEAR 2016
CountyHarvested Acreage
Yield Per Acre Production Dollars
CATTLE, DAIRY COWS, BREEDING (N/A) (N/A)
Fresno 134,029,000STATE TOTAL 134,029,000Counties Reporting -- 1
CATTLE, DAIRY HEIFERS, REPLACEMENT (N/A) (N/A)
Madera 32,400,000San Bernardino 34,952,000Stanislaus 132,580,000Tehama 2,666,000Sum of Others 3,328,000STATE TOTAL 205,926,000Counties Reporting -- 5
CATTLE, HEIFERS (N/A) (N/A)
Lassen 9,558,000Plumas 6,277,000Sierra 2,593,000STATE TOTAL 18,428,000Counties Reporting -- 3
CATTLE, HEIFERS & STEERS, FED (N/A) (N/A)
Fresno 169,601,000Imperial 400,614,000Nevada 5,996,000Santa Clara 3,561,000Shasta 1,298,000Siskiyou 14,438,000Stanislaus 34,927,000Tehama 6,826,000Sum of Others 3,862,000STATE TOTAL 641,123,000Counties Reporting -- 9
CATTLE, MILK COWS (N/A) (N/A)
Humboldt 26,820,000Lassen 6,217,000STATE TOTAL 33,037,000Counties Reporting -- 2
CATTLE, MILK COWS, CULL (N/A) (N/A)
Fresno 26,651,000Nevada 4,109,000San Bernardino 42,508,000Santa Clara 388,000Stanislaus 61,407,000STATE TOTAL 135,063,000Counties Reporting -- 5

CDFA 33 California County Agricultural Commissioners' Reports, 2016
Price Per Total ValueCOUNTY AGRICULTURAL COMMISSIONERS' DATA, CALENDAR YEAR 2016
CountyHarvested Acreage
Yield Per Acre Production Dollars
CATTLE, STEERS (N/A) (N/A)
Lassen 12,996,000Plumas 9,074,000Sierra 3,460,000STATE TOTAL 25,530,000Counties Reporting -- 3
CATTLE, STOCKERS, FEEDERS (N/A) (N/A)
Fresno 48,003,000Monterey 43,065,000Plumas 1,882,000San Benito 4,969,000Shasta 8,567,000Sierra 455,000Tehama 13,510,000STATE TOTAL 120,451,000Counties Reporting -- 7
CAULIFLOWER, FOOD SERVICE (Tons) (Tons)
Monterey 3,260 9.63 31,400 722.01 22,671,000STATE TOTAL 3,260 9.63 31,400 722.01 22,671,000Counties Reporting -- 1
CAULIFLOWER, FRESH MARKET (Tons) (Tons)
Imperial 4,430 9.05 40,100 899.08 36,053,000Monterey 17,800 9.61 171,000 976.00 166,896,000Sum of Others 39 5.62 219 3,680.37 806,000STATE TOTAL 22,269 9.49 211,319 964.21 203,755,000Counties Reporting -- 3
CAULIFLOWER, UNSPECIFIED (Tons) (Tons)
Riverside 1,420 7.75 11,000 998.18 10,980,000San Luis Obispo 2,360 11.14 26,300 621.06 16,334,000Santa Barbara 8,290 10.01 83,000 849.12 70,477,000Sum of Others 541 6.27 3,394 804.80 2,731,500STATE TOTAL 12,611 9.81 123,694 812.67 100,522,500Counties Reporting -- 4
CELERY, FOOD SERVICE (Tons) (Tons)
Monterey 997 32.60 32,500 375.02 12,188,000STATE TOTAL 997 32.60 32,500 375.02 12,188,000Counties Reporting -- 1
CELERY, FRESH MARKET (Tons) (Tons)
Monterey 11,700 31.97 374,000 400.00 149,600,000STATE TOTAL 11,700 31.97 374,000 400.00 149,600,000Counties Reporting -- 1
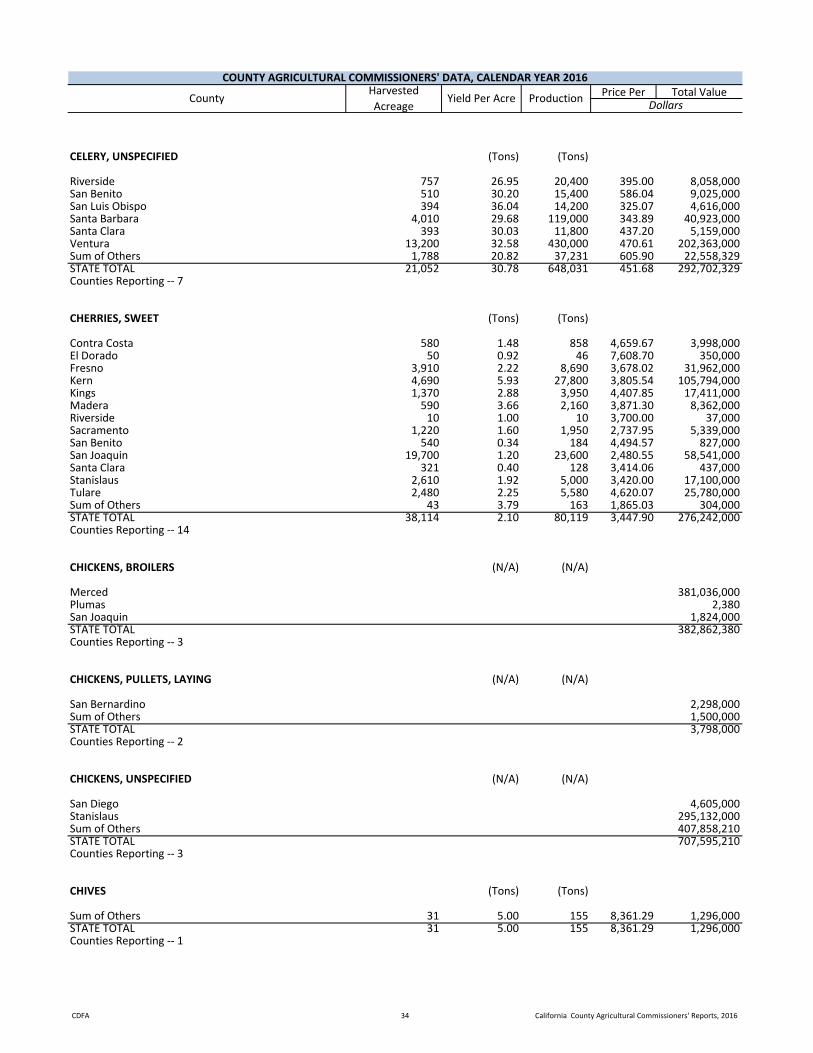
CDFA 34 California County Agricultural Commissioners' Reports, 2016
Price Per Total ValueCOUNTY AGRICULTURAL COMMISSIONERS' DATA, CALENDAR YEAR 2016
CountyHarvested Acreage
Yield Per Acre Production Dollars
CELERY, UNSPECIFIED (Tons) (Tons)
Riverside 757 26.95 20,400 395.00 8,058,000San Benito 510 30.20 15,400 586.04 9,025,000San Luis Obispo 394 36.04 14,200 325.07 4,616,000Santa Barbara 4,010 29.68 119,000 343.89 40,923,000Santa Clara 393 30.03 11,800 437.20 5,159,000Ventura 13,200 32.58 430,000 470.61 202,363,000Sum of Others 1,788 20.82 37,231 605.90 22,558,329STATE TOTAL 21,052 30.78 648,031 451.68 292,702,329Counties Reporting -- 7
CHERRIES, SWEET (Tons) (Tons)
Contra Costa 580 1.48 858 4,659.67 3,998,000El Dorado 50 0.92 46 7,608.70 350,000Fresno 3,910 2.22 8,690 3,678.02 31,962,000Kern 4,690 5.93 27,800 3,805.54 105,794,000Kings 1,370 2.88 3,950 4,407.85 17,411,000Madera 590 3.66 2,160 3,871.30 8,362,000Riverside 10 1.00 10 3,700.00 37,000Sacramento 1,220 1.60 1,950 2,737.95 5,339,000San Benito 540 0.34 184 4,494.57 827,000San Joaquin 19,700 1.20 23,600 2,480.55 58,541,000Santa Clara 321 0.40 128 3,414.06 437,000Stanislaus 2,610 1.92 5,000 3,420.00 17,100,000Tulare 2,480 2.25 5,580 4,620.07 25,780,000Sum of Others 43 3.79 163 1,865.03 304,000STATE TOTAL 38,114 2.10 80,119 3,447.90 276,242,000Counties Reporting -- 14
CHICKENS, BROILERS (N/A) (N/A)
Merced 381,036,000Plumas 2,380San Joaquin 1,824,000STATE TOTAL 382,862,380Counties Reporting -- 3
CHICKENS, PULLETS, LAYING (N/A) (N/A)
San Bernardino 2,298,000Sum of Others 1,500,000STATE TOTAL 3,798,000Counties Reporting -- 2
CHICKENS, UNSPECIFIED (N/A) (N/A)
San Diego 4,605,000Stanislaus 295,132,000Sum of Others 407,858,210STATE TOTAL 707,595,210Counties Reporting -- 3
CHIVES (Tons) (Tons)
Sum of Others 31 5.00 155 8,361.29 1,296,000STATE TOTAL 31 5.00 155 8,361.29 1,296,000Counties Reporting -- 1
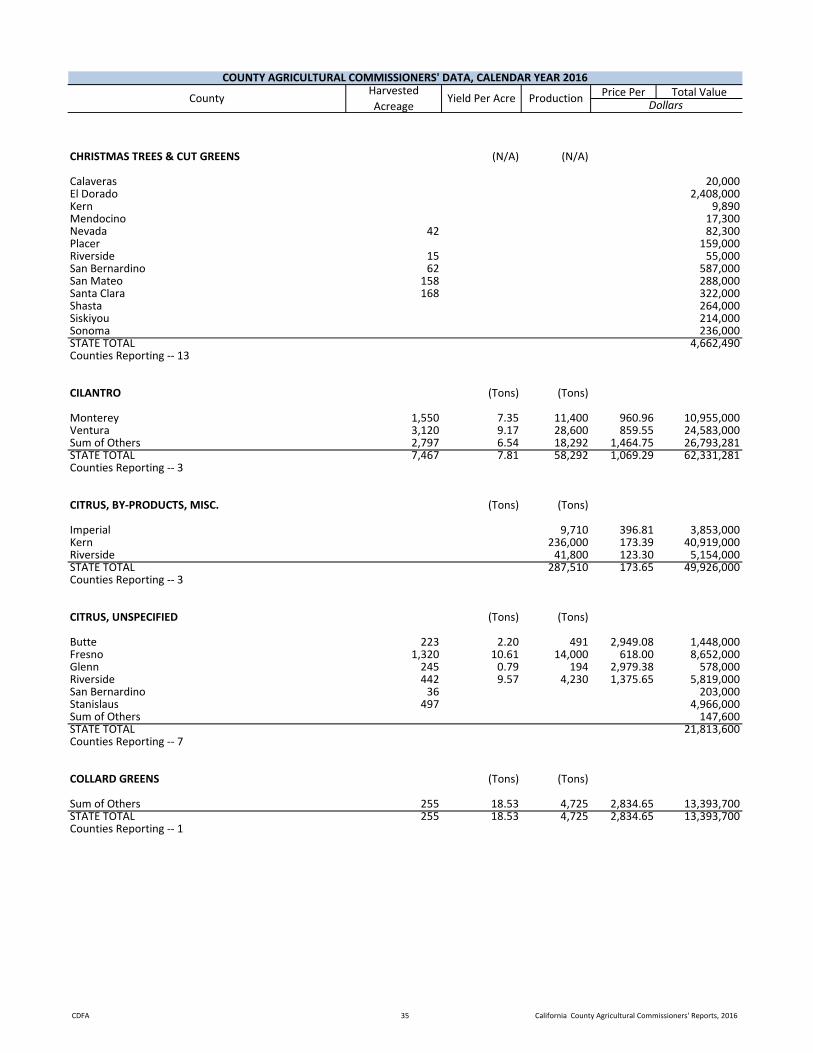
CDFA 35 California County Agricultural Commissioners' Reports, 2016
Price Per Total ValueCOUNTY AGRICULTURAL COMMISSIONERS' DATA, CALENDAR YEAR 2016
CountyHarvested Acreage
Yield Per Acre Production Dollars
CHRISTMAS TREES & CUT GREENS (N/A) (N/A)
Calaveras 20,000El Dorado 2,408,000Kern 9,890Mendocino 17,300Nevada 42 82,300Placer 159,000Riverside 15 55,000San Bernardino 62 587,000San Mateo 158 288,000Santa Clara 168 322,000Shasta 264,000Siskiyou 214,000Sonoma 236,000STATE TOTAL 4,662,490Counties Reporting -- 13
CILANTRO (Tons) (Tons)
Monterey 1,550 7.35 11,400 960.96 10,955,000Ventura 3,120 9.17 28,600 859.55 24,583,000Sum of Others 2,797 6.54 18,292 1,464.75 26,793,281STATE TOTAL 7,467 7.81 58,292 1,069.29 62,331,281Counties Reporting -- 3
CITRUS, BY-PRODUCTS, MISC. (Tons) (Tons)
Imperial 9,710 396.81 3,853,000Kern 236,000 173.39 40,919,000Riverside 41,800 123.30 5,154,000STATE TOTAL 287,510 173.65 49,926,000Counties Reporting -- 3
CITRUS, UNSPECIFIED (Tons) (Tons)
Butte 223 2.20 491 2,949.08 1,448,000Fresno 1,320 10.61 14,000 618.00 8,652,000Glenn 245 0.79 194 2,979.38 578,000Riverside 442 9.57 4,230 1,375.65 5,819,000San Bernardino 36 203,000Stanislaus 497 4,966,000Sum of Others 147,600STATE TOTAL 21,813,600Counties Reporting -- 7
COLLARD GREENS (Tons) (Tons)
Sum of Others 255 18.53 4,725 2,834.65 13,393,700STATE TOTAL 255 18.53 4,725 2,834.65 13,393,700Counties Reporting -- 1

CDFA 36 California County Agricultural Commissioners' Reports, 2016
Price Per Total ValueCOUNTY AGRICULTURAL COMMISSIONERS' DATA, CALENDAR YEAR 2016
CountyHarvested Acreage
Yield Per Acre Production Dollars
CORN, GRAIN (Tons) (Tons)
Colusa 1,180 6.29 7,420 152.29 1,130,000Contra Costa 7,410 3.91 29,000 153.55 4,453,000Glenn 12,900 6.22 80,200 155.92 12,505,000Madera 300 4.13 1,240 180.65 224,000Merced 5,300 5.72 30,300 279.04 8,455,000Sacramento 18,200 5.30 96,400 148.14 14,281,000San Joaquin 42,300 5.20 220,000 155.65 34,243,000Solano 4,410 4.72 20,800 156.83 3,262,000Sutter 8,310 7.09 58,900 177.03 10,427,000Tehama 441 5.31 2,340 147.86 346,000Tulare 5,300 4.94 26,200 208.02 5,450,000Yolo 5,510 6.01 33,100 157.01 5,197,000Sum of Others 1,320 4.88 6,440 209.32 1,348,000STATE TOTAL 112,881 5.42 612,340 165.47 101,321,000Counties Reporting -- 13
CORN, SILAGE (Tons) (Tons)
Fresno 24,900 22.93 571,000 42.00 23,982,000Glenn 1,730 32.02 55,400 30.00 1,662,000Kings 45,000 25.22 1,135,000 40.11 45,525,000Madera 18,000 25.61 461,000 38.98 17,971,000Merced 91,100 28.21 2,570,000 38.46 98,842,000Riverside 1,920 30.36 58,300 47.98 2,797,000Sacramento 6,920 27.02 187,000 32.28 6,036,000San Bernardino 914 23.96 21,900 45.16 989,000San Joaquin 34,600 27.11 938,000 31.31 29,369,000Sonoma 184 20.22 3,720 48.92 182,000Stanislaus 91,200 26.64 2,430,000 39.00 94,770,000Tehama 633 26.22 16,600 41.27 685,000Tulare 158,000 26.00 4,108,000 44.00 180,752,000Sum of Others 4,260 20.40 86,900 99.48 8,645,000STATE TOTAL 479,361 26.37 12,642,820 40.51 512,207,000Counties Reporting -- 14
CORN, SWEET, ALL (Tons) (Tons)
Contra Costa 4,030 10.99 44,300 525.01 23,258,000Fresno 4,000 10.65 42,600 331.01 14,101,000Imperial 7,410 11.12 82,400 500.01 41,201,000Los Angeles 58 4.67 271 535.06 145,000Riverside 1,900 10.05 19,100 585.39 11,181,000San Bernardino 15 10.87 163 1,509.20 246,000San Joaquin 3,480 7.64 26,600 280.08 7,450,000Santa Clara 1,630 9.51 15,500 580.39 8,996,000Tulare 387 5.30 2,050 536.10 1,099,000Ventura 214 7.52 1,610 621.74 1,001,000Sum of Others 44 7.05 310 1,103.23 342,000STATE TOTAL 23,168 10.14 234,904 464.10 109,020,000Counties Reporting -- 11
COTTON LINT, PIMA (Tons) (Tons)
Fresno 39,800 0.73 29,000 2,701.45 78,342,000Kern 20,200 0.79 16,000 2,764.00 44,224,000Kings 80,500 0.79 63,800 2,759.06 176,028,000STATE TOTAL 140,500 0.77 108,800 2,744.43 298,594,000Counties Reporting -- 3

CDFA 37 California County Agricultural Commissioners' Reports, 2016
Price Per Total ValueCOUNTY AGRICULTURAL COMMISSIONERS' DATA, CALENDAR YEAR 2016
CountyHarvested Acreage
Yield Per Acre Production Dollars
COTTON LINT, UNSPECIFIED (Tons) (Tons)
Merced 40,000 0.79 31,700 2,036.91 64,570,000Tulare 13,600 0.84 11,400 1,974.91 22,514,000Sum of Others 219 307,000STATE TOTAL 53,819 0.80 43,100 2,020.51 87,391,000Counties Reporting -- 3
COTTON LINT, UPLAND (Tons) (Tons)
Fresno 8,400 0.86 7,250 1,632.97 11,839,000Glenn 2,200 0.88 1,930 1,595.85 3,080,000Imperial 2,000 0.98 1,950 1,430.26 2,789,000Kern 3,480 0.92 3,200 1,339.06 4,285,000Kings 8,540 0.90 7,690 1,725.10 13,266,000Madera 630 0.82 515 1,619.42 834,000Riverside 4,280 1.30 5,560 1,260.07 7,006,000STATE TOTAL 29,530 0.95 28,095 1,534.05 43,099,000Counties Reporting -- 7
COTTON, SEED, PLANTING (Tons) (Tons)
Kern 9,750Tulare 75 1.31 98 271.43 26,600STATE TOTAL 75 1.31 98 271.43 36,350Counties Reporting -- 2
COTTONSEED (Tons) (Tons)
Fresno 55,900 232.97 13,023,000Glenn 2,640 375.00 990,000Imperial 2,720 155.51 423,000Kern 28,500 451.93 12,880,000Kings 125,000 258.94 32,368,000Madera 858 290.21 249,000Merced 12,400 279.35 3,464,000Riverside 6,800 251.03 1,707,000Tulare 18,300 270.98 4,959,000Sum of Others 200 379.50 75,900STATE TOTAL 253,318 276.88 70,138,900Counties Reporting -- 10
CUCUMBERS (Tons) (Tons)
San Diego 97 10.00 970 827.84 803,000San Joaquin 2,900 7.48 21,700 189.77 4,118,000Tulare 66 6.39 422 1,599.53 675,000Ventura 64 80.31 5,140 2,317.90 11,914,000Sum of Others 172 7.53 1,295 947.49 1,227,000STATE TOTAL 3,299 8.95 29,527 634.57 18,737,000Counties Reporting -- 5
DATES (Tons) (Tons)
Imperial 2,140 2.75 5,880 3,243.03 19,069,000Riverside 7,960 2.75 21,900 1,842.33 40,347,000STATE TOTAL 10,100 2.75 27,780 2,138.80 59,416,000Counties Reporting -- 2
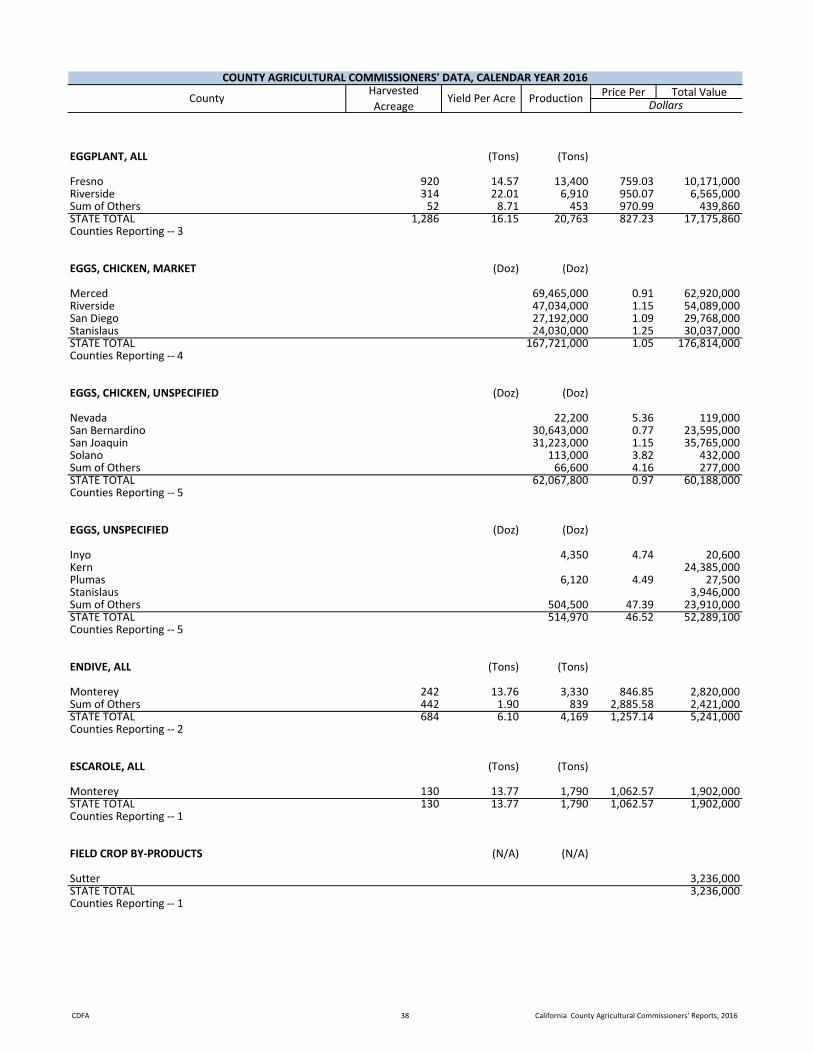
CDFA 38 California County Agricultural Commissioners' Reports, 2016
Price Per Total ValueCOUNTY AGRICULTURAL COMMISSIONERS' DATA, CALENDAR YEAR 2016
CountyHarvested Acreage
Yield Per Acre Production Dollars
EGGPLANT, ALL (Tons) (Tons)
Fresno 920 14.57 13,400 759.03 10,171,000Riverside 314 22.01 6,910 950.07 6,565,000Sum of Others 52 8.71 453 970.99 439,860STATE TOTAL 1,286 16.15 20,763 827.23 17,175,860Counties Reporting -- 3
EGGS, CHICKEN, MARKET (Doz) (Doz)
Merced 69,465,000 0.91 62,920,000Riverside 47,034,000 1.15 54,089,000San Diego 27,192,000 1.09 29,768,000Stanislaus 24,030,000 1.25 30,037,000STATE TOTAL 167,721,000 1.05 176,814,000Counties Reporting -- 4
EGGS, CHICKEN, UNSPECIFIED (Doz) (Doz)
Nevada 22,200 5.36 119,000San Bernardino 30,643,000 0.77 23,595,000San Joaquin 31,223,000 1.15 35,765,000Solano 113,000 3.82 432,000Sum of Others 66,600 4.16 277,000STATE TOTAL 62,067,800 0.97 60,188,000Counties Reporting -- 5
EGGS, UNSPECIFIED (Doz) (Doz)
Inyo 4,350 4.74 20,600Kern 24,385,000Plumas 6,120 4.49 27,500Stanislaus 3,946,000Sum of Others 504,500 47.39 23,910,000STATE TOTAL 514,970 46.52 52,289,100Counties Reporting -- 5
ENDIVE, ALL (Tons) (Tons)
Monterey 242 13.76 3,330 846.85 2,820,000Sum of Others 442 1.90 839 2,885.58 2,421,000STATE TOTAL 684 6.10 4,169 1,257.14 5,241,000Counties Reporting -- 2
ESCAROLE, ALL (Tons) (Tons)
Monterey 130 13.77 1,790 1,062.57 1,902,000STATE TOTAL 130 13.77 1,790 1,062.57 1,902,000Counties Reporting -- 1
FIELD CROP BY-PRODUCTS (N/A) (N/A)
Sutter 3,236,000STATE TOTAL 3,236,000Counties Reporting -- 1
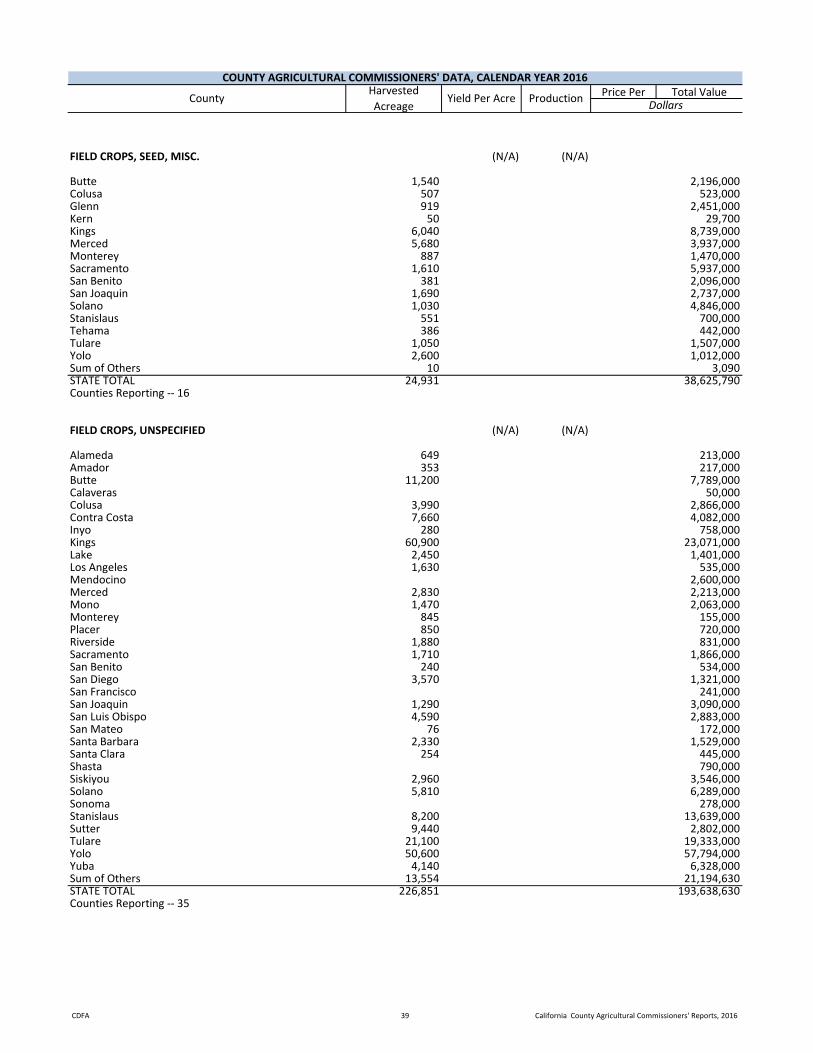
CDFA 39 California County Agricultural Commissioners' Reports, 2016
Price Per Total ValueCOUNTY AGRICULTURAL COMMISSIONERS' DATA, CALENDAR YEAR 2016
CountyHarvested Acreage
Yield Per Acre Production Dollars
FIELD CROPS, SEED, MISC. (N/A) (N/A)
Butte 1,540 2,196,000Colusa 507 523,000Glenn 919 2,451,000Kern 50 29,700Kings 6,040 8,739,000Merced 5,680 3,937,000Monterey 887 1,470,000Sacramento 1,610 5,937,000San Benito 381 2,096,000San Joaquin 1,690 2,737,000Solano 1,030 4,846,000Stanislaus 551 700,000Tehama 386 442,000Tulare 1,050 1,507,000Yolo 2,600 1,012,000Sum of Others 10 3,090STATE TOTAL 24,931 38,625,790Counties Reporting -- 16
FIELD CROPS, UNSPECIFIED (N/A) (N/A)
Alameda 649 213,000Amador 353 217,000Butte 11,200 7,789,000Calaveras 50,000Colusa 3,990 2,866,000Contra Costa 7,660 4,082,000Inyo 280 758,000Kings 60,900 23,071,000Lake 2,450 1,401,000Los Angeles 1,630 535,000Mendocino 2,600,000Merced 2,830 2,213,000Mono 1,470 2,063,000Monterey 845 155,000Placer 850 720,000Riverside 1,880 831,000Sacramento 1,710 1,866,000San Benito 240 534,000San Diego 3,570 1,321,000San Francisco 241,000San Joaquin 1,290 3,090,000San Luis Obispo 4,590 2,883,000San Mateo 76 172,000Santa Barbara 2,330 1,529,000Santa Clara 254 445,000Shasta 790,000Siskiyou 2,960 3,546,000Solano 5,810 6,289,000Sonoma 278,000Stanislaus 8,200 13,639,000Sutter 9,440 2,802,000Tulare 21,100 19,333,000Yolo 50,600 57,794,000Yuba 4,140 6,328,000Sum of Others 13,554 21,194,630STATE TOTAL 226,851 193,638,630Counties Reporting -- 35

CDFA 40 California County Agricultural Commissioners' Reports, 2016
Price Per Total ValueCOUNTY AGRICULTURAL COMMISSIONERS' DATA, CALENDAR YEAR 2016
CountyHarvested Acreage
Yield Per Acre Production Dollars
FIGS, DRIED (Tons) (Tons)
Madera 5,600 1.65 9,240 2,353.03 21,742,000Sum of Others 615 3.16 1,946 3,006.17 5,850,000STATE TOTAL 6,215 1.80 11,186 2,466.65 27,592,000Counties Reporting -- 2
FISH (N/A) (N/A)
Imperial 12,298,000Riverside 4,624,000Sacramento 16,576,000Sum of Others 2,517,700STATE TOTAL 36,015,700Counties Reporting -- 4
FISH, SHELL (N/A) (N/A)
Humboldt 10,280,000Marin 4,760,000STATE TOTAL 15,040,000Counties Reporting -- 2
FLOWERS, ASTERS, CUT (N/A) (N/A)
Ventura 89 3,104,000STATE TOTAL 89 3,104,000Counties Reporting -- 1
FLOWERS, CACTI, SUCCULENTS (N/A) (N/A)
San Diego 438 82,958,000Sum of Others 12 208,000STATE TOTAL 450 83,166,000Counties Reporting -- 2
FLOWERS, CARNATION, UNSPECIFIED (N/A) (N/A)
Monterey 2 83,400STATE TOTAL 2 83,400Counties Reporting -- 1
FLOWERS, CHRYSANTHEMUM, UNSPECIFIED (N/A) (N/A)
Monterey 18 1,974,000Santa Barbara 8,416,000Santa Clara 549,000Ventura 51 3,973,000STATE TOTAL 14,912,000Counties Reporting -- 4
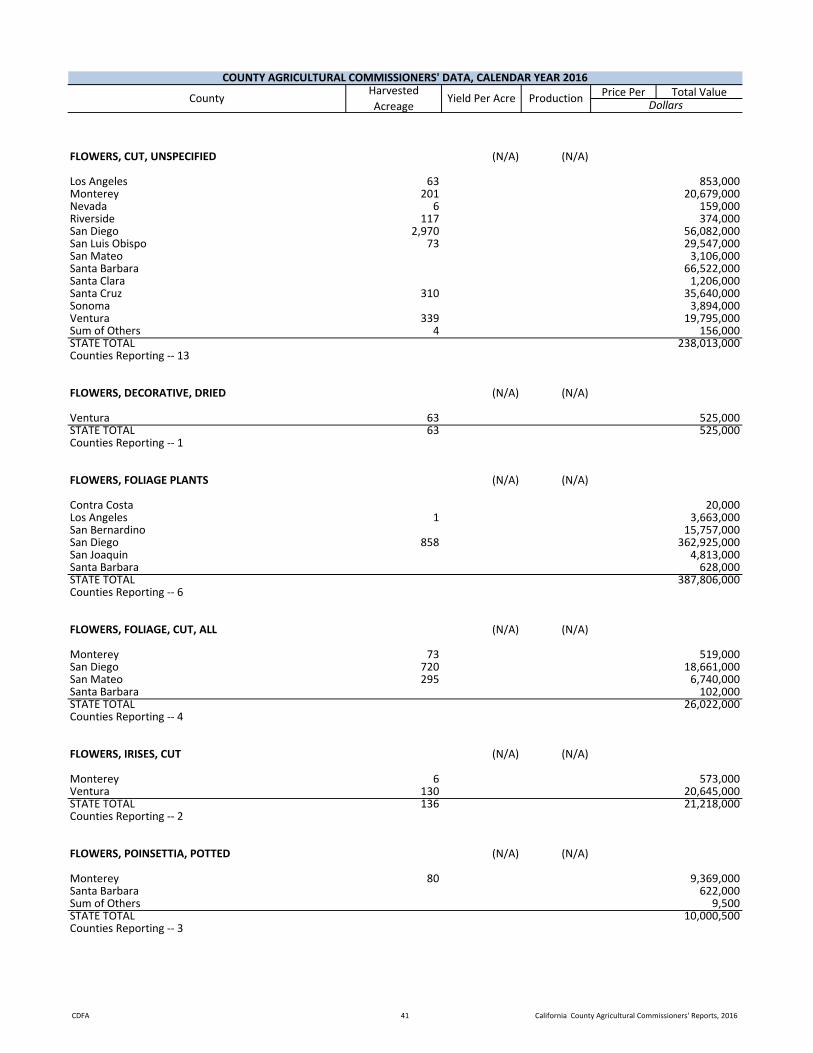
CDFA 41 California County Agricultural Commissioners' Reports, 2016
Price Per Total ValueCOUNTY AGRICULTURAL COMMISSIONERS' DATA, CALENDAR YEAR 2016
CountyHarvested Acreage
Yield Per Acre Production Dollars
FLOWERS, CUT, UNSPECIFIED (N/A) (N/A)
Los Angeles 63 853,000Monterey 201 20,679,000Nevada 6 159,000Riverside 117 374,000San Diego 2,970 56,082,000San Luis Obispo 73 29,547,000San Mateo 3,106,000Santa Barbara 66,522,000Santa Clara 1,206,000Santa Cruz 310 35,640,000Sonoma 3,894,000Ventura 339 19,795,000Sum of Others 4 156,000STATE TOTAL 238,013,000Counties Reporting -- 13
FLOWERS, DECORATIVE, DRIED (N/A) (N/A)
Ventura 63 525,000STATE TOTAL 63 525,000Counties Reporting -- 1
FLOWERS, FOLIAGE PLANTS (N/A) (N/A)
Contra Costa 20,000Los Angeles 1 3,663,000San Bernardino 15,757,000San Diego 858 362,925,000San Joaquin 4,813,000Santa Barbara 628,000STATE TOTAL 387,806,000Counties Reporting -- 6
FLOWERS, FOLIAGE, CUT, ALL (N/A) (N/A)
Monterey 73 519,000San Diego 720 18,661,000San Mateo 295 6,740,000Santa Barbara 102,000STATE TOTAL 26,022,000Counties Reporting -- 4
FLOWERS, IRISES, CUT (N/A) (N/A)
Monterey 6 573,000Ventura 130 20,645,000STATE TOTAL 136 21,218,000Counties Reporting -- 2
FLOWERS, POINSETTIA, POTTED (N/A) (N/A)
Monterey 80 9,369,000Santa Barbara 622,000Sum of Others 9,500STATE TOTAL 10,000,500Counties Reporting -- 3

CDFA 42 California County Agricultural Commissioners' Reports, 2016
Price Per Total ValueCOUNTY AGRICULTURAL COMMISSIONERS' DATA, CALENDAR YEAR 2016
CountyHarvested Acreage
Yield Per Acre Production Dollars
FLOWERS, ROSES, UNSPECIFIED (N/A) (N/A)
Monterey 10 3,421,000STATE TOTAL 10 3,421,000Counties Reporting -- 1
FOREST PRODUCTS, FIREWOOD (Cord) (Cord)
Del Norte 450,000Fresno 1,440 5.00 7,200Kern 503,000Los Angeles 5,030Madera 12,700 122.99 1,562,000Merced 16,900 165.56 2,798,000Mono 55,600San Diego 750,000Tuolumne 1,140,000STATE TOTAL 7,270,830Counties Reporting -- 9
FOREST PRODUCTS, UNSPECIFIED (N/A) (N/A)
Butte 6,510Del Norte 390,000El Dorado 55,600Fresno 3,311,000Plumas 96,400Sierra 23,100Tuolumne 1,006,000STATE TOTAL 4,888,610Counties Reporting -- 7

CDFA 43 California County Agricultural Commissioners' Reports, 2016
Price Per Total ValueCOUNTY AGRICULTURAL COMMISSIONERS' DATA, CALENDAR YEAR 2016
CountyHarvested Acreage
Yield Per Acre Production Dollars
FRUITS & NUTS, UNSPECIFIED (N/A) (N/A)
Alameda 304 770,000Amador 152 498,000Butte 8,570 25,671,000Calaveras 120,000Colusa 7,140 18,850,000Contra Costa 201 1,685,000El Dorado 1,723,000Humboldt 1,798,000Inyo 35 333,000Kings 4,050 21,618,000Lake 19 65,400Los Angeles 412 4,234,000Mendocino 257 800,000Merced 4,080 21,282,000Mono 43,300Monterey 447 3,275,000Napa 385,000Nevada 40 193,000Placer 825,000Plumas 45,000Riverside 475 4,383,000Sacramento 812 5,665,000San Benito 350 12,250,000San Bernardino 88 1,421,000San Diego 1,350 10,652,000San Joaquin 1,030 27,607,000San Luis Obispo 2,410 22,173,000San Mateo 109 1,914,000Santa Barbara 2,280 9,278,000Santa Clara 264 1,948,000Santa Cruz 384 730,000Shasta 332,000Sierra 122Siskiyou 347,000Solano 1,090 3,377,000Sonoma 600,000Stanislaus 5,700 97,081,000Sutter 576 3,134,000Trinity 6,100Tulare 709 21,086,000Tuolumne 254 322,000Ventura 938 14,580,000Yolo 5,000 11,202,000Yuba 891 6,476,000Sum of Others 1,588 11,663,400STATE TOTAL 372,441,322Counties Reporting -- 45
GAME BIRDS, UNSPEC (N/A) (N/A)
Stanislaus 1,048,000Sum of Others 458,000STATE TOTAL 1,506,000Counties Reporting -- 2

CDFA 44 California County Agricultural Commissioners' Reports, 2016
Price Per Total ValueCOUNTY AGRICULTURAL COMMISSIONERS' DATA, CALENDAR YEAR 2016
CountyHarvested Acreage
Yield Per Acre Production Dollars
GARLIC, ALL (Tons) (Tons)
Fresno 21,500 6.84 147,000 1,500.00 220,500,000Kern 5,530 7.90 43,700 1,456.22 63,637,000Riverside 1,630 6.07 9,900 1,050.00 10,395,000Santa Clara 828 4.00 3,310 1,965.26 6,505,000Sum of Others 903 7.76 7,010 554.15 3,884,620STATE TOTAL 30,391 6.94 210,920 1,445.67 304,921,620Counties Reporting -- 5
GOAT CHEESE (Cwt) (Cwt)
Humboldt 24,251,000Plumas 1,730STATE TOTAL 24,252,730Counties Reporting -- 2
GOATS & KIDS, UNSPECIFIED (N/A) (N/A)
Amador 248,000Plumas 3,990Stanislaus 2,325,000Sum of Others 1,243,200STATE TOTAL 3,820,190Counties Reporting -- 4
GOATS, MILK (Cwt) (Cwt)
Humboldt 503,000Kings 129,000 36.32 4,685,000Merced 62,200 36.82 2,290,000Plumas 67 37.76 2,530Stanislaus 107,000 37.70 4,034,000Sum of Others 231 431.17 99,600STATE TOTAL 298,498 37.22 11,614,130Counties Reporting -- 6
GRAPEFRUIT, ALL (Tons) (Tons)
Imperial 818 12.84 10,500 415.24 4,360,000Kern 853 13.01 11,100 852.70 9,465,000Riverside 4,200 12.38 52,000 545.08 28,344,000San Bernardino 225 1.24 279 353.41 98,600San Diego 1,440 17.01 24,500 779.35 19,094,000Tulare 1,740 11.49 20,000 859.00 17,180,000Ventura 89 2.98 265 2,890.57 766,000STATE TOTAL 9,365 12.67 118,644 668.45 79,307,600Counties Reporting -- 7
GRAPES, RAISIN (Tons) (Tons)
Fresno 82,300 9.32 767,000 262.28 201,170,000Kern 13,400 15.67 210,000 324.62 68,171,000Kings 1,700 12.12 20,600 286.07 5,893,000Madera 23,400 13.50 316,000 258.95 81,828,000Tulare 11,300 10.71 121,000 628.89 76,096,000Sum of Others 1,570 8.03 12,600 354.13 4,462,000STATE TOTAL 133,670 10.83 1,447,200 302.39 437,620,000Counties Reporting -- 6

CDFA 45 California County Agricultural Commissioners' Reports, 2016
Price Per Total ValueCOUNTY AGRICULTURAL COMMISSIONERS' DATA, CALENDAR YEAR 2016
CountyHarvested Acreage
Yield Per Acre Production Dollars
GRAPES, TABLE (Tons) (Tons)
Fresno 20,300 7.29 148,000 1,476.61 218,539,000Kern 63,800 11.07 706,000 2,155.38 1,521,701,000Kings 824 13.47 11,100 1,551.08 17,217,000Madera 3,500 9.14 32,000 1,787.47 57,199,000Riverside 7,430 7.70 57,200 2,435.65 139,319,000Tulare 35,600 11.12 396,000 1,207.19 478,048,000Sum of Others 283 7.55 2,137 432.71 924,700STATE TOTAL 131,737 10.27 1,352,437 1,798.94 2,432,947,700Counties Reporting -- 7
GRAPES, UNSPECIFIED (Tons) (Tons)
Glenn 745 5.70 4,250 937.41 3,984,000Los Angeles 340 3.74 1,270 796.85 1,012,000Stanislaus 10,400 9.42 98,000 512.04 50,180,000Tehama 191 3.51 670 1,494.03 1,001,000Sum of Others 528 10.90 5,753 914.36 5,260,300STATE TOTAL 12,204 9.01 109,943 558.81 61,437,300Counties Reporting -- 5
GRAPES, WINE (Tons) (Tons)
Alameda 2,630 4.83 12,700 1,432.20 18,189,000Amador 4,260 3.17 13,500 1,335.41 18,028,000Calaveras 696 2.89 2,010 1,375.62 2,765,000Colusa 1,390 10.36 14,400 542.15 7,807,000Contra Costa 2,500 5.04 12,600 1,096.03 13,810,000El Dorado 2,340 2.58 6,030 1,449.59 8,741,000Fresno 75,500 10.00 755,000 382.85 289,053,000Kern 29,700 7.85 233,000 298.54 69,559,000Kings 3,730 13.62 50,800 286.22 14,540,000Lake 8,230 5.65 46,500 1,691.27 78,644,000Madera 37,300 11.23 419,000 314.01 131,571,000Marin 182 1.37 250 3,468.00 867,000Mariposa 73 0.52 38 1,263.16 48,000Mendocino 16,900 3.39 57,300 1,540.79 88,287,000Merced 13,600 11.18 152,000 525.60 79,891,000Monterey 44,800 3.84 172,000 1,388.91 238,892,000Napa 43,400 3.53 153,000 4,768.02 729,507,000Nevada 417 3.33 1,390 1,386.33 1,927,000Placer 265 3.11 823 1,245.44 1,025,000Riverside 2,630 2.09 5,500 1,746.18 9,604,000Sacramento 33,900 8.50 288,000 639.59 184,202,000San Benito 4,380 4.86 21,300 1,460.89 31,117,000San Bernardino 268 0.72 192 1,463.54 281,000San Diego 930 2.71 2,520 1,192.46 3,005,000San Joaquin 98,000 7.31 716,000 594.67 425,781,000San Luis Obispo 40,300 3.87 156,000 1,557.05 242,900,000San Mateo 152 703,000Santa Barbara 21,300 3.87 82,500 1,837.94 151,630,000Santa Clara 1,580 2.84 4,490 1,703.56 7,649,000Santa Cruz 626 2.43 1,520 2,988.82 4,543,000Shasta 160 1.70 272 1,110.29 302,000Solano 4,110 5.79 23,800 821.85 19,560,000Sonoma 60,000 3.77 226,000 2,595.21 586,518,000Trinity 44 1.93 85 1,729.41 147,000Tulare 9,940 15.29 152,000 303.00 46,056,000Yolo 14,500 7.10 103,000 788.97 81,264,000Sum of Others 4 2.25 9 1,422.22 12,800STATE TOTAL 580,737 6.69 3,885,529 923.36 3,588,425,800Counties Reporting -- 37

CDFA 46 California County Agricultural Commissioners' Reports, 2016
Price Per Total ValueCOUNTY AGRICULTURAL COMMISSIONERS' DATA, CALENDAR YEAR 2016
CountyHarvested Acreage
Yield Per Acre Production Dollars
GREENS, TURNIP & MUSTARD (Tons) (Tons)
Ventura 970 8.95 8,680 1,039.06 9,019,000Sum of Others 2,151 5.35 11,517 989.27 11,393,400STATE TOTAL 3,121 6.47 20,197 1,010.66 20,412,400Counties Reporting -- 2
GUAVAS (Tons) (Tons)
Sum of Others 3 2.33 7 7,070.00 49,490STATE TOTAL 3 2.33 7 7,070.00 49,490Counties Reporting -- 1
HAY, ALFALFA (Tons) (Tons)
Alameda 533 5.20 2,770 169.68 470,000Amador 633 5.99 3,790 150.13 569,000Butte 1,350 7.85 10,600 137.64 1,459,000Colusa 6,890 6.08 41,900 118.42 4,962,000Contra Costa 1,910 4.16 7,940 155.67 1,236,000Fresno 36,300 7.58 275,000 167.00 45,925,000Glenn 11,200 6.74 75,500 132.95 10,038,000Imperial 155,000 7.19 1,114,000 133.68 148,915,000Inyo 15,100 180.00 2,718,000Kern 84,200 7.14 601,000 152.96 91,931,000Kings 27,500 7.67 211,000 142.24 30,013,000Lassen 28,000 4.50 126,000 154.73 19,496,000Los Angeles 6,240 7.85 49,000 229.31 11,236,000Madera 13,100 7.24 94,800 158.07 14,985,000Merced 62,300 7.24 451,000 170.74 77,003,000Mono 47,200 180.00 8,496,000Monterey 200 6.05 1,210 200.00 242,000Plumas 4,610 2.58 11,900 251.01 2,987,000Riverside 49,400 8.26 408,000 167.32 68,267,000Sacramento 16,400 5.90 96,700 138.01 13,346,000San Bernardino 6,160 7.92 48,800 288.79 14,093,000San Joaquin 51,300 6.37 327,000 143.11 46,796,000San Luis Obispo 1,800 5.09 9,170 181.03 1,660,000Shasta 3,600 5.31 19,100 159.84 3,053,000Sierra 1,310 3.12 4,090 234.72 960,000Siskiyou 44,600 6.26 279,000 170.93 47,689,000Solano 30,500 5.25 160,000 139.17 22,267,000Stanislaus 23,000 7.09 163,000 148.00 24,124,000Sutter 5,710 6.43 36,700 159.89 5,868,000Tehama 1,800 6.00 10,800 128.15 1,384,000Tulare 56,800 7.85 446,000 154.00 68,684,000Yolo 30,200 5.63 170,000 137.00 23,290,000Yuba 614 8.00 4,910 140.12 688,000Sum of Others 60 10.00 600 185.00 111,000STATE TOTAL 763,220 6.89 5,323,580 153.09 814,961,000Counties Reporting -- 34

CDFA 47 California County Agricultural Commissioners' Reports, 2016
Price Per Total ValueCOUNTY AGRICULTURAL COMMISSIONERS' DATA, CALENDAR YEAR 2016
CountyHarvested Acreage
Yield Per Acre Production Dollars
HAY, GRAIN (Tons) (Tons)
Amador 1,230 520,000Calaveras 200 2.00 400 150.00 60,000Colusa 3,770 2.00 7,550 80.00 604,000Contra Costa 2,920 4.52 13,200 55.38 731,000Fresno 19,000 2.11 40,100 155.81 6,248,000Kern 6,400 3.95 25,300 140.12 3,545,000Kings 2,880 3.61 10,400 79.52 827,000Lassen 10,000 2.50 25,000 85.00 2,125,000Los Angeles 3,200 3.00 9,600 200.00 1,920,000Madera 1,800 3.20 5,760 92.01 530,000Merced 35,200 3.92 138,000 144.20 19,900,000Monterey 416 1.75 728 120.05 87,400Napa 425 1.50 638 119.91 76,500Placer 2,370 1.21 2,870 134.49 386,000Plumas 1,000 2.10 2,100 175.24 368,000Riverside 371 1.99 740 194.59 144,000Sacramento 3,490 3.61 12,600 90.32 1,138,000San Benito 11,800 3.14 37,100 150.13 5,570,000San Diego 2,100 1.00 2,100 141.90 298,000San Luis Obispo 11,000 2.15 23,700 132.87 3,149,000San Mateo 480 2.52 1,210 181.82 220,000Santa Barbara 3,280 1,766,000Santa Clara 3,860 2.69 10,400 107.31 1,116,000Sierra 425 2.94 1,250 175.20 219,000Solano 4,650 3.72 17,300 95.78 1,657,000Sonoma 5,490 2.81 15,400 60.97 939,000Stanislaus 11,400 3.19 36,400 100.00 3,640,000Sutter 4,640 3.36 15,600 80.77 1,260,000Tehama 3,890 3.70 14,400 133.82 1,927,000Yolo 13,800 2.70 37,300 77.99 2,909,000Sum of Others 1,469 3.66 5,378 163.82 881,000STATE TOTAL 172,956 3.04 512,524 121.90 64,760,900Counties Reporting -- 31
HAY, GREEN CHOP (Tons) (Tons)
Riverside 15,900 7.61 121,000 55.58 6,725,000San Bernardino 2,860 23.71 67,800 50.44 3,420,000Sonoma 1,130 14.16 16,000 27.25 436,000STATE TOTAL 19,890 10.30 204,800 51.67 10,581,000Counties Reporting -- 3
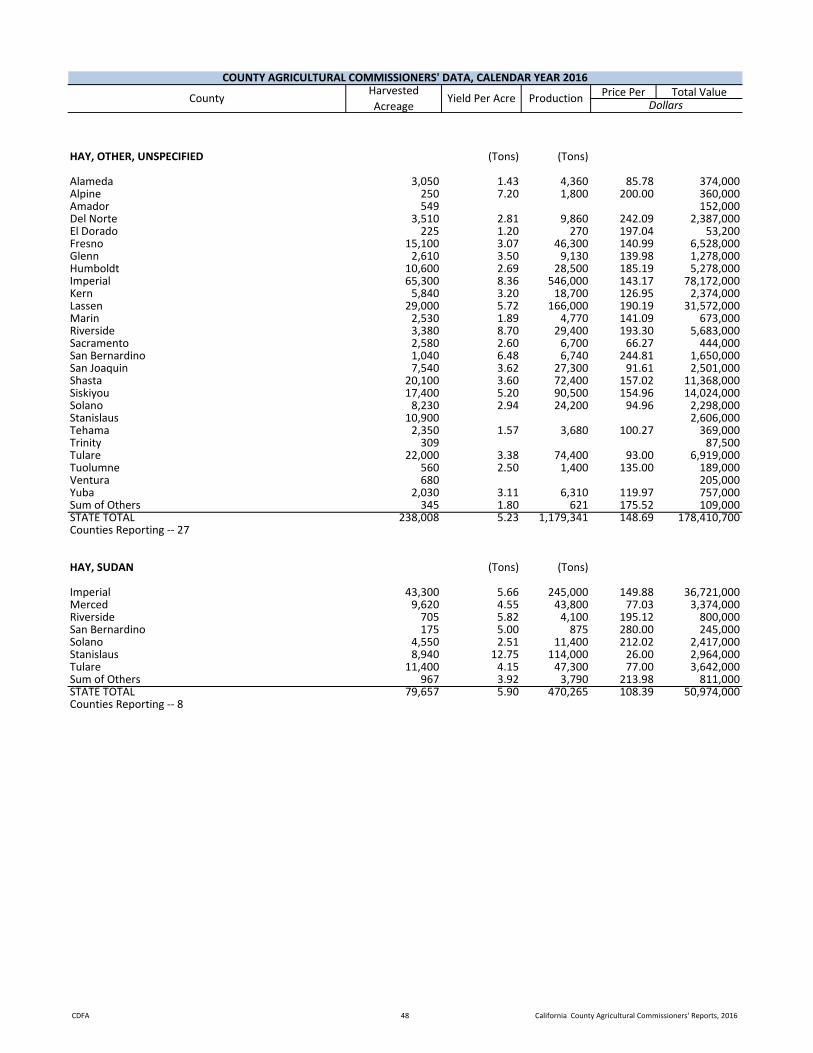
CDFA 48 California County Agricultural Commissioners' Reports, 2016
Price Per Total ValueCOUNTY AGRICULTURAL COMMISSIONERS' DATA, CALENDAR YEAR 2016
CountyHarvested Acreage
Yield Per Acre Production Dollars
HAY, OTHER, UNSPECIFIED (Tons) (Tons)
Alameda 3,050 1.43 4,360 85.78 374,000Alpine 250 7.20 1,800 200.00 360,000Amador 549 152,000Del Norte 3,510 2.81 9,860 242.09 2,387,000El Dorado 225 1.20 270 197.04 53,200Fresno 15,100 3.07 46,300 140.99 6,528,000Glenn 2,610 3.50 9,130 139.98 1,278,000Humboldt 10,600 2.69 28,500 185.19 5,278,000Imperial 65,300 8.36 546,000 143.17 78,172,000Kern 5,840 3.20 18,700 126.95 2,374,000Lassen 29,000 5.72 166,000 190.19 31,572,000Marin 2,530 1.89 4,770 141.09 673,000Riverside 3,380 8.70 29,400 193.30 5,683,000Sacramento 2,580 2.60 6,700 66.27 444,000San Bernardino 1,040 6.48 6,740 244.81 1,650,000San Joaquin 7,540 3.62 27,300 91.61 2,501,000Shasta 20,100 3.60 72,400 157.02 11,368,000Siskiyou 17,400 5.20 90,500 154.96 14,024,000Solano 8,230 2.94 24,200 94.96 2,298,000Stanislaus 10,900 2,606,000Tehama 2,350 1.57 3,680 100.27 369,000Trinity 309 87,500Tulare 22,000 3.38 74,400 93.00 6,919,000Tuolumne 560 2.50 1,400 135.00 189,000Ventura 680 205,000Yuba 2,030 3.11 6,310 119.97 757,000Sum of Others 345 1.80 621 175.52 109,000STATE TOTAL 238,008 5.23 1,179,341 148.69 178,410,700Counties Reporting -- 27
HAY, SUDAN (Tons) (Tons)
Imperial 43,300 5.66 245,000 149.88 36,721,000Merced 9,620 4.55 43,800 77.03 3,374,000Riverside 705 5.82 4,100 195.12 800,000San Bernardino 175 5.00 875 280.00 245,000Solano 4,550 2.51 11,400 212.02 2,417,000Stanislaus 8,940 12.75 114,000 26.00 2,964,000Tulare 11,400 4.15 47,300 77.00 3,642,000Sum of Others 967 3.92 3,790 213.98 811,000STATE TOTAL 79,657 5.90 470,265 108.39 50,974,000Counties Reporting -- 8

CDFA 49 California County Agricultural Commissioners' Reports, 2016
Price Per Total ValueCOUNTY AGRICULTURAL COMMISSIONERS' DATA, CALENDAR YEAR 2016
CountyHarvested Acreage
Yield Per Acre Production Dollars
HAY, WILD (Tons) (Tons)
Plumas 2,800 2.00 5,600 251.07 1,406,000San Mateo 128 2.31 296 81.08 24,000Sierra 185 2.16 400 239.75 95,900Sonoma 1,740 2.22 3,860 132.38 511,000Sum of Others 70 1.80 126 142.86 18,000STATE TOTAL 4,923 2.09 10,282 199.85 2,054,900Counties Reporting -- 5
HOGS & PIGS, UNSPECIFIED (N/A) (N/A)
Amador 6,750Fresno 12,468,000Glenn 277,000Kern 259,000Mendocino 102,000Monterey 228,000Plumas 24,300San Diego 159,000Shasta 117,000Sonoma 271,000Stanislaus 4,108,000Tehama 102,000Sum of Others 305,200STATE TOTAL 18,427,250Counties Reporting -- 13
HORSERADISH (Tons) (Tons)
Siskiyou 170 2.50 425 501.18 213,000STATE TOTAL 170 2.50 425 501.18 213,000Counties Reporting -- 1
JOJOBA (Lbs) (Lbs)
San Bernardino 2 40.00 80 62.50 5,000STATE TOTAL 2 40.00 80 62.50 5,000Counties Reporting -- 1
KALE (Tons) (Tons)
Monterey 2,690 10.30 27,700 1,191.01 32,991,000San Benito 1,340 12.16 16,300 1,169.14 19,057,000San Bernardino 10 25.20 252 861.11 217,000Ventura 1,200 5.19 6,230 4,734.83 29,498,000Sum of Others 1,484 11.57 17,176 808.64 13,889,250STATE TOTAL 6,724 10.06 67,658 1,413.76 95,652,250Counties Reporting -- 5

CDFA 50 California County Agricultural Commissioners' Reports, 2016
Price Per Total ValueCOUNTY AGRICULTURAL COMMISSIONERS' DATA, CALENDAR YEAR 2016
CountyHarvested Acreage
Yield Per Acre Production Dollars
KIWIFRUIT (Tons) (Tons)
Butte 693 8.56 5,930 645.36 3,827,000Fresno 587 1.77 1,040 1,273.08 1,324,000Sutter 87 10.78 938 1,399.79 1,313,000Tulare 1,850 13.89 25,700 1,780.00 45,746,000Yuba 338 11.51 3,890 2,298.20 8,940,000Sum of Others 101 6.17 623 1,435.79 894,500STATE TOTAL 3,656 10.43 38,121 1,627.57 62,044,500Counties Reporting -- 6
KOHLRABI (Tons) (Tons)
Sum of Others 61 6.30 384 980.99 376,700STATE TOTAL 61 6.30 384 980.99 376,700Counties Reporting -- 1
KUMQUATS (Tons) (Tons)
San Diego 79 1.90 150 3,000.00 450,000Sum of Others 1 3,000STATE TOTAL 80 1.90 150 3,000.00 453,000Counties Reporting -- 2
LEEKS (Tons) (Tons)
Monterey 339 12.51 4,240 1,500.00 6,360,000San Bernardino 13 8.23 107 2,448.60 262,000San Mateo 118 13.39 1,580 1,125.32 1,778,000Sum of Others 210 17.29 3,630 434.18 1,576,091STATE TOTAL 680 14.05 9,557 1,043.85 9,976,091Counties Reporting -- 4
LEMONS, ALL (Tons) (Tons)
Fresno 2,840 13.42 38,100 1,037.01 39,510,000Imperial 4,410 11.97 52,800 859.15 45,363,000Kern 3,740 14.73 55,100 1,327.80 73,162,000Monterey 1,150 32.26 37,100 1,110.00 41,181,000Riverside 6,380 15.83 101,000 1,249.80 126,230,000San Bernardino 274 3.51 961 830.39 798,000San Diego 3,400 16.41 55,800 1,019.27 56,875,000San Luis Obispo 1,410 12.70 17,900 894.30 16,008,000Santa Barbara 1,300 14.69 19,100 669.79 12,793,000Tulare 7,190 13.00 93,500 1,260.00 117,810,000Ventura 14,800 18.31 271,000 985.15 266,977,000Sum of Others 380 20.24 7,690 1,103.12 8,483,000STATE TOTAL 47,274 15.87 750,051 1,073.51 805,190,000Counties Reporting -- 12
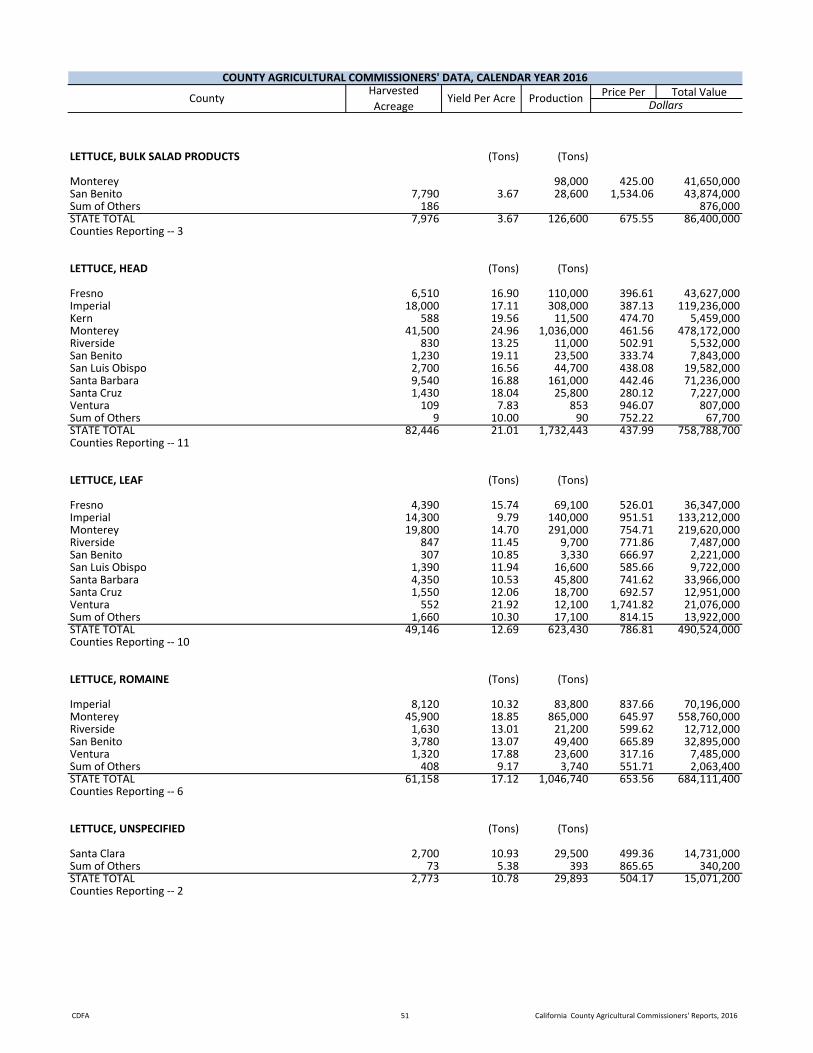
CDFA 51 California County Agricultural Commissioners' Reports, 2016
Price Per Total ValueCOUNTY AGRICULTURAL COMMISSIONERS' DATA, CALENDAR YEAR 2016
CountyHarvested Acreage
Yield Per Acre Production Dollars
LETTUCE, BULK SALAD PRODUCTS (Tons) (Tons)
Monterey 98,000 425.00 41,650,000San Benito 7,790 3.67 28,600 1,534.06 43,874,000Sum of Others 186 876,000STATE TOTAL 7,976 3.67 126,600 675.55 86,400,000Counties Reporting -- 3
LETTUCE, HEAD (Tons) (Tons)
Fresno 6,510 16.90 110,000 396.61 43,627,000Imperial 18,000 17.11 308,000 387.13 119,236,000Kern 588 19.56 11,500 474.70 5,459,000Monterey 41,500 24.96 1,036,000 461.56 478,172,000Riverside 830 13.25 11,000 502.91 5,532,000San Benito 1,230 19.11 23,500 333.74 7,843,000San Luis Obispo 2,700 16.56 44,700 438.08 19,582,000Santa Barbara 9,540 16.88 161,000 442.46 71,236,000Santa Cruz 1,430 18.04 25,800 280.12 7,227,000Ventura 109 7.83 853 946.07 807,000Sum of Others 9 10.00 90 752.22 67,700STATE TOTAL 82,446 21.01 1,732,443 437.99 758,788,700Counties Reporting -- 11
LETTUCE, LEAF (Tons) (Tons)
Fresno 4,390 15.74 69,100 526.01 36,347,000Imperial 14,300 9.79 140,000 951.51 133,212,000Monterey 19,800 14.70 291,000 754.71 219,620,000Riverside 847 11.45 9,700 771.86 7,487,000San Benito 307 10.85 3,330 666.97 2,221,000San Luis Obispo 1,390 11.94 16,600 585.66 9,722,000Santa Barbara 4,350 10.53 45,800 741.62 33,966,000Santa Cruz 1,550 12.06 18,700 692.57 12,951,000Ventura 552 21.92 12,100 1,741.82 21,076,000Sum of Others 1,660 10.30 17,100 814.15 13,922,000STATE TOTAL 49,146 12.69 623,430 786.81 490,524,000Counties Reporting -- 10
LETTUCE, ROMAINE (Tons) (Tons)
Imperial 8,120 10.32 83,800 837.66 70,196,000Monterey 45,900 18.85 865,000 645.97 558,760,000Riverside 1,630 13.01 21,200 599.62 12,712,000San Benito 3,780 13.07 49,400 665.89 32,895,000Ventura 1,320 17.88 23,600 317.16 7,485,000Sum of Others 408 9.17 3,740 551.71 2,063,400STATE TOTAL 61,158 17.12 1,046,740 653.56 684,111,400Counties Reporting -- 6
LETTUCE, UNSPECIFIED (Tons) (Tons)
Santa Clara 2,700 10.93 29,500 499.36 14,731,000Sum of Others 73 5.38 393 865.65 340,200STATE TOTAL 2,773 10.78 29,893 504.17 15,071,200Counties Reporting -- 2

CDFA 52 California County Agricultural Commissioners' Reports, 2016
Price Per Total ValueCOUNTY AGRICULTURAL COMMISSIONERS' DATA, CALENDAR YEAR 2016
CountyHarvested Acreage
Yield Per Acre Production Dollars
LIMES, ALL (Tons) (Tons)
San Diego 259 5.29 1,370 1,133.58 1,553,000Sum of Others 156 6.99 1,090 627.52 684,000STATE TOTAL 415 5.93 2,460 909.35 2,237,000Counties Reporting -- 2
LIVESTOCK PRODUCTS, MISC. (N/A) (N/A)
Amador 54,000Calaveras 38,000Colusa 62,000Del Norte 1,650,000Glenn 85,000Humboldt 84,000Lake 168,000Lassen 129,000Mendocino 1,500,000Monterey 12,261,000Napa 661,000Placer 1,500,000Plumas 3,790Riverside 1,739,000Sacramento 1,076,000San Benito 2,610,000San Mateo 1,226,000Santa Barbara 7,665,000Solano 14,635,000Sonoma 31,299,000Stanislaus 1,738,000Sutter 3,000Tehama 2,151,000Tulare 1,588,000Tuolumne 145,000Ventura 2,018,000Yolo 1,348,000Sum of Others 27,728,130STATE TOTAL 115,164,920Counties Reporting -- 28

CDFA 53 California County Agricultural Commissioners' Reports, 2016
Price Per Total ValueCOUNTY AGRICULTURAL COMMISSIONERS' DATA, CALENDAR YEAR 2016
CountyHarvested Acreage
Yield Per Acre Production Dollars
LIVESTOCK, UNSPECIFIED (N/A) (N/A)
Alameda 762,000Amador 370,000Butte 1,205,000Calaveras 140,000Colusa 762,000Contra Costa 1,300,000El Dorado 2,121,000Humboldt 1,052,000Inyo 186,000Kern 1,125,000Kings 29,286,000Lake 41,300Lassen 64,000Los Angeles 7,977,000Mendocino 650,000Merced 5,017,000Mono 2,570,000Napa 20,300Nevada 213,000Placer 10,765,000Riverside 1,167,000Sacramento 185,000San Joaquin 8,712,000San Luis Obispo 5,366,000San Mateo 626,000Santa Barbara 1,787,000Santa Clara 313,000Santa Cruz 7,403,000Shasta 3,000,000Sierra 3,790Siskiyou 350,000Solano 1,074,000Sutter 2,265,000Tehama 3,023,000Tulare 11,322,000Tuolumne 12,405,000Ventura 2,171,000Yolo 1,016,000Sum of Others 294,150STATE TOTAL 128,109,540Counties Reporting -- 39

CDFA 54 California County Agricultural Commissioners' Reports, 2016
Price Per Total ValueCOUNTY AGRICULTURAL COMMISSIONERS' DATA, CALENDAR YEAR 2016
CountyHarvested Acreage
Yield Per Acre Production Dollars
MANURE (Tons) (Tons)
Fresno 621,000 7.60 4,720,000Kern 4,514,000Kings 761,000 4.30 3,274,000Merced 1,653,000 5.17 8,552,000San Joaquin 208,000 4.05 842,000Stanislaus 514,000 7.05 3,624,000Tulare 2,612,000 4.19 10,944,000Sum of Others 511,000STATE TOTAL 36,981,000Counties Reporting -- 8
MELONS, CANTALOUPE (Tons) (Tons)
Fresno 14,400 17.29 249,000 339.00 84,411,000Imperial 5,070 12.41 62,900 346.41 21,789,000Merced 4,520 13.43 60,700 243.56 14,784,000Riverside 2,220 12.66 28,100 422.99 11,886,000Sum of Others 430 14.80 6,366 242.65 1,544,700STATE TOTAL 26,640 15.28 407,066 330.20 134,414,700Counties Reporting -- 5
MELONS, HONEYDEW (Tons) (Tons)
Fresno 5,220 19.92 104,000 515.00 53,560,000Imperial 1,280 13.83 17,700 467.80 8,280,000Riverside 1,930 13.01 25,100 532.99 13,378,000Sutter 506 3,674,000Sum of Others 10,100STATE TOTAL 8,936 17.41 146,800 512.38 78,902,100Counties Reporting -- 5
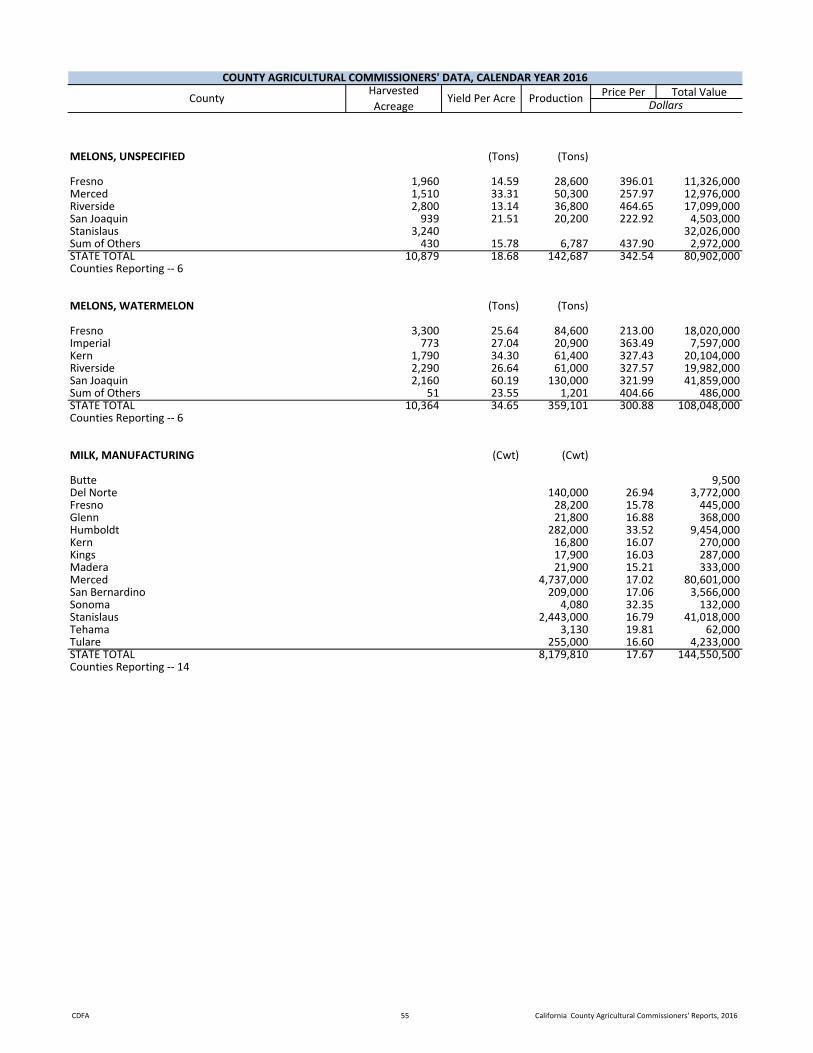
CDFA 55 California County Agricultural Commissioners' Reports, 2016
Price Per Total ValueCOUNTY AGRICULTURAL COMMISSIONERS' DATA, CALENDAR YEAR 2016
CountyHarvested Acreage
Yield Per Acre Production Dollars
MELONS, UNSPECIFIED (Tons) (Tons)
Fresno 1,960 14.59 28,600 396.01 11,326,000Merced 1,510 33.31 50,300 257.97 12,976,000Riverside 2,800 13.14 36,800 464.65 17,099,000San Joaquin 939 21.51 20,200 222.92 4,503,000Stanislaus 3,240 32,026,000Sum of Others 430 15.78 6,787 437.90 2,972,000STATE TOTAL 10,879 18.68 142,687 342.54 80,902,000Counties Reporting -- 6
MELONS, WATERMELON (Tons) (Tons)
Fresno 3,300 25.64 84,600 213.00 18,020,000Imperial 773 27.04 20,900 363.49 7,597,000Kern 1,790 34.30 61,400 327.43 20,104,000Riverside 2,290 26.64 61,000 327.57 19,982,000San Joaquin 2,160 60.19 130,000 321.99 41,859,000Sum of Others 51 23.55 1,201 404.66 486,000STATE TOTAL 10,364 34.65 359,101 300.88 108,048,000Counties Reporting -- 6
MILK, MANUFACTURING (Cwt) (Cwt)
Butte 9,500Del Norte 140,000 26.94 3,772,000Fresno 28,200 15.78 445,000Glenn 21,800 16.88 368,000Humboldt 282,000 33.52 9,454,000Kern 16,800 16.07 270,000Kings 17,900 16.03 287,000Madera 21,900 15.21 333,000Merced 4,737,000 17.02 80,601,000San Bernardino 209,000 17.06 3,566,000Sonoma 4,080 32.35 132,000Stanislaus 2,443,000 16.79 41,018,000Tehama 3,130 19.81 62,000Tulare 255,000 16.60 4,233,000STATE TOTAL 8,179,810 17.67 144,550,500Counties Reporting -- 14
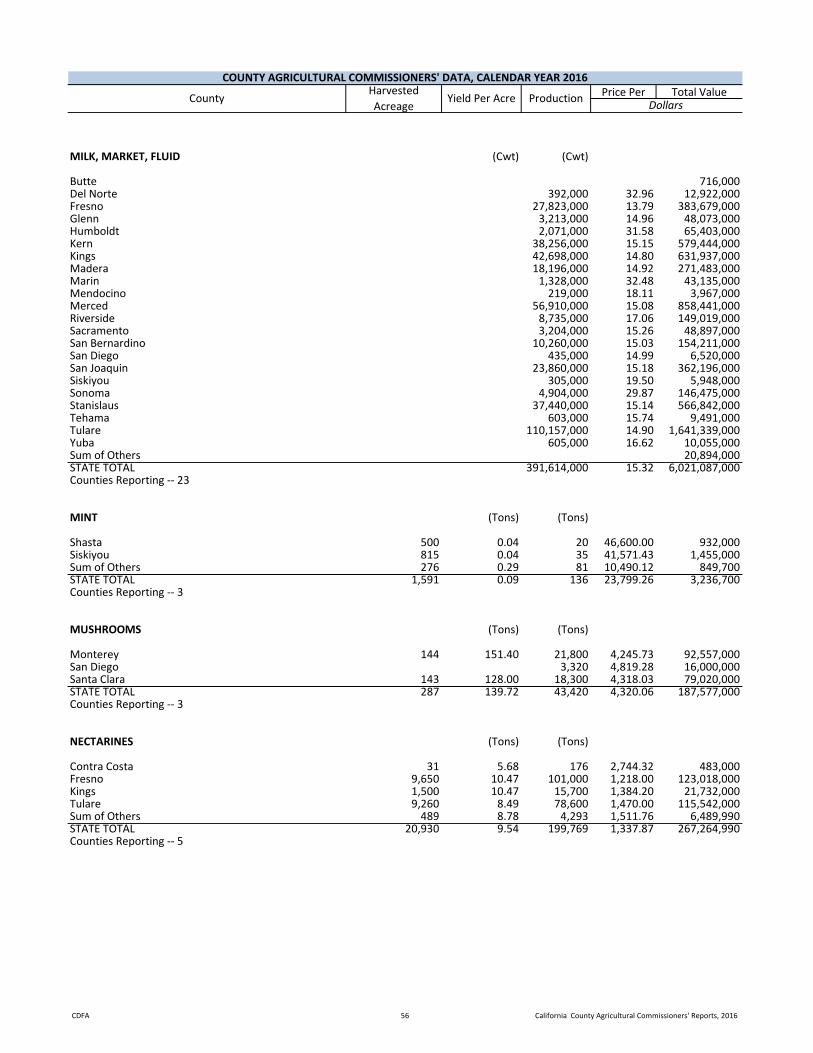
CDFA 56 California County Agricultural Commissioners' Reports, 2016
Price Per Total ValueCOUNTY AGRICULTURAL COMMISSIONERS' DATA, CALENDAR YEAR 2016
CountyHarvested Acreage
Yield Per Acre Production Dollars
MILK, MARKET, FLUID (Cwt) (Cwt)
Butte 716,000Del Norte 392,000 32.96 12,922,000Fresno 27,823,000 13.79 383,679,000Glenn 3,213,000 14.96 48,073,000Humboldt 2,071,000 31.58 65,403,000Kern 38,256,000 15.15 579,444,000Kings 42,698,000 14.80 631,937,000Madera 18,196,000 14.92 271,483,000Marin 1,328,000 32.48 43,135,000Mendocino 219,000 18.11 3,967,000Merced 56,910,000 15.08 858,441,000Riverside 8,735,000 17.06 149,019,000Sacramento 3,204,000 15.26 48,897,000San Bernardino 10,260,000 15.03 154,211,000San Diego 435,000 14.99 6,520,000San Joaquin 23,860,000 15.18 362,196,000Siskiyou 305,000 19.50 5,948,000Sonoma 4,904,000 29.87 146,475,000Stanislaus 37,440,000 15.14 566,842,000Tehama 603,000 15.74 9,491,000Tulare 110,157,000 14.90 1,641,339,000Yuba 605,000 16.62 10,055,000Sum of Others 20,894,000STATE TOTAL 391,614,000 15.32 6,021,087,000Counties Reporting -- 23
MINT (Tons) (Tons)
Shasta 500 0.04 20 46,600.00 932,000Siskiyou 815 0.04 35 41,571.43 1,455,000Sum of Others 276 0.29 81 10,490.12 849,700STATE TOTAL 1,591 0.09 136 23,799.26 3,236,700Counties Reporting -- 3
MUSHROOMS (Tons) (Tons)
Monterey 144 151.40 21,800 4,245.73 92,557,000San Diego 3,320 4,819.28 16,000,000Santa Clara 143 128.00 18,300 4,318.03 79,020,000STATE TOTAL 287 139.72 43,420 4,320.06 187,577,000Counties Reporting -- 3
NECTARINES (Tons) (Tons)
Contra Costa 31 5.68 176 2,744.32 483,000Fresno 9,650 10.47 101,000 1,218.00 123,018,000Kings 1,500 10.47 15,700 1,384.20 21,732,000Tulare 9,260 8.49 78,600 1,470.00 115,542,000Sum of Others 489 8.78 4,293 1,511.76 6,489,990STATE TOTAL 20,930 9.54 199,769 1,337.87 267,264,990Counties Reporting -- 5
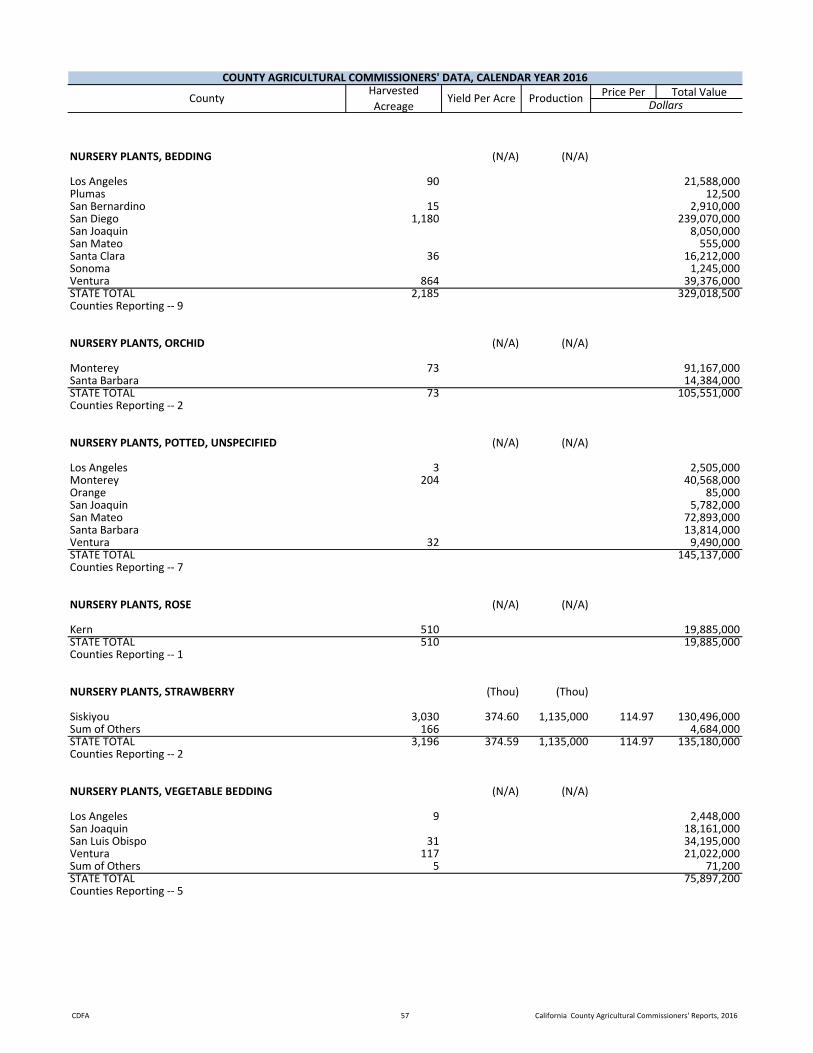
CDFA 57 California County Agricultural Commissioners' Reports, 2016
Price Per Total ValueCOUNTY AGRICULTURAL COMMISSIONERS' DATA, CALENDAR YEAR 2016
CountyHarvested Acreage
Yield Per Acre Production Dollars
NURSERY PLANTS, BEDDING (N/A) (N/A)
Los Angeles 90 21,588,000Plumas 12,500San Bernardino 15 2,910,000San Diego 1,180 239,070,000San Joaquin 8,050,000San Mateo 555,000Santa Clara 36 16,212,000Sonoma 1,245,000Ventura 864 39,376,000STATE TOTAL 2,185 329,018,500Counties Reporting -- 9
NURSERY PLANTS, ORCHID (N/A) (N/A)
Monterey 73 91,167,000Santa Barbara 14,384,000STATE TOTAL 73 105,551,000Counties Reporting -- 2
NURSERY PLANTS, POTTED, UNSPECIFIED (N/A) (N/A)
Los Angeles 3 2,505,000Monterey 204 40,568,000Orange 85,000San Joaquin 5,782,000San Mateo 72,893,000Santa Barbara 13,814,000Ventura 32 9,490,000STATE TOTAL 145,137,000Counties Reporting -- 7
NURSERY PLANTS, ROSE (N/A) (N/A)
Kern 510 19,885,000STATE TOTAL 510 19,885,000Counties Reporting -- 1
NURSERY PLANTS, STRAWBERRY (Thou) (Thou)
Siskiyou 3,030 374.60 1,135,000 114.97 130,496,000Sum of Others 166 4,684,000STATE TOTAL 3,196 374.59 1,135,000 114.97 135,180,000Counties Reporting -- 2
NURSERY PLANTS, VEGETABLE BEDDING (N/A) (N/A)
Los Angeles 9 2,448,000San Joaquin 18,161,000San Luis Obispo 31 34,195,000Ventura 117 21,022,000Sum of Others 5 71,200STATE TOTAL 75,897,200Counties Reporting -- 5

CDFA 58 California County Agricultural Commissioners' Reports, 2016
Price Per Total ValueCOUNTY AGRICULTURAL COMMISSIONERS' DATA, CALENDAR YEAR 2016
CountyHarvested Acreage
Yield Per Acre Production Dollars
NURSERY PRODUCTS, MISC. (N/A) (N/A)
Alameda 60 1,000,000Amador 192,000Butte 141 12,091,000Calaveras 165,000Contra Costa 6,629,000Del Norte 205,000El Dorado 36 2,567,000Fresno 107,134,000Humboldt 55,945,000Inyo 121 1,032,000Lake 43 925,000Los Angeles 574 13,382,000Madera 350 29,977,000Marin 9 360,000Mariposa 8 69,000Mendocino 1,560,000Merced 1,480 74,189,000Mono 20,000Monterey 305 47,704,000Napa 2,133,000Nevada 4 261,000Orange 1,049,000Placer 8,154,000Sacramento 563 30,702,000San Benito 130 7,686,000San Diego 710 16,639,000San Joaquin 26,879,000San Luis Obispo 110 14,030,000San Mateo 89 14,340,000Santa Barbara 49,464,000Santa Clara 184 36,344,000Santa Cruz 642 57,972,000Shasta 14,083,000Siskiyou 9,375,000Solano 39,754,000Sonoma 13,002,000Stanislaus 1,380 14,413,000Sutter 7 455,000Tehama 18,186,000Trinity 3,630Tulare 3,297,000Tuolumne 272,000Yolo 85 9,315,000Sum of Others 594 6,095,630STATE TOTAL 749,050,260Counties Reporting -- 44

CDFA 59 California County Agricultural Commissioners' Reports, 2016
Price Per Total ValueCOUNTY AGRICULTURAL COMMISSIONERS' DATA, CALENDAR YEAR 2016
CountyHarvested Acreage
Yield Per Acre Production Dollars
NURSERY, BULBS, LILY (N/A) (N/A)
Del Norte 340 6,737,000STATE TOTAL 340 6,737,000Counties Reporting -- 1
NURSERY, FLOWER PROPAGATIVE MATERIALS (N/A) (N/A)
Kern 2,962,000Monterey 127 56,195,000Riverside 153 4,712,000Ventura 1 6,543,000Sum of Others 4 243,000STATE TOTAL 285 70,655,000Counties Reporting -- 5
NURSERY, FLOWER SEEDS (N/A) (N/A)
Santa Barbara 624 6,316,000STATE TOTAL 624 6,316,000Counties Reporting -- 1
NURSERY, FRUIT/VINE/NUT, NON-BEARING (N/A) (N/A)
Kern 820 72,709,000San Diego 267 20,790,000San Joaquin 8,151,000Stanislaus 780 162,685,000Sutter 195 35,196,000Tulare 25,930,000Ventura 245 21,342,000Yolo 385 8,988,000Sum of Others 11 787,000STATE TOTAL 2,703 356,578,000Counties Reporting -- 9
NURSERY, HERBACIOUS PERERNNIALS (N/A) (N/A)
Fresno 4,121,000Kern 1,213,000San Bernardino 43 6,019,000Ventura 97 10,554,000STATE TOTAL 140 21,907,000Counties Reporting -- 4
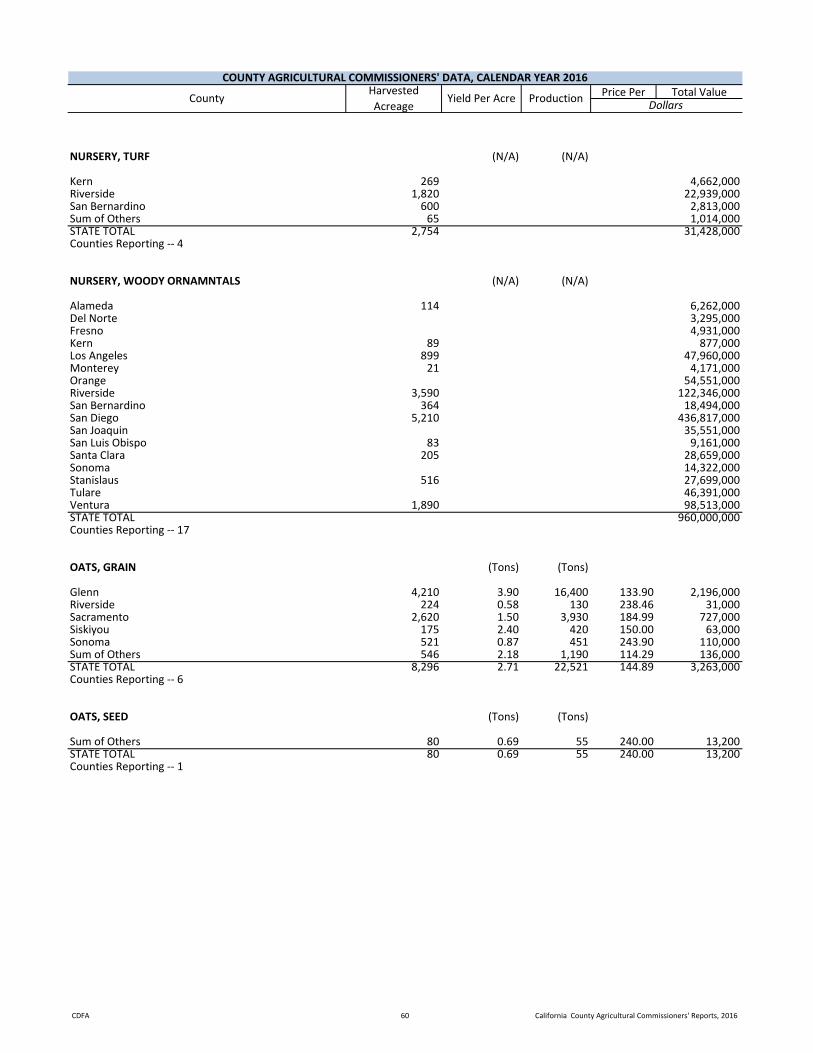
CDFA 60 California County Agricultural Commissioners' Reports, 2016
Price Per Total ValueCOUNTY AGRICULTURAL COMMISSIONERS' DATA, CALENDAR YEAR 2016
CountyHarvested Acreage
Yield Per Acre Production Dollars
NURSERY, TURF (N/A) (N/A)
Kern 269 4,662,000Riverside 1,820 22,939,000San Bernardino 600 2,813,000Sum of Others 65 1,014,000STATE TOTAL 2,754 31,428,000Counties Reporting -- 4
NURSERY, WOODY ORNAMNTALS (N/A) (N/A)
Alameda 114 6,262,000Del Norte 3,295,000Fresno 4,931,000Kern 89 877,000Los Angeles 899 47,960,000Monterey 21 4,171,000Orange 54,551,000Riverside 3,590 122,346,000San Bernardino 364 18,494,000San Diego 5,210 436,817,000San Joaquin 35,551,000San Luis Obispo 83 9,161,000Santa Clara 205 28,659,000Sonoma 14,322,000Stanislaus 516 27,699,000Tulare 46,391,000Ventura 1,890 98,513,000STATE TOTAL 960,000,000Counties Reporting -- 17
OATS, GRAIN (Tons) (Tons)
Glenn 4,210 3.90 16,400 133.90 2,196,000Riverside 224 0.58 130 238.46 31,000Sacramento 2,620 1.50 3,930 184.99 727,000Siskiyou 175 2.40 420 150.00 63,000Sonoma 521 0.87 451 243.90 110,000Sum of Others 546 2.18 1,190 114.29 136,000STATE TOTAL 8,296 2.71 22,521 144.89 3,263,000Counties Reporting -- 6
OATS, SEED (Tons) (Tons)
Sum of Others 80 0.69 55 240.00 13,200STATE TOTAL 80 0.69 55 240.00 13,200Counties Reporting -- 1
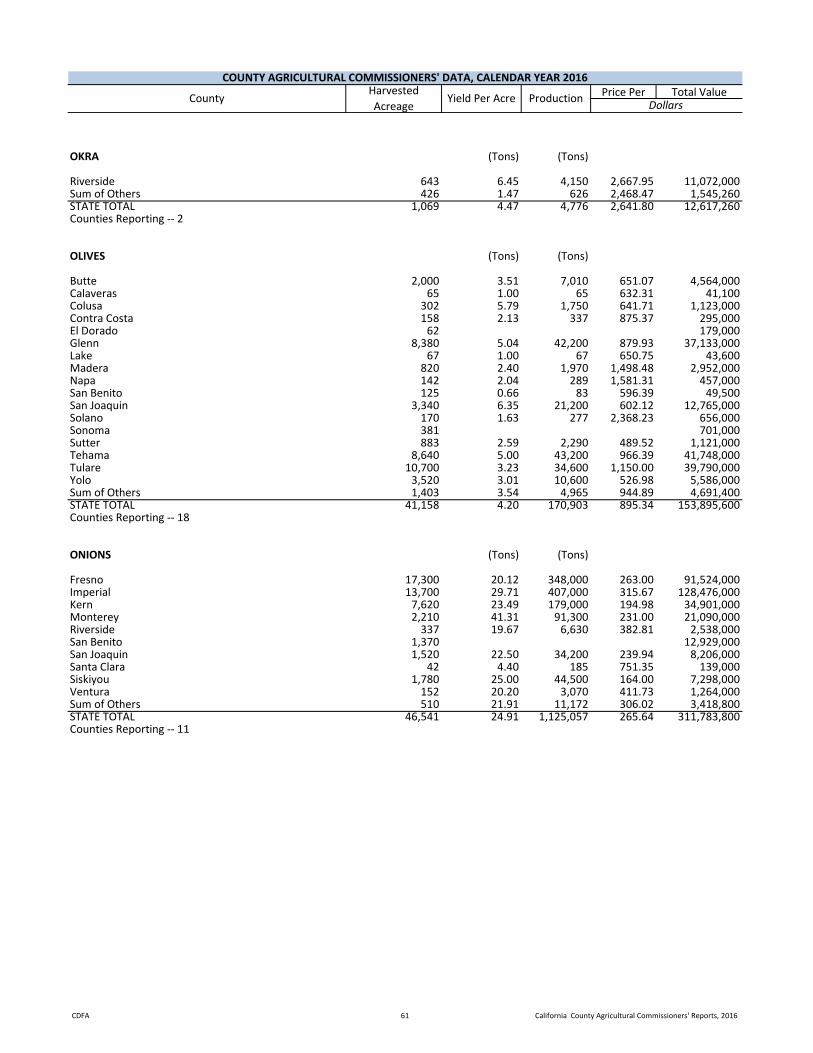
CDFA 61 California County Agricultural Commissioners' Reports, 2016
Price Per Total ValueCOUNTY AGRICULTURAL COMMISSIONERS' DATA, CALENDAR YEAR 2016
CountyHarvested Acreage
Yield Per Acre Production Dollars
OKRA (Tons) (Tons)
Riverside 643 6.45 4,150 2,667.95 11,072,000Sum of Others 426 1.47 626 2,468.47 1,545,260STATE TOTAL 1,069 4.47 4,776 2,641.80 12,617,260Counties Reporting -- 2
OLIVES (Tons) (Tons)
Butte 2,000 3.51 7,010 651.07 4,564,000Calaveras 65 1.00 65 632.31 41,100Colusa 302 5.79 1,750 641.71 1,123,000Contra Costa 158 2.13 337 875.37 295,000El Dorado 62 179,000Glenn 8,380 5.04 42,200 879.93 37,133,000Lake 67 1.00 67 650.75 43,600Madera 820 2.40 1,970 1,498.48 2,952,000Napa 142 2.04 289 1,581.31 457,000San Benito 125 0.66 83 596.39 49,500San Joaquin 3,340 6.35 21,200 602.12 12,765,000Solano 170 1.63 277 2,368.23 656,000Sonoma 381 701,000Sutter 883 2.59 2,290 489.52 1,121,000Tehama 8,640 5.00 43,200 966.39 41,748,000Tulare 10,700 3.23 34,600 1,150.00 39,790,000Yolo 3,520 3.01 10,600 526.98 5,586,000Sum of Others 1,403 3.54 4,965 944.89 4,691,400STATE TOTAL 41,158 4.20 170,903 895.34 153,895,600Counties Reporting -- 18
ONIONS (Tons) (Tons)
Fresno 17,300 20.12 348,000 263.00 91,524,000Imperial 13,700 29.71 407,000 315.67 128,476,000Kern 7,620 23.49 179,000 194.98 34,901,000Monterey 2,210 41.31 91,300 231.00 21,090,000Riverside 337 19.67 6,630 382.81 2,538,000San Benito 1,370 12,929,000San Joaquin 1,520 22.50 34,200 239.94 8,206,000Santa Clara 42 4.40 185 751.35 139,000Siskiyou 1,780 25.00 44,500 164.00 7,298,000Ventura 152 20.20 3,070 411.73 1,264,000Sum of Others 510 21.91 11,172 306.02 3,418,800STATE TOTAL 46,541 24.91 1,125,057 265.64 311,783,800Counties Reporting -- 11
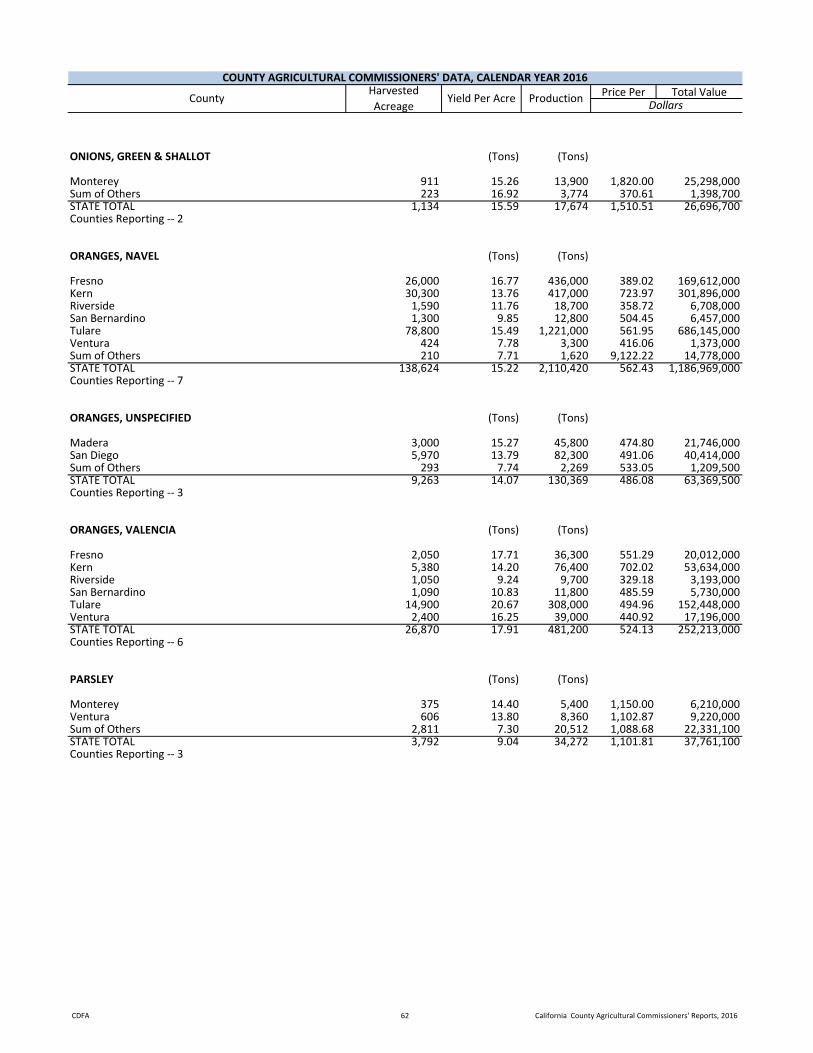
CDFA 62 California County Agricultural Commissioners' Reports, 2016
Price Per Total ValueCOUNTY AGRICULTURAL COMMISSIONERS' DATA, CALENDAR YEAR 2016
CountyHarvested Acreage
Yield Per Acre Production Dollars
ONIONS, GREEN & SHALLOT (Tons) (Tons)
Monterey 911 15.26 13,900 1,820.00 25,298,000Sum of Others 223 16.92 3,774 370.61 1,398,700STATE TOTAL 1,134 15.59 17,674 1,510.51 26,696,700Counties Reporting -- 2
ORANGES, NAVEL (Tons) (Tons)
Fresno 26,000 16.77 436,000 389.02 169,612,000Kern 30,300 13.76 417,000 723.97 301,896,000Riverside 1,590 11.76 18,700 358.72 6,708,000San Bernardino 1,300 9.85 12,800 504.45 6,457,000Tulare 78,800 15.49 1,221,000 561.95 686,145,000Ventura 424 7.78 3,300 416.06 1,373,000Sum of Others 210 7.71 1,620 9,122.22 14,778,000STATE TOTAL 138,624 15.22 2,110,420 562.43 1,186,969,000Counties Reporting -- 7
ORANGES, UNSPECIFIED (Tons) (Tons)
Madera 3,000 15.27 45,800 474.80 21,746,000San Diego 5,970 13.79 82,300 491.06 40,414,000Sum of Others 293 7.74 2,269 533.05 1,209,500STATE TOTAL 9,263 14.07 130,369 486.08 63,369,500Counties Reporting -- 3
ORANGES, VALENCIA (Tons) (Tons)
Fresno 2,050 17.71 36,300 551.29 20,012,000Kern 5,380 14.20 76,400 702.02 53,634,000Riverside 1,050 9.24 9,700 329.18 3,193,000San Bernardino 1,090 10.83 11,800 485.59 5,730,000Tulare 14,900 20.67 308,000 494.96 152,448,000Ventura 2,400 16.25 39,000 440.92 17,196,000STATE TOTAL 26,870 17.91 481,200 524.13 252,213,000Counties Reporting -- 6
PARSLEY (Tons) (Tons)
Monterey 375 14.40 5,400 1,150.00 6,210,000Ventura 606 13.80 8,360 1,102.87 9,220,000Sum of Others 2,811 7.30 20,512 1,088.68 22,331,100STATE TOTAL 3,792 9.04 34,272 1,101.81 37,761,100Counties Reporting -- 3

CDFA 63 California County Agricultural Commissioners' Reports, 2016
Price Per Total ValueCOUNTY AGRICULTURAL COMMISSIONERS' DATA, CALENDAR YEAR 2016
CountyHarvested Acreage
Yield Per Acre Production Dollars
PASTURE, FORAGE, MISC. (N/A) (N/A)
Del Norte 15,500 1,085,000Imperial 1,358,000Kern 1,153,000Lassen 20,000 500,000Madera 1,900 514,000Mendocino 363,000 4,950,000Merced 50,000Plumas 45,000 1,035,000San Luis Obispo 6,080 61,000Sierra 21,000 315,000Tehama 6,150 53,800Sum of Others 3,790 1,666,000STATE TOTAL 482,420 12,740,800Counties Reporting -- 12
PASTURE, IRRIGATED (N/A) (N/A)
Alpine 2,700 378,000Amador 2,050 205,000Butte 14,000 2,102,000Calaveras 2,000 300,000Colusa 1,100 183,000Contra Costa 5,450 1,635,000Del Norte 3,800 897,000El Dorado 1,580 221,000Glenn 9,530 1,572,000Inyo 14,000 980,000Kern 7,000 980,000Lake 700 70,000Lassen 23,000 5,520,000Madera 1,800 270,000Mariposa 500 60,000Mendocino 3,500 820,000Merced 25,000 4,355,000Mono 26,000 1,820,000Nevada 10,000 1,800,000Placer 18,000 2,700,000Plumas 27,000 3,510,000Riverside 2,500 350,000Sacramento 16,800 2,352,000San Benito 340 93,500San Bernardino 358 23,600San Diego 902 1,745,000San Joaquin 14,500 3,886,000San Mateo 181 28,000Santa Barbara 3,770 722,000Santa Clara 342 75,000Shasta 28,000 3,920,000Sierra 10,000 1,300,000Siskiyou 89,200 6,854,000Solano 21,600 2,498,000Sonoma 8,260 751,000Stanislaus 32,500 9,458,000Sutter 10,000 1,400,000Tehama 19,000 4,275,000Trinity 1,660 165,000Tulare 93,000 27,063,000Tuolumne 1,120 112,000Yolo 12,400 1,550,000Yuba 8,840 1,590,000Sum of Others 10,025 2,157,500STATE TOTAL 584,008 102,746,600Counties Reporting -- 44
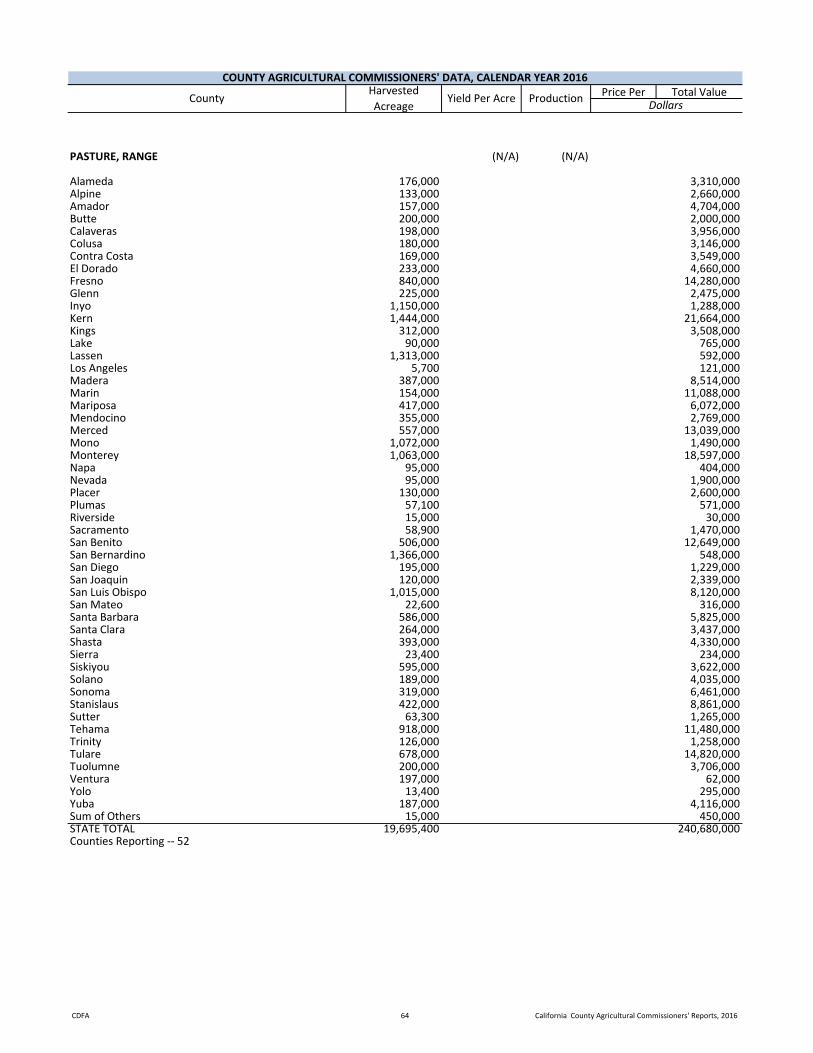
CDFA 64 California County Agricultural Commissioners' Reports, 2016
Price Per Total ValueCOUNTY AGRICULTURAL COMMISSIONERS' DATA, CALENDAR YEAR 2016
CountyHarvested Acreage
Yield Per Acre Production Dollars
PASTURE, RANGE (N/A) (N/A)
Alameda 176,000 3,310,000Alpine 133,000 2,660,000Amador 157,000 4,704,000Butte 200,000 2,000,000Calaveras 198,000 3,956,000Colusa 180,000 3,146,000Contra Costa 169,000 3,549,000El Dorado 233,000 4,660,000Fresno 840,000 14,280,000Glenn 225,000 2,475,000Inyo 1,150,000 1,288,000Kern 1,444,000 21,664,000Kings 312,000 3,508,000Lake 90,000 765,000Lassen 1,313,000 592,000Los Angeles 5,700 121,000Madera 387,000 8,514,000Marin 154,000 11,088,000Mariposa 417,000 6,072,000Mendocino 355,000 2,769,000Merced 557,000 13,039,000Mono 1,072,000 1,490,000Monterey 1,063,000 18,597,000Napa 95,000 404,000Nevada 95,000 1,900,000Placer 130,000 2,600,000Plumas 57,100 571,000Riverside 15,000 30,000Sacramento 58,900 1,470,000San Benito 506,000 12,649,000San Bernardino 1,366,000 548,000San Diego 195,000 1,229,000San Joaquin 120,000 2,339,000San Luis Obispo 1,015,000 8,120,000San Mateo 22,600 316,000Santa Barbara 586,000 5,825,000Santa Clara 264,000 3,437,000Shasta 393,000 4,330,000Sierra 23,400 234,000Siskiyou 595,000 3,622,000Solano 189,000 4,035,000Sonoma 319,000 6,461,000Stanislaus 422,000 8,861,000Sutter 63,300 1,265,000Tehama 918,000 11,480,000Trinity 126,000 1,258,000Tulare 678,000 14,820,000Tuolumne 200,000 3,706,000Ventura 197,000 62,000Yolo 13,400 295,000Yuba 187,000 4,116,000Sum of Others 15,000 450,000STATE TOTAL 19,695,400 240,680,000Counties Reporting -- 52

CDFA 65 California County Agricultural Commissioners' Reports, 2016
Price Per Total ValueCOUNTY AGRICULTURAL COMMISSIONERS' DATA, CALENDAR YEAR 2016
CountyHarvested Acreage
Yield Per Acre Production Dollars
PEACHES, CLINGSTONE (Tons) (Tons)
Butte 1,380 12.39 17,100 575.85 9,847,000Fresno 1,350 18.22 24,600 491.02 12,079,000Kings 703 18.21 12,800 498.83 6,385,000Madera 210 15.71 3,300 507.58 1,675,000Merced 1,350 16.67 22,500 490.89 11,045,000San Joaquin 1,150 18.78 21,600 498.38 10,765,000Stanislaus 4,980 24.30 121,000 491.00 59,411,000Sutter 7,250 16.00 116,000 489.66 56,801,000Tulare 1,220 20.33 24,800 496.01 12,301,000Yuba 3,330 15.02 50,000 474.82 23,741,000Sum of Others 131 20.00 2,620 812.98 2,130,000STATE TOTAL 23,054 18.06 416,320 495.24 206,180,000Counties Reporting -- 11
PEACHES, FREESTONE (Tons) (Tons)
Fresno 13,200 10.91 144,000 1,238.00 178,272,000Kings 1,890 11.22 21,200 1,200.75 25,456,000Madera 410 26.10 10,700 467.10 4,998,000Merced 1,460 24.52 35,800 463.10 16,579,000San Joaquin 617 16.14 9,960 473.90 4,720,000Stanislaus 478 12.13 5,800 1,500.00 8,700,000Tulare 11,300 8.35 94,400 1,090.66 102,958,000Sum of Others 454 9.45 4,289 2,106.23 9,033,600STATE TOTAL 29,809 10.94 326,149 1,075.33 350,716,600Counties Reporting -- 8
PEACHES, UNSPECIFIED (Tons) (Tons)
Contra Costa 125 5.88 735 2,491.16 1,831,000El Dorado 110 3.36 370 5,000.00 1,850,000Placer 67 2.31 155 2,264.52 351,000Riverside 39 1.23 48 2,000.00 96,000Sum of Others 764 11.71 8,950 1,289.50 11,541,000STATE TOTAL 1,105 9.28 10,258 1,527.49 15,669,000Counties Reporting -- 5
PEARS, ASIAN (Tons) (Tons)
El Dorado 40 6.20 248 4,850.81 1,203,000Fresno 1,200 19.33 23,200 1,263.02 29,302,000Sum of Others 46 25.26 1,162 763.51 887,200STATE TOTAL 1,286 19.14 24,610 1,275.59 31,392,200Counties Reporting -- 3
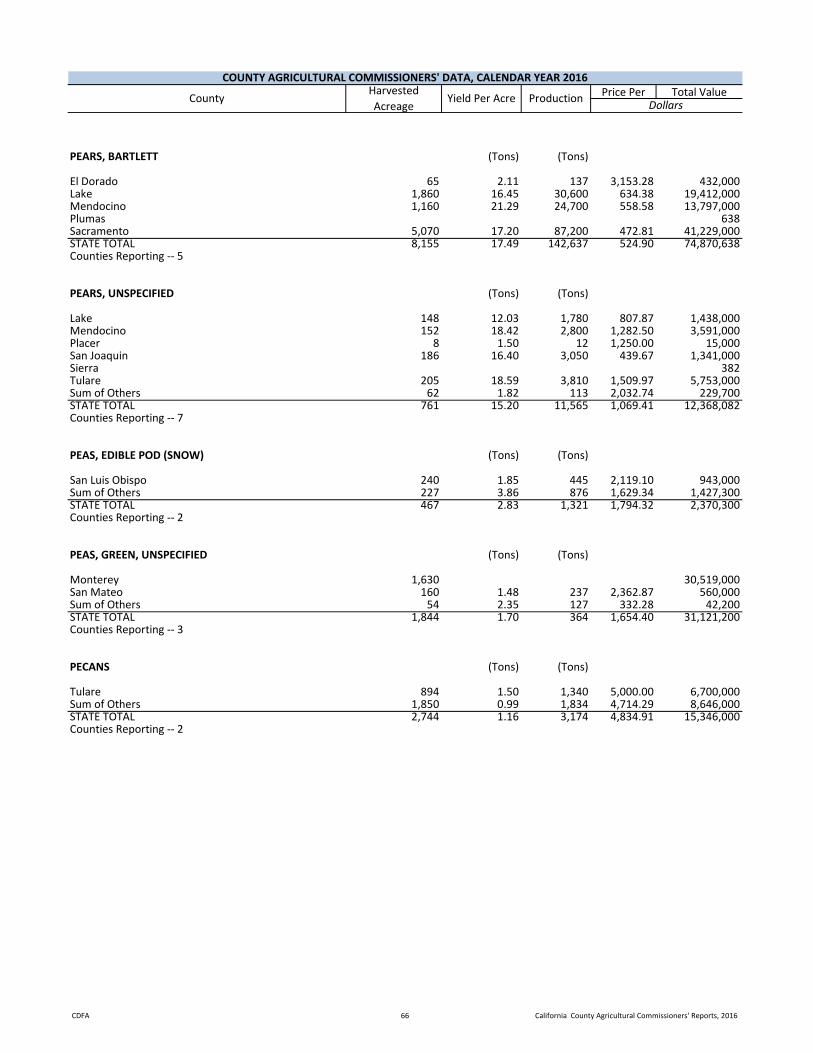
CDFA 66 California County Agricultural Commissioners' Reports, 2016
Price Per Total ValueCOUNTY AGRICULTURAL COMMISSIONERS' DATA, CALENDAR YEAR 2016
CountyHarvested Acreage
Yield Per Acre Production Dollars
PEARS, BARTLETT (Tons) (Tons)
El Dorado 65 2.11 137 3,153.28 432,000Lake 1,860 16.45 30,600 634.38 19,412,000Mendocino 1,160 21.29 24,700 558.58 13,797,000Plumas 638Sacramento 5,070 17.20 87,200 472.81 41,229,000STATE TOTAL 8,155 17.49 142,637 524.90 74,870,638Counties Reporting -- 5
PEARS, UNSPECIFIED (Tons) (Tons)
Lake 148 12.03 1,780 807.87 1,438,000Mendocino 152 18.42 2,800 1,282.50 3,591,000Placer 8 1.50 12 1,250.00 15,000San Joaquin 186 16.40 3,050 439.67 1,341,000Sierra 382Tulare 205 18.59 3,810 1,509.97 5,753,000Sum of Others 62 1.82 113 2,032.74 229,700STATE TOTAL 761 15.20 11,565 1,069.41 12,368,082Counties Reporting -- 7
PEAS, EDIBLE POD (SNOW) (Tons) (Tons)
San Luis Obispo 240 1.85 445 2,119.10 943,000Sum of Others 227 3.86 876 1,629.34 1,427,300STATE TOTAL 467 2.83 1,321 1,794.32 2,370,300Counties Reporting -- 2
PEAS, GREEN, UNSPECIFIED (Tons) (Tons)
Monterey 1,630 30,519,000San Mateo 160 1.48 237 2,362.87 560,000Sum of Others 54 2.35 127 332.28 42,200STATE TOTAL 1,844 1.70 364 1,654.40 31,121,200Counties Reporting -- 3
PECANS (Tons) (Tons)
Tulare 894 1.50 1,340 5,000.00 6,700,000Sum of Others 1,850 0.99 1,834 4,714.29 8,646,000STATE TOTAL 2,744 1.16 3,174 4,834.91 15,346,000Counties Reporting -- 2
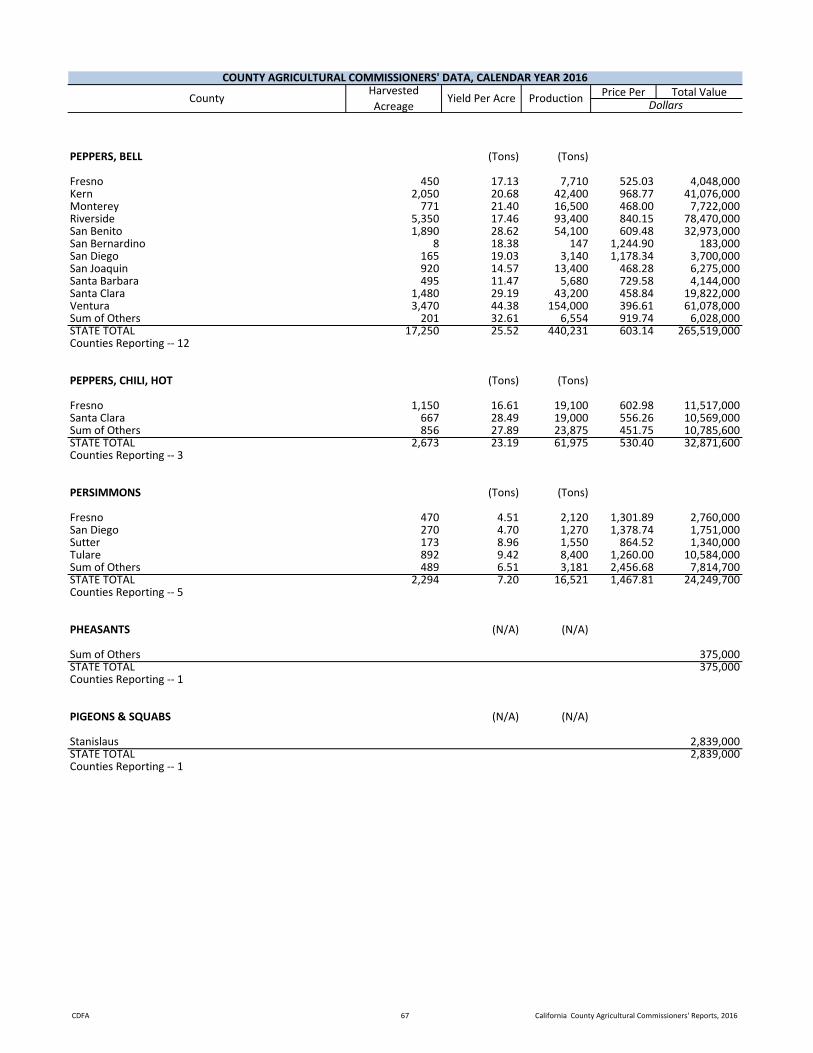
CDFA 67 California County Agricultural Commissioners' Reports, 2016
Price Per Total ValueCOUNTY AGRICULTURAL COMMISSIONERS' DATA, CALENDAR YEAR 2016
CountyHarvested Acreage
Yield Per Acre Production Dollars
PEPPERS, BELL (Tons) (Tons)
Fresno 450 17.13 7,710 525.03 4,048,000Kern 2,050 20.68 42,400 968.77 41,076,000Monterey 771 21.40 16,500 468.00 7,722,000Riverside 5,350 17.46 93,400 840.15 78,470,000San Benito 1,890 28.62 54,100 609.48 32,973,000San Bernardino 8 18.38 147 1,244.90 183,000San Diego 165 19.03 3,140 1,178.34 3,700,000San Joaquin 920 14.57 13,400 468.28 6,275,000Santa Barbara 495 11.47 5,680 729.58 4,144,000Santa Clara 1,480 29.19 43,200 458.84 19,822,000Ventura 3,470 44.38 154,000 396.61 61,078,000Sum of Others 201 32.61 6,554 919.74 6,028,000STATE TOTAL 17,250 25.52 440,231 603.14 265,519,000Counties Reporting -- 12
PEPPERS, CHILI, HOT (Tons) (Tons)
Fresno 1,150 16.61 19,100 602.98 11,517,000Santa Clara 667 28.49 19,000 556.26 10,569,000Sum of Others 856 27.89 23,875 451.75 10,785,600STATE TOTAL 2,673 23.19 61,975 530.40 32,871,600Counties Reporting -- 3
PERSIMMONS (Tons) (Tons)
Fresno 470 4.51 2,120 1,301.89 2,760,000San Diego 270 4.70 1,270 1,378.74 1,751,000Sutter 173 8.96 1,550 864.52 1,340,000Tulare 892 9.42 8,400 1,260.00 10,584,000Sum of Others 489 6.51 3,181 2,456.68 7,814,700STATE TOTAL 2,294 7.20 16,521 1,467.81 24,249,700Counties Reporting -- 5
PHEASANTS (N/A) (N/A)
Sum of Others 375,000STATE TOTAL 375,000Counties Reporting -- 1
PIGEONS & SQUABS (N/A) (N/A)
Stanislaus 2,839,000STATE TOTAL 2,839,000Counties Reporting -- 1

CDFA 68 California County Agricultural Commissioners' Reports, 2016
Price Per Total ValueCOUNTY AGRICULTURAL COMMISSIONERS' DATA, CALENDAR YEAR 2016
CountyHarvested Acreage
Yield Per Acre Production Dollars
PISTACHIOS (Tons) (Tons)
Butte 765 1.00 765 3,826.14 2,927,000Fresno 94,000 1.54 145,000 1,746.00 253,170,000Glenn 1,950 1.69 3,290 3,996.35 13,148,000Kern 110,000 1.62 178,000 4,321.67 769,258,000Kings 21,900 1.89 41,500 4,303.33 178,588,000Madera 33,500 1.75 58,600 3,986.71 233,621,000Merced 6,210 1.39 8,640 3,368.63 29,105,000Tehama 311 0.89 277 4,079.42 1,130,000Tulare 60,800 1.28 77,800 4,360.00 339,208,000Sum of Others 390 1.30 507 5,355.03 2,715,000STATE TOTAL 329,826 1.56 514,379 3,543.83 1,822,870,000Counties Reporting -- 10
PLUMCOTS (Tons) (Tons)
Fresno 1,200 8.31 9,970 1,970.01 19,641,000Sum of Others 1 19,700STATE TOTAL 1,201 8.31 9,970 1,970.01 19,660,700Counties Reporting -- 2
PLUMS (Tons) (Tons)
Contra Costa 38 5.45 207 3,231.88 669,000El Dorado 52 3.33 173 4,202.31 727,000Fresno 9,340 9.14 85,400 1,540.00 131,516,000Kings 2,140 7.76 16,600 1,411.39 23,429,000Sierra 125Tulare 8,540 9.59 81,900 1,260.00 103,194,000Sum of Others 338 6.51 2,201 1,531.08 3,369,900STATE TOTAL 20,448 9.12 186,481 1,409.82 262,905,025Counties Reporting -- 7
PLUMS, DRIED (Tons) (Tons)
Butte 6,570 1.99 13,100 2,366.56 31,002,000Colusa 711 1.18 839 2,300.36 1,930,000Fresno 969 2.98 2,890 2,176.12 6,289,000Glenn 3,770 1.61 6,070 2,264.09 13,743,000Madera 1,000 3.17 3,170 2,431.86 7,709,000Merced 1,480 3.91 5,780 1,051.38 6,077,000Placer 14 0.57 8 3,125.00 25,000Solano 1,190 1.46 1,740 1,917.24 3,336,000Sutter 14,300 0.86 12,300 1,997.48 24,569,000Tehama 6,090 1.34 8,170 2,211.63 18,069,000Tulare 3,100 7.16 22,200 1,650.00 36,630,000Yolo 1,800 0.85 1,530 2,050.33 3,137,000Yuba 8,540 1.50 12,800 1,951.33 24,977,000Sum of Others 5 4.20 21 2,252.38 47,300STATE TOTAL 49,539 1.83 90,618 1,959.22 177,540,300Counties Reporting -- 14
POMEGRANATES (Tons) (Tons)
Fresno 3,880 10.05 39,000 362.28 14,129,000Riverside 15 7.00 105 1,085.71 114,000Tulare 2,960 3.78 11,200 670.98 7,515,000Sum of Others 10,682 14.99 160,120 735.18 117,717,700STATE TOTAL 17,537 12.00 210,425 662.83 139,475,700Counties Reporting -- 4
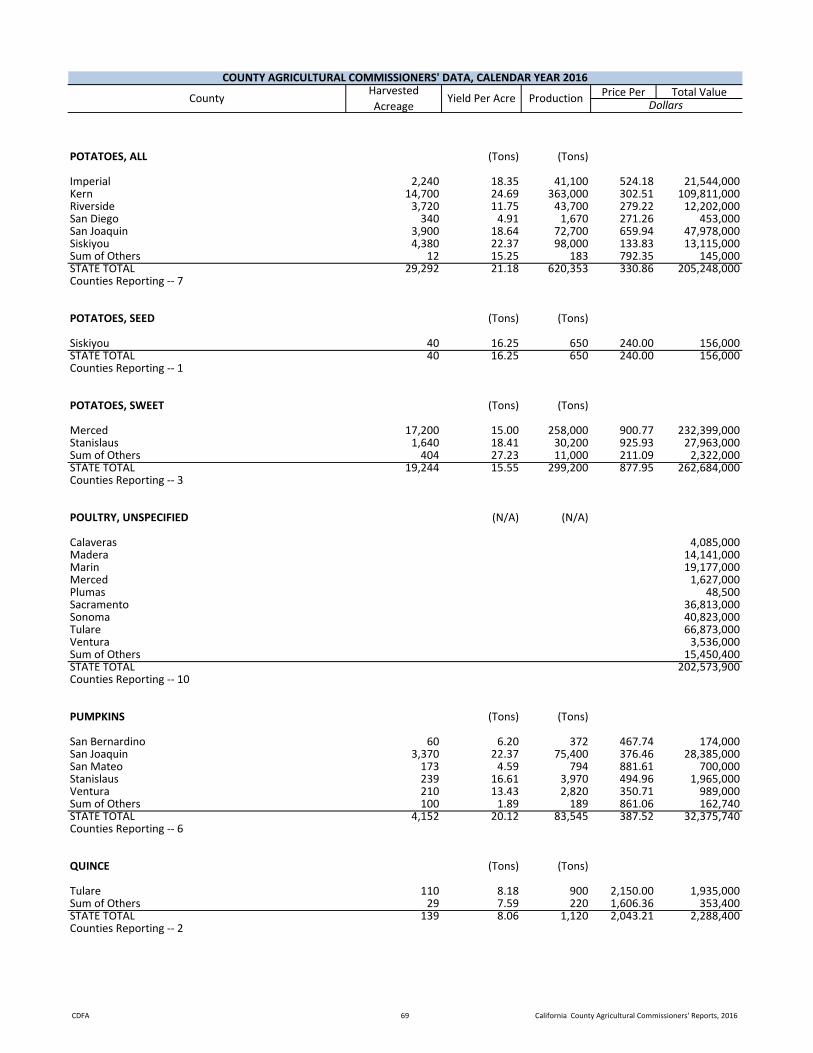
CDFA 69 California County Agricultural Commissioners' Reports, 2016
Price Per Total ValueCOUNTY AGRICULTURAL COMMISSIONERS' DATA, CALENDAR YEAR 2016
CountyHarvested Acreage
Yield Per Acre Production Dollars
POTATOES, ALL (Tons) (Tons)
Imperial 2,240 18.35 41,100 524.18 21,544,000Kern 14,700 24.69 363,000 302.51 109,811,000Riverside 3,720 11.75 43,700 279.22 12,202,000San Diego 340 4.91 1,670 271.26 453,000San Joaquin 3,900 18.64 72,700 659.94 47,978,000Siskiyou 4,380 22.37 98,000 133.83 13,115,000Sum of Others 12 15.25 183 792.35 145,000STATE TOTAL 29,292 21.18 620,353 330.86 205,248,000Counties Reporting -- 7
POTATOES, SEED (Tons) (Tons)
Siskiyou 40 16.25 650 240.00 156,000STATE TOTAL 40 16.25 650 240.00 156,000Counties Reporting -- 1
POTATOES, SWEET (Tons) (Tons)
Merced 17,200 15.00 258,000 900.77 232,399,000Stanislaus 1,640 18.41 30,200 925.93 27,963,000Sum of Others 404 27.23 11,000 211.09 2,322,000STATE TOTAL 19,244 15.55 299,200 877.95 262,684,000Counties Reporting -- 3
POULTRY, UNSPECIFIED (N/A) (N/A)
Calaveras 4,085,000Madera 14,141,000Marin 19,177,000Merced 1,627,000Plumas 48,500Sacramento 36,813,000Sonoma 40,823,000Tulare 66,873,000Ventura 3,536,000Sum of Others 15,450,400STATE TOTAL 202,573,900Counties Reporting -- 10
PUMPKINS (Tons) (Tons)
San Bernardino 60 6.20 372 467.74 174,000San Joaquin 3,370 22.37 75,400 376.46 28,385,000San Mateo 173 4.59 794 881.61 700,000Stanislaus 239 16.61 3,970 494.96 1,965,000Ventura 210 13.43 2,820 350.71 989,000Sum of Others 100 1.89 189 861.06 162,740STATE TOTAL 4,152 20.12 83,545 387.52 32,375,740Counties Reporting -- 6
QUINCE (Tons) (Tons)
Tulare 110 8.18 900 2,150.00 1,935,000Sum of Others 29 7.59 220 1,606.36 353,400STATE TOTAL 139 8.06 1,120 2,043.21 2,288,400Counties Reporting -- 2

CDFA 70 California County Agricultural Commissioners' Reports, 2016
Price Per Total ValueCOUNTY AGRICULTURAL COMMISSIONERS' DATA, CALENDAR YEAR 2016
CountyHarvested Acreage
Yield Per Acre Production Dollars
RADISHES (Tons) (Tons)
Monterey 164 13.78 2,260 999.12 2,258,000Riverside 101 7.52 760 1,064.47 809,000San Bernardino 21 16.43 345 1,982.61 684,000Ventura 796 17.96 14,300 615.03 8,795,000Sum of Others 324 14.92 4,833 751.56 3,632,290STATE TOTAL 1,406 16.00 22,498 719.10 16,178,290Counties Reporting -- 5
RICE, MILLING (Tons) (Tons)
Butte 95,000 4.71 447,000 274.82 122,846,000Colusa 140,000 4.56 639,000 318.93 203,796,000Glenn 77,400 4.90 379,000 264.18 100,125,000Placer 11,300 3.96 44,700 282.66 12,635,000Sacramento 8,840 4.00 35,400 236.05 8,356,000San Joaquin 4,410 3.49 15,400 276.10 4,252,000Sutter 113,000 4.37 494,000 247.09 122,061,000Yolo 35,800 4.25 152,000 283.00 43,016,000Yuba 37,900 5.09 193,000 200.42 38,682,000Sum of Others 3,835 2.49 9,557 569.84 5,446,000STATE TOTAL 527,485 4.57 2,409,057 274.47 661,215,000Counties Reporting -- 10
RICE, SEED (Tons) (Tons)
Butte 4,640 4.98 23,100 540.30 12,481,000Colusa 10,000 4.59 45,900 359.98 16,523,000Glenn 2,250 4.89 11,000 320.45 3,525,000Sutter 2,830 4.35 12,300 439.67 5,408,000STATE TOTAL 19,720 4.68 92,300 411.02 37,937,000Counties Reporting -- 4
RICE, WILD (Tons) (Tons)
Lassen 1,460 0.60 878 1,859.91 1,633,000Shasta 5,800 0.80 4,640 1,859.91 8,630,000Sutter 1,950 1.05 2,050 1,981.95 4,063,000Sum of Others 85 0.91 77 2,480.52 191,000STATE TOTAL 9,295 0.82 7,645 1,898.89 14,517,000Counties Reporting -- 4
RUTABAGAS (Tons) (Tons)
Sum of Others 46 0.50 23 1,372.17 31,560STATE TOTAL 46 0.50 23 1,372.17 31,560Counties Reporting -- 1
RYE, GRAIN (Tons) (Tons)
Siskiyou 700 0.50 350 275.14 96,300Sum of Others 292 4.42 1,290 184.50 238,000STATE TOTAL 992 1.65 1,640 203.84 334,300Counties Reporting -- 2

CDFA 71 California County Agricultural Commissioners' Reports, 2016
Price Per Total ValueCOUNTY AGRICULTURAL COMMISSIONERS' DATA, CALENDAR YEAR 2016
CountyHarvested Acreage
Yield Per Acre Production Dollars
RYE, SEED (Tons) (Tons)
Siskiyou 150 1.50 225 275.11 61,900STATE TOTAL 150 1.50 225 275.11 61,900Counties Reporting -- 1
RYEGRASS, PERENNIAL, ALL (N/A) (N/A)
Sacramento 5,280 2.10 11,100 67.66 751,000STATE TOTAL 5,280 2.10 11,100 67.66 751,000Counties Reporting -- 1
SAFFLOWER (Tons) (Tons)
Butte 219 1.82 399 441.10 176,000Colusa 2,660 0.89 2,360 401.27 947,000Sacramento 4,260 1.21 5,150 439.81 2,265,000San Joaquin 6,550 1.40 9,170 459.43 4,213,000Solano 2,980 1.12 3,340 430.54 1,438,000Sutter 3,610 1.08 3,900 427.18 1,666,000Yolo 4,870 1.03 5,000 435.00 2,175,000Sum of Others 6,152 1.24 7,643 447.47 3,420,000STATE TOTAL 31,301 1.18 36,962 440.99 16,300,000Counties Reporting -- 8
SAFFLOWER, SEED, PLANTING (Tons) (Tons)
Sutter 662 1.08 715 419.58 300,000STATE TOTAL 662 1.08 715 419.58 300,000Counties Reporting -- 1
SALAD GREENS MISC. (Tons) (Tons)
Imperial 2,970 5.69 16,900 1,657.57 28,013,000Los Angeles 8 177,000Monterey 7,900 6.70 52,900 825.01 43,643,000Santa Clara 1,130 4.01 4,530 923.40 4,183,000Sum of Others 1,529 3.03 4,627 2,411.71 11,159,000STATE TOTAL 13,537 5.84 78,957 1,101.84 87,175,000Counties Reporting -- 5
SEED, ALFALFA (Tons) (Tons)
Fresno 6,550 0.34 2,210 6,701.36 14,810,000Imperial 41,100 0.32 13,300 6,384.29 84,911,000Sum of Others 314 0.27 85 5,647.06 480,000STATE TOTAL 47,964 0.33 15,595 6,425.20 100,201,000Counties Reporting -- 3
SEED, BERMUDA GRASS (Tons) (Tons)
Imperial 20,800 0.15 3,190 6,278.06 20,027,000STATE TOTAL 20,800 0.15 3,190 6,278.06 20,027,000Counties Reporting -- 1

CDFA 72 California County Agricultural Commissioners' Reports, 2016
Price Per Total ValueCOUNTY AGRICULTURAL COMMISSIONERS' DATA, CALENDAR YEAR 2016
CountyHarvested Acreage
Yield Per Acre Production Dollars
SEED, CLOVER, UNSPECIFIED (N/A) (N/A)
Sacramento 1,380 405.80 560,000 2.15 1,203,000STATE TOTAL 1,380 405.80 560,000 2.15 1,203,000Counties Reporting -- 1
SEED, GRASS, UNSPECIFIED (N/A) (N/A)
Imperial 278 31,300Yolo 1,130 6,221,000STATE TOTAL 1,408 6,252,300Counties Reporting -- 2
SEED, OTHER (NO FLOWERS) (N/A) (N/A)
Yolo 6,910 21,171,000Sum of Others 3,630STATE TOTAL 6,910 21,174,630Counties Reporting -- 2
SEED, VEGETABLE & VINECROP (N/A) (N/A)
Colusa 8,040 21,714,000Fresno 1,370 5,893,000Glenn 3,500 16,477,000Imperial 684 1,424,000Kern 1,100 9,371,000Santa Clara 503 2,221,000Solano 140 218,000Sutter 2,170 7,429,000Yolo 2,490 3,671,000Sum of Others 1,070 10,065,000STATE TOTAL 21,067 78,483,000Counties Reporting -- 10
SHEEP (N/A) (N/A)
Plumas 16,400Sierra 23,200Siskiyou 144,000Sum of Others 111,700STATE TOTAL 295,300Counties Reporting -- 4
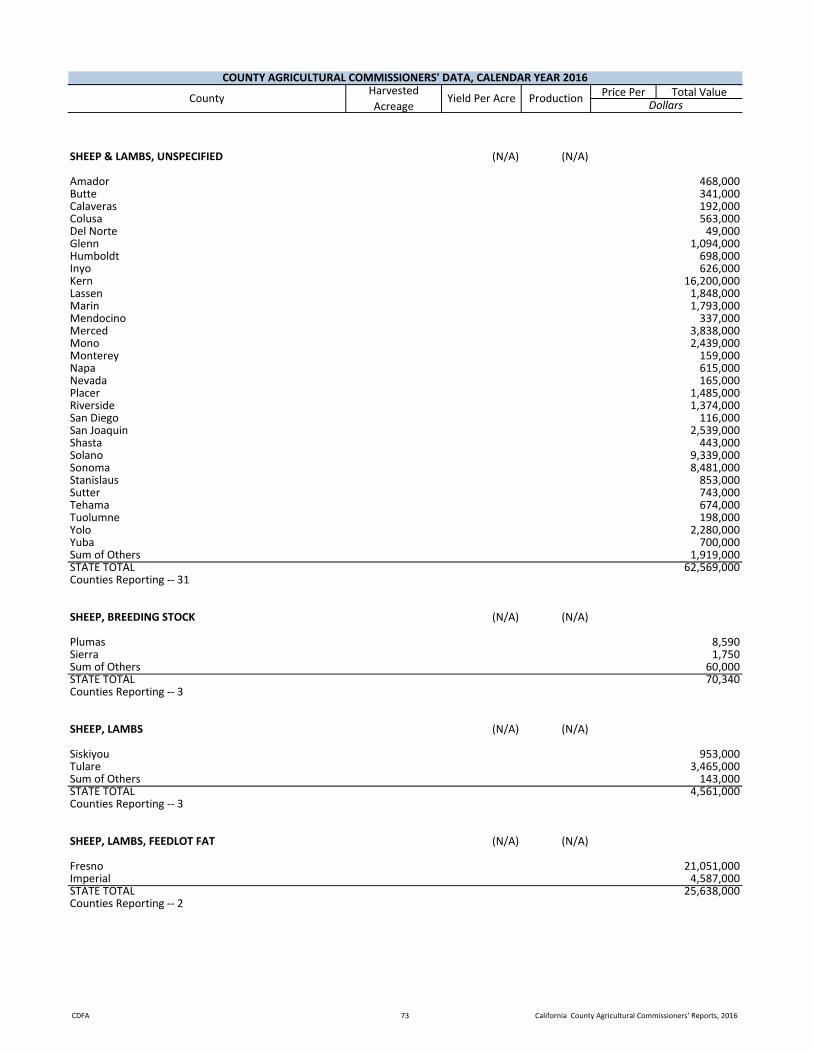
CDFA 73 California County Agricultural Commissioners' Reports, 2016
Price Per Total ValueCOUNTY AGRICULTURAL COMMISSIONERS' DATA, CALENDAR YEAR 2016
CountyHarvested Acreage
Yield Per Acre Production Dollars
SHEEP & LAMBS, UNSPECIFIED (N/A) (N/A)
Amador 468,000Butte 341,000Calaveras 192,000Colusa 563,000Del Norte 49,000Glenn 1,094,000Humboldt 698,000Inyo 626,000Kern 16,200,000Lassen 1,848,000Marin 1,793,000Mendocino 337,000Merced 3,838,000Mono 2,439,000Monterey 159,000Napa 615,000Nevada 165,000Placer 1,485,000Riverside 1,374,000San Diego 116,000San Joaquin 2,539,000Shasta 443,000Solano 9,339,000Sonoma 8,481,000Stanislaus 853,000Sutter 743,000Tehama 674,000Tuolumne 198,000Yolo 2,280,000Yuba 700,000Sum of Others 1,919,000STATE TOTAL 62,569,000Counties Reporting -- 31
SHEEP, BREEDING STOCK (N/A) (N/A)
Plumas 8,590Sierra 1,750Sum of Others 60,000STATE TOTAL 70,340Counties Reporting -- 3
SHEEP, LAMBS (N/A) (N/A)
Siskiyou 953,000Tulare 3,465,000Sum of Others 143,000STATE TOTAL 4,561,000Counties Reporting -- 3
SHEEP, LAMBS, FEEDLOT FAT (N/A) (N/A)
Fresno 21,051,000Imperial 4,587,000STATE TOTAL 25,638,000Counties Reporting -- 2

CDFA 74 California County Agricultural Commissioners' Reports, 2016
Price Per Total ValueCOUNTY AGRICULTURAL COMMISSIONERS' DATA, CALENDAR YEAR 2016
CountyHarvested Acreage
Yield Per Acre Production Dollars
SILAGE (Tons) (Tons)
Fresno 7,870 14.49 114,000 29.00 3,306,000Glenn 6,100 13.00 79,300 39.02 3,094,000Kern 102,000 19.37 1,976,000 46.41 91,704,000Kings 49,200 16.46 810,000 29.17 23,624,000Madera 21,300 14.69 313,000 32.19 10,075,000Marin 1,560 6.10 9,510 68.03 647,000Merced 79,600 16.41 1,306,000 25.85 33,765,000Sacramento 3,140 10.32 32,400 23.80 771,000San Bernardino 897 14.05 12,600 46.03 580,000San Joaquin 97,000 11.55 1,120,000 24.37 27,297,000Sonoma 8,460 12.17 103,000 39.00 4,017,000Stanislaus 61,200 19,797,000Tulare 296,000 17.24 5,104,000 27.17 138,677,000Sum of Others 11,351 5.64 64,036 66.08 4,231,800STATE TOTAL 745,678 16.13 11,043,846 30.95 361,585,800Counties Reporting -- 14
SORGHUM, GRAIN (Tons) (Tons)
Sacramento 2,100 2.80 5,890 172.50 1,016,000Sum of Others 8,870 11.84 105,045 99.98 10,502,540STATE TOTAL 10,970 10.11 110,935 103.83 11,518,540Counties Reporting -- 2
SORGHUM, SILAGE (Tons) (Tons)
Kings 12,400 17.98 223,000 27.81 6,201,000Riverside 300 5.33 1,600 70.00 112,000San Bernardino 646 30.03 19,400 54.43 1,056,000Sum of Others 3,970 19.26 76,450 33.03 2,525,000STATE TOTAL 17,316 18.51 320,450 30.88 9,894,000Counties Reporting -- 4
SPICES AND HERBS (Tons) (Tons)
Los Angeles 3 459,000Monterey 92 7.91 728 1,750.00 1,274,000Plumas 6,530Riverside 1,560 7.95 12,400 501.69 6,221,000San Diego 73 10.00 730 6,000.00 4,380,000Sierra 774Sum of Others 313 1.86 582 2,404.98 1,399,700STATE TOTAL 2,041 7.09 14,440 919.30 13,741,004Counties Reporting -- 7
SPINACH, FOOD SERVICE (Tons) (Tons)
Monterey 12,900 8.76 113,000 972.00 109,836,000STATE TOTAL 12,900 8.76 113,000 972.00 109,836,000Counties Reporting -- 1
SPINACH, FRESH MARKET (Tons) (Tons)
Monterey 1,820 8.79 16,000 1,430.00 22,880,000Sum of Others 66 6.88 454 1,508.81 685,000STATE TOTAL 1,886 8.72 16,454 1,432.17 23,565,000Counties Reporting -- 2
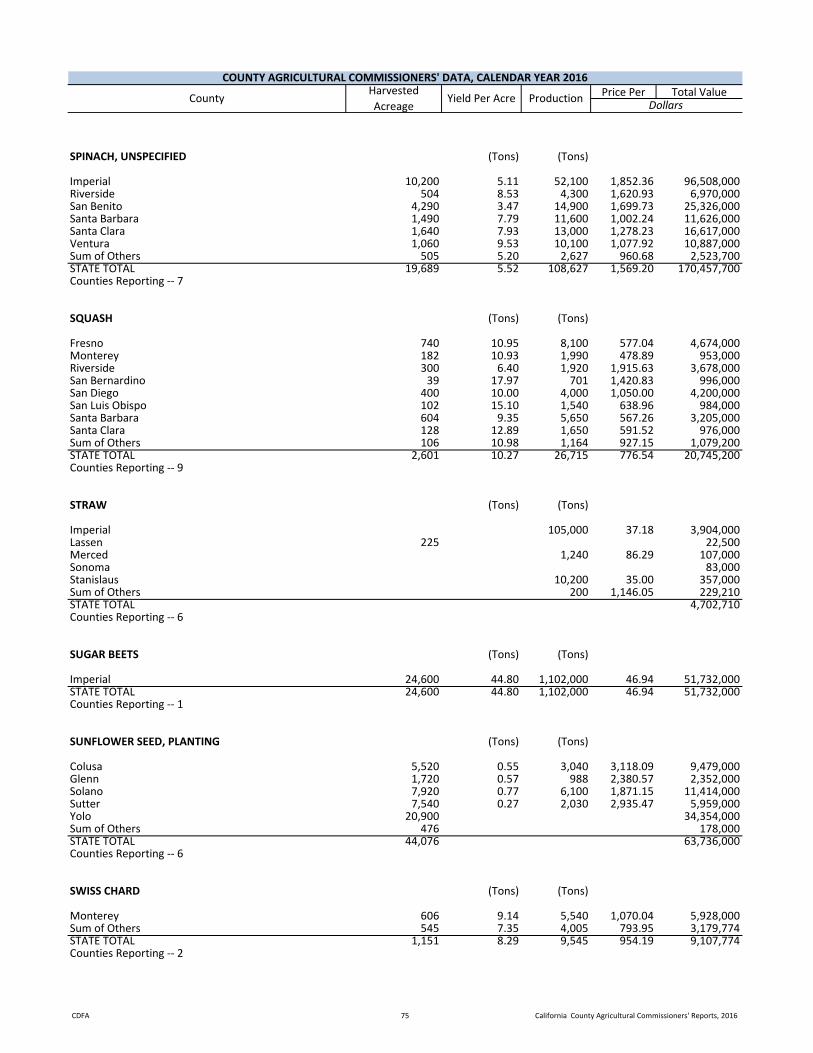
CDFA 75 California County Agricultural Commissioners' Reports, 2016
Price Per Total ValueCOUNTY AGRICULTURAL COMMISSIONERS' DATA, CALENDAR YEAR 2016
CountyHarvested Acreage
Yield Per Acre Production Dollars
SPINACH, UNSPECIFIED (Tons) (Tons)
Imperial 10,200 5.11 52,100 1,852.36 96,508,000Riverside 504 8.53 4,300 1,620.93 6,970,000San Benito 4,290 3.47 14,900 1,699.73 25,326,000Santa Barbara 1,490 7.79 11,600 1,002.24 11,626,000Santa Clara 1,640 7.93 13,000 1,278.23 16,617,000Ventura 1,060 9.53 10,100 1,077.92 10,887,000Sum of Others 505 5.20 2,627 960.68 2,523,700STATE TOTAL 19,689 5.52 108,627 1,569.20 170,457,700Counties Reporting -- 7
SQUASH (Tons) (Tons)
Fresno 740 10.95 8,100 577.04 4,674,000Monterey 182 10.93 1,990 478.89 953,000Riverside 300 6.40 1,920 1,915.63 3,678,000San Bernardino 39 17.97 701 1,420.83 996,000San Diego 400 10.00 4,000 1,050.00 4,200,000San Luis Obispo 102 15.10 1,540 638.96 984,000Santa Barbara 604 9.35 5,650 567.26 3,205,000Santa Clara 128 12.89 1,650 591.52 976,000Sum of Others 106 10.98 1,164 927.15 1,079,200STATE TOTAL 2,601 10.27 26,715 776.54 20,745,200Counties Reporting -- 9
STRAW (Tons) (Tons)
Imperial 105,000 37.18 3,904,000Lassen 225 22,500Merced 1,240 86.29 107,000Sonoma 83,000Stanislaus 10,200 35.00 357,000Sum of Others 200 1,146.05 229,210STATE TOTAL 4,702,710Counties Reporting -- 6
SUGAR BEETS (Tons) (Tons)
Imperial 24,600 44.80 1,102,000 46.94 51,732,000STATE TOTAL 24,600 44.80 1,102,000 46.94 51,732,000Counties Reporting -- 1
SUNFLOWER SEED, PLANTING (Tons) (Tons)
Colusa 5,520 0.55 3,040 3,118.09 9,479,000Glenn 1,720 0.57 988 2,380.57 2,352,000Solano 7,920 0.77 6,100 1,871.15 11,414,000Sutter 7,540 0.27 2,030 2,935.47 5,959,000Yolo 20,900 34,354,000Sum of Others 476 178,000STATE TOTAL 44,076 63,736,000Counties Reporting -- 6
SWISS CHARD (Tons) (Tons)
Monterey 606 9.14 5,540 1,070.04 5,928,000Sum of Others 545 7.35 4,005 793.95 3,179,774STATE TOTAL 1,151 8.29 9,545 954.19 9,107,774Counties Reporting -- 2
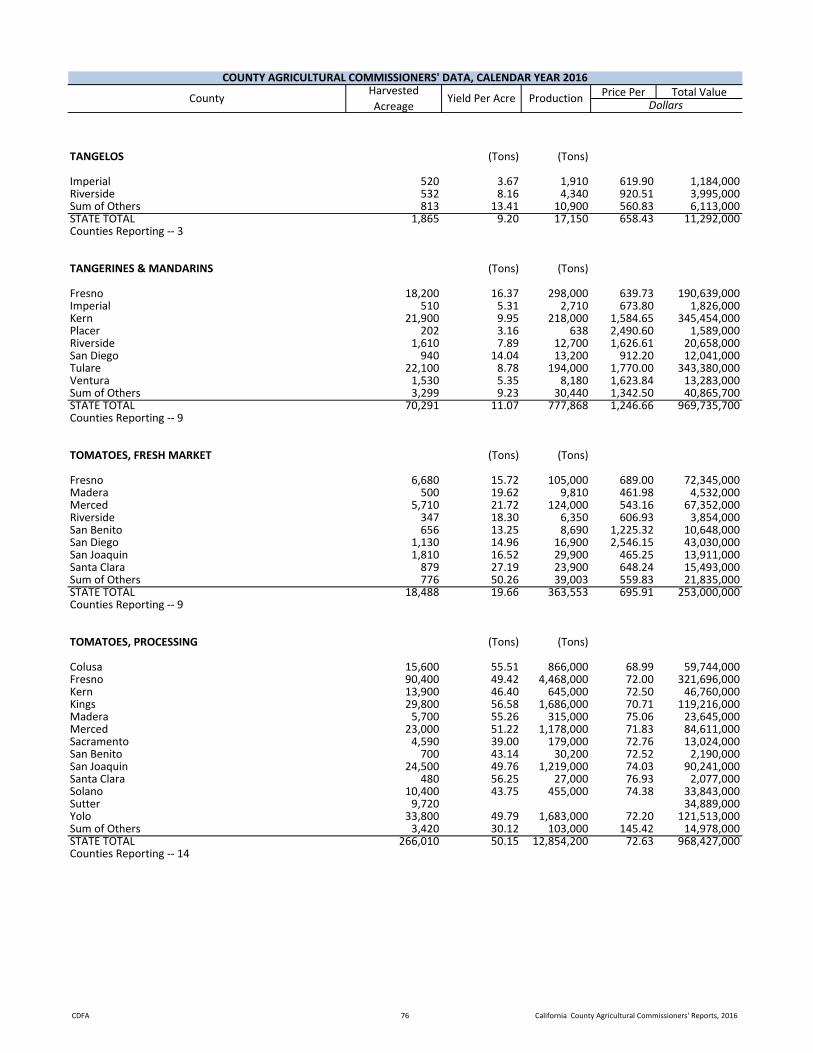
CDFA 76 California County Agricultural Commissioners' Reports, 2016
Price Per Total ValueCOUNTY AGRICULTURAL COMMISSIONERS' DATA, CALENDAR YEAR 2016
CountyHarvested Acreage
Yield Per Acre Production Dollars
TANGELOS (Tons) (Tons)
Imperial 520 3.67 1,910 619.90 1,184,000Riverside 532 8.16 4,340 920.51 3,995,000Sum of Others 813 13.41 10,900 560.83 6,113,000STATE TOTAL 1,865 9.20 17,150 658.43 11,292,000Counties Reporting -- 3
TANGERINES & MANDARINS (Tons) (Tons)
Fresno 18,200 16.37 298,000 639.73 190,639,000Imperial 510 5.31 2,710 673.80 1,826,000Kern 21,900 9.95 218,000 1,584.65 345,454,000Placer 202 3.16 638 2,490.60 1,589,000Riverside 1,610 7.89 12,700 1,626.61 20,658,000San Diego 940 14.04 13,200 912.20 12,041,000Tulare 22,100 8.78 194,000 1,770.00 343,380,000Ventura 1,530 5.35 8,180 1,623.84 13,283,000Sum of Others 3,299 9.23 30,440 1,342.50 40,865,700STATE TOTAL 70,291 11.07 777,868 1,246.66 969,735,700Counties Reporting -- 9
TOMATOES, FRESH MARKET (Tons) (Tons)
Fresno 6,680 15.72 105,000 689.00 72,345,000Madera 500 19.62 9,810 461.98 4,532,000Merced 5,710 21.72 124,000 543.16 67,352,000Riverside 347 18.30 6,350 606.93 3,854,000San Benito 656 13.25 8,690 1,225.32 10,648,000San Diego 1,130 14.96 16,900 2,546.15 43,030,000San Joaquin 1,810 16.52 29,900 465.25 13,911,000Santa Clara 879 27.19 23,900 648.24 15,493,000Sum of Others 776 50.26 39,003 559.83 21,835,000STATE TOTAL 18,488 19.66 363,553 695.91 253,000,000Counties Reporting -- 9
TOMATOES, PROCESSING (Tons) (Tons)
Colusa 15,600 55.51 866,000 68.99 59,744,000Fresno 90,400 49.42 4,468,000 72.00 321,696,000Kern 13,900 46.40 645,000 72.50 46,760,000Kings 29,800 56.58 1,686,000 70.71 119,216,000Madera 5,700 55.26 315,000 75.06 23,645,000Merced 23,000 51.22 1,178,000 71.83 84,611,000Sacramento 4,590 39.00 179,000 72.76 13,024,000San Benito 700 43.14 30,200 72.52 2,190,000San Joaquin 24,500 49.76 1,219,000 74.03 90,241,000Santa Clara 480 56.25 27,000 76.93 2,077,000Solano 10,400 43.75 455,000 74.38 33,843,000Sutter 9,720 34,889,000Yolo 33,800 49.79 1,683,000 72.20 121,513,000Sum of Others 3,420 30.12 103,000 145.42 14,978,000STATE TOTAL 266,010 50.15 12,854,200 72.63 968,427,000Counties Reporting -- 14
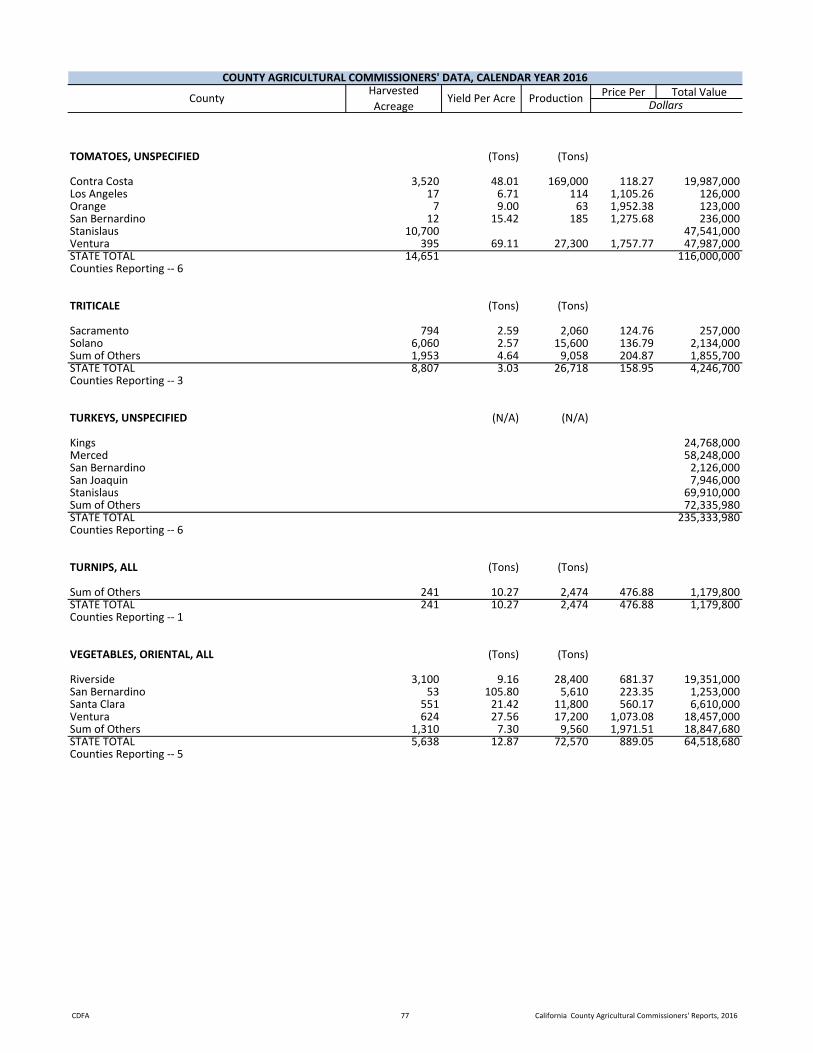
CDFA 77 California County Agricultural Commissioners' Reports, 2016
Price Per Total ValueCOUNTY AGRICULTURAL COMMISSIONERS' DATA, CALENDAR YEAR 2016
CountyHarvested Acreage
Yield Per Acre Production Dollars
TOMATOES, UNSPECIFIED (Tons) (Tons)
Contra Costa 3,520 48.01 169,000 118.27 19,987,000Los Angeles 17 6.71 114 1,105.26 126,000Orange 7 9.00 63 1,952.38 123,000San Bernardino 12 15.42 185 1,275.68 236,000Stanislaus 10,700 47,541,000Ventura 395 69.11 27,300 1,757.77 47,987,000STATE TOTAL 14,651 116,000,000Counties Reporting -- 6
TRITICALE (Tons) (Tons)
Sacramento 794 2.59 2,060 124.76 257,000Solano 6,060 2.57 15,600 136.79 2,134,000Sum of Others 1,953 4.64 9,058 204.87 1,855,700STATE TOTAL 8,807 3.03 26,718 158.95 4,246,700Counties Reporting -- 3
TURKEYS, UNSPECIFIED (N/A) (N/A)
Kings 24,768,000Merced 58,248,000San Bernardino 2,126,000San Joaquin 7,946,000Stanislaus 69,910,000Sum of Others 72,335,980STATE TOTAL 235,333,980Counties Reporting -- 6
TURNIPS, ALL (Tons) (Tons)
Sum of Others 241 10.27 2,474 476.88 1,179,800STATE TOTAL 241 10.27 2,474 476.88 1,179,800Counties Reporting -- 1
VEGETABLES, ORIENTAL, ALL (Tons) (Tons)
Riverside 3,100 9.16 28,400 681.37 19,351,000San Bernardino 53 105.80 5,610 223.35 1,253,000Santa Clara 551 21.42 11,800 560.17 6,610,000Ventura 624 27.56 17,200 1,073.08 18,457,000Sum of Others 1,310 7.30 9,560 1,971.51 18,847,680STATE TOTAL 5,638 12.87 72,570 889.05 64,518,680Counties Reporting -- 5

CDFA 78 California County Agricultural Commissioners' Reports, 2016
Price Per Total ValueCOUNTY AGRICULTURAL COMMISSIONERS' DATA, CALENDAR YEAR 2016
CountyHarvested Acreage
Yield Per Acre Production Dollars
VEGETABLES, UNSPECIFIED (N/A) (N/A)
Alameda 121 1,052,000Amador 36,800Butte 4 1,581,000Calaveras 165,000Colusa 3,990 28,690,000Contra Costa 1,430 10,663,000Del Norte 158,000Glenn 1,320 5,782,000Humboldt 2,477,000Inyo 7 42,000Kings 9,730 56,617,000Lake 18 231,000Lassen 15,660,000Los Angeles 7,840 70,108,000Marin 410 3,412,000Mendocino 340 1,150,000Merced 5,170 31,694,000Monterey 38,400 158,350,000Napa 26 295,000Nevada 87 1,771,000Placer 1,750,000Plumas 112,000Riverside 1,090 5,071,000Sacramento 3,410 27,437,000San Benito 6,180 55,016,000San Diego 1,350 45,725,000San Joaquin 3,690 15,481,000San Luis Obispo 13,000 101,469,000San Mateo 369 6,573,000Santa Barbara 12,300 117,981,000Santa Clara 826 5,074,000Santa Cruz 2,530 40,911,000Sierra 10,700Siskiyou 347,000Solano 3,180 33,742,000Sonoma 482 9,961,000Stanislaus 6,370 54,268,000Sutter 927 3,802,000Tehama 205 523,000Trinity 6,100Tulare 2,800 21,962,000Tuolumne 15 214,000Ventura 3,580 48,669,000Yolo 9,160 43,024,000Sum of Others 4,185 35,939,670STATE TOTAL 1,065,003,270Counties Reporting -- 45
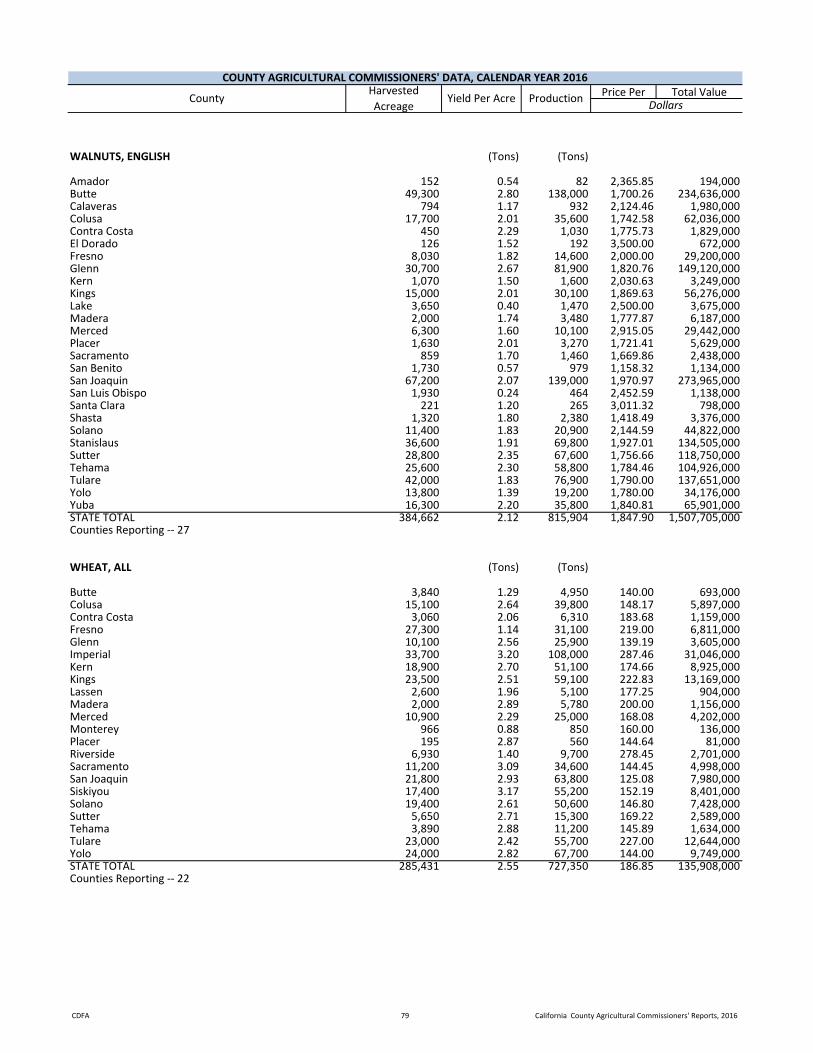
CDFA 79 California County Agricultural Commissioners' Reports, 2016
Price Per Total ValueCOUNTY AGRICULTURAL COMMISSIONERS' DATA, CALENDAR YEAR 2016
CountyHarvested Acreage
Yield Per Acre Production Dollars
WALNUTS, ENGLISH (Tons) (Tons)
Amador 152 0.54 82 2,365.85 194,000Butte 49,300 2.80 138,000 1,700.26 234,636,000Calaveras 794 1.17 932 2,124.46 1,980,000Colusa 17,700 2.01 35,600 1,742.58 62,036,000Contra Costa 450 2.29 1,030 1,775.73 1,829,000El Dorado 126 1.52 192 3,500.00 672,000Fresno 8,030 1.82 14,600 2,000.00 29,200,000Glenn 30,700 2.67 81,900 1,820.76 149,120,000Kern 1,070 1.50 1,600 2,030.63 3,249,000Kings 15,000 2.01 30,100 1,869.63 56,276,000Lake 3,650 0.40 1,470 2,500.00 3,675,000Madera 2,000 1.74 3,480 1,777.87 6,187,000Merced 6,300 1.60 10,100 2,915.05 29,442,000Placer 1,630 2.01 3,270 1,721.41 5,629,000Sacramento 859 1.70 1,460 1,669.86 2,438,000San Benito 1,730 0.57 979 1,158.32 1,134,000San Joaquin 67,200 2.07 139,000 1,970.97 273,965,000San Luis Obispo 1,930 0.24 464 2,452.59 1,138,000Santa Clara 221 1.20 265 3,011.32 798,000Shasta 1,320 1.80 2,380 1,418.49 3,376,000Solano 11,400 1.83 20,900 2,144.59 44,822,000Stanislaus 36,600 1.91 69,800 1,927.01 134,505,000Sutter 28,800 2.35 67,600 1,756.66 118,750,000Tehama 25,600 2.30 58,800 1,784.46 104,926,000Tulare 42,000 1.83 76,900 1,790.00 137,651,000Yolo 13,800 1.39 19,200 1,780.00 34,176,000Yuba 16,300 2.20 35,800 1,840.81 65,901,000STATE TOTAL 384,662 2.12 815,904 1,847.90 1,507,705,000Counties Reporting -- 27
WHEAT, ALL (Tons) (Tons)
Butte 3,840 1.29 4,950 140.00 693,000Colusa 15,100 2.64 39,800 148.17 5,897,000Contra Costa 3,060 2.06 6,310 183.68 1,159,000Fresno 27,300 1.14 31,100 219.00 6,811,000Glenn 10,100 2.56 25,900 139.19 3,605,000Imperial 33,700 3.20 108,000 287.46 31,046,000Kern 18,900 2.70 51,100 174.66 8,925,000Kings 23,500 2.51 59,100 222.83 13,169,000Lassen 2,600 1.96 5,100 177.25 904,000Madera 2,000 2.89 5,780 200.00 1,156,000Merced 10,900 2.29 25,000 168.08 4,202,000Monterey 966 0.88 850 160.00 136,000Placer 195 2.87 560 144.64 81,000Riverside 6,930 1.40 9,700 278.45 2,701,000Sacramento 11,200 3.09 34,600 144.45 4,998,000San Joaquin 21,800 2.93 63,800 125.08 7,980,000Siskiyou 17,400 3.17 55,200 152.19 8,401,000Solano 19,400 2.61 50,600 146.80 7,428,000Sutter 5,650 2.71 15,300 169.22 2,589,000Tehama 3,890 2.88 11,200 145.89 1,634,000Tulare 23,000 2.42 55,700 227.00 12,644,000Yolo 24,000 2.82 67,700 144.00 9,749,000STATE TOTAL 285,431 2.55 727,350 186.85 135,908,000Counties Reporting -- 22
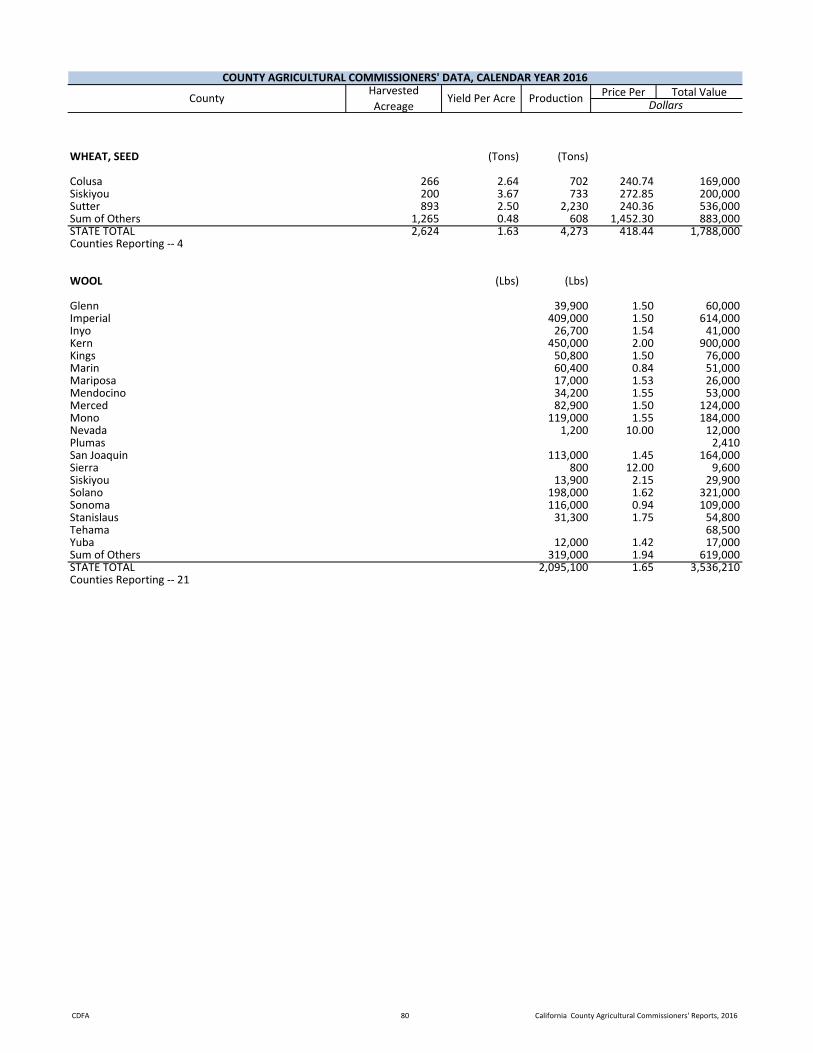
CDFA 80 California County Agricultural Commissioners' Reports, 2016
Price Per Total ValueCOUNTY AGRICULTURAL COMMISSIONERS' DATA, CALENDAR YEAR 2016
CountyHarvested Acreage
Yield Per Acre Production Dollars
WHEAT, SEED (Tons) (Tons)
Colusa 266 2.64 702 240.74 169,000Siskiyou 200 3.67 733 272.85 200,000Sutter 893 2.50 2,230 240.36 536,000Sum of Others 1,265 0.48 608 1,452.30 883,000STATE TOTAL 2,624 1.63 4,273 418.44 1,788,000Counties Reporting -- 4
WOOL (Lbs) (Lbs)
Glenn 39,900 1.50 60,000Imperial 409,000 1.50 614,000Inyo 26,700 1.54 41,000Kern 450,000 2.00 900,000Kings 50,800 1.50 76,000Marin 60,400 0.84 51,000Mariposa 17,000 1.53 26,000Mendocino 34,200 1.55 53,000Merced 82,900 1.50 124,000Mono 119,000 1.55 184,000Nevada 1,200 10.00 12,000Plumas 2,410San Joaquin 113,000 1.45 164,000Sierra 800 12.00 9,600Siskiyou 13,900 2.15 29,900Solano 198,000 1.62 321,000Sonoma 116,000 0.94 109,000Stanislaus 31,300 1.75 54,800Tehama 68,500Yuba 12,000 1.42 17,000Sum of Others 319,000 1.94 619,000STATE TOTAL 2,095,100 1.65 3,536,210Counties Reporting -- 21

CDFA 81 California County Agricultural Commissioners’ Reports, 2016
County Agricultural Commissioners. And Sealers of Weights and Measures General Office Contact Information Updated: January 19, 2018
COUNTY COMMISSIONER OFFICE PHONE / FAX MAILING ADDRESS CITY MAIL
ZIP EMAIL
ALAMEDA Humberto Izquierdo
(510) 670-5232 (510) 783-3928
224 W Winton Ave, Rm 184
Hayward 94544-1220
AMADOR Eric Mayberry (209) 223-6487 (209) 223-3312
12200-B Airport Rd Jackson 95642-9527
BUTTE Louie Mendoza, Jr,
(530) 538-7381 (530) 538-7594
316 Nelson Ave Oroville 95965-3318
CALAVERAS Kevin Wright (209) 754-6504 x3 (209) 754-9256
891 Mountain Ranch Rd
San Andreas 95249-9709
COLUSA Greg Hinton (530) 458-0580 (530) 458-5000
100 Sunrise Blvd, Ste F
Colusa 95932-3246
CONTRA COSTA
Humberto Izquierdo
(925) 646-5250 (925) 646-5732
2366-A Stanwell Circle
Concord 94520-4804
DEL NORTE Jeff Dolf (707) 464-7235 (707) 465-6044
2650 W Washington Blvd
Crescent City 95531-8619
EL DORADO / ALPINE Charlene Carveth (530) 621-5520
(530) 626-4756 311 Fair Lane Placerville 95667-
4195 [email protected]
FRESNO Les Wright (559) 600-7510 (559) 455-2415
1730 S Maple Ave Fresno 93702-4596
GLENN Marcie Skelton (530) 934-6501 (530) 934-6503
PO Box 351 Willows 95988-0351
HUMBOLDT Jeff Dolf (707) 441-5260 (707) 445-7220
5630 S Broadway St Eureka 95503-6905
IMPERIAL Carlos Ortiz (acting)
(442) 265-1500 (760) 353-9420
PO Box 806 El Centro 92244-0806
INYO/MONO Nathan Reade (760) 873-7860 (760) 872-1610
207 W South St Bishop 93514-3492
KERN Glenn Fankhauser
(661) 868-6300 (661) 868-6301
1001 S Mt Vernon Ave
Bakersfield 93307-2857
KINGS Jimmy Hook (559) 852-2830 (559) 582-5251
680 N Campus Dr, Ste B
Hanford 93230-3556
LAKE Steven Hajik (707) 263-0217 (707) 263-1052
883 Lakeport Blvd Lakeport 95453-5405
LASSEN Craig Hemphill (530) 251-8110 (530) 257-6515
175 Russell Ave Susanville 96130-4299
LOS ANGELES Kurt Floren (626) 575-5471 (626) 443-6652
12300 Lower Azusa Rd
Arcadia 91005-5872
MADERA Stevie McNeill (626) 443-7876 (559) 674-4071
332 Madera Ave Madera 93637-5499
MARIN Stacy Carlsen (559) 674-4071 (415) 473-7543
1682 Novato Blvd, Ste 150-A
Novato 94947-7021
MARIPOSA vacant (209) 966-2075 (209) 966-2056
PO Box 905 Mariposa 95338-0905
MENDOCINO Diane Curry (Interim)
(707) 234-6830 (707) 463-0240
890 N Bush St Ukiah 95482-3745
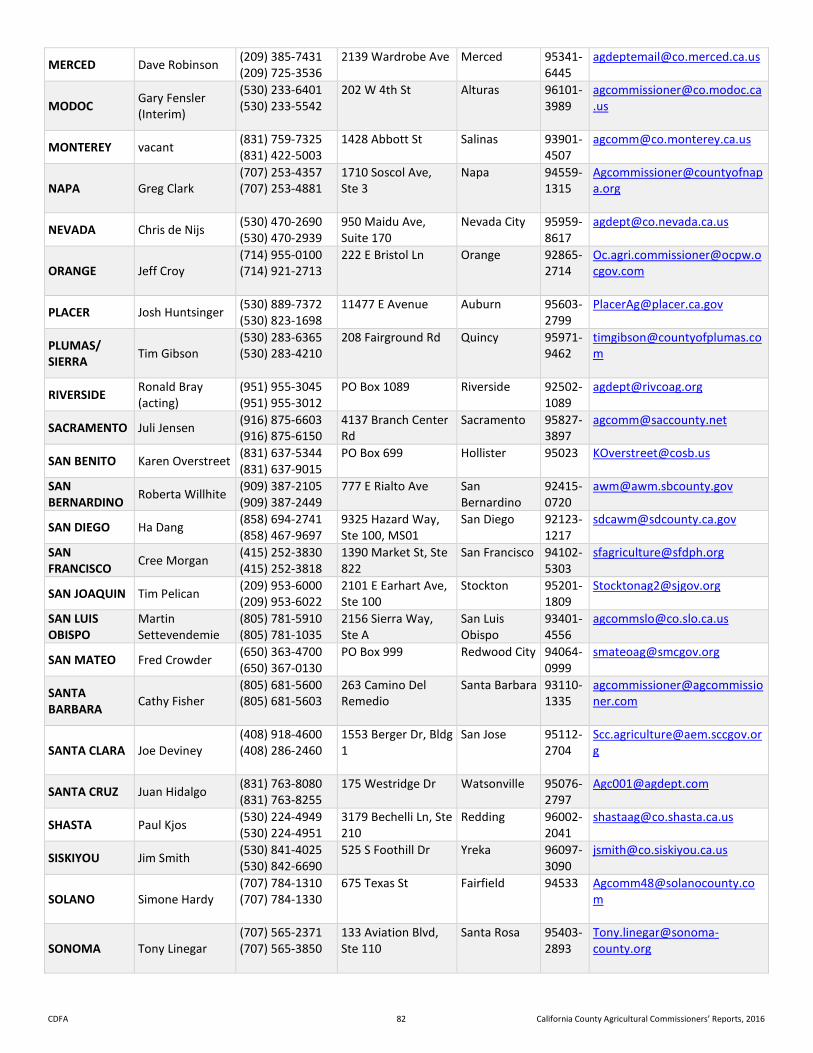
CDFA 82 California County Agricultural Commissioners’ Reports, 2016
MERCED Dave Robinson (209) 385-7431 (209) 725-3536
2139 Wardrobe Ave Merced 95341-6445
MODOC Gary Fensler (Interim)
(530) 233-6401 (530) 233-5542
202 W 4th St Alturas 96101-3989
MONTEREY vacant (831) 759-7325 (831) 422-5003
1428 Abbott St Salinas 93901-4507
NAPA Greg Clark (707) 253-4357 (707) 253-4881
1710 Soscol Ave, Ste 3
Napa 94559-1315
NEVADA Chris de Nijs (530) 470-2690 (530) 470-2939
950 Maidu Ave, Suite 170
Nevada City 95959-8617
ORANGE Jeff Croy (714) 955-0100 (714) 921-2713
222 E Bristol Ln Orange 92865-2714
PLACER Josh Huntsinger (530) 889-7372 (530) 823-1698
11477 E Avenue Auburn 95603-2799
PLUMAS/ SIERRA Tim Gibson
(530) 283-6365 (530) 283-4210
208 Fairground Rd Quincy 95971-9462
RIVERSIDE Ronald Bray (acting)
(951) 955-3045 (951) 955-3012
PO Box 1089 Riverside 92502-1089
SACRAMENTO Juli Jensen (916) 875-6603 (916) 875-6150
4137 Branch Center Rd
Sacramento 95827-3897
SAN BENITO Karen Overstreet (831) 637-5344 (831) 637-9015
PO Box 699 Hollister 95023 [email protected]
SAN BERNARDINO Roberta Willhite (909) 387-2105
(909) 387-2449 777 E Rialto Ave San
Bernardino 92415-0720
SAN DIEGO Ha Dang (858) 694-2741 (858) 467-9697
9325 Hazard Way, Ste 100, MS01
San Diego 92123-1217
SAN FRANCISCO Cree Morgan (415) 252-3830
(415) 252-3818 1390 Market St, Ste 822
San Francisco 94102-5303
SAN JOAQUIN Tim Pelican (209) 953-6000 (209) 953-6022
2101 E Earhart Ave, Ste 100
Stockton 95201-1809
SAN LUIS OBISPO
Martin Settevendemie
(805) 781-5910 (805) 781-1035
2156 Sierra Way, Ste A
San Luis Obispo
93401-4556
SAN MATEO Fred Crowder (650) 363-4700 (650) 367-0130
PO Box 999 Redwood City 94064-0999
SANTA BARBARA Cathy Fisher
(805) 681-5600 (805) 681-5603
263 Camino Del Remedio
Santa Barbara 93110-1335
SANTA CLARA Joe Deviney (408) 918-4600 (408) 286-2460
1553 Berger Dr, Bldg 1
San Jose 95112-2704
SANTA CRUZ Juan Hidalgo (831) 763-8080 (831) 763-8255
175 Westridge Dr Watsonville 95076-2797
SHASTA Paul Kjos (530) 224-4949 (530) 224-4951
3179 Bechelli Ln, Ste 210
Redding 96002-2041
SISKIYOU Jim Smith (530) 841-4025 (530) 842-6690
525 S Foothill Dr Yreka 96097-3090
SOLANO Simone Hardy (707) 784-1310 (707) 784-1330
675 Texas St Fairfield 94533 [email protected]
SONOMA Tony Linegar (707) 565-2371 (707) 565-3850
133 Aviation Blvd, Ste 110
Santa Rosa 95403-2893

CDFA 83 California County Agricultural Commissioners’ Reports, 2016
STANISLAUS Milton O'Haire (209) 525-4730 (209) 525-4790
3800 Cornucopia Way, Ste B
Modesto 95358-9494
SUTTER Lisa Herbert (530) 822-7500 (530) 822-7510
142 Garden Highway
Yuba City 95991-5512
TEHAMA Rick Gurrola (530) 527-4504 (530) 529-1049
PO Box 38 Red Bluff 96080-0038
TRINITY Jeff Dolf (530) 623-1356 (530) 623-1391
PO Box 1466 Weaverville 96093-1466
TULARE Marilyn Kinoshita
(559) 684-3350 (559) 685-3335
4437 S Laspina St Tulare 93274-9537
TUOLUMNE Gary Stockel (209) 533-5691 (209) 533-5520
2 S Green St Sonora 95370-4618
VENTURA-Agricultural Henry Gonzales
(805) 388-4222 (805) 388-4209
555 Airport Way, Ste E
Camarillo 93010-8530
VENTURA-SWM
Angela Godwin (Sealer)
(805) 654-2444 (808) 654-5177
800 S Victoria Ave, L# 1750
Ventura 93009-1750
YOLO John Young (530) 666-8140 (530) 666-6094
70 Cottonwood St Woodland 95695-2593
YUBA Steve Scheer (530) 749-5400 (530) 749-5404
915 8th St, Ste 127 Marysville 95901-5273
LIAISONS
CACASA Executive Director
Sandy Elles (707)235-6135 680 N. Campus
Drive, Suite B PO Box 2205
Hanford 93230
CDFA Gary Leslie (916) 403-6700 (916) 654-9079
1220 "N" St, Rm 445 Sacramento 95814 [email protected]
CDFA County Licensing Program
Hannah Black (916)653-5866 1220 “N” Street Sacramento 95814 [email protected]
DPR General Information
(916) 445-4038 PO Box 4015 Sacramento 95812-4015
US Customs & Border Protection
Joe Scheele (916) 930-5505 (916) 930-5518
650 Capitol Mall, Ste. 6-400
Sacramento 95814


