1 David Rizzardo, PE Chief, Snow Surveys Section Hydrology Branch/Division of Flood Management California Department of Water Resources California’s Water Supply Forecasting DWR & Water Education Foundation: Challenges for Water Operations April 26, 2016 Fresno State University
Transcript
1
David Rizzardo, PE
Chief, Snow Surveys Section
Hydrology Branch/Division of Flood Management
California Department of Water Resources
California’s Water Supply Forecasting
DWR & Water Education Foundation:
Challenges for Water Operations April 26, 2016
Fresno State University
2
Background on Water Supply Forecasting Products
3
4
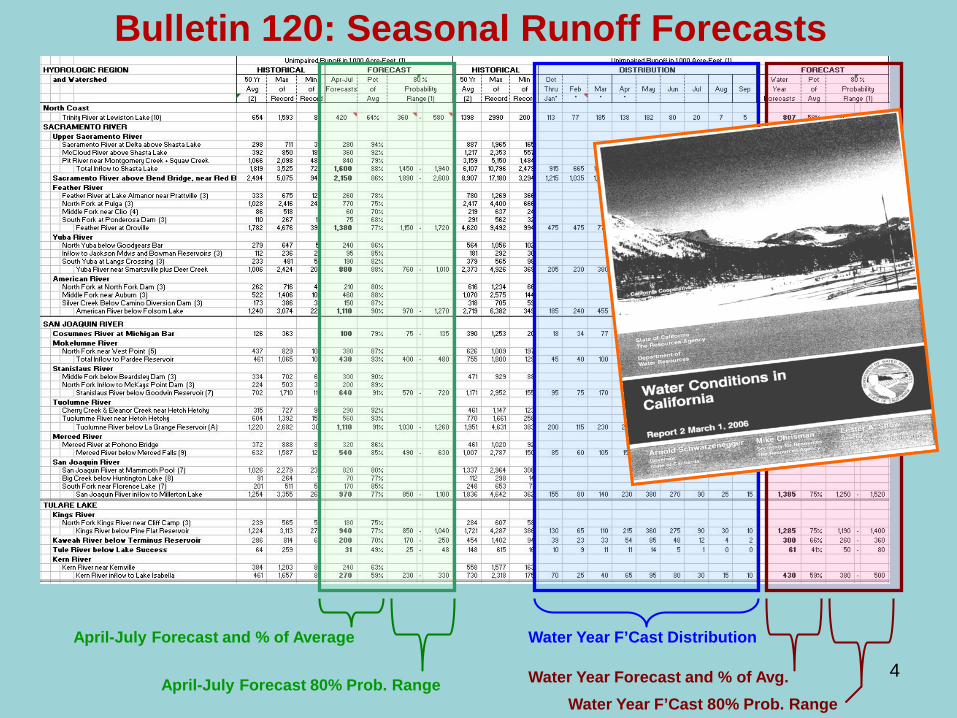
Bulletin 120: Seasonal Runoff Forecasts
April-July Forecast and % of Average
April-July Forecast 80% Prob. Range
Water Year F’Cast Distribution
Water Year Forecast and % of Avg. Water Year F’Cast 80% Prob. Range
5
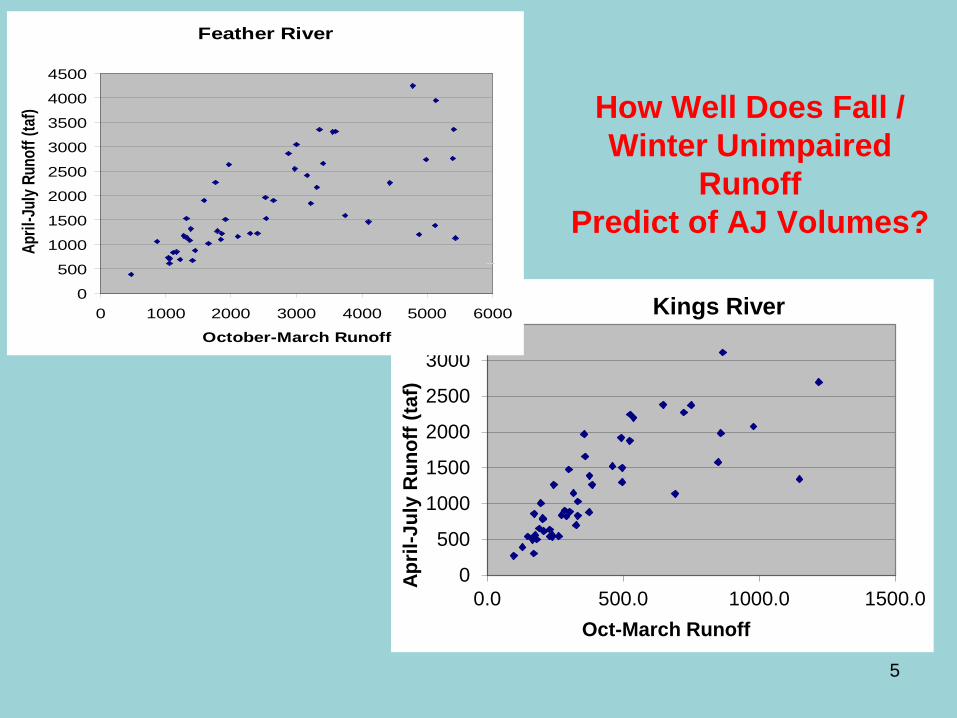
How Well Does Fall / Winter Unimpaired
Runoff Predict of AJ Volumes?
0
500
1000
1500
2000
2500
3000
3500
0.0 500.0 1000.0 1500.0
April
-Jul
y R
unof
f (ta
f)
Oct-March Runoff
Kings River
Feather River
0
500
1000
1500
2000
2500
3000
3500
4000
4500
0 1000 2000 3000 4000 5000 6000
October-March Runoff
April
-Jul
y Run
off (
taf)
Correlation of AJ Runoff to High Elevation Snow Index
6
0
500
1000
1500
2000
2500
3000
3500
0 100 200 300Ap
ril-J
uly
Run
off (
taf)
High Snow Index
Kings River
0
500
1000
1500
2000
2500
3000
3500
4000
4500
0 50 100 150 200 250
Apr
il-Ju
ly R
unof
f (ta
f)
High Snow Index
Feather River
“Non Snow Driven” Basin (Feather) vs. “Snow Driven” Basin (Kings) We analyze similar patterns and correlations for precipitation data
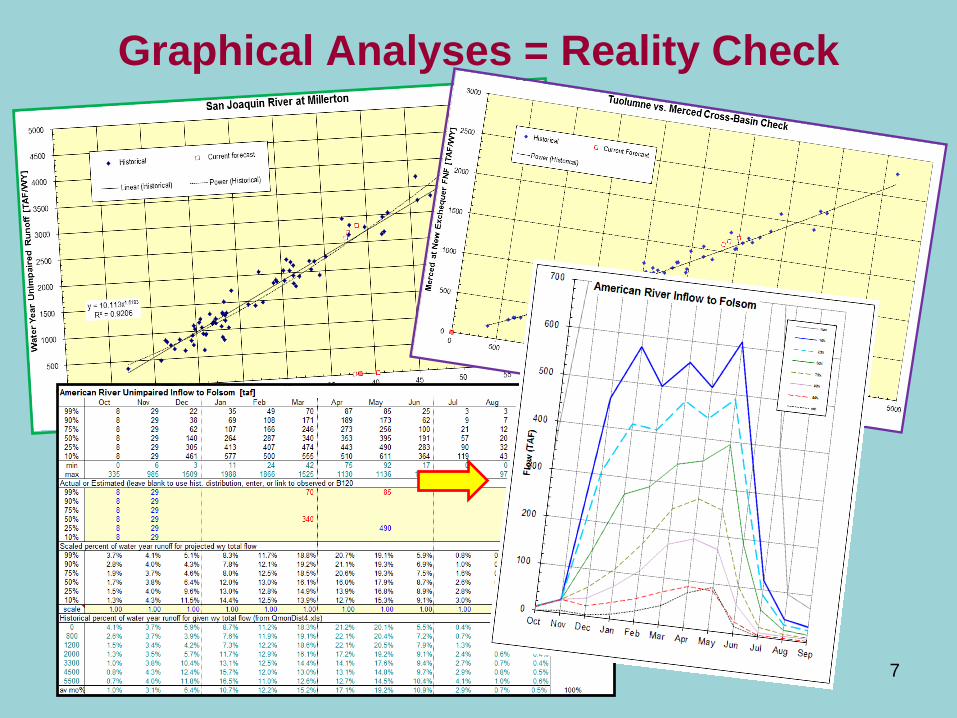
Graphical Analyses = Reality Check
7
Using Averages to Predict Extremes
Calibration
High Water Events
Critically Dry Years
• Based on…historical measurements • Errors are part of the process / define confidence levels
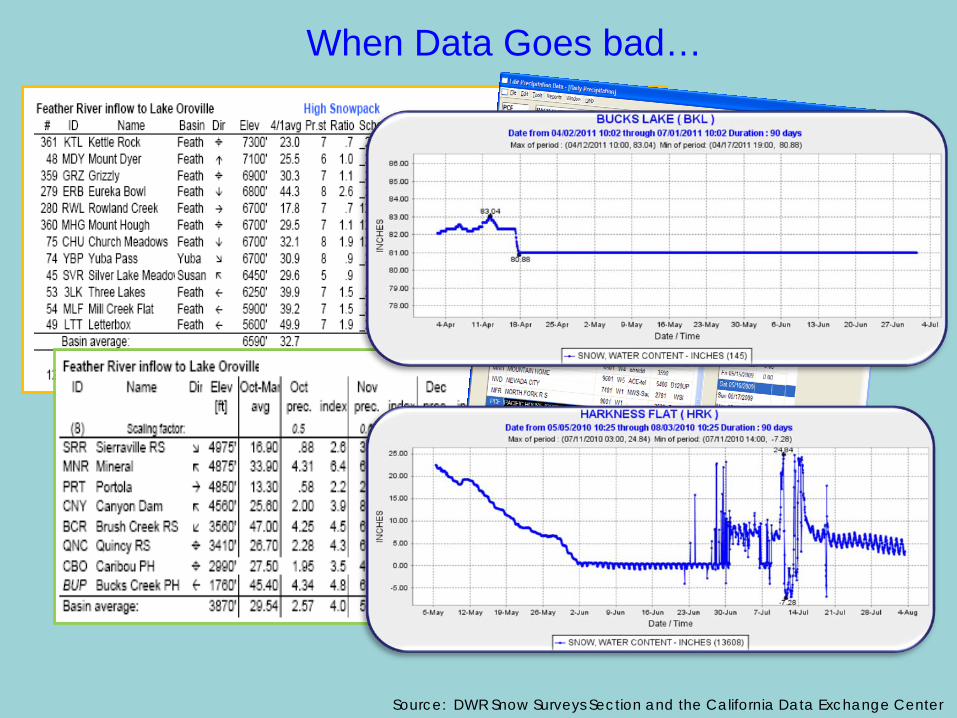
Source: DWR Snow Surveys Section and the California Data Exchange Center
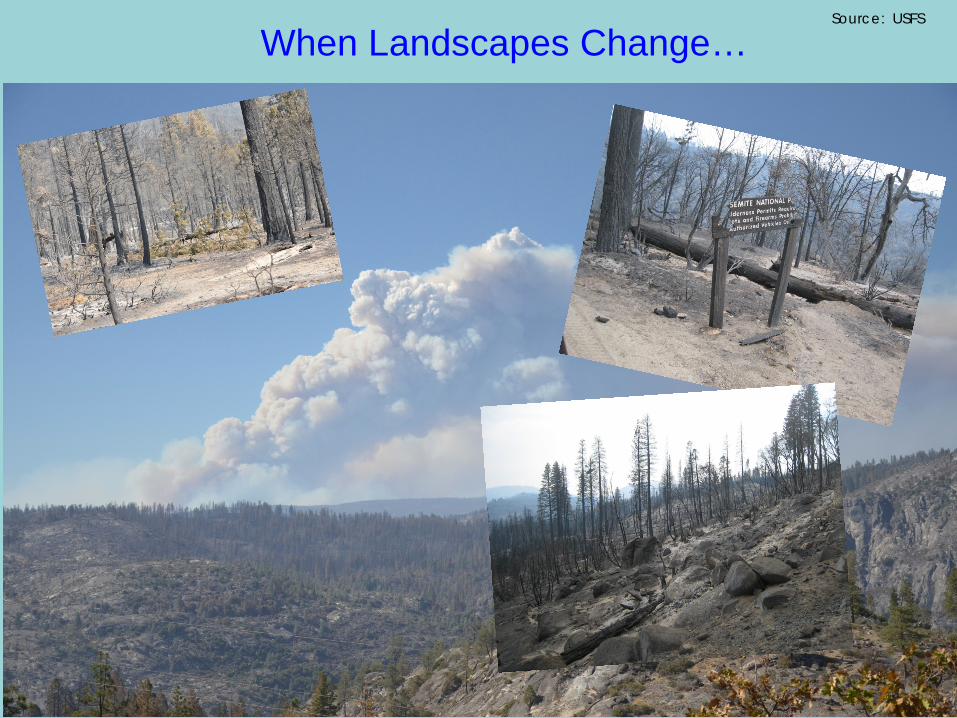
When Landscapes Change… Source: USFS
When Climate Changes…
“The Only Constant In Life Is Change” -Heraclitus, c 535 BC
Warning! Climate Change Slide!
Springtime SWE Under Projected Temperature Increases
Source: Knowles and Cayan, 2002 Notes: Projected temperature increases: 0.6C (2020-2039), 1.6C ((2050-2069), and 2.1C (2080-2099),
expressed as a percentage of average present conditions
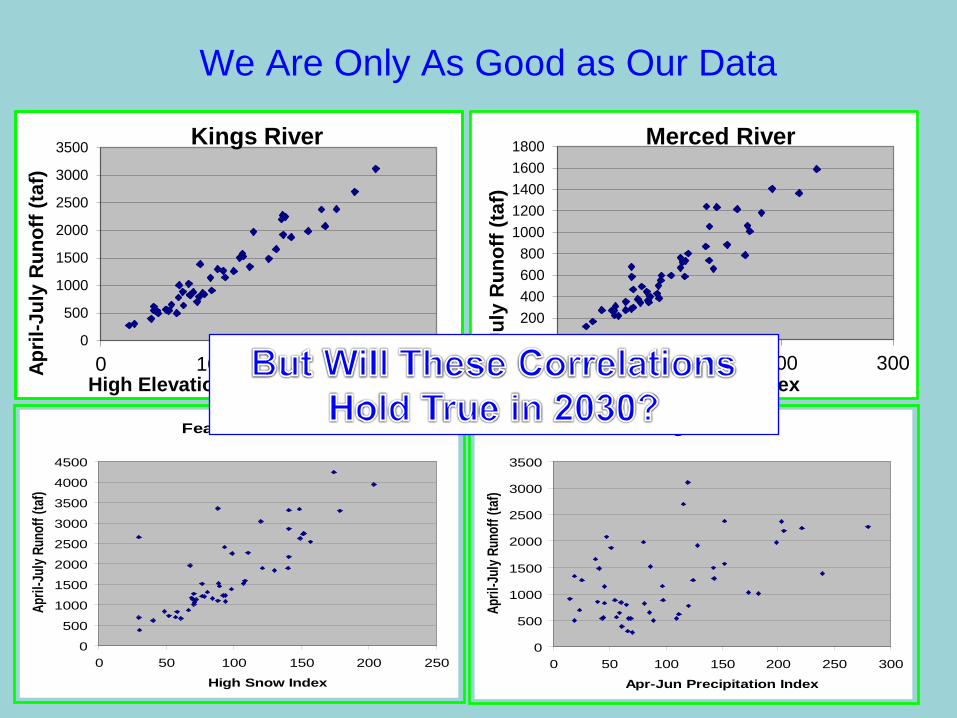
We Are Only As Good as Our Data
0
500
1000
1500
2000
2500
3000
3500
0 100 200 300April
-Jul
y R
unof
f (ta
f)
High Elevation Snow Index
Kings River
0200400600800
10001200140016001800
0 100 200 300
April
-Jul
y R
unof
f (ta
f)
Snow Index
Merced River
Feather River
0
500
1000
1500
2000
2500
3000
3500
4000
4500
0 50 100 150 200 250
High Snow Index
April
-Jul
y Run
off (
taf)
Kings River
0
500
1000
1500
2000
2500
3000
3500
0 50 100 150 200 250 300
Apr-Jun Precipitation Index
April
-Jul
y Run
off (
taf)
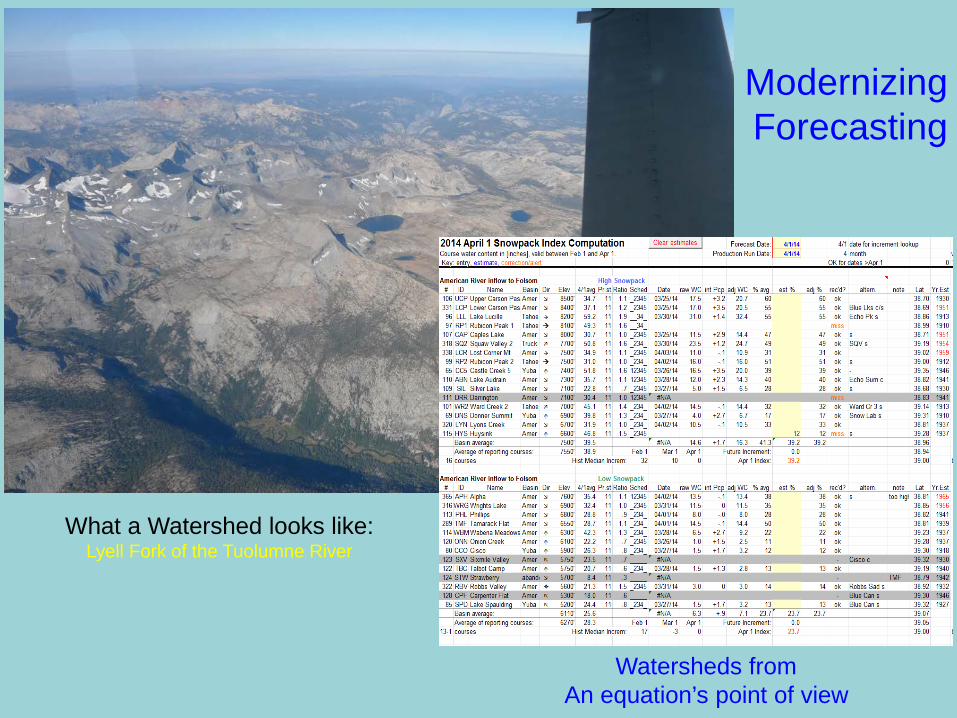
Modernizing Forecasting
What a Watershed looks like: Lyell Fork of the Tuolumne River
Watersheds from An equation’s point of view
Feed Me! “Healthy” Models Need Many Sources of Many Types of
Good-Quality, Long-Term Data
Conceptualized Physical Hydrology Model
Solar Radiation
Evapo-transpiration
Precip/Snow
Full Natural Flow
Soil Moisture / Groundwater
Slope / Aspect / Elev.
Soils / Vegetation Properties
Consider a 5% Error When… W
et Y
ear
Dry
Yea
r • 5% Error on the A-J Inflow To Friant Dam in
WY2011 was 112,153 AF (above and beyond our typical 5-10% error) or about 21% of Millerton’s capacity.
• 5% Error on the A-J Inflow to Folsom Lake during WY2006 was 131,119 AF or about 13% of Folsom’s capacity
• 5% Error on the May 2012 A-J Inflow Forecast (175,000 AF) to Terminus Lake on the Kaweah is equal to 8,750 AF. An over-forecast means the A-J would have been less than 172,000 AF which is a Normal/Dry year trigger on the Kaweah River.
The Snapshot • Current forecasting and data network is the
backbone of our “early warning system” for Flood ER as well as responding to droughts
• Climate Change may limit regression correlations in the future leading to an increase in forecast error
• Advanced modeling capabilities have big appetites for data
• Limited access to Wilderness is a threat to remote data collection