68
CALL CENTER REPORTS GUIDE (800) 799-0600 Nextiva.com

CALL CENTERREPORTS GUIDE
(800) 799-0600Nextiva.com
3 Overview
Nextiva Enhanced Call Center Reporting feature allows users to generate enhanced reports and schedule reports to be run in the future. It provides a set of canned report templates and allows administrators to define customized templates.
Call center agents and supervisors can generate reports on demand and schedulereports from the Hosted Thin Call Center client application. For information ongenerating and scheduling reports from the Call Center client, see the NextivaHosted Thin Call Center Agent/Supervisor User Guide.
NOTE: Agents can only request reports about themselves.
Nextiva group and enterprise administrators can schedule reports from the webportal. They cannot generate reports on demand. For information on schedulingreports from the web portal, see the Nextiva Application Server Group WebInterface Administration Guide – Part 2.
The report template defines the layout and to some extent the contents of a report. When requesting a report, the user first selects a template, enters some input parameters, and then runs or schedules a report.
The input parameters include information such as the reporting period and the list of agents or call centers for which the report is requested. In addition, certain reports require you to provide performance parameters that are used to make report calculations. The performance parameters you need to provide when requesting a report are listed in each report template section. The list of performance parameters used in canned templates is included in section 6.1 Performance Parameters.
This document describes the canned report templates available from Nextiva as part of the Enhanced Call Center Reporting feature.
Section 3.1 Report Types describes the different types of reports.
Section 3.2 Canned Report Layout describes the general layout of a report generatedusing a canned template.
Section 4 Agent Report Templates describes the canned Agent Reports.
Section 5 Call Center Report Templates describes the canned Call Center Reports.
NOTE: The report templates that are available to you depend on your system configuration.
3.1 Report Types Reports templates are divided into two categories: Agent and Call Center
Agent Report templates allow you to generate reports containing statistical informationabout one or more agents.
Call Center Report templates allow you to generate reports that include statisticsrelated to one or more call centers or one or more Dialed Number IdentificationServices (DNISs) for a selected call center.
Nextiva Call Center Reports – 2014Page 2 of 68
In addition, reports can be real-time or historical and they can be interval-based or not interval-based.
A real-time report includes statistics for a period that has a start date and time, but noend date and time.
A historical report includes statistics for a specified time period in the past.
A real-time report template can be used to generate both real-time and historicalreports.
A historical report template can only be used to generate historical reports.
An interval-based report template is a template that is used to generate reports thatinclude interval statistics.
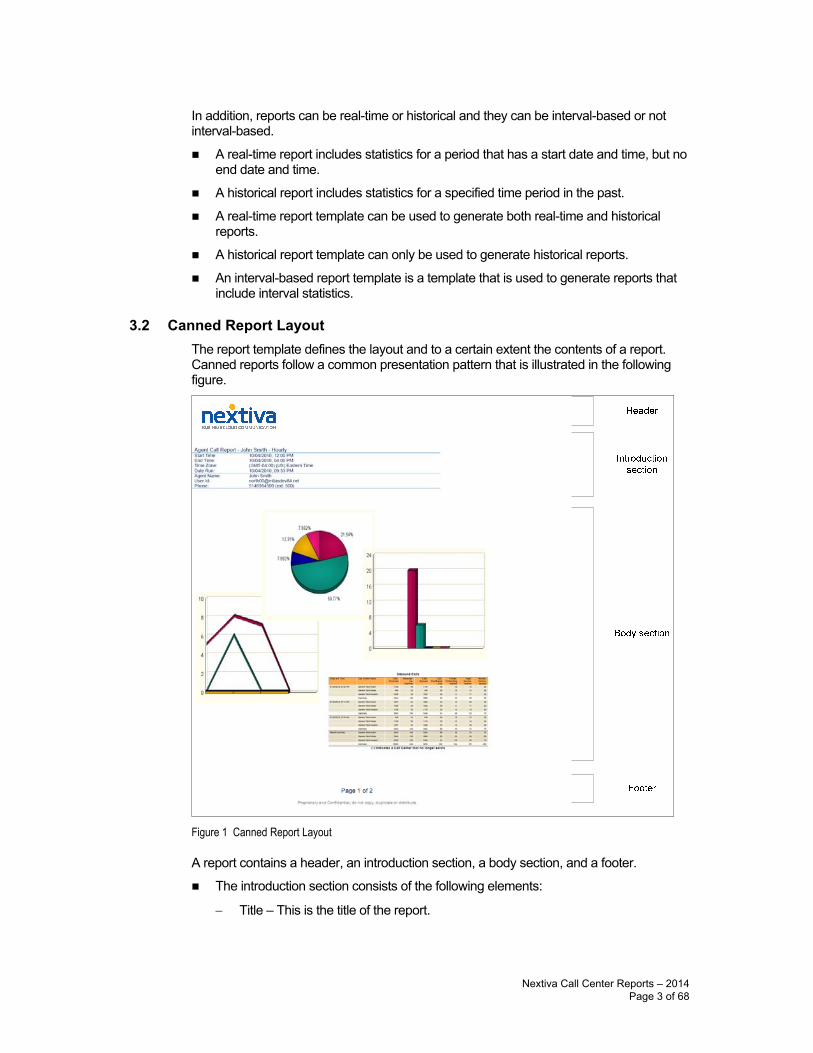
3.2 Canned Report Layout The report template defines the layout and to a certain extent the contents of a report. Canned reports follow a common presentation pattern that is illustrated in the following figure.
Figure 1 Canned Report Layout
A report contains a header, an introduction section, a body section, and a footer.
The introduction section consists of the following elements:
− Title – This is the title of the report.
Nextiva Call Center Reports – 2014Page 3 of 68
− Time frame – This is the start date and start time, and optionally the end date and end time of the reporting period. The end date and end time are conditional and are only included for historical reports.
− Time zone – This is the time zone used when generating the report, in a localized display format, for example, “(GMT-04:00) (US) Eastern Time”.
Note that the offset from Greenwich Mean Time (GMT) is computed at the time of report generation and not necessarily in relation to the requested time frame.
− Date run – This is the date and time at which the report was run.
− Agent, call center, or DNIS information – The information is conditional and only included when an Agent Report is run for a single agent or when a Call Center Report is run for a single call center or DNIS.
The body section is made up of one or more of the following elements:
− Pie chart
− Bar chart
− Line chart
− Matrix
− Table
Note that pie charts are not displayed if the report does not contain data for the requested time frame. Unless otherwise specified, bar charts, line charts, and tables are always displayed; however, they may be empty. For interval-based reports, rows that do not have data to display are not shown on the report.
Although most canned reports may be printed on A4 paper in landscape mode, you may need to use legal size paper and/or enable the fit to page option for reports that have tables that have a large number of columns.
Nextiva Call Center Reports – 2014 Page 4 of 68
4 Agent Report Templates
Nextiva Call Center Enhanced Reporting provides the following canned Agent Report templates:
Agent Call Report
Agent Duration Report
Agent Call Detail Report
Agent Activity Report
Agent Summary Report
Agent Unavailability Report
Agent Disposition Code Report
Agent Sign In Sign Out Report
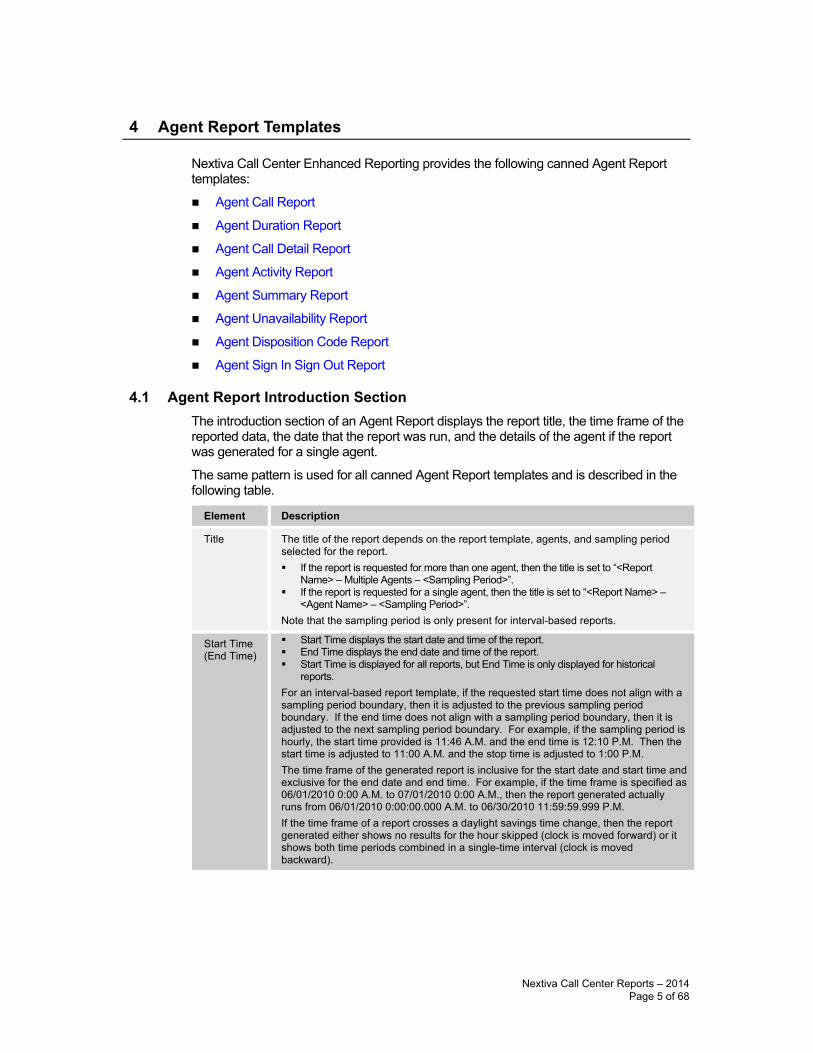
4.1 Agent Report Introduction Section The introduction section of an Agent Report displays the report title, the time frame of the reported data, the date that the report was run, and the details of the agent if the report was generated for a single agent.
The same pattern is used for all canned Agent Report templates and is described in the following table.
Element Description
Title The title of the report depends on the report template, agents, and sampling period selected for the report. If the report is requested for more than one agent, then the title is set to “<Report
Name> – Multiple Agents – <Sampling Period>”. If the report is requested for a single agent, then the title is set to “<Report Name> –
<Agent Name> – <Sampling Period>”. Note that the sampling period is only present for interval-based reports.
Start Time (End Time)
Start Time displays the start date and time of the report. End Time displays the end date and time of the report. Start Time is displayed for all reports, but End Time is only displayed for historical
reports. For an interval-based report template, if the requested start time does not align with a sampling period boundary, then it is adjusted to the previous sampling period boundary. If the end time does not align with a sampling period boundary, then it is adjusted to the next sampling period boundary. For example, if the sampling period is hourly, the start time provided is 11:46 A.M. and the end time is 12:10 P.M. Then the start time is adjusted to 11:00 A.M. and the stop time is adjusted to 1:00 P.M. The time frame of the generated report is inclusive for the start date and start time and exclusive for the end date and end time. For example, if the time frame is specified as 06/01/2010 0:00 A.M. to 07/01/2010 0:00 A.M., then the report generated actually runs from 06/01/2010 0:00:00.000 A.M. to 06/30/2010 11:59:59.999 P.M. If the time frame of a report crosses a daylight savings time change, then the report generated either shows no results for the hour skipped (clock is moved forward) or it shows both time periods combined in a single-time interval (clock is moved backward).
Nextiva Call Center Reports – 2014 Page 5 of 68
Element Description
Time Zone This is the time zone used for the generation of the report in a localized display format, for example “(GMT-04:00) (US) Eastern Time”. Note that the offset from GMT displayed in this introduction section is relative to the time of the report generation and not necessarily to the requested time frame. The time intervals provided in the contents of the report are always presented relative to the offset from GMT that is applicable at the time the statistics were collected for that time zone.
Date Run Date Run displays the date and time at which the report was generated.
Agent Information
If the report is generated for a single agent, then the detailed information for the agent is provided. The agent name, user ID, phone number, and extension are displayed.
If the agent only has a phone number configured, then only the phone number is displayed.
If the agent only has an extension configured, then only the extension is displayed.
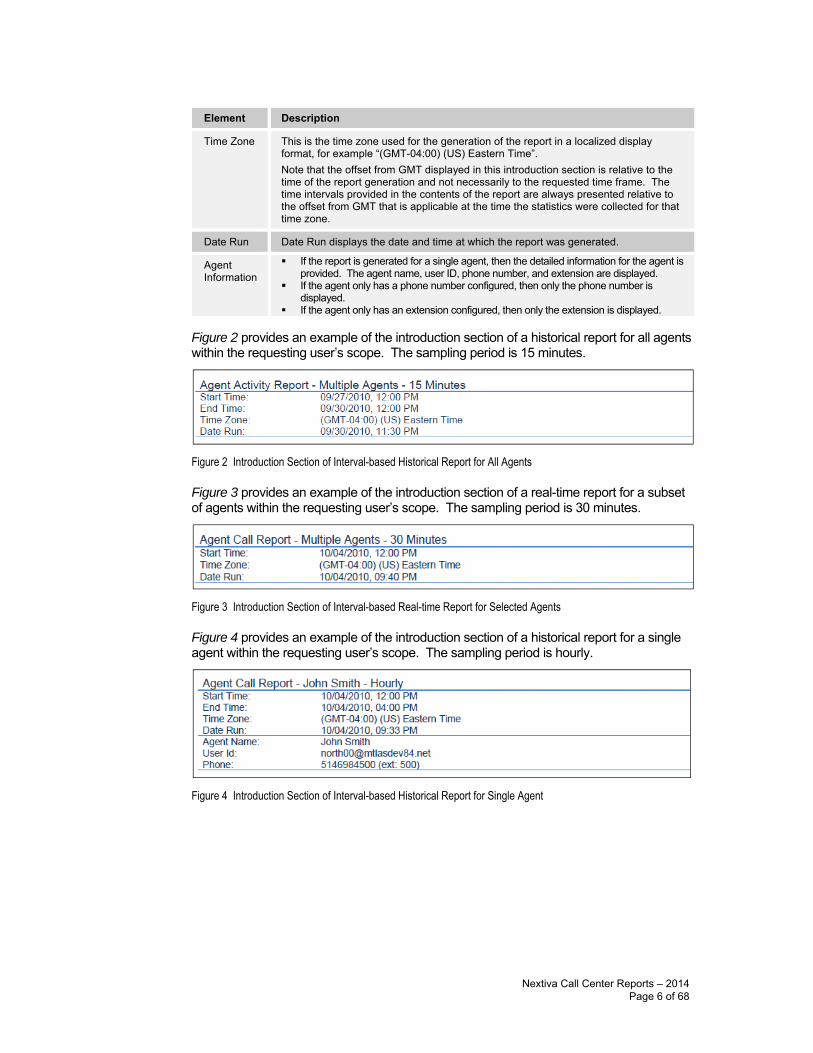
Figure 2 provides an example of the introduction section of a historical report for all agents within the requesting user’s scope. The sampling period is 15 minutes.
Figure 2 Introduction Section of Interval-based Historical Report for All Agents
Figure 3 provides an example of the introduction section of a real-time report for a subset of agents within the requesting user’s scope. The sampling period is 30 minutes.
Figure 3 Introduction Section of Interval-based Real-time Report for Selected Agents
Figure 4 provides an example of the introduction section of a historical report for a single agent within the requesting user’s scope. The sampling period is hourly.
Figure 4 Introduction Section of Interval-based Historical Report for Single Agent
Nextiva Call Center Reports – 2014 Page 6 of 68
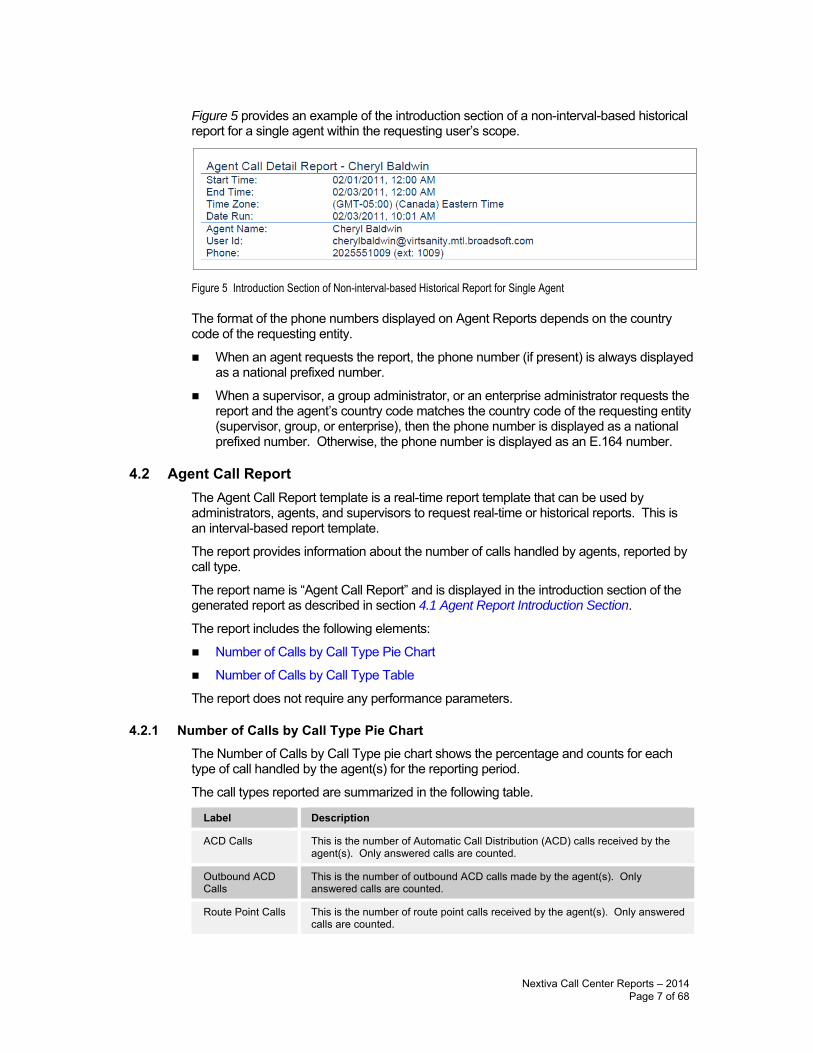
Figure 5 provides an example of the introduction section of a non-interval-based historical report for a single agent within the requesting user’s scope.
Figure 5 Introduction Section of Non-interval-based Historical Report for Single Agent
The format of the phone numbers displayed on Agent Reports depends on the country code of the requesting entity.
When an agent requests the report, the phone number (if present) is always displayedas a national prefixed number.
When a supervisor, a group administrator, or an enterprise administrator requests thereport and the agent’s country code matches the country code of the requesting entity(supervisor, group, or enterprise), then the phone number is displayed as a nationalprefixed number. Otherwise, the phone number is displayed as an E.164 number.
4.2 Agent Call Report The Agent Call Report template is a real-time report template that can be used by administrators, agents, and supervisors to request real-time or historical reports. This is an interval-based report template.
The report provides information about the number of calls handled by agents, reported by call type.
The report name is “Agent Call Report” and is displayed in the introduction section of the generated report as described in section 4.1 Agent Report Introduction Section.
The report includes the following elements:
Number of Calls by Call Type Pie Chart
Number of Calls by Call Type Table
The report does not require any performance parameters.
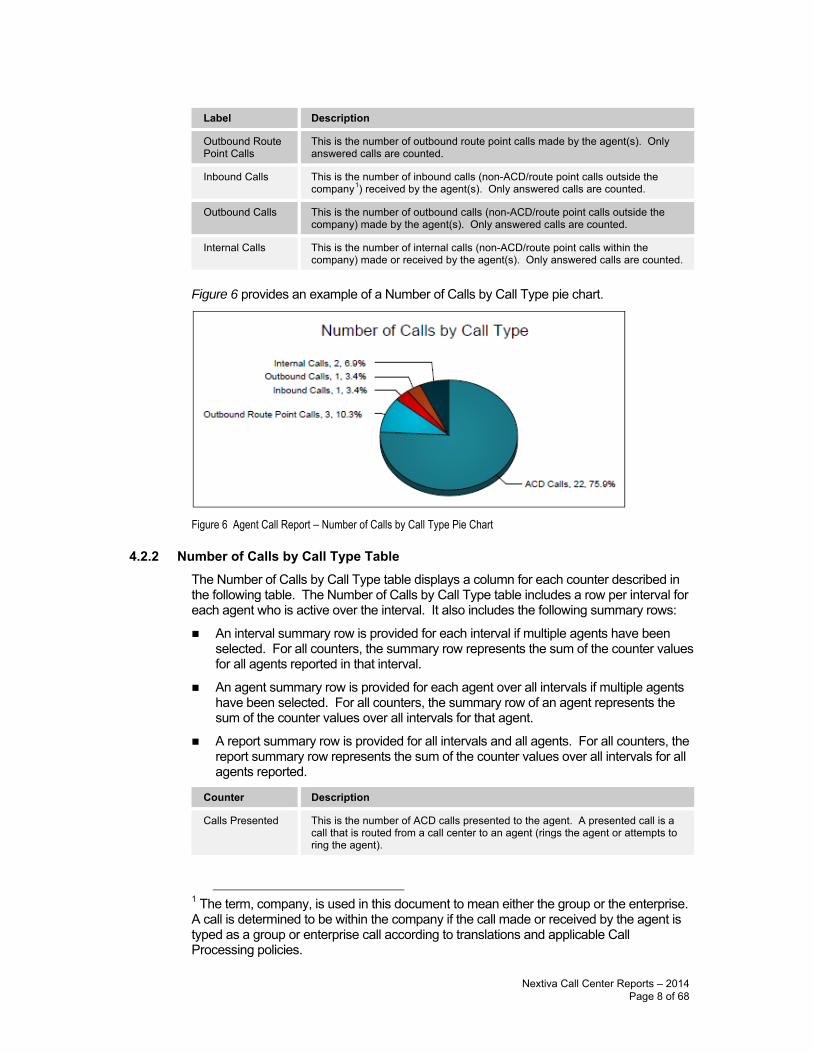
4.2.1 Number of Calls by Call Type Pie Chart The Number of Calls by Call Type pie chart shows the percentage and counts for each type of call handled by the agent(s) for the reporting period.
The call types reported are summarized in the following table.
Label Description
ACD Calls This is the number of Automatic Call Distribution (ACD) calls received by the agent(s). Only answered calls are counted.
Outbound ACD Calls
This is the number of outbound ACD calls made by the agent(s). Only answered calls are counted.
Route Point Calls This is the number of route point calls received by the agent(s). Only answered calls are counted.
Nextiva Call Center Reports – 2014 Page 7 of 68
Label Description
Outbound Route Point Calls
This is the number of outbound route point calls made by the agent(s). Only answered calls are counted.
Inbound Calls This is the number of inbound calls (non-ACD/route point calls outside the company1) received by the agent(s). Only answered calls are counted.
Outbound Calls This is the number of outbound calls (non-ACD/route point calls outside the company) made by the agent(s). Only answered calls are counted.
Internal Calls This is the number of internal calls (non-ACD/route point calls within the company) made or received by the agent(s). Only answered calls are counted.
Figure 6 provides an example of a Number of Calls by Call Type pie chart.
Figure 6 Agent Call Report – Number of Calls by Call Type Pie Chart
4.2.2 Number of Calls by Call Type Table The Number of Calls by Call Type table displays a column for each counter described in the following table. The Number of Calls by Call Type table includes a row per interval for each agent who is active over the interval. It also includes the following summary rows:
An interval summary row is provided for each interval if multiple agents have beenselected. For all counters, the summary row represents the sum of the counter valuesfor all agents reported in that interval.
An agent summary row is provided for each agent over all intervals if multiple agentshave been selected. For all counters, the summary row of an agent represents thesum of the counter values over all intervals for that agent.
A report summary row is provided for all intervals and all agents. For all counters, thereport summary row represents the sum of the counter values over all intervals for allagents reported.
Counter Description
Calls Presented This is the number of ACD calls presented to the agent. A presented call is a call that is routed from a call center to an agent (rings the agent or attempts to ring the agent).
1 The term, company, is used in this document to mean either the group or the enterprise. A call is determined to be within the company if the call made or received by the agent is typed as a group or enterprise call according to translations and applicable Call Processing policies.
Nextiva Call Center Reports – 2014 Page 8 of 68
Counter Description
ACD Calls This is the number of ACD calls received and answered by the agent.
Outbound ACD Calls
This is the number of outbound calls that had been made by the agent as an ACD, answered by the remote party.
Route Point Calls This is the number of route point calls received and answered by the agent.
Outbound Route Point Calls
This is the number of outbound calls that had been made by the agent as a route point, answered by the remote party.
Inbound Calls This is the number of non-ACD/route point calls (outside the company) received by the agent.
Outbound Calls This is the number of non-ACD/route point calls (outside the company) made by the agent.
Internal Calls This is the number of non-ACD/route point calls (within the company) made or received by the agent.
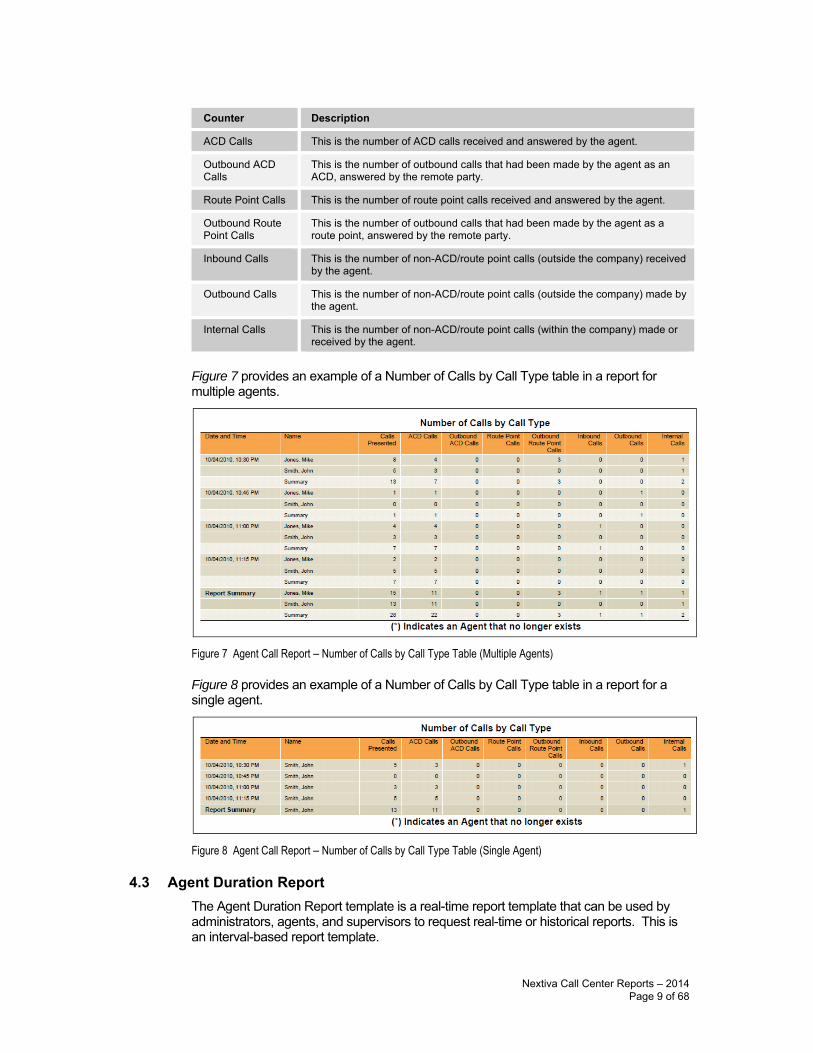
Figure 7 provides an example of a Number of Calls by Call Type table in a report for multiple agents.
Figure 7 Agent Call Report – Number of Calls by Call Type Table (Multiple Agents)
Figure 8 provides an example of a Number of Calls by Call Type table in a report for a single agent.
Figure 8 Agent Call Report – Number of Calls by Call Type Table (Single Agent)
4.3 Agent Duration Report The Agent Duration Report template is a real-time report template that can be used by administrators, agents, and supervisors to request real-time or historical reports. This is an interval-based report template.
Nextiva Call Center Reports – 2014 Page 9 of 68
The report provides information related to the duration of calls handled by agents.
The report name is “Agent Duration Report” and is displayed in the introduction section of the generated report described in section 4.1 Agent Report Introduction Section.
The report includes the following elements:
Call Duration by Call Type Bar Chart
Call Duration by Call Type Table
The report does not require any performance parameters.
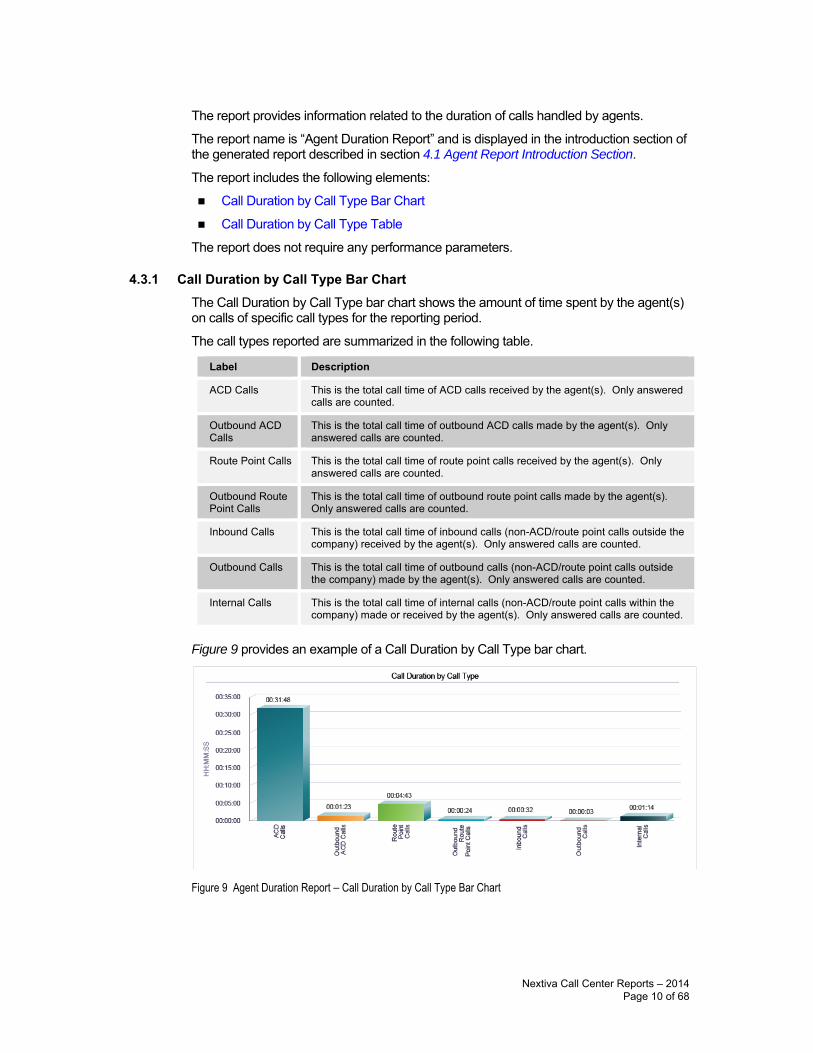
4.3.1 Call Duration by Call Type Bar Chart The Call Duration by Call Type bar chart shows the amount of time spent by the agent(s) on calls of specific call types for the reporting period.
The call types reported are summarized in the following table.
Label Description
ACD Calls This is the total call time of ACD calls received by the agent(s). Only answered calls are counted.
Outbound ACD Calls
This is the total call time of outbound ACD calls made by the agent(s). Only answered calls are counted.
Route Point Calls This is the total call time of route point calls received by the agent(s). Only answered calls are counted.
Outbound Route Point Calls
This is the total call time of outbound route point calls made by the agent(s). Only answered calls are counted.
Inbound Calls This is the total call time of inbound calls (non-ACD/route point calls outside the company) received by the agent(s). Only answered calls are counted.
Outbound Calls This is the total call time of outbound calls (non-ACD/route point calls outside the company) made by the agent(s). Only answered calls are counted.
Internal Calls This is the total call time of internal calls (non-ACD/route point calls within the company) made or received by the agent(s). Only answered calls are counted.
Figure 9 provides an example of a Call Duration by Call Type bar chart.
Figure 9 Agent Duration Report – Call Duration by Call Type Bar Chart
Nextiva Call Center Reports – 2014 Page 10 of 68
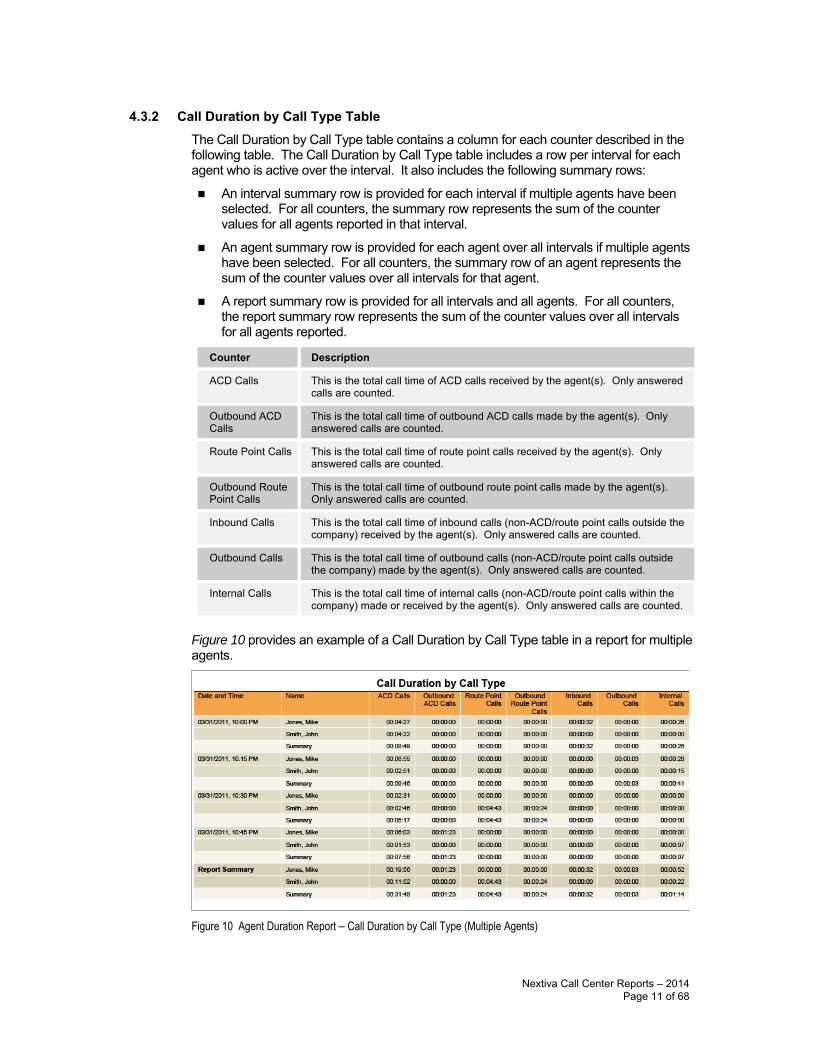
4.3.2 Call Duration by Call Type Table The Call Duration by Call Type table contains a column for each counter described in the following table. The Call Duration by Call Type table includes a row per interval for each agent who is active over the interval. It also includes the following summary rows:
An interval summary row is provided for each interval if multiple agents have beenselected. For all counters, the summary row represents the sum of the countervalues for all agents reported in that interval.
An agent summary row is provided for each agent over all intervals if multiple agentshave been selected. For all counters, the summary row of an agent represents thesum of the counter values over all intervals for that agent.
A report summary row is provided for all intervals and all agents. For all counters,the report summary row represents the sum of the counter values over all intervalsfor all agents reported.
Counter Description
ACD Calls This is the total call time of ACD calls received by the agent(s). Only answered calls are counted.
Outbound ACD Calls
This is the total call time of outbound ACD calls made by the agent(s). Only answered calls are counted.
Route Point Calls This is the total call time of route point calls received by the agent(s). Only answered calls are counted.
Outbound Route Point Calls
This is the total call time of outbound route point calls made by the agent(s). Only answered calls are counted.
Inbound Calls This is the total call time of inbound calls (non-ACD/route point calls outside the company) received by the agent(s). Only answered calls are counted.
Outbound Calls This is the total call time of outbound calls (non-ACD/route point calls outside the company) made by the agent(s). Only answered calls are counted.
Internal Calls This is the total call time of internal calls (non-ACD/route point calls within the company) made or received by the agent(s). Only answered calls are counted.
Figure 10 provides an example of a Call Duration by Call Type table in a report for multiple agents.
Figure 10 Agent Duration Report – Call Duration by Call Type (Multiple Agents)
Nextiva Call Center Reports – 2014 Page 11 of 68
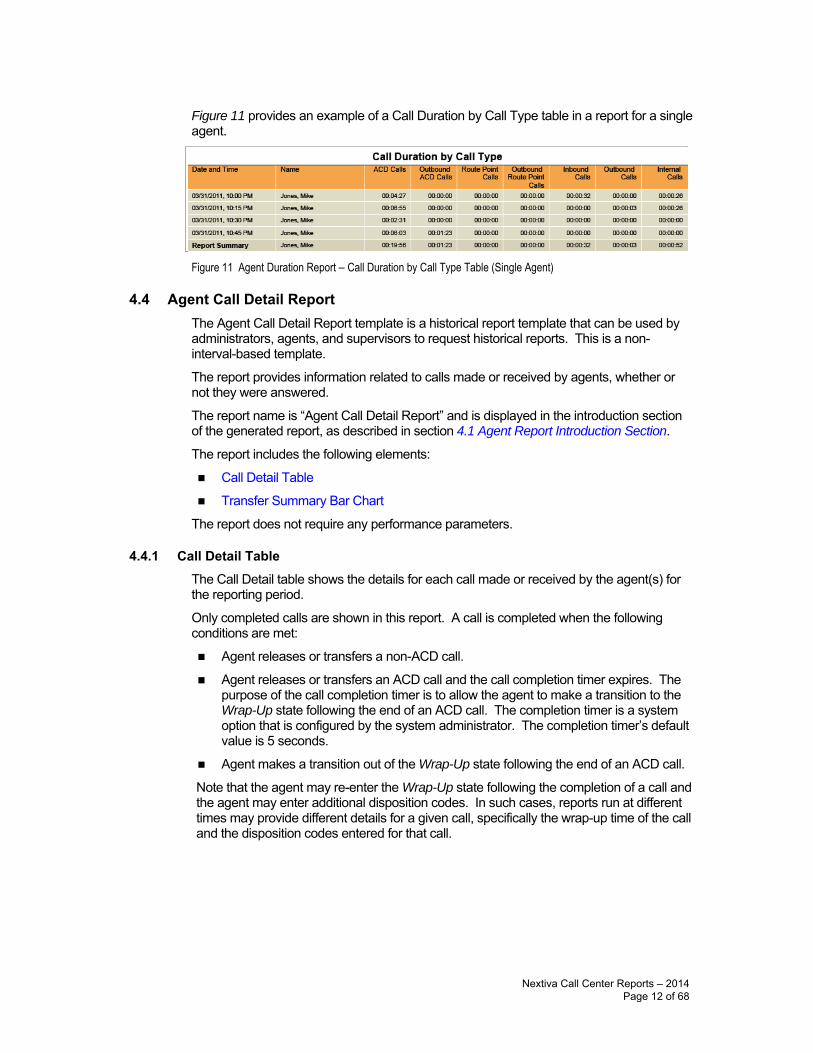
Figure 11 provides an example of a Call Duration by Call Type table in a report for a single agent.
Figure 11 Agent Duration Report – Call Duration by Call Type Table (Single Agent)
4.4 Agent Call Detail Report The Agent Call Detail Report template is a historical report template that can be used by administrators, agents, and supervisors to request historical reports. This is a non-interval-based template.
The report provides information related to calls made or received by agents, whether or not they were answered.
The report name is “Agent Call Detail Report” and is displayed in the introduction section of the generated report, as described in section 4.1 Agent Report Introduction Section.
The report includes the following elements:
Call Detail Table
Transfer Summary Bar Chart
The report does not require any performance parameters.
4.4.1 Call Detail Table The Call Detail table shows the details for each call made or received by the agent(s) for the reporting period.
Only completed calls are shown in this report. A call is completed when the following conditions are met:
Agent releases or transfers a non-ACD call.
Agent releases or transfers an ACD call and the call completion timer expires. Thepurpose of the call completion timer is to allow the agent to make a transition to theWrap-Up state following the end of an ACD call. The completion timer is a systemoption that is configured by the system administrator. The completion timer’s defaultvalue is 5 seconds.
Agent makes a transition out of the Wrap-Up state following the end of an ACD call.
Note that the agent may re-enter the Wrap-Up state following the completion of a call and the agent may enter additional disposition codes. In such cases, reports run at different times may provide different details for a given call, specifically the wrap-up time of the call and the disposition codes entered for that call.
Nextiva Call Center Reports – 2014 Page 12 of 68
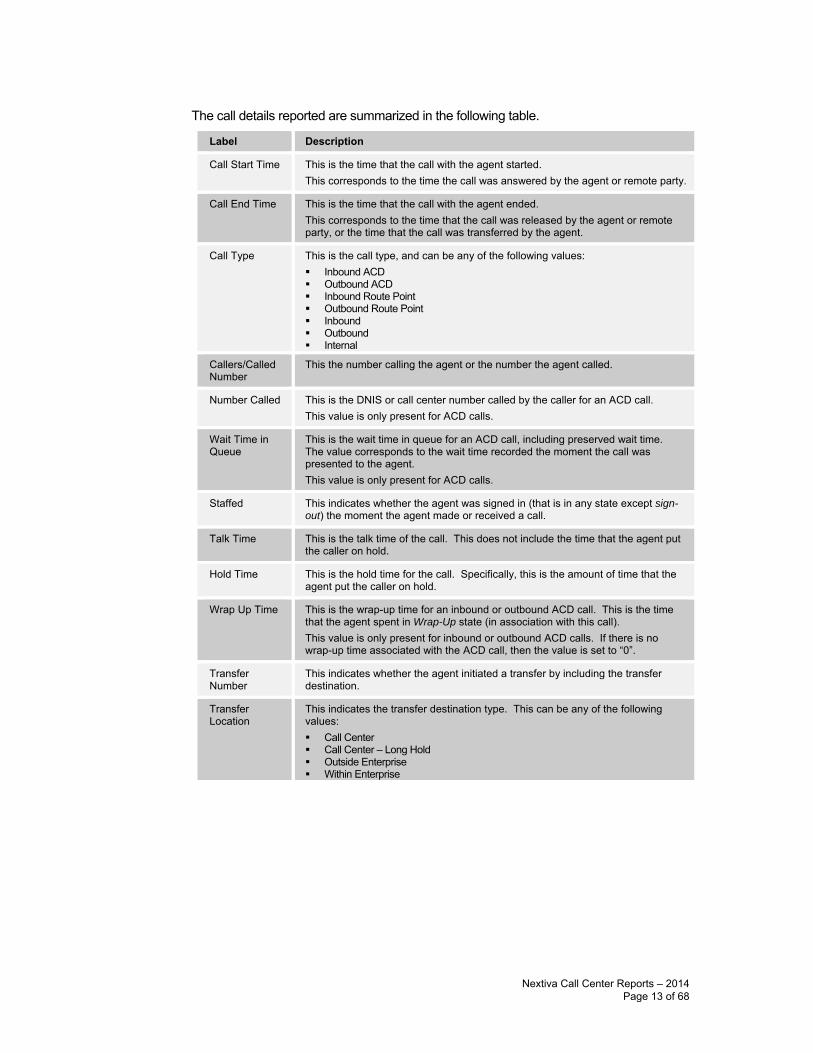
The call details reported are summarized in the following table.
Label Description
Call Start Time This is the time that the call with the agent started. This corresponds to the time the call was answered by the agent or remote party.
Call End Time This is the time that the call with the agent ended. This corresponds to the time that the call was released by the agent or remote party, or the time that the call was transferred by the agent.
Call Type This is the call type, and can be any of the following values: Inbound ACDOutbound ACD
Inbound Route Point Outbound Route Point
InboundOutboundInternal
Callers/Called Number
This the number calling the agent or the number the agent called.
Number Called This is the DNIS or call center number called by the caller for an ACD call. This value is only present for ACD calls.
Wait Time in Queue
This is the wait time in queue for an ACD call, including preserved wait time. The value corresponds to the wait time recorded the moment the call was presented to the agent. This value is only present for ACD calls.
Staffed This indicates whether the agent was signed in (that is in any state except sign-out) the moment the agent made or received a call.
Talk Time This is the talk time of the call. This does not include the time that the agent put the caller on hold.
Hold Time This is the hold time for the call. Specifically, this is the amount of time that the agent put the caller on hold.
Wrap Up Time This is the wrap-up time for an inbound or outbound ACD call. This is the time that the agent spent in Wrap-Up state (in association with this call). This value is only present for inbound or outbound ACD calls. If there is no wrap-up time associated with the ACD call, then the value is set to “0”.
Transfer Number
This indicates whether the agent initiated a transfer by including the transfer destination.
Transfer Location
This indicates the transfer destination type. This can be any of the following values:
Call Center Call Center – Long Hold
Outside EnterpriseWithin Enterprise
Nextiva Call Center Reports – 2014 Page 13 of 68
Label Description
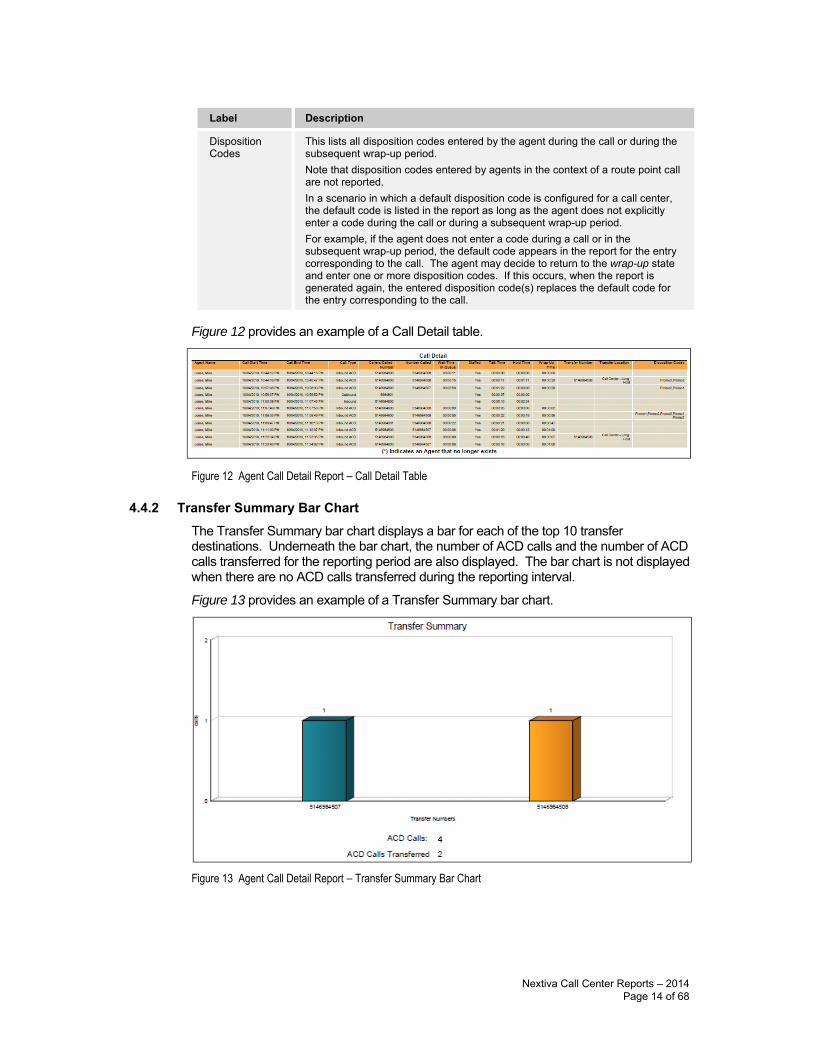
Disposition Codes
This lists all disposition codes entered by the agent during the call or during the subsequent wrap-up period. Note that disposition codes entered by agents in the context of a route point call are not reported. In a scenario in which a default disposition code is configured for a call center, the default code is listed in the report as long as the agent does not explicitly enter a code during the call or during a subsequent wrap-up period. For example, if the agent does not enter a code during a call or in the subsequent wrap-up period, the default code appears in the report for the entry corresponding to the call. The agent may decide to return to the wrap-up state and enter one or more disposition codes. If this occurs, when the report is generated again, the entered disposition code(s) replaces the default code for the entry corresponding to the call.
Figure 12 provides an example of a Call Detail table.
Figure 12 Agent Call Detail Report – Call Detail Table
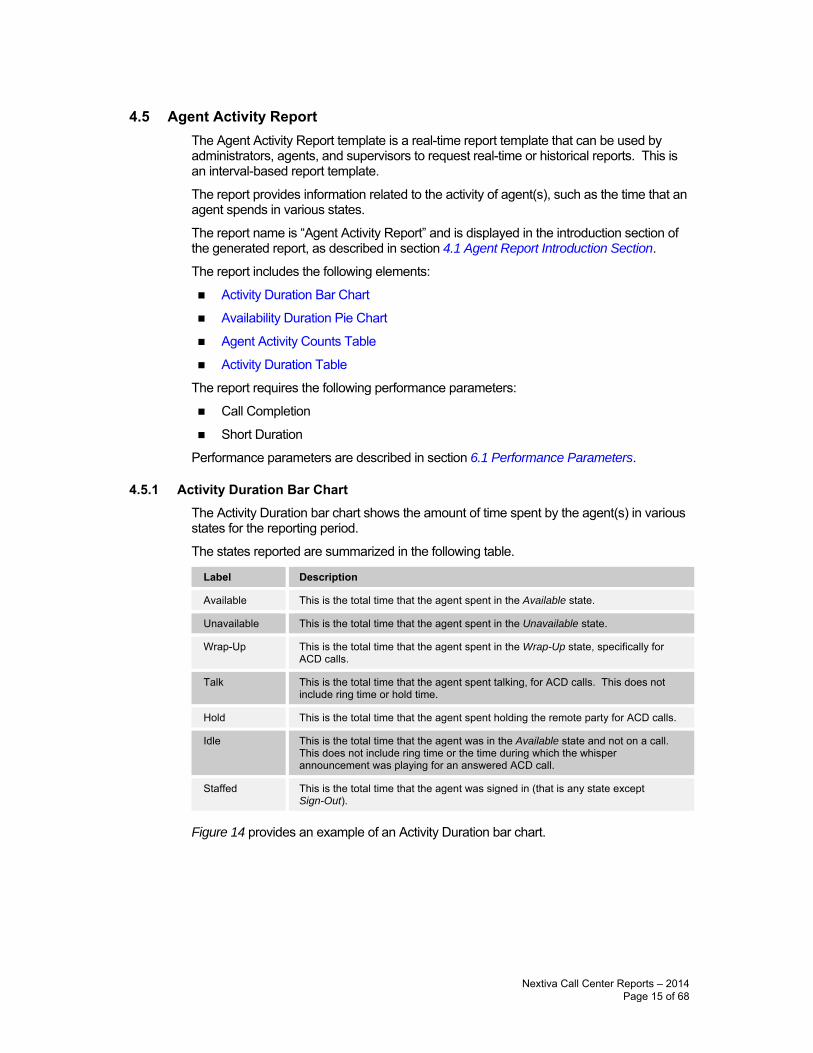
4.4.2 Transfer Summary Bar Chart The Transfer Summary bar chart displays a bar for each of the top 10 transfer destinations. Underneath the bar chart, the number of ACD calls and the number of ACD calls transferred for the reporting period are also displayed. The bar chart is not displayed when there are no ACD calls transferred during the reporting interval.
Figure 13 provides an example of a Transfer Summary bar chart.
Figure 13 Agent Call Detail Report – Transfer Summary Bar Chart
Nextiva Call Center Reports – 2014 Page 14 of 68
4.5 Agent Activity Report The Agent Activity Report template is a real-time report template that can be used by administrators, agents, and supervisors to request real-time or historical reports. This is an interval-based report template.
The report provides information related to the activity of agent(s), such as the time that an agent spends in various states.
The report name is “Agent Activity Report” and is displayed in the introduction section of the generated report, as described in section 4.1 Agent Report Introduction Section.
The report includes the following elements:
Activity Duration Bar Chart
Availability Duration Pie Chart
Agent Activity Counts Table
Activity Duration Table
The report requires the following performance parameters:
Call Completion
Short Duration
Performance parameters are described in section 6.1 Performance Parameters.
4.5.1 Activity Duration Bar Chart The Activity Duration bar chart shows the amount of time spent by the agent(s) in various states for the reporting period.
The states reported are summarized in the following table.
Label Description
Available This is the total time that the agent spent in the Available state.
Unavailable This is the total time that the agent spent in the Unavailable state.
Wrap-Up This is the total time that the agent spent in the Wrap-Up state, specifically for ACD calls.
Talk This is the total time that the agent spent talking, for ACD calls. This does not include ring time or hold time.
Hold This is the total time that the agent spent holding the remote party for ACD calls.
Idle This is the total time that the agent was in the Available state and not on a call. This does not include ring time or the time during which the whisper announcement was playing for an answered ACD call.
Staffed This is the total time that the agent was signed in (that is any state except Sign-Out).
Figure 14 provides an example of an Activity Duration bar chart.
Nextiva Call Center Reports – 2014 Page 15 of 68
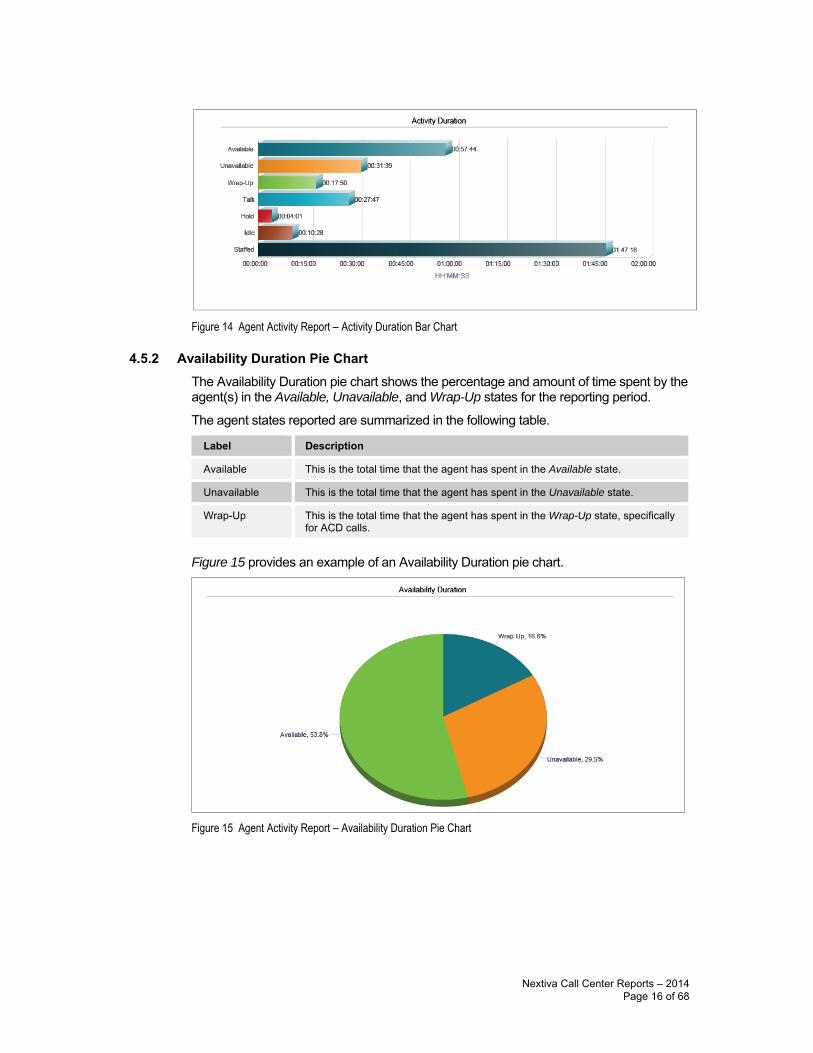
Figure 14 Agent Activity Report – Activity Duration Bar Chart
4.5.2 Availability Duration Pie Chart The Availability Duration pie chart shows the percentage and amount of time spent by the agent(s) in the Available, Unavailable, and Wrap-Up states for the reporting period.
The agent states reported are summarized in the following table.
Label Description
Available This is the total time that the agent has spent in the Available state.
Unavailable This is the total time that the agent has spent in the Unavailable state.
Wrap-Up This is the total time that the agent has spent in the Wrap-Up state, specifically for ACD calls.
Figure 15 provides an example of an Availability Duration pie chart.
Figure 15 Agent Activity Report – Availability Duration Pie Chart
Nextiva Call Center Reports – 2014 Page 16 of 68
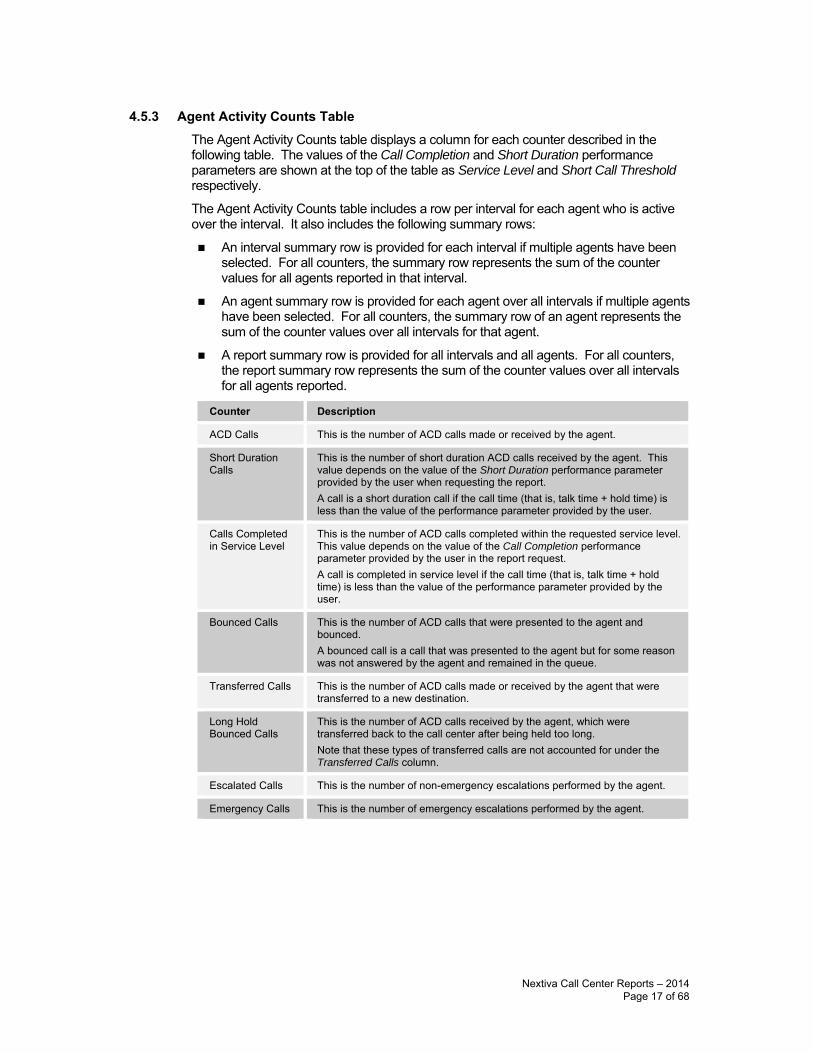
4.5.3 Agent Activity Counts Table The Agent Activity Counts table displays a column for each counter described in the following table. The values of the Call Completion and Short Duration performance parameters are shown at the top of the table as Service Level and Short Call Threshold respectively.
The Agent Activity Counts table includes a row per interval for each agent who is active over the interval. It also includes the following summary rows:
An interval summary row is provided for each interval if multiple agents have beenselected. For all counters, the summary row represents the sum of the countervalues for all agents reported in that interval.
An agent summary row is provided for each agent over all intervals if multiple agentshave been selected. For all counters, the summary row of an agent represents thesum of the counter values over all intervals for that agent.
A report summary row is provided for all intervals and all agents. For all counters,the report summary row represents the sum of the counter values over all intervalsfor all agents reported.
Counter Description
ACD Calls This is the number of ACD calls made or received by the agent.
Short Duration Calls
This is the number of short duration ACD calls received by the agent. This value depends on the value of the Short Duration performance parameter provided by the user when requesting the report. A call is a short duration call if the call time (that is, talk time + hold time) is less than the value of the performance parameter provided by the user.
Calls Completed in Service Level
This is the number of ACD calls completed within the requested service level. This value depends on the value of the Call Completion performance parameter provided by the user in the report request. A call is completed in service level if the call time (that is, talk time + hold time) is less than the value of the performance parameter provided by the user.
Bounced Calls This is the number of ACD calls that were presented to the agent and bounced. A bounced call is a call that was presented to the agent but for some reason was not answered by the agent and remained in the queue.
Transferred Calls This is the number of ACD calls made or received by the agent that were transferred to a new destination.
Long Hold Bounced Calls
This is the number of ACD calls received by the agent, which were transferred back to the call center after being held too long. Note that these types of transferred calls are not accounted for under the Transferred Calls column.
Escalated Calls This is the number of non-emergency escalations performed by the agent.
Emergency Calls This is the number of emergency escalations performed by the agent.
Nextiva Call Center Reports – 2014 Page 17 of 68

Figure 16 provides an example of an Agent Activity Counts table in a report for multiple agents.
Figure 16 Agent Activity Report – Agent Activity Counts Table (Multiple Agents)
Figure 17 provides an example of an Agent Activity Counts table in a report for a single agent.
Figure 17 Agent Activity Report – Agent Activity Counts Table (Single Agent)
4.5.4 Activity Duration Table The Activity Duration table displays a column for each duration counter. The table includes a row per interval for each agent who is active over the interval. It also includes the following summary rows:
An interval summary row is provided for each interval if multiple agents have beenselected. For all counters, the summary row represents the sum of the countervalues for all agents reported in that interval.
An agent summary row is provided for each agent over all intervals if multiple agentshave been selected. For all counters, the summary row of an agent represents thesum of the counter values over all intervals for that agent.
A report summary row is provided for all intervals and all agents. For all counters,the report summary row represents the sum of the counter values over all intervalsfor all agents reported.
Nextiva Call Center Reports – 2014 Page 18 of 68
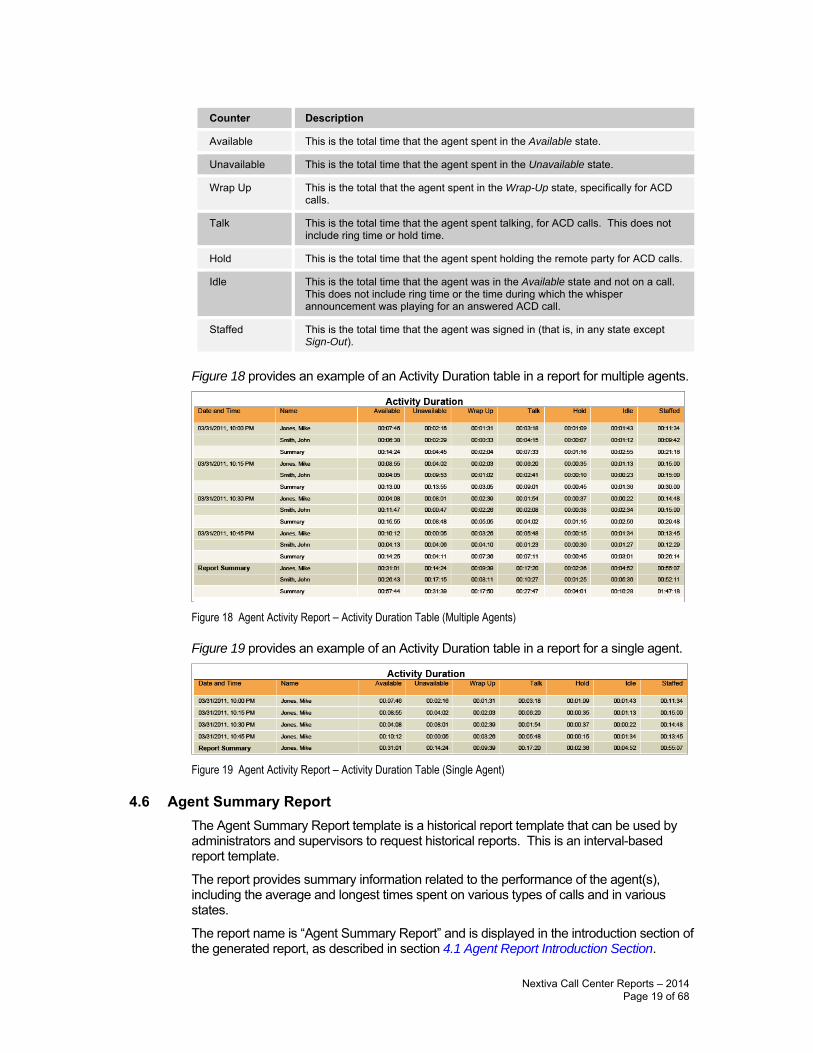
Counter Description
Available This is the total time that the agent spent in the Available state.
Unavailable This is the total time that the agent spent in the Unavailable state.
Wrap Up This is the total that the agent spent in the Wrap-Up state, specifically for ACD calls.
Talk This is the total time that the agent spent talking, for ACD calls. This does not include ring time or hold time.
Hold This is the total time that the agent spent holding the remote party for ACD calls.
Idle This is the total time that the agent was in the Available state and not on a call. This does not include ring time or the time during which the whisper announcement was playing for an answered ACD call.
Staffed This is the total time that the agent was signed in (that is, in any state except Sign-Out).
Figure 18 provides an example of an Activity Duration table in a report for multiple agents.
Figure 18 Agent Activity Report – Activity Duration Table (Multiple Agents)
Figure 19 provides an example of an Activity Duration table in a report for a single agent.
Figure 19 Agent Activity Report – Activity Duration Table (Single Agent)
4.6 Agent Summary Report The Agent Summary Report template is a historical report template that can be used by administrators and supervisors to request historical reports. This is an interval-based report template.
The report provides summary information related to the performance of the agent(s), including the average and longest times spent on various types of calls and in various states.
The report name is “Agent Summary Report” and is displayed in the introduction section of the generated report, as described in section 4.1 Agent Report Introduction Section.
Nextiva Call Center Reports – 2014 Page 19 of 68
The report includes the following elements:
Call Summary Bar Chart
Activity Summary Bar Chart
High Water Marks Bar Chart
Call Summary Table
Activity Summary Table
High Water Marks Table
The report does not require any performance parameters.
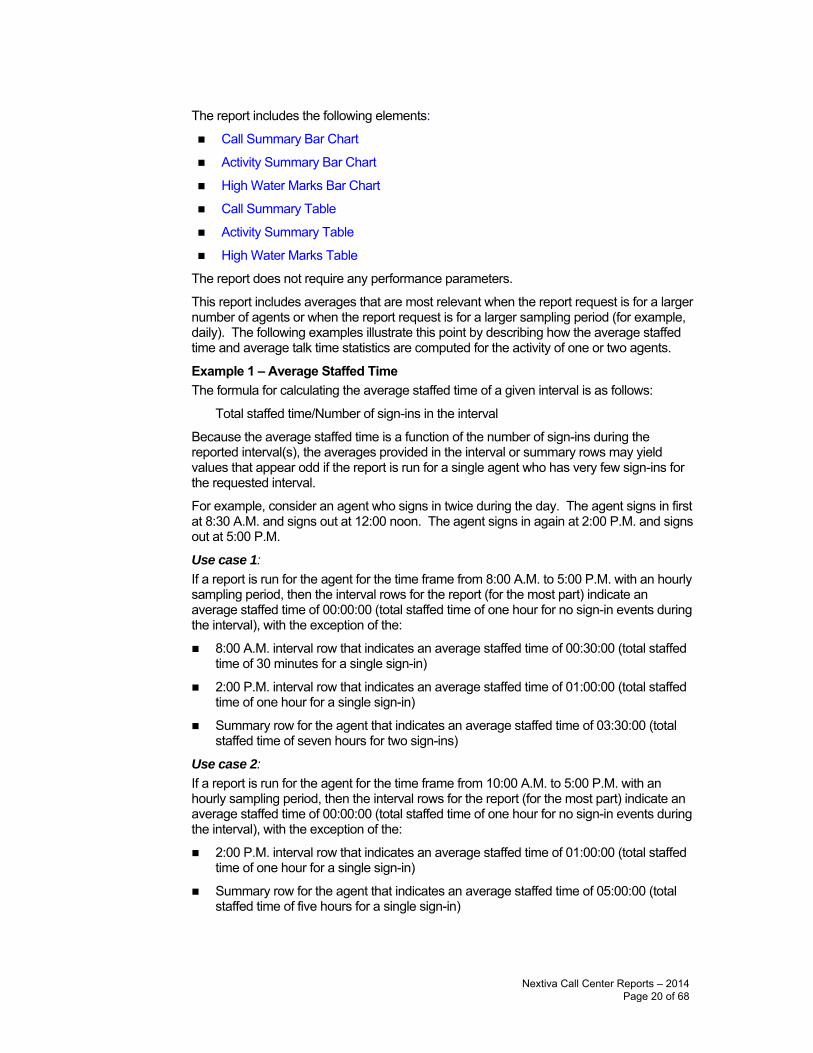
This report includes averages that are most relevant when the report request is for a larger number of agents or when the report request is for a larger sampling period (for example, daily). The following examples illustrate this point by describing how the average staffed time and average talk time statistics are computed for the activity of one or two agents.
Example 1 – Average Staffed Time The formula for calculating the average staffed time of a given interval is as follows:
Total staffed time/Number of sign-ins in the interval
Because the average staffed time is a function of the number of sign-ins during the reported interval(s), the averages provided in the interval or summary rows may yield values that appear odd if the report is run for a single agent who has very few sign-ins for the requested interval.
For example, consider an agent who signs in twice during the day. The agent signs in first at 8:30 A.M. and signs out at 12:00 noon. The agent signs in again at 2:00 P.M. and signs out at 5:00 P.M.
Use case 1: If a report is run for the agent for the time frame from 8:00 A.M. to 5:00 P.M. with an hourly sampling period, then the interval rows for the report (for the most part) indicate an average staffed time of 00:00:00 (total staffed time of one hour for no sign-in events during the interval), with the exception of the:
8:00 A.M. interval row that indicates an average staffed time of 00:30:00 (total staffedtime of 30 minutes for a single sign-in)
2:00 P.M. interval row that indicates an average staffed time of 01:00:00 (total staffedtime of one hour for a single sign-in)
Summary row for the agent that indicates an average staffed time of 03:30:00 (totalstaffed time of seven hours for two sign-ins)
Use case 2: If a report is run for the agent for the time frame from 10:00 A.M. to 5:00 P.M. with an hourly sampling period, then the interval rows for the report (for the most part) indicate an average staffed time of 00:00:00 (total staffed time of one hour for no sign-in events during the interval), with the exception of the:
2:00 P.M. interval row that indicates an average staffed time of 01:00:00 (total staffedtime of one hour for a single sign-in)
Summary row for the agent that indicates an average staffed time of 05:00:00 (totalstaffed time of five hours for a single sign-in)
Nextiva Call Center Reports – 2014 Page 20 of 68
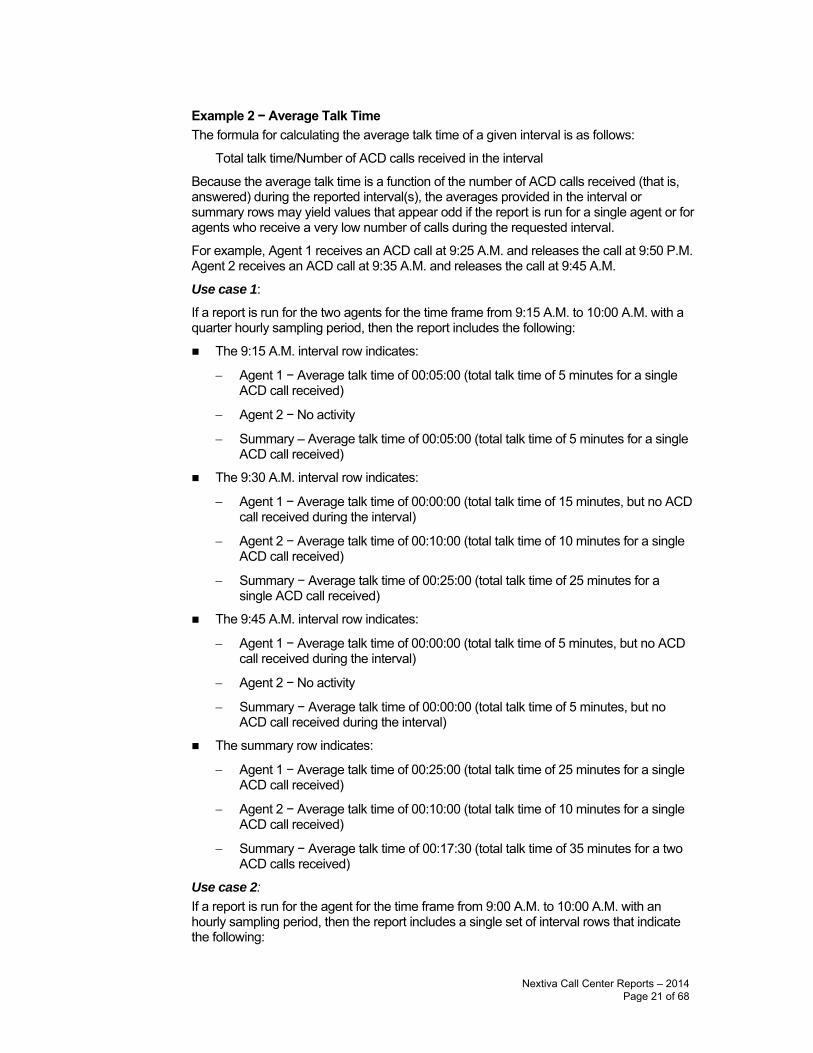
Example 2 − Average Talk Time The formula for calculating the average talk time of a given interval is as follows:
Total talk time/Number of ACD calls received in the interval
Because the average talk time is a function of the number of ACD calls received (that is, answered) during the reported interval(s), the averages provided in the interval or summary rows may yield values that appear odd if the report is run for a single agent or for agents who receive a very low number of calls during the requested interval.
For example, Agent 1 receives an ACD call at 9:25 A.M. and releases the call at 9:50 P.M. Agent 2 receives an ACD call at 9:35 A.M. and releases the call at 9:45 A.M.
Use case 1:
If a report is run for the two agents for the time frame from 9:15 A.M. to 10:00 A.M. with a quarter hourly sampling period, then the report includes the following:
The 9:15 A.M. interval row indicates:
− Agent 1 − Average talk time of 00:05:00 (total talk time of 5 minutes for a singleACD call received)
− Agent 2 − No activity
− Summary – Average talk time of 00:05:00 (total talk time of 5 minutes for a single ACD call received)
The 9:30 A.M. interval row indicates:
− Agent 1 − Average talk time of 00:00:00 (total talk time of 15 minutes, but no ACDcall received during the interval)
− Agent 2 − Average talk time of 00:10:00 (total talk time of 10 minutes for a single ACD call received)
− Summary − Average talk time of 00:25:00 (total talk time of 25 minutes for a single ACD call received)
The 9:45 A.M. interval row indicates:
− Agent 1 − Average talk time of 00:00:00 (total talk time of 5 minutes, but no ACDcall received during the interval)
− Agent 2 − No activity
− Summary − Average talk time of 00:00:00 (total talk time of 5 minutes, but no ACD call received during the interval)
The summary row indicates:
− Agent 1 − Average talk time of 00:25:00 (total talk time of 25 minutes for a singleACD call received)
− Agent 2 − Average talk time of 00:10:00 (total talk time of 10 minutes for a single ACD call received)
− Summary − Average talk time of 00:17:30 (total talk time of 35 minutes for a two ACD calls received)
Use case 2: If a report is run for the agent for the time frame from 9:00 A.M. to 10:00 A.M. with an hourly sampling period, then the report includes a single set of interval rows that indicate the following:
Nextiva Call Center Reports – 2014 Page 21 of 68
Agent 1 – Average talk time of 00:25:00 (total talk time of 25 minutes for a single ACDcall received)
Agent 2 − Average talk time of 00:10:00 (total talk time of 10 minutes for a single ACDcall received)
Summary − Average talk time of 00:17:30 (total talk time of 35 minutes for two ACDcalls received)
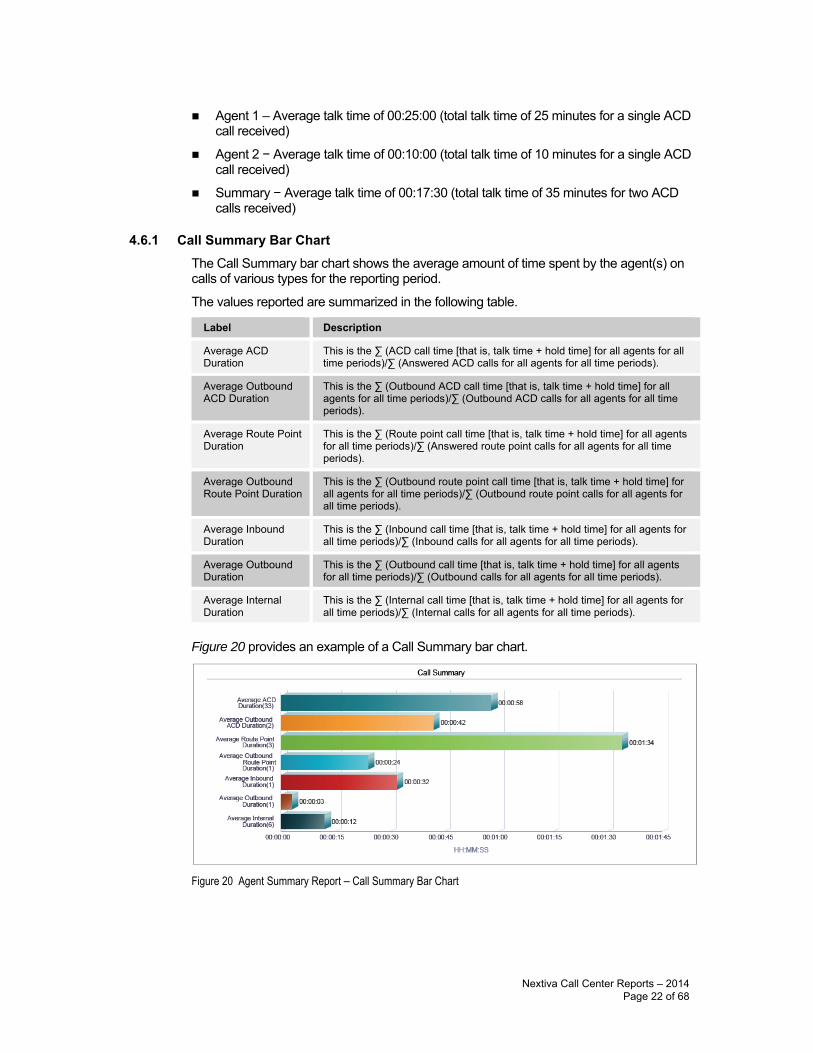
4.6.1 Call Summary Bar Chart The Call Summary bar chart shows the average amount of time spent by the agent(s) on calls of various types for the reporting period.
The values reported are summarized in the following table.
Label Description
Average ACD Duration
This is the ∑ (ACD call time [that is, talk time + hold time] for all agents for all time periods)/∑ (Answered ACD calls for all agents for all time periods).
Average Outbound ACD Duration
This is the ∑ (Outbound ACD call time [that is, talk time + hold time] for all agents for all time periods)/∑ (Outbound ACD calls for all agents for all time periods).
Average Route Point Duration
This is the ∑ (Route point call time [that is, talk time + hold time] for all agents for all time periods)/∑ (Answered route point calls for all agents for all time periods).
Average Outbound Route Point Duration
This is the ∑ (Outbound route point call time [that is, talk time + hold time] for all agents for all time periods)/∑ (Outbound route point calls for all agents for all time periods).
Average Inbound Duration
This is the ∑ (Inbound call time [that is, talk time + hold time] for all agents for all time periods)/∑ (Inbound calls for all agents for all time periods).
Average Outbound Duration
This is the ∑ (Outbound call time [that is, talk time + hold time] for all agents for all time periods)/∑ (Outbound calls for all agents for all time periods).
Average Internal Duration
This is the ∑ (Internal call time [that is, talk time + hold time] for all agents for all time periods)/∑ (Internal calls for all agents for all time periods).
Figure 20 provides an example of a Call Summary bar chart.
Figure 20 Agent Summary Report – Call Summary Bar Chart
Nextiva Call Center Reports – 2014 Page 22 of 68
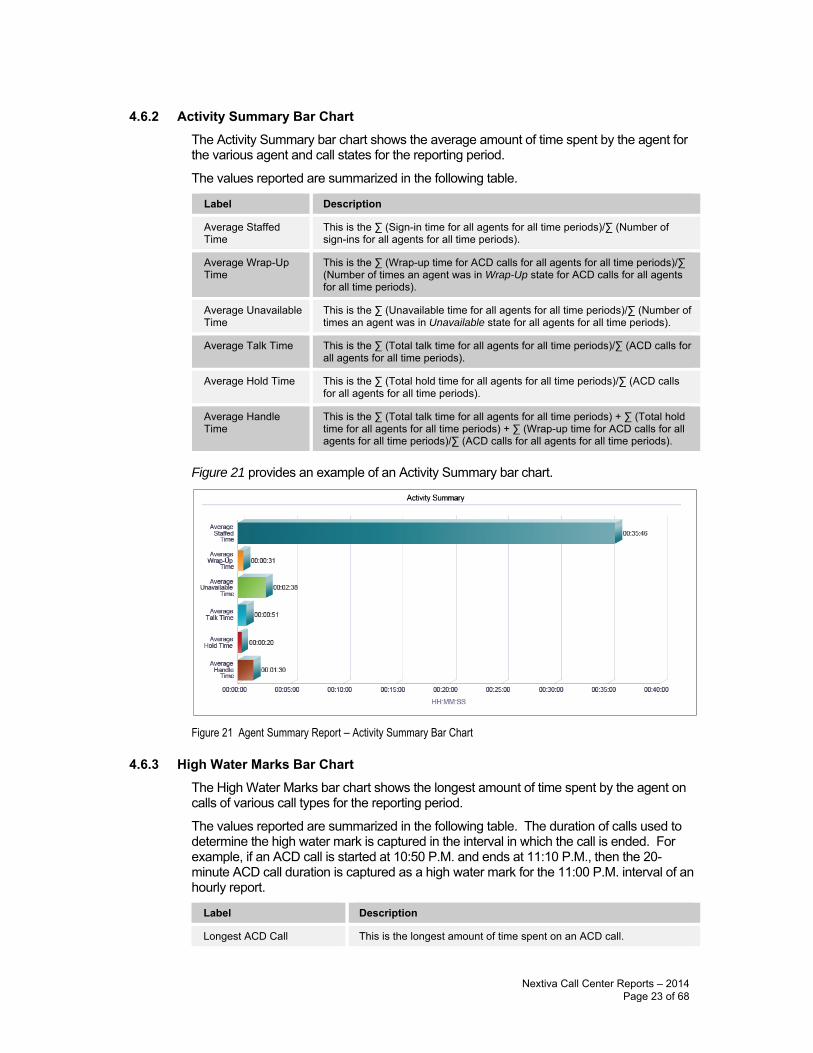
4.6.2 Activity Summary Bar Chart The Activity Summary bar chart shows the average amount of time spent by the agent for the various agent and call states for the reporting period.
The values reported are summarized in the following table.
Label Description
Average Staffed Time
This is the ∑ (Sign-in time for all agents for all time periods)/∑ (Number of sign-ins for all agents for all time periods).
Average Wrap-Up Time
This is the ∑ (Wrap-up time for ACD calls for all agents for all time periods)/∑ (Number of times an agent was in Wrap-Up state for ACD calls for all agents for all time periods).
Average Unavailable Time
This is the ∑ (Unavailable time for all agents for all time periods)/∑ (Number of times an agent was in Unavailable state for all agents for all time periods).
Average Talk Time This is the ∑ (Total talk time for all agents for all time periods)/∑ (ACD calls for all agents for all time periods).
Average Hold Time This is the ∑ (Total hold time for all agents for all time periods)/∑ (ACD calls for all agents for all time periods).
Average Handle Time
This is the ∑ (Total talk time for all agents for all time periods) + ∑ (Total hold time for all agents for all time periods) + ∑ (Wrap-up time for ACD calls for all agents for all time periods)/∑ (ACD calls for all agents for all time periods).
Figure 21 provides an example of an Activity Summary bar chart.
Figure 21 Agent Summary Report – Activity Summary Bar Chart
4.6.3 High Water Marks Bar Chart The High Water Marks bar chart shows the longest amount of time spent by the agent on calls of various call types for the reporting period.
The values reported are summarized in the following table. The duration of calls used to determine the high water mark is captured in the interval in which the call is ended. For example, if an ACD call is started at 10:50 P.M. and ends at 11:10 P.M., then the 20-minute ACD call duration is captured as a high water mark for the 11:00 P.M. interval of an hourly report.
Label Description
Longest ACD Call This is the longest amount of time spent on an ACD call.
Nextiva Call Center Reports – 2014 Page 23 of 68
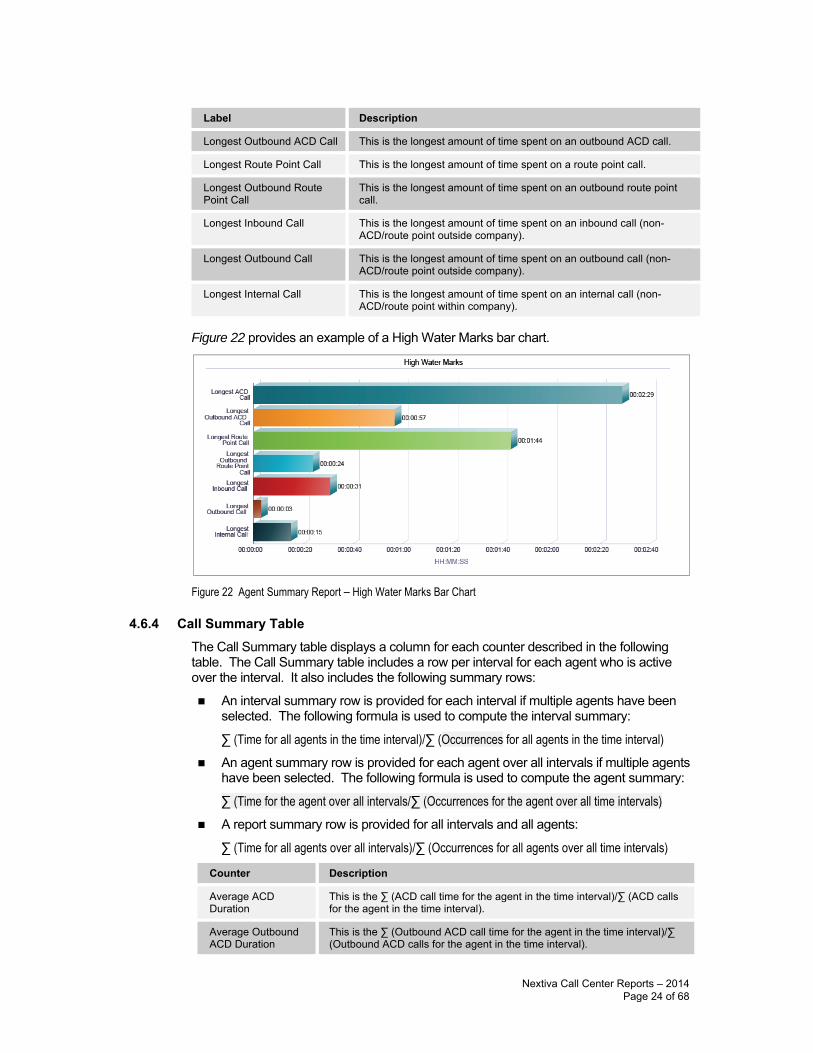
Label Description
Longest Outbound ACD Call This is the longest amount of time spent on an outbound ACD call.
Longest Route Point Call This is the longest amount of time spent on a route point call.
Longest Outbound Route Point Call
This is the longest amount of time spent on an outbound route point call.
Longest Inbound Call This is the longest amount of time spent on an inbound call (non-ACD/route point outside company).
Longest Outbound Call This is the longest amount of time spent on an outbound call (non-ACD/route point outside company).
Longest Internal Call This is the longest amount of time spent on an internal call (non-ACD/route point within company).
Figure 22 provides an example of a High Water Marks bar chart.
Figure 22 Agent Summary Report – High Water Marks Bar Chart
4.6.4 Call Summary Table The Call Summary table displays a column for each counter described in the following table. The Call Summary table includes a row per interval for each agent who is active over the interval. It also includes the following summary rows:
An interval summary row is provided for each interval if multiple agents have beenselected. The following formula is used to compute the interval summary:
∑ (Time for all agents in the time interval)/∑ (Occurrences for all agents in the time interval) An agent summary row is provided for each agent over all intervals if multiple agents
have been selected. The following formula is used to compute the agent summary:
∑ (Time for the agent over all intervals/∑ (Occurrences for the agent over all time intervals) A report summary row is provided for all intervals and all agents:
∑ (Time for all agents over all intervals)/∑ (Occurrences for all agents over all time intervals)
Counter Description
Average ACD Duration
This is the ∑ (ACD call time for the agent in the time interval)/∑ (ACD calls for the agent in the time interval).
Average Outbound ACD Duration
This is the ∑ (Outbound ACD call time for the agent in the time interval)/∑ (Outbound ACD calls for the agent in the time interval).
Nextiva Call Center Reports – 2014 Page 24 of 68
Counter Description
Average Route Point Duration
This is the ∑ (Route point call time for the agent in the time interval)/∑ (Route point calls for the agent in the time interval).
Average Outbound Route Point Duration
This is the ∑ (Outbound route point call time for the agent in the time interval)/∑ (Outbound route point calls for the agent in the time interval).
Average Inbound Duration
This is the ∑ (Inbound call time for the agent in the time interval)/∑ (Inbound calls for the agent in the time interval).
Average Outbound Duration
This is the ∑ (Outbound call time for the agent in the time interval)/∑ (Outbound calls for the agent in the time interval).
Average Internal Duration
This is the ∑ (Internal call time for the agent in the time interval)/∑ (Internal calls for the agent in the time interval).
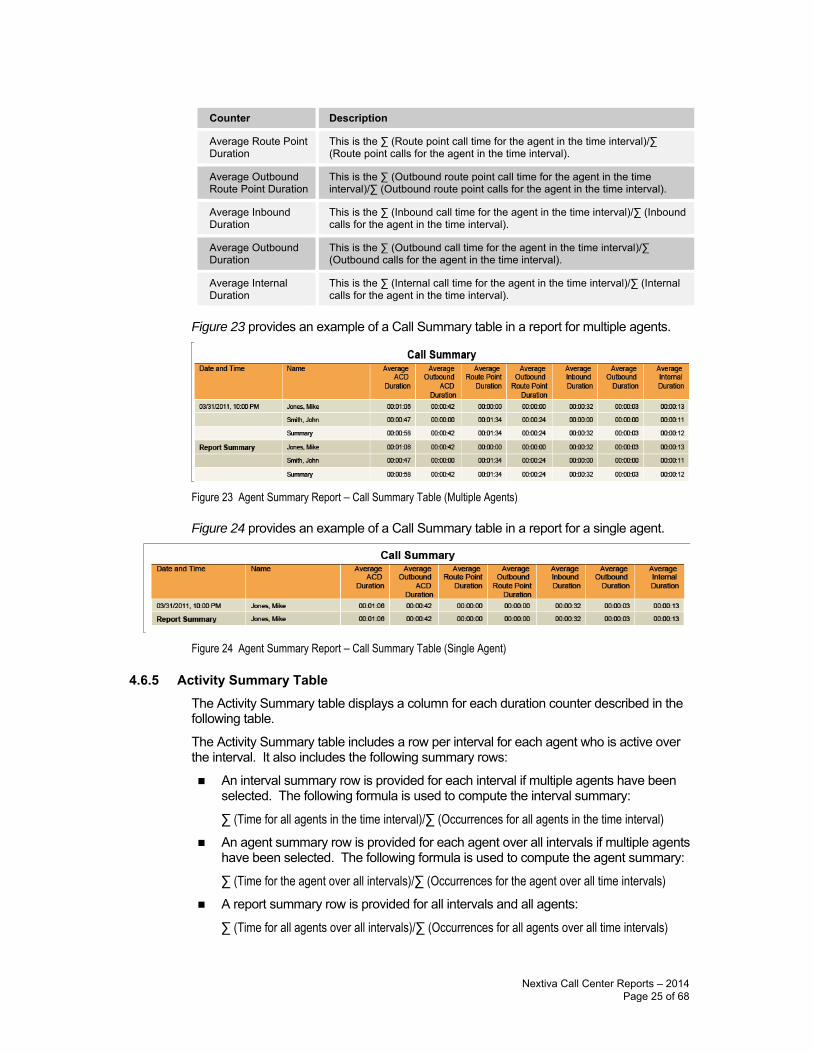
Figure 23 provides an example of a Call Summary table in a report for multiple agents.
Figure 23 Agent Summary Report – Call Summary Table (Multiple Agents)
Figure 24 provides an example of a Call Summary table in a report for a single agent.
Figure 24 Agent Summary Report – Call Summary Table (Single Agent)
4.6.5 Activity Summary Table The Activity Summary table displays a column for each duration counter described in the following table.
The Activity Summary table includes a row per interval for each agent who is active over the interval. It also includes the following summary rows:
An interval summary row is provided for each interval if multiple agents have beenselected. The following formula is used to compute the interval summary:
∑ (Time for all agents in the time interval)/∑ (Occurrences for all agents in the time interval) An agent summary row is provided for each agent over all intervals if multiple agents
have been selected. The following formula is used to compute the agent summary:
∑ (Time for the agent over all intervals)/∑ (Occurrences for the agent over all time intervals) A report summary row is provided for all intervals and all agents:
∑ (Time for all agents over all intervals)/∑ (Occurrences for all agents over all time intervals)
Nextiva Call Center Reports – 2014 Page 25 of 68
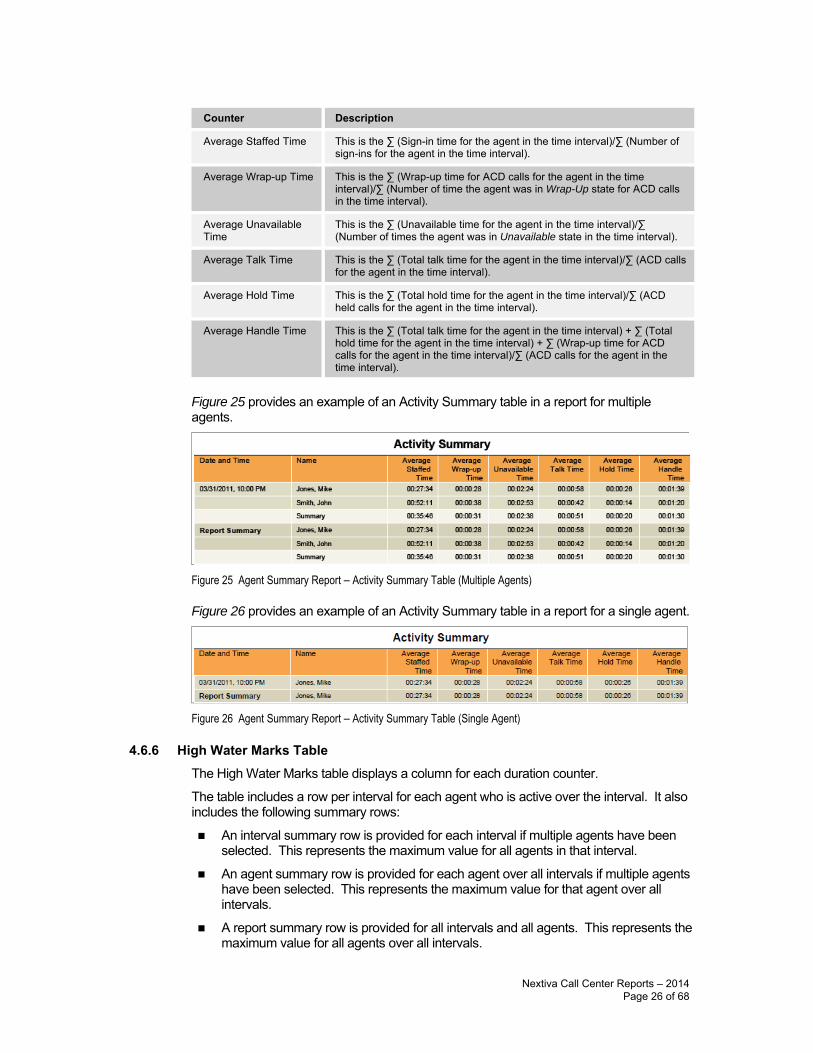
Counter Description
Average Staffed Time This is the ∑ (Sign-in time for the agent in the time interval)/∑ (Number of sign-ins for the agent in the time interval).
Average Wrap-up Time This is the ∑ (Wrap-up time for ACD calls for the agent in the time interval)/∑ (Number of time the agent was in Wrap-Up state for ACD calls in the time interval).
Average Unavailable Time
This is the ∑ (Unavailable time for the agent in the time interval)/∑ (Number of times the agent was in Unavailable state in the time interval).
Average Talk Time This is the ∑ (Total talk time for the agent in the time interval)/∑ (ACD calls for the agent in the time interval).
Average Hold Time This is the ∑ (Total hold time for the agent in the time interval)/∑ (ACD held calls for the agent in the time interval).
Average Handle Time This is the ∑ (Total talk time for the agent in the time interval) + ∑ (Total hold time for the agent in the time interval) + ∑ (Wrap-up time for ACD calls for the agent in the time interval)/∑ (ACD calls for the agent in the time interval).
Figure 25 provides an example of an Activity Summary table in a report for multiple agents.
Figure 25 Agent Summary Report – Activity Summary Table (Multiple Agents)
Figure 26 provides an example of an Activity Summary table in a report for a single agent.
Figure 26 Agent Summary Report – Activity Summary Table (Single Agent)
4.6.6 High Water Marks Table The High Water Marks table displays a column for each duration counter.
The table includes a row per interval for each agent who is active over the interval. It also includes the following summary rows:
An interval summary row is provided for each interval if multiple agents have beenselected. This represents the maximum value for all agents in that interval.
An agent summary row is provided for each agent over all intervals if multiple agentshave been selected. This represents the maximum value for that agent over allintervals.
A report summary row is provided for all intervals and all agents. This represents themaximum value for all agents over all intervals.
Nextiva Call Center Reports – 2014 Page 26 of 68
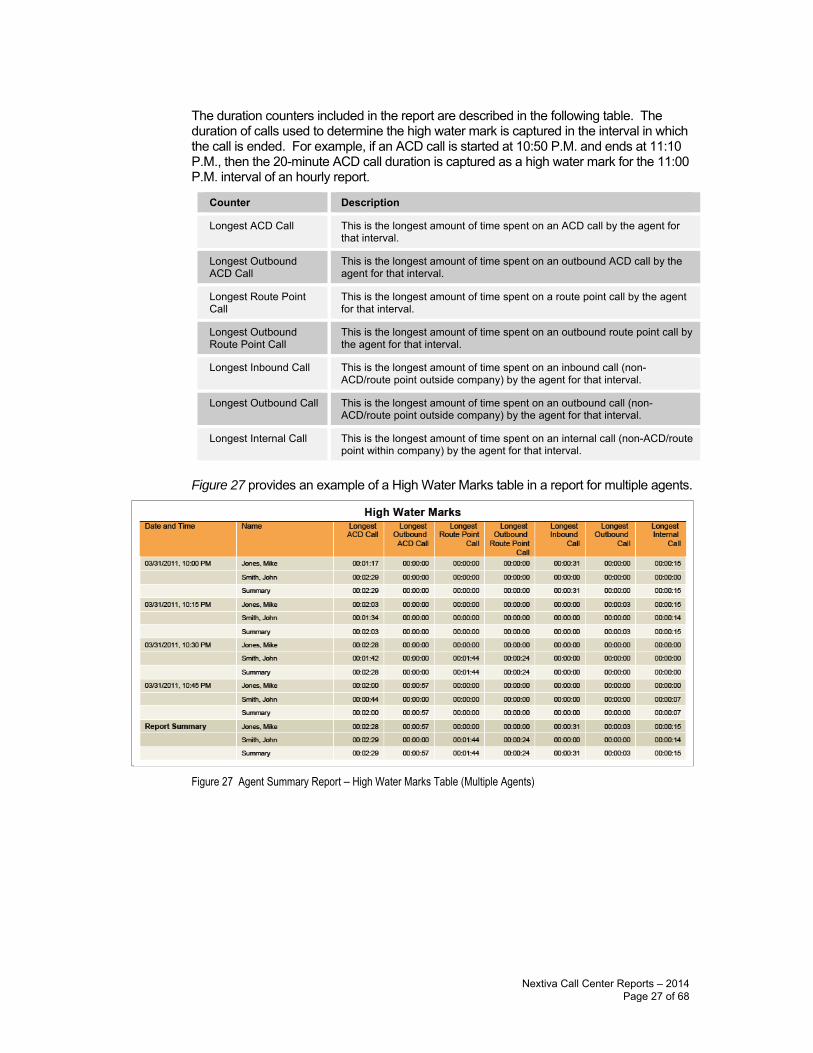
The duration counters included in the report are described in the following table. The duration of calls used to determine the high water mark is captured in the interval in which the call is ended. For example, if an ACD call is started at 10:50 P.M. and ends at 11:10 P.M., then the 20-minute ACD call duration is captured as a high water mark for the 11:00 P.M. interval of an hourly report.
Counter Description
Longest ACD Call This is the longest amount of time spent on an ACD call by the agent for that interval.
Longest Outbound ACD Call
This is the longest amount of time spent on an outbound ACD call by the agent for that interval.
Longest Route Point Call
This is the longest amount of time spent on a route point call by the agent for that interval.
Longest Outbound Route Point Call
This is the longest amount of time spent on an outbound route point call by the agent for that interval.
Longest Inbound Call This is the longest amount of time spent on an inbound call (non-ACD/route point outside company) by the agent for that interval.
Longest Outbound Call This is the longest amount of time spent on an outbound call (non-ACD/route point outside company) by the agent for that interval.
Longest Internal Call This is the longest amount of time spent on an internal call (non-ACD/route point within company) by the agent for that interval.
Figure 27 provides an example of a High Water Marks table in a report for multiple agents.
Figure 27 Agent Summary Report – High Water Marks Table (Multiple Agents)
Nextiva Call Center Reports – 2014 Page 27 of 68
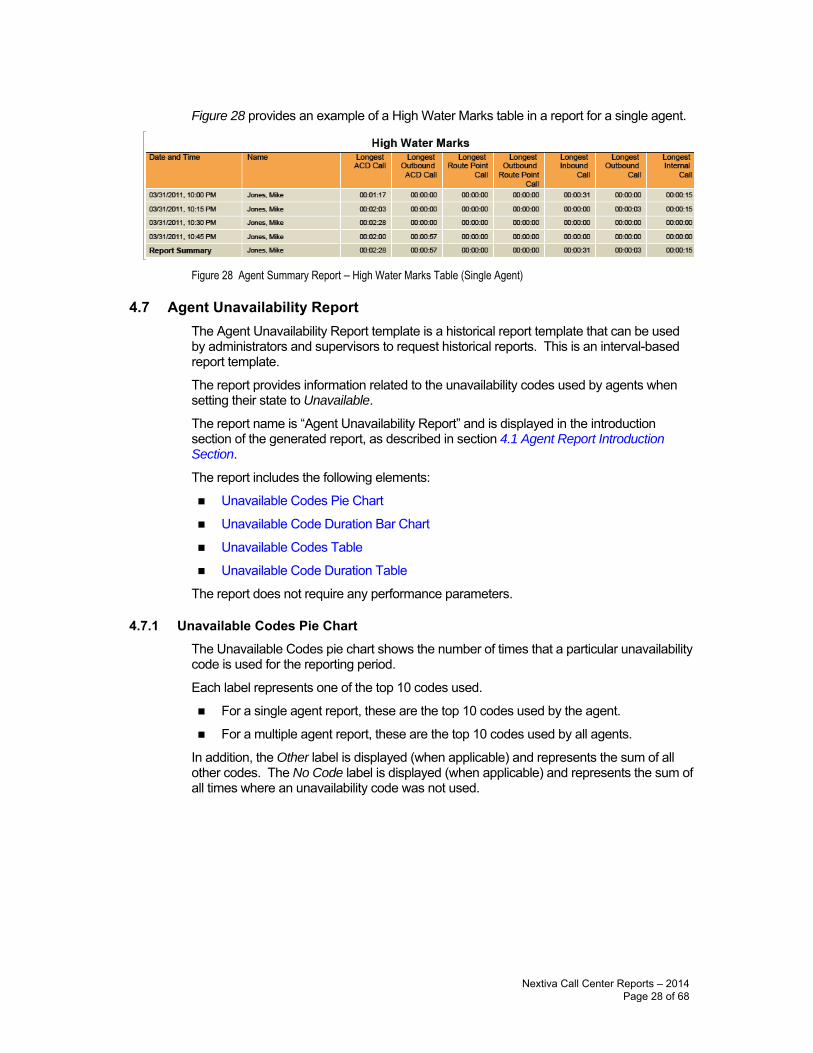
Figure 28 provides an example of a High Water Marks table in a report for a single agent.
Figure 28 Agent Summary Report – High Water Marks Table (Single Agent)
4.7 Agent Unavailability Report The Agent Unavailability Report template is a historical report template that can be used by administrators and supervisors to request historical reports. This is an interval-based report template.
The report provides information related to the unavailability codes used by agents when setting their state to Unavailable.
The report name is “Agent Unavailability Report” and is displayed in the introduction section of the generated report, as described in section 4.1 Agent Report Introduction Section.
The report includes the following elements:
Unavailable Codes Pie Chart
Unavailable Code Duration Bar Chart
Unavailable Codes Table
Unavailable Code Duration Table
The report does not require any performance parameters.
4.7.1 Unavailable Codes Pie Chart The Unavailable Codes pie chart shows the number of times that a particular unavailability code is used for the reporting period.
Each label represents one of the top 10 codes used.
For a single agent report, these are the top 10 codes used by the agent.
For a multiple agent report, these are the top 10 codes used by all agents.
In addition, the Other label is displayed (when applicable) and represents the sum of all other codes. The No Code label is displayed (when applicable) and represents the sum of all times where an unavailability code was not used.
Nextiva Call Center Reports – 2014 Page 28 of 68
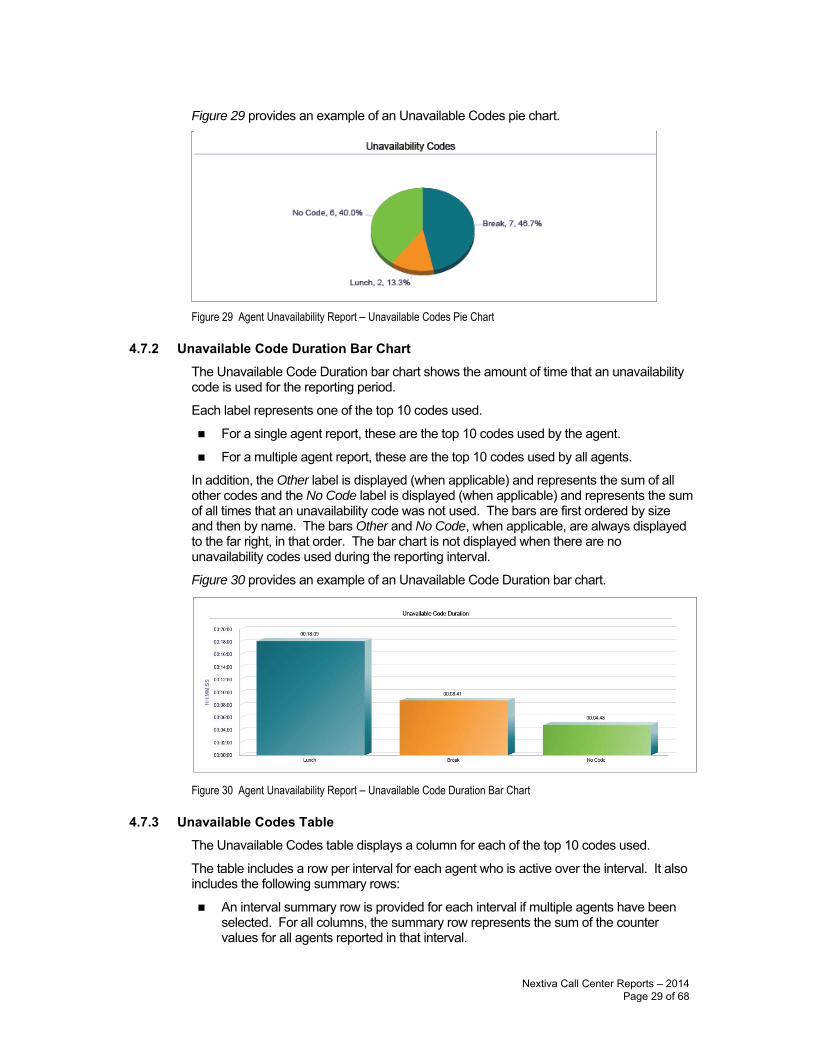
Figure 29 provides an example of an Unavailable Codes pie chart.
Figure 29 Agent Unavailability Report – Unavailable Codes Pie Chart
4.7.2 Unavailable Code Duration Bar Chart The Unavailable Code Duration bar chart shows the amount of time that an unavailability code is used for the reporting period.
Each label represents one of the top 10 codes used.
For a single agent report, these are the top 10 codes used by the agent.
For a multiple agent report, these are the top 10 codes used by all agents.
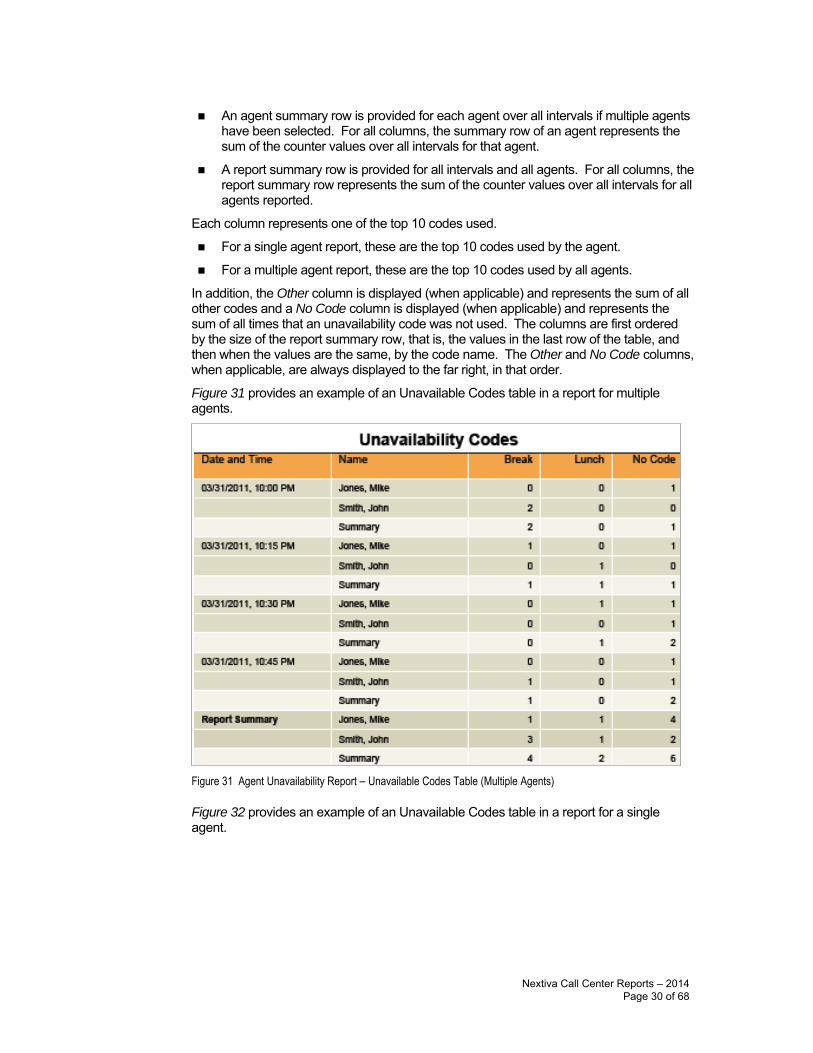
In addition, the Other label is displayed (when applicable) and represents the sum of all other codes and the No Code label is displayed (when applicable) and represents the sum of all times that an unavailability code was not used. The bars are first ordered by size and then by name. The bars Other and No Code, when applicable, are always displayed to the far right, in that order. The bar chart is not displayed when there are no unavailability codes used during the reporting interval.
Figure 30 provides an example of an Unavailable Code Duration bar chart.
Figure 30 Agent Unavailability Report – Unavailable Code Duration Bar Chart
4.7.3 Unavailable Codes Table The Unavailable Codes table displays a column for each of the top 10 codes used.
The table includes a row per interval for each agent who is active over the interval. It also includes the following summary rows:
An interval summary row is provided for each interval if multiple agents have beenselected. For all columns, the summary row represents the sum of the countervalues for all agents reported in that interval.
Nextiva Call Center Reports – 2014 Page 29 of 68
An agent summary row is provided for each agent over all intervals if multiple agentshave been selected. For all columns, the summary row of an agent represents thesum of the counter values over all intervals for that agent.
A report summary row is provided for all intervals and all agents. For all columns, thereport summary row represents the sum of the counter values over all intervals for allagents reported.
Each column represents one of the top 10 codes used.
For a single agent report, these are the top 10 codes used by the agent.
For a multiple agent report, these are the top 10 codes used by all agents.
In addition, the Other column is displayed (when applicable) and represents the sum of all other codes and a No Code column is displayed (when applicable) and represents the sum of all times that an unavailability code was not used. The columns are first ordered by the size of the report summary row, that is, the values in the last row of the table, and then when the values are the same, by the code name. The Other and No Code columns, when applicable, are always displayed to the far right, in that order.
Figure 31 provides an example of an Unavailable Codes table in a report for multiple agents.
Figure 31 Agent Unavailability Report – Unavailable Codes Table (Multiple Agents)
Figure 32 provides an example of an Unavailable Codes table in a report for a single agent.
Nextiva Call Center Reports – 2014 Page 30 of 68
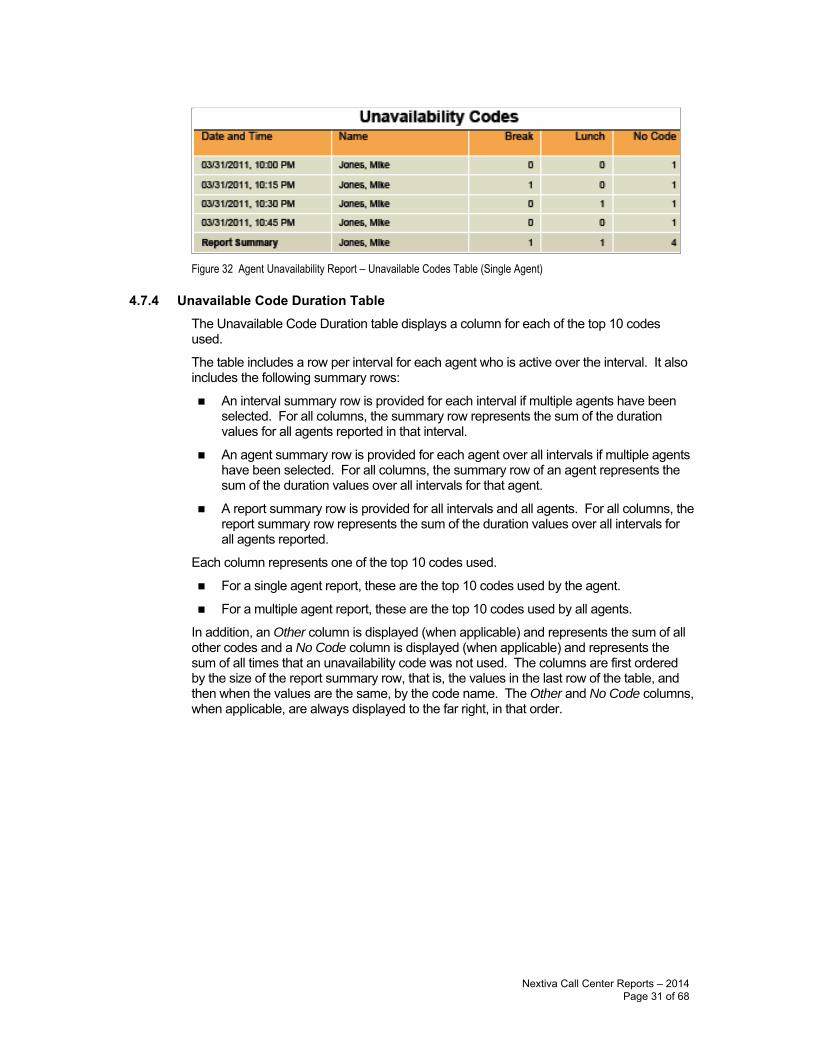
Figure 32 Agent Unavailability Report – Unavailable Codes Table (Single Agent)
4.7.4 Unavailable Code Duration Table The Unavailable Code Duration table displays a column for each of the top 10 codes used.
The table includes a row per interval for each agent who is active over the interval. It also includes the following summary rows:
An interval summary row is provided for each interval if multiple agents have beenselected. For all columns, the summary row represents the sum of the durationvalues for all agents reported in that interval.
An agent summary row is provided for each agent over all intervals if multiple agentshave been selected. For all columns, the summary row of an agent represents thesum of the duration values over all intervals for that agent.
A report summary row is provided for all intervals and all agents. For all columns, thereport summary row represents the sum of the duration values over all intervals forall agents reported.
Each column represents one of the top 10 codes used.
For a single agent report, these are the top 10 codes used by the agent.
For a multiple agent report, these are the top 10 codes used by all agents.
In addition, an Other column is displayed (when applicable) and represents the sum of all other codes and a No Code column is displayed (when applicable) and represents the sum of all times that an unavailability code was not used. The columns are first ordered by the size of the report summary row, that is, the values in the last row of the table, and then when the values are the same, by the code name. The Other and No Code columns, when applicable, are always displayed to the far right, in that order.
Nextiva Call Center Reports – 2014 Page 31 of 68
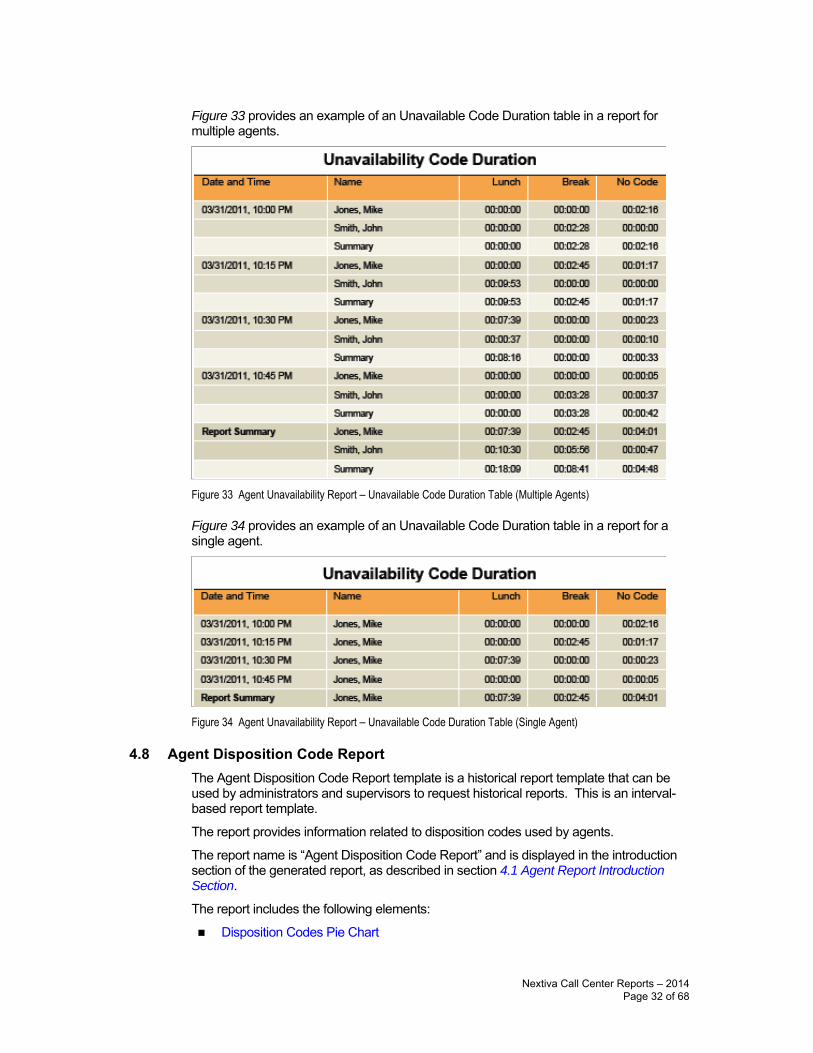
Figure 33 provides an example of an Unavailable Code Duration table in a report for multiple agents.
Figure 33 Agent Unavailability Report – Unavailable Code Duration Table (Multiple Agents)
Figure 34 provides an example of an Unavailable Code Duration table in a report for a single agent.
Figure 34 Agent Unavailability Report – Unavailable Code Duration Table (Single Agent)
4.8 Agent Disposition Code Report The Agent Disposition Code Report template is a historical report template that can be used by administrators and supervisors to request historical reports. This is an interval-based report template.
The report provides information related to disposition codes used by agents.
The report name is “Agent Disposition Code Report” and is displayed in the introduction section of the generated report, as described in section 4.1 Agent Report Introduction Section.
The report includes the following elements:
Disposition Codes Pie Chart
Nextiva Call Center Reports – 2014 Page 32 of 68
Disposition Codes Table
The report does not require any performance parameters.
Note that disposition codes entered for route point calls are not reported.
4.8.1 Disposition Codes Pie Chart The Disposition Codes pie chart shows the number of times that a particular disposition code is used for the reporting period.
Each label represents one of the top 10 codes used.
For a single agent report, these are the top 10 codes used by the agent.
For a multiple agent report, these are the top 10 codes used by all agents.
In addition, the Other label is displayed (when applicable) and represents the sum of all other codes.
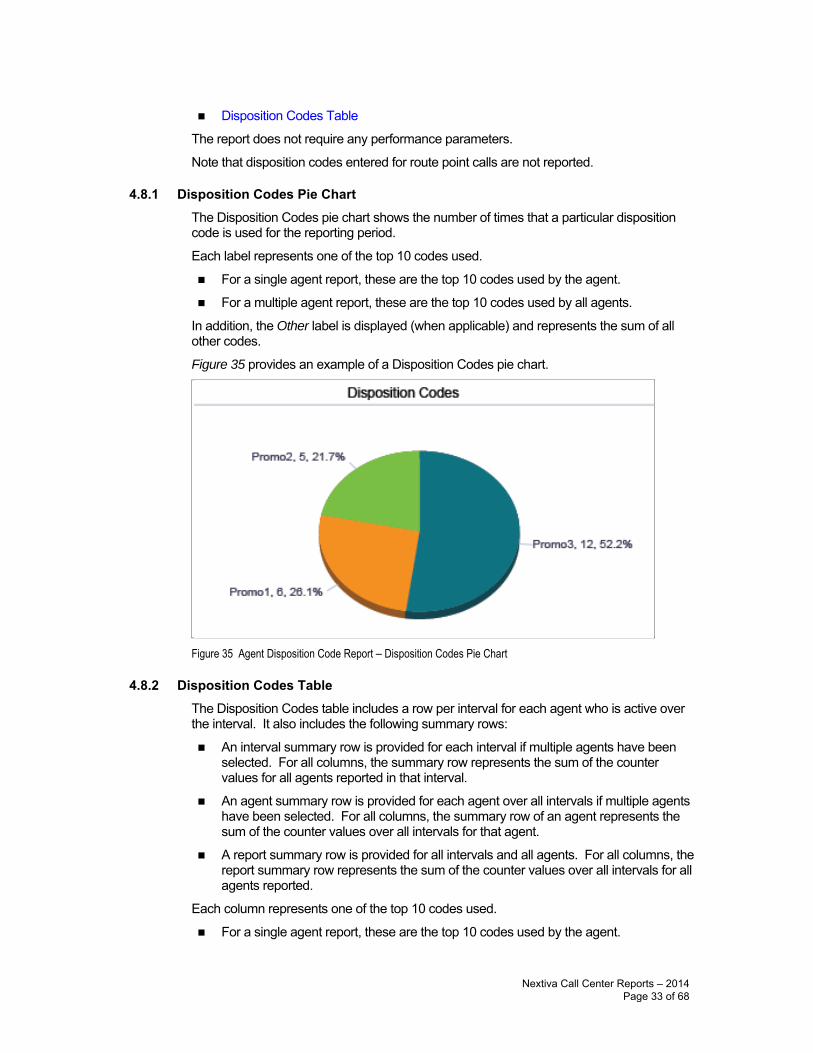
Figure 35 provides an example of a Disposition Codes pie chart.
Figure 35 Agent Disposition Code Report – Disposition Codes Pie Chart
4.8.2 Disposition Codes Table The Disposition Codes table includes a row per interval for each agent who is active over the interval. It also includes the following summary rows:
An interval summary row is provided for each interval if multiple agents have beenselected. For all columns, the summary row represents the sum of the countervalues for all agents reported in that interval.
An agent summary row is provided for each agent over all intervals if multiple agentshave been selected. For all columns, the summary row of an agent represents thesum of the counter values over all intervals for that agent.
A report summary row is provided for all intervals and all agents. For all columns, thereport summary row represents the sum of the counter values over all intervals for allagents reported.
Each column represents one of the top 10 codes used.
For a single agent report, these are the top 10 codes used by the agent.
Nextiva Call Center Reports – 2014 Page 33 of 68
For a multiple agent report, these are the top 10 codes used by all agents.
In addition, the Other column (when applicable) represents the sum of all other codes.
The columns are first ordered by the size of the report summary row, that is, the values in the last row of the table, and then when the values are the same, by the code name. The Other column, when applicable, is displayed to the far right.
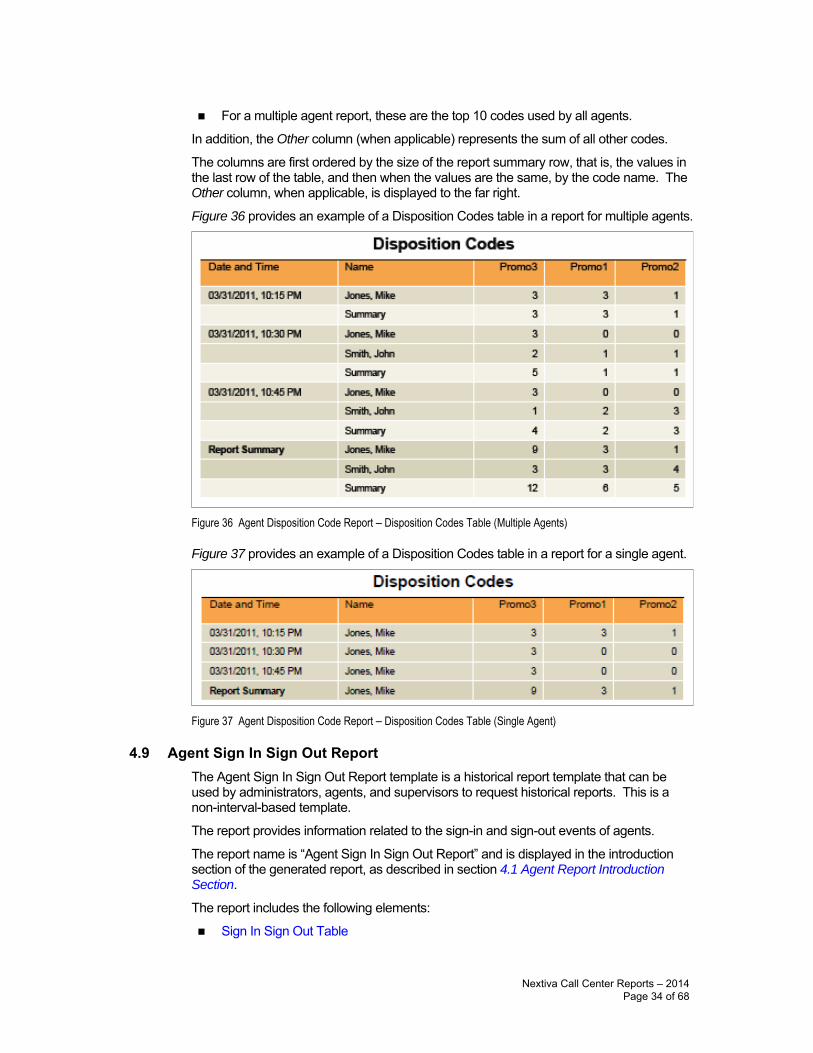
Figure 36 provides an example of a Disposition Codes table in a report for multiple agents.
Figure 36 Agent Disposition Code Report – Disposition Codes Table (Multiple Agents)
Figure 37 provides an example of a Disposition Codes table in a report for a single agent.
Figure 37 Agent Disposition Code Report – Disposition Codes Table (Single Agent)
4.9 Agent Sign In Sign Out Report The Agent Sign In Sign Out Report template is a historical report template that can be used by administrators, agents, and supervisors to request historical reports. This is a non-interval-based template.
The report provides information related to the sign-in and sign-out events of agents.
The report name is “Agent Sign In Sign Out Report” and is displayed in the introduction section of the generated report, as described in section 4.1 Agent Report Introduction Section.
The report includes the following elements:
Sign In Sign Out Table
Nextiva Call Center Reports – 2014 Page 34 of 68
Average Staffed Duration Bar Chart
The report does not require any performance parameters.
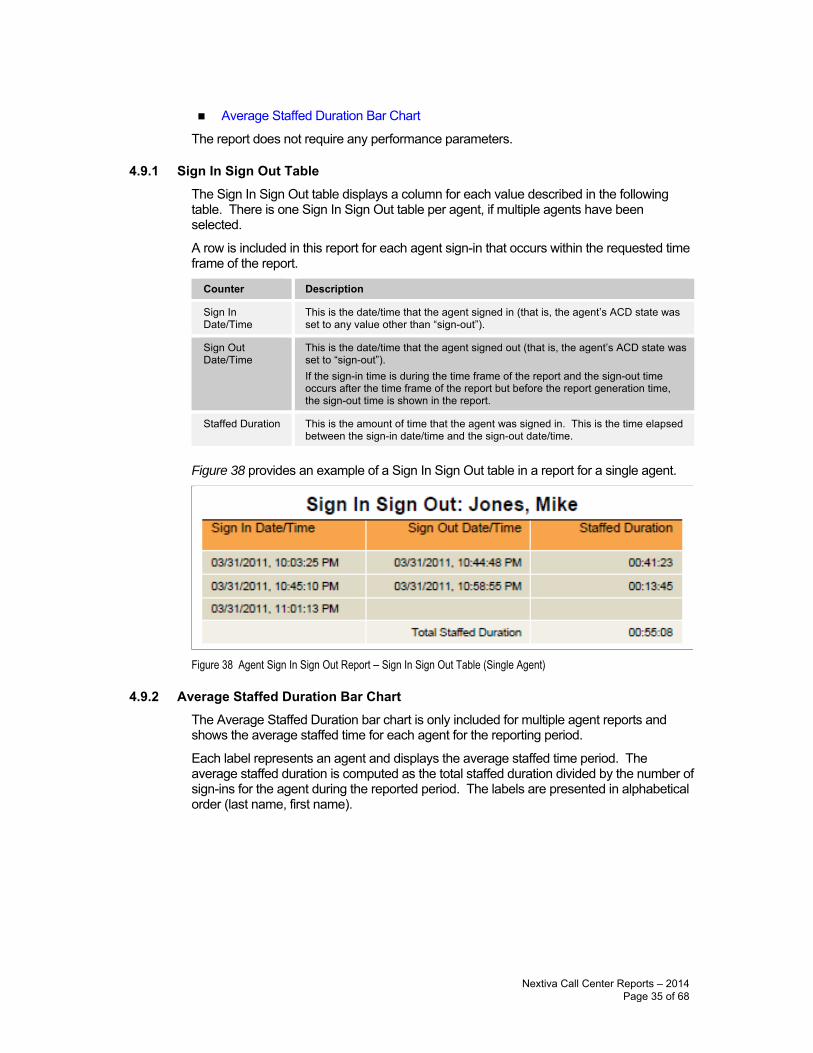
4.9.1 Sign In Sign Out Table The Sign In Sign Out table displays a column for each value described in the following table. There is one Sign In Sign Out table per agent, if multiple agents have been selected.
A row is included in this report for each agent sign-in that occurs within the requested time frame of the report.
Counter Description
Sign In Date/Time
This is the date/time that the agent signed in (that is, the agent’s ACD state was set to any value other than “sign-out”).
Sign Out Date/Time
This is the date/time that the agent signed out (that is, the agent’s ACD state was set to “sign-out”). If the sign-in time is during the time frame of the report and the sign-out time occurs after the time frame of the report but before the report generation time, the sign-out time is shown in the report.
Staffed Duration This is the amount of time that the agent was signed in. This is the time elapsed between the sign-in date/time and the sign-out date/time.
Figure 38 provides an example of a Sign In Sign Out table in a report for a single agent.
Figure 38 Agent Sign In Sign Out Report – Sign In Sign Out Table (Single Agent)
4.9.2 Average Staffed Duration Bar Chart The Average Staffed Duration bar chart is only included for multiple agent reports and shows the average staffed time for each agent for the reporting period.
Each label represents an agent and displays the average staffed time period. The average staffed duration is computed as the total staffed duration divided by the number of sign-ins for the agent during the reported period. The labels are presented in alphabetical order (last name, first name).
Nextiva Call Center Reports – 2014 Page 35 of 68
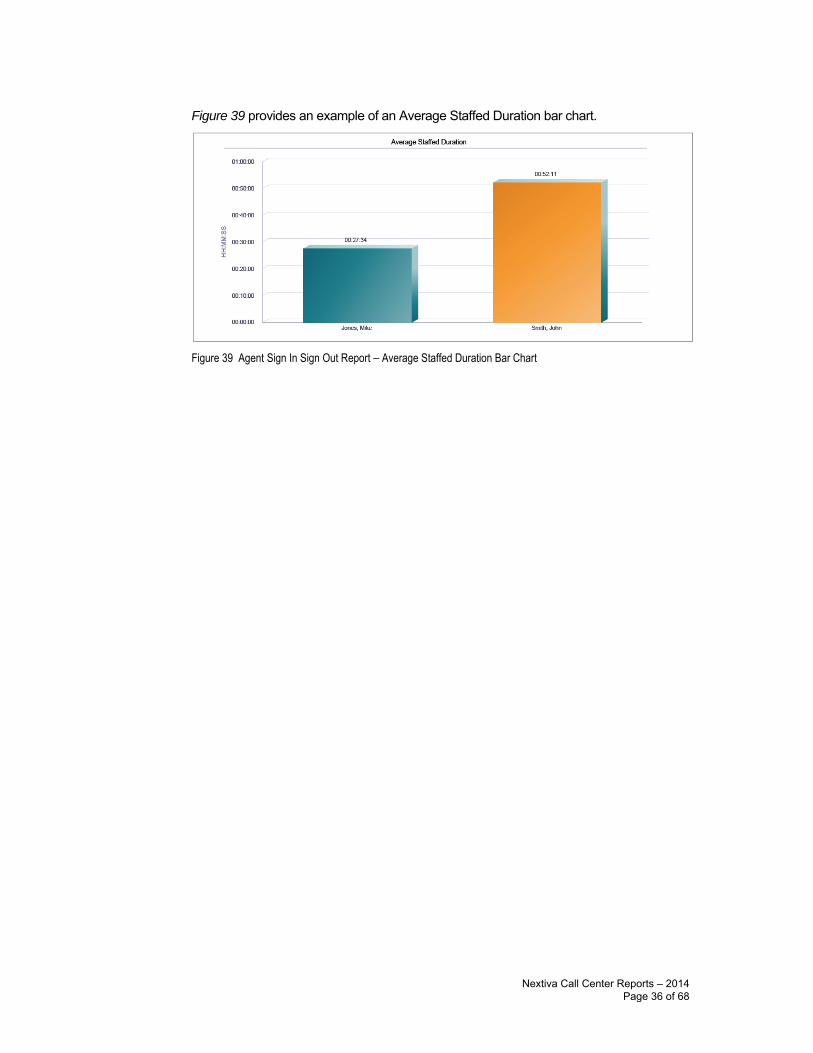
Figure 39 provides an example of an Average Staffed Duration bar chart.
Figure 39 Agent Sign In Sign Out Report – Average Staffed Duration Bar Chart
Nextiva Call Center Reports – 2014 Page 36 of 68
5 Call Center Report Templates
Nextiva Enhanced Reporting provides the following canned Call Center Report templates:
Call Center Incoming Calls Report
Call Center Report
Call Center Presented Calls Report
Abandoned Call Report
Call Center Summary Report
Service Level Report
Call Center Call Detail Report
Call Center Disposition Code Report
Call Center Overflow Matrix Report
5.1 Call Center Report Introduction Section The introduction section displays the report title, the time frame of the reported data, the date that the report was run, and the details of the call center or DNIS if the report was generated for a single call center or DNIS.
The same pattern is used for all report templates and is described in the following table.
Element Description
Title The title of the report depends on the report template, selected call centers/DNISs, and the sampling period. If you request a report for more than one call center, then the title of the report is
<Report Name> – Multiple Call Centers – <Sampling Period>. If you request a report for a single call center or one or more DNISs of a call center, then
the title of the report is <Report Name> – <Call Center Name> – <Sampling Period>. NOTE: The sampling period is only present for interval-based reports.
Start Time (End Time)
Start Time displays the start date and time of the report. End Time displays the end date and time of the report. Start Time is displayed for all reports, but End Time is displayed only for historical
reports. For an interval-based report template, if the requested start time does not align with a sampling period boundary, then it is adjusted to the previous sampling period boundary. If the end time does not align with a sampling period boundary, then it is adjusted to the next sampling period boundary. For example, if the sampling period is hourly, the start time provided is 11:46 A.M. and the end time is 12:10 P.M. Then the start time is adjusted to 11:00 A.M. and the stop time is adjusted to 1:00 P.M. The time frame of the generated report is inclusive for the start date and start time and exclusive for the end date and end time. For example, if the time frame is specified as 06/01/2010 0:00 A.M. to 07/01/2010 0:00 A.M., then the report generated actually runs from 06/01/2010 0:00:00.000 A.M. to 06/30/2010 11:59:59.999 P.M. If the time frame of a report crosses a daylight savings time change, then the report generated either shows no results for the hour skipped (clock is moved forward) or it shows both time periods combined in a single-time interval (clock is moved backward).
Nextiva Call Center Reports – 2014 Page 37 of 68
Element Description
Time Zone The time zone is displayed in a localized format, for example, “(GMT-04:00) (US) Eastern Time”. Note that the offset from GMT displayed in the introduction section is relative to the time of report generation and not necessarily to the requested time frame. The time intervals provided in the contents of the report are always presented relative to the offset from GMT that is applicable at the time the statistics were collected for that time zone.
Date Run Date Run displays the date and time at which the report was generated.
Call Center or DNIS information
If the report is generated for a single call center or a single DNIS, then detailed information for the call center or DNIS is provided. For a single call center report, the call center name and ID are displayed. For a single DNIS report, the DNIS name and phone number are displayed.
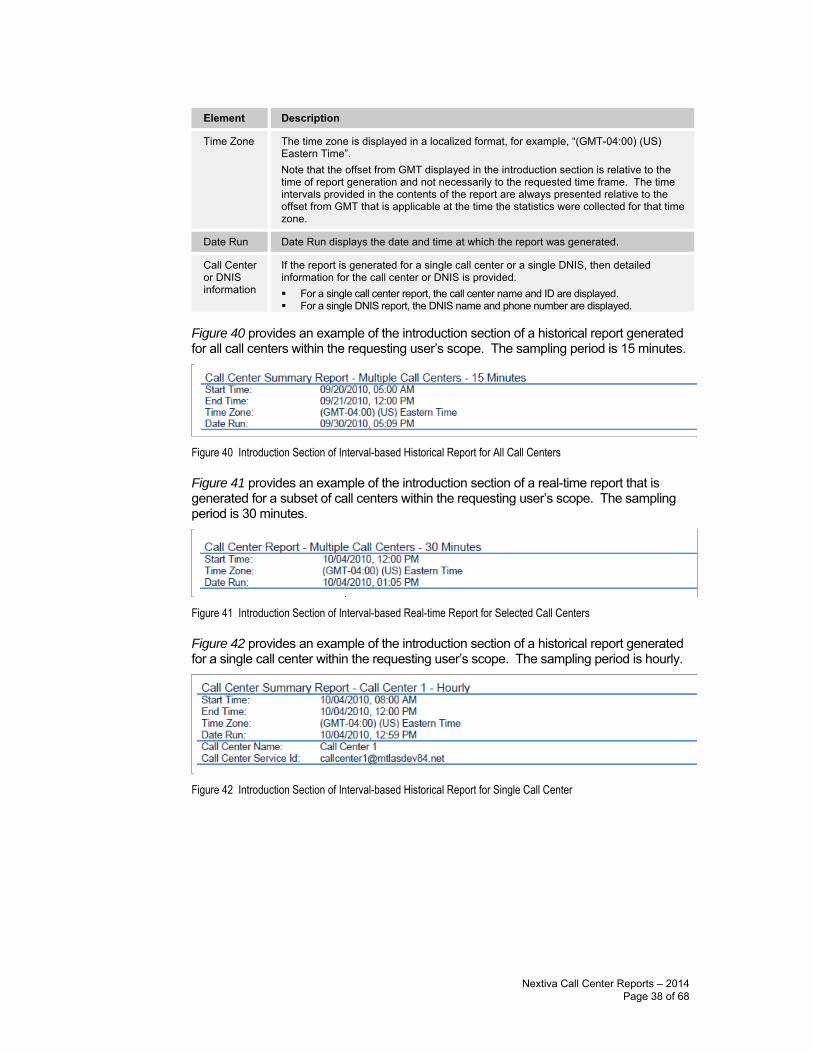
Figure 40 provides an example of the introduction section of a historical report generated for all call centers within the requesting user’s scope. The sampling period is 15 minutes.
Figure 40 Introduction Section of Interval-based Historical Report for All Call Centers
Figure 41 provides an example of the introduction section of a real-time report that is generated for a subset of call centers within the requesting user’s scope. The sampling period is 30 minutes.
Figure 41 Introduction Section of Interval-based Real-time Report for Selected Call Centers
Figure 42 provides an example of the introduction section of a historical report generated for a single call center within the requesting user’s scope. The sampling period is hourly.
Figure 42 Introduction Section of Interval-based Historical Report for Single Call Center
Nextiva Call Center Reports – 2014 Page 38 of 68
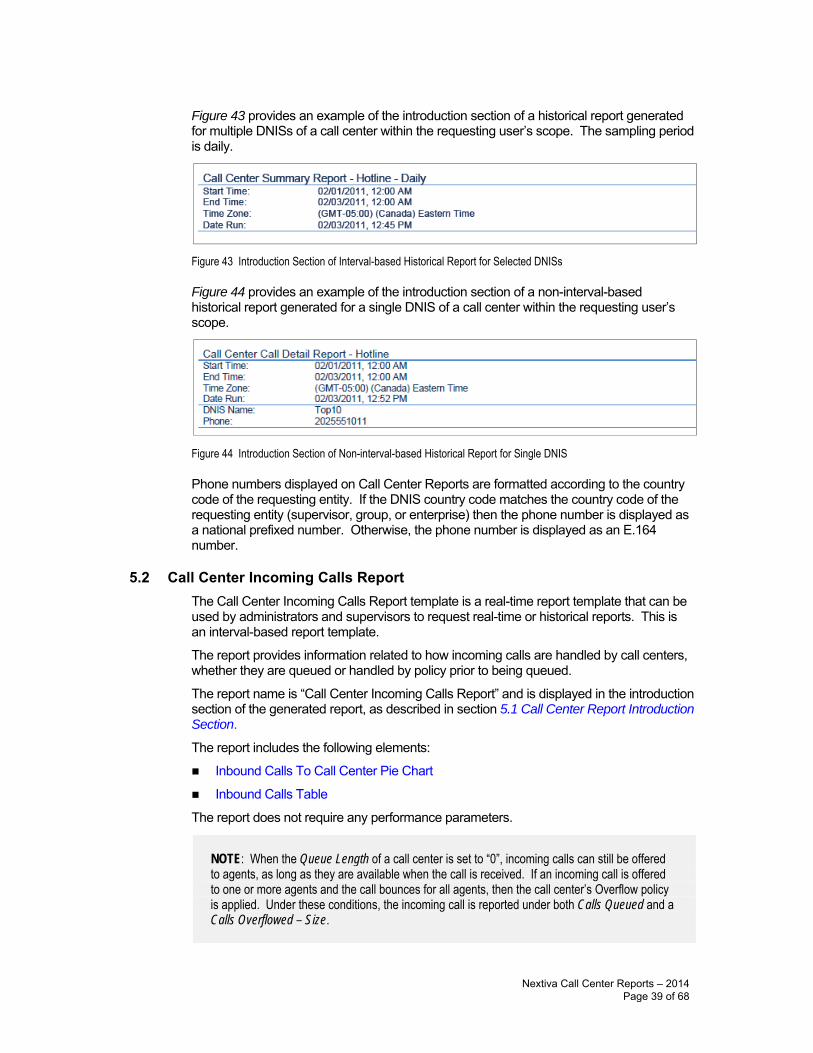
Figure 43 provides an example of the introduction section of a historical report generated for multiple DNISs of a call center within the requesting user’s scope. The sampling period is daily.
Figure 43 Introduction Section of Interval-based Historical Report for Selected DNISs
Figure 44 provides an example of the introduction section of a non-interval-based historical report generated for a single DNIS of a call center within the requesting user’s scope.
Figure 44 Introduction Section of Non-interval-based Historical Report for Single DNIS
Phone numbers displayed on Call Center Reports are formatted according to the country code of the requesting entity. If the DNIS country code matches the country code of the requesting entity (supervisor, group, or enterprise) then the phone number is displayed as a national prefixed number. Otherwise, the phone number is displayed as an E.164 number.
5.2 Call Center Incoming Calls Report The Call Center Incoming Calls Report template is a real-time report template that can be used by administrators and supervisors to request real-time or historical reports. This is an interval-based report template.
The report provides information related to how incoming calls are handled by call centers, whether they are queued or handled by policy prior to being queued.
The report name is “Call Center Incoming Calls Report” and is displayed in the introduction section of the generated report, as described in section 5.1 Call Center Report Introduction Section.
The report includes the following elements:
Inbound Calls To Call Center Pie Chart
Inbound Calls Table
The report does not require any performance parameters.
NOTE: When the Queue Length of a call center is set to “0”, incoming calls can still be offered to agents, as long as they are available when the call is received. If an incoming call is offered to one or more agents and the call bounces for all agents, then the call center’s Overflow policy is applied. Under these conditions, the incoming call is reported under both Calls Queued and a Calls Overflowed – Size.
Nextiva Call Center Reports – 2014 Page 39 of 68
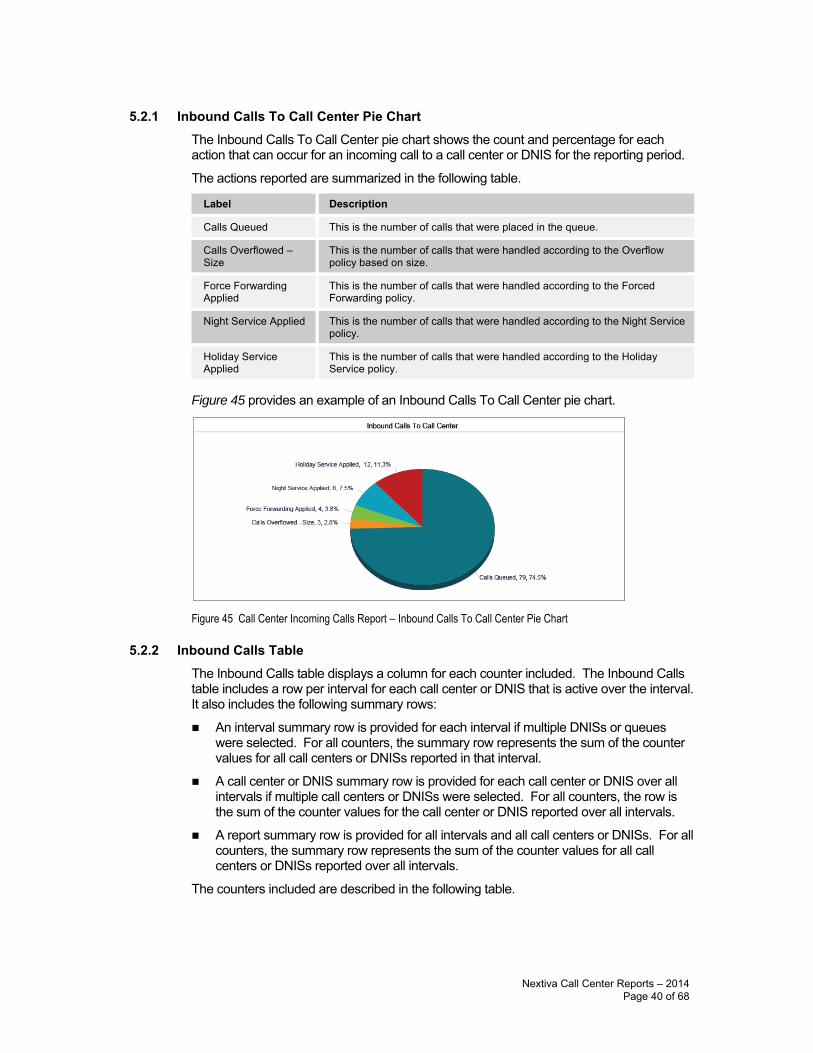
5.2.1 Inbound Calls To Call Center Pie Chart The Inbound Calls To Call Center pie chart shows the count and percentage for each action that can occur for an incoming call to a call center or DNIS for the reporting period.
The actions reported are summarized in the following table.
Label Description
Calls Queued This is the number of calls that were placed in the queue.
Calls Overflowed – Size
This is the number of calls that were handled according to the Overflow policy based on size.
Force Forwarding Applied
This is the number of calls that were handled according to the Forced Forwarding policy.
Night Service Applied This is the number of calls that were handled according to the Night Service policy.
Holiday Service Applied
This is the number of calls that were handled according to the Holiday Service policy.
Figure 45 provides an example of an Inbound Calls To Call Center pie chart.
Figure 45 Call Center Incoming Calls Report – Inbound Calls To Call Center Pie Chart
5.2.2 Inbound Calls Table The Inbound Calls table displays a column for each counter included. The Inbound Calls table includes a row per interval for each call center or DNIS that is active over the interval. It also includes the following summary rows:
An interval summary row is provided for each interval if multiple DNISs or queueswere selected. For all counters, the summary row represents the sum of the countervalues for all call centers or DNISs reported in that interval.
A call center or DNIS summary row is provided for each call center or DNIS over allintervals if multiple call centers or DNISs were selected. For all counters, the row isthe sum of the counter values for the call center or DNIS reported over all intervals.
A report summary row is provided for all intervals and all call centers or DNISs. For allcounters, the summary row represents the sum of the counter values for all callcenters or DNISs reported over all intervals.
The counters included are described in the following table.
Nextiva Call Center Reports – 2014 Page 40 of 68
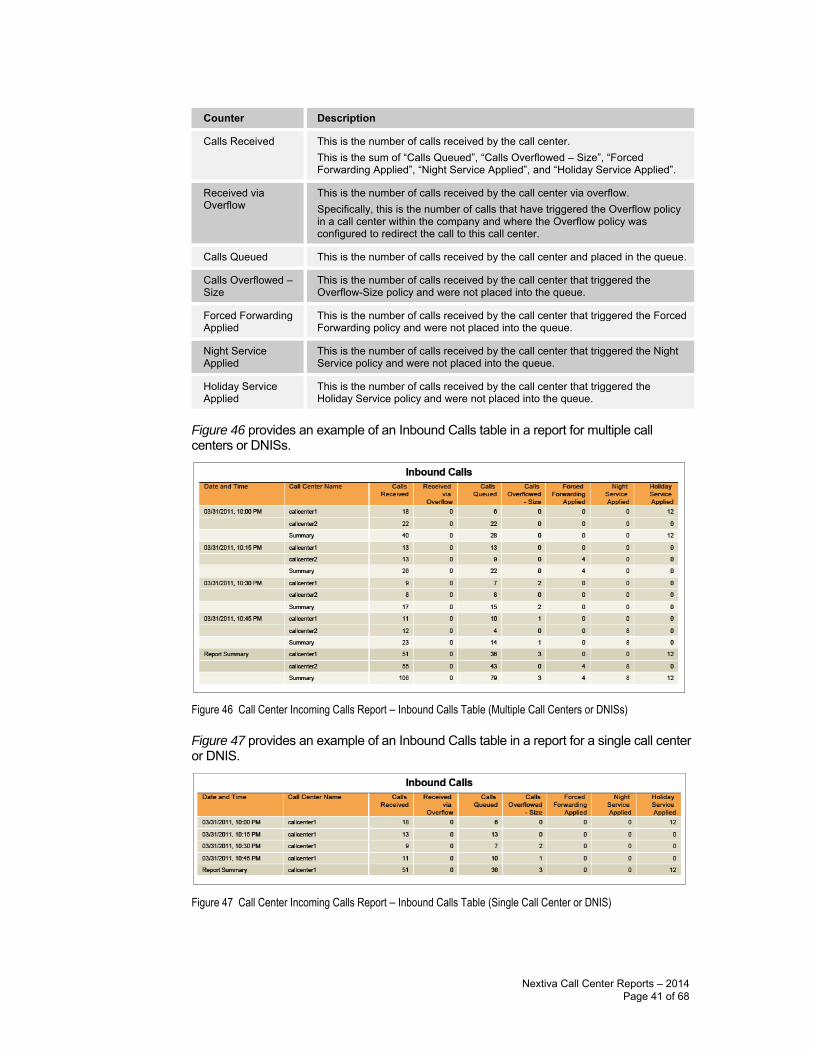
Counter Description
Calls Received This is the number of calls received by the call center. This is the sum of “Calls Queued”, “Calls Overflowed – Size”, “Forced Forwarding Applied”, “Night Service Applied”, and “Holiday Service Applied”.
Received via Overflow
This is the number of calls received by the call center via overflow. Specifically, this is the number of calls that have triggered the Overflow policy in a call center within the company and where the Overflow policy was configured to redirect the call to this call center.
Calls Queued This is the number of calls received by the call center and placed in the queue.
Calls Overflowed – Size
This is the number of calls received by the call center that triggered the Overflow-Size policy and were not placed into the queue.
Forced Forwarding Applied
This is the number of calls received by the call center that triggered the Forced Forwarding policy and were not placed into the queue.
Night Service Applied
This is the number of calls received by the call center that triggered the Night Service policy and were not placed into the queue.
Holiday Service Applied
This is the number of calls received by the call center that triggered the Holiday Service policy and were not placed into the queue.
Figure 46 provides an example of an Inbound Calls table in a report for multiple call centers or DNISs.
Figure 46 Call Center Incoming Calls Report – Inbound Calls Table (Multiple Call Centers or DNISs)
Figure 47 provides an example of an Inbound Calls table in a report for a single call center or DNIS.
Figure 47 Call Center Incoming Calls Report – Inbound Calls Table (Single Call Center or DNIS)
Nextiva Call Center Reports – 2014 Page 41 of 68
5.3 Call Center Report The Call Center Report template is a real-time report template that can be used by administrators and supervisors to request real-time or historical reports. This is an interval-based report template.
The report provides information related to how calls are handled by call centers once they have been queued.
The report name is “Call Center Report” and is displayed in the introduction section of the generated report, as described in section 5.1 Call Center Report Introduction Section.
The report includes the following elements:
Call Center Activity by Answered Calls Pie Chart
Call Center Activity Bar Chart
Call Center Activity Table
High Water Marks Table
The report requires the Service Level performance parameter.
Performance parameters are described in section 6.1 Performance Parameters.
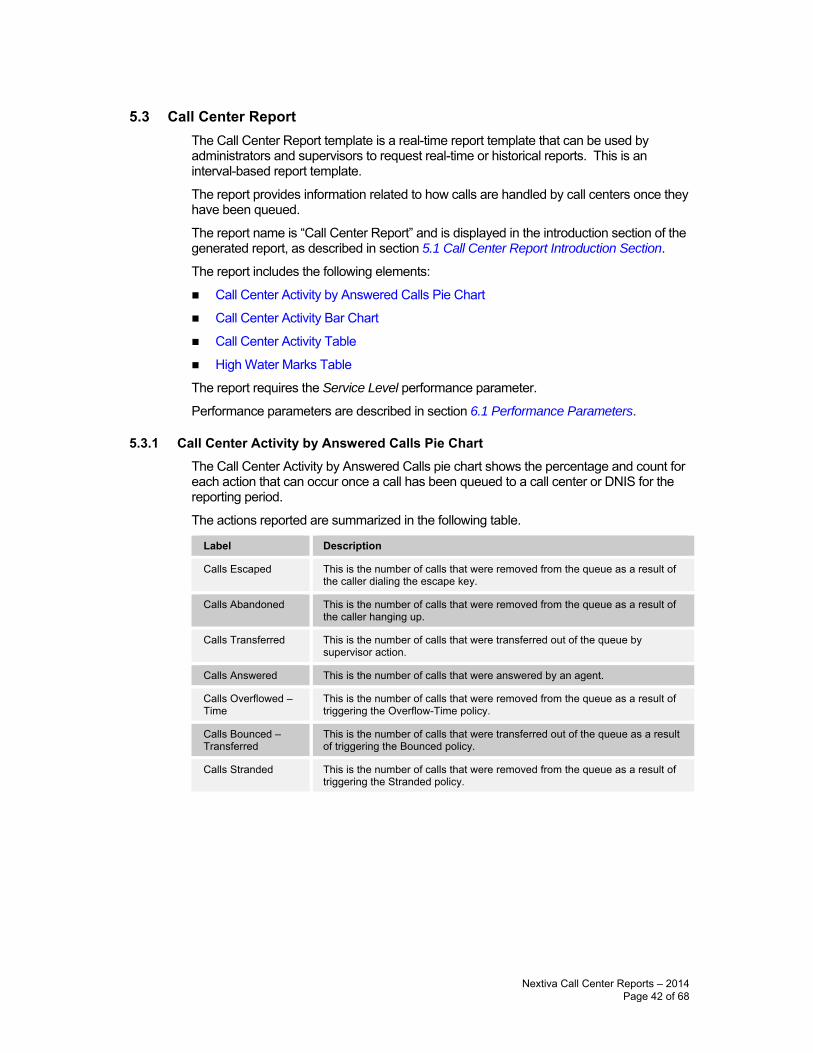
5.3.1 Call Center Activity by Answered Calls Pie Chart The Call Center Activity by Answered Calls pie chart shows the percentage and count for each action that can occur once a call has been queued to a call center or DNIS for the reporting period.
The actions reported are summarized in the following table.
Label Description
Calls Escaped This is the number of calls that were removed from the queue as a result of the caller dialing the escape key.
Calls Abandoned This is the number of calls that were removed from the queue as a result of the caller hanging up.
Calls Transferred This is the number of calls that were transferred out of the queue by supervisor action.
Calls Answered This is the number of calls that were answered by an agent.
Calls Overflowed – Time
This is the number of calls that were removed from the queue as a result of triggering the Overflow-Time policy.
Calls Bounced – Transferred
This is the number of calls that were transferred out of the queue as a result of triggering the Bounced policy.
Calls Stranded This is the number of calls that were removed from the queue as a result of triggering the Stranded policy.
Nextiva Call Center Reports – 2014 Page 42 of 68
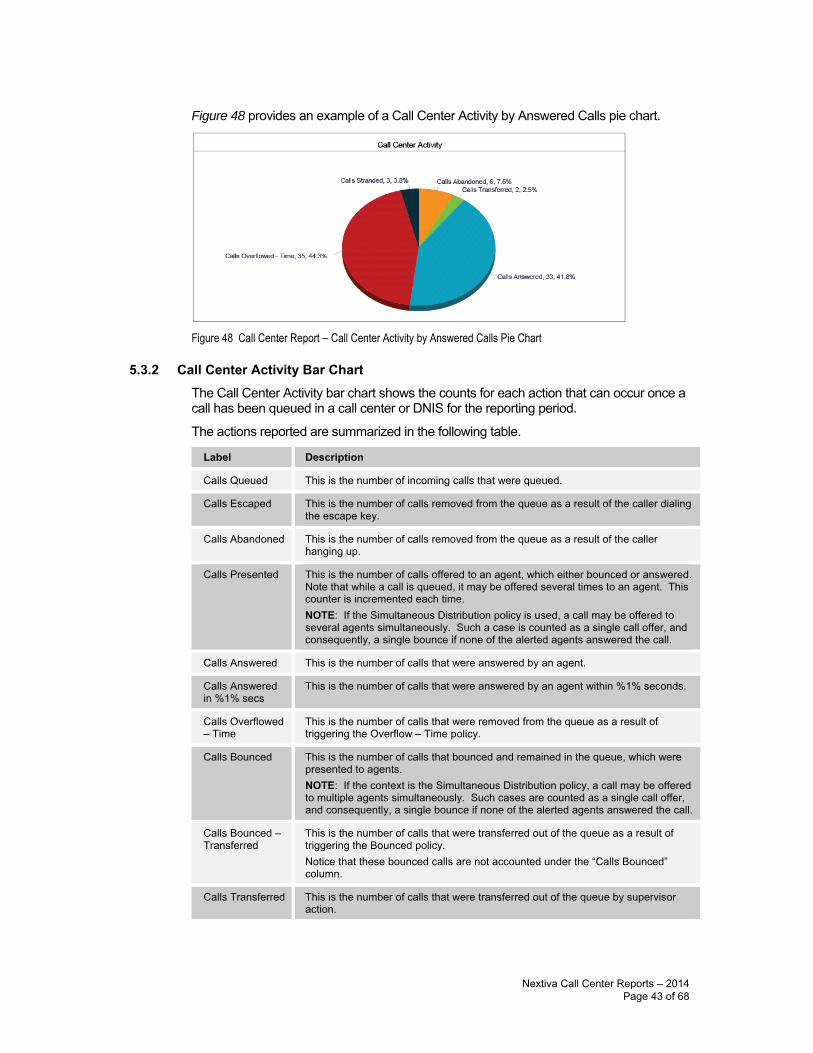
Figure 48 provides an example of a Call Center Activity by Answered Calls pie chart.
Figure 48 Call Center Report – Call Center Activity by Answered Calls Pie Chart
5.3.2 Call Center Activity Bar Chart The Call Center Activity bar chart shows the counts for each action that can occur once a call has been queued in a call center or DNIS for the reporting period.
The actions reported are summarized in the following table.
Label Description
Calls Queued This is the number of incoming calls that were queued.
Calls Escaped This is the number of calls removed from the queue as a result of the caller dialing the escape key.
Calls Abandoned This is the number of calls removed from the queue as a result of the caller hanging up.
Calls Presented This is the number of calls offered to an agent, which either bounced or answered. Note that while a call is queued, it may be offered several times to an agent. This counter is incremented each time. NOTE: If the Simultaneous Distribution policy is used, a call may be offered to several agents simultaneously. Such a case is counted as a single call offer, and consequently, a single bounce if none of the alerted agents answered the call.
Calls Answered This is the number of calls that were answered by an agent.
Calls Answered in %1% secs
This is the number of calls that were answered by an agent within %1% seconds.
Calls Overflowed – Time
This is the number of calls that were removed from the queue as a result of triggering the Overflow – Time policy.
Calls Bounced This is the number of calls that bounced and remained in the queue, which were presented to agents. NOTE: If the context is the Simultaneous Distribution policy, a call may be offered to multiple agents simultaneously. Such cases are counted as a single call offer, and consequently, a single bounce if none of the alerted agents answered the call.
Calls Bounced – Transferred
This is the number of calls that were transferred out of the queue as a result of triggering the Bounced policy. Notice that these bounced calls are not accounted under the “Calls Bounced” column.
Calls Transferred This is the number of calls that were transferred out of the queue by supervisor action.
Nextiva Call Center Reports – 2014 Page 43 of 68
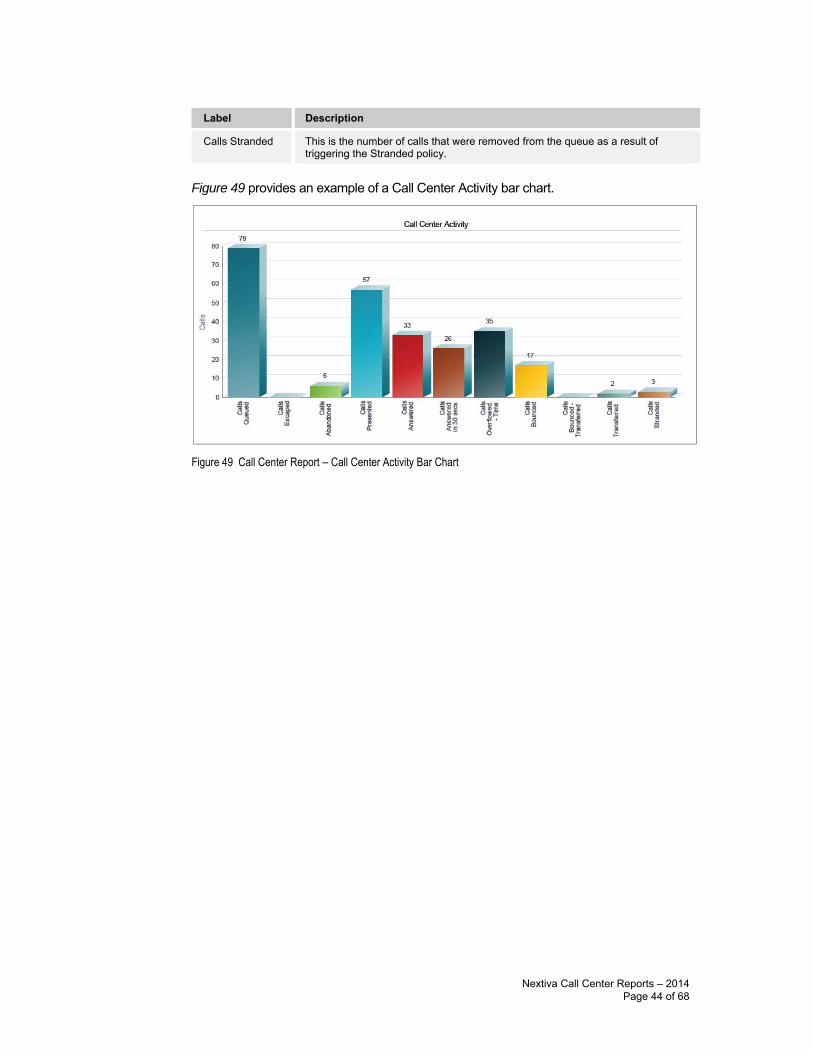
Label Description
Calls Stranded This is the number of calls that were removed from the queue as a result of triggering the Stranded policy.
Figure 49 provides an example of a Call Center Activity bar chart.
Figure 49 Call Center Report – Call Center Activity Bar Chart
Nextiva Call Center Reports – 2014 Page 44 of 68
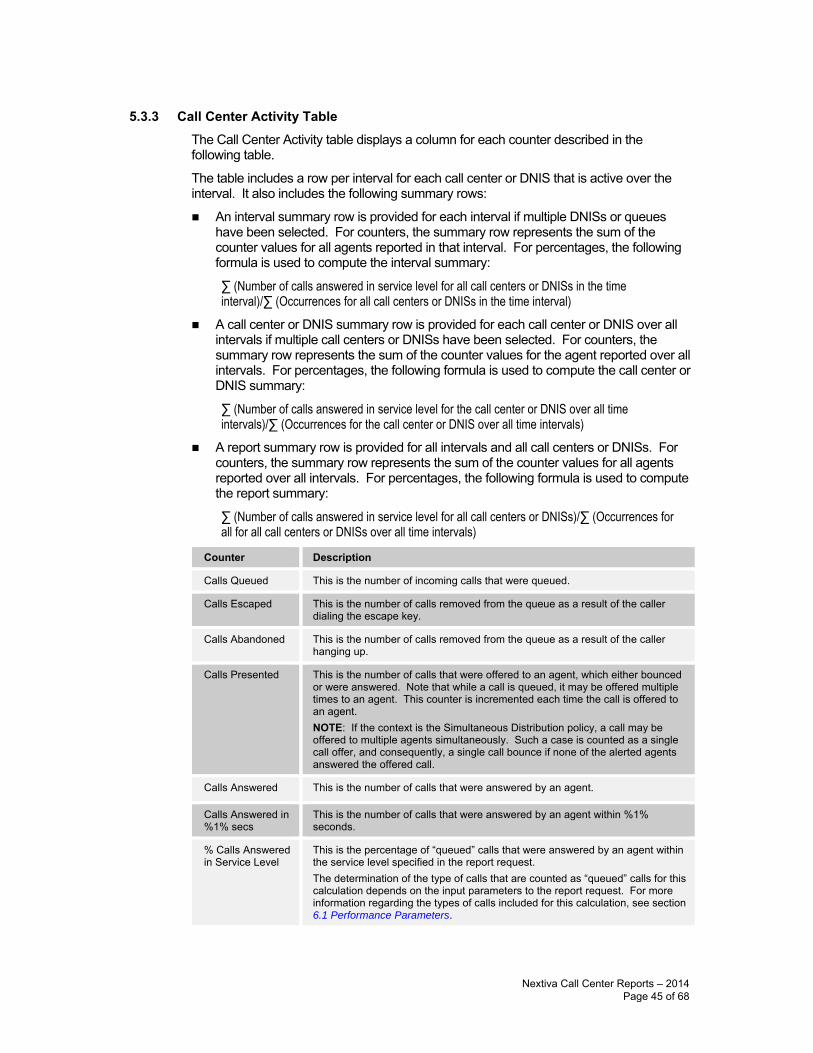
5.3.3 Call Center Activity Table The Call Center Activity table displays a column for each counter described in the following table.
The table includes a row per interval for each call center or DNIS that is active over the interval. It also includes the following summary rows:
An interval summary row is provided for each interval if multiple DNISs or queueshave been selected. For counters, the summary row represents the sum of thecounter values for all agents reported in that interval. For percentages, the followingformula is used to compute the interval summary:
∑ (Number of calls answered in service level for all call centers or DNISs in the time interval)/∑ (Occurrences for all call centers or DNISs in the time interval)
A call center or DNIS summary row is provided for each call center or DNIS over allintervals if multiple call centers or DNISs have been selected. For counters, thesummary row represents the sum of the counter values for the agent reported over allintervals. For percentages, the following formula is used to compute the call center orDNIS summary:
∑ (Number of calls answered in service level for the call center or DNIS over all time intervals)/∑ (Occurrences for the call center or DNIS over all time intervals)
A report summary row is provided for all intervals and all call centers or DNISs. Forcounters, the summary row represents the sum of the counter values for all agentsreported over all intervals. For percentages, the following formula is used to computethe report summary:
∑ (Number of calls answered in service level for all call centers or DNISs)/∑ (Occurrences for all for all call centers or DNISs over all time intervals)
Counter Description
Calls Queued This is the number of incoming calls that were queued.
Calls Escaped This is the number of calls removed from the queue as a result of the caller dialing the escape key.
Calls Abandoned This is the number of calls removed from the queue as a result of the caller hanging up.
Calls Presented This is the number of calls that were offered to an agent, which either bounced or were answered. Note that while a call is queued, it may be offered multiple times to an agent. This counter is incremented each time the call is offered to an agent. NOTE: If the context is the Simultaneous Distribution policy, a call may be offered to multiple agents simultaneously. Such a case is counted as a single call offer, and consequently, a single call bounce if none of the alerted agents answered the offered call.
Calls Answered This is the number of calls that were answered by an agent.
Calls Answered in %1% secs
This is the number of calls that were answered by an agent within %1% seconds.
% Calls Answered in Service Level
This is the percentage of “queued” calls that were answered by an agent within the service level specified in the report request. The determination of the type of calls that are counted as “queued” calls for this calculation depends on the input parameters to the report request. For more information regarding the types of calls included for this calculation, see section 6.1 Performance Parameters.
Nextiva Call Center Reports – 2014 Page 45 of 68
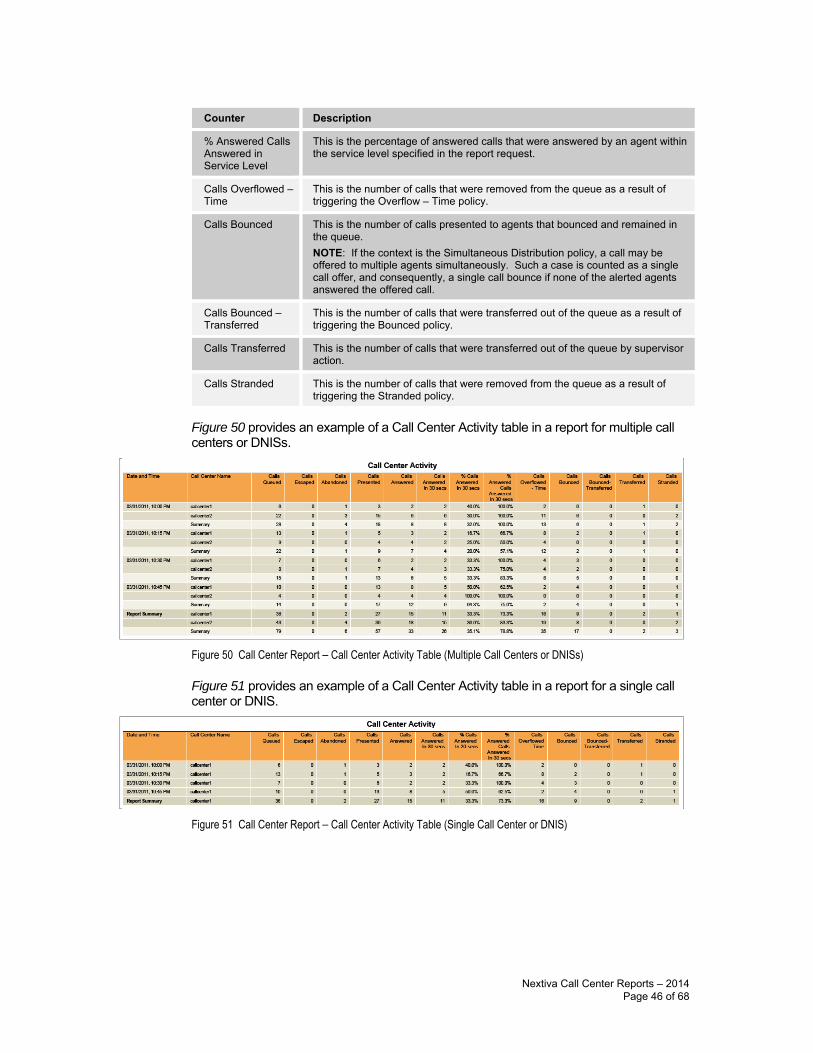
Counter Description
% Answered Calls Answered in Service Level
This is the percentage of answered calls that were answered by an agent within the service level specified in the report request.
Calls Overflowed – Time
This is the number of calls that were removed from the queue as a result of triggering the Overflow – Time policy.
Calls Bounced This is the number of calls presented to agents that bounced and remained in the queue. NOTE: If the context is the Simultaneous Distribution policy, a call may be offered to multiple agents simultaneously. Such a case is counted as a single call offer, and consequently, a single call bounce if none of the alerted agents answered the offered call.
Calls Bounced – Transferred
This is the number of calls that were transferred out of the queue as a result of triggering the Bounced policy.
Calls Transferred This is the number of calls that were transferred out of the queue by supervisor action.
Calls Stranded This is the number of calls that were removed from the queue as a result of triggering the Stranded policy.
Figure 50 provides an example of a Call Center Activity table in a report for multiple call centers or DNISs.
Figure 50 Call Center Report – Call Center Activity Table (Multiple Call Centers or DNISs)
Figure 51 provides an example of a Call Center Activity table in a report for a single call center or DNIS.
Figure 51 Call Center Report – Call Center Activity Table (Single Call Center or DNIS)
Nextiva Call Center Reports – 2014 Page 46 of 68
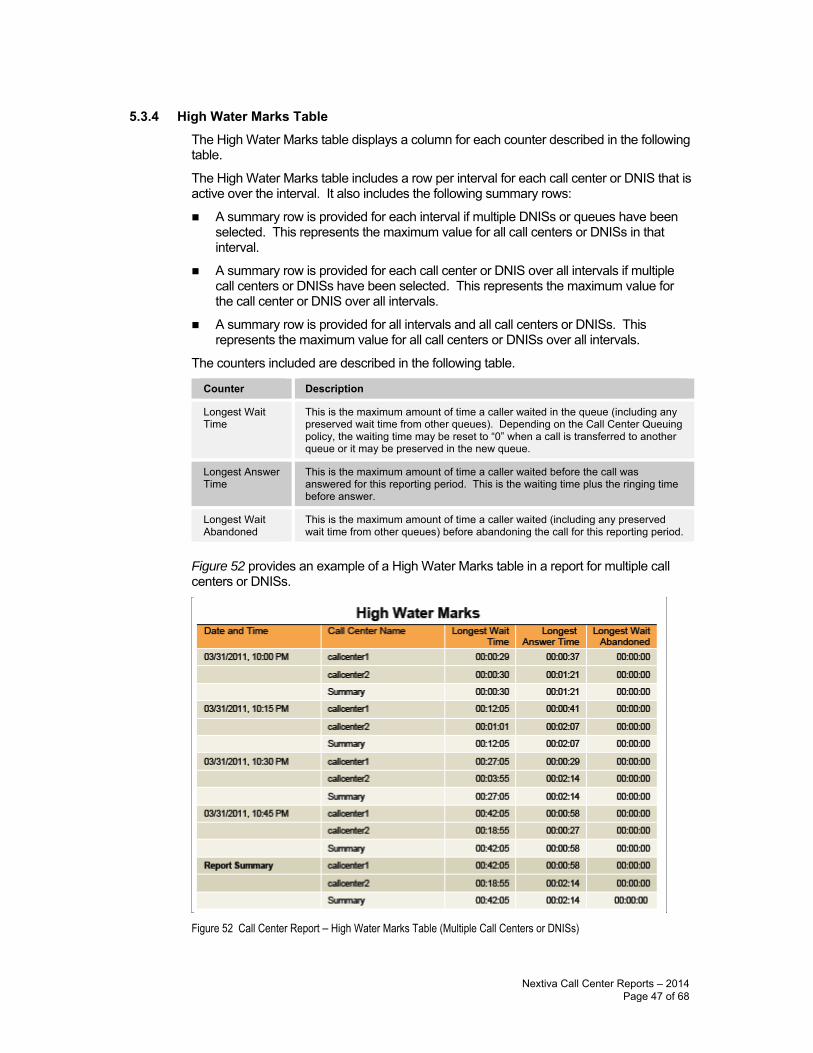
5.3.4 High Water Marks Table The High Water Marks table displays a column for each counter described in the following table.
The High Water Marks table includes a row per interval for each call center or DNIS that is active over the interval. It also includes the following summary rows:
A summary row is provided for each interval if multiple DNISs or queues have beenselected. This represents the maximum value for all call centers or DNISs in thatinterval.
A summary row is provided for each call center or DNIS over all intervals if multiplecall centers or DNISs have been selected. This represents the maximum value forthe call center or DNIS over all intervals.
A summary row is provided for all intervals and all call centers or DNISs. Thisrepresents the maximum value for all call centers or DNISs over all intervals.
The counters included are described in the following table.
Counter Description
Longest Wait Time
This is the maximum amount of time a caller waited in the queue (including any preserved wait time from other queues). Depending on the Call Center Queuing policy, the waiting time may be reset to “0” when a call is transferred to another queue or it may be preserved in the new queue.
Longest Answer Time
This is the maximum amount of time a caller waited before the call was answered for this reporting period. This is the waiting time plus the ringing time before answer.
Longest Wait Abandoned
This is the maximum amount of time a caller waited (including any preserved wait time from other queues) before abandoning the call for this reporting period.
Figure 52 provides an example of a High Water Marks table in a report for multiple call centers or DNISs.
Figure 52 Call Center Report – High Water Marks Table (Multiple Call Centers or DNISs)
Nextiva Call Center Reports – 2014 Page 47 of 68
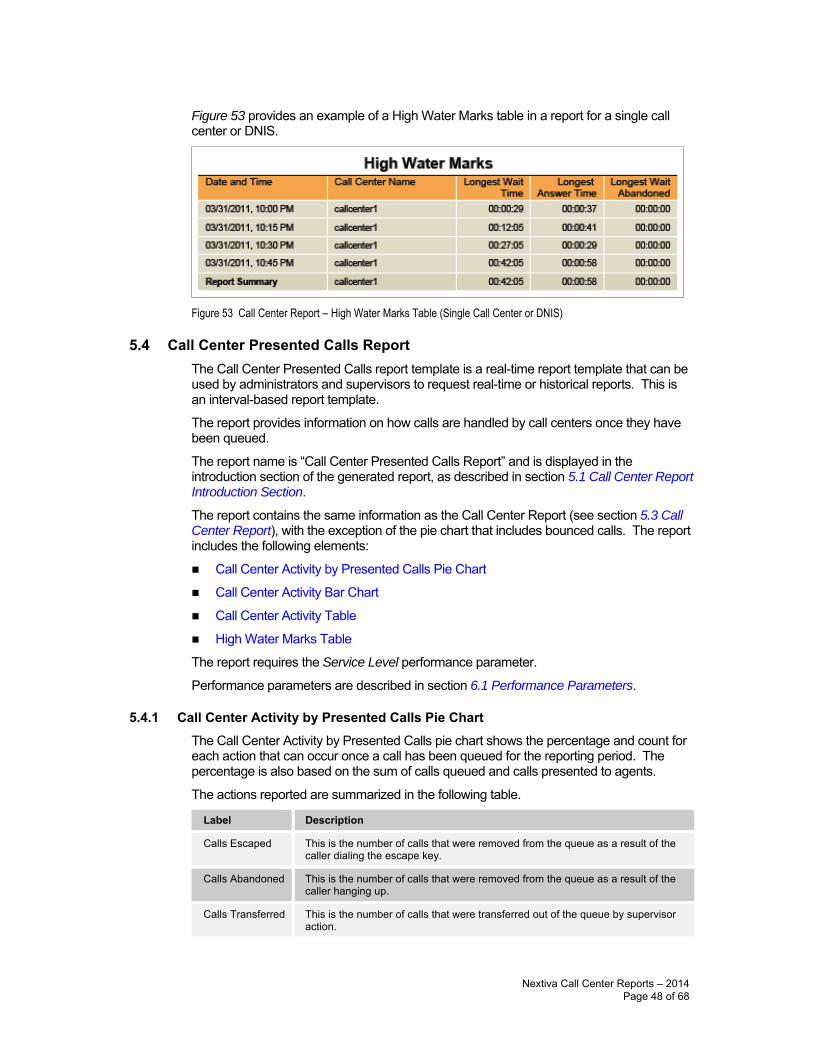
Figure 53 provides an example of a High Water Marks table in a report for a single call center or DNIS.
Figure 53 Call Center Report – High Water Marks Table (Single Call Center or DNIS)
5.4 Call Center Presented Calls Report The Call Center Presented Calls report template is a real-time report template that can be used by administrators and supervisors to request real-time or historical reports. This is an interval-based report template.
The report provides information on how calls are handled by call centers once they have been queued.
The report name is “Call Center Presented Calls Report” and is displayed in the introduction section of the generated report, as described in section 5.1 Call Center Report Introduction Section.
The report contains the same information as the Call Center Report (see section 5.3 Call Center Report), with the exception of the pie chart that includes bounced calls. The report includes the following elements:
Call Center Activity by Presented Calls Pie Chart
Call Center Activity Bar Chart
Call Center Activity Table
High Water Marks Table
The report requires the Service Level performance parameter.
Performance parameters are described in section 6.1 Performance Parameters.
5.4.1 Call Center Activity by Presented Calls Pie Chart The Call Center Activity by Presented Calls pie chart shows the percentage and count for each action that can occur once a call has been queued for the reporting period. The percentage is also based on the sum of calls queued and calls presented to agents.
The actions reported are summarized in the following table.
Label Description
Calls Escaped This is the number of calls that were removed from the queue as a result of the caller dialing the escape key.
Calls Abandoned This is the number of calls that were removed from the queue as a result of the caller hanging up.
Calls Transferred This is the number of calls that were transferred out of the queue by supervisor action.
Nextiva Call Center Reports – 2014 Page 48 of 68
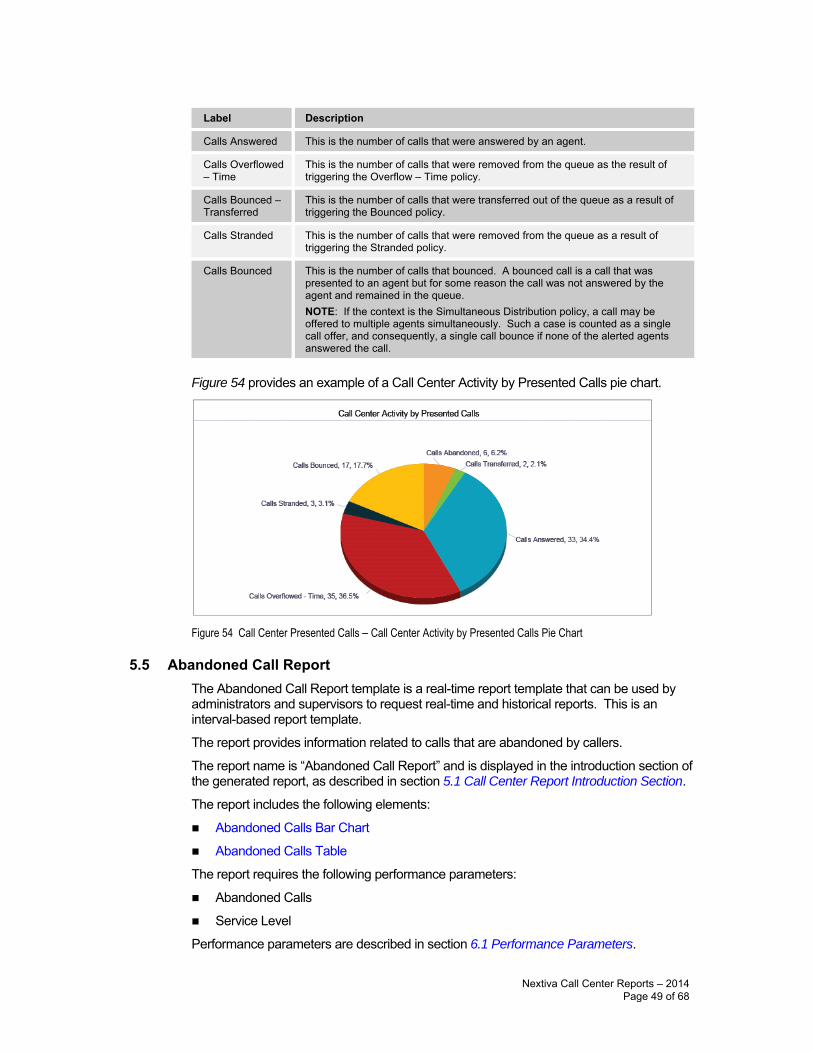
Label Description
Calls Answered This is the number of calls that were answered by an agent.
Calls Overflowed – Time
This is the number of calls that were removed from the queue as the result of triggering the Overflow – Time policy.
Calls Bounced – Transferred
This is the number of calls that were transferred out of the queue as a result of triggering the Bounced policy.
Calls Stranded This is the number of calls that were removed from the queue as a result of triggering the Stranded policy.
Calls Bounced This is the number of calls that bounced. A bounced call is a call that was presented to an agent but for some reason the call was not answered by the agent and remained in the queue. NOTE: If the context is the Simultaneous Distribution policy, a call may be offered to multiple agents simultaneously. Such a case is counted as a single call offer, and consequently, a single call bounce if none of the alerted agents answered the call.
Figure 54 provides an example of a Call Center Activity by Presented Calls pie chart.
Figure 54 Call Center Presented Calls – Call Center Activity by Presented Calls Pie Chart
5.5 Abandoned Call Report The Abandoned Call Report template is a real-time report template that can be used by administrators and supervisors to request real-time and historical reports. This is an interval-based report template.
The report provides information related to calls that are abandoned by callers.
The report name is “Abandoned Call Report” and is displayed in the introduction section of the generated report, as described in section 5.1 Call Center Report Introduction Section.
The report includes the following elements:
Abandoned Calls Bar Chart
Abandoned Calls Table
The report requires the following performance parameters:
Abandoned Calls
Service Level
Performance parameters are described in section 6.1 Performance Parameters.
Nextiva Call Center Reports – 2014 Page 49 of 68
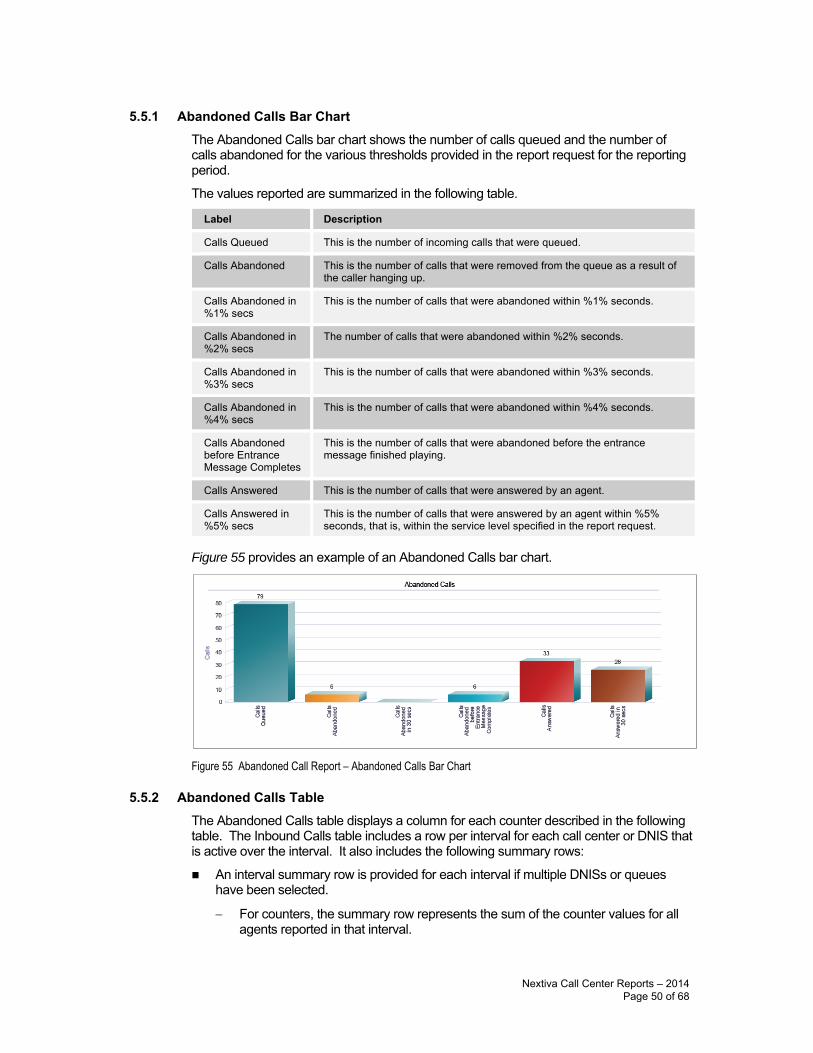
5.5.1 Abandoned Calls Bar Chart The Abandoned Calls bar chart shows the number of calls queued and the number of calls abandoned for the various thresholds provided in the report request for the reporting period.
The values reported are summarized in the following table.
Label Description
Calls Queued This is the number of incoming calls that were queued.
Calls Abandoned This is the number of calls that were removed from the queue as a result of the caller hanging up.
Calls Abandoned in %1% secs
This is the number of calls that were abandoned within %1% seconds.
Calls Abandoned in %2% secs
The number of calls that were abandoned within %2% seconds.
Calls Abandoned in %3% secs
This is the number of calls that were abandoned within %3% seconds.
Calls Abandoned in %4% secs
This is the number of calls that were abandoned within %4% seconds.
Calls Abandoned before Entrance Message Completes
This is the number of calls that were abandoned before the entrance message finished playing.
Calls Answered This is the number of calls that were answered by an agent.
Calls Answered in %5% secs
This is the number of calls that were answered by an agent within %5% seconds, that is, within the service level specified in the report request.
Figure 55 provides an example of an Abandoned Calls bar chart.
Figure 55 Abandoned Call Report – Abandoned Calls Bar Chart
5.5.2 Abandoned Calls Table The Abandoned Calls table displays a column for each counter described in the following table. The Inbound Calls table includes a row per interval for each call center or DNIS that is active over the interval. It also includes the following summary rows:
An interval summary row is provided for each interval if multiple DNISs or queueshave been selected.
− For counters, the summary row represents the sum of the counter values for allagents reported in that interval.
Nextiva Call Center Reports – 2014 Page 50 of 68
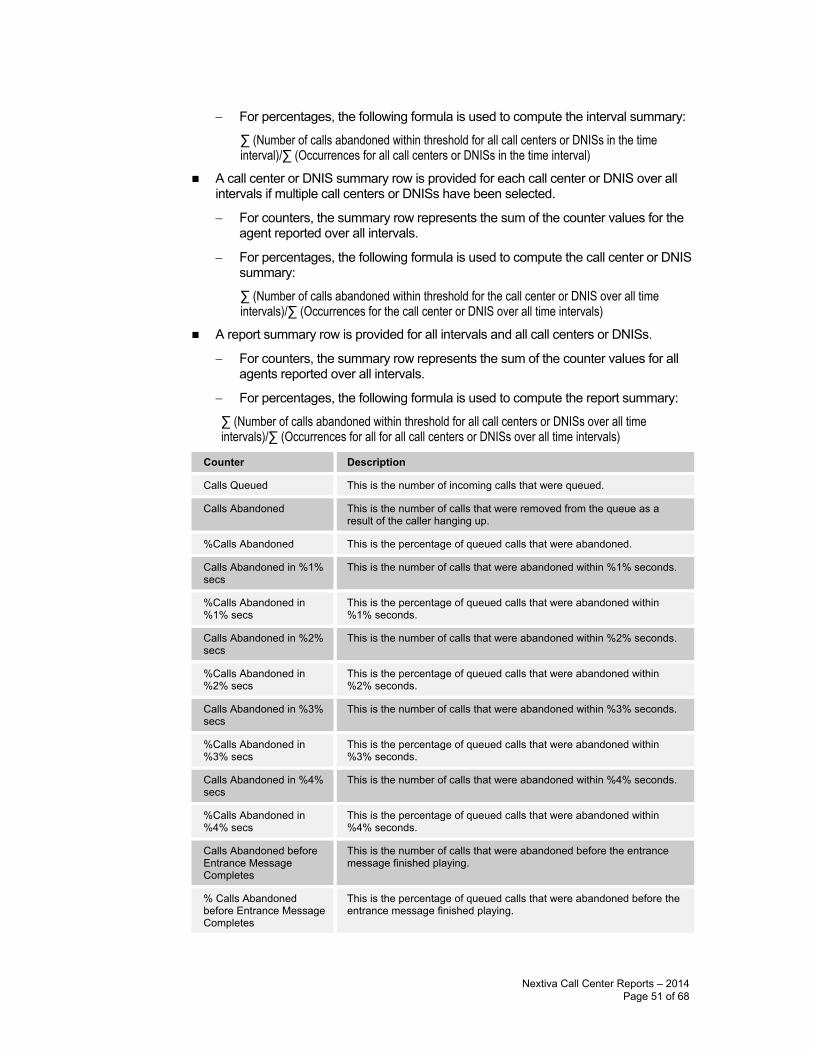
− For percentages, the following formula is used to compute the interval summary:
∑ (Number of calls abandoned within threshold for all call centers or DNISs in the time interval)/∑ (Occurrences for all call centers or DNISs in the time interval)
A call center or DNIS summary row is provided for each call center or DNIS over allintervals if multiple call centers or DNISs have been selected.
− For counters, the summary row represents the sum of the counter values for theagent reported over all intervals.
− For percentages, the following formula is used to compute the call center or DNIS summary:
∑ (Number of calls abandoned within threshold for the call center or DNIS over all time intervals)/∑ (Occurrences for the call center or DNIS over all time intervals)
A report summary row is provided for all intervals and all call centers or DNISs.
− For counters, the summary row represents the sum of the counter values for allagents reported over all intervals.
− For percentages, the following formula is used to compute the report summary:
∑ (Number of calls abandoned within threshold for all call centers or DNISs over all time intervals)/∑ (Occurrences for all for all call centers or DNISs over all time intervals)
Counter Description
Calls Queued This is the number of incoming calls that were queued.
Calls Abandoned This is the number of calls that were removed from the queue as a result of the caller hanging up.
%Calls Abandoned This is the percentage of queued calls that were abandoned.
Calls Abandoned in %1% secs
This is the number of calls that were abandoned within %1% seconds.
%Calls Abandoned in %1% secs
This is the percentage of queued calls that were abandoned within %1% seconds.
Calls Abandoned in %2% secs
This is the number of calls that were abandoned within %2% seconds.
%Calls Abandoned in %2% secs
This is the percentage of queued calls that were abandoned within %2% seconds.
Calls Abandoned in %3% secs
This is the number of calls that were abandoned within %3% seconds.
%Calls Abandoned in %3% secs
This is the percentage of queued calls that were abandoned within %3% seconds.
Calls Abandoned in %4% secs
This is the number of calls that were abandoned within %4% seconds.
%Calls Abandoned in %4% secs
This is the percentage of queued calls that were abandoned within %4% seconds.
Calls Abandoned before Entrance Message Completes
This is the number of calls that were abandoned before the entrance message finished playing.
% Calls Abandoned before Entrance Message Completes
This is the percentage of queued calls that were abandoned before the entrance message finished playing.
Nextiva Call Center Reports – 2014 Page 51 of 68
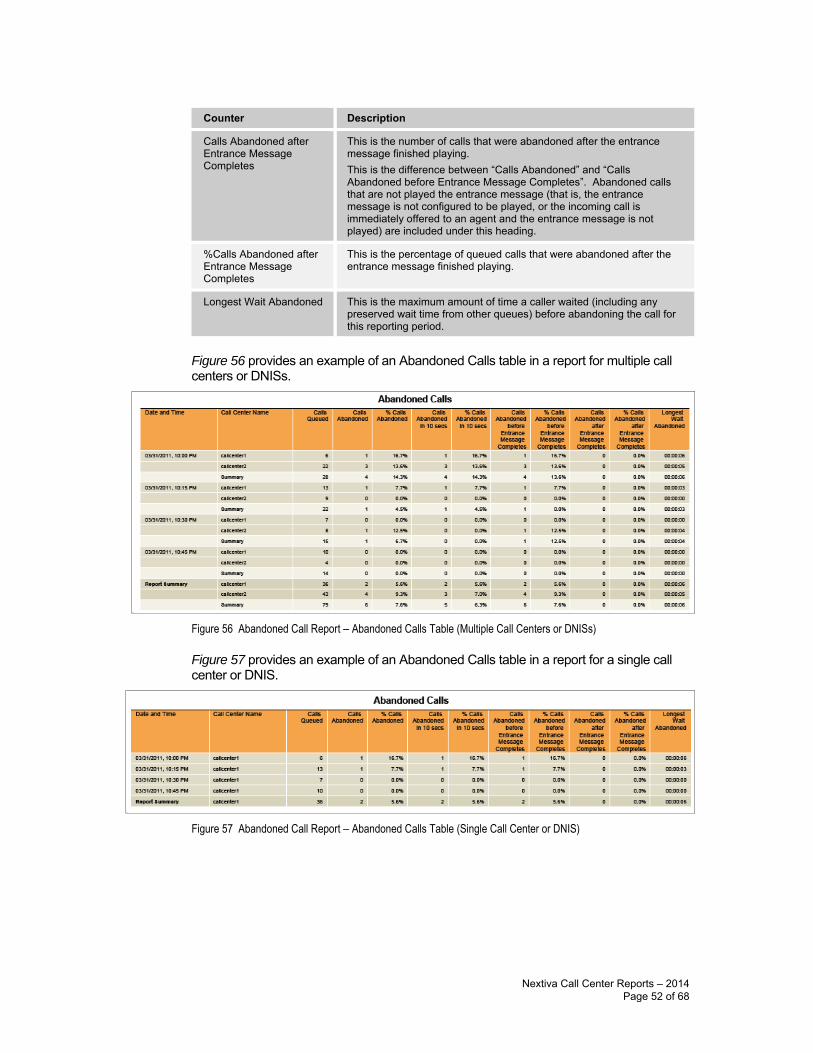
Counter Description
Calls Abandoned after Entrance Message Completes
This is the number of calls that were abandoned after the entrance message finished playing. This is the difference between “Calls Abandoned” and “Calls Abandoned before Entrance Message Completes”. Abandoned calls that are not played the entrance message (that is, the entrance message is not configured to be played, or the incoming call is immediately offered to an agent and the entrance message is not played) are included under this heading.
%Calls Abandoned after Entrance Message Completes
This is the percentage of queued calls that were abandoned after the entrance message finished playing.
Longest Wait Abandoned This is the maximum amount of time a caller waited (including any preserved wait time from other queues) before abandoning the call for this reporting period.
Figure 56 provides an example of an Abandoned Calls table in a report for multiple call centers or DNISs.
Figure 56 Abandoned Call Report – Abandoned Calls Table (Multiple Call Centers or DNISs)
Figure 57 provides an example of an Abandoned Calls table in a report for a single call center or DNIS.
Figure 57 Abandoned Call Report – Abandoned Calls Table (Single Call Center or DNIS)
Nextiva Call Center Reports – 2014 Page 52 of 68
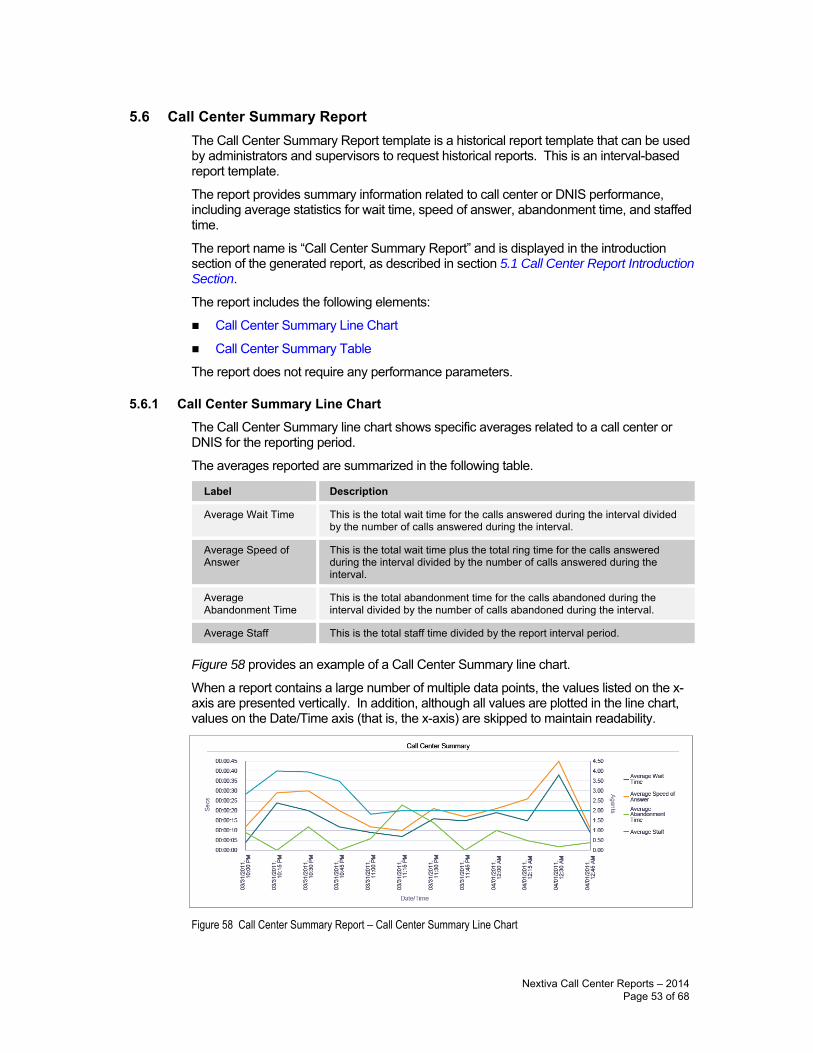
5.6 Call Center Summary Report The Call Center Summary Report template is a historical report template that can be used by administrators and supervisors to request historical reports. This is an interval-based report template.
The report provides summary information related to call center or DNIS performance, including average statistics for wait time, speed of answer, abandonment time, and staffed time.
The report name is “Call Center Summary Report” and is displayed in the introduction section of the generated report, as described in section 5.1 Call Center Report Introduction Section.
The report includes the following elements:
Call Center Summary Line Chart
Call Center Summary Table
The report does not require any performance parameters.
5.6.1 Call Center Summary Line Chart The Call Center Summary line chart shows specific averages related to a call center or DNIS for the reporting period.
The averages reported are summarized in the following table.
Label Description
Average Wait Time This is the total wait time for the calls answered during the interval divided by the number of calls answered during the interval.
Average Speed of Answer
This is the total wait time plus the total ring time for the calls answered during the interval divided by the number of calls answered during the interval.
Average Abandonment Time
This is the total abandonment time for the calls abandoned during the interval divided by the number of calls abandoned during the interval.
Average Staff This is the total staff time divided by the report interval period.
Figure 58 provides an example of a Call Center Summary line chart.
When a report contains a large number of multiple data points, the values listed on the x-axis are presented vertically. In addition, although all values are plotted in the line chart, values on the Date/Time axis (that is, the x-axis) are skipped to maintain readability.
Figure 58 Call Center Summary Report – Call Center Summary Line Chart
Nextiva Call Center Reports – 2014 Page 53 of 68
5.6.2 Call Center Summary Table The Call Center Summary table displays a column for each counter described in the following table. The Inbound Calls table includes a row per interval for each call center or DNIS that is active over the interval. It also includes the following summary rows:
An interval summary row is provided for each interval if multiple DNISs or queueshave been selected. The following formula is used to compute the interval summary:
∑ (Time for all call centers or DNISs for the interval)/∑ (Occurrences for all call centers or DNISs for the time interval)
A call center or DNIS summary row is provided for each call center or DNIS over allintervals if multiple call centers or DNISs have been selected. The following formula isused to compute the call center or DNIS summary:
∑ (Time for the call center or DNIS over all intervals)/∑ (Occurrences for the call center or DNIS over all time intervals)
A report summary row is provided for all intervals and all call centers or DNISs. Thefollowing formula is used to compute the report summary:
∑ (Time for all call centers or DNISs over all intervals)/∑ (Occurrences for all call centers or DNISs over all time intervals)
Counter Description
Average Wait Time This is the total wait time for the calls answered during the interval divided by the number of calls answered during the interval.
Average Speed of Answer
This is the total wait time plus the total ring time for the calls answered during the interval divided by the number of calls answered during the interval.
Average Abandonment Time
This is the total abandonment time for the calls abandoned during the interval divided by the number of calls abandoned during the interval.
Average Staff This is the average number of agents staffing the call center(s) during the reporting period interval. This is the total staff time divided by the interval period.
Nextiva Call Center Reports – 2014 Page 54 of 68
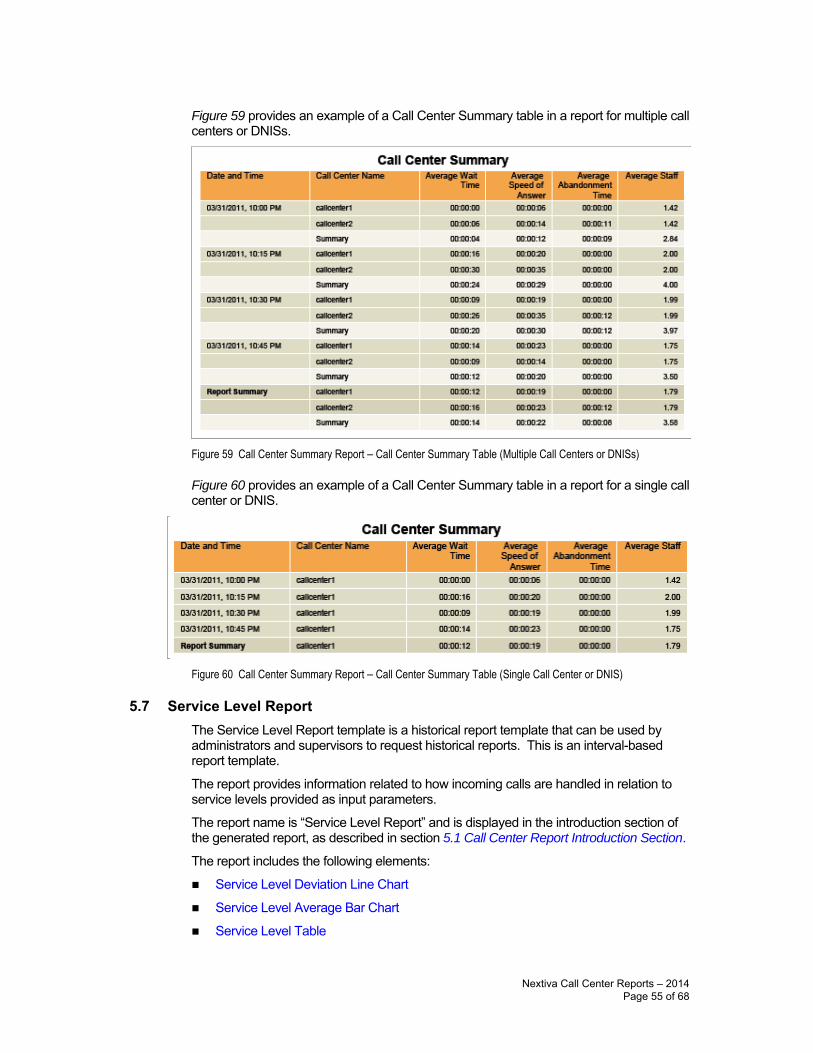
Figure 59 provides an example of a Call Center Summary table in a report for multiple call centers or DNISs.
Figure 59 Call Center Summary Report – Call Center Summary Table (Multiple Call Centers or DNISs)
Figure 60 provides an example of a Call Center Summary table in a report for a single call center or DNIS.
Figure 60 Call Center Summary Report – Call Center Summary Table (Single Call Center or DNIS)
5.7 Service Level Report The Service Level Report template is a historical report template that can be used by administrators and supervisors to request historical reports. This is an interval-based report template.
The report provides information related to how incoming calls are handled in relation to service levels provided as input parameters.
The report name is “Service Level Report” and is displayed in the introduction section of the generated report, as described in section 5.1 Call Center Report Introduction Section.
The report includes the following elements:
Service Level Deviation Line Chart
Service Level Average Bar Chart
Service Level Table
Nextiva Call Center Reports – 2014 Page 55 of 68
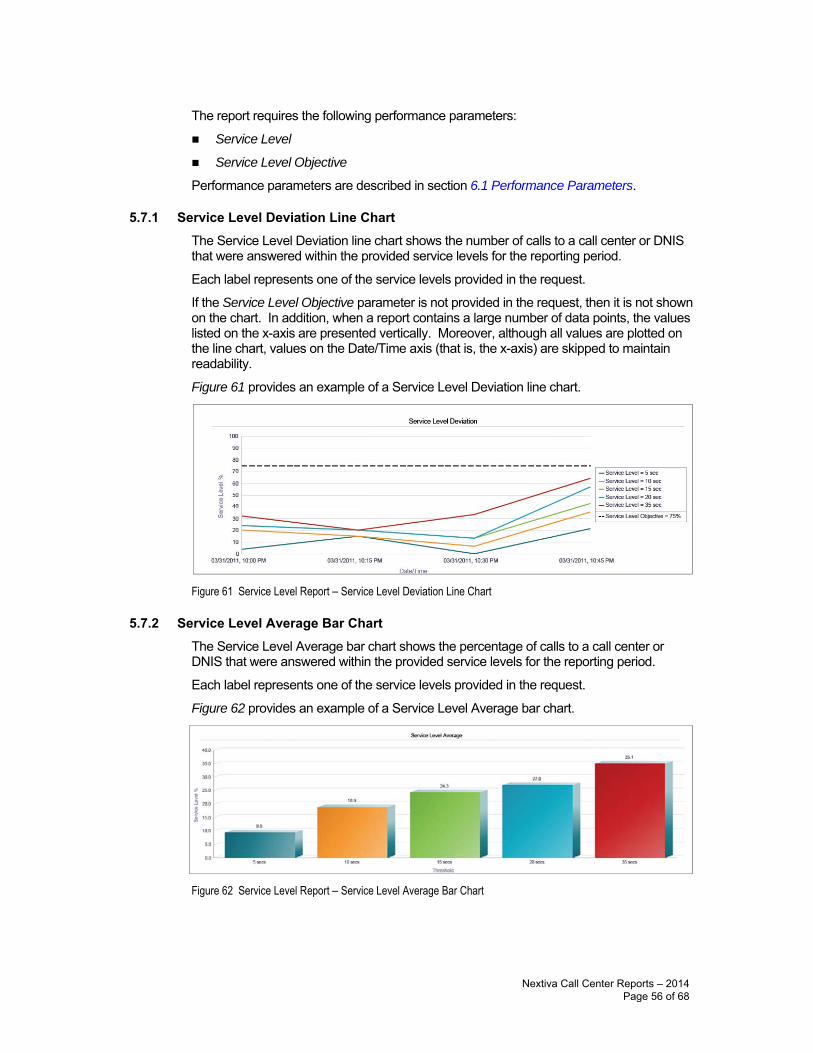
The report requires the following performance parameters:
Service Level
Service Level Objective
Performance parameters are described in section 6.1 Performance Parameters.
5.7.1 Service Level Deviation Line Chart The Service Level Deviation line chart shows the number of calls to a call center or DNIS that were answered within the provided service levels for the reporting period.
Each label represents one of the service levels provided in the request.
If the Service Level Objective parameter is not provided in the request, then it is not shown on the chart. In addition, when a report contains a large number of data points, the values listed on the x-axis are presented vertically. Moreover, although all values are plotted on the line chart, values on the Date/Time axis (that is, the x-axis) are skipped to maintain readability.
Figure 61 provides an example of a Service Level Deviation line chart.
Figure 61 Service Level Report – Service Level Deviation Line Chart
5.7.2 Service Level Average Bar Chart The Service Level Average bar chart shows the percentage of calls to a call center or DNIS that were answered within the provided service levels for the reporting period.
Each label represents one of the service levels provided in the request.
Figure 62 provides an example of a Service Level Average bar chart.
Figure 62 Service Level Report – Service Level Average Bar Chart
Nextiva Call Center Reports – 2014 Page 56 of 68
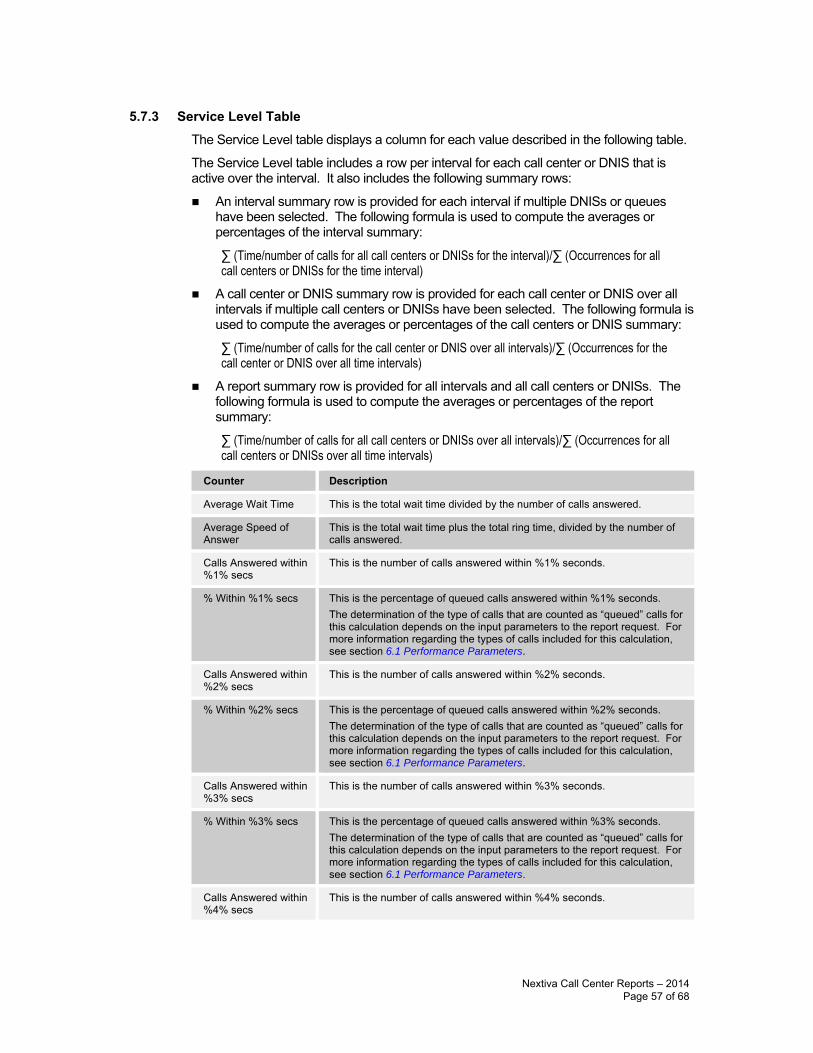
5.7.3 Service Level Table The Service Level table displays a column for each value described in the following table.
The Service Level table includes a row per interval for each call center or DNIS that is active over the interval. It also includes the following summary rows:
An interval summary row is provided for each interval if multiple DNISs or queueshave been selected. The following formula is used to compute the averages orpercentages of the interval summary:
∑ (Time/number of calls for all call centers or DNISs for the interval)/∑ (Occurrences for all call centers or DNISs for the time interval)
A call center or DNIS summary row is provided for each call center or DNIS over allintervals if multiple call centers or DNISs have been selected. The following formula isused to compute the averages or percentages of the call centers or DNIS summary:
∑ (Time/number of calls for the call center or DNIS over all intervals)/∑ (Occurrences for the call center or DNIS over all time intervals)
A report summary row is provided for all intervals and all call centers or DNISs. Thefollowing formula is used to compute the averages or percentages of the reportsummary:
∑ (Time/number of calls for all call centers or DNISs over all intervals)/∑ (Occurrences for all call centers or DNISs over all time intervals)
Counter Description
Average Wait Time This is the total wait time divided by the number of calls answered.
Average Speed of Answer
This is the total wait time plus the total ring time, divided by the number of calls answered.
Calls Answered within %1% secs
This is the number of calls answered within %1% seconds.
% Within %1% secs This is the percentage of queued calls answered within %1% seconds. The determination of the type of calls that are counted as “queued” calls for this calculation depends on the input parameters to the report request. For more information regarding the types of calls included for this calculation, see section 6.1 Performance Parameters.
Calls Answered within %2% secs
This is the number of calls answered within %2% seconds.
% Within %2% secs This is the percentage of queued calls answered within %2% seconds. The determination of the type of calls that are counted as “queued” calls for this calculation depends on the input parameters to the report request. For more information regarding the types of calls included for this calculation, see section 6.1 Performance Parameters.
Calls Answered within %3% secs
This is the number of calls answered within %3% seconds.
% Within %3% secs This is the percentage of queued calls answered within %3% seconds. The determination of the type of calls that are counted as “queued” calls for this calculation depends on the input parameters to the report request. For more information regarding the types of calls included for this calculation, see section 6.1 Performance Parameters.
Calls Answered within %4% secs
This is the number of calls answered within %4% seconds.
Nextiva Call Center Reports – 2014 Page 57 of 68
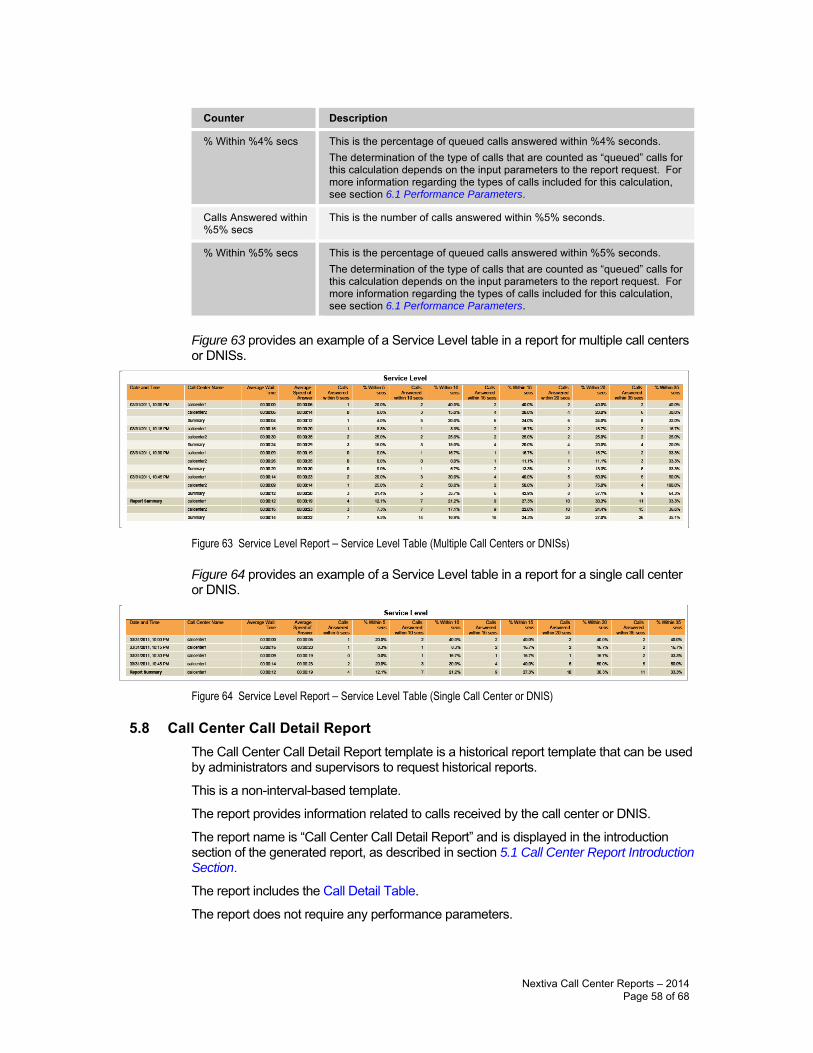
Counter Description
% Within %4% secs This is the percentage of queued calls answered within %4% seconds. The determination of the type of calls that are counted as “queued” calls for this calculation depends on the input parameters to the report request. For more information regarding the types of calls included for this calculation, see section 6.1 Performance Parameters.
Calls Answered within %5% secs
This is the number of calls answered within %5% seconds.
% Within %5% secs This is the percentage of queued calls answered within %5% seconds. The determination of the type of calls that are counted as “queued” calls for this calculation depends on the input parameters to the report request. For more information regarding the types of calls included for this calculation, see section 6.1 Performance Parameters.
Figure 63 provides an example of a Service Level table in a report for multiple call centers or DNISs.
Figure 63 Service Level Report – Service Level Table (Multiple Call Centers or DNISs)
Figure 64 provides an example of a Service Level table in a report for a single call center or DNIS.
Figure 64 Service Level Report – Service Level Table (Single Call Center or DNIS)
5.8 Call Center Call Detail Report The Call Center Call Detail Report template is a historical report template that can be used by administrators and supervisors to request historical reports.
This is a non-interval-based template.
The report provides information related to calls received by the call center or DNIS.
The report name is “Call Center Call Detail Report” and is displayed in the introduction section of the generated report, as described in section 5.1 Call Center Report Introduction Section.
The report includes the Call Detail Table.
The report does not require any performance parameters.
Nextiva Call Center Reports – 2014 Page 58 of 68
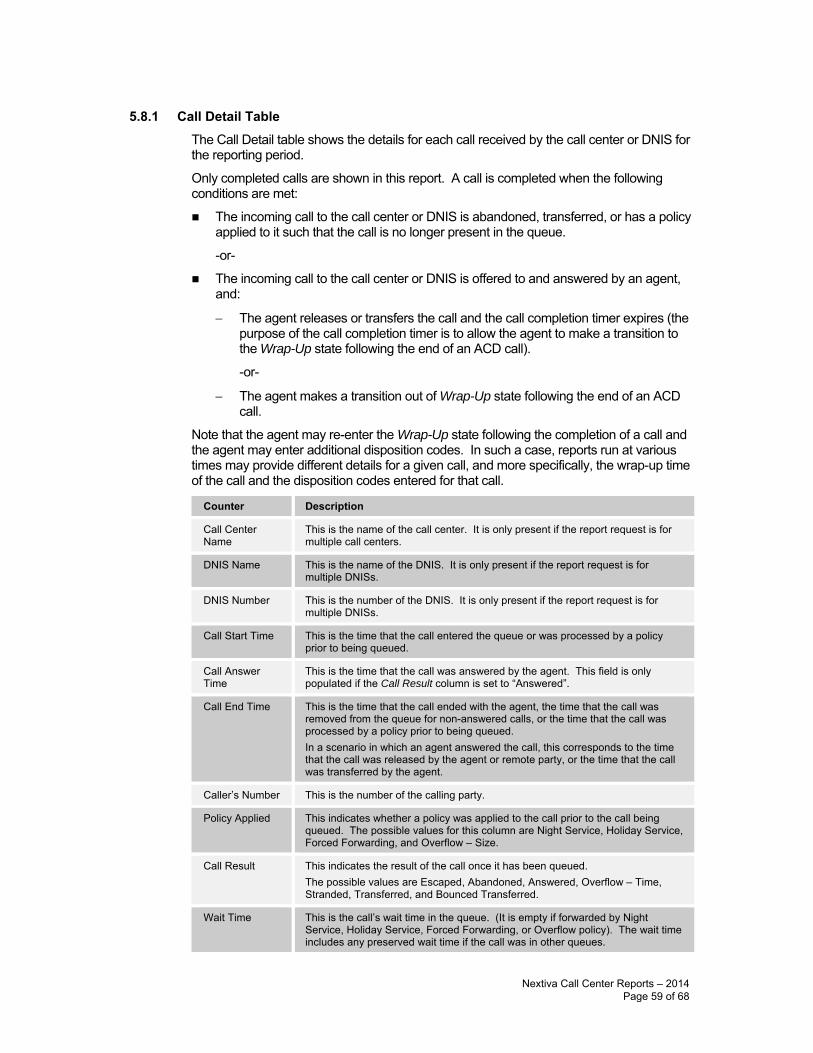
5.8.1 Call Detail Table The Call Detail table shows the details for each call received by the call center or DNIS for the reporting period.
Only completed calls are shown in this report. A call is completed when the following conditions are met:
The incoming call to the call center or DNIS is abandoned, transferred, or has a policyapplied to it such that the call is no longer present in the queue.
-or-
The incoming call to the call center or DNIS is offered to and answered by an agent,and:
− The agent releases or transfers the call and the call completion timer expires (thepurpose of the call completion timer is to allow the agent to make a transition to the Wrap-Up state following the end of an ACD call).
-or-
− The agent makes a transition out of Wrap-Up state following the end of an ACD call.
Note that the agent may re-enter the Wrap-Up state following the completion of a call and the agent may enter additional disposition codes. In such a case, reports run at various times may provide different details for a given call, and more specifically, the wrap-up time of the call and the disposition codes entered for that call.
Counter Description
Call Center Name
This is the name of the call center. It is only present if the report request is for multiple call centers.
DNIS Name This is the name of the DNIS. It is only present if the report request is for multiple DNISs.
DNIS Number This is the number of the DNIS. It is only present if the report request is for multiple DNISs.
Call Start Time This is the time that the call entered the queue or was processed by a policy prior to being queued.
Call Answer Time
This is the time that the call was answered by the agent. This field is only populated if the Call Result column is set to “Answered”.
Call End Time This is the time that the call ended with the agent, the time that the call was removed from the queue for non-answered calls, or the time that the call was processed by a policy prior to being queued. In a scenario in which an agent answered the call, this corresponds to the time that the call was released by the agent or remote party, or the time that the call was transferred by the agent.
Caller’s Number This is the number of the calling party.
Policy Applied This indicates whether a policy was applied to the call prior to the call being queued. The possible values for this column are Night Service, Holiday Service, Forced Forwarding, and Overflow – Size.
Call Result This indicates the result of the call once it has been queued. The possible values are Escaped, Abandoned, Answered, Overflow – Time, Stranded, Transferred, and Bounced Transferred.
Wait Time This is the call’s wait time in the queue. (It is empty if forwarded by Night Service, Holiday Service, Forced Forwarding, or Overflow policy). The wait time includes any preserved wait time if the call was in other queues.
Nextiva Call Center Reports – 2014 Page 59 of 68
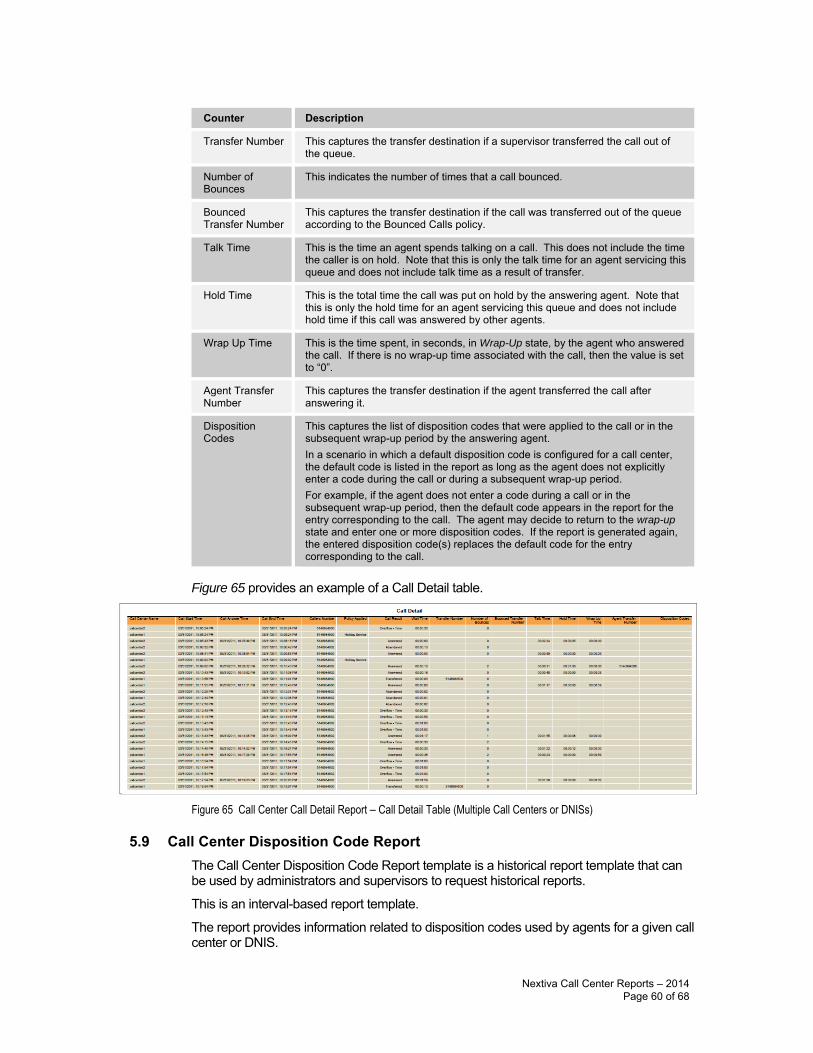
Counter Description
Transfer Number This captures the transfer destination if a supervisor transferred the call out of the queue.
Number of Bounces
This indicates the number of times that a call bounced.
Bounced Transfer Number
This captures the transfer destination if the call was transferred out of the queue according to the Bounced Calls policy.
Talk Time This is the time an agent spends talking on a call. This does not include the time the caller is on hold. Note that this is only the talk time for an agent servicing this queue and does not include talk time as a result of transfer.
Hold Time This is the total time the call was put on hold by the answering agent. Note that this is only the hold time for an agent servicing this queue and does not include hold time if this call was answered by other agents.
Wrap Up Time This is the time spent, in seconds, in Wrap-Up state, by the agent who answered the call. If there is no wrap-up time associated with the call, then the value is set to “0”.
Agent Transfer Number
This captures the transfer destination if the agent transferred the call after answering it.
Disposition Codes
This captures the list of disposition codes that were applied to the call or in the subsequent wrap-up period by the answering agent. In a scenario in which a default disposition code is configured for a call center, the default code is listed in the report as long as the agent does not explicitly enter a code during the call or during a subsequent wrap-up period. For example, if the agent does not enter a code during a call or in the subsequent wrap-up period, then the default code appears in the report for the entry corresponding to the call. The agent may decide to return to the wrap-up state and enter one or more disposition codes. If the report is generated again, the entered disposition code(s) replaces the default code for the entry corresponding to the call.
Figure 65 provides an example of a Call Detail table.
Figure 65 Call Center Call Detail Report – Call Detail Table (Multiple Call Centers or DNISs)
5.9 Call Center Disposition Code Report The Call Center Disposition Code Report template is a historical report template that can be used by administrators and supervisors to request historical reports.
This is an interval-based report template.
The report provides information related to disposition codes used by agents for a given call center or DNIS.
Nextiva Call Center Reports – 2014 Page 60 of 68
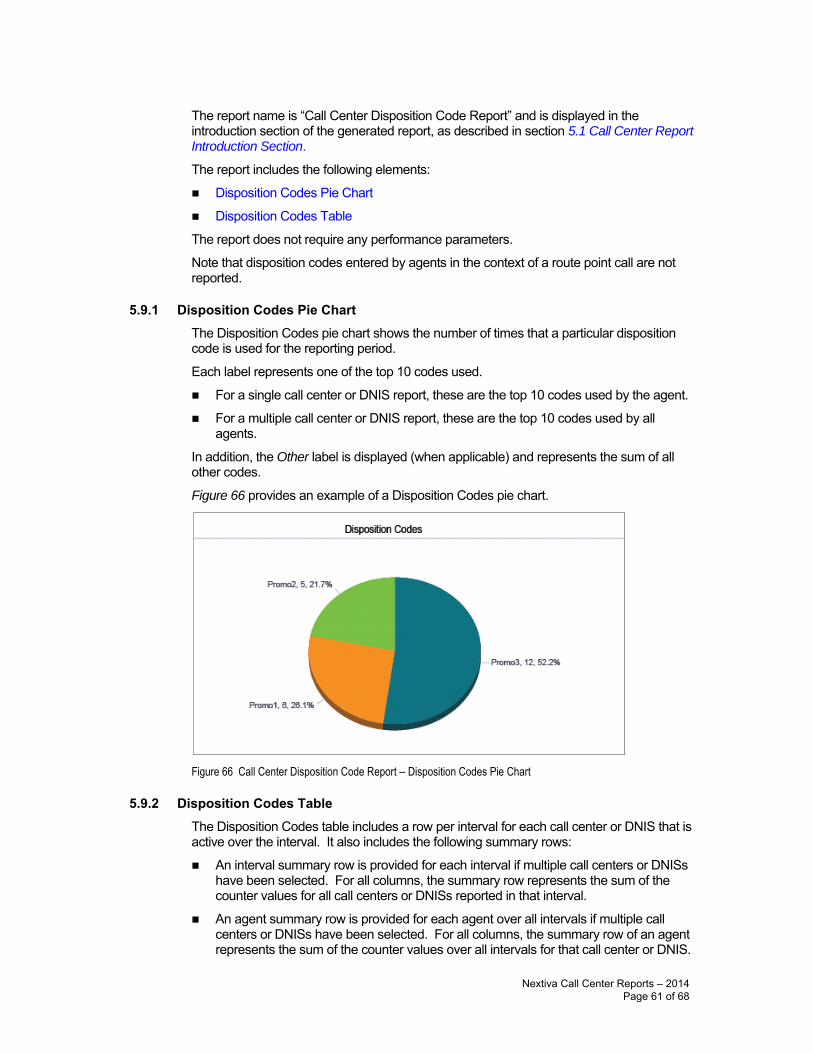
The report name is “Call Center Disposition Code Report” and is displayed in the introduction section of the generated report, as described in section 5.1 Call Center Report Introduction Section.
The report includes the following elements:
Disposition Codes Pie Chart
Disposition Codes Table
The report does not require any performance parameters.
Note that disposition codes entered by agents in the context of a route point call are not reported.
5.9.1 Disposition Codes Pie Chart The Disposition Codes pie chart shows the number of times that a particular disposition code is used for the reporting period.
Each label represents one of the top 10 codes used.
For a single call center or DNIS report, these are the top 10 codes used by the agent.
For a multiple call center or DNIS report, these are the top 10 codes used by allagents.
In addition, the Other label is displayed (when applicable) and represents the sum of all other codes.
Figure 66 provides an example of a Disposition Codes pie chart.
Figure 66 Call Center Disposition Code Report – Disposition Codes Pie Chart
5.9.2 Disposition Codes Table The Disposition Codes table includes a row per interval for each call center or DNIS that is active over the interval. It also includes the following summary rows:
An interval summary row is provided for each interval if multiple call centers or DNISshave been selected. For all columns, the summary row represents the sum of thecounter values for all call centers or DNISs reported in that interval.
An agent summary row is provided for each agent over all intervals if multiple callcenters or DNISs have been selected. For all columns, the summary row of an agentrepresents the sum of the counter values over all intervals for that call center or DNIS.
Nextiva Call Center Reports – 2014 Page 61 of 68
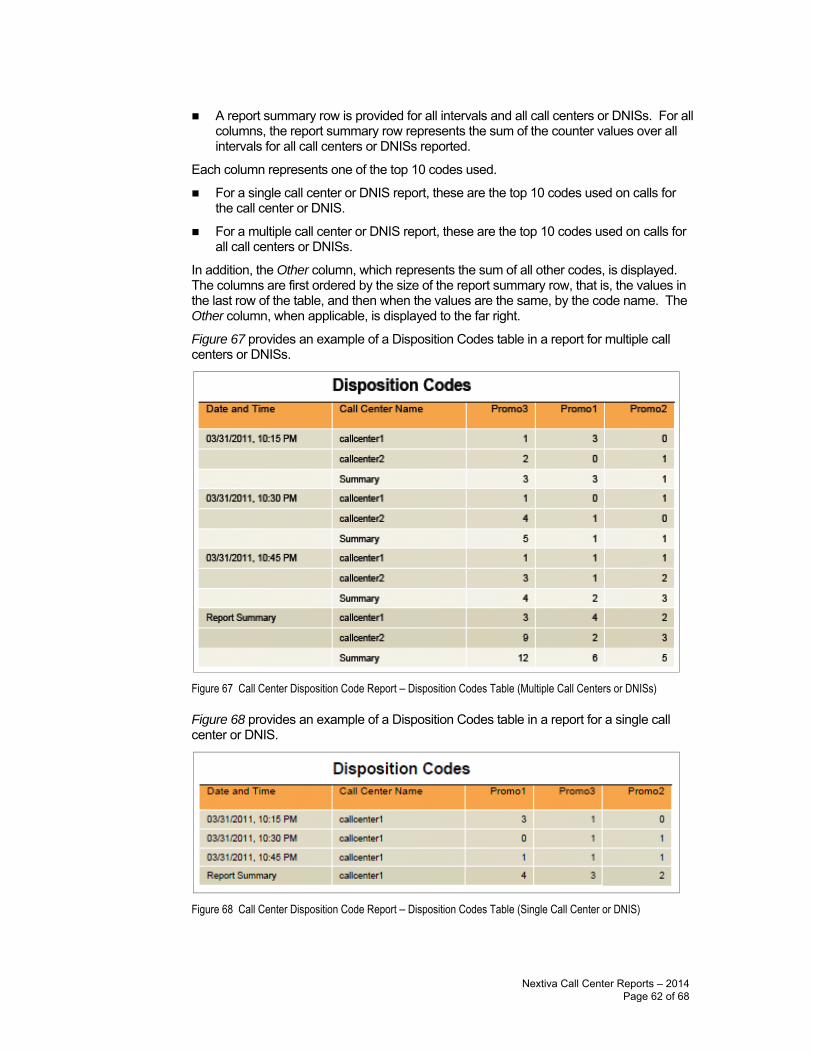
A report summary row is provided for all intervals and all call centers or DNISs. For allcolumns, the report summary row represents the sum of the counter values over allintervals for all call centers or DNISs reported.
Each column represents one of the top 10 codes used.
For a single call center or DNIS report, these are the top 10 codes used on calls forthe call center or DNIS.
For a multiple call center or DNIS report, these are the top 10 codes used on calls forall call centers or DNISs.
In addition, the Other column, which represents the sum of all other codes, is displayed. The columns are first ordered by the size of the report summary row, that is, the values in the last row of the table, and then when the values are the same, by the code name. The Other column, when applicable, is displayed to the far right.
Figure 67 provides an example of a Disposition Codes table in a report for multiple call centers or DNISs.
Figure 67 Call Center Disposition Code Report – Disposition Codes Table (Multiple Call Centers or DNISs)
Figure 68 provides an example of a Disposition Codes table in a report for a single call center or DNIS.
Figure 68 Call Center Disposition Code Report – Disposition Codes Table (Single Call Center or DNIS)
Nextiva Call Center Reports – 2014 Page 62 of 68
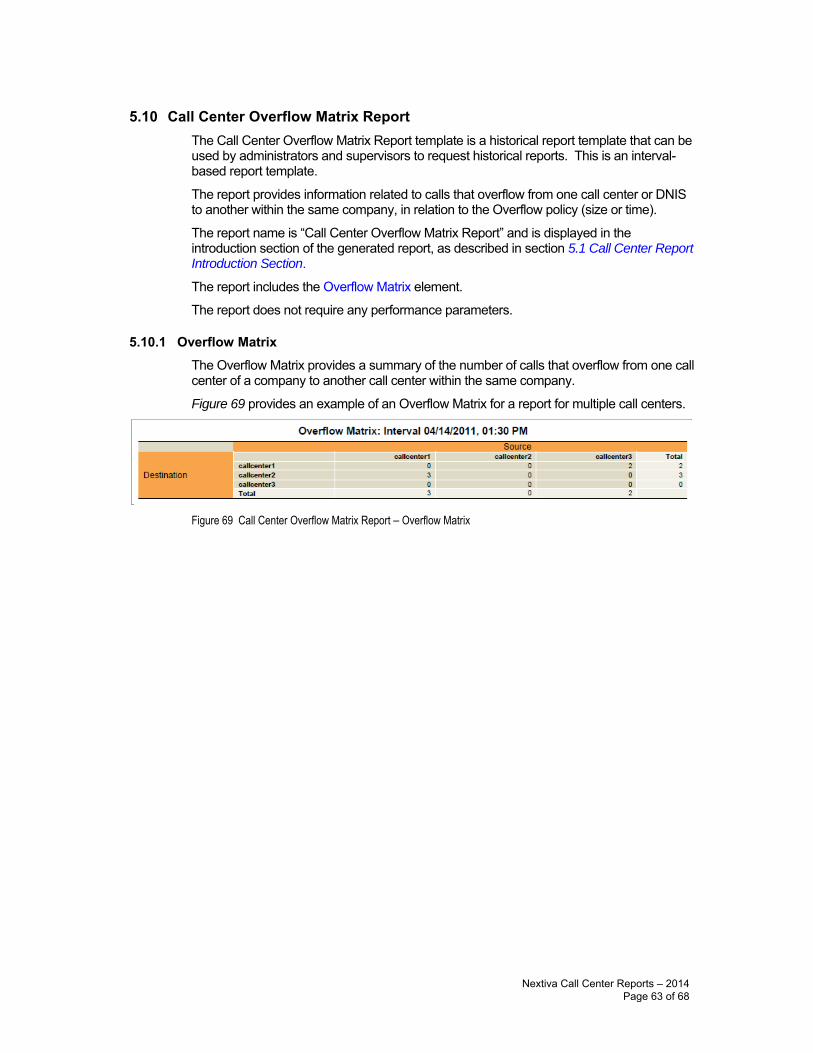
5.10 Call Center Overflow Matrix Report The Call Center Overflow Matrix Report template is a historical report template that can be used by administrators and supervisors to request historical reports. This is an interval-based report template.
The report provides information related to calls that overflow from one call center or DNIS to another within the same company, in relation to the Overflow policy (size or time).
The report name is “Call Center Overflow Matrix Report” and is displayed in the introduction section of the generated report, as described in section 5.1 Call Center Report Introduction Section.
The report includes the Overflow Matrix element.
The report does not require any performance parameters.
5.10.1 Overflow Matrix The Overflow Matrix provides a summary of the number of calls that overflow from one call center of a company to another call center within the same company.
Figure 69 provides an example of an Overflow Matrix for a report for multiple call centers.
Figure 69 Call Center Overflow Matrix Report – Overflow Matrix
Nextiva Call Center Reports – 2014 Page 63 of 68
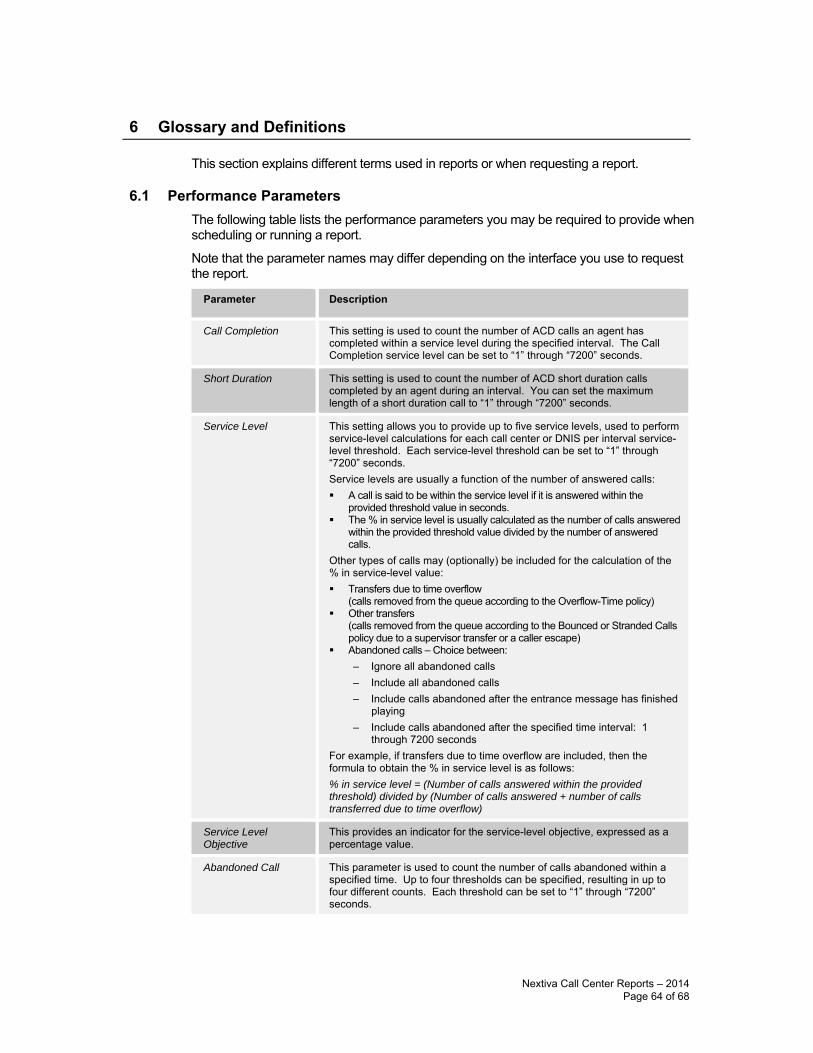
6 Glossary and Definitions
This section explains different terms used in reports or when requesting a report.
6.1 Performance Parameters The following table lists the performance parameters you may be required to provide when scheduling or running a report.
Note that the parameter names may differ depending on the interface you use to request the report.
Parameter Description
Call Completion This setting is used to count the number of ACD calls an agent has completed within a service level during the specified interval. The Call Completion service level can be set to “1” through “7200” seconds.
Short Duration This setting is used to count the number of ACD short duration calls completed by an agent during an interval. You can set the maximum length of a short duration call to “1” through “7200” seconds.
Service Level This setting allows you to provide up to five service levels, used to perform service-level calculations for each call center or DNIS per interval service-level threshold. Each service-level threshold can be set to “1” through “7200” seconds. Service levels are usually a function of the number of answered calls: A call is said to be within the service level if it is answered within the
provided threshold value in seconds. The % in service level is usually calculated as the number of calls answered
within the provided threshold value divided by the number of answered calls.
Other types of calls may (optionally) be included for the calculation of the % in service-level value: Transfers due to time overflow
(calls removed from the queue according to the Overflow-Time policy) Other transfers(calls removed from the queue according to the Bounced or Stranded Calls policy due to a supervisor transfer or a caller escape)
Abandoned calls – Choice between: – Ignore all abandoned calls– Include all abandoned calls– Include calls abandoned after the entrance message has finished
playing– Include calls abandoned after the specified time interval: 1
through 7200 secondsFor example, if transfers due to time overflow are included, then the formula to obtain the % in service level is as follows: % in service level = (Number of calls answered within the provided threshold) divided by (Number of calls answered + number of calls transferred due to time overflow)
Service Level Objective
This provides an indicator for the service-level objective, expressed as a percentage value.
Abandoned Call This parameter is used to count the number of calls abandoned within a specified time. Up to four thresholds can be specified, resulting in up to four different counts. Each threshold can be set to “1” through “7200” seconds.
Nextiva Call Center Reports – 2014 Page 64 of 68
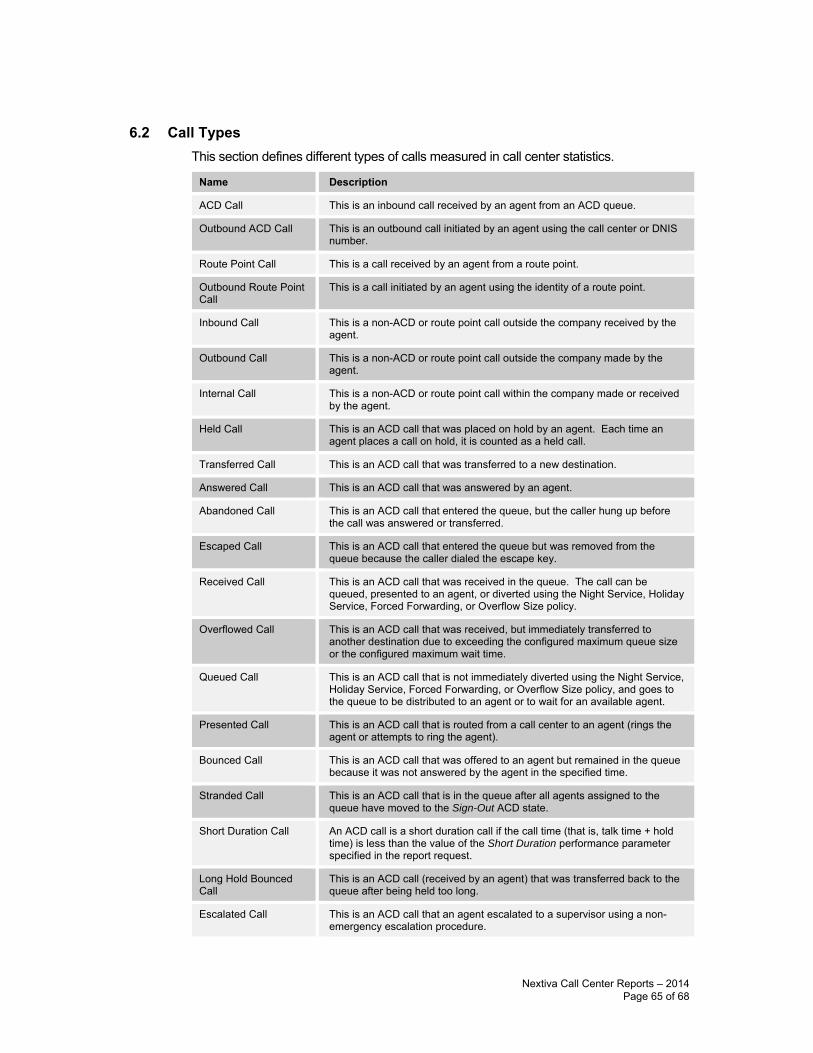
6.2 Call Types This section defines different types of calls measured in call center statistics.
Name Description
ACD Call This is an inbound call received by an agent from an ACD queue.
Outbound ACD Call This is an outbound call initiated by an agent using the call center or DNIS number.
Route Point Call This is a call received by an agent from a route point.
Outbound Route Point Call
This is a call initiated by an agent using the identity of a route point.
Inbound Call This is a non-ACD or route point call outside the company received by the agent.
Outbound Call This is a non-ACD or route point call outside the company made by the agent.
Internal Call This is a non-ACD or route point call within the company made or received by the agent.
Held Call This is an ACD call that was placed on hold by an agent. Each time an agent places a call on hold, it is counted as a held call.
Transferred Call This is an ACD call that was transferred to a new destination.
Answered Call This is an ACD call that was answered by an agent.
Abandoned Call This is an ACD call that entered the queue, but the caller hung up before the call was answered or transferred.
Escaped Call This is an ACD call that entered the queue but was removed from the queue because the caller dialed the escape key.
Received Call This is an ACD call that was received in the queue. The call can be queued, presented to an agent, or diverted using the Night Service, Holiday Service, Forced Forwarding, or Overflow Size policy.
Overflowed Call This is an ACD call that was received, but immediately transferred to another destination due to exceeding the configured maximum queue size or the configured maximum wait time.
Queued Call This is an ACD call that is not immediately diverted using the Night Service, Holiday Service, Forced Forwarding, or Overflow Size policy, and goes to the queue to be distributed to an agent or to wait for an available agent.
Presented Call This is an ACD call that is routed from a call center to an agent (rings the agent or attempts to ring the agent).
Bounced Call This is an ACD call that was offered to an agent but remained in the queue because it was not answered by the agent in the specified time.
Stranded Call This is an ACD call that is in the queue after all agents assigned to the queue have moved to the Sign-Out ACD state.
Short Duration Call An ACD call is a short duration call if the call time (that is, talk time + hold time) is less than the value of the Short Duration performance parameter specified in the report request.
Long Hold Bounced Call
This is an ACD call (received by an agent) that was transferred back to the queue after being held too long.
Escalated Call This is an ACD call that an agent escalated to a supervisor using a non-emergency escalation procedure.
Nextiva Call Center Reports – 2014 Page 65 of 68
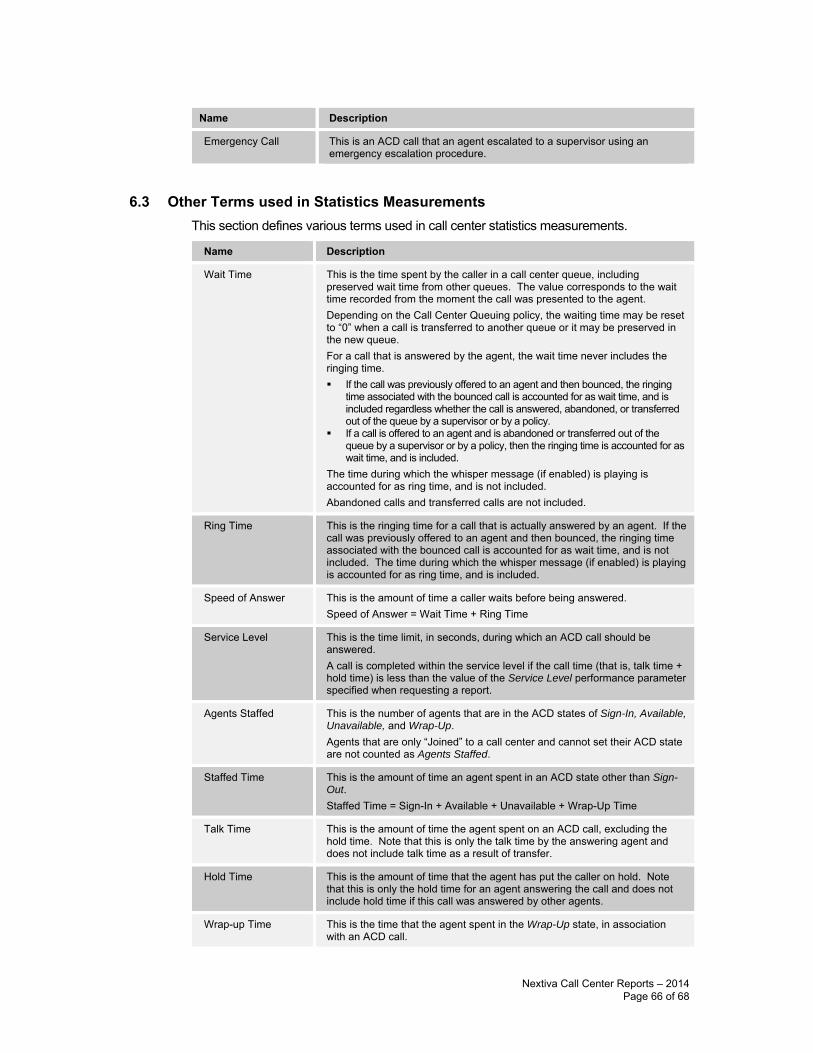
Name Description
Emergency Call This is an ACD call that an agent escalated to a supervisor using an emergency escalation procedure.
6.3 Other Terms used in Statistics Measurements This section defines various terms used in call center statistics measurements.
Name Description
Wait Time This is the time spent by the caller in a call center queue, including preserved wait time from other queues. The value corresponds to the wait time recorded from the moment the call was presented to the agent. Depending on the Call Center Queuing policy, the waiting time may be reset to “0” when a call is transferred to another queue or it may be preserved in the new queue. For a call that is answered by the agent, the wait time never includes the ringing time. If the call was previously offered to an agent and then bounced, the ringing
time associated with the bounced call is accounted for as wait time, and is included regardless whether the call is answered, abandoned, or transferred out of the queue by a supervisor or by a policy.
If a call is offered to an agent and is abandoned or transferred out of the queue by a supervisor or by a policy, then the ringing time is accounted for as wait time, and is included.
The time during which the whisper message (if enabled) is playing is accounted for as ring time, and is not included. Abandoned calls and transferred calls are not included.
Ring Time This is the ringing time for a call that is actually answered by an agent. If the call was previously offered to an agent and then bounced, the ringing time associated with the bounced call is accounted for as wait time, and is not included. The time during which the whisper message (if enabled) is playing is accounted for as ring time, and is included.
Speed of Answer This is the amount of time a caller waits before being answered. Speed of Answer = Wait Time + Ring Time
Service Level This is the time limit, in seconds, during which an ACD call should be answered. A call is completed within the service level if the call time (that is, talk time + hold time) is less than the value of the Service Level performance parameter specified when requesting a report.
Agents Staffed This is the number of agents that are in the ACD states of Sign-In, Available, Unavailable, and Wrap-Up. Agents that are only “Joined” to a call center and cannot set their ACD state are not counted as Agents Staffed.
Staffed Time This is the amount of time an agent spent in an ACD state other than Sign-Out. Staffed Time = Sign-In + Available + Unavailable + Wrap-Up Time
Talk Time This is the amount of time the agent spent on an ACD call, excluding the hold time. Note that this is only the talk time by the answering agent and does not include talk time as a result of transfer.
Hold Time This is the amount of time that the agent has put the caller on hold. Note that this is only the hold time for an agent answering the call and does not include hold time if this call was answered by other agents.
Wrap-up Time This is the time that the agent spent in the Wrap-Up state, in association with an ACD call.
Nextiva Call Center Reports – 2014 Page 66 of 68
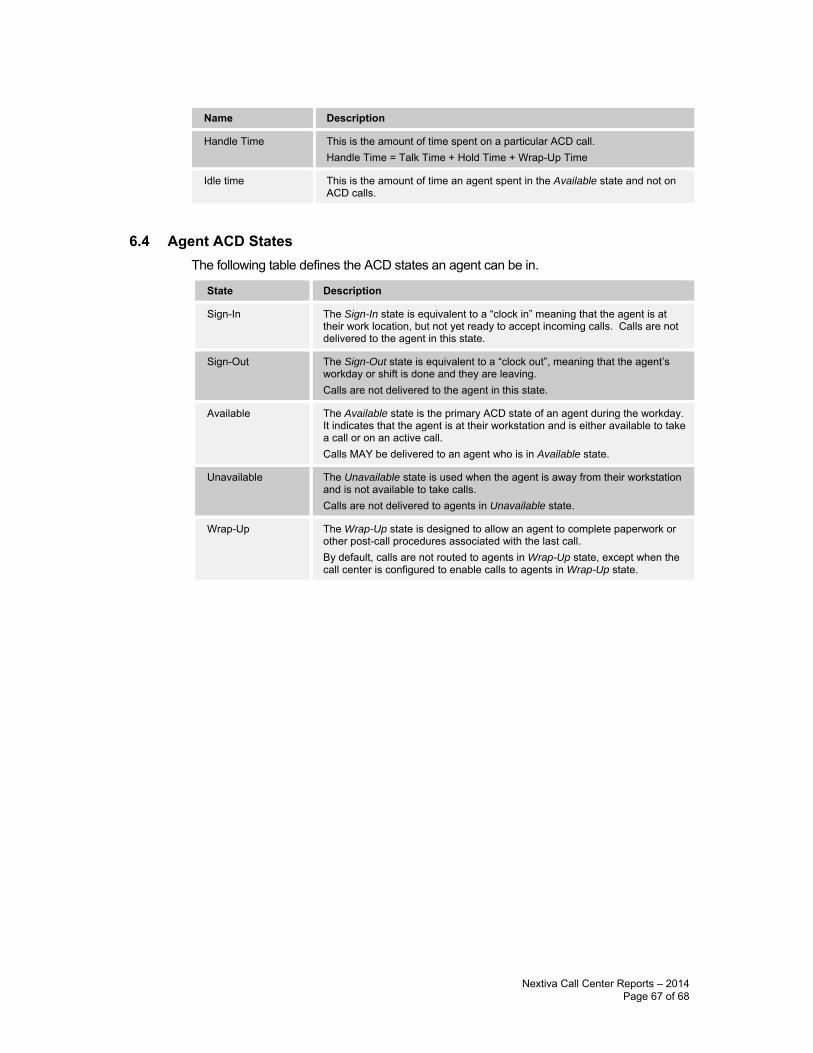
Name Description
Handle Time This is the amount of time spent on a particular ACD call. Handle Time = Talk Time + Hold Time + Wrap-Up Time
Idle time This is the amount of time an agent spent in the Available state and not on ACD calls.
6.4 Agent ACD States The following table defines the ACD states an agent can be in.
State Description
Sign-In The Sign-In state is equivalent to a “clock in” meaning that the agent is at their work location, but not yet ready to accept incoming calls. Calls are not delivered to the agent in this state.
Sign-Out The Sign-Out state is equivalent to a “clock out”, meaning that the agent’s workday or shift is done and they are leaving. Calls are not delivered to the agent in this state.
Available The Available state is the primary ACD state of an agent during the workday. It indicates that the agent is at their workstation and is either available to take a call or on an active call. Calls MAY be delivered to an agent who is in Available state.
Unavailable The Unavailable state is used when the agent is away from their workstation and is not available to take calls. Calls are not delivered to agents in Unavailable state.
Wrap-Up The Wrap-Up state is designed to allow an agent to complete paperwork or other post-call procedures associated with the last call. By default, calls are not routed to agents in Wrap-Up state, except when the call center is configured to enable calls to agents in Wrap-Up state.
Nextiva Call Center Reports – 2014 Page 67 of 68
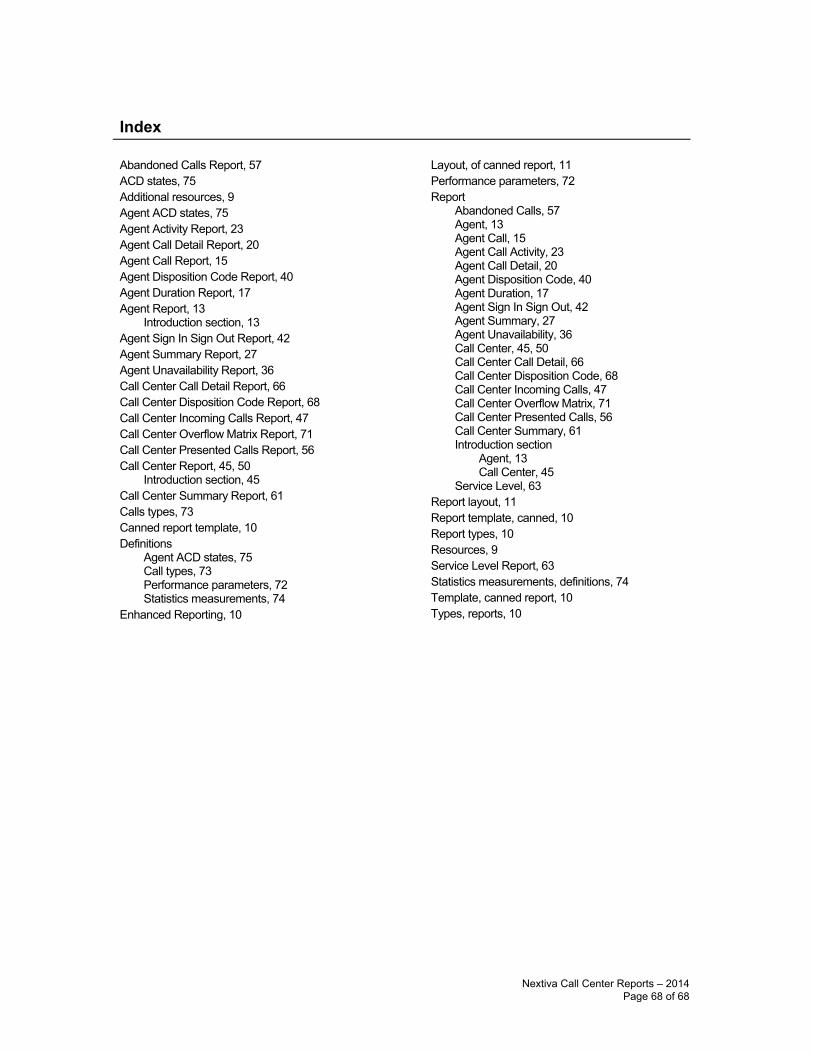
Index
Abandoned Calls Report, 57 ACD states, 75 Additional resources, 9 Agent ACD states, 75 Agent Activity Report, 23 Agent Call Detail Report, 20 Agent Call Report, 15 Agent Disposition Code Report, 40 Agent Duration Report, 17 Agent Report, 13
Introduction section, 13 Agent Sign In Sign Out Report, 42 Agent Summary Report, 27 Agent Unavailability Report, 36 Call Center Call Detail Report, 66 Call Center Disposition Code Report, 68 Call Center Incoming Calls Report, 47 Call Center Overflow Matrix Report, 71 Call Center Presented Calls Report, 56 Call Center Report, 45, 50
Introduction section, 45 Call Center Summary Report, 61 Calls types, 73 Canned report template, 10 Definitions
Agent ACD states, 75 Call types, 73 Performance parameters, 72 Statistics measurements, 74
Enhanced Reporting, 10
Layout, of canned report, 11 Performance parameters, 72 Report
Abandoned Calls, 57 Agent, 13 Agent Call, 15 Agent Call Activity, 23 Agent Call Detail, 20 Agent Disposition Code, 40 Agent Duration, 17 Agent Sign In Sign Out, 42 Agent Summary, 27 Agent Unavailability, 36 Call Center, 45, 50 Call Center Call Detail, 66 Call Center Disposition Code, 68 Call Center Incoming Calls, 47 Call Center Overflow Matrix, 71 Call Center Presented Calls, 56 Call Center Summary, 61 Introduction section
Agent, 13 Call Center, 45
Service Level, 63 Report layout, 11 Report template, canned, 10 Report types, 10 Resources, 9 Service Level Report, 63 Statistics measurements, definitions, 74 Template, canned report, 10 Types, reports, 10
Nextiva Call Center Reports – 2014 Page 68 of 68


