Caltrans Project P359, Trip Generation Rates for Transportation Impact Analyses of Smart Growth Land Use Projects USER GUIDE Prepared by Texas A&M Transportation Institute The Texas A&M University System College Station, TX 77843 April 2017
Transcript
Caltrans Project P359, Trip Generation Rates for Transportation Impact Analyses of Smart Growth Land Use Projects
USER GUIDE
Prepared by Texas A&M Transportation Institute The Texas A&M University System
College Station, TX 77843
April 2017
iii
FUNDING This project was funded by the California Department of Transportation (Caltrans) with Federal Highway Administration (FHWA) State Planning & Research Program (SPR) and State Public Transportation Account (PTA) funds provided by the Caltrans Headquarters Divisions of Transportation Planning, and Research, Innovation, and System Information. ACKNOWLEDGEMENTS There were many individuals who provided technical and administrative support and guidance throughout this project and in the development of project reports and deliverables. Special thanks are extended to the following individuals:
• Mr. Marc Birnbaum and Mr. Robert Ferwerda of the Caltrans Traffic Operations Division for their technical guidance, feedback, and support throughout the duration of the project;
• Mr. Scott Williams, Mr. Hassan Aboukhadijeh, and Ms. Gloria Gwynne of the Caltrans Division of Research for their management and administration of the project’s contract; and
• Members of the project’s Smart Growth Trip Generation (SGTG) Technical Advisory Panel for graciously volunteering their time and sharing their expertise in numerous project webinars and in review and feedback on project methods, analyses, results, and deliverables. The names and organizational affiliation of SGTG panel members are listed on Page 8 of this report.
Finally, special thanks are also extended to the dozens of property owners and managers of apartments and office buildings in California that granted Caltrans permission to conduct studies and collect trip generation data at their buildings and properties. DISCLAIMER The contents of this report reflect the views of the authors, who are responsible for the accuracy of the information present herein. The contents do not necessarily reflect the official views of policies of the State of California or the Federal Highway Administration (FHWA). This report and other project products do not constitute a standard, specification, or regulation.
v
TABLE OF CONTENTS
List of Figures ............................................................................................................................ viii List of Tables ............................................................................................................................. viii
User Guide Contents ................................................................................................................... 1
PART A. ESTIMATING TRIP GENERATION FOR SMART GROWTH DEVELOPMENTS ........................ 3
Site Applicability ......................................................................................................................... 3 Limitations .................................................................................................................................. 4 land Uses ..................................................................................................................................... 4 Development Units ..................................................................................................................... 4 Intersection Density .................................................................................................................... 4 Data Applicability ........................................................................................................................ 5 Trip Generation Equations .......................................................................................................... 5
Apartments – AM Street Peak Hour ....................................................................................... 5 Apartments – PM Street Peak Hour ........................................................................................ 7 Office Buildings (General Multi-Tenant) – AM Street Peak Hour ........................................... 8 Office Buildings (General Multi-Tenant) – PM Street Peak Hour ........................................... 9
Compare for Reasonableness ................................................................................................... 10 Additional Cautions ................................................................................................................... 11
PART B. SPREADSHEET ESTIMATOR TOOL .................................................................................... 12
Identify Site ........................................................................................................................... 15 Project Name .................................................................................................................... 15 Land Use Description ........................................................................................................ 15 Address, City, State ........................................................................................................... 15 Analyst’s Name, Organization, Date ................................................................................. 15 Checked by, Date .............................................................................................................. 16 Analysis Year ..................................................................................................................... 16
Development Size ................................................................................................................. 16 ITE Land Use Code ............................................................................................................. 16 Apartment – Dwelling Units .............................................................................................. 16 Office – Gross Square Feet ................................................................................................ 17
Qualifiers ............................................................................................................................... 17 Adequate Parking? ............................................................................................................ 17 Walkable Surroundings? ................................................................................................... 17 Transit Stops Within ¼-Mile Easily Accessible by Foot? ................................................... 17 Moderate to High Building Compactness and Densities? ................................................ 18 Well Connected and Conveniently Walkable to Adjacent Land Uses? ............................. 18
vi
No Major Special Attractors Within ¼-Mile ...................................................................... 18 Area Within ½-Mile of Site at Least 80 Percent Developed?............................................ 18 At Least Two Interacting Land Uses Within ¼-Mile? ........................................................ 18 Number of Public Intersections Within ½-Mile ................................................................ 19 Total Jobs Within ½-Mile .................................................................................................. 19 Total Population Within ½-Mile ........................................................................................ 20 Minimum Buses or Rail Transit Trains Stopping Near Site ............................................... 21
PART C. TRIP GENERATION DATA COLLECTION FOR SMART GROWTH SITES .............................. 23
Introduction .............................................................................................................................. 23 Applicability ........................................................................................................................... 23 Data Collection Objectives .................................................................................................... 24 Need for Quality Assurance and Control .............................................................................. 25
Step 1 – Define Purpose of Data Collection .............................................................................. 25 Use of Data ............................................................................................................................ 25 Site Selection ......................................................................................................................... 26 Timeframe ............................................................................................................................. 26
Step 2 – Establish Desired Site Characteristics ......................................................................... 27 Characteristics of Smart Growth Sites .................................................................................. 28 Site Selection Criteria ............................................................................................................ 29
Land Use ............................................................................................................................ 29 Survey Site Development Size .......................................................................................... 29 Smart Growth Area ........................................................................................................... 29 On-Site Parking ................................................................................................................. 30 Site and Area Maturity ...................................................................................................... 30 Transit Proximity ............................................................................................................... 30 Bicycle Facility Proximity ................................................................................................... 30 Normal Conditions ............................................................................................................ 30 Atypical Conditions to be Avoided .................................................................................... 31 Efficiency of Survey ........................................................................................................... 31 Field Verification of Survey Suitability .............................................................................. 33
Step 3. Screen Sites ................................................................................................................... 33 Step 4. Obtain Permissions ....................................................................................................... 36 Step 5. Data Collection Forms................................................................................................... 36 Step 6. Collect Site Data ............................................................................................................ 41 Step 7. Collect Travel Data ........................................................................................................ 45
7A – Establish the Specific Purpose of Data Collection ........................................................ 45 7B – Identify Interview Intercept Locations at Study Site(s) ................................................ 45 7C – Identify Count Locations at Study Sites ........................................................................ 46 7D – Determine Staffing Requirements ................................................................................ 47 7E – Develop Survey Instrument and Other Data Collection Forms .................................... 47 7F – Recruit and Train Field Personnel ................................................................................. 50
vii
7G – Conduct Field Data Collection ...................................................................................... 50 Inbound and Outbound Door and Driveway Counts ........................................................ 50 Interviews .......................................................................................................................... 51 Multimodal Cordon Counts .............................................................................................. 52 Use of Electronic Recording Devices ................................................................................. 53
Step 7H – Supervise in Field .................................................................................................. 53 Step 7I – Check Data after Each Period................................................................................. 53
PART D. SURVEY DATA REDUCTION .............................................................................................. 55
Step 1 – Summarize Cordon Counts ......................................................................................... 55 Step 2 – Process Interview Data ............................................................................................... 55
Interviews and Door Counts ................................................................................................. 55 Expansion Factors ................................................................................................................. 56
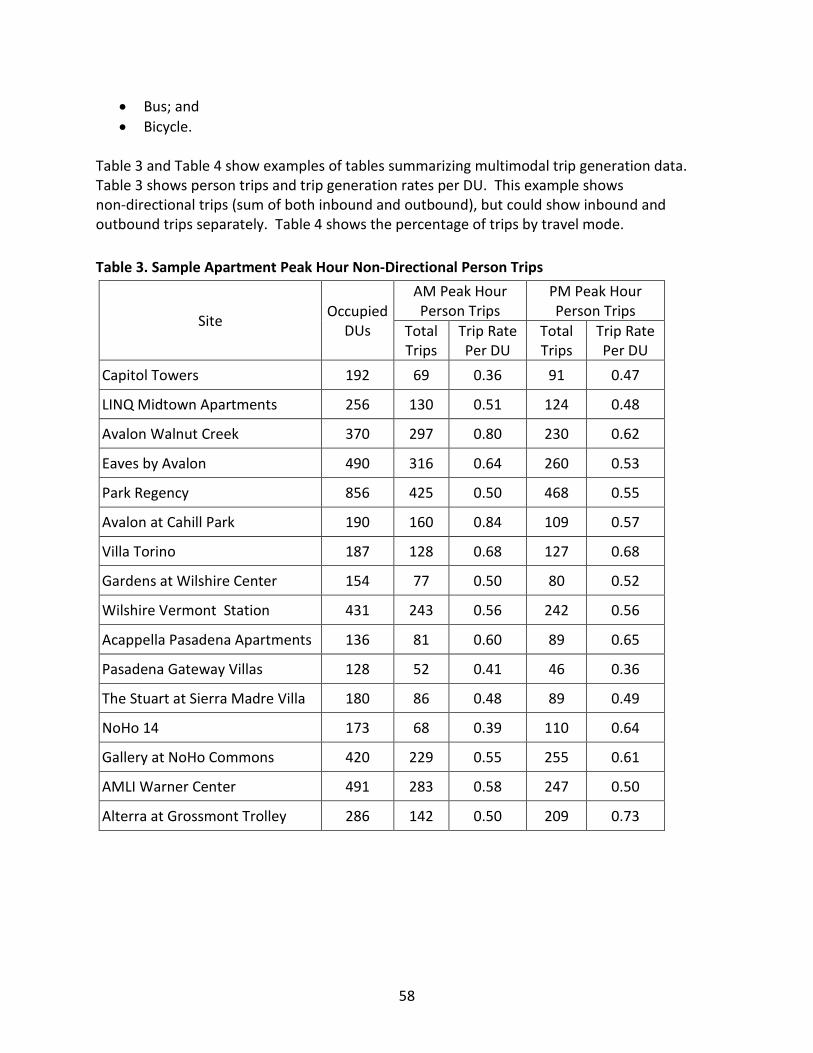
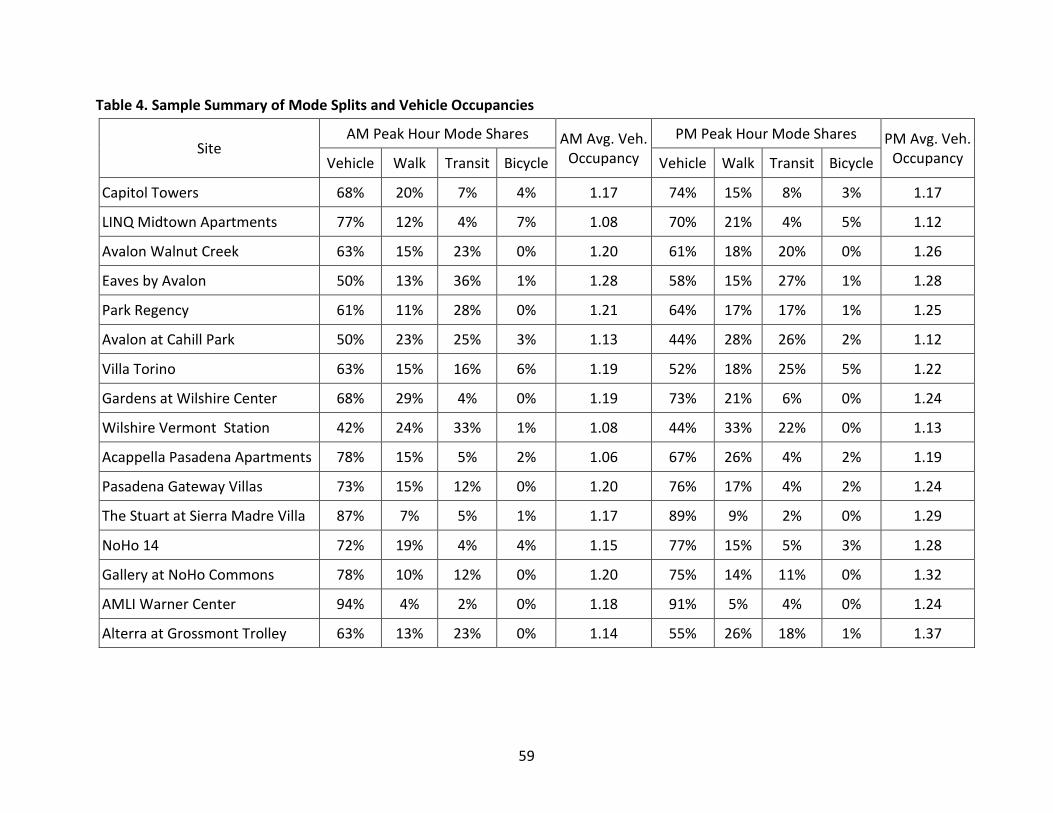
Step 3 – Determine Trip Generation and Mode Splits ............................................................. 57 Exception – Survey Site with Shared Parking with Other On-Site Land Uses ........................... 60
viii
LIST OF FIGURES Figure 1. Sample Half-Mile Circle of Intersections ......................................................................... 6 Figure 2. Apartment AM Street Peak Hour Comparison of Estimate vs. Count for SGTG
Database ............................................................................................................................. 7 Figure 3. Apartment PM Street Peak Hour Comparison of Estimate vs. Count for SGTG
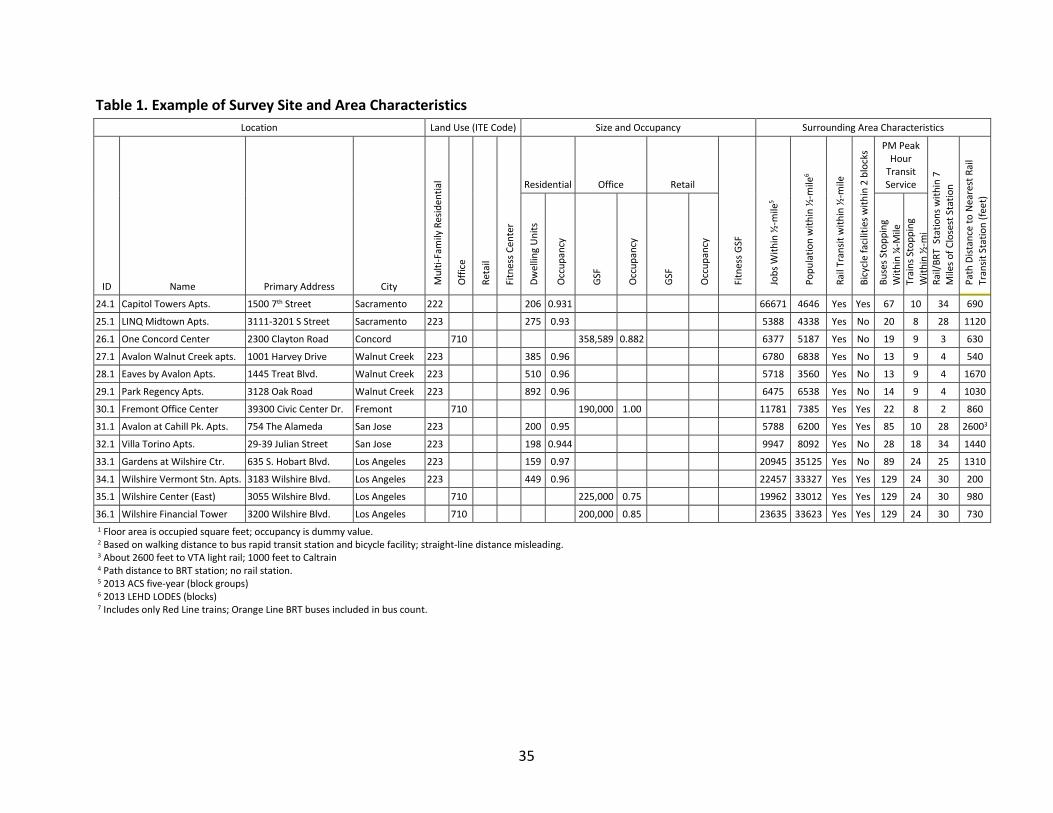
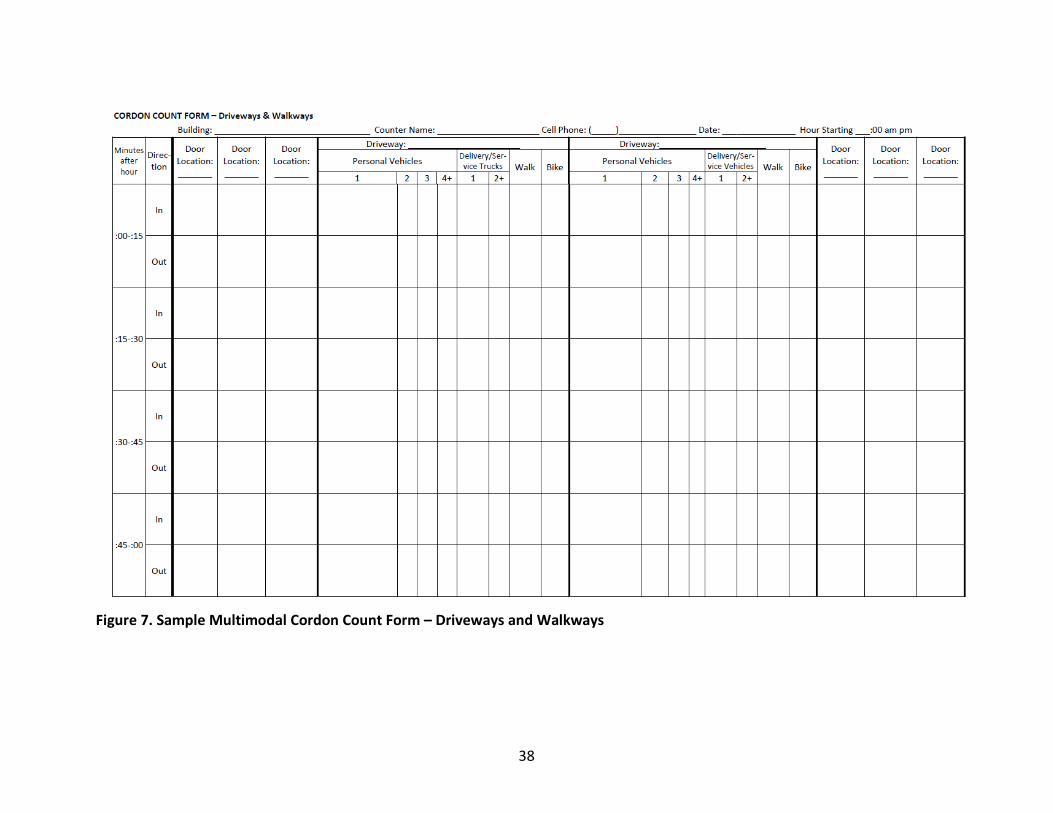
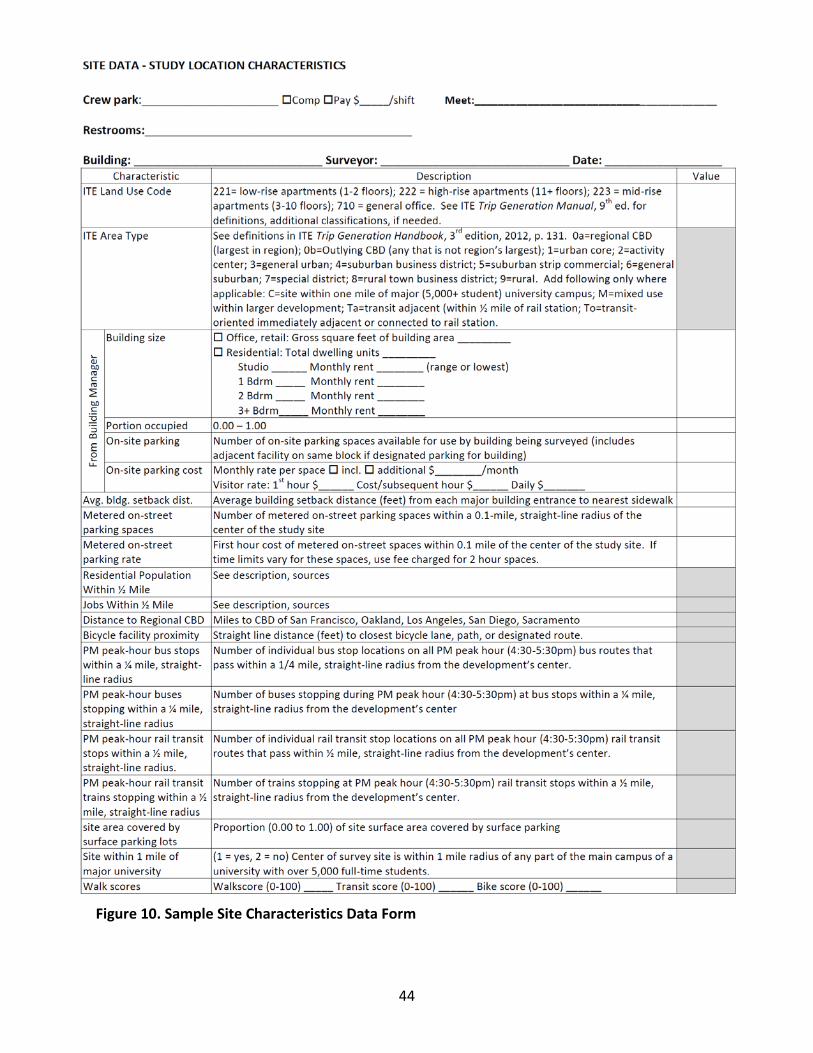
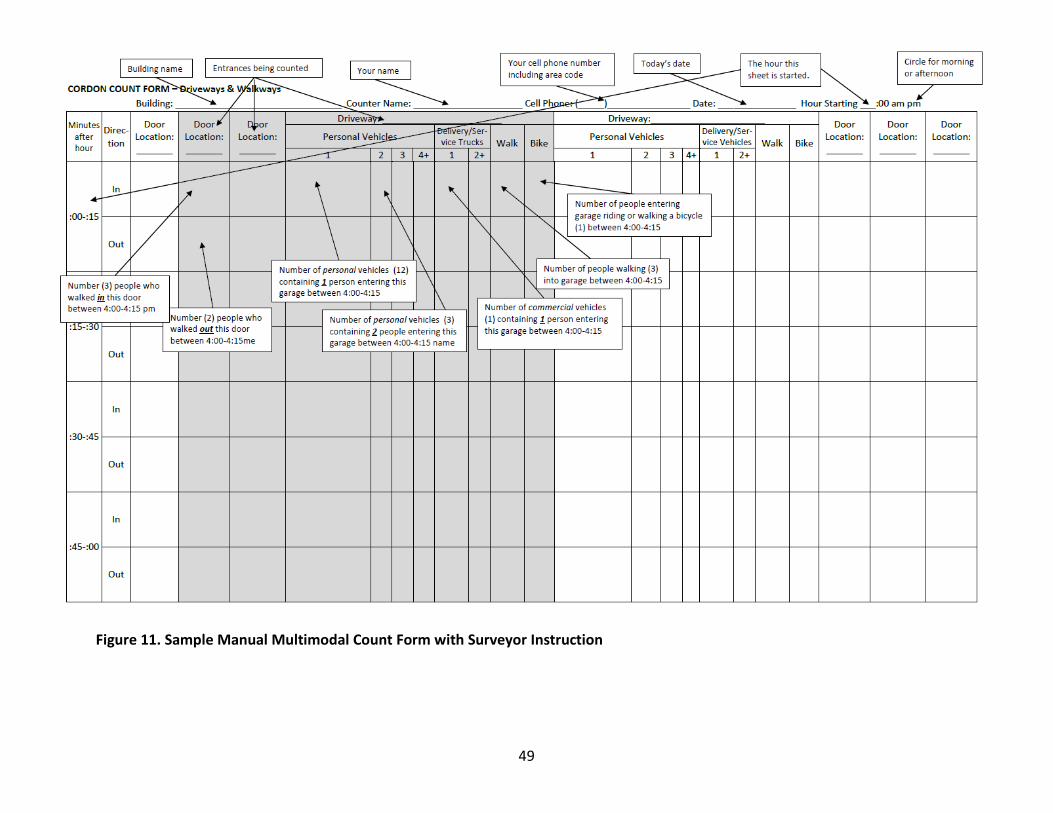
Database ............................................................................................................................. 8 Figure 4 . Office AM Street Peak Hour Comparison of Estimate vs. Count for SGTG Database ..... 9 Figure 5. Office PM Street Peak Hour Comparison of Estimate vs. Count for SGTG Database .... 10 Figure 6. Sample Estimator Spreadsheet Input and Output Appearance .................................... 14 Figure 7. Sample Multimodal Cordon Count Form – Driveways and Walkways .......................... 38 Figure 8. Sample Cordon Count Form – Walkways Only .............................................................. 39 Figure 9. Sample Manual Interview Form ..................................................................................... 40 Figure 10. Sample Site Characteristics Data Form ........................................................................ 44 Figure 11. Sample Manual Multimodal Count Form with Surveyor Instruction .......................... 49 LIST OF TABLES Table 1. Example of Survey Site and Area Characteristics ............................................................ 35 Table 2. Sample of Survey Intercept Percentages ........................................................................ 43 Table 3. Sample Apartment Peak Hour Non-Directional Person Trips ......................................... 58 Table 4. Sample Summary of Mode Splits and Vehicle Occupancies ........................................... 59
1
PURPOSE The purpose of this user guide is to present recommended procedures for:
A. Estimating vehicle trip generation for single land use sites within smart growth areas; B. Collecting and processing site trip generation data for land uses within smart growth
areas; and C. Processing the site trip generation survey data for use in expanding the trip generation
database and/or developing enhanced estimation tools. These procedures are presented as Parts A, B, and C of this guide. USER GUIDE CONTENTS This user guide presents these procedures to obtain and process new data for, and prepare estimates of, vehicle trip generation for smart growth sites. Subsequent sections address the following. Part A. Trip generation estimation for smart growth developments
1. Site applicability 2. Limitations 3. Land uses 4. Development units 5. Intersection density 6. Data applicability 7. Trip generation equations 8. Compare for reasonableness 9. Additional cautions
1. Define purpose of data collection 2. Establish desired site characteristics 3. Screen candidate sites 4. Obtain permissions 5. Data collection procedures and forms
2
6. Collect site data 7. Collect travel data
Part D. Survey data reduction
1. Summarize cordon counts 2. Process interview data 3. Determine trip generation and mode splits
3
PART A. ESTIMATING TRIP GENERATION FOR SMART GROWTH DEVELOPMENTS This section of the user guide describes how to estimate site trip generation for smart growth development sites as defined for the California Department of Transportation (Caltrans) Smart Growth Trip Generation (SGTG) Study. A smart growth development site is one that is located within an area that has a mix of land uses, many of which conveniently interact with each other. The site itself may be a single or multiple land use development. Smart growth sites and areas are typically served by pedestrian and bicycle facilities and frequent and reliable public transportation. They usually also have higher development densities and are more compact than traditional suburban development. The trip generation estimate may be made using a spreadsheet or by manual means. The data currently available from the SGTG will support estimates for:
• Average weekdays; • AM and PM street peak hours (7-9 a.m., 4-6 p.m.); and • School season (school in regular session so commute patterns are normal).
SITE APPLICABILITY Sites for which the SGTG database was developed have definite characteristics. Developments for which trip generation estimates are sought should generally possess the following characteristics.
• Area characteristics o Area within ½-mile of an almost fully-developed area (at least 80 percent) o Mix of at least two complementary, interacting land uses within about ¼-mile of the
site (e.g., residential, office, retail, restaurant, etc.) o Moderate-to-high densities o Both significant population and employment o Well connected and conveniently walkable o No special major trip attractor within ½-mile of the site (e.g., major university,
stadium/arena, airport, military base, theme park, etc.) o Substantial peak hour transit service 10 or more buses stopping within ¼-mile of the site, or Five or more rail transit trains stopping within ½-mile of the site
• Site characteristics o Mature development (“fully” occupied – at least 80 percent - at least two years) o Adequate parking to meet demand, either on-site or within convenient walking
distance o Convenient transit stops accessible (by foot) to/from development’s entrances o Multiple complementary land uses conveniently walkable from the site o Walkable environment
4
LIMITATIONS The product of this estimation method is an estimate of vehicle trips that transport people to or from a free-standing apartment or office building in a smart growth area. This method has taken into account the person trips to or from the site made as pedestrians, bicyclists, or on transit. Because the study site is, by definition, a smart growth site, many of the non-vehicle trips are made to or from nearby interacting complementary uses. If the development to be analyzed also includes on-site interacting uses such as retail, restaurant, or hotel, the internal capture estimation technique for mixed-use development presented in the Institute of Transportation Engineers (ITE) Trip Generation Handbook (TGH) is an appropriate tool for estimating vehicle trips generated by those uses.1 However, if an internal capture method such as that described in the TGH is used, the method presented here cannot be used for apartment and office components because it will double-count vehicle trip reductions due to non-drive modes. The vehicle trip estimates from this method should be considered to represent post-internal capture reduction and should not be further reduced for the on-site apartment or office use. LAND USES At present, the SGTG smart growth trip generation database contains sufficient data to estimate site trip generation for (1) apartment and (2) general multi-tenant office buildings. DEVELOPMENT UNITS The development units for use in estimating trip generation for these land uses are:
• Apartment developments – occupied dwelling units (DUs) (method supports 80-800 DUs); and
• Office buildings – occupied gross square feet of floor area (GSF) (method supports (100-500 GSF).
INTERSECTION DENSITY This method uses intersection density as an input variable. The density ranges supported by the model are:
• Apartments – 50-150 intersections within ½-mile; and • Office buildings – 40-250 intersections within ½-mile.
Normal practice is to assume 100 percent occupancy for proposed developments when estimating trip generation. 1 Trip Generation Handbook, Institute of Transportation Engineers, Washington, D.C., current edition.
5
DATA APPLICABILITY If a proposed development generally satisfied the previous characteristics, then the SGTG trip generation equations can be considered applicable. However, if the proposed development in question will diverge in character from what is described previously, the analyst has the following three other options.
• Seek out existing local trip generation data for sites that have characteristics similar to that which has been proposed. If this route is taken, it is recommended that the analyst discuss applicability with the agency reviewer who will have to approve the trip generation estimate. It is best to reach an agreement on the basis for trip generation before the analysis is performed in case applicability is not accepted.
• Identify similar sites (preferably at least three) where new trip generation data can be collected. As with the previous option, it is recommended that the analyst discuss applicability with the agency reviewer who will have to approve the trip generation estimate. If new data are to be collected, see parts B and C of this guide for recommended procedures.
• Use the ITE trip generation data. For a presumed smart growth site, this will result in foregoing any estimates of non-vehicle trips associated with significant transit, bicycle, or walk trips as well as any other differences that might be associated with smart growth development and reduce vehicular trip generation.
TRIP GENERATION EQUATIONS The applicable smart growth trip generation equations for apartment and office developments are described individually in the next four sub-sections. APARTMENTS – AM STREET PEAK HOUR The SGTG equation for this estimate is: Tv = [(0.24 x occupied DUs) + 4610/intersection density – 38] x directional split. Where, Tv = Vehicle trips;
Occupied DUs = 100 percent of the proposed DUs in the development; Intersection density = number of street intersections within ½-mile of the site entrance; Directional split = percentage of trips that are inbound or outbound; and Inbound vehicle trips are estimated to be 20 percent and outbound to be 80 percent of
total based on SGTG counts. The proposed DUs are determined from the development proposal or (re)zoning application.
6
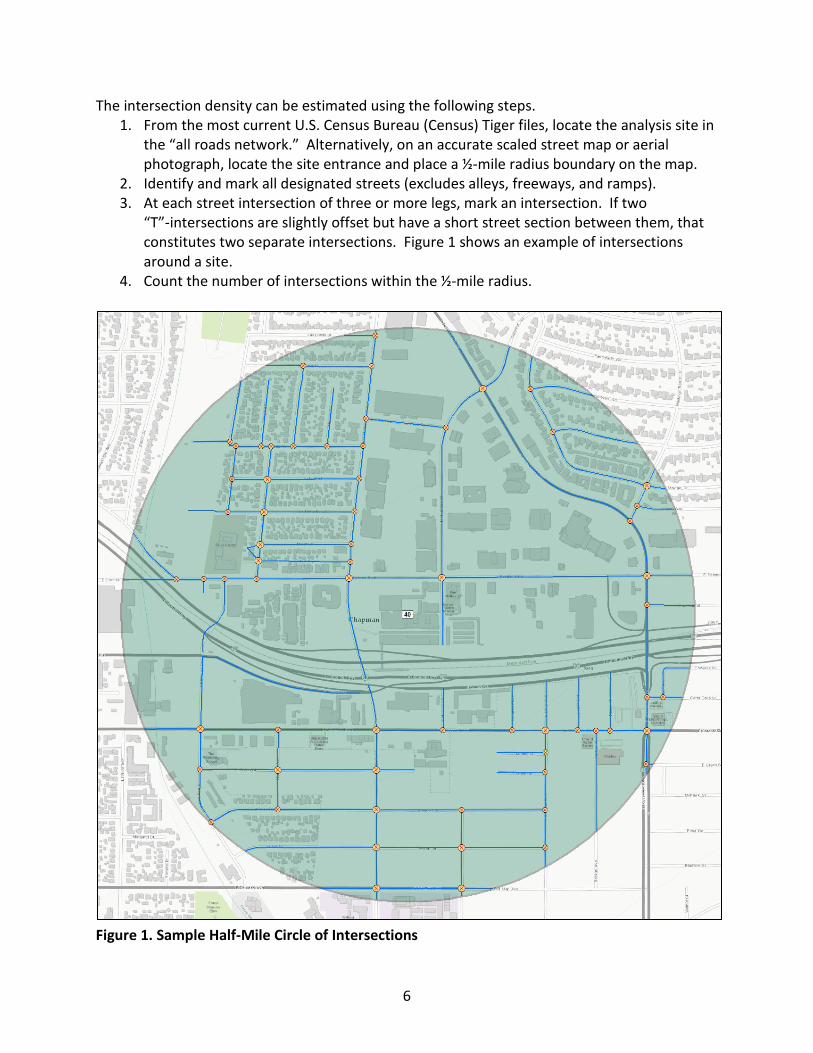
The intersection density can be estimated using the following steps. 1. From the most current U.S. Census Bureau (Census) Tiger files, locate the analysis site in
the “all roads network.” Alternatively, on an accurate scaled street map or aerial photograph, locate the site entrance and place a ½-mile radius boundary on the map.
2. Identify and mark all designated streets (excludes alleys, freeways, and ramps). 3. At each street intersection of three or more legs, mark an intersection. If two
“T”-intersections are slightly offset but have a short street section between them, that constitutes two separate intersections. Figure 1 shows an example of intersections around a site.
4. Count the number of intersections within the ½-mile radius.
Figure 1. Sample Half-Mile Circle of Intersections
7
Figure 2 shows the scatter diagram of comparisons of counts versus estimates and the adjusted R2 for the SGTG data.
Figure 2. Apartment AM Street Peak Hour Comparison of Estimate vs. Count for SGTG Database
APARTMENTS – PM STREET PEAK HOUR The SGTG equation for this estimate is: Tv = [(0.24 x occupied DUs) + 3488/intersection density – 31] x directional split. Where,
Tv = Vehicle trips; Occupied DUs = 100 percent of the proposed DUs in the development; Intersection density = number of street intersections within ½-mile of the site entrance; Directional split = percentage of trips that are inbound or outbound; and Inbound vehicle trips are estimated to be 65 percent and outbound trips to be 35
percent of the total trips based on SGTG counts. The occupied DUs and intersection density are determined in the same manner as for the AM equation. Figure 3 shows the scatter diagram for the PM comparison of counts and estimates.
Adjusted R2 = 0.78
8
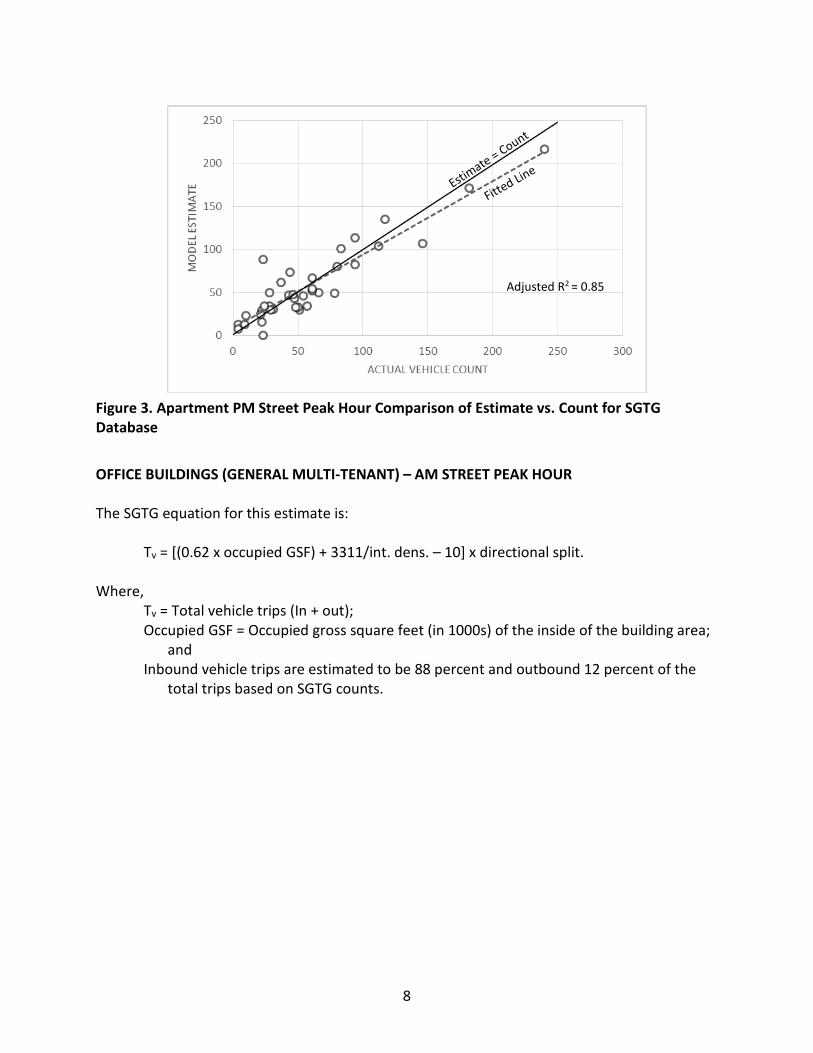
Figure 3. Apartment PM Street Peak Hour Comparison of Estimate vs. Count for SGTG Database
OFFICE BUILDINGS (GENERAL MULTI-TENANT) – AM STREET PEAK HOUR The SGTG equation for this estimate is:
Tv = [(0.62 x occupied GSF) + 3311/int. dens. – 10] x directional split. Where,
Tv = Total vehicle trips (In + out); Occupied GSF = Occupied gross square feet (in 1000s) of the inside of the building area;
and Inbound vehicle trips are estimated to be 88 percent and outbound 12 percent of the
total trips based on SGTG counts.
Adjusted R2 = 0.85
9
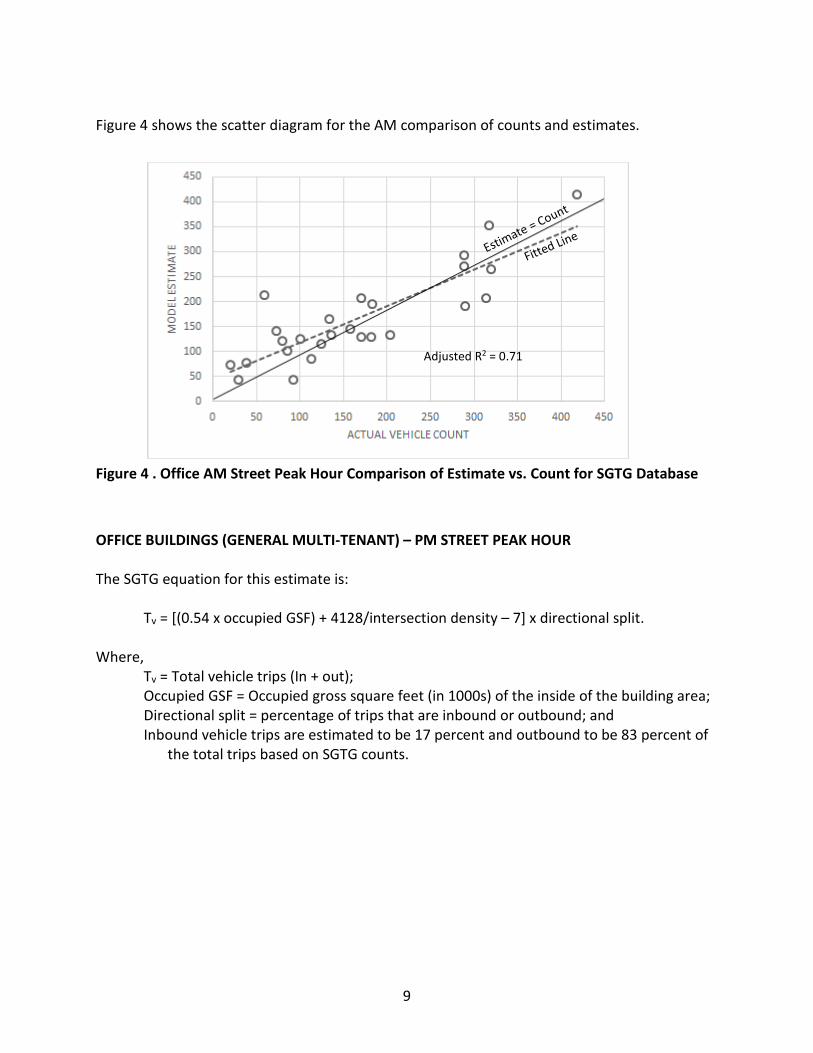
Figure 4 shows the scatter diagram for the AM comparison of counts and estimates.
Figure 4 . Office AM Street Peak Hour Comparison of Estimate vs. Count for SGTG Database
OFFICE BUILDINGS (GENERAL MULTI-TENANT) – PM STREET PEAK HOUR The SGTG equation for this estimate is: Tv = [(0.54 x occupied GSF) + 4128/intersection density – 7] x directional split. Where, Tv = Total vehicle trips (In + out); Occupied GSF = Occupied gross square feet (in 1000s) of the inside of the building area;
Directional split = percentage of trips that are inbound or outbound; and Inbound vehicle trips are estimated to be 17 percent and outbound to be 83 percent of
the total trips based on SGTG counts.
Adjusted R2 = 0.71
10
Figure 5 shows the scatter diagram for the PM comparison of counts and estimates.
Figure 5. Office PM Street Peak Hour Comparison of Estimate vs. Count for SGTG Database
COMPARE FOR REASONABLENESS It is recommended that estimates using SGTG equations always be compared to estimates using ITE suburban data to ensure that they seem reasonable. Based on SGTG findings, most smart growth sites generated at least 25 percent fewer vehicle trips than were derived for the same sites using ITE suburban data. In fact, many sites were found to generate as much as 50 percent less. The biggest reduction found among the apartment buildings surveyed was 69 percent in the AM peak hour and 73 percent in the PM peak hour. However, out of 29 SGTG apartment survey sites, only 4 had more than 50 percent non-vehicle trips in the AM peak and 5 during the PM peak. Similarly, for the SGTG office building surveys, the largest non-vehicle trip percentage was 20 percent in the AM peak hour and 19 percent in the PM peak hour. However, that building was in downtown San Francisco about two blocks from a BART station and across the street from the temporary transbay bus terminal (site with extremely high transit accessibility and highly walkable). Of the 22 SGTG office buildings surveyed, only 3 had over 50 percent non-vehicle trips in the AM peak hour and 4 in the PM peak hour. Hence, any apartment or office building found to have a peak hour non-vehicle trip percentage over 50 percent should be checked very carefully.
Adjusted R2 = 0.63
11
ADDITIONAL CAUTIONS Analysts should also note the following cautions.
• These smart growth estimates should be used only for proposed developments on sites that are similar to those described under the Site Applicability section near the beginning of Part A of this user guide.
• The equations given are only applicable for: o Average weekday estimates; and o AM and PM street peak hours that occur between 7-9 a.m. and 4-6 p.m. No
factoring should be used in an attempt to adapt them to other periods.
12
PART B. SPREADSHEET ESTIMATOR TOOL The spreadsheet estimator tool developed under the SGTG project was designed to automate the trip generation estimation process described in the previous section. It is a Microsoft® Excel application. At the time this report was written, the spreadsheet tool estimates site trip generation for only apartment and general office buildings in well developed areas outside regional central business districts. Nevertheless, it can expedite the estimation process and potentially eliminate computation errors. PURPOSE The purpose of this tool is to enable users to quickly and simply estimate site trip generation for smart growth developments. The tool estimates inbound and outbound vehicle trip generation for typical weekdays when schools are in session, and for AM and PM street peak hours (peak one hour between 7-9 a.m. and 4-6 p.m., respectively). The tool helps the user identify and document the analysis site and then qualify the site as being eligible as a smart growth site and appropriate for this method of trip generation estimation. The tool requests several site and vicinity characteristics to determine eligibility. In addition, limited quantitative site data are required for the trip generation computation. The tool provides the user with a simple one page report covering site information, eligibility criteria, input data, and vehicle trip generation estimates. LIMITATIONS The product of the spreadsheet estimator tool is an estimate of vehicle trips that transport people to or from a free-standing apartment or office building in a smart growth area. The “tool” has taken into account the person trips to or from the site made as pedestrians, bicyclists, or on transit. Because the study site is, by definition, a smart growth site, many of the non-vehicle trips are made to or from nearby interacting complementary uses. If the development to be analyzed also includes on-site interacting uses such as retail, restaurant, or hotel, the internal capture estimation technique for mixed-use development presented in the ITE TGH is an appropriate tool for estimating vehicle trips generated by those uses.2 However, if an internal capture method such as that described in the TGH is used, this spreadsheet cannot be used for apartment and office components because it will double-count vehicle trip reductions due to non-drive modes. The vehicle trip estimates from this spreadsheet “tool” should be considered to represent post-internal capture reduction and should not be further reduced for the on-site apartment or office use.
2 Trip Generation Handbook, Institute of Transportation Engineers, Washington, D.C., current edition.
13
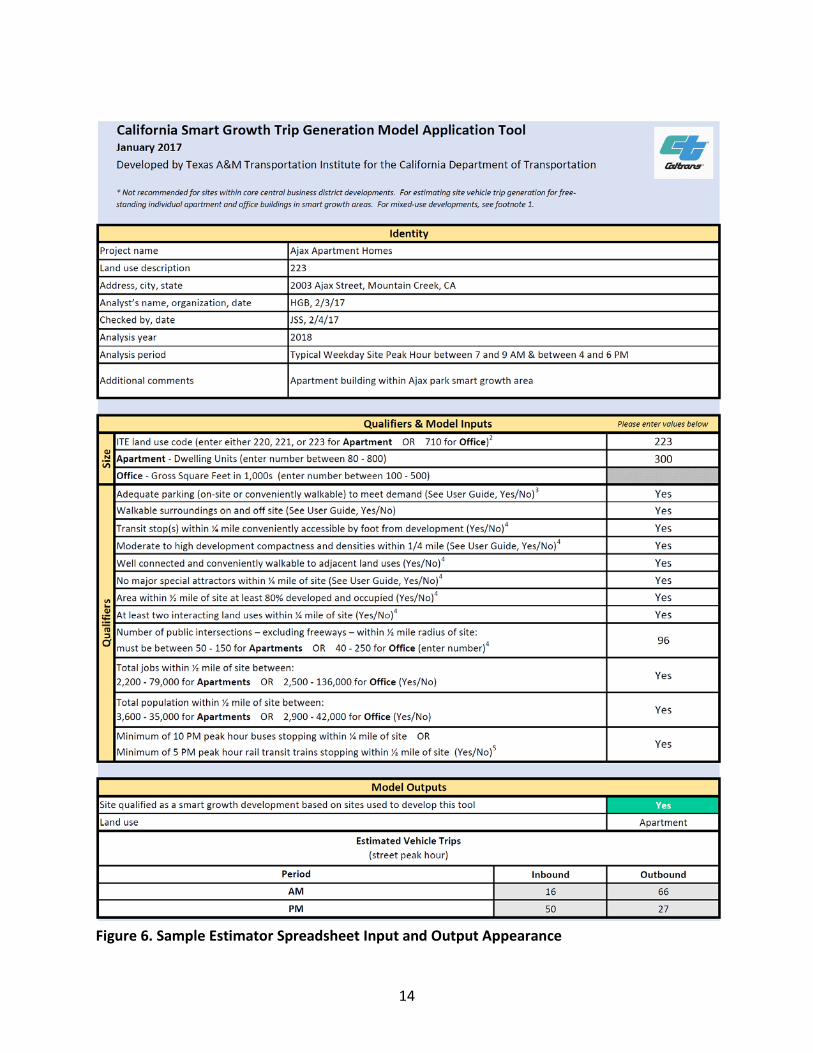
SOFTWARE NEEDED No special software is needed to use this tool. It requires only Microsoft® Excel. Only one worksheet is required per analysis site. Figure 6 shows the complete input/output/report worksheet. Inputs start at the top. The eligibility test result (i.e., does the site qualify as a smart growth site?) is near the bottom. The estimated vehicle trip generation is at the bottom.
14
Figure 6. Sample Estimator Spreadsheet Input and Output Appearance
15
The spreadsheet is set up to accept sites with “Yes” qualifiers. It will also reject numerical inputs that are outside the acceptable ranges. Hence, if a site is too large, too small, or in an area that does not have the requisite characteristics, the eligibility determination will be “No.” Where distances are mentioned, all are in straight line distances (i.e., straight line radius, not distance by actual path taken) unless otherwise specified. INPUTS Each blank line or row of the worksheet requires an input unless blocked out (dark shading). IDENTIFY SITE The top section of the worksheet is for site and analyst identity information. Identification items are shown, but all cells in this section are changeable so the user can insert information relevant to the analysis site and the analysis itself. Descriptions of identity fields below are for items listed. Project Name Enter the name of the site or building being analyzed. If confidential, just enter “confidential.” Land Use Description Describe the land use as clearly as possible. Include not only the general land use type, but also additional detail that might help reviewers better understand the function of the land use. For example, an apartment building might be fully described as “six-story apartment development of four buildings with a center courtyard and a common below-ground garage.” Address, City, State Enter the complete address. For a confidential site, enter city and state; if permissible, also enter the part of the city. If the city cannot be identified, enter the metropolitan area, county, or region. Analyst’s Name, Organization, Date Enter the first and last names of the person preparing the spreadsheet, that person’s employer, and the date the work is being performed. If the spreadsheet is being revised, enter the date of the current revision.
16
Checked by, Date The name of the person checking the spreadsheet for accuracy and the date of the latest check should be entered here. Analysis Year The analysis year is the year for which conditions are being analyzed, not the year during which the analysis is performed. The analysis year may be specified by the developer or review agency and may be (1) the year the development will be completed and occupied, (2) another future year during which a development phase will be occupied, (3) a future planning year the review agency uses for transportation analyses, or (4) another year of interest. DEVELOPMENT SIZE This next group of inputs is divided into two sub-groups.
• Site – site characteristics that determine eligibility to be considered a smart growth development or be used in the trip generation estimation equation.
• Qualifiers – characteristics of the area surrounding the site; these are also employed to help to determine eligibility to be considered a smart growth development or be used in the trip generation estimation equation
All distances described in this section are straight-line radii from the main building entrance. ITE Land Use Code ITE has a standard set of land use codes it uses for trip generation. At present, the SGTG database covers only low- and mid-rise apartment and multiple-tenant general office buildings. The applicable ITE land use codes for these are:
• 220 – apartments not specifically identified as low-, mid- or high-rise; • 221 – low-rise apartments (2 stories or less); • 223 – mid-rise apartments (3-9 stories); and • 710 – multi-tenant general purpose office building (e.g., excludes medical office,
corporate buildings). Apartment – Dwelling Units If the development to be analyzed is apartments, enter the number of total dwelling units (DUs) for the development being analyzed. The estimation method covers apartment developments between 80 and 800 DUs. Estimates for developments outside this range may not be accurate enough to use. If the development is an office building, leave this line blank and go to the next line below.
17
Office – Gross Square Feet If the development to be analyzed is offices, enter the number of total gross square feet (GSF) of floor space in 1,000s in the development being analyzed. GSF is all space inside the outside faces of exterior walls of an office building, including architectural setbacks, basements, mezzanines, penthouses, corridors, lobbies, stores, and offices and any other areas having at least 6½-feet minimum headroom.3 Unenclosed areas are excluded from GSF as are areas used within the building for parking. The estimation method covers office buildings between 100,000 and 500,000 GSF. Estimates for developments outside this range may not be accurate enough to use. If the development is an apartment building, leave this line blank and go to the next line above. QUALIFIERS Adequate Parking? Enter “Yes” if there is expected to be adequate available parking either on-site or off-site and nearby. That means that the expected (daily) peak parking demand will be satisfied by available parking supply. If trying to determine this in the field, look for a significant number of unoccupied spaces during the hours of peak parking demand (typically weekdays 10pm-5am for apartments, 10-11am and 1-2pm for office buildings), For proposed developments, on-site adequacy can be based on ITE parking generation rates (office peak parking demand can be adjusted for peak hour transit mode split). If parking is or will be inadequate in the analysis year, enter “No”. That will mean that the building will not be eligible to be analyzed using this method. Walkable Surroundings? Enter “Yes” if building entrances are conveniently accessible (close and easily walked) from area walkways and that other buildings housing complementary land uses exist nearby and are also easily reached and accessed by foot by way of sidewalks or other paved walkways. If not, enter “No;” that will mean that the building will not be eligible to be analyzed using this method. Transit Stops Within ¼-Mile Easily Accessible by Foot? Enter “Yes” if there is at least one bus and/or rail transit stop within ¼-mile of the building entrances that are conveniently and easily accessed by foot along paved walkways. Enter “No” if there are no transit stops within ¼-mile or if they are not easily and conveniently walked to
3 Trip Generation Handbook, 3rd Edition, a proposed recommended practice, Institute of Transportation Engineers,
Washington, D.C., August 2014, p. 134.
18
and from the analysis site entrances; that will mean that the building will not be eligible to be analyzed using this method. Current transit stop locations can usually be determined from the transit operator’s website or field observations. Proposed transit stops will normally require a conversation with the transit operator’s service planning staff. Moderate to High Building Compactness and Densities? This is a qualitative question. Enter “Yes” if buildings within and adjacent to the site being analyzed are close together (compact) and in aggregate creates at least moderate density for the area. To do so in most areas within California, most buildings would need to have multiple stories (including some of 3-4 stories or more) and negligible to moderate spacing between them. Enter “No” if this is not the case; that will mean that the building will not be eligible to be analyzed using this method. Well Connected and Conveniently Walkable to Adjacent Land Uses? Enter “Yes” if building entrances are fairly close together and/or close to street sidewalks and conveniently accessible (close and easily walked) from area walkways, that other buildings, housing, and complementary interactive land uses exist and are also easily reached and accessed by foot by way of sidewalks or other paved walkways. If not, enter “No;” that will mean that the building will not be eligible to be analyzed using this method. No Major Special Attractors Within ¼-Mile Enter “Yes” if there are NO special major attractors (i.e., trip generators) within ¼-mile of the site building entrance. A special major attractor generates a lot of trips and could affect peak hour trip generation of the development being analyzed. Examples of such a generator are major universities (over 5,000 students), stadiums, arenas, convention centers, military bases, theme parks, airports, transportation terminals, regional shopping centers, and other major centers of activity. Enter “No” if any such major attractors exist within ¼-mile; that will mean that the building will not be eligible to be analyzed using this method. Area Within ½-Mile of Site at Least 80 Percent Developed? Enter “Yes” if the area within ½-mile of the site’s building entrance has at least 80 percent of its land parcels developed. Vacant buildings do not count as developed. Large parcels that have or are planned or expected to contain multiple future building sites should not be considered developed. If the development percentage is less than 80 percent, enter “No;” that will mean that the building will not be eligible to be analyzed using this method. At Least Two Interacting Land Uses Within ¼-Mile? Enter “Yes” if there are at least two different complementary and interactive land uses within ¼-mile of the analysis development’s entrance. These land uses must complement and interact
19
with the development being analyzed during weekday street peak hours. Examples of land uses complementing apartments include but are not limited to retail, restaurants, office buildings, and entertainment. Examples of office buildings include retail, restaurant, residential, and hotel. Enter “No” if there are fewer than two interacting land uses within ¼-mile; that will mean that the building will not be eligible to be analyzed using this method. Number of Public Intersections Within ½-Mile Enter the number of public street intersections within ½-mile radius of the site. Count each intersection of two or more publicly accessible streets (but exclude alleys). Do not include intersections with freeways, frontage roads, or ramps. Where one leg of an intersection is offset from another leg on the opposite side of an intersecting street, count that as two intersections, as shown in Figure 1 of Part A. This can be accomplished using Geographic Information systems (GIS) or manually from maps or aerial photographs of suitable scale. See Part A for additional information about estimating this number. The estimation tool is valid for this number being between 50-150 intersections for apartment buildings and 40-250 for office buildings. The spreadsheet will not accept out-of-range numbers of intersections since the building will not be eligible to be analyzed using this method. Total Jobs Within ½-Mile Enter “Yes” if there are, or will be in the analysis year, between 2,200-79,000 total jobs within ½-mile radius for apartment buildings being analyzed or 2,500-42,000 total jobs if analyzing office buildings (the ranges for sites from which the estimation equations were drawn). This information may be available from local GIS databases, census data, or another source. Enter “No” if the estimate of jobs for the analysis year falls outside the above ranges. This information can be obtained through the following options: A) GIS Analysis Option The employment and population measures used to develop the model were calculated from raw population data, which are available from the US Census Factfinder and TIGER Line/Shapefile websites (http://factfinder2.census.gov and https://www.census.gov/geo/maps-data/data/tiger-line.html), and raw employment data, which are available from the US Census Longitudinal Household-Employment Dynamics website (http://onthemap.ces.census.gov/). Most Metropolitan Planning Organizations (MPO) already have population and employment data converted into GIS shapefiles at the census block group level, so they are a good source of raw data. The following steps were done in GIS to calculate the population (or employment) within 0.5 miles of the center of each study site:
1) Create a point at the center of the site. 2) Create a 0.5-mile buffer around the site center point (this is a circle with a radius of 0.5
3) Calculate the area of all census block groups within several miles of the site (this was done for the entire state).
4) Use the ArcGIS “Intersect” tool to intersect the census block group layer with 0.5-mile buffer layer. This “cuts” any census block groups that straddle the buffer boundary into new shapes (these newly cut shapes are saved as a new shapefile that also contains the other existing census block groups that were not “cut”).
5) Re-calculate the area of all of the shapes in the new shapefile. Divide the new area by the old area to identify proportion of each census block group that is inside (and outside) the buffer boundary.
6) Multiply the total population (employment) within each census block group by the proportion of the census block group that is within the buffer boundary (e.g., if one-quarter of a census block group with 100 residents is within the buffer boundary, then 25 people are assumed to live within the buffer boundary and 75 people live outside the buffer boundary). Note that this assumes an even spatial distribution of the population (employment) within a census block group.
7) Sum the recalculated population (employment) of all census block groups and parts of census block groups that are within the 0.5-mile buffer.
B) Online Tools Option There are also several online tools that can be used to approximate the total population and jobs within 0.5 miles of a study site: Population within a specified buffer distance (0.5 miles) around a specific point (latitude, longitude) can be calculated from the Missouri Census Data Center website (http://mcdc.missouri.edu/websas/caps16acs.html). Employment within a specified buffer distance (0.5 miles) around a specific point (address) is available from the US Census Longitudinal Household-Employment Dynamics website (http://onthemap.ces.census.gov/). Depending on the preliminary data, it may be necessary to convert from address to latitude, longitude points. This can be done easily using Google Earth or websites like https://itouchmap.com/latlong.html. Note of caution: the online websites (Missouri Census Data Center and Longitudinal Household-Employment Dynamics) estimate population and employment within the buffer area using whole census blocks. They do not allocate the proportion of the census block that is within the buffer area (i.e., areal interpolation). For census blocks that straddle the buffer line, they simply add the total population of the census block if more than half of the block is within the buffer line or add zero population if less than half of the block is within the buffer line. This creates less accurate estimates than were used for model development, especially in areas that have larger-area census blocks (i.e., more suburban areas). However, the estimated population and employment numbers should be sufficient for planning-level analysis. Total Population Within ½-Mile Enter “Yes” if in the analysis year there are or will be between 3,500-35,000 people residing within ½-mile radius for apartment buildings being analyzed or 2,900-42,000 people if analyzing office buildings (the ranges for sites from which the estimation equations were drawn). This
information may be available from local GIS databases, census data, or another source. Enter “No” if the estimate of population for the analysis year falls outside the above ranges. This information can also be obtained through one of the options detailed above. Minimum Buses or Rail Transit Trains Stopping Near Site Enter “Yes” if either or both of the following conditions are met during the weekday PM peak hour in the analysis year:
• A minimum of 10 separate buses do or will stop within ¼-mile radius of an entrance to the building being analyzed (this is not one bus stopping at ten locations within the radius); or
• A minimum of five separate rail transit trains do or will stop within ½-mile radius of an entrance to the building being analyzed.
This information can usually be obtained from the local transit operator. Distances are straight line between entrances of the analysis building and the transit station or bus stop. A single bus or train stopping at multiple locations within the designated radius from an analysis site counts as one bus or train. If at least one of these conditions is not met, enter “No;” that will mean that the building will not be eligible to be analyzed using this method. OUTPUTS After all of the entries described previously have been made, a green color in the site qualification cell with a “Yes” will appear in the Model Outputs box indicating that the development qualifies for analysis as a smart growth site. The land use will be confirmed in the next box below. If there is a red color with a “No” in the Model Output site qualification cell, it means one of two things:
• An incorrect input has been entered (either wrong type of entry or a number out of the acceptable range); or
• An entry has yet to be made. If that occurs, check all inputs against the instructions. If the site qualifies (green color in site qualification cell), the estimates of AM and PM street peak hour vehicle trips will be shown in the bottom box. These estimates will have been computed using the formulas shown in Part A of this report. Estimates are rounded to the nearest whole number after the direction split has been applied. CHECKING OUTPUTS Analysts are encouraged to check the spreadsheet outputs for accuracy, especially upon the first use after downloading the spreadsheet. Every effort has been made to ensure that the
22
spreadsheet is working properly at time of posting on the website. However, it is possible that the file may have become corrupted or otherwise modified while posted, so it is wise to use the manual procedures described in Part A to confirm that the spreadsheet is working properly, at least the first time it is used for each land use.
23
PART C. TRIP GENERATION DATA COLLECTION FOR SMART GROWTH SITES INTRODUCTION At the time this user guide was developed, the procedures herein had been used to collect multimodal trip generation at over 60 individual establishments located on over 50 separate California sites. The data were collected during four separate spring and fall periods with procedures being refined after each season. While further enhancements may be found to be desirable in the future, experience gained during the more than 60 surveys have resulted in efficient procedures for conducting multimodal site trip generation surveys. These are described in Part B of this user guide. Most data collection sites so far have been apartment complexes of between about 30 and 850 occupied units and general multi-tenant office buildings of between about 50,000 and 500,000 occupied GSF of floor space. However, several surveys covered retail, coffee shop, and fitness center establishments. Part D of this guide describes the basic data processing that is needed to convert newly-collected raw survey data into trip generation characteristics. The output can be ready for development of relationships (models) with which future trip generation can be estimated. Part D describes how to begin with raw sample survey data and produce trip generation data that represents all travel generated by the site surveyed. APPLICABILITY Part C describes recommended procedures for conducting surveys to quantify site trip generation at smart growth sites as defined earlier in this guide. The procedures collect multimodal trip information as well as site and context data for use as independent variables in the estimation process presented in Part C. The audience for this chapter is the potential collector of multimodal site trip generation data (whether typical traffic consultants, researchers, or public agency staff). While these procedures have been used for data collection and reduction at mostly apartment and office buildings, they are applicable at virtually any land use. Surveys at very large or very small developments may benefit from minor adjustments to these procedures. The same may be true of land uses with very unusual characteristics, but virtually all single-use sites should be suitable for the basics of these procedures. The trip generation estimation procedures described in Part A should also be broadly applicable with one exception. As more multimodal trip generation data become available for more land uses, estimation methods may change from regression equations to something more complex. An example of a more complex estimation process can be found in the National Cooperative Research Program (NCHRP) Report 684, Enhancing Trip Capture Estimation for Mixed-Use
24
Developments, which uses a multi-step process consisting of trip generation rates and equations, a balancing step, and a factoring step.4 DATA COLLECTION OBJECTIVES Data collection procedures presented in this user guide follow four objectives:
• Are usable for any land use typically found in urban smart growth areas; • Are straightforward, easily replicated, and efficient to apply; • Provide data needed to develop site trip generation rates (or equations or other
computational methods) usable for estimating trip generation for use in traffic impact analyses (TIA) and Environmental Impact Reports (EIR) for developments in urban smart growth areas; and
• Build on, and be compatible with, established ITE site-based trip generation data collection guidelines so the resulting estimation method can be applied to adjust or replace ITE vehicle trip generation rates.
The recommended procedures consist of seven steps, beginning with the definition of the specific purpose of the data collection effort and concluding with the proper processing of the survey data. These steps are described in detail later in this chapter. Data collected for smart growth sites must be based on consistent and correctly applicable procedures and data. Therefore, it is essential that there be consistency in the definitions used and the means by which the data are collected. The procedures are structured to be straightforward, easily replicated, and adaptable to any potential smart growth or infill land use and development type. The field data collection can be conducted with an experienced survey supervisor and low-cost or temporary personnel who are given specific training prior to initiation of the survey. However, survey efficiency and results will be significantly better if interviewers with experience with intercept surveys are used for the interviews. The data collection procedure described may at first appear to be onerous. However, all data listed will be needed for a typical multimodal trip generation analysis. Special or limited studies may require more, less, or different data. Prior to the collection of any data, the desired outputs should be examined and the necessary field data determined. Even for such special studies, the recommended framework presented in this chapter will provide a good foundation from which to work. However, if the resulting data are to be consistent with other data collected in accordance with the Caltrans SGTG project, the procedures described in this chapter should be followed. Any deviations to add more data should not change the basic data described herein.
4 Enhancing Trip Capture Estimation for Mixed-Use Developments. NCHRP Report 684, B. Bochner, K. Hooper, B.
Sperry and R. Dunphy, Transportation Research Board, Washington, D.C., 2011.
25
The list of data to be collected for a typical analysis has been streamlined so that no extraneous data are collected. There are numerous types of information that could be interesting descriptors but that do not provide direct relevance to estimating smart growth site trip generation. These extraneous data have been excluded from the data collection plan because requiring them would expand the volume of data to collect (and the cost), could intimidate or discourage a potential data collector, and could thereby hinder the collection of the important and relevant data. However, the entity conducting the survey may have other reasons to collect additional data. NEED FOR QUALITY ASSURANCE AND CONTROL An important component of the data collection effort is adherence to a quality assurance/quality control (QA/QC) program. The exact nature of the program should be at the discretion of the agency that is funding or conducting the data collection. However, at a minimum, a QA/QC plan should be developed at the outset and checks should be conducted during each of the procedural steps. An important consideration in the QA/QC process should be the definition of the level of precision desired and the travel modes for which trip generation is to be estimated. This should be one of the first things determined for each survey. It is critical that the data be compatible among smart growth developments. One QA action is to carefully consider the definitions and descriptions of both the developments and the data to be collected and applied. STEP 1 – DEFINE PURPOSE OF DATA COLLECTION Step 1 provides the structure and scope for the survey. It is used to identify what is to be collected, how the data are to be used, and where to collect the data. USE OF DATA The first step is to clearly specify the purpose of the site trip generation data collection effort. There are two basic choices: (1) to study trip generation characteristics for one or more specific land uses that appear in smart growth developments; or (2) to determine site trip generation characteristics for a development that is similar to a proposed smart growth development under consideration. In either case, the purpose may be to enhance the existing smart growth trip generation multimodal database or to establish multimodal trip generation characteristics for a similar smart growth development. Under both choices, the data to be collected, the survey instrument, and the interview procedures remain the same. The only difference occurs in Step 2, when a data collection site is selected. Additionally important is how those data will be used. For example, is it to assess traffic impacts of a proposed development on roads in an area that already experiences congestion during certain periods, or will the data be used to initiate or expand a local or national smart growth trip generation database? The specific use will influence selection of the
26
study site(s) as well as the season, day of week, and time-of-day when surveys should be conducted. SITE SELECTION At first glance, it may seem that any smart growth development with the desired land use(s) be selected for data collection. However, smart growth sites can vary significantly in either the development characteristics or in characteristics of the surrounding area. Their differences may, in some cases, cause small-to-large differences, especially in mode split. However, some seemingly minor differences (for example, in the proximity of interacting land uses, or in an area with a different nearby land use mix) can cause substantial changes. Transit accessibility or service frequency, among other factors, can cause substantial changes. Therefore, it is important to select a development that is similar to the one to be analyzed or representative of the desired database. It is also important to collect the complete set of data to help identify differences that could explain the need to interpret the comparable sites for slightly different characteristics. In other words, although two sites may appear very similar, when individual parameters are examined (e.g., distances to nearest rail station, nearby population and employment densities), slight, yet important, differences may be revealed. Site selection should consider:
• Types or styles of development that the data will be used to analyze; • Development land uses and mix, both on- and off-site; • Size range of development; • Development maturity (is it fully occupied and sufficiently vibrant?) • Representativeness of the development in relation to sites for which the data will
support the analysis; • External conditions, including competing and interacting opportunities, modes of
access, economic strength of the area; and • Willingness of the development(s) owners and/or managers to permit the surveys in a
manner needed for the surveys. TIMEFRAME The collected data needs to be valid for typical analyses used for TIAs and EIRs. These analyses typically focus on peak hours of weekday morning and afternoon commute travel periods, which often have the highest amount of traffic across the transportation system as a whole. Normally these analyses are conducted for the street peak hour of the highest four consecutive 15-minute periods during weekday morning (7-9 a.m.) and evening (4-6 p.m.) street peak hours. This is because the peak total demand usually occurs during those hours.
27
However, it is important to recognize that travel to and from some land use types (e.g., schools, churches, restaurants, theaters) may peak at different times or on different days than the transportation system as a whole. While transportation system impacts at times other than weekday commute periods are an important topic for future research, most analyses, and therefore normal data needs, cover weekday street peak periods rather than peaks specific to individual land uses. Representative weekday street peak hour data can normally be collected during the following periods.
• Time-of-day. For morning street peak periods, 7 a.m. to 10 a.m. or 6:30 a.m. to 9:30 a.m. will apply. Check local peaking data to select the best period. For afternoons, 4 p.m. to 7 p.m. should be sufficient, but some areas have earlier or later peaking. A one-hour or two-hour peak period can be extracted from those survey periods as desired.
• Day of the week. Data should be collected on typical weekdays – normally Tuesday, Wednesday, and Thursday. Traffic patterns on Mondays and Fridays are not always the same as the midweek days.
• Season of the year. Site trip generation for most land uses is at typical levels during fair weather months in the spring and fall (non-holiday weeks during March-May and September – mid-November). Data are collected on typical days when school is in session. Some land uses (e.g., recreational facilities) may operate at typical levels during other periods.
• Weather. Data should only be collected on rain-free days without abnormally high or low temperatures.
The data collection time periods should not represent any seasonal peaks or lows at study locations. STEP 2 – ESTABLISH DESIRED SITE CHARACTERISTICS Site selection is among one of the most important steps in preparing for data collection. For the resulting data to be representative, credible, and usable, the data need to be collected at sites that truly represent the types and characteristics of land uses and developments that are expected to be analyzed using the data collected. Some key questions to be addressed are:
• What types of land uses and development are being proposed and analyzed in smart growth areas and developments?
• What sizes of these developments are being analyzed in TIAs and EIRs? • What size area or regions are these smart growth developments occurring in? • Where within those areas or regions are the smart growth developments occurring?
Analysts seeking data specific to a particular site should modify these questions so they will apply to the specific site in question.
28
The purpose of this chapter is to provide specific guidance on how to select data collection sites that address the previous questions and how they can be surveyed efficiently and provide the necessary information. These guidelines should be usable for almost any land use and development size that would likely generate a significant transportation impact and be subject to a TIA or EIR. It can be very expensive to collect multimodal trip generation data at sites with very small amounts of trip making because of the very low frequency at which interview data can be obtained and the length of time needed to accumulate enough completed interviews to yield credible results. CHARACTERISTICS OF SMART GROWTH SITES For the purposes of transportation and trip generation, a smart growth development area is one where many common interactive land uses (e.g., homes, workplaces, parks, restaurants, stores, other complementary land uses) are located within a convenient walking distance of each other and where people can choose to do many of their daily activities within a walkable area. A smart growth development site can be a piece of land on which a multiple-use or mixed-use development or a single building that is part of a development or adjacent to it. It can also be a parcel of land within an area as described in the first sentence of this section. Smart growth sites and areas are typically served by pedestrian and bicycle facilities and convenient, frequent, and reliable public transportation. Additionally, they usually have higher development densities and are more compact than traditional suburban development. For the purpose of trip generation data collection and estimation, a smart growth area is also nearly fully developed (at least 80 percent, but usually more). Development may be new (green field), infill, re-development, or mature as long as it meets the characteristics described in the previous paragraph. The survey sites from which data have been collected for the Caltrans SGTG database generally follow almost all of the following criteria, and it is suggested that these criteria be used to locate applicable smart growth areas.
• Area characteristics o Area within ½-mile of an almost fully-developed area (at least 80 percent) o Mix of complementary, interacting land uses within about ¼-mile of the site (e.g.,
residential, office, retail, restaurant, etc.) o Moderate-to-high densities o Both significant population and employment o Well connected and conveniently walkable o No special major trip attractor within ½-mile of the site (e.g., major university,
stadium/arena, airport, military base, theme park, etc.) o Substantial peak hour transit service 10 or more buses stopping within ¼-mile of the site, or Five or more rail transit trains stopping within ½-mile of the site
• Site characteristics o Mature development (“fully” occupied – at least 80 percent – at least two years)
29
o Adequate parking to meet demand, either on-site or within convenient walking distance
o Convenient transit stops accessible (by foot) to/from development’s entrances o Multiple complementary land uses conveniently walkable from the site o Walkable environment
SITE SELECTION CRITERIA Data collected should be transferrable and applicable for analyses of either specific sites or the common type of development normally developed. Site selection is intended to locate sites to provide such data. Land Use Trip generation data collection is normally conducted for one or both of the following reasons:
• Start or add to a trip generation database for one or more specific land uses, sometimes of specific size ranges or in the case of smart growth developments, with specific context or surrounding area characteristics; or
• Collect data for use in analyzing a site with certain characteristics either nearby or elsewhere.
In either case, the land use of the candidate sites for survey should be the same as for the database or site to be analyzed. Survey Site Development Size The site should be of a density and size for which the potential for walk or bicycle trips is significant, either within the survey site or to/from nearby sites. It is desirable from a cost-effectiveness standpoint to obtain enough interviews in a single day. Sites should be large enough to generate at least 100 peak period trips (AM, PM street peak 2-3 hours). This would normally provide a sufficient number of interviews to yield a breakdown of mode splits for the site person trips. Some smaller buildings might also be considered acceptable if they exhibit excellent smart growth characteristics, but they might require a second day of surveys. In some cases, multiple buildings totaling more than these threshold values would be acceptable if they could be surveyed as one site and as long as the full site operated as if it was a single building. Smart Growth Area The site should be of a density and size for which the potential for walk or bicycle trips is significant, either within the survey site or to/from nearby sites. Individual land uses should be conveniently accessible, either internally by pedestrian pathways or streets or externally by
30
streets adjoining the site. The mix of land uses should be representative of current or anticipated trends in smart growth developments. The land uses at or nearby the site should interact with each other. The site should be surrounded by convenient, complementary, and interacting land uses with which it interacts. The area should be conveniently walkable and pedestrian friendly (sidewalks on at least 50 percent ((preferably 100 percent)) of the block faces within ¼-mile of the site). It should be attractive to use travel modes other than driving to make at least some normal trips. The area within ½-mile (straight line radius) of the site should be mostly developed (generally 80 percent or more). The site should also not be on the periphery of an urban area. Within a radius of ½-mile, there should be at least 6,000 residents and 1,000 jobs (based on 2010 Census data). On-Site Parking Parking for the site to be surveyed is either fully within the survey boundaries or, if off-site, interviews of people crossing the site’s cordon can be successfully conducted to determine their primary mode of travel and parking location, if any. Site and Area Maturity The site or targeted building or land use within the site should be at least two years old (i.e., occupied for at least two years) and have at least 80 percent occupancy. Transit Proximity The site should be served by frequent transit service (at least 10 buses stopping within ¼-mile or five transit trains stopping within ½-mile during the weekday PM peak hour). Ferries and other forms of transit are not considered. Bicycle Facility Proximity The site should have bicycle lanes, multi-use paths, or other designated bicycle facilities within two blocks. This excludes shared lane markings (sharrows) and signed but unmarked bicycle routes. Normal Conditions There should be no construction or other activity at or near a study location that restricts access or volume of activity.
31
Atypical Conditions to be Avoided Sites having characteristics that generate unusual conditions not typically associated with a proposed development site should generally be avoided. Examples of such conditions include:
• Higher or lower than normal customer bases or activity, such as (currently) an Apple store or the only grocery store in a downtown;
• Sites serving students and that are within a mile of major colleges or universities (5,000 or more students) or sites within ½-mile of census tracts with more than 15 percent of the population between the ages of 18 and 21; and
• Sites within ½-mile of a stadium, military base, major tourist attraction, commercial airport, or other specialty high-activity location.
If the purpose of the data collection effort is to determine (person trip/multimodal) trip generation at a site similar to a proposed smart growth development, the analyst should take a slightly different approach. First, the analyst must define the proposed development in terms of the independent variables collected in Step 3. In other words, compile the descriptive data for the proposed smart growth development as if it was the data collection site. Armed with that information, selection of a similar site may be possible. Identify a site (1) with the same land use, (2) a similar balance of land uses nearby, (3) with a generally similar site layout characteristics (e.g., density, building siting relative to the transportation system), and (4) that is at least two years old, and (5), if possible, that is located in an area with similar land use and transportation system characteristics. In addition, follow the previous criteria. When data are to be collected for a similar development, it is always valuable to verify acceptance of transferability with the agency that will review and decide whether to accept the results. Advance concurrence with site selection and procedures usually alleviates the possibility of having to collect data elsewhere. Efficiency of Survey Sufficient Activity The site should be large and active enough to obtain the needed data sample sizes in the number of survey hours planned. Surveys to obtain peak hour data are 2-3 hours per peak period. It is desirable to obtain at least 50 samples per peak period for breaking out trip characteristics such as mode split, but 100 or more should be sought. The actual target size will depend on how the modal data will be collected and the effective sampling rates (i.e., counts or completed interviews). A development to be surveyed should appear to be economically viable. That is, it should look like the business or other land use is economically healthy as represented by trips to and from the building and occupancy of the parking facilities. Relatively empty parking lots, restaurants with only a few tables occupied, and stores with few customers are all signs of a development
32
that is not economically healthy and not representative of what a developer would want to develop. Ability to Isolate and Survey Site It should be possible to isolate the survey site and each land use to permit accurate complete cordon, door, and/or driveway counts and interviews covering all person trips and modes. It is also necessary to be able to conduct counts and conduct interviews at a site without the possibility of double-counting or missing trips. The data collection program should be able to isolate the trips to and from the development.
• There should be locations where persons making trips to/from the site can be counted or interviewed to determine primary mode of travel.
• There should be no through trips across the site. • Where tube traffic counters are to be used, the design of external access points should
be such that mechanical counting techniques will produce accurate vehicle counts (e.g., short driveway throats make it difficult to place tube counters to work properly), or if not, manual or video counts should be employed. Similarly, if video counters are used, all movements to/from the site should be clearly visible and distinguishable by mode of travel at the cordon boundary.
Any trips using parking or access points that are shared with buildings or land uses not intended to be incorporated in the survey should be included so they could be subtracted to yield only trips from the targeted building or land use. In most cases, shared parking or access will increase the necessary size of the survey crew; this may make a survey of such a site infeasible. Limited Number of Count and Interview Locations The site should have a limited (i.e., a relatively small number) of access points in order to limit the cost to collect counts and interviews. Safe Count and Interview Locations Locations to be used for survey personal to conduct counts (pedestrians, bicyclists, transit boardings and alightings, or vehicles) should be safe for both survey personnel and passersby. It should not be necessary to arrange for elaborate safety provisions just to afford minimal safety. No Through Trips There should be no through trips passing through the development unless they can be isolated and accurately counted. Presence of through trips increases the cost of surveys and also introduces the chance for errors.
33
Site Data Available Data describing the site characteristics should be confirmed to be available, either from the development property owner/manager or from field measurements. This should be determined before the survey is conducted. Field Verification of Survey Suitability It is vitally important to check every prospective site in the field to ensure that the previous conditions can be met so the site can be surveyed efficiently and accurately. A preliminary data collection plan should be developed as part of the field reconnaissance – before a site is formally selected – to ensure that the survey is feasible within available resources. If the site looks promising for a survey, this field visit should also include a visit with the property owner/manager to gain a better understanding about how the development functions, where all access points are located, and to answer questions that arise as the preliminary data collection plan is developed. This meeting might also be used to initiate the permission request if the site is deemed desirable for a survey. STEP 3. SCREEN SITES There are a number of ways to identify candidate smart growth sites for data collection. These include the following.
• Seek sites considered “smart growth” by searching the internet for “smart growth developments (city name).” Also try “transit-oriented developments (city name).”
• Ask city planning staff for suggestions. • Examine sites you know are within smart growth, transit-oriented, or compact urban
development types of areas. • Use internet sources such as Google Earth and Bing Maps to identify and assess images
of those buildings near rail transit stations that might meet the site selection criteria. Unless the analyst is familiar with enough sites to meet survey needs, it is a good idea to identify at least twice as many sites as are needed. This is because the field reconnaissance step will likely cause some sites to be eliminated due to difficulty in isolating the site, site and/or surrounding vicinity does not really have the needed smart growth characteristics, size of survey crew needed, or inability to obtain permission to conduct the survey. Assemble Information for each site, including estimates of size, types of land use, locations, contact persons and information, and additional information that could help in the selection of the sites to be surveyed. Then visit the candidate locations to see how well each site meets the desired characteristics and develop a preliminary data collection plan (including how much equipment and how many people will be needed). After all of the best candidate sites have been identified, they can be prioritized by how fully they meet the site selection criteria.
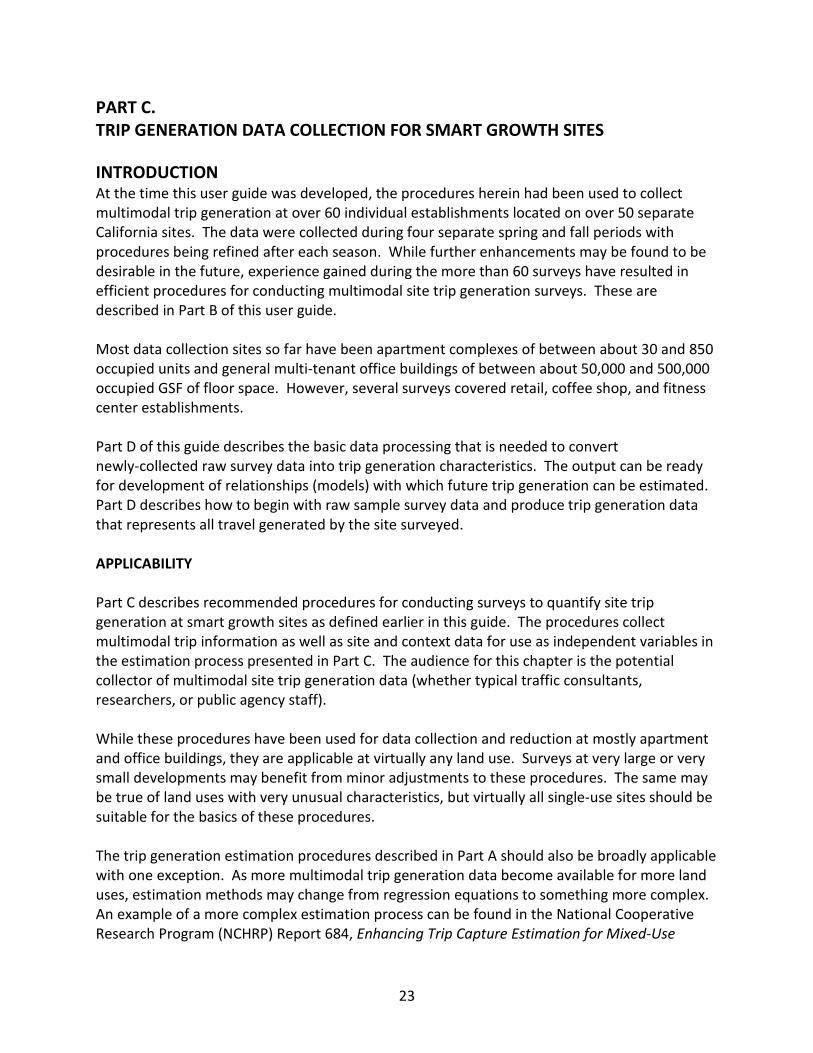
34
Table 1 shows a format that can be used to organize site data. This example includes common smart growth site characteristics, but other smart growth characteristics can be added or the initial list for screening sites can be much shorter.
35
Table 1. Example of Survey Site and Area Characteristics Location Land Use (ITE Code) Size and Occupancy Surrounding Area Characteristics
35.1 Wilshire Center (East) 3055 Wilshire Blvd. Los Angeles 710 225,000 0.75 19962 33012 Yes Yes 129 24 30 980
36.1 Wilshire Financial Tower 3200 Wilshire Blvd. Los Angeles 710 200,000 0.85 23635 33623 Yes Yes 129 24 30 730 1 Floor area is occupied square feet; occupancy is dummy value. 2 Based on walking distance to bus rapid transit station and bicycle facility; straight-line distance misleading. 3 About 2600 feet to VTA light rail; 1000 feet to Caltrain 4 Path distance to BRT station; no rail station. 5 2013 ACS five-year (block groups) 6 2013 LEHD LODES (blocks) 7 Includes only Red Line trains; Orange Line BRT buses included in bus count.
36
STEP 4. OBTAIN PERMISSIONS After an appropriate smart growth site is selected for data collection, it is normally necessary to obtain permission from the site property owner/manager to collect data at each site and land use. In some cases it may be possible to collect all data at or from locations on public sidewalks, but it is preferred and good practice to request permissions as a matter of courtesy and to facilitate obtaining site-related data that normally comes from the property owner/manager (e.g., development units, occupancy). It is not possible or appropriate to collect the necessary data (especially the on-site interviews of site visitors, patrons, and workers) without the permission and cooperation of the site property owner/manager. In most cases, the owner or manager will communicate with internal businesses, landlords, etc. In some cases, the survey supervisor may need to make direct contact to gain full permission. A primary objective of property management is to keep property ownership and property tenants content by, if possible, maintaining the status quo. One means of achieving this objective is to prevent the occurrence of any problems for the customers, visitors, workers, etc., of their property tenants. To that end, the analyst should contact property management by phone and email, and then meet as necessary to discuss the purpose and procedures of the data collection effort. During each contact, the analyst should convey an understanding of the need (1) to not impede patrons and (2) to not divulge proprietary or sensitive information. An incentive for property management to cooperate is to offer to include a site-specific question during the interview process (and to offer the opportunity to receive the survey results or a copy of the study report). If a good working relationship can be developed, property management can often provide insight that will help the analyst tailor the intercept sampling procedure for the site and help interpret the survey results. STEP 5. DATA COLLECTION FORMS After a data collection site has been selected, the next step is to finalize the data collection plan. Data collection for a multimodal trip generation survey of a smart growth site typically will consist of the following.
• Directional counts. Directional cordon person and vehicle trip by mode and vehicle occupancy counts (manual or video) as applicable at every site access point. Counts cover every access point or route across external cordons around the survey site. Counts consist of pedestrians, bicyclists, and sometimes vehicles by type, and vehicle occupancy. Figure 7 and Figure 8 show examples of two forms that can be used or modified to manually record the counts, one when counts consist of vehicles and pedestrians (see Figure 7), and the other when counts included pedestrians only (see Figure 8).
37
• Interviews. Intercept interviews are conducted at locations where travel mode in and out of the site cannot be determined by visual observation. Direct modal counts – counts covering all trips by specific modes – include:
o Persons bicycling – Persons riding bicycles to and from the site. o Vehicles driving – this includes personal vehicles, commercial trucks, motorcycles
and any other motorized vehicle legally permitted to operate on public roadways. Depending on survey specifics, vehicle types may be counted separately.
o Vehicle passengers – passengers riding in motorized vehicles. • Indirect modal counts – counts that will be subdivided into other modes based on
interview responses: o Persons walking – Persons walking across the site’s cordon boundary. These may
include trips to/from off-site parking spaces, transit stops, or ultimate off-site destinations. That breakdown is determined from the intercept interviews.
These counts are used directly or as controls for expanding interview samples (since complete interviews will not be obtained from every person entering and exiting).
• Interview responses can be recorded on paper forms or on handheld tablets using an app. Interviews are conducted with as many people entering and exiting a site as possible to determine the mode of travel and vehicle occupancy (if any) for all trips involving a walk across the site cordon. Those trips include pedestrian, bicycle, transit (rail or bus), and walking to/from a vehicle parked off-site. Figure 9 shows a sample form that can be used for manual recording of interview responses. An app was developed and is available from Caltrans for conducting interviews with a tablet. A good, motivated interviewer with extensive intercept interview experience can obtain completed interviews from 50-80 percent of people approached. Less experienced interviewers may complete less than one-third of interviews attempted, so it is important to use motivated interviewers with significant intercept interview experience. Survey supervisors should remember that not all people using an access point can be intercepted. The percentage intercepted will vary based on volume, proximity to the building entrance used, time-of-day and degree of hurry target interviewees are in, and motivation of the interviewer. As part of the site reconnaissance and survey preparation, the survey supervisor should estimate the intercept percentage and interview completion percentage to make ensure that enough interviews can be obtained. This is performed as part of the survey staffing plan. Table 2 shows the sample sizes and rates for sites surveyed using professional interviewers. The percentage of people intercepted and interviewed to usable completion varied, but averaged about 46 percent across all sites.
38
Figure 7. Sample Multimodal Cordon Count Form – Driveways and Walkways
39
Figure 8. Sample Cordon Count Form – Walkways Only
40
Figure 9. Sample Manual Interview Form
41
The interview data are typically used only to split walking access trips into walk, transit, and bicycle trips. Trips by motor vehicle (driver, passengers) are determined in most cases by direct counts at site driveways; for those trips the sample rate is 100 percent. Hence, for a hypothetical site, if there were 30 percent non-vehicle trips and the sample rate for those was 40 percent, then 12 percent of all trips were reported in interviews (30 percent times 40 percent) and the 70 percent that were vehicle trips would all be represented by counts, yielding a total of 82 percent of all trips having modes directly reported. Table 2 shows an example of a table summarizing usable interviews compared to the non-directional pedestrian volume (total of entering plus exiting) the site. STEP 6. COLLECT SITE DATA These data are typically obtained from property owner/management, field observation, aerial photos (e.g., Google Earth, Bing Maps, etc.), and local GIS and Census data. Figure 10 provides an example of a form that can be used. The site data collected should include at least those items listed on this figure; these are included in trip generation data available from Caltrans and any additions to that database should include at least the same items. The descriptions or definitions for the “site data” contained on the next page are as follows:
• ITE Land Use Code – Code assigned according to list in Trip Generation Manual, 9th Edition., Institute of Transportation Engineers, Washington, D.C., 2012
• ITE Area Type – Code assigned according to definitions in ITE Trip Generation Handbook, 3rd Edition, Institute of Transportation Engineers, Washington, D.C., August 2014, p. 131 with revisions as described below:
o 0a = regional central business district (CBD) o 0b=Outlying CBD o 1 = urban core o 2 = activity center o 3 = general urban o 4 = suburban or outlying business district o 5 = suburban strip commercial o 6 = general suburban o 7 = special district o 8 = rural town business district o 9 = rural
Supplemental codes added only where applicable are:
• C = site within one mile of campus of university with over 5,000 students • M = mixed use within larger development • Ta = transit-adjacent (within ¼-mile of rail station) • To = transit-oriented immediately adjacent or connect to rail station.
Definitions enhanced from the Trip Generation Handbook version are:
42
• Regional CBD is the largest within its region, has a government center, and has the regional or main transit hub within the region
• Outlying CBD (not described in Trip Generation Handbook) is any community CBD that is not the largest in the region; it has a government center but may or may not have a transit hub
• Building size – DUs (apartments) or GSF of floor area (other uses) as reported by building owner/manager
• Building occupancy – percent of building occupied as reported by building owner/manager at survey time
• On-site parking spaces – total number of on-site parking spaces • On-site parking cost – cost of parking for visitors (first hour) • Average building setback distance – Average setback distance at building access points • Curb parking spaces within 0.1-mile – total spaces within straight line radius, regardless
of use restrictions • Metered curb parking rate – where metered, or free if applicable • Residential population within ½-mile (straight line radius) – 2013 American Community
Survey (ACS) • Jobs within ½-mile (straight line radius) – 2013 Longitudinal Employer-Household
Dynamics (LEHD), LEHD Origin-Destination Statistics (LODES) • Distance to regional CBD – closest among Sacramento, San Francisco, Oakland, Los
Angeles, San Diego • Closest bicycle facility – straight line distance to bike lane, path (excludes sharrows and
unmarked routes) • PM peak-hour bus stops within a ¼-mile, straight-line – number of different bus stops
within ¼-mile • PM peak hour buses stopping within a ¼-mile (straight line radius) – number of different
buses stopping • PM peak hour rail transit stops within a ½-mile (straight line radius) – different rail
transit stations (20-minute headways or less) • PM peak-hour rail transit trains stopping within a ½-mile (straight-line radius) – number
of different trains • Site area covered by surface parking lots – percentage of total site area • Site within ½-mile of major university – straight line distance to universities with over
5,000 students • Walk scores – walk, transit, and/or bike scores (for residential sites) from walkscore.com
43
Table 2. Sample of Survey Intercept Percentages
Site Non-Directional Pedestrian Volume at Survey
Useable interviews
Percent Captured and Usable
AM PM AM PM AM PM Capitol Towers 153 223 103 127 67% 57% LINQ Midtown Apartments 111 149 95 128 86% 86% One Concord Center 400 337 262 206 66% 61% Avalon Walnut Creek 189 251 64 145 34% 58% Eaves by Avalon 314 266 271 263 86% 99% Park Regency 270 314 237 270 88% 86% Fremont Office Center 397 386 245 182 62% 47% Avalon at Cahill Park 156 220 73 137 47% 62% Villa Torino 124 207 106 116 85% 56% Gardens at Wilshire Center 46 97 20 38 43% 39% Wilshire Vermont Station 332 440 98 138 30% 31% Wilshire Center East 157 199 60 69 38% 35% Wilshire Financial Tower - North 226 170 41 41 18% 24% Wilshire Serrano Building 446 342 138 140 31% 41% 24 Hour Fitness Center 472 787 117 160 25% 20% Acappella Pasadena Apartments 40 102 36 65 90% 64% Pasadena Gateway Villas 51 45 24 23 47% 51% The Stuart at Sierra Madre Villa 26 33 23 33 88% 100% Lake Corson Building 73 87 56 54 77% 62% NoHo 14 36 80 11 23 31% 29% Gallery at NoHo Commons 107 243 45 79 42% 33% The Academy 306 415 160 102 52% 25% Lankershim Plaza 401 585 176 200 44% 34% AMLI Warner Center 102 178 35 48 34% 27% Confidential Office Building 260 255 83 112 32% 44% Alterra at Grossmont Trolley 187 356 60 140 32% 39% Pravada at Grossmont Trolley 138 195 38 70 28% 36% Hazard Center Office Tower 294 278 143 75 49% 27% Hazard Center 162 231 53 79 33% 34% Mission City Corporate Center 62 39 40 33 65% 85% Rio San Diego Plaza 58 44 24 42 41% 95% Rio Vista Plaza 56 70 25 17 45% 24%
Total (by Peak Period) 6152 7624 2962 3355 48% 44% Total (Both Peak Periods) 13776 6317 46%
44
Figure 10. Sample Site Characteristics Data Form
45
STEP 7. COLLECT TRAVEL DATA Step 7 is subdivided into eight specific steps/decisions that need to be completed to conduct a successful field survey. Steps 2 and 3 include identifying intercept interview and count locations at study sites. As part of site data collection, every person entering/exiting the site is counted. For count locations on a site where the travel mode can be determined by observation (such as a passenger in a car entering the parking lot) then an intercept interview is not needed. 7A – ESTABLISH THE SPECIFIC PURPOSE OF DATA COLLECTION Step 1 in the overall data collection framework requires the analyst to define the specific purpose of the data collection effort. It should be repeated here and with specific reference to the following questions and issues. • Specify the timeframe of interest for determining site trip generation. Plan to collect trip
data for one or more of the following periods. o Street Peak Hour – Collect data for at least one-half hour before to one-half hour after
the known peak hour (i.e., for at least two hours total) to ensure that the peak hour during the survey is actually covered. Check the current ITE definition (in Trip Generation Handbook5) for the complete street peak hour definition to ensure the correct peak hour is selected (the weekday street peak hour is currently the highest 60 minutes of site plus adjacent street traffic within 7 a.m.–9 a.m. and 4 p.m.–6 p.m.);
o Peak Hour of Generator – Determine the highest morning or afternoon hour of trip generation from trip generation counts at the survey site. Collect data for at least one-half hour before the beginning of the peak until one-half hour after the end of that peak hour;
o Mid-Day – Collect data for at least one hour after the AM street peak hour to one hour before the PM street peak hour unless a shorter period has been established with the review agency for the resulting analysis; and
o Daily – Collect survey data during the active part of the 24-hour period (e.g., when businesses are open; between about 6 a.m. and 10 p.m. for typical residential).
• Specify the preferred day of the week (weekday, Saturday, or Sunday), based on the period analyses are to cover. If a weekday, select a typical day of the week for the land uses to be surveyed.
• Specify the preferred season of the year (holiday shopping, summer, school-in-session), based on the period analyses are to cover.
7B – IDENTIFY INTERVIEW INTERCEPT LOCATIONS AT STUDY SITE(S) Identify all means/routes of entering or exiting the survey building (or significant use within the building) to make an external trip. At each of these entrances/exits, select an interview location. The best interview locations (1) are close to the building entrance, (2) are along the 5 Trip Generation Handbook, Institute of Transportation Engineers, Washington, D.C., current edition.
46
path that most users of the entrance will travel, (3) are in well lighted areas so interviewees feel safe and comfortable, and (4) have adequate area to stand away from the door so as not to block movements. 7C – IDENTIFY COUNT LOCATIONS AT STUDY SITES The data collection plan must include a count of all people (not simply vehicles) entering or exiting the building at which interviews are being conducted. Therefore, appropriate count locations must be identified. These will usually be entrances (and exits) to the property being surveyed (count people entering and existing), and garage and parking lot access points (count vehicles and occupants); there may be other access points. As previously noted, where the travel mode can be determined by observation (such as a passenger in a car entering the parking lot) then an intercept interview is not needed at this (individual) data collection location on a site. The count should track entering and exiting people separately. The counts will be used for two purposes:
1. Person trip generation count for establishment being surveyed; and 2. For computing an expansion factor to be applied to the interview data.
The site survey should include as many interviews as possible at as many entrances as possible within available resources, but providing at least 100 completed interviews per period, if at all possible. Fewer than 50 completed interviews may result in erroneous modal data and defeat the purpose of the survey. Under the best scenario, interviews will be conducted at each building entrance at which people walk to/from the external cordon around the site. If that is not possible, conduct interviews of pedestrians at representative entrances – making sure to obtain 100 or more completed interviews per analysis period. When using the sampling approach, deploy interviewers to the busiest locations for each site. If interviewers are assigned to low volume access points, they will not complete many interviews. A pre-survey site reconnaissance and discussions with property managers will help the analyst to determine where to interview to be most effective. Similarly, selecting a site large enough to meet interview minimums is also very important. There is no sense in selecting a nice easy-to-survey 20-unit apartment building for such a survey unless one is willing to conduct interviews and counts for several days. There just are not enough trips generated. A competent and properly motivated interviewer (actively approaches people to get interviews, responses are complete and accurately recorded) located at a moderately active entrance should be able to complete interviews with at least 10 people per hour. An experienced professional interviewer may be able to do 20 or even 30 per hour at a busy location. However, activity levels will vary and typically result in a range of 5-to-20 completed interviews per hour. An average and motivated interviewer should be able to obtain completed interviews from one out of every three persons approached. Professional interviewers can successfully intercept
47
and complete interviews of an average of 40-to-50 percent of all entering/exiting persons. Recognize that some interview candidates will decline to participate or have been interviewed previously and not want to participate again. 7D – DETERMINE STAFFING REQUIREMENTS For this type of survey, it is desired to conduct 100 or more interviews per land use per survey time period. This may not be possible for land uses that are small or are relatively inactive during the survey time period (e.g., weekday morning retail). One way an interview sample can be expanded is by conducting interviews during the same time periods over multiple days. The survey supervisor should determine how many counters and interviewers are needed, based on the survey location requirements described in Step 7C and on the minimum sample requirements described previously. If there is a steady stream of pedestrians at a survey location, a rate of 20 complete interviews per hour is a reasonable expectation for each surveyor. For less active locations, estimate 5-to-10 complete interviews per hour for well-trained interviewers who are experienced at approaching strangers. When estimating manpower requirements, it is important to assess the pedestrian traffic flow to be intercepted. 7E – DEVELOP SURVEY INSTRUMENT AND OTHER DATA COLLECTION FORMS For this type of survey, interviews of persons can be conducted while both entering and departing an entrance. One exception is retail, where management can be resistant to anything that might delay a person from entering a business. However, each interview can obtain information on both trips going to and from the surveyed site. In that way, people travelling only outbound can be asked about trips going both inbound (prior trip into store) and outbound (trip currently being made). Figure 9 provides a sample list of interview questions. These are only asked of people walking to/from the site at the cordon. Modal determination for vehicle drivers and passengers can be determined from counts made at the cordon. The survey supervisor should ensure that the questionnaires to be used fit the conditions as well as collect the desired data. In general, use of questionnaires such as the one shown in Figure 9 will be adaptable to nearly any standard survey and can be automated and conducted using a tablet if desired. Each item is needed for a complete analysis or for checking responses. However, some survey sites may need supplemental questions to firmly and clearly establish the characteristics of the trips being reported. If interviews are limited to outbound trips only (e.g., permission prohibits interviewing inbound pedestrians), the left column can be used for the current outbound trip and the right column for the inbound trip that preceded the current outbound trip. Interviewees would be asked about BOTH the current outbound and preceding inbound trips. Additionally, a column would
48
need to be added to the right of the inbound trip column for the time of arrival. In this case, the question for the preceding inbound trip would be something such as: “Where did you come from immediately before you arrived at (this entrance)?” The field survey form should include a space for the interviewer to record the date, the name of the development, the interviewer’s location within the site, the time each interview begins, as well as the interviewer’s name. It is important that every single item be filled out completely and accurately for each interview. Omissions can make an interview unusable. Inaccurate entries, guesses, or incomplete entries will also invalidate an interview, wasting both time and money. Interviews will be completed for a sample of all persons exiting establishments or the site. Factoring will be used to expand the survey data to represent the universe of trips represented in the survey. Counts of all persons exiting the survey locations (or all locations) will be needed to develop the expansion factors. This expansion process will need to be developed as part of the survey design so the proper counts can be made. Figure 7 and Figure 8 show manual count forms that can be used to count people exiting (or entering) each door of each establishment where interviews are to be conducted or that the interviews are to represent. This form or an automated equivalent can be modified to meet specific survey site needs. Vehicle occupancies should be counted since the recommended estimation methodology (and therefore survey methodology) is for person trips. Counts should cover all access points. Figure 11 shows a manual cordon count form that can be used for this type of survey. This form can be automated or modified as needed for specific survey conditions. This version also includes directions for count personnel to help them better understand how to use a manual form.
49
Figure 11. Sample Manual Multimodal Count Form with Surveyor Instruction
50
7F – RECRUIT AND TRAIN FIELD PERSONNEL After recruiting the survey field personnel, the survey supervisor should conduct a training exercise. Some personnel will need to conduct door counts—the counts of people entering and existing establishments surveyed. Some will count vehicles, vehicle occupants, and pedestrians at multimodal access points. Some personnel will conduct interviews. Generally the most outgoing and assertive staff will make the best interviewers. Use professional interviewers for best and most cost-effective results. The interviewers should be made familiar with the survey instrument through practicing with intercept interviews (tablets or paper forms). The same is true for counters and their count forms (or tablets). All survey personnel should be provided with maps showing each location where counts and/or interviews are to be performed. The survey supervisor should include on each map the overall survey site with names of entrances to which interviewees might refer as well as the specific location and movements the counter or interviewer is to handle. Field surveys are not trivial. They require thorough preparation and training as well as good supervision. Most surveys of this type will require one supervisor for each 6-to-10 interviewers and counters. Specifics of the survey site, including size and distribution of survey personnel, may increase or decrease the number of supervisors needed. 7G – CONDUCT FIELD DATA COLLECTION Inbound and Outbound Door and Driveway Counts As noted previously, total person counts are needed at each location where intercept surveys are to be conducted plus site access driveways where counts determine modal splits as well as access volumes. If several adjacent entrances are to be surveyed, one counter may be able to count multiple access points concurrently. This will depend on sight lines and placement of the counter. A counter should only be assigned to count those movements that can easily be seen while looking in one direction. Requiring a counter to look in multiple directions will result in missed persons entering or exiting doors and driveways being inaccurately counted. As mentioned previously, every establishment door where interviews are conducted must have entering and exiting people counted. Counts should be made by 5- or 15-minute periods beginning on the hour or half hour when the survey begins. Counts should be made for the complete survey period. The survey supervisor should have extra personnel to provide short breaks for the counters to use restrooms. It is suggested that breaks be permitted every two hours. With cell phones in common use, they can be used by survey personnel to request restroom breaks, if needed before scheduled breaks. Survey personnel should be cautioned to stay hydrated, especially on hot days, but not to drink so much that frequent trips to restrooms are needed. They should be advised to have their cell phones fully charged when reporting to work, not only to request
51
restroom breaks, but also in the rare instance that a clarification is needed from the supervisor. They should also be advised that they are not to use their cell phones for non-work related uses (e.g., personal calls, texting, internet use, etc.) while at their count or interview location. Counters should be trained about the work they are to perform. Training should be completed prior to the survey and may require one-to-two hours. It can be beneficial to begin the first day’s survey an hour early to make sure the survey personnel are comfortable with their job before the survey period actually starts. On the first survey day, the supervisor should walk each counter to the assigned survey location. The supervisor should make clear what doors and movements are to be counted and where on the form each movement should be recorded (form for each counter should be set up in advance). The supervisor should ask each counter if he or she has any questions to ensure that instructions are clear. After the survey begins, the supervisor should circulate among the counters to check to see that counts are being made and recorded correctly. Common problems are line of sight obstructions (unanticipated or resulting because counter moved), inattention, recording counts in the wrong column, not keeping track of time, talking to another counter, and socializing with passersby. Interviews The survey supervisor should carefully recruit and select interviewers. Experienced professional interviewers are greatly preferred. The ideal interviewer is outgoing, assertive, willing to approach and talk to strangers, sounds professional, and understands the purpose and procedure for the interviews. The survey supervisor will need to train all survey personnel, but spend more time with the interviewers. It is recommended that each interviewer perform a few practice interviews under supervision prior to beginning the actual surveys. On the first survey day, the supervisor should walk each interviewer to the assigned interview location. The supervisor should make clear what doors and movements for which interviews are to be conducted and make clear where the inbound and outbound trips are to be recorded. If appropriate, the supervisor should also discuss the strategy for approaching people to interview, although this should have already been covered in training. The supervisor should ask each interviewer if he or she has any questions to make sure instructions are clear. Practice or test interviews are recommended. It may be beneficial to begin interviews an hour early the first shift worked by each interviewer to ensure that the interviewer is comfortable and approaching and interviewing people correctly. After the survey begins, the supervisor should circulate among the interviewers to check to see that candidate respondents are being approached professionally and that interviews are being conducted and recorded correctly. Common problems include:
• Shyness in approaching people to interview; • Not asking questions correctly or leading respondents by guessing answers for them; • Incomplete recording of responses;
52
• Not asking all questions; • Not keeping track of time; • Talking to another survey staff member; and • Socializing with passersby.
The selection of a representative and sufficient sample of workers, shoppers, visitors, and residents at the survey site is critical to the success of the survey. Therefore, the survey supervisor should closely monitor the real-time progress of the intercept surveys to make adjustments as necessary to achieve the representative and sufficient sample, keeping in mind the stated objectives for the data collection effort. This may require re-deployment of interviewers to different locations that have more activity or making other changes that will increase the number of usable interviews for each land use. Multimodal Cordon Counts One counter should be assigned responsibility for each cordon count location. Since the counter must be able to count not only vehicles (often by type), but also vehicle occupants as well as pedestrians and bicyclists, the counter will need to be close to where the cordon crossing is located. Ideally the counter can be immediately adjacent to the driveway, street, garage entrance, or other cordon location. In some cases, two adjacent cordon locations will be so close together that a single counter can count both with accuracy. In either case, each form or tablet should be set up specifically for the location(s) to be counted. A counter should only be assigned those movements to count that can easily be seen while looking in one direction. Requiring a counter to look in multiple directions will result in missed persons and vehicles crossing the cordon line. Counts should be made by 5- or 15-minute periods beginning on the hour or half hour when the survey starts. Counts should be made for the complete survey period. The survey supervisor should have extra personnel to provide short breaks for the counters to use restrooms. It is suggested that breaks be permitted every two hours. However, it is preferable to work as continuously as possible. Most survey personnel can work 3-4 hours without stopping. Cell phones can be used by survey personnel to request restroom breaks, if needed before scheduled breaks. Survey personnel should be cautioned to stay hydrated, especially on hot days, but not to drink so much that frequent trips to restrooms are needed. Counters should be trained on what they are to do. Training should be completed prior to the survey. On the first survey day, the supervisor should walk each counter to the assigned survey location. The supervisor should make clear what movements are to be counted and where on the form each movement should be recorded (form for each counter should be set up in advance). The supervisor should ask each counter if he or she has any questions to ensure that instructions are clear.
53
After the survey begins, the supervisor should circulate among the counters to check to see that counts are being made and recorded correctly. Common problems are line of sight obstructions (unanticipated or resulting because counter moved), inattention, recording counts in the wrong column, not keeping track of time, and socializing with passersby. Use of Electronic Recording Devices A number of electronic survey recording devices, including laptop computers and tablets can be used to record survey information. They can be successfully used for these counts and interviews, if they are set up in formats that are easily used. Straight-forward apps can be developed quite readily, but must be carefully and completely field tested before use. Otherwise an entire survey can be ruined. Formats that do not allow counters or interviewers both ease of use and logical positioning of responses only invite confusion and errors. For example, use of an electronic intersection turning movement count board for a door count where several doors are to be counted by one person will probably not present a logical input format and lead to errors. STEP 7H – SUPERVISE IN FIELD Survey supervisors should have a survey check procedure developed as part of the QA/QC procedure suggested at the beginning of this chapter. This procedure should be in place prior to training. The check procedure should include assignments of supervisors to check each counter and interviewer and how to perform the check. Supervisors should observe interviewers at work and suggest refinements in their approach and conduct of interviews. Spot checks of interview records should be made early in the first interview period to ensure that the responses are both logical and complete. Supervisors should understand that errors in procedure usually continue until corrected. If not corrected, interviews for an entire day could be lost as unusable. The same is true for counts. It is important for the supervisors to keep circulating among those being supervised. Even though the counts or interviews are being performed correctly, other supervisory needs may arise. Common needs include complaints from business or landlords wanting survey personnel to relocate or stop their survey, unexpected movements that are being missed by the survey, too much activity for one person to cover, “no” activity to count or interview, business opened or closed unexpectedly, and survey staffer unable to perform as needed. STEP 7I – CHECK DATA AFTER EACH PERIOD The survey supervisors should perform a check of the counts and interviews periodically when they are being conducted and immediately after each survey period. The check should be included in the QA/QC plan, but should generally include at least the following.
• Counts: o Count covers full period. o Inbound and outbound balances are logical.
54
o Variations by 5- or 15-minute period are logical. o Modal splits and vehicle type percentages are within the expected ranges. o Vehicle occupancies are in expected ranges. o For cordon counts, it is desirable to total the counts to see if they appear
reasonable, particularly the balances between inbound and outbound. o For door counts, for each land use, compare inbound and outbound totals to ensure
that the balance appears logical. o If discrepancies are found, determine if corrections can be made, and if not,
schedule a recount(s) as needed. • Interviews:
o Times of interviews are recorded. o Are responses within range of permitted choices (i.e., are codes consistent with
choices available)? o Are write-in responses complete and understandable? o If asked, destination for outbound trip is logical and mode fits origin-destination
pair. o Origin of inbound trip is logical for reported time of trip (i.e., was it really the
immediately prior trip?); is time reported for that trip logical for immediately prior trip?
o If asked, check response to whether a vehicle was available for trip; is it logical for reported mode of trip?
o Is mode of access to site logical given mode reported for these trips? o Where discrepancies or errors appear to exist, review forms with interviewer (call as
soon as possible while memory still clearest) to determine if corrections can be made or if interviews must be discarded. If necessary, repeat interviews where prior interviews had to be discarded.
After the survey has been completed in the field, the supervisor should complete the checking of all counts and interviews. Those that are unusable should be deleted. Erroneous counts should have been repeated. Small percentages of unusable interviews should be deleted. Large numbers should have been repeated.
55
PART D. SURVEY DATA REDUCTION After the surveys are completed, the next step is to enter the raw data into spreadsheets and to compile it to create a trip generation database. That database could then be used to (1) develop travel summaries for the survey sites, (2) combine those data with prior data for development of an expanded smart growth trip generation database, or (3) use the expanded data to develop enhanced methods to estimate smart growth trip generation. Part D describes how the first of these three actions can be accomplished. STEP 1 – SUMMARIZE CORDON COUNTS A cordon was established for each site to serve as a boundary across which all trips to and from survey sites were counted by 15-minute periods. Each building access point or path was to have been counted as a separate station. If the cordon station was a driveway, directional counts (i.e., inbound and outbound) were made of vehicles, vehicle occupants, bicyclists, and pedestrians (if any). Travel modes usually included in these counts are:
• Vehicle (including vehicle driver, vehicle passengers); vehicle types may also be counted; and
• Pedestrians (specific travel modes determined from interviews as applicable from the following choices):
o Walk; o Rail transit; o Bus rapid transit (BRT); o Bus; o Bicycle; o Parked off-site but drove; o Pick-up/drop-off; and o Other, if applicable.
Summarize each count to the desired survey periods, computing a separate summary for each count location. Summarize by travel mode for use in creating a complete cordon count by mode as well as expansion factors by interview location. STEP 2 – PROCESS INTERVIEW DATA INTERVIEWS AND DOOR COUNTS For each survey site, the analyst should determine the number of usable interviews. Under normal circumstances, 50 or more usable interviews should be available for each land use (100 desirable). In some cases, this will not be possible because the land use will not be active (e.g., retail closed during AM peak hour) or because the quantity of development in a land use category will be small. That number can be compared to the total door counts for the same period. The sampling percentages can be calculated by dividing the number of usable
56
interviews by the number of people counted in the same direction (inbound or outbound). The same can be performed for each land use by aggregating all establishments within specific land uses. EXPANSION FACTORS Since the interviews represent a sample, the next step is to compute a directional (inbound, outbound) expansion factor to expand the sample to represent the total for that universe. This can be accomplished in at least two ways.
• By land use; usually one building (normal approach): o Separate each interview record into individual trip records; there will be one or
two usable trips, potentially one inbound and one outbound if people are asked for trips in both directions (occurs most often when interviews can only be conducted in outbound direction), in each interview record depending on how many occurred during the survey period; only data for trips within the survey periods can be used;
o Aggregate by land use the numbers of inbound and outbound trips (aggregate to the interview end of the trip) reported during the survey period from those interviews; (TL for each direction);
o Aggregate door counts to the land use level (CL for each direction); o Determine number of DUs (e.g., GSF) covered by interviews and if any, the
number of DUs for which no interviews were conducted (in cases where interviews were conducted at only a sample portion of establishments within a given land use); calculate a sample percentage for each land use (S);
o The expansion factor (FL) for reported trips for each land use and each direction will be: FL = (CL/TL)/S; and
o Apply the directional land use expansion factor FL to each interview trip record. • By establishment within a single land use:
o Separate each interview record into individual directional trip records (inbound, outbound); there will be one or two usable trips in each interview record depending on how many occurred during the survey period;
o Aggregate by establishment the number of inbound and outbound trips (aggregate to the interview end of the trip) reported during the survey period from those interviews; this includes both trips reported in the interview if they were during the designated survey period (TE for each direction);
o Aggregate by establishment the door counts (CE for each direction); o For each establishment surveyed, compute the expansion factor to apply to trips
to and from that establishment; it will be the establishment’s directional door count divided by the establishments usable trips in the same direction (CE/TE);
o Determine the number of DUs (e.g., GSF) covered by interviews and the number of DUs for which no interviews were conducted (in cases where only a portion of establishments within a given land use were interviewed); calculate a sample percentage for each land use (SE);
57
o Apply the directional establishment’s expansion factor FL to each trip record for each establishment (Ei), then sum to aggregate the trips to the land use level, or FEi = (CEi/TEi)/SE; and
o Those expansion factors are then applied to the interview trip records for each surveyed establishment; the sum equals the total for that land use.
Thus, in a case in which 20 inbound trips were reported in interviews and there were 35 inbound persons counted at that location during the period, the expansion factor for each interview would be E = 35/20 (or 1.75). That factor would be applied to each interview at that location during that period to expand the sample to represent all trips during the period. Each expanded sample, whether directional or non-directional (that is determined based on survey purpose) is combined with all others at the site for the period and then summed over the complete survey period or peak hour, depending on the need. STEP 3 – DETERMINE TRIP GENERATION AND MODE SPLITS The next step is to apply the expansion factors for the interview data so they will represent all counted trips walked across the cordon line at each survey station and site. The expansion factor is then added to each interview trip record for that movement during that period. The factors are used to expand or multiply the interview data by that amount, or in the case of the example, responses from each interview at that location during that period are multiplied by 1.75. This will result in factored numbers of interviews equaling the corresponding peak hour counts at that location. This process is repeated for all walk access stations for a site. Adding the expanded interview data makes it possible to extract modal percentages for each direction (inbound and outbound) for each peak period. However, two additional computations must be added to obtain a finished mode split for each site and period. First, trips for which vehicles were driven but parked off-site must be converted to vehicle trips since the predominant mode was driving, not walking. Second, pick-up/drop-off trips must be changed from walk trips to two vehicle trips – one to and one from the site. In most cases the vehicle does not cross the site cordon, but again, the predominant mode of travel is a vehicle, not walking. Two vehicle trips must be added because a pick-up/drop-off trip consists of a trip to the site and another one away from the site, both generated by site activity. With these adjustments, the count and survey data yield (1) total vehicle trips plus total vehicle passenger trips (from vehicle occupancy counts), (2) total non-vehicle trips (remaining trips walked to and from the sites), and (3) percent of walk trips by the following actual modes:
• Walk; • Rail transit; • BRT;
58
• Bus; and • Bicycle.
Table 3 and Table 4 show examples of tables summarizing multimodal trip generation data. Table 3 shows person trips and trip generation rates per DU. This example shows non-directional trips (sum of both inbound and outbound), but could show inbound and outbound trips separately. Table 4 shows the percentage of trips by travel mode. Table 3. Sample Apartment Peak Hour Non-Directional Person Trips
Site Occupied DUs
AM Peak Hour Person Trips
PM Peak Hour Person Trips
Total Trips
Trip Rate Per DU
Total Trips
Trip Rate Per DU
Capitol Towers 192 69 0.36 91 0.47
LINQ Midtown Apartments 256 130 0.51 124 0.48
Avalon Walnut Creek 370 297 0.80 230 0.62
Eaves by Avalon 490 316 0.64 260 0.53
Park Regency 856 425 0.50 468 0.55
Avalon at Cahill Park 190 160 0.84 109 0.57
Villa Torino 187 128 0.68 127 0.68
Gardens at Wilshire Center 154 77 0.50 80 0.52
Wilshire Vermont Station 431 243 0.56 242 0.56
Acappella Pasadena Apartments 136 81 0.60 89 0.65
Pasadena Gateway Villas 128 52 0.41 46 0.36
The Stuart at Sierra Madre Villa 180 86 0.48 89 0.49
NoHo 14 173 68 0.39 110 0.64
Gallery at NoHo Commons 420 229 0.55 255 0.61
AMLI Warner Center 491 283 0.58 247 0.50
Alterra at Grossmont Trolley 286 142 0.50 209 0.73
59
Table 4. Sample Summary of Mode Splits and Vehicle Occupancies
Site AM Peak Hour Mode Shares AM Avg. Veh.
Occupancy PM Peak Hour Mode Shares PM Avg. Veh.
Occupancy Vehicle Walk Transit Bicycle Vehicle Walk Transit Bicycle
The objective is to determine the number of trips by mode for a typical weekday for the AM and PM peak hours of adjacent street traffic between the hours of 7-9 a.m. and 4-6 p.m. (periods that match those used to estimate vehicle trips using ITE definitions and procedures). This is another two-step process: (1) determine the peak hour (60 consecutive minutes) between 7-9 a.m. and 4-6 p.m. for each site, then sum the 15-minute cordon counts for each peak hour, and (2) multiply the non-vehicle mode split percentages times the adjusted peak hour non-vehicle trip counts. This will produce AM and PM street peak hour inbound and outbound person trips by mode. This is performed separately for each site. EXCEPTION – SURVEY SITE WITH SHARED PARKING WITH OTHER ON-SITE LAND USES The previous steps are used for sites that have adequate on-site parking and no on-site shared parking that serves other nearby sites. For sites that use shared on-site parking, the above process cannot isolate all of the site’s trips in the same manner. For those sites, a similar, but different, process can be used with similar counts and the same interviews. The only way to fully isolate trips to and from the survey sites using on-site shared parking is to (1) count all people entering and leaving the survey building (all should be on foot) and (2) interview as many as possible at all access points. This method relies on interviews to establish travel by all modes, including those by vehicle. That means that Step 2 is used to determine mode splits by all modes rather than just the non-vehicle modes.