19
CAN FD System Design International CAN Conference 2015, Vienna Dr.–Ing. Marc Schreiner – Daimler AG

CAN FD System Design
International CAN Conference 2015, Vienna
Dr.–Ing. Marc Schreiner – Daimler AG
Overview:
• Acquisition and assessment of CAN FD signals
• Determination of a safe operation area for CAN FD topologies
• Typical characteristics of CAN FD topologies:
− Point to point link
− Line topology
− Bus topology with stubs
− Star topology
CAN FD System Design
Marc Schreiner, International CAN Conference 2015, Vienna2
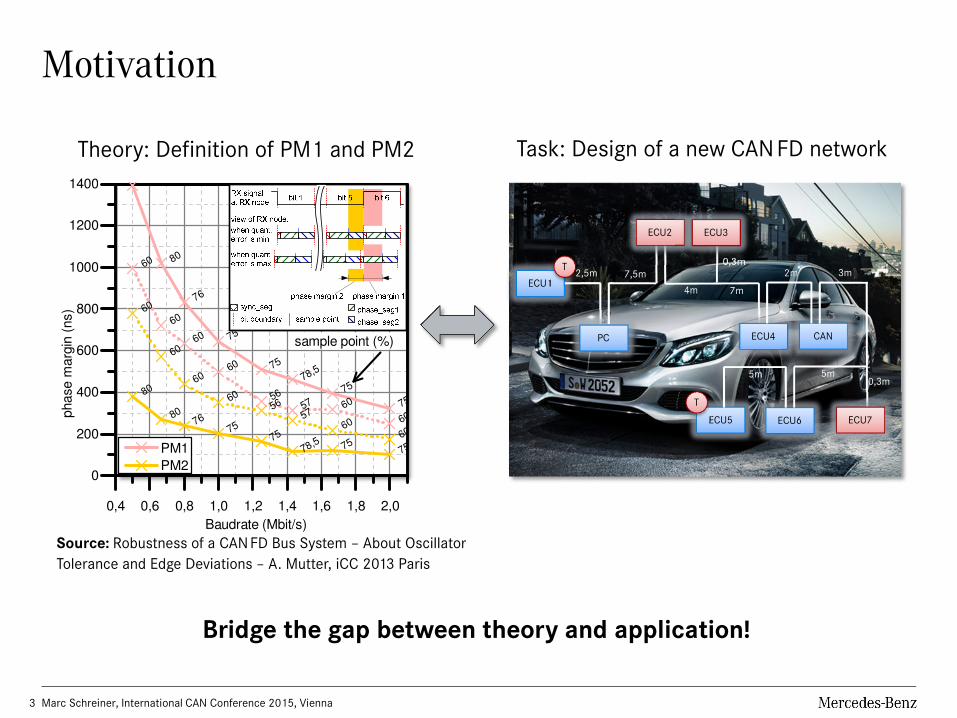
Motivation
0,4 0,6 0,8 1,0 1,2 1,4 1,6 1,8 2,0
0
200
400
600
800
1000
1200
1400
7575
78,575
75
76
80
80
757578,5
7575
7680
80
606057
56
60
60
60
60
6060
5756
60
60
60
60
phase m
arg
in (
ns)
Baudrate (Mbit/s)
PM1
PM2
sample point (%)
Marc Schreiner, International CAN Conference 2015, Vienna3
Bridge the gap between theory and application!
Theory: Definition of PM1 and PM2
Source: Robustness of a CAN FD Bus System – About Oscillator
Tolerance and Edge Deviations – A. Mutter, iCC 2013 Paris
Task: Design of a new CAN FD network
ECU1
T
ECU5
4m
2,5m
PC
7,5m
7m
0,3m
ECU4
2m
CAN
3m
ECU7ECU6
5m5m0,3m
T
ECU2 ECU3
TX
TX
TX
TX
TX
TX
TX
TX
RX
RX
RX
RX
RX
RX
RX
RX
µC
µC
µC
µC
CAN_H
CAN_H
CAN_H
CAN_H
CAN_L
CAN_L
CAN_L
CAN_L
CAN topologyunder test
CAN node 1 CAN node 1
CAN node n-1CAN node n
scope Tx1 (trigger)
scope bus 1 scope bus 2scope RX1 scope RX2
SE
SE
SE
SE
diff
diff
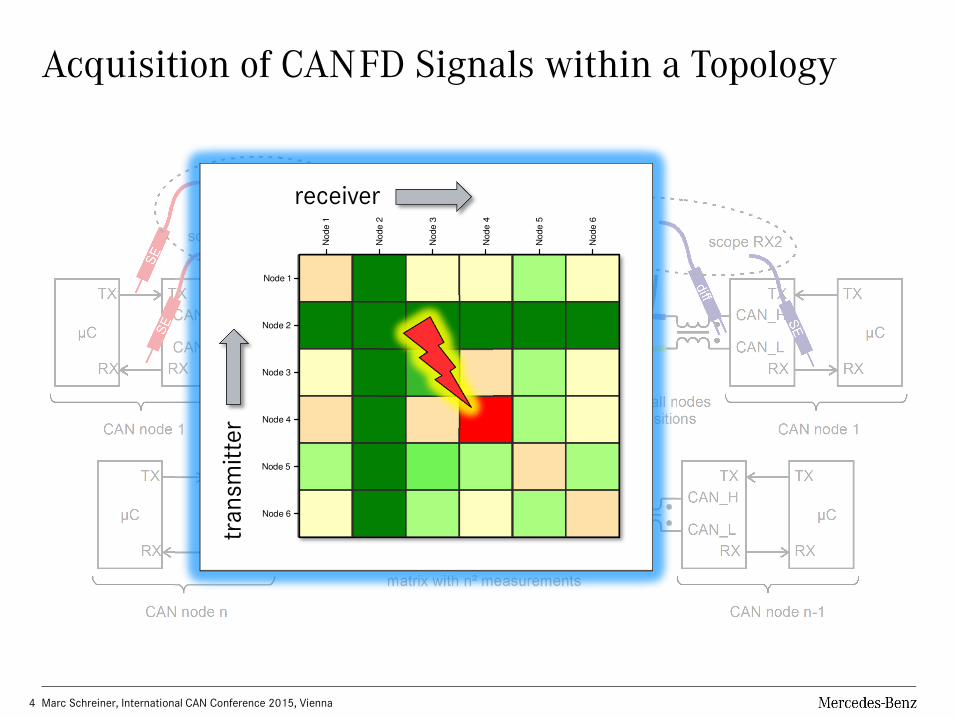
trigger once at all nodes
measure once at all nodesfor all trigger positions
result:matrix with n² measurements
Acquisition of CAN FD Signals within a Topology
Marc Schreiner, International CAN Conference 2015, Vienna4
Nod
e 1
Nod
e 2
Nod
e 3
Nod
e 4
Nod
e 5
Nod
e 6
Node 6
Node 5
Node 4
Node 3
Node 2
Node 1
receiver
tran
smit
ter
receiver
tran
smit
ter
Node
1
Node
2
Node
3
Node
4
Node
5
Node
6
Node 6
Node 5
Node 4
Node 3
Node 2
Node 1
0
1
2
3
4
71,50µ 71,75µ 72,00µ 72,25µ 72,50µ 72,75µ 73,00µ 73,25µ 73,50µ 73,75µ
-1
0
1
2
3
RX
/ T
X s
ign
al (V
)
logic transmitted TX
logic received RX
500mV
diffe
ren
tia
l b
us s
ign
al (V
)
differential bus signal at receiver
0.5V/0.9V transceiver thresholds
900mV
t(s)
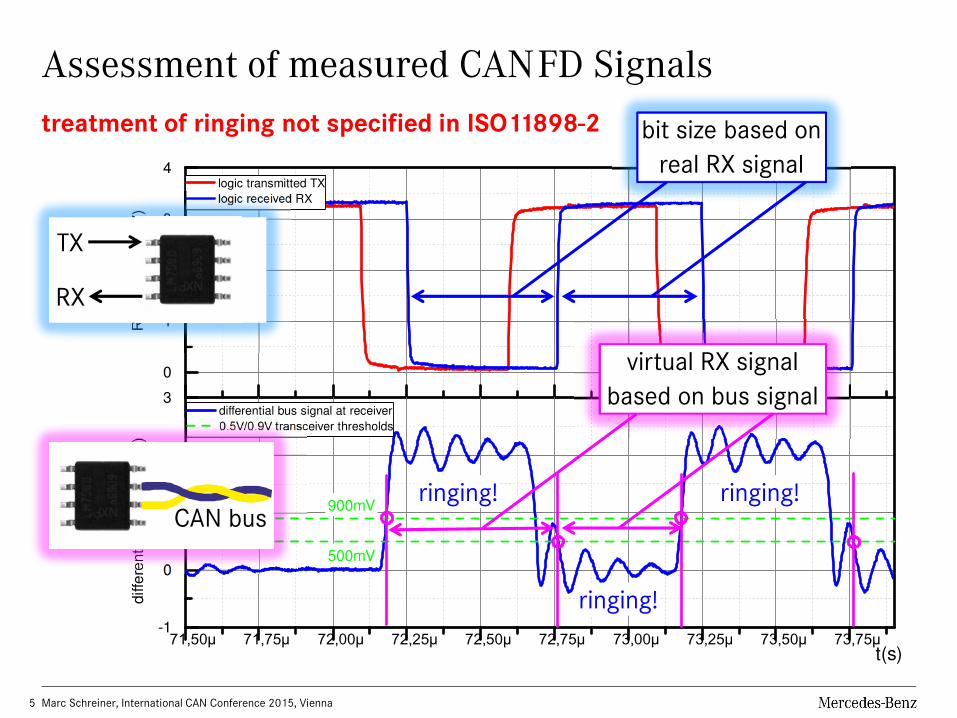
Assessment of measured CAN FD Signals
Marc Schreiner, International CAN Conference 2015, Vienna5
RX
TX
CAN busringing!
virtual RX signal
based on bus signal
bit size based on
real RX signal
treatment of ringing not specified in ISO11898-2
ringing!
ringing!
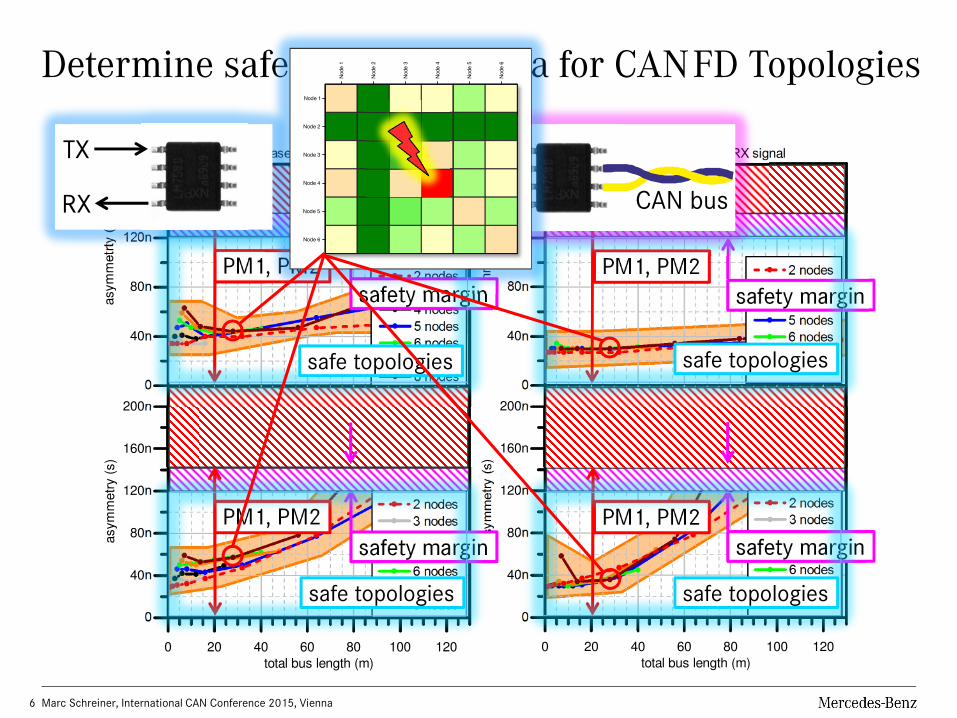
Determine safe Operation Area for CAN FD Topologies
Marc Schreiner, International CAN Conference 2015, Vienna6
0
40n
80n
120n
160n
2 nodes
3 nodes
4 nodes
5 nodes
6 nodes
7 nodes
8 nodes
asym
metr
ty (
s)
loopback signal
0 20 40 60 80 100 120
0
40n
80n
120n
160n
200ncommunication
between nodes
asym
metr
y (
s)
total bus length (m)
2 nodes
3 nodes
4 nodes
5 nodes
6 nodes
7 nodes
8 nodes
0
40n
80n
120n
160n
2 nodes
3 nodes
4 nodes
5 nodes
6 nodes
7 nodes
8 nodes
asym
metr
ty (
s)
loopback signal
0 20 40 60 80 100 120
0
40n
80n
120n
160n
200ncommunication between nodes
asym
metr
y (
s)
total bus length (m)
2 nodes
3 nodes
4 nodes
5 nodes
6 nodes
7 nodes
8 nodes
evaluation based on real RX signal evaluation based on virtual RX signal
PM1, PM2 PM1, PM2
PM1, PM2 PM1, PM2
safety marginsafety margin
safety margin safety margin
safe topologies
safe topologies safe topologies
safe topologies
RX
TX
CAN bus
Node
1
Node
2
Node
3
Node
4
Node
5
Node
6
Node 6
Node 5
Node 4
Node 3
Node 2
Node 1
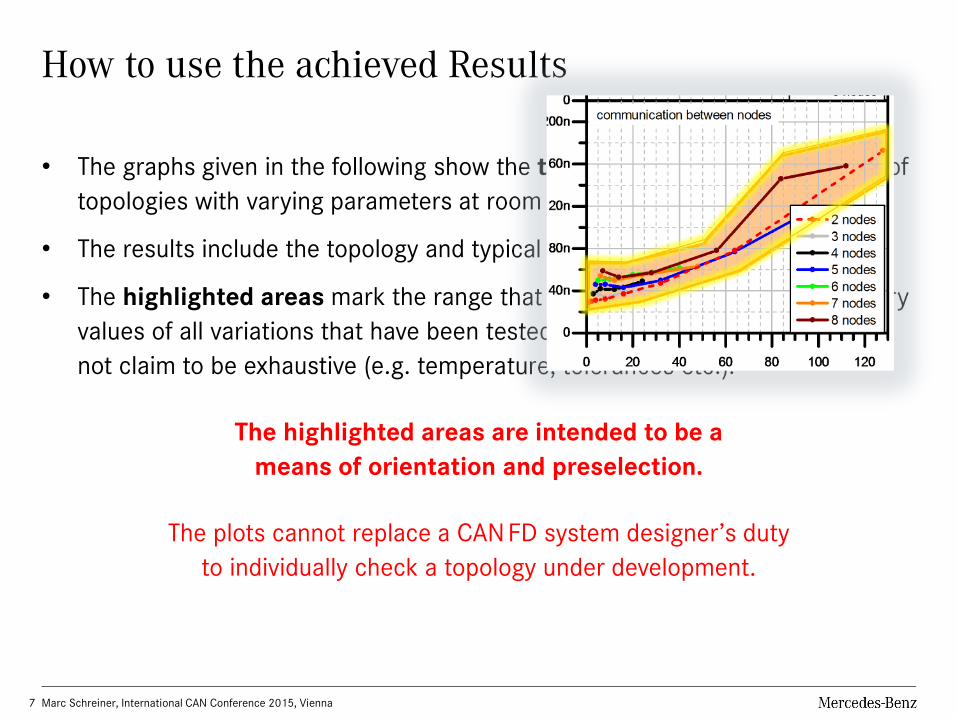
How to use the achieved Results
• The graphs given in the following show the typical characteristics of a set of
topologies with varying parameters at room temperature.
• The results include the topology and typical transceivers.
• The highlighted areas mark the range that contains all measured asymmetry
values of all variations that have been tested. These experimental results do
not claim to be exhaustive (e.g. temperature, tolerances etc.).
The highlighted areas are intended to be a
means of orientation and preselection.
The plots cannot replace a CAN FD system designer’s duty
to individually check a topology under development.
Marc Schreiner, International CAN Conference 2015, Vienna7
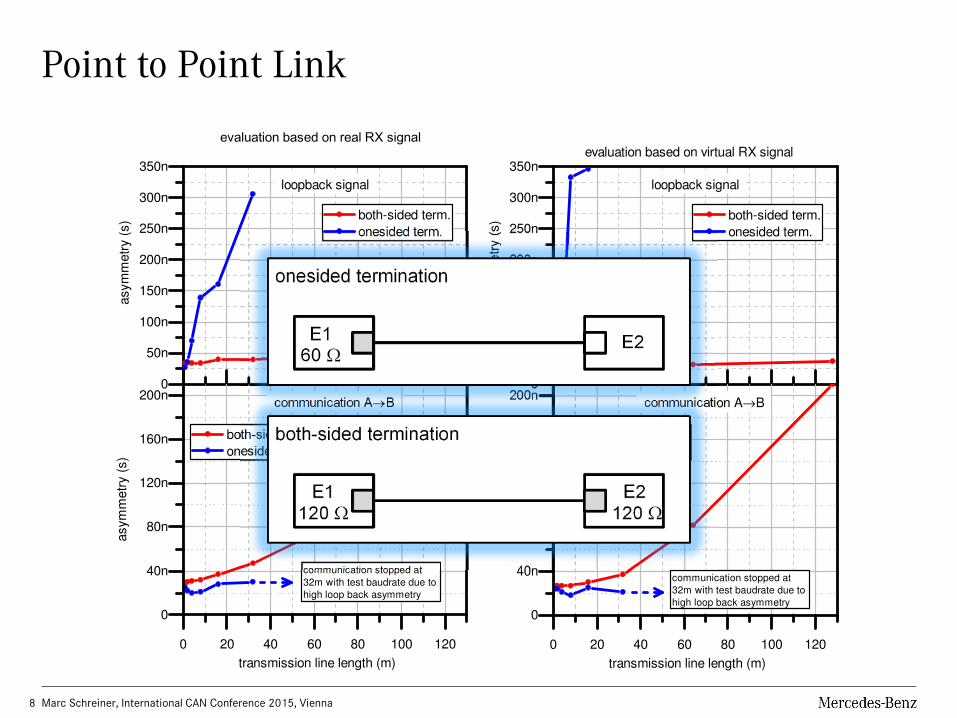
Point to Point Link
evaluation based on virtual RX signal
0
50n
100n
150n
200n
250n
300n
350n
both-sided term.
onesided term.
asym
metr
y (
s)
0 20 40 60 80 100 120
0
40n
80n
120n
160n
200n
both-sided term.
onesided term.
communication A→B
loopback signal
asym
metr
y (
s)
transmission line length (m)
communication stopped at
32m with test baudrate due to
high loop back asymmetry
0
50n
100n
150n
200n
250n
300n
350n
both-sided term.
onesided term.
asym
metr
y (
s)
0 20 40 60 80 100 120
0
40n
80n
120n
160n
200n
both-sided term.
onesided term.
communication A→B
loopback signal
asym
metr
y (
s)
transmission line length (m)
communication stopped at
32m with test baudrate due to
high loop back asymmetry
evaluation based on real RX signal
Marc Schreiner, International CAN Conference 2015, Vienna8
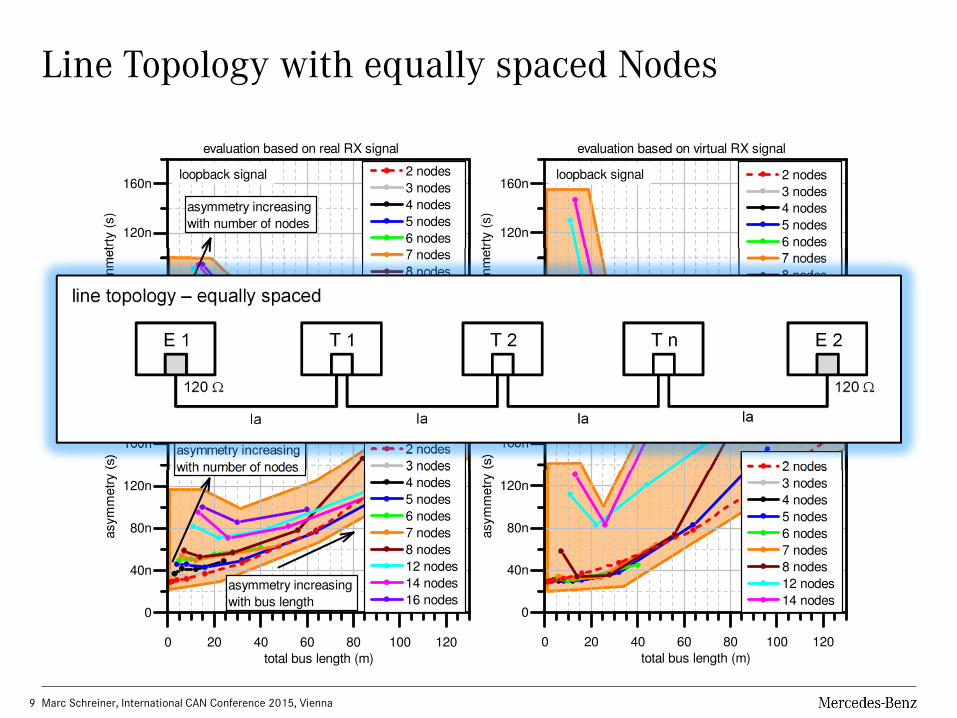
Line Topology with equally spaced Nodes
Marc Schreiner, International CAN Conference 2015, Vienna9
0
40n
80n
120n
160n 2 nodes
3 nodes
4 nodes
5 nodes
6 nodes
7 nodes
8 nodes
12 nodes
14 nodes
asym
metr
ty (
s)
loopback signal
0 20 40 60 80 100 120
0
40n
80n
120n
160n
200ncommunication
between nodes
asym
metr
y (
s)
total bus length (m)
2 nodes
3 nodes
4 nodes
5 nodes
6 nodes
7 nodes
8 nodes
12 nodes
14 nodes
0
40n
80n
120n
160n
asymmetry increasing
with number of nodes
2 nodes
3 nodes
4 nodes
5 nodes
6 nodes
7 nodes
8 nodes
12 nodes
14 nodes
16 nodes
asym
metr
ty (
s)
loopback signal
0 20 40 60 80 100 120
0
40n
80n
120n
160n
200n
asymmetry increasing
with bus length
communication between nodes
asym
metr
y (
s)
total bus length (m)
2 nodes
3 nodes
4 nodes
5 nodes
6 nodes
7 nodes
8 nodes
12 nodes
14 nodes
16 nodes
asymmetry increasing
with number of nodes
evaluation based on real RX signal evaluation based on virtual RX signal
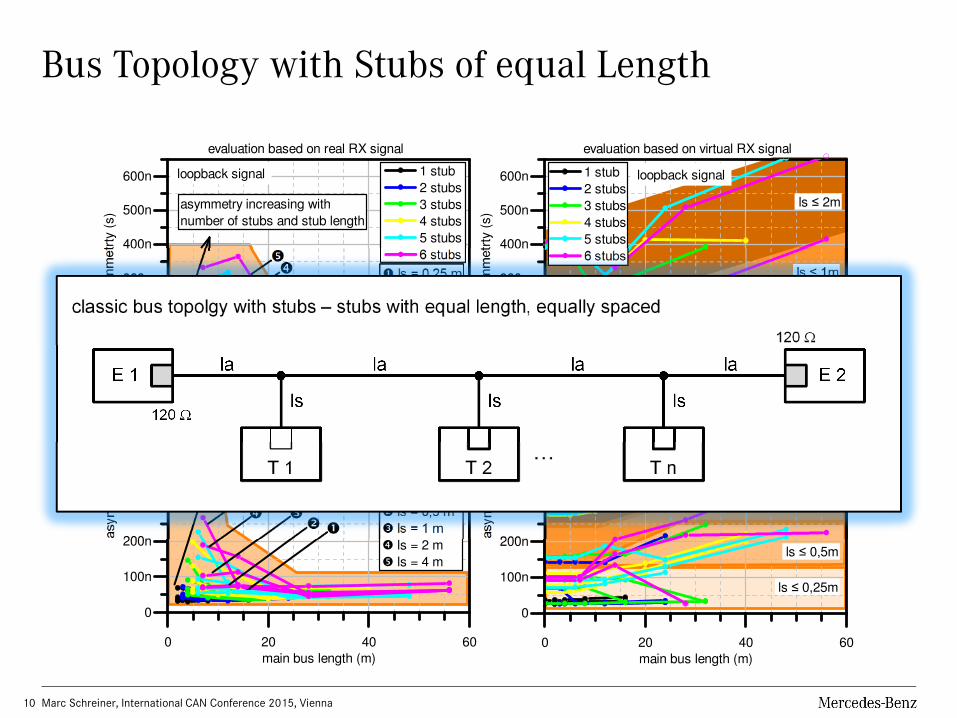
Bus Topology with Stubs of equal Length
0
100n
200n
300n
400n
500n
600n
ls ≤ 0,25m
ls ≤ 0,5m
ls ≤ 1m
ls ≤ 2m
ls ≤ 2m
ls ≤ 1m
ls ≤ 0,5m
ls ≤ 0,25m
loopback signal 1 stub
2 stubs
3 stubs
4 stubs
5 stubs
6 stubs
asym
metr
ty (
s)
0 20 40 60
0
100n
200n
300n
400n
500n
600n communication between nodes
asym
metr
y (
s)
main bus length (m)
1 stub
2 stubs
3 stubs
4 stubs
5 stubs
6 stubs
0
100n
200n
300n
400n
500n
600n
��
�� ls = 0,25 m
� ls = 0,5 m
� ls = 1 m
� ls = 2 m
� ls = 4 m
�
asymmetry increasing with
number of stubs and stub length
1 stub
2 stubs
3 stubs
4 stubs
5 stubs
6 stubs
asym
metr
ty (
s)
loopback signal
�
0 20 40 60
0
100n
200n
300n
400n
500n
600n
asym
metr
y (
s)
main bus length (m)
1 stub
2 stubs
3 stubs
4 stubs
5 stubs
6 stubs
communication between nodes
�� �
� �
� ls = 0,25 m
� ls = 0,5 m
� ls = 1 m
� ls = 2 m
� ls = 4 m
asymmetry increasing with
number of stubs and stub length
evaluation based on real RX signal evaluation based on virtual RX signal
Marc Schreiner, International CAN Conference 2015, Vienna10
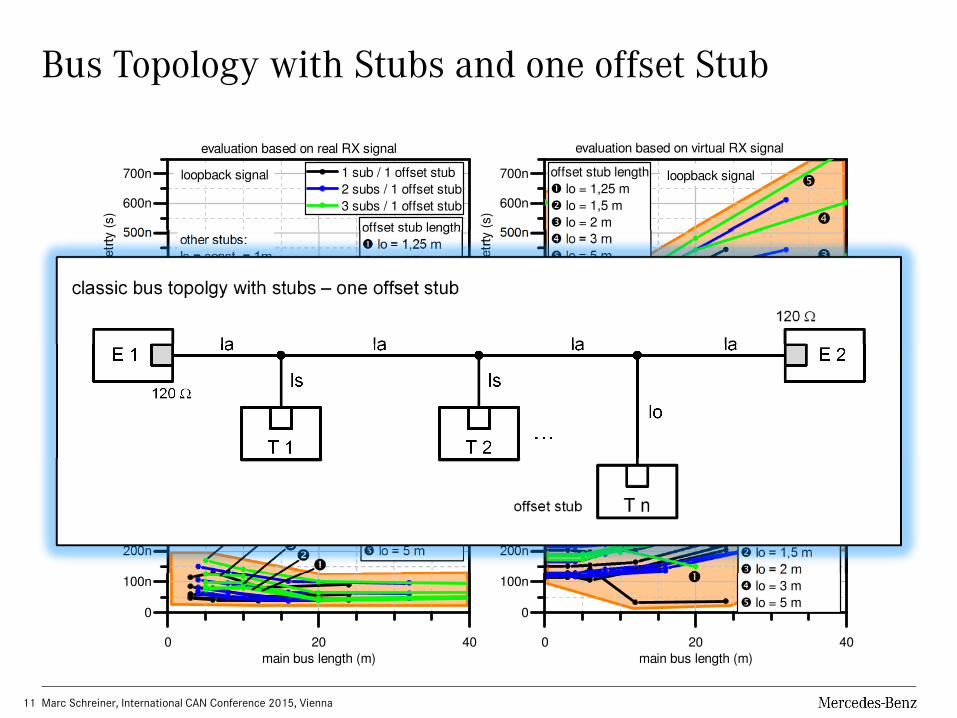
Bus Topology with Stubs and one offset Stub
0
100n
200n
300n
400n
500n
600n
700n offset stub length
� lo = 1,25 m
� lo = 1,5 m
� lo = 2 m
� lo = 3 m
� lo = 5 m
1 sub / 1 offset stub
2 subs / 1 offset stub
3 subs / 1 offset stubls = const. = 1m
loopback signal
asym
metr
ty (
s)
�
�
�
�
�
�
�
�
�
�
0 20 40
0
100n
200n
300n
400n
500n
600n
700n
offset stub length
� lo = 1,25 m
� lo = 1,5 m
� lo = 2 m
� lo = 3 m
� lo = 5 m
ls = const. = 1m
asym
metr
y (
s)
main bus length (m)
1 sub / 1 offset stub
2 subs / 1 offset stub
3 subs / 1 offset stub
communication between nodes0
100n
200n
300n
400n
500n
600n
700n loopback signal 1 sub / 1 offset stub
2 subs / 1 offset stub
3 subs / 1 offset stub
��
�
asym
metr
ty (
s)
offset stub length
� lo = 1,25 m
� lo = 1,5 m
� lo = 2 m
� lo = 3 m
� lo = 5 m
�
�
��
�
�
�
��
�
�
�
other stubs:
ls = const. = 1m
0 20 40
0
100n
200n
300n
400n
500n
600n
700n
offset stub length
� lo = 1,25 m
� lo = 1,5 m
� lo = 2 m
� lo = 3 m
� lo = 5 m
other stubs:
ls = const. = 1m
communication between nodes
asym
metr
y (
s)
main bus length (m)
1 sub / 1 offset stub
2 subs / 1 offset stub
3 subs / 1 offset stub
evaluation based on real RX signal evaluation based on virtual RX signal
Marc Schreiner, International CAN Conference 2015, Vienna11
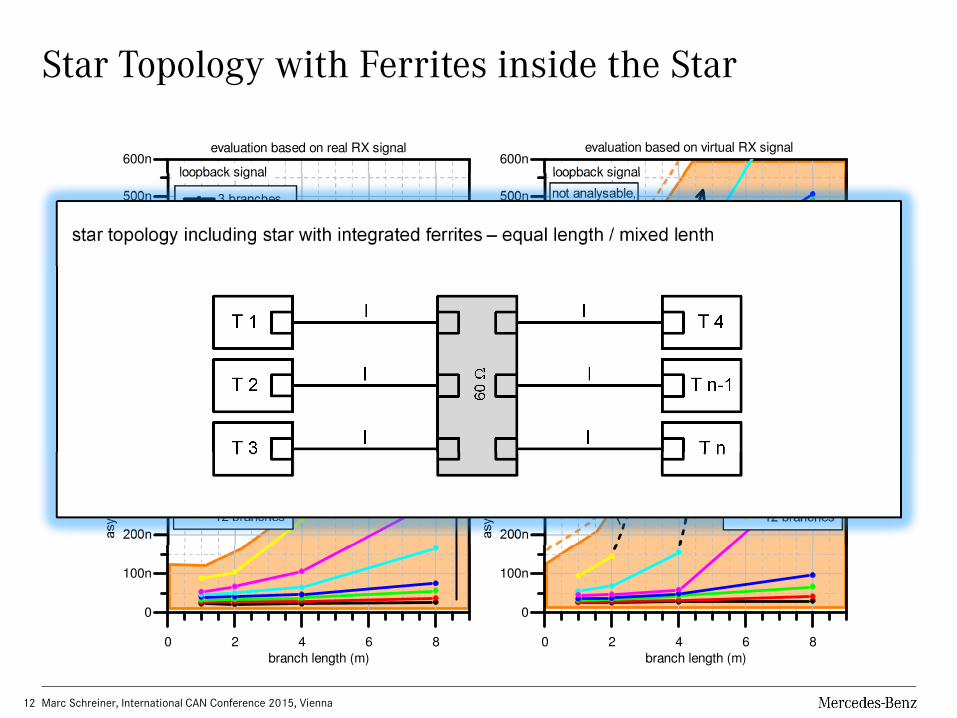
Star Topology with Ferrites inside the Star
0
100n
200n
300n
400n
500n
600n
3 branches
4 branches
5 branches
6 branches
7 branches
8 branches
12 branches
asym
metr
ty (
s)
loopback signal
not analysable,
ringing > tBit
not analysable,
ringing > tBit
0 2 4 6 8
0
100n
200n
300n
400n
500n
communication between nodes
asym
metr
y (
s)
branch length (m)
3 branches
4 branches
5 branches
6 branches
7 branches
8 branches
12 branches
0
100n
200n
300n
400n
500n
600n
low loopback asymmetry
3 branches
4 branches
5 branches
6 branches
7 branches
8 branches
12 branchesasym
metr
ty (
s)
loopback signal
asymmetry increasing
with number of branches
0 2 4 6 8
0
100n
200n
300n
400n
500n
communication between nodes
asym
metr
y (
s)
branch length (m)
3 branches
4 branches
5 branches
6 branches
7 branches
8 branches
12 branches
evaluation based on real RX signal evaluation based on virtual RX signal
Marc Schreiner, International CAN Conference 2015, Vienna12
CAN FD System Design – Conclusion
A workflow for the assessment of CANFD topologies has been presented.
The maximum asymmetry of various CAN FD topologies has been compared,
based on the logic RX signal and on the signal quality on the bus lines.
Point to point link and line topology:
• most suitable for high communication speeds, very low ringing
• lowest risks for signal integrity issues
Bus topology with stubs:
• trade-offs have to be made for higher communication speeds
• ringing on the bus lines causes risks for signal integrity issues
• if stubs are needed they should be as short as possible
Star topology (star including ferrites):
• only suitable for high communication speed if branches are very short
Marc Schreiner, International CAN Conference 2015, Vienna13

CAN FD System Design
International CAN Conference 2015, Vienna
Dr.–Ing. Marc Schreiner – Daimler AG
Backup
• Exemplary signal shapes
• Safety margin
Marc Schreiner, International CAN Conference 2015, Vienna15
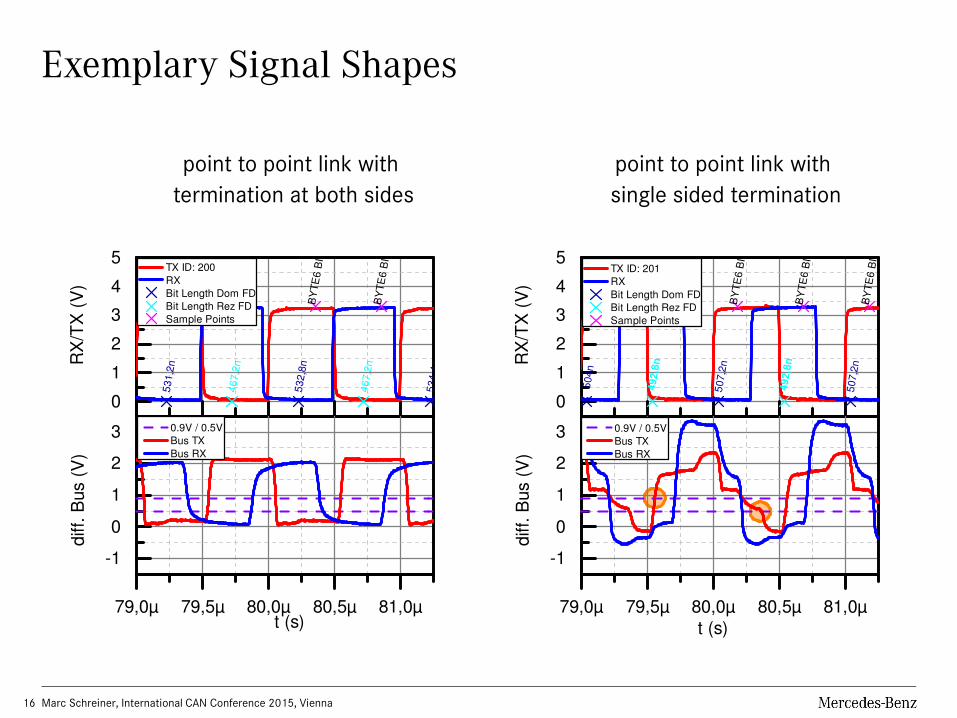
Exemplary Signal Shapes
Marc Schreiner, International CAN Conference 2015, Vienna16
0
1
2
3
4
5
79,0µ 79,5µ 80,0µ 80,5µ 81,0µ
-1
0
1
2
3
504
n
507,2
n
507,2
n
492,8
n
492,8
n
BY
TE
6 B
IT5
BY
TE
6 B
IT4
BY
TE
6 B
IT3
BY
TE
6 B
IT2
BY
TE
6 B
IT1
RX
/TX
(V
)
TX ID: 201
RX
Bit Length Dom FD
Bit Length Rez FD
Sample Points
diff.
Bus (
V)
t (s)
0.9V / 0.5V
Bus TX
Bus RX
0
1
2
3
4
5
79,0µ 79,5µ 80,0µ 80,5µ 81,0µ
-1
0
1
2
3
531,2
n
532,8
n
534,4
n
467,2
n
467,2
n
BY
TE
6 B
IT5
BY
TE
6 B
IT4
BY
TE
6 B
IT3
BY
TE
6 B
IT2
RX
/TX
(V
)
TX ID: 200
RX
Bit Length Dom FD
Bit Length Rez FD
Sample Points
diff.
Bus (
V)
t (s)
0.9V / 0.5V
Bus TX
Bus RX
point to point link with
single sided termination
point to point link with
termination at both sides
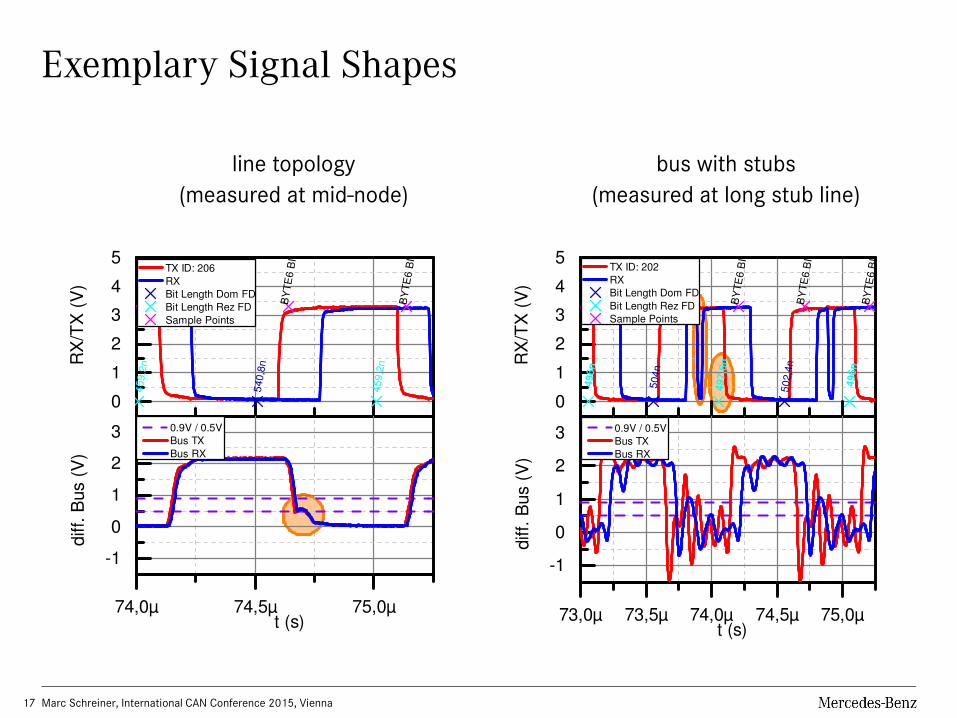
Exemplary Signal Shapes
Marc Schreiner, International CAN Conference 2015, Vienna17
0
1
2
3
4
5
74,0µ 74,5µ 75,0µ
-1
0
1
2
3
540,8
n
459,2
n
459,2
n
BY
TE
6 B
IT2
BY
TE
6 B
IT1
BY
TE
6 B
IT0
RX
/TX
(V
)
TX ID: 206
RX
Bit Length Dom FD
Bit Length Rez FD
Sample Points
diff.
Bus (
V)
t (s)
0.9V / 0.5V
Bus TX
Bus RX
bus with stubs
(measured at long stub line)
line topology
(measured at mid-node)
0
1
2
3
4
5
73,0µ 73,5µ 74,0µ 74,5µ 75,0µ
-1
0
1
2
3
504n
502,4
n
496n
49
7,6
n
496n
BY
TE
6 B
IT4
BY
TE
6 B
IT3
BY
TE
6 B
IT2
BY
TE
6 B
IT1
BY
TE
6 B
IT0
RX
/TX
(V
)
TX ID: 202
RX
Bit Length Dom FD
Bit Length Rez FD
Sample Points
diff.
Bus (
V)
t (s)
0.9V / 0.5V
Bus TX
Bus RX
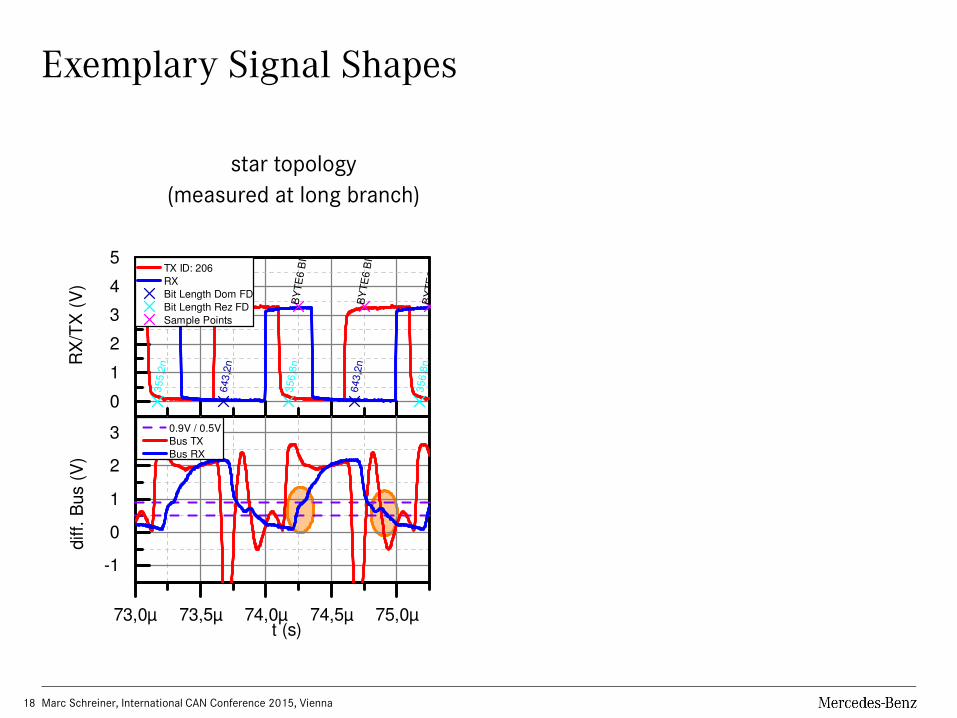
Exemplary Signal Shapes
Marc Schreiner, International CAN Conference 2015, Vienna18
0
1
2
3
4
5
73,0µ 73,5µ 74,0µ 74,5µ 75,0µ
-1
0
1
2
3
643,2
n
643,2
n
355,2
n
356,8
n
356,8
n
BY
TE
6 B
IT4
BY
TE
6 B
IT3
BY
TE
6 B
IT2
BY
TE
6 B
IT1
BY
TE
6 B
IT0
RX
/TX
(V
)
TX ID: 206
RX
Bit Length Dom FD
Bit Length Rez FD
Sample Points
diff.
Bus (
V)
t (s)
0.9V / 0.5V
Bus TX
Bus RX
star topology
(measured at long branch)
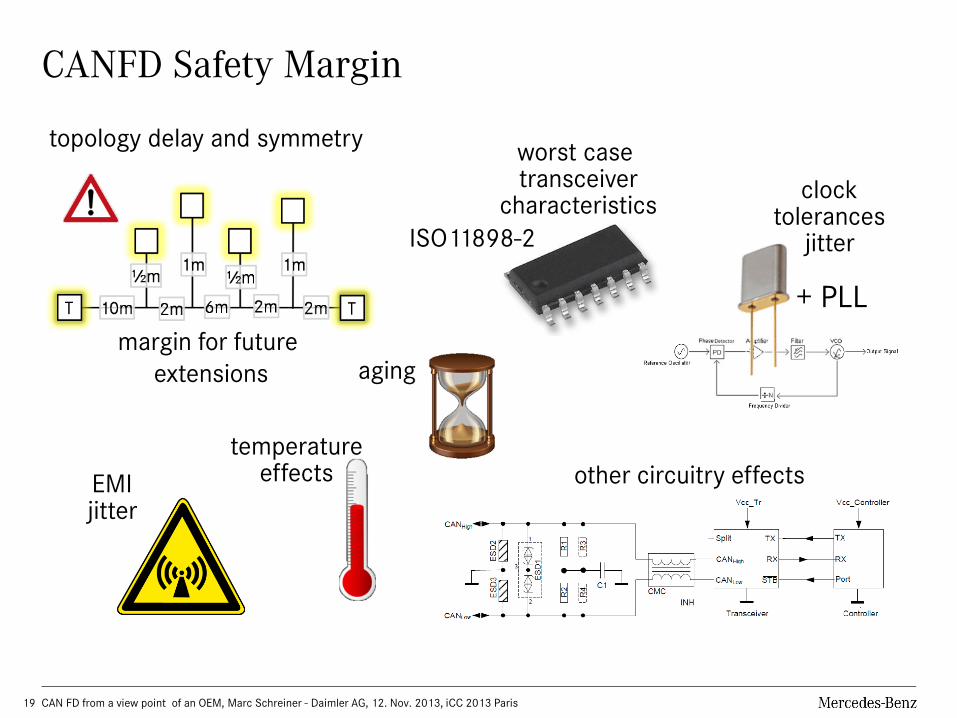
CANFD Safety Margin
CAN FD from a view point of an OEM, Marc Schreiner - Daimler AG, 12. Nov. 2013, iCC 2013 Paris19
topology delay and symmetryworst case transceiver
characteristicsclock
tolerancesjitter
EMIjitter
margin for future
extensions
+ PLL
temperatureeffects other circuitry effects
aging
ISO11898-2


