j ourna l homepage: www.e lsev ie r .com/ locate / jcorpf in
Can firms learn by observing? Evidence fromcross-border M&As
Bill B. Francis a, Iftekhar Hasan b, Xian Sun c,⁎, Maya Waisman d
a Rensselaer Polytechnic Institute, 110 8th Street, Pittsburgh Building, Troy, NY 12180-3590, United Statesb Fordham University and Bank of Finland, 5 Columbus Circle, 11th Floor, New York, NY 10019, United Statesc Johns Hopkins University, 100 N. Charles Street, Baltimore, MD 21201, United Statesd Fordham University, 5 Columbus Circle, 13th Floor, New York, NY 10019, United States
a r t i c l e i n f o
⁎ Corresponding author.E-mail addresses: [email protected] (B.B. Francis), ih
Article history:Received 21 June 2010Received in revised form 21 November 2013Accepted 23 November 2013Available online 11 December 2013
In the presence of high uncertainty and limited experience, can observing the actions ofother acquiring predecessors help firms make better acquisition decisions? Using a sample ofcross-border M&As conducted by US acquirers in developing countries, we document apositive and significant relationship between an acquirer's performance and its predecessors'acquisition activity. This relationship is especially pronounced in the prevalence of newsevents about the outcome of predecessors' acquisitions, when predecessors consist of US peersfrom the same industry and/or when targets are based in culturally distant countries. Ourfindings shed light on one channel through which information spillovers across industries andacquiring firms could be a key driver of value creation in developing market cross-borderM&As.
Learning by observing the actions of others is a common strategic behavior in the mergers and acquisitions (M&A) market. Forinstance, Haunschild (1993, 1994), and Westphal et al. (2001) find that firms rely on their board interlocks in other acquiringfirms for information on how much to pay for targets; Haunschild and Miner (1997) find that firms hire acquisition advisorsbased on the frequency their large and successful peers have used them in the past; Baum et al. (2000) report that Ontario nursinghome chains tend to acquire targets near those of their counterparts' recent target locations; Yang and Hyland (2006) find that USpublic firms in the financial service industry are more likely to engage in unrelated acquisitions if their competitors undertakemore unrelated acquisitions as well; Almazan et al. (2010) find that firms located within industry clusters make moreacquisitions; and DeLong and DeYoung (2007), and Cai et al. (2011) document evidence consistent with industry-wideinformation spillovers aroundM&A deals and acquisition bids, respectfully. While academics have long been aware of information
203B.B. Francis et al. / Journal of Corporate Finance 25 (2014) 202–215
spillovers across firms and industries in the context of M&As (see, e.g., Griliches, 1979), we know very little about whether suchobservational learning has a real effect on the performance of acquiring firms.1
In this study, we look at a sample of developing country, cross-border M&As to examine whether the past acquisitionexperience of other firms in the same target country plays a role in explaining the performance of US acquiring companies.Compared to acquisitions in large and established developed markets, the limited experience and exposure to external learningsources, as well as the high level of uncertainty, complexity and heterogeneity in the acquisition process, make developingcountry cross-border M&As an ideal laboratory to study the effect of learning from predecessors on the success of mergers andacquisitions (Zollo and Singh, 2004).
We specifically ask whether controlling for country and deal characteristics, as well as an acquirer's own acquisitionexperience, firms can learn how to better plan and execute mergers by observing their predecessors' previous mergers, andwhether investors can learn how to better value cross-border, developing country mergers as they observe and evaluate more ofthem. There are numerous channels through which useful information can spill over from one company or industry to another,including relationships with consulting firms, underwriters and M&A advisors (Haunschild and Miner, 1997; Ofek, and Sarvary,2001), industry networks (Almeida and Kogut, 1999; Irwin and Klenow, 1996), membership in interlocking boards (Haunschild,1993, 1994; Haunschild and Beckman, 1998; Westphal et al., 2001) or geographic proximity between firms (e.g., Almazan et al.,2010; Choi et al., 2010; DeLong, 2001; and Kedia et al., 2008). If information spillovers from the acquisition activity of others cantranslate into learning gains and reduce the bargaining and transaction costs associated with the high information asymmetry indeveloping market countries, the effort to structure learning processes within organizations could be a key driver of valuecreation.
To examine whether learning from other acquirers matters in the success of mergers and acquisitions, we rely upon theexisting literature to construct measures of three fundamental facets of learning. We start with frequency based learning (see, e.g.,DeLong and DeYoung, 2007), where firms execute practices previously used by large numbers of other organizations, and proxyfor such learning by the number of past acquisition deals made by other acquirers in the same target country. We then measuretrait based learning (Bala and Goyal, 1998), where firms use practices previously used by other similar organizations with mutualtraits, such as industry and country of origin. We specifically measure such learning by the number of past acquisition dealsconducted by same industry and/or US origin predecessors. Finally, we consider outcome based learning (Bikhchandani et al.,1998) in which firms imitate the practices that appear to have had good outcomes for other organizations in the past and avoidpractices with bad outcomes. To account for such learning, we measure the number of financial press releases about the outcomeof past M&A deals in the target's country of origin. To the extent that qualitative information about the acquisition outcome ofpredecessors becomes especially crucial in developing markets, where cultural distance and weaker freedom of press makeinformation about the local legal, political and economic environment more difficult to evaluate, we expect such information to bepositively associated with a firm's acquisition performance.2
To determine the effect of observational learning on an acquirer's accounting profitability, long- and short-term stock returns,and likelihood of deal completion, our proxies for acquisition performance, we start with a sample of 317 cross-borders,developing market transactions made by non-financial, US public firms during 1993–2010. In determining developing marketaffiliation, we follow the International Monetary Fund classifications, and collect information on 43 non-advanced marketacquisitions.3 Controlling for acquirer, target country and deal characteristics, we then document several striking results.
First, we find a positive relationship between the likelihood of deal completion and learning from the past acquisitionexperience of industry peers, especially if they are based in the US. This is consistent with the arguments in Almazan et al. (2010)and Guillén (2002) that under uncertainty, economic agents learn most effectively from the experience of their peers andneighbors in guiding their decision making. While the effect of the overall number of prior acquisitions is positively associatedwith the likelihood of deal completion, its magnitude is only marginally significant, indicating that the decision on whether tocomplete an acquisition is mainly driven by the actions of similar trait acquirers.
Second, we examine whether learning by observing affects an acquirer's post-merger accounting performance. While marketreturns predict investor future expectations, measuring long run, post-merger accounting performance allows us to captureactual financial performance over a relatively long period of time. Again, we document a positive and significant relationshipbetween the number of acquisitions conducted by industry peers, especially those based in the US, and the average, industryadjusted change in operating performance following the acquisition event. The effect of learning from others on an acquirer'spost-merger operating performance is both statistically significant and economically meaningful, and can be as high as 5.6%,depending on the model specification. This is consistent with the notion that information spillovers play an important role invalue creation in cross-border, developing market M&As.
Third, we find that the positive effect of learning by observing others' acquisitions on an acquirer's accounting performanceis also significant when measured by the number of financial press releases about the outcome of prior M&As in the sametarget country, suggesting effective spillover of information through media coverage. Thus consistent with the predictions of
1 Empirical work has documented the importance of “learning from others” in several contexts, such as the adoption of new crops (Ryan and Gross, 1943), thediffusion of patent drugs (Coleman, 1966), the choice of new agricultural techniques (Hagerstrand, 1969; Rogers, 1983), economic demography (Watkins, 1991),and the purchase of consumer products (Kotler, 1986). The empirical evidence in the finance, management and strategy literature pertaining to learning from theactions of others in an M&A setting is largely limited, however, to case study analyses on a single or small set of industries and countries. For example, DeLong andDeYoung (2007) use a sample of 216 observations in the US banking industry. Barkema and Schijven (2008) provide a good summary of the field.
2 We thank the referee for suggesting this important source of learning by observing other acquirers.3 http://www.imf.org/external/pubs/ft/weo/2012/02/pdf/text.pdf.
204 B.B. Francis et al. / Journal of Corporate Finance 25 (2014) 202–215
Bikhchandani et al. (1998), observing predecessors' M&A decisions, as well as their outcomes, can effectively increase thelikelihood of informative learning and thus acquisition success.
We then examine the effect of learning by observing on the value of acquiring firms, measured by the market adjustedfive-year buy-and-hold abnormal returns around the acquisition announcement month (BHAR). Consistent with our conjecture,we find a strong, positive and significant relationship between an acquirer's long-term stock performance, the prevalence of pressrelease events about the outcome of prior M&As, and past acquisitions made by local US, industry peers in the same targetcountry. For example, controlling for other factors, the BHAR earned by an acquirer who observes the past acquisition behavior of(US) industry peers over a five-year horizon starting at bid announcement is (1.9%) 6.2% higher than that of an acquirer with nosuch learning opportunities. The relationship between an acquirer's long-term stock performance and the mere number of pastacquisitions by all predecessors in the same target country, however, is only weakly and marginally significant, indicating thatobserving the acquisition behavior of a large number of prior acquirers is insufficient for effective learning, unless such observinginvolves local, same industry predecessors.
The existence of a positive, statistically significant effect of the past acquisition experience of US industry peers, the prevalenceof news coverage about the outcome of their acquisitions, and an acquirer's acquisition performance are robust to a host ofsensitivity tests and control variables, including accounting for the complexity of the deal, form of payment, country levelgovernance measures such as local corruption and constraints on executive power, year fixed effects, merger waves, and deal andacquirer characteristics. Because acquirers can also learn from their own acquisition experience, we also control for “learning bydoing” effects in all regressions (see, e.g., Aktas et al., 2013). Our results, however, continue to hold, indicating a stable andpersistent positive relationship between learning from local peers and/or from informative news events on prior acquisitionoutcomes, and acquisition performance.
Finally, we examine whether market investors are better able to identify value enhancing, developing market mergers, if asubstantial number of other firms have merged in the recent past or if there have been recent press releases about the outcome ofsuch mergers. While we find no relationship between our learning-by-observing measures and the cumulative abnormal stockreturn (CAR) for the average acquirer around the acquisition announcement, ceteris paribus, there is a strong, positive effect oflearning-by-observing on CARs for high-tech industry targets. These findings are consistent with the interpretation that all elseequal, risk-averse investors are willing to pay higher prices in high information states if information uncertainty is reduced bylearning from the experience of others. Such effect is particularly strong for high-tech targets, where information asymmetry ishighly pronounced to begin with (Sevilir and Tian, 2010). Thus under semi-strong market efficiency, investors are better able toprice high-tech, developing market new mergers when there is relevant information spilling over from other recent M&As.
Because national borders are associated with factors such as culture, religion, language and geographic distance that are alsolikely to affect the costs and benefits of mergers (see Ahern et al., in press; Ongena and Penas, 2009; and Rose, 2000), we alsoexamine how target country cultural heterogeneity affects the relationship between learning from others and acquisitionperformance. To the extent that cultural distance creates greater information asymmetry and uncertainty, we expectpredecessors' experience to play a stronger role in a firm's acquisition performance in target countries where culturalheterogeneity is more significant (Kogut and Singh, 1988). Not surprisingly, we find that the positive effect of learning fromothers on acquisition performance is more strongly pronounced in culturally remote markets, indicating that such learning ismore beneficial in economic settings that are inherently different from the US.
Our paper adds to a few streams of research in the management, strategy and finance literature that document learning byobserving effects in a variety of strategic activities, ranging from new product introduction and market entry to timing ofinvestment and mergers and acquisitions.4 While the literature on observational learning has made substantial strides since the1990s (Miner and Haunschild, 1995), it is still unclear whether such learning can lead to performance improvement (Beckmanand Haunschild, 2002; DeLong and DeYoung, 2007). Our study contributes to this literature by documenting a positiverelationship between learning-by-observing and acquisition performance that is especially pronounced for same industry, USpeers and targets based in culturally distant, developing economies.
Our findings are also consistent with several studies that find a strong, industry-wide (Almazan et al., 2010; Almeida andKogut, 1999) and local (DeLong, 2001; Uysal et al., 2008) information spillover in the context of M&As. While these prior papersmainly focus on acquisition experience in one country or industry, as far as we are aware, this is the first study that looks atdeveloping country acquisitions.
The remainder of the paper is organized as follows. Section 2 summarizes the data, variables and methodology. Section 3presents the results, and Section 4 concludes.
2. Data
2.1. Sample and methodology
To conduct this study, we start with data from the Worldwide M&A section of the SDC Platinum Database for all M&As thattook place by US acquirers during 1993–2010 (17,244 deals).5 We then limit our transactions to cross-border deals conducted in
4 For excellent reviews on learning from others, see Lieberman and Asaba (2006) and Barkema and Schijven (2008).5 Some of the databases in SDC go back to the 1970s. However, Netter, Stegemoller and Wintoki (2011) report that SDC data coverage is highly limited
throughout the 1980s, and that SDC only covers deals of any value, including unreported values starting from 1992. We therefore start our sample period in 1993.
205B.B. Francis et al. / Journal of Corporate Finance 25 (2014) 202–215
developing economy countries, as classified by the IMF (1755 observations). We specifically obtain information on acquireridentities, target firm country, public status, primary four digit SIC codes for both acquirers and targets, tender offer status,payment method, and shares owned by acquirers following the transaction. Because some of the performance measures we use inour study involve market price data, we exclude transactions made by private acquirers and those where the percentage of sharesacquired is less than 50% of the target's shares outstanding as defined by SDC (818 transactions). Following conventional sampleselection criteria, we also exclude financial firms (SIC 6000–6999), and restrict the sample to deals with information ontransaction value and identifiable GVKEY from Compustat. After imposing the above selection criteria, our final sample results in543 deals made by U.S. acquirers in 43 developing market economies, of which 317 are completed transactions that involvetransfer in control.
2.2. Description of variables
The dependent variables used throughout our analyses include the likelihood of deal completion, the acquirer's CumulativeAbnormal Return (CAR) and market adjusted five year Buy-and-Hold Return (BHAR) around the acquisition announcement date,and the change in post merger performance (ΔROA). The likelihood of deal completion is a dummy variable that receives a value of 1if the acquisition has been completed, resulting in transfer in control, and 0 otherwise. The long-run change in financialperformance, ΔROA is based on industry adjusted data, and measures the average pre-merger (3 to 1 years prior) to post-merger(3 to 5 years after) change in the return on assets of the acquiring firm after first normalizing ROA to average industry wide levelsin those years. This approach thus largely inoculates ΔROA from intertemporal changes in recorded financial performance that arecaused by industry-wide phenomena or economy-wide phenomena that systematically affect a given industry.
To compute abnormal stock returns associated with acquisition announcements, we use standard event study methodology(see, e.g., Brown and Warner, 1980). The market model abnormal returns are computed using the CRSP equally weighted indexreturns. The parameters for the market model are estimated over the (−250,−20) day interval. Using these parameters, for eachof the 317 acquisitions in our sample of completed deals, we estimate an acquirer's abnormal return over a three-dayannouncement period (−1, +1) and use both a t-test and a nonparametric Wilcoxon signed rank test to perform significancetests.
Our BHARs are adjusted for firm size and book-to-market ratio. To calculate BHARs, we followMitchell and Stafford (2000) andmeasure the five-year buy-and hold abnormal return for each acquirer as the difference between the buy-and-hold return of theacquirer and the buy-and-hold return of the appropriate size and book-to-market portfolio. Both value-weighted andequal-weighted averages of the BHARs are computed across acquirers.6
Throughout the analysis, we also use acquirer, deal and country specific characteristics. Our acquirer related measures arefrom Compustat, and include the natural logarithm of market size, 4 weeks prior to the announcement (LnMkt); the naturallogarithm of total assets (LnAT); and market-to-book ratio (MtB), measured four weeks prior to the acquisition announcement.We include a dummy variable to denote whether an acquirer has an ownership stake in the target firm prior to the announcement(Toehold); We also control for an acquirer' learning by doing experience (LBD). Specifically, we measure LBD as the number ofprior acquisitions conducted by the acquirer in the same target country in the two years prior to the focal transaction.
Deal characteristics include a transaction size value (Transaction), and Relative Size measured as the ratio of the transactionvalue to the acquirer's market value 4 weeks before the announcement; a dummy variable to denote high-tech industry affiliationfor the target firm (Hitech); a dummy variable to denote whether the acquirer's two-digit SIC code is the same as the target's(Related); the natural logarithm of deal size (Transaction); and an indicator to denote whether the target is a public company(Public Tgt.), whether the acquisition involves a friendly offer (Friendly Offer), and whether the form of payment was cash (Cash100).
Prior research also shows that the difference between bidder and target corporate governance is an important factor that couldaffect post-merger performance (see, e.g., Martynova and Renneboog, 2008a,b; Burns et al. 2007; Bris and Cabolis, 2008Bris et al.,2008; Francis et al. 2008).7 To control for country level corporate governance, we use the Executive Constraints variable that is awidely used measure of the extent of institutionalized constraints on the decision making power of chief executives (see Jaggersand Marshall, 2000, for more details on variable construction).8 This variable ranges from one to seven, with higher valuesrepresenting stronger shareholder rights. For every deal, we then calculate the Difference in Executive Constraints as the differencebetween shareholder rights in the US and the target country, with higher values reflecting weaker shareholder rights (weakerconstraints on executive power) in the target country as compared to the US. In addition, to capture any unobservable country
6 Our results are qualitatively similar when in the spirit of Mitchell and Stafford (2000), we also form equal- and value-weighted portfolios each calendarmonth using the sample of all acquirers with an acquisition within the last three years. Monthly excess returns on these ‘event’ portfolios are then regressed onthe three Fama and French factors. Results are available upon request.
7 We thank the referee for raising this important issue.8 The variable takes seven different values: (1) Unlimited authority (there are no regular limitations on the executive's actions, as distinct from irregular
limitations such as the threat or actuality of coups and assassinations); (2) Intermediate category; (3) Slight to moderate limitation on executive authority (thereare some real but limited restraints on the executive); (4) Intermediate category; (5) Substantial limitations on executive authority (the executive has moreeffective authority than any accountability group but is subject to substantial constraints by them); (6) Intermediate category; (7) Executive parity orsubordination (accountability groups have effective authority equal to or greater than the executive in most areas of activity). This variable is calculated as theaverage from 1960 through 2000.
206 B.B. Francis et al. / Journal of Corporate Finance 25 (2014) 202–215
specific factors that may influence deal completion, we create a target country level variable, TgtCountryCompleteness, which is theaverage completion rate of all cross-border M&As in the target country during the five-year period prior to the focal deal.
To account for cultural differences between the target country and the US, we use the Hofstede (1980, 2001) cultural distancemeasure, which reflects the differences in how firms organize, function and manage in different country origins (see Kogut andSingh, 1988 for details on construction).9 Such differences matter as they can significantly affect the likelihood of acquisitionsuccess (Weber and Camerer, 2003). We thus measure Culture Close, a dummy variable we use to denote countries that areculturally similar to the US. Specifically, this variable receives a value of one if the target country's cultural deviation from the US isless than the sample median difference between the US and all target countries in a given year, and zero otherwise.
As a measure of country level governance, we use the Control of Corruption indicator complied by Kaufmann et al. (2010)during 1996–2009. This variable has values that range from −25 to 25, with higher values reflecting better corruption control inthe respective target country.
We also use the Freedom of Press index, constructed by Freedom House as a control variable.10 The Freedom House index coversmost of the countries in our sample from 1980 to 2011 and the values of the aggregate score range from 0 (“least free”) to 100(“most free”).11 Freedom of the Press is commonly used as a measure of good government, public access to information andinformation accountability. Although Tetlock (2010) suggests that the financial press could help in mitigating informationasymmetry across economic agents, media coverage, or the accountability of media coverage, could be compromised in manycountries that US firms target for M&A transactions. As a result, in countries with weaker freedom of the press, acquirers maydepend on information from predecessors' past acquisitions to collect useful data about a target country's legal, political andeconomic environment.
Finally, to capture the various forms of information spillover associated with learning-by-observing, we define three facets ofobservational learning. We start with frequency based learning, where firms execute practices previously used by large numbers ofother organizations, and proxy for such learning by the number of acquisition deals made by other acquirers in the same targetcountry (Cumulative Learning by Observing — CLBO). Because more recent deals are expected to contribute more to an acquirer'sknowledge of the target country, we impose a five-year cutoff period between the current acquisition and past acquisitionsconducted by predecessors.12
We then measure trait based learning, where firms use practices previously used by other similar organizations with mutualtraits, such as industry and/or country of origin. We specifically measure such learning by the number of past acquisition dealsconducted by same 2-digit SIC industry and/or US origin predecessors up to five years prior to the focal acquisition event(Cumulative Industry Learning by Observing — CILBO; Cumulative Learning by Observing US Acquirers — CLBO_US; and CumulativeIndustry Learning by Observing US Acquirers — CILBO_US).
Finally, we consider outcome based learning, in which firms learn from the practices that appear to have had good outcomesfor other organizations in the past and avoid practices with bad outcomes. To account for such learning, we measure the numberof financial press releases about the outcome of M&A deals in the target country in the five years prior to the acquisitionannouncement (Top News). We specifically follow Tetlock (2010), and collect information about the outcome of such prior dealsfrom major newspaper databases such as ProQuest, Lexis-Nexis, and Factiva, and rely on the Harvard-IV-4 psychologicaldictionary word classification to categorize positive and negative words in each news story, using the General Inquirer, a wellknown semantic quantitative analysis program.13 To the extent that media content could capture otherwise hard to quantifyaspects of firm fundamentals (Tetlock, 2007), especially in developing market economies, where information is more difficult toevaluate and come by, we expect firms to be better able to plan and execute mergers as they are exposed to more qualitativeinformation about predecessors' acquisition experience.
2.3. Summary statistics
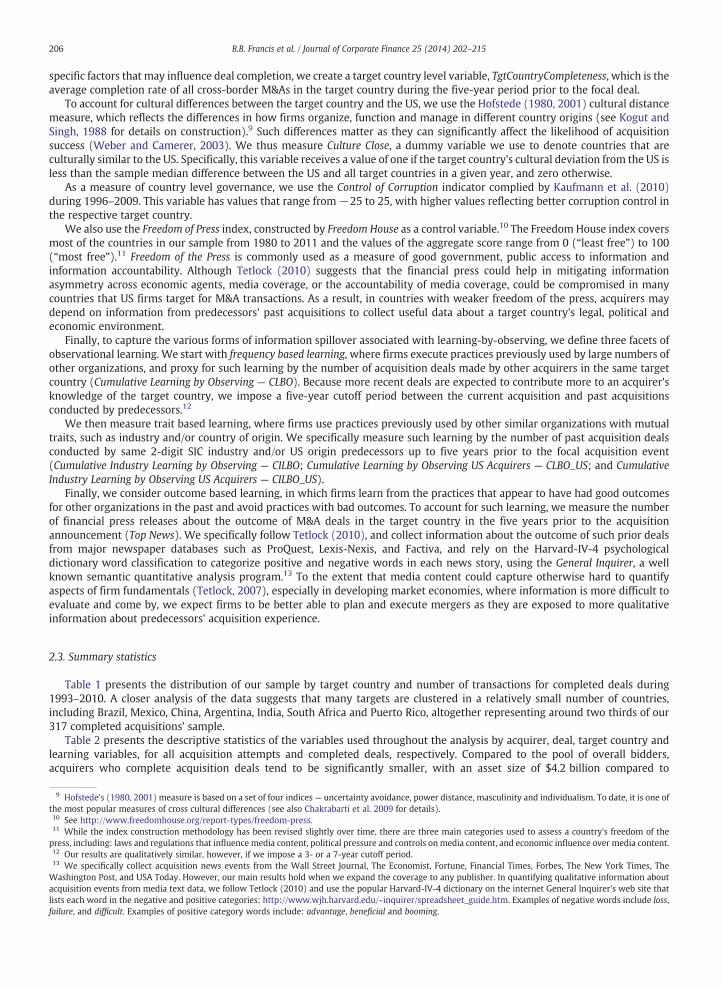
Table 1 presents the distribution of our sample by target country and number of transactions for completed deals during1993–2010. A closer analysis of the data suggests that many targets are clustered in a relatively small number of countries,including Brazil, Mexico, China, Argentina, India, South Africa and Puerto Rico, altogether representing around two thirds of our317 completed acquisitions' sample.
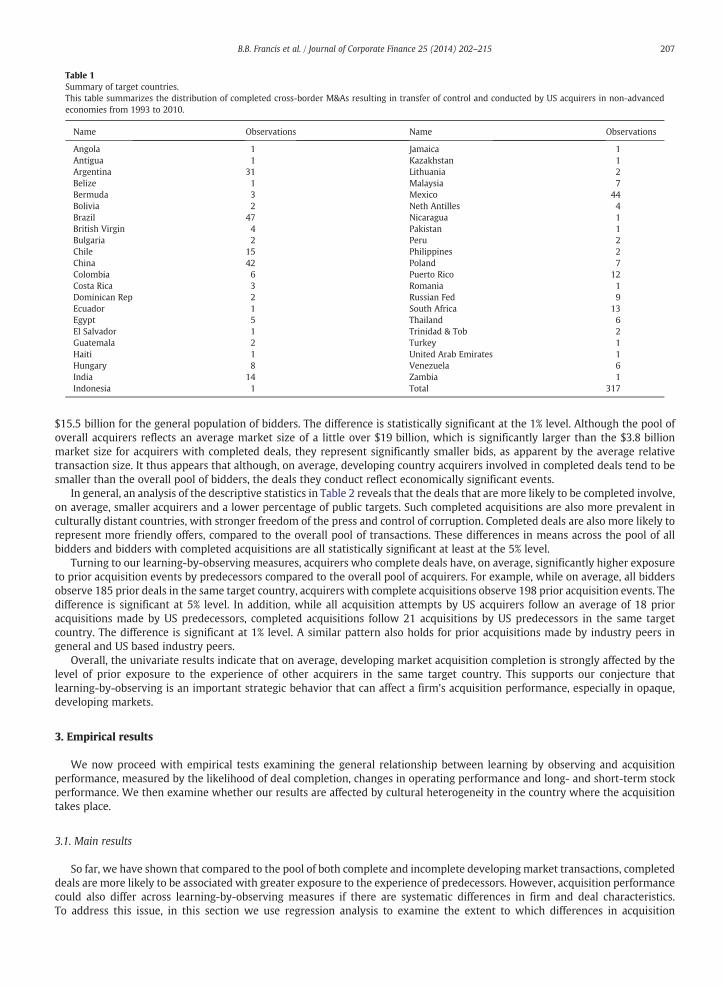
Table 2 presents the descriptive statistics of the variables used throughout the analysis by acquirer, deal, target country andlearning variables, for all acquisition attempts and completed deals, respectively. Compared to the pool of overall bidders,acquirers who complete acquisition deals tend to be significantly smaller, with an asset size of $4.2 billion compared to
9 Hofstede's (1980, 2001) measure is based on a set of four indices — uncertainty avoidance, power distance, masculinity and individualism. To date, it is one ofthe most popular measures of cross cultural differences (see also Chakrabarti et al. 2009 for details).10 See http://www.freedomhouse.org/report-types/freedom-press.11 While the index construction methodology has been revised slightly over time, there are three main categories used to assess a country's freedom of thepress, including: laws and regulations that influence media content, political pressure and controls on media content, and economic influence over media content.12 Our results are qualitatively similar, however, if we impose a 3- or a 7-year cutoff period.13 We specifically collect acquisition news events from the Wall Street Journal, The Economist, Fortune, Financial Times, Forbes, The New York Times, TheWashington Post, and USA Today. However, our main results hold when we expand the coverage to any publisher. In quantifying qualitative information aboutacquisition events from media text data, we follow Tetlock (2010) and use the popular Harvard-IV-4 dictionary on the internet General Inquirer's web site thatlists each word in the negative and positive categories: http://www.wjh.harvard.edu/~inquirer/spreadsheet_guide.htm. Examples of negative words include loss,failure, and difficult. Examples of positive category words include: advantage, beneficial and booming.
Table 1Summary of target countries.This table summarizes the distribution of completed cross-border M&As resulting in transfer of control and conducted by US acquirers in non-advancedeconomies from 1993 to 2010.
Name Observations Name Observations
Angola 1 Jamaica 1Antigua 1 Kazakhstan 1Argentina 31 Lithuania 2Belize 1 Malaysia 7Bermuda 3 Mexico 44Bolivia 2 Neth Antilles 4Brazil 47 Nicaragua 1British Virgin 4 Pakistan 1Bulgaria 2 Peru 2Chile 15 Philippines 2China 42 Poland 7Colombia 6 Puerto Rico 12Costa Rica 3 Romania 1Dominican Rep 2 Russian Fed 9Ecuador 1 South Africa 13Egypt 5 Thailand 6El Salvador 1 Trinidad & Tob 2Guatemala 2 Turkey 1Haiti 1 United Arab Emirates 1Hungary 8 Venezuela 6India 14 Zambia 1Indonesia 1 Total 317
207B.B. Francis et al. / Journal of Corporate Finance 25 (2014) 202–215
$15.5 billion for the general population of bidders. The difference is statistically significant at the 1% level. Although the pool ofoverall acquirers reflects an average market size of a little over $19 billion, which is significantly larger than the $3.8 billionmarket size for acquirers with completed deals, they represent significantly smaller bids, as apparent by the average relativetransaction size. It thus appears that although, on average, developing country acquirers involved in completed deals tend to besmaller than the overall pool of bidders, the deals they conduct reflect economically significant events.
In general, an analysis of the descriptive statistics in Table 2 reveals that the deals that are more likely to be completed involve,on average, smaller acquirers and a lower percentage of public targets. Such completed acquisitions are also more prevalent inculturally distant countries, with stronger freedom of the press and control of corruption. Completed deals are also more likely torepresent more friendly offers, compared to the overall pool of transactions. These differences in means across the pool of allbidders and bidders with completed acquisitions are all statistically significant at least at the 5% level.
Turning to our learning-by-observing measures, acquirers who complete deals have, on average, significantly higher exposureto prior acquisition events by predecessors compared to the overall pool of acquirers. For example, while on average, all biddersobserve 185 prior deals in the same target country, acquirers with complete acquisitions observe 198 prior acquisition events. Thedifference is significant at 5% level. In addition, while all acquisition attempts by US acquirers follow an average of 18 prioracquisitions made by US predecessors, completed acquisitions follow 21 acquisitions by US predecessors in the same targetcountry. The difference is significant at 1% level. A similar pattern also holds for prior acquisitions made by industry peers ingeneral and US based industry peers.
Overall, the univariate results indicate that on average, developing market acquisition completion is strongly affected by thelevel of prior exposure to the experience of other acquirers in the same target country. This supports our conjecture thatlearning-by-observing is an important strategic behavior that can affect a firm's acquisition performance, especially in opaque,developing markets.
3. Empirical results
We now proceed with empirical tests examining the general relationship between learning by observing and acquisitionperformance, measured by the likelihood of deal completion, changes in operating performance and long- and short-term stockperformance. We then examine whether our results are affected by cultural heterogeneity in the country where the acquisitiontakes place.
3.1. Main results
So far, we have shown that compared to the pool of both complete and incomplete developing market transactions, completeddeals are more likely to be associated with greater exposure to the experience of predecessors. However, acquisition performancecould also differ across learning-by-observing measures if there are systematic differences in firm and deal characteristics.To address this issue, in this section we use regression analysis to examine the extent to which differences in acquisition
Table 2Summary of sample characteristics.This table presents the summary statistics of cross-border M&As conducted by U.S. acquirers in developing market countries during 1993–2010. All Attemptsinclude incomplete transactions and transactions that do not result in transfer in control. Completed Deals include completed transactions that result in transfer incontrol. Total Assets (Market 4 wks before) reflect the asset size (market value) of the acquirer four weeks prior to the acquisition. MtB is the market-to-book ratioof the acquiring firms, measured by the acquirers' market value four weeks prior to the announcement. Hitech is a dummy variable that denotes whether thetarget company is a high-tech firm. Transaction is the value of the transaction (in $mil). Relative Size is the ratio of the transaction value to the acquirer's marketvalue 4 weeks before the announcement. LBD refers to the number of deals conducted by the acquirers in the target country during the two years prior to the focaltransaction. Public Tgt., Friendly and Cash 100 are dummy variables that denote public targets, friendly acquisitions and deals for which the form of payment wasonly cash, respectively. Executive Constraints refer to the difference country-level number of executive constraints between the US and the target country. Freedomof the Press measures good government, access to information, and accountability of information, with higher scores indicting lower freedom of press. Control ofCorruption is from the governance indicators complied by Kaufmann, Kraay and Mastruzzi (2010). Higher values indicate better corruption control. Culture Closerefers to countries with similar culture as the US, based on the sample median. CLBO (CLBO_US) denotes the cumulative number of mergers conducted by other(US based) acquirers in the same target country up to five years prior to the focal acquisition event. CILBO (CILBO_US) denotes the cumulative number of mergersconducted by other (local US), same two digit SIC industry acquirers in the same target country up to five years prior to the focal acquisition event. Top News is thecumulative number of media coverage events about the outcome of prior acquisitions in the same target country up to five years prior to the focal acquisitionevent. Other variables are defined in the Appendix. *, **, and *** denote statistical significance at the 10%, 5%, and 1% level.
Country characteristicsExecutive Constraints 2.902 3.022 0.120*Freedom of the Press 45.798 43.039 −2.759**Control of Corruption −0.082 −0.013 0.069***Culture Close 0.489 0.462 −0.027**
208 B.B. Francis et al. / Journal of Corporate Finance 25 (2014) 202–215
performance can be attributable to observational learning. To minimize the effect of outliers, we winsorized all accountingvariables at the 1% level.
3.1.1. The effect of learning by observing on the likelihood of acquisition completionGenerally speaking, deal completion can be viewed as a measure of acquisition performance, especially in the eyes of
managers and financial advisors. Given the complexity of conducting a merger or acquisition, which becomes even morepronounced in the case of developing market deals, learning from others may alleviate such difficulties and improve completionrates.
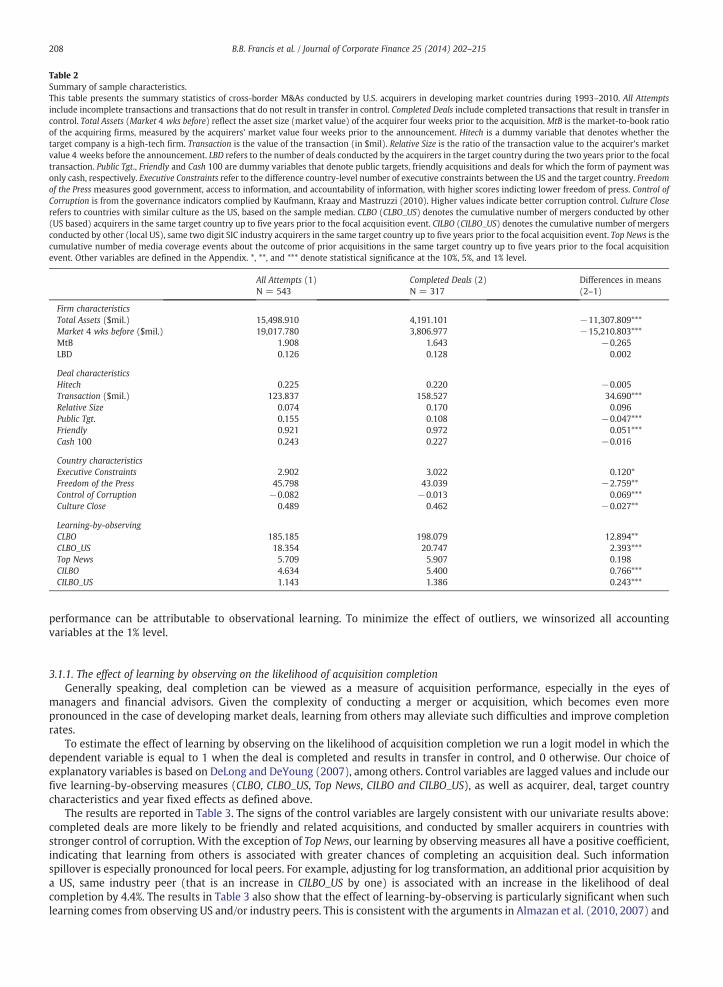
To estimate the effect of learning by observing on the likelihood of acquisition completion we run a logit model in which thedependent variable is equal to 1 when the deal is completed and results in transfer in control, and 0 otherwise. Our choice ofexplanatory variables is based on DeLong and DeYoung (2007), among others. Control variables are lagged values and include ourfive learning-by-observing measures (CLBO, CLBO_US, Top News, CILBO and CILBO_US), as well as acquirer, deal, target countrycharacteristics and year fixed effects as defined above.
The results are reported in Table 3. The signs of the control variables are largely consistent with our univariate results above:completed deals are more likely to be friendly and related acquisitions, and conducted by smaller acquirers in countries withstronger control of corruption. With the exception of Top News, our learning by observing measures all have a positive coefficient,indicating that learning from others is associated with greater chances of completing an acquisition deal. Such informationspillover is especially pronounced for local peers. For example, adjusting for log transformation, an additional prior acquisition bya US, same industry peer (that is an increase in CILBO_US by one) is associated with an increase in the likelihood of dealcompletion by 4.4%. The results in Table 3 also show that the effect of learning-by-observing is particularly significant when suchlearning comes from observing US and/or industry peers. This is consistent with the arguments in Almazan et al. (2010, 2007) and
Table 3Learning-by-observing and the likelihood of acquisition completion.This table presents the results of a logit regression model of the likelihood of deal completion. The dependent variable is a dummy variable that receives a value of1 if the deal is completed and 0 otherwise. The observational learning variables are defined above. Executive Constraints measure the country-level difference incorporate governance (shareholder rights) between the U.S. and the target country. TgtCountryCompleteness is the average completion rate of all the cross-borderM&As in the target country during the two-year period prior to the focal deal. Freedom of the Press ranges from 0 to 100 with higher values representing countrieswith weaker freedom of press. Control of Corruption ranges from −2.5 to 2.5, with higher values indicating better corruption control. Merger Waves are definedfollowing Harford (2005). LBD measures the acquirers' recent cross-border M&As in the target country two years prior to the focal transaction. The other controlvariables are defined in Table 2. *, **, and *** denote statistical significance at the 10%, 5%, and 1% level.
(1) (2) (3) (4) (5)
CLBO 0.001*(0.088)
CLBO_US 0.009*(0.096)
Top News 0.001(0.988)
Country and industry informationCILBO 0.025*
(0.077)CILBO_US 0.184***
(0.001)Control variableslnMkt −0.587***
(0.000)−0.581***(0.000)
−0.576***(0.000)
−0.588***(0.000)
−0.591***(0.000)
Hitech −0.330(0.175)
−0.299(0.215)
−0.251(0.300)
−0.370(0.133)
−0.405*(0.098)
PublicT −0.082(0.777)
−0.064(0.824)
−0.094(0.745)
−0.062(0.829)
−0.108(0.711)
Friendly 1.571***(0.001)
1.542***(0.000)
1.454***(0.001)
1.503***(0.001)
1.601***(0.000)
Cash 100 0.183(0.413)
0.159(0.477)
0.218(0.324)
0.168(0.453)
0.146(0.516)
Related 0.463**(0.030)
0.479**(0.024)
0.490**(0.021)
0.487**(0.023)
0.480**(0.025)
Executive Constraints 0.139*(0.069)
0.130*(0.091)
0.140*(0.071)
0.145*(0.059)
0.146*(0.059)
TgtCountryCompleteness 0.162(0.808)
−0.013(0.984)
0.130(0.844)
0.061(0.927)
−0.098(0.884)
Freedom of the Press −0.007(0.331)
−0.007(0.291)
−0.007(0.343)
−0.010(0.180)
−0.009(0.202)
Control Of Corruption 0.291*(0.100)
0.302(0.136)
0.225(0.274)
0.274(0.176)
0.345*(0.095)
Merger Waves −0.881(0.220)
−0.846(0.233)
−0.860(0.225)
−0.880(0.218)
−0.758(0.289)
LBD −0.040(0.851)
−0.070(0.742)
−0.069(0.742)
−0.105(0.621)
−0.210(0.326)
Year effects Yes Yes Yes Yes YesObs. 543 543 543 543 543Pseudo R2 0.257 0.258 0.264 0.258 0.266Prob N F 0.000 0.000 0.000 0.000 0.000
209B.B. Francis et al. / Journal of Corporate Finance 25 (2014) 202–215
Guillén (2002) that under uncertainty, economic agents learnmost effectively from the experience of their peers and neighbors inguiding their decision making.
Acquisition completion likelihood, however, should not be studied alone in examining the effect of observational learning onacquisition performance. This is the case because some deals may be completed for reasons other than the fact of a goodinvestment. For instance, Moeller et al. (2004) find that larger firms are more likely to complete a transaction by paying a higherpremium, resulting in value loss. Similarly, Hunter and Jagtiani (2003) show that deals advised by top ranked advisors are morelikely to be completed, but those deals are also associated with declined synergistic gains. We therefore proceed with a battery oftests to examine the effect of learning-by-observing on three additional measures of acquisition performance: change inoperating performance, and long- and short-term stock performance.
3.1.2. The effect of learning by observing on post-merger operating performanceIn this section we examine whether learning-by-observing plays a role in the post-merger operating performance of acquirers
in developing market economics. The long-run change in financial performance, ΔROA is based on industry adjusted data, andmeasures the average pre-merger (3 to 1 years prior) to post-merger (3 to 5 years after) change in the return on assets of theacquiring firm after first normalizing ROA to average industry wide levels in those years. This approach largely isolates postmerger performance from inter-temporal changes in industry-wide phenomena.
210 B.B. Francis et al. / Journal of Corporate Finance 25 (2014) 202–215
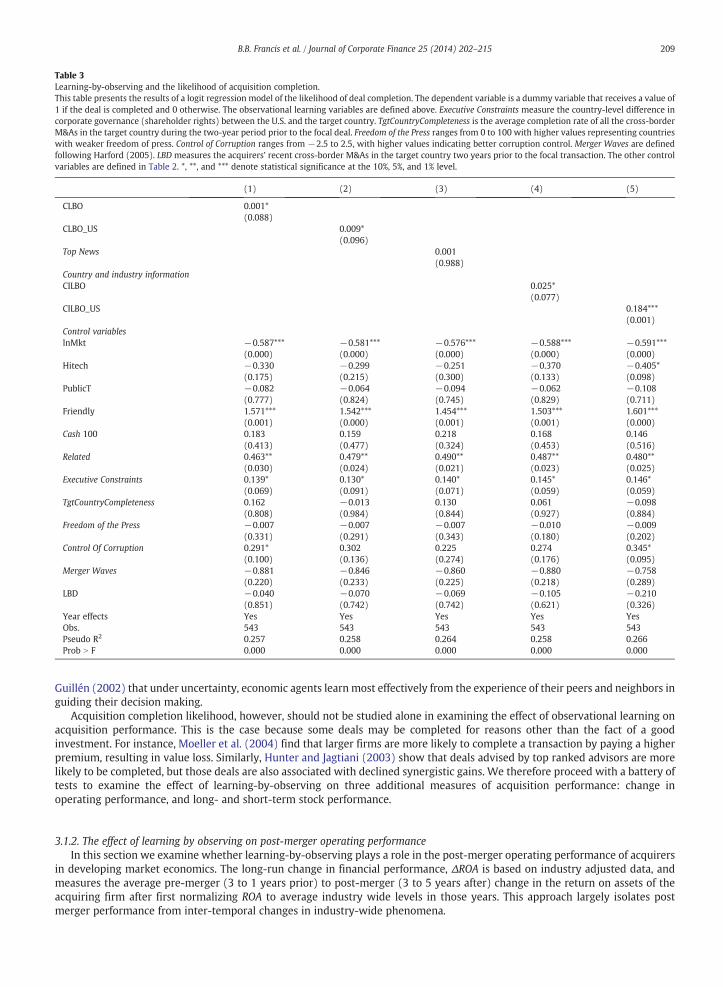
Table 4 displays the results from ordinary least squares (OLS) estimation in which the dependent variable is ΔROA. In eachregression model, we separately use one of our five learning-by-observing measures, reflecting frequency (CLBO), trait (CLBO_US,CILBO, and CILBO_US) and outcome-based-learning (Top News), respectively. We include control variables to account for deal,acquirer, target country characteristics and year fixed effects. Because acquirers can learn from their own acquisition experience,we also control for “learning by doing” in all regressions (see, e.g., Aktas et al., 2013). In addition, in all regression models, wecontrol for country level governance (Executive Constraints, Freedom of Press and Control of Corruption), as defined above.
To conduct our estimations, we include completed deals where acquirers gain absolute control rights after the transaction(ownership higher than 50%) and exclude those strategically insignificant deals that account for less than 1% of the acquirer'smarket value of equity 4 weeks prior to the announcement. The sample is truncated at 2008 so that there is enough informationto measure the change in operating performance after the transaction is completed.
We find evidence consistent with learning-by-observing in all five regressions in Table 4, with the strongest impliedimprovement in operating performance that results from trait based learning (learning-by-observing industry and/or US peers).For example, an increase in CLBO_US by one transaction evaluated at the sample means generates an estimated 0.002 increase inΔROA. Using the average (unreported) pre-merger acquiring firm ROA of 0.197 as a benchmark, this corresponds to a substantial1.0% improvement in post-merger profitability. Similarly, an increase in CILBO (CILBO_US) by one transaction is associated with a3.0% (5.6%) increase in average pre-merger ROA. This is consistent with non-trivial information spillover related improvement inpost-merger operating performance that is highly pronounced when learning is based on similar trait predecessor acquisitionexperience. As can be seen from the positive and significant coefficient on the Top News variable, such information spillovers arealso associated with an operating performance improvement of 0.51% for every incremental increase in media coverage events. It
Table 4Learning-by-observing and changes in post-merger operating performance.This table presents the OLS regression results of regressing the changes in pre-merger operating performance on learning by observing measures. The dependentvariable, ΔROA is the average pre-merger (3 to 1 years prior) to post-merger (3 to 5 years after) change in the return on assets of the acquiring firm after firstnormalizing ROA to average industry wide levels in those years. The observational learning variables are defined above. Executive Constraints measures thecountry-level difference in corporate governance (shareholder rights) between the U.S. and the target country. Freedom of the Press ranges from 0 to 100 withhigher values representing countries with weaker freedom of press. Control of Corruption ranges from−2.5 to 2.5, with higher values indicating better corruptioncontrol. Merger Waves are defined following Harford (2005). LBD measures the acquirers' recent cross-border M&As in the target country two years prior to thefocal transactions. The other control variables are defined in Table 2. *, **, and *** denote statistical significance at the 10%, 5%, and 1% level.
(1) (2) (3) (4) (5)
CLBO 0.001***(0.002)
CLBO_US 0.002**(0.020)
Top News 0.001*(0.100)
CILBO 0.006**(0.047)
CILBO_US 0.011***(0.010)
Control variablesLnMkt −0.003
(0.634)−0.002(0.743)
−0.001(0.888)
−0.001(0.908)
−0.001(0.840)
MtB 0.002(0.417)
0.002(0.438)
0.001(0.602)
0.001(0.634)
0.002(0.359)
Hitech −0.041(0.133)
−0.036(0.178)
−0.033(0.203)
−0.033(0.210)
−0.035(0.198)
Cash 100 0.031**(0.040)
0.028*(0.079)
0.034**(0.028)
0.016(0.374)
0.031**(0.042)
Relative Size 0.025(0.608)
0.018(0.726)
0.030(0.566)
0.019(0.714)
0.016(0.752)
Related −0.015(0.563)
−0.009(0.710)
−0.017(0.520)
−0.018(0.504)
−0.015(0.566)
Executive Constraints 0.004(0.521)
0.003(0.733)
0.002(0.827)
0.004(0.544)
0.005(0.479)
Freedom of the Press 0.001(0.719)
0.001(0.548)
0.001(0.318)
0.001(0.969)
0.001(0.619)
Control of Corruption 0.001(0.961)
0.003(0.863)
−0.002(0.940)
−0.002(0.919)
0.006(0.733)
Merger Waves 0.033(0.222)
0.025(0.163)
0.043**(0.019)
0.038*(0.100)
0.042**(0.041)
LBD 0.012(0.156)
0.009(0.302)
0.012*(0.097)
0.005(0.541)
0.008(0.300)
Year effects Yes Yes Yes Yes YesObs. 168 168 168 168 168Ajd. R2 0.225 0.201 0.229 0.249 0.200Prob. N F 0.013 0.000 0.000 0.000 0.022
211B.B. Francis et al. / Journal of Corporate Finance 25 (2014) 202–215
is also interesting to note that the coefficient of learning-by-doing (LBD) is positive and significant in some of the regressions,indicating that learning from others has a strong effect on acquisition performance that is not subsumed by an acquirer's ownacquisition experience.
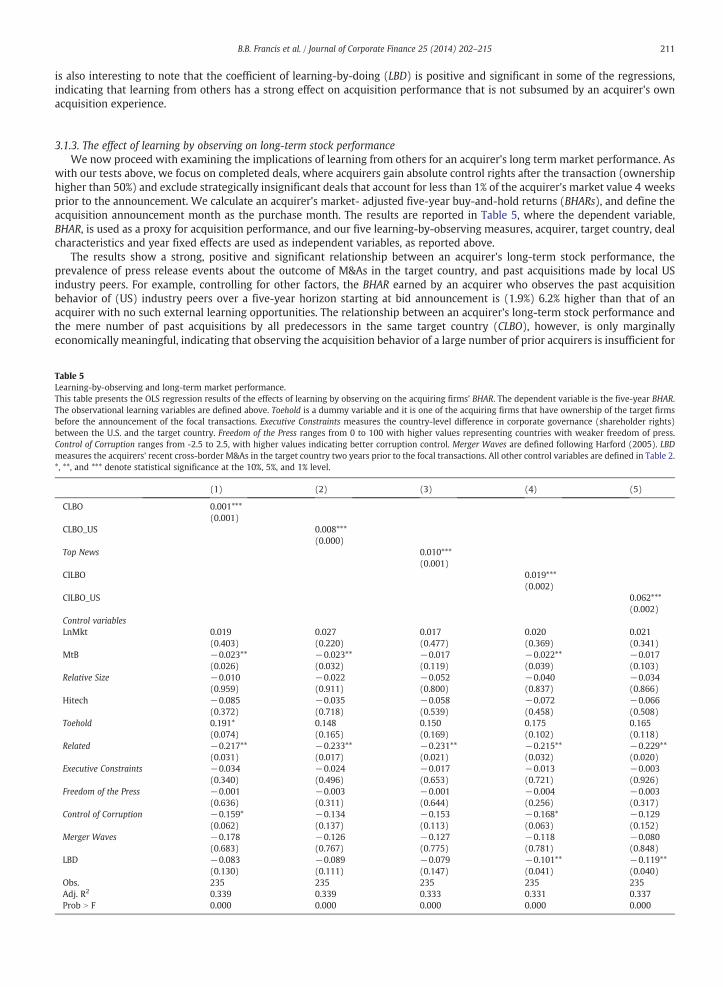
3.1.3. The effect of learning by observing on long-term stock performanceWe now proceed with examining the implications of learning from others for an acquirer's long term market performance. As
with our tests above, we focus on completed deals, where acquirers gain absolute control rights after the transaction (ownershiphigher than 50%) and exclude strategically insignificant deals that account for less than 1% of the acquirer's market value 4 weeksprior to the announcement. We calculate an acquirer's market- adjusted five-year buy-and-hold returns (BHARs), and define theacquisition announcement month as the purchase month. The results are reported in Table 5, where the dependent variable,BHAR, is used as a proxy for acquisition performance, and our five learning-by-observing measures, acquirer, target country, dealcharacteristics and year fixed effects are used as independent variables, as reported above.
The results show a strong, positive and significant relationship between an acquirer's long-term stock performance, theprevalence of press release events about the outcome of M&As in the target country, and past acquisitions made by local USindustry peers. For example, controlling for other factors, the BHAR earned by an acquirer who observes the past acquisitionbehavior of (US) industry peers over a five-year horizon starting at bid announcement is (1.9%) 6.2% higher than that of anacquirer with no such external learning opportunities. The relationship between an acquirer's long-term stock performance andthe mere number of past acquisitions by all predecessors in the same target country (CLBO), however, is only marginallyeconomically meaningful, indicating that observing the acquisition behavior of a large number of prior acquirers is insufficient for
Table 5Learning-by-observing and long-term market performance.This table presents the OLS regression results of the effects of learning by observing on the acquiring firms' BHAR. The dependent variable is the five-year BHAR.The observational learning variables are defined above. Toehold is a dummy variable and it is one of the acquiring firms that have ownership of the target firmsbefore the announcement of the focal transactions. Executive Constraints measures the country-level difference in corporate governance (shareholder rights)between the U.S. and the target country. Freedom of the Press ranges from 0 to 100 with higher values representing countries with weaker freedom of press.Control of Corruption ranges from -2.5 to 2.5, with higher values indicating better corruption control. Merger Waves are defined following Harford (2005). LBDmeasures the acquirers' recent cross-border M&As in the target country two years prior to the focal transactions. All other control variables are defined in Table 2.*, **, and *** denote statistical significance at the 10%, 5%, and 1% level.
(1) (2) (3) (4) (5)
CLBO 0.001***(0.001)
CLBO_US 0.008***(0.000)
Top News 0.010***(0.001)
CILBO 0.019***(0.002)
CILBO_US 0.062***(0.002)
Control variablesLnMkt 0.019
(0.403)0.027(0.220)
0.017(0.477)
0.020(0.369)
0.021(0.341)
MtB −0.023**(0.026)
−0.023**(0.032)
−0.017(0.119)
−0.022**(0.039)
−0.017(0.103)
Relative Size −0.010(0.959)
−0.022(0.911)
−0.052(0.800)
−0.040(0.837)
−0.034(0.866)
Hitech −0.085(0.372)
−0.035(0.718)
−0.058(0.539)
−0.072(0.458)
−0.066(0.508)
Toehold 0.191*(0.074)
0.148(0.165)
0.150(0.169)
0.175(0.102)
0.165(0.118)
Related −0.217**(0.031)
−0.233**(0.017)
−0.231**(0.021)
−0.215**(0.032)
−0.229**(0.020)
Executive Constraints −0.034(0.340)
−0.024(0.496)
−0.017(0.653)
−0.013(0.721)
−0.003(0.926)
Freedom of the Press −0.001(0.636)
−0.003(0.311)
−0.001(0.644)
−0.004(0.256)
−0.003(0.317)
Control of Corruption −0.159*(0.062)
−0.134(0.137)
−0.153(0.113)
−0.168*(0.063)
−0.129(0.152)
Merger Waves −0.178(0.683)
−0.126(0.767)
−0.127(0.775)
−0.118(0.781)
−0.080(0.848)
LBD −0.083(0.130)
−0.089(0.111)
−0.079(0.147)
−0.101**(0.041)
−0.119**(0.040)
Obs. 235 235 235 235 235Adj. R2 0.339 0.339 0.333 0.331 0.337Prob N F 0.000 0.000 0.000 0.000 0.000
212 B.B. Francis et al. / Journal of Corporate Finance 25 (2014) 202–215
effective learning, unless such observing involves local, same industry predecessors or qualitative information spillovers frommedia coverage about the outcome of prior deals.
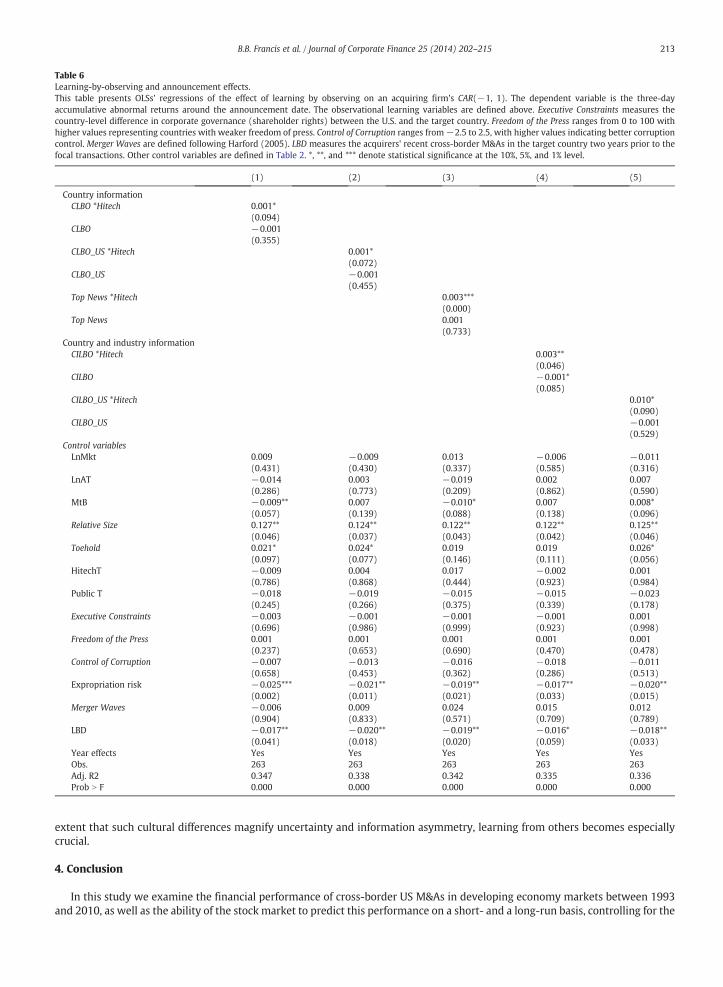
3.1.4. Learning by observing and announcement effectsTo study the implications of learning from others on short term announcement effects, we collect stock return information
from CRSP and require that acquirers have at least 100 days of stock return data, 46 days prior to the announcement date. In ouranalysis, we follow standard event study methodology and report the three-day cumulative abnormal returns around theacquisition announcement.
Table 6 presents the OLS results using the announcement effect of CARs (−1, 1) as a dependent variable. If the stock market isefficient and investors are fully informed about the phenomenon they are pricing (strong efficient market), then investors will beable to accurately price a newmerger, regardless of the amount of information spilling over from other recent mergers. However,if the stock market is efficient but investors lack full information about the phenomenon they are pricing (semi-strong efficientmarkets), then investors will be better able to price a new merger when there is relevant information spilling over from otherrecent mergers.
The results in Table 6 indicate that after controlling for the standard factors that are shown to influence shareholder reaction toacquisition announcements, learning-by-observing variables have an insignificant effect on CARs for the average acquirer in oursample. The insignificant effect of learning by observing on CARs implies that investors infer little information from other firms'past acquisition experience.
In contrast, we find relatively broad evidence that market investors learn-by-observing when the target is a high-tech firm.The positive coefficient on the interaction term between our learning-by-observing measures and the high-tech dummy variableindicate that the correlations between CARs and learning-by-observing are more positive for mergers that occur during highinformation states. These findings are consistent with the interpretation that risk-averse investors are willing, ceteris paribus, topay higher prices when high information uncertainty is reduced via learning-by-observing. Such effect is particularly strong forhigh-tech target acquisitions, where information asymmetry is highly pronounced ex ante (Sevilir and Tian, 2010). These findingsare also consistent with Chari et al. (2010), who report that acquirers in emerging markets experience significantly larger synergyeffects when there is an intangible asset transfer, and Hasan et al. (2012) who find that the previously reported higher acquirerreturns in emerging markets are driven by high-tech related acquisitions.
The results in Table 6 also show that investors react negatively if the acquirer has recently conducted cross-border M&As in thetarget country, as evident by the negative coefficient on the learning-by-doing (LBD) control variable. So while the data stronglysupports the possibility that acquirers in developing markets and investors in high information uncertainty settings benefit byobserving other previous mergers, we find relatively little evidence here to suggest that investors learn from an acquirer's ownprevious mergers. This counter intuitive finding reflects the possibility that investors who are in the best position to learn from anacquirer's experience, that is, investors in acquiring firms that perform a lot of mergers, have noisy information settings becausethese acquirers are perpetually digesting other developing market targets, which makes it difficult to distinguish between highand low quality mergers for any single merger in our empirical framework.
In sum, the results in Tables 3–6 confirm the positive effect of learning-by-observing when U.S. firms acquire targets fromnon-advanced economies and suggest that such learning by observing becomes especially pronounced when learning comes fromlocal industry peers, media coverage about the outcome of recent deals, and for high-tech affiliated acquisitions.
We next examine the extent to which target country cultural heterogeneity affects the relationship between learning fromothers and acquisition performance. To the extent that cultural distance creates greater information asymmetry and uncertainty,we expect predecessors' experience to play a stronger role in a firm's acquisition performance in target countries where culturalheterogeneity is more significant (Kogut and Singh, 1988).
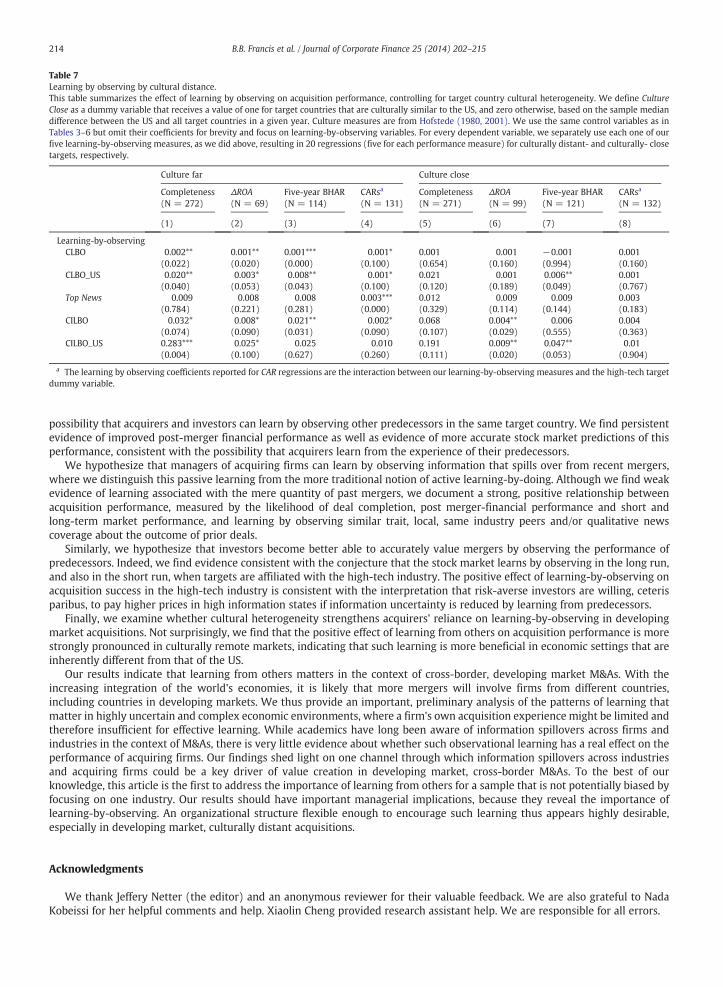
3.1.5. Learning-by-observing, acquisition performance and cultural heterogeneityWhile cultural conflict often plays a large role in producing merger failure, it is often neglected when the benefits of a potential
merger are examined (Weber and Camerer, 2003). In this section, we examine the extent to which cultural differences betweenan acquirer and its target affect the way acquirers learn by observing predecessors' recent acquisitions. To account for culturaldifferences between the target country and the US, we use the Hofstede (1980, 2001) cultural distance measure, as describedabove. Specifically, we define Culture Close as a dummy variable that receives a value of one for target countries that are culturallysimilar to the US, and zero otherwise, based on the sample median difference between the US and all target countries in a givenyear.
Table 7 summarizes the effect of learning-by-observing on our four proxies of acquisition performance (likelihood ofcompletion, change in operating performance, and long- and short term market returns, respectively), controlling for culturaldifferences. We control for all deal, acquirer, target country characteristics and year fixed-effects but omit their coefficients forbrevity and focus on our learning-by-observing independent variables. For every dependent variable, we separately use each oneof our five learning-by-observing measures, as we did above, resulting in 20 regressions (five for each performance measure) forculturally distant- and culturally- close targets, respectively. The results in Table 7 suggest that the effect of learning-by-observingis significantly stronger in the sub-sample of target countries where cultural differences are the most pronounced. UnreportedF-tests of whether the slopes on each of our learning measures are the same for firms acquiring targets in culturally close andculturally distant countries are statistically significant in all cases for all five measures of learning-by-observing. This indicatesthat managers learn more effectively from other predecessors when the target is based in a culturally distant country. Thus to the
Table 6Learning-by-observing and announcement effects.This table presents OLSs' regressions of the effect of learning by observing on an acquiring firm's CAR(−1, 1). The dependent variable is the three-dayaccumulative abnormal returns around the announcement date. The observational learning variables are defined above. Executive Constraints measures thecountry-level difference in corporate governance (shareholder rights) between the U.S. and the target country. Freedom of the Press ranges from 0 to 100 withhigher values representing countries with weaker freedom of press. Control of Corruption ranges from−2.5 to 2.5, with higher values indicating better corruptioncontrol. Merger Waves are defined following Harford (2005). LBD measures the acquirers' recent cross-border M&As in the target country two years prior to thefocal transactions. Other control variables are defined in Table 2. *, **, and *** denote statistical significance at the 10%, 5%, and 1% level.
(1) (2) (3) (4) (5)
Country informationCLBO *Hitech 0.001*
(0.094)CLBO −0.001
(0.355)CLBO_US *Hitech 0.001*
(0.072)CLBO_US −0.001
(0.455)Top News *Hitech 0.003***
(0.000)Top News 0.001
(0.733)Country and industry information
CILBO *Hitech 0.003**(0.046)
CILBO −0.001*(0.085)
CILBO_US *Hitech 0.010*(0.090)
CILBO_US −0.001(0.529)
Control variablesLnMkt 0.009
(0.431)−0.009(0.430)
0.013(0.337)
−0.006(0.585)
−0.011(0.316)
LnAT −0.014(0.286)
0.003(0.773)
−0.019(0.209)
0.002(0.862)
0.007(0.590)
MtB −0.009**(0.057)
0.007(0.139)
−0.010*(0.088)
0.007(0.138)
0.008*(0.096)
Relative Size 0.127**(0.046)
0.124**(0.037)
0.122**(0.043)
0.122**(0.042)
0.125**(0.046)
Toehold 0.021*(0.097)
0.024*(0.077)
0.019(0.146)
0.019(0.111)
0.026*(0.056)
HitechT −0.009(0.786)
0.004(0.868)
0.017(0.444)
−0.002(0.923)
0.001(0.984)
Public T −0.018(0.245)
−0.019(0.266)
−0.015(0.375)
−0.015(0.339)
−0.023(0.178)
Executive Constraints −0.003(0.696)
−0.001(0.986)
−0.001(0.999)
−0.001(0.923)
0.001(0.998)
Freedom of the Press 0.001(0.237)
0.001(0.653)
0.001(0.690)
0.001(0.470)
0.001(0.478)
Control of Corruption −0.007(0.658)
−0.013(0.453)
−0.016(0.362)
−0.018(0.286)
−0.011(0.513)
Expropriation risk −0.025***(0.002)
−0.021**(0.011)
−0.019**(0.021)
−0.017**(0.033)
−0.020**(0.015)
Merger Waves −0.006(0.904)
0.009(0.833)
0.024(0.571)
0.015(0.709)
0.012(0.789)
LBD −0.017**(0.041)
−0.020**(0.018)
−0.019**(0.020)
−0.016*(0.059)
−0.018**(0.033)
Year effects Yes Yes Yes Yes YesObs. 263 263 263 263 263Adj. R2 0.347 0.338 0.342 0.335 0.336Prob N F 0.000 0.000 0.000 0.000 0.000
213B.B. Francis et al. / Journal of Corporate Finance 25 (2014) 202–215
extent that such cultural differences magnify uncertainty and information asymmetry, learning from others becomes especiallycrucial.
4. Conclusion
In this study we examine the financial performance of cross-border US M&As in developing economy markets between 1993and 2010, as well as the ability of the stock market to predict this performance on a short- and a long-run basis, controlling for the
Table 7Learning by observing by cultural distance.This table summarizes the effect of learning by observing on acquisition performance, controlling for target country cultural heterogeneity. We define CultureClose as a dummy variable that receives a value of one for target countries that are culturally similar to the US, and zero otherwise, based on the sample mediandifference between the US and all target countries in a given year. Culture measures are from Hofstede (1980, 2001). We use the same control variables as inTables 3–6 but omit their coefficients for brevity and focus on learning-by-observing variables. For every dependent variable, we separately use each one of ourfive learning-by-observing measures, as we did above, resulting in 20 regressions (five for each performance measure) for culturally distant- and culturally- closetargets, respectively.
Culture far Culture close
Completeness(N = 272)
ΔROA(N = 69)
Five-year BHAR(N = 114)
CARsa
(N = 131)Completeness(N = 271)
ΔROA(N = 99)
Five-year BHAR(N = 121)
CARsa
(N = 132)
(1) (2) (3) (4) (5) (6) (7) (8)
Learning-by-observingCLBO 0.002**
(0.022)0.001**(0.020)
0.001***(0.000)
0.001*(0.100)
0.001(0.654)
0.001(0.160)
−0.001(0.994)
0.001(0.160)
CLBO_US 0.020**(0.040)
0.003*(0.053)
0.008**(0.043)
0.001*(0.100)
0.021(0.120)
0.001(0.189)
0.006**(0.049)
0.001(0.767)
Top News 0.009(0.784)
0.008(0.221)
0.008(0.281)
0.003***(0.000)
0.012(0.329)
0.009(0.114)
0.009(0.144)
0.003(0.183)
CILBO 0.032*(0.074)
0.008*(0.090)
0.021**(0.031)
0.002*(0.090)
0.068(0.107)
0.004**(0.029)
0.006(0.555)
0.004(0.363)
CILBO_US 0.283***(0.004)
0.025*(0.100)
0.025(0.627)
0.010(0.260)
0.191(0.111)
0.009**(0.020)
0.047**(0.053)
0.01(0.904)
a The learning by observing coefficients reported for CAR regressions are the interaction between our learning-by-observing measures and the high-tech targetdummy variable.
214 B.B. Francis et al. / Journal of Corporate Finance 25 (2014) 202–215
possibility that acquirers and investors can learn by observing other predecessors in the same target country. We find persistentevidence of improved post-merger financial performance as well as evidence of more accurate stock market predictions of thisperformance, consistent with the possibility that acquirers learn from the experience of their predecessors.
We hypothesize that managers of acquiring firms can learn by observing information that spills over from recent mergers,where we distinguish this passive learning from the more traditional notion of active learning-by-doing. Although we find weakevidence of learning associated with the mere quantity of past mergers, we document a strong, positive relationship betweenacquisition performance, measured by the likelihood of deal completion, post merger-financial performance and short andlong-term market performance, and learning by observing similar trait, local, same industry peers and/or qualitative newscoverage about the outcome of prior deals.
Similarly, we hypothesize that investors become better able to accurately value mergers by observing the performance ofpredecessors. Indeed, we find evidence consistent with the conjecture that the stock market learns by observing in the long run,and also in the short run, when targets are affiliated with the high-tech industry. The positive effect of learning-by-observing onacquisition success in the high-tech industry is consistent with the interpretation that risk-averse investors are willing, ceterisparibus, to pay higher prices in high information states if information uncertainty is reduced by learning from predecessors.
Finally, we examine whether cultural heterogeneity strengthens acquirers' reliance on learning-by-observing in developingmarket acquisitions. Not surprisingly, we find that the positive effect of learning from others on acquisition performance is morestrongly pronounced in culturally remote markets, indicating that such learning is more beneficial in economic settings that areinherently different from that of the US.
Our results indicate that learning from others matters in the context of cross-border, developing market M&As. With theincreasing integration of the world's economies, it is likely that more mergers will involve firms from different countries,including countries in developing markets. We thus provide an important, preliminary analysis of the patterns of learning thatmatter in highly uncertain and complex economic environments, where a firm's own acquisition experience might be limited andtherefore insufficient for effective learning. While academics have long been aware of information spillovers across firms andindustries in the context of M&As, there is very little evidence about whether such observational learning has a real effect on theperformance of acquiring firms. Our findings shed light on one channel through which information spillovers across industriesand acquiring firms could be a key driver of value creation in developing market, cross-border M&As. To the best of ourknowledge, this article is the first to address the importance of learning from others for a sample that is not potentially biased byfocusing on one industry. Our results should have important managerial implications, because they reveal the importance oflearning-by-observing. An organizational structure flexible enough to encourage such learning thus appears highly desirable,especially in developing market, culturally distant acquisitions.
Acknowledgments
We thank Jeffery Netter (the editor) and an anonymous reviewer for their valuable feedback. We are also grateful to NadaKobeissi for her helpful comments and help. Xiaolin Cheng provided research assistant help. We are responsible for all errors.
215B.B. Francis et al. / Journal of Corporate Finance 25 (2014) 202–215
References
Ahern, K., Daminelli, D., Fracassi, C., 2013. Lost in translation? The effect of cultural values on mergers around the world. J. Financ. Econ. (in press).Aktas, N., Bodt, E.D., Roll, R., 2013. Learning from repetitive acquisitions: evidence from the time between deals. J. Financ. Econ. 108, 99–117.Almazan, A., de Motta, A., Titman, S., Uysal, V.B., 2010. Financial structure, acquisition opportunities, and firm locations. J. Financ. 65, 529–563.Almeida, P., Kogut, B., 1999. Localization of knowledge and the mobility of engineers in regional networks. Manag. Sci. 45, 905–917.Bala, V., Goyal, S., 1998. Learning from neighbors. Rev. Econ. Stud. 65, 595–621.Barkema, H.G., Schijven, M., 2008. How do firms learn to make acquisitions? A review of past research and an agenda for the future. J. Manag. 34, 594–634.Baum, J.A.C., Li, S.X., Usher, J.M., 2000. Making the next move: how experiential and vicarious learning shape the locations of chains' acquisitions. Adm. Sci. Q. 45,
766–801.Beckman, C.M., Haunschild, P.R., 2002. Network learning: the effects of partners' heterogeneity of experience on corporate acquisitions. Adm. Sci. Q. 47, 92–124.Bikhchandani, S., Hirshleifer, D., Welch, I., 1998. Learning from the behavior of others: conformity, fads, and informational cascades. J. Econ. Perspect. 12, 151–170.Bris, A., Cabolis, C., 2008. The value of investor protection: firm evidence from cross-border mergers. Rev. Financ. Stud. 21 (2), 605–648.Bris, A., Brisley, N., Cabolis, C., 2008. Adopting better corporate governance: evidence from cross-border mergers. J. Corp. Finance 14, 224–240.Brown, S.J., Warner, J.B., 1980. Measuring security price performance. J. Financ. Econ. 8, 205–258.Burns, N., Francis, B., Hasan, I., 2007. Cross-listing and legal bonding: evidence from mergers and acquisitions. J. Bank. Finance 31, 1003–1031.Cai, J., Song, M.H., Walking, R.A., 2011. Anticipation, acquisitions, and bidder returns: industry shocks and the transfer of information across rivals. Rev. Financ.
Stud. 24, 2242–2285.Chakrabarti, R., Gupta-Mukherjee, S., Jayaraman, N., 2009. Mars–Venus marriages: culture and cross-border M&A. J. Int. Bus. Stud. 40, 216–236.Chari, A., Ouimet, P.P., Tesar, L.L., 2010. The value of control in emerging markets. Rev. Financ. Stud. 23, 1741–1770.Choi, S., Francis, B., Hasan, I., 2010. Cross border M&As and bank risk: evidence from the bond market. J. Money Credit Bank. 42, 615–645.Coleman, J., 1966. Medical Innovation: A Diffusion Study. Bobbs-Merrill, New York.DeLong, G., 2001. Stockholder gains from focusing versus diversifying bank mergers. J. Financ. Econ. 59, 221–252.DeLong, G., DeYoung, R., 2007. Learning by observing: information spillovers in the execution and valuation of commercial bank M&As. J. Financ. 62, 181–216.Francis, B., Hasan, I., Sun, X., 2008. Financial market integration and the value of global diversification: evidence for U.S. acquirers in cross-border mergers and
acquisitions. J. Bank. Financ. 32, 1522–1640.Griliches, Z., 1979. Issues in assessing the contribution of research and development to productivity growth. Bell J. Econ. 10, 92–116.Guillén, M.F., 2002. Structural inertia, imitation, and foreign expansion: South Korean firms and business groups in China, 1987–1995. Acad. Manag. J. 45,
509–525.Hagerstrand, T., 1969. Innovation Diffusion as a Spatial Process. University of Chicago Press, Chicago.Hasan, I., Khalil, F., Sun, X., 2012. Do Intellectual Protection Reforms Create Value? Evidence From Cross-Border Mergers and Acquisitions. Working Paper.Haunschild, P.R., 1993. Interorganizational imitation: the impact of interlocks on corporate acquisition activity. Adm. Sci. Q. 38, 564–592.Haunschild, P.R., 1994. How much is that company worth? Interorganizational relationships, uncertainty, and acquisition premiums. Adm. Sci. Q. 39, 391–411.Haunschild, P.R., Beckman, C., 1998. When do interlocks matter? Alternative sources of information and interlock influence. Adm. Sci. Q. 43, 815–844.Haunschild, P.R., Miner, A.S., 1997. Modes of inter-organizational imitation: the effects of salience and un-certainty. Adm. Sci. Q. 42, 472–500.Hofstede, G.H., 1980. Culture Consequences: International Differences in Work-related Values. Sage Publications, London.Hofstede, G.H., 2001. Culture's Consequences: Comparing Values, Behaviors, Institutions, and Organizations Across Nations, 2nd ed. Sage Publications, Inc.,
Thousand Oaks, California.Hunter, W.C., Jagtiani, J., 2003. An analysis of advisor choice, fees, and effort in mergers and acquisitions. Rev. Financ. Econ. 12, 65–81.Irwin, D., Klenow, P., 1996. High-tech R&D subsidies—estimating the effects of SEMATECH. J. Int. Econ. 40, 323–344.Jaggers, K., Marshall, M.G., 2000. Polity IV Project. Center for International Development and Conflict Management.University of Maryland.Kaufmann, D., Kraay, A., Mastruzzi, M., 2010. The worldwide governance indicators: methodology and analytical issues. Policy Research Working Paper Series
5430, The World Bank.Kedia, S., Panchapagesan, V., Uysal, V.B., 2008. Geography and acquirer returns. J. Financ. Intermed. 17, 256–275.Kogut, B., Singh, H., 1988. The effect of national culture on the choice of entry mode. J. Int. Bus. Stud. 19, 411–432.Kotler, P., 1986. The prosumer movement: a new challenge for marketers. Adv. Consum. Res. 13, 510–513.Lieberman, M., Asaba, S., 2006. Why do firms imitate each other? Acad. Manag. Rev. 31 (2), 366–385.Martynova, M., Renneboog, L., 2008a. A century of corporate takeovers: what have we learned and where do we stand? J. Bank. Financ. 32, 2148–2177.Martynova, M., Renneboog, L., 2008b. Spillover of corporate governance standards in cross- border mergers and acquisitions. J. Corp. Finance 14, 200–223.Miner, A.S., Haunschild, P.R., 1995. Population level learning. Res. Organ. Behav. 17, 115–166.Mitchell, M.L., Stafford, E., 2000. Managerial decisions and long-term stock price performance. J. Bus. 73, 287–329.Moeller, S.B., Schlingemann, F.P., Stulz, R.M., 2004. Firm size and the gains from acquisition. J. Financ. Econ. 73, 201–228.Ofek, E., Sarvary, M., 2001. Leveraging the customer base: creating competitive advantage through knowledge management. Manag. Sci. 47, 1441–1456.Ongena, S., Penas, M.F., 2009. Bondholders' wealth effects in domestic and cross-border bank mergers. J. Financ. Stab. 5, 256–271.Rose, A.K., 2000. One money, one market: estimating the effect of common currencies on trade. Econ. Policy 30, 7–45.Ryan, B., Gross, N., 1943. The diffusion of hybrid seed corn in two Iowa communities. Rural. Sociol. 8, 15–24.Sevilir, M., Tian, X., 2010. Acquiring Innovation. Working paper. Indiana University.Tetlock, P.C., 2007. Giving content to investor sentiment: the role of media in the stock market. J. Financ. 62, 1139–1168.Tetlock, P.C., 2010. Does public financial news resolve asymmetric information? R. Financ. Stud. 23, 3520–3557.Uysal, V.B., Kedia, S., Panchapagesan, V., 2008. Geography and acquirer returns. J. Financ. Intermed. 17, 256–275.Weber, R., Colin, F.C., 2003. Cultural conflict and merger failure: An experimental approach. Manage. Sci. 49 (4), 400–415.Westphal, J.D., Seidel, M-D.L., Stewart, K.J., 2001. Second order imitation: uncovering latent effects of board network ties. Admin. Sci. Quart. 46 (4), 717–747.Yang, M., Hyland, M.A., 2006. Who do firms imitate? A multilevel approach to examining sources of imitation in the choice of mergers and acquisitions. J. Manage.
32, 381–399.Zollo, M., Singh, H., 2004. Deliberate learning in corporate acquisitions: post-acquisition strategies and integration capability in U.S. bank mergers. Strateg. Manag.