58
Canadian Environmental Sector Trends LABOUR MARKET STUDY 2010
Canadian Environmental Sector Trends L A B O U R M A R K E T S T U D Y
2010
E C O C A N A D A
ECO Canada develops programs that help individuals build meaningful
environmental careers, provides employers with resources to find and keep the
best environmental practitioners, and informs educators and governments of
employment trends to ensure the ongoing prosperity of this growing sector.
L A B O U R M A R K E T R E S E A R C H
ECO Canada Labour Market Research investigates current environmental skill and
labour trends within the environmental profession and provides up-to-date, timely
and relevant insights that can be applied in policy, business, and educational contexts.
The complete collection of reports is available at www.eco.ca.
1
Table of Contents3 1.0 INTRODUCTION
3 1.1 About ECO Canada
3 1.2 Research Objectives
4 2.0 EXECUTIVE SUMMARY
11 3.0 DEFINING THE ENVIRONMENTAL SECTOR
12 3.1 Canadian Environmental Goods and Services Sector Model (CEGSS)
13 3.1.1 Canadian Context
14 3.2 Employment Data Availability and Quality
15 4.0 KEY EMERGING TRENDS
15 4.1 Carbon & climate change mitigation
17 4.2 Energy-efficiency
18 4.3 Renewable energy sources
19 4.4 Alternative fuels and alternative fuel vehicles
19 4.5 Eco-innovation
21 4.6 Environmental management practices
22 5.0 DRIVERS OF SUB-SECTOR EMPLOYMENT
24 6.0 GLOBAL TRENDS
24 6.1 Global environmental employment growth
28 6.2 Global environmental goods and services exports
30 6.3 Global trends affecting environmental employment
33 7.0 SOCIAL, ECONOMIC & POLITICAL TRENDS
34 8.0 DRIVERS OF GROWTH IN CANADA’S ENVIRONMENTAL SECTOR
35 8.1 Policy and regulation drivers
36 8.1.1 Employment demand as a result of direct Canadian government spending
37 8.1.2 Employment demand driven by policy compliance activities
38 8.1.3 Policy compliance as a driver of environmental innovation
38 8.1.4 Policy incentives as a driver of
eco-innovation
40 8.2 Financial and economic drivers
40 8.2.1 Efficiency & costs savings
40 8.2.2 Access to developing markets
40 8.3 Other economic and environmental linkages
41 8.4 Consumer and businesses-to-business demand
44 8.5 Trend toward pollution prevention
44 8.6 Trend toward diversification
46 9.0 CONSTRAINTS TO GROWTH OF THE CANADIAN EVIRONMENTAL SECTOR
49 Appendix A: RESEARCH METHODOLOGY
53 Appendix B: SOURCES CITED

2
Special thanks to all of the environmental sector experts who
shared their knowledge in the development of this study and
helped make this study a success.
ECO Canada extends gratitude to RDA Global for their
research advice, and for carrying out the research for this
study, including data collection, analysis and report writing.
The financial support of Human Resources and Skills
Development Canada’s Sector Council Program, without
which this study would not have been possible, is gratefully
acknowledged. Also, ECO Canada thanks HRSDC for their
continued support of labour market research.
Finally, thanks are due for the support from all the ECO
Canada staff members who were directly and indirectly
involved in this study.
Acknowledgements
3
1.0 INTRODUCTION
1.1 ABOUT ECO CANADA
Environmental Careers Organization Canada (ECO Canada)
is a not-for-profit corporation that assists the Canadian
environment sector in implementing sound human resource
development policies. Since its founding in 1992 (as the
Canadian Council for Human Resources in the Environment
Industry, or CCHREI), ECO Canada has taken great strides
toward developing a national human resource strategy that
is focused towards the needs of environmental practitioners,
employers and educators.
1.2 RESEARCH OBJECTIVES
ECO Canada has been collecting labour market information
relevant to the environmental sector for over 15 years. Due
to the dispersed and diversified nature of the sector itself, the
majority of available information has had limited applicability,
as regional and other modalities are often so substantive
that it is hard to identify common denominators and monitor
common indicators.
Consequently, ECO Canada commissioned this study to obtain
baseline data from a macro and micro level, to help determine
the factors and drivers of change and growth within the
environmental sector, with a special focus on how those
changes impact employment, occupations and labour issues.
The report provides employers, government, environmental
practitioners and ECO Canada with a broad and detailed
overview of the trends affecting growth in Canada’s
environmental sector. It also contains extensive background
on the sector’s history, as well as the drivers of and barriers
to growth within the sector. The research in the report is
organized according to a new model for categorization of
employment in the environmental sector that is based on
the definitional structure of the Environmental Goods and
Services Sector. Use of this definitional framework, which
was recently adopted by the United Nations and the European
Commission, allows for comparisons between Canada and
other nations.
The report contains statistics and commentary useful for
policy development to support growth of the sector. Findings
have implications for developing a proactive policy for human
resource development, and addressing current and future
potential labour supply and demand gaps. It may also be used
to inform government policy decisions on the direction of
future environmental employment, providing insight on the
impacts that social, economic and other drivers may have. The
project also provides direction to government regarding what
areas of environmental employment are of primary importance
to support and, therefore, which policies may be implemented
to ensure the healthy future development of environmental
employment in Canada.
As part of this project, the research team spoke with several
experts in the Canadian environmental industry and its
sub-divisions. These informants identified key trends that
they view as major factors currently driving changes in
environmental employment in Canada, as well as potential
drivers for the future. In the report, these trends are explored
using secondary data to describe how they are likely to shape
demand for environmental employment in the future. Beyond
discussion of these macro trends, key micro trends in each sub-
sector of the environmental sector and their potential impact
on the environmental labour market are outlined in a separate
ECO Canada report entitled Future Growth Expectations for Worker Demand within Each Environmental Sub-Sector.
The report provides employers, government, environmental
practitioners and ECO Canada with a broad and detailed overview of the trends affecting growth in Canada’s environmental sector.
4
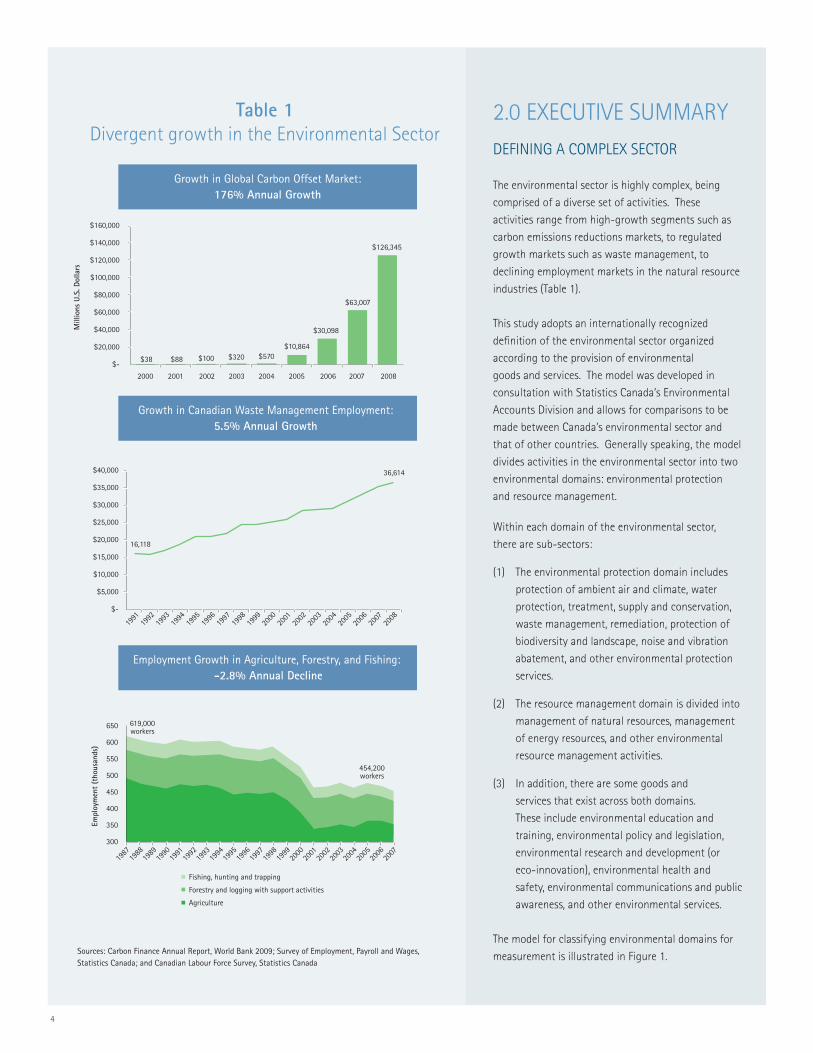
Table 1
Divergent growth in the Environmental Sector
2000 2001 2002 2003 2004 2005 2006 2007 2008
$38 $88 $100 $320 $570$10,864
$30,098
$63,007
$126,345
$160,000
$140,000
$120,000
$100,000
$80,000
$60,000
$40,000
$20,000
$-
Mill
ions
U.S
. Dol
lars
1991
1992
1993
1994
1995
1996
1997
1998
1999
2000
2001
2002
2003
2004
2005
2006
2007
2008
$40,000
$35,000
$30,000
$25,000
$20,000
$15,000
$10,000
$5,000
$-
16,118
36,614
Empl
oym
ent
(tho
usan
ds)
1987
1988
1989
1990
1991
1992
1993
1994
1995
1996
1997
1998
1999
2000
2001
2002
2003
2004
2005
2006
2007
650
600
550
500
450
400
350
300
619,000workers
454,200workers
Fishing, hunting and trapping
Forestry and logging with support activities
Agriculture
Growth in Global Carbon Offset Market:176% Annual Growth
Growth in Canadian Waste Management Employment:5.5% Annual Growth
Employment Growth in Agriculture, Forestry, and Fishing: -2.8% Annual Decline
Sources: Carbon Finance Annual Report, World Bank 2009; Survey of Employment, Payroll and Wages, Statistics Canada; and Canadian Labour Force Survey, Statistics Canada
2.0 EXECUTIVE SUMMARY
DEFINING A COMPLEX SECTOR
The environmental sector is highly complex, being
comprised of a diverse set of activities. These
activities range from high-growth segments such as
carbon emissions reductions markets, to regulated
growth markets such as waste management, to
declining employment markets in the natural resource
industries (Table 1).
This study adopts an internationally recognized
definition of the environmental sector organized
according to the provision of environmental
goods and services. The model was developed in
consultation with Statistics Canada’s Environmental
Accounts Division and allows for comparisons to be
made between Canada’s environmental sector and
that of other countries. Generally speaking, the model
divides activities in the environmental sector into two
environmental domains: environmental protection
and resource management.
Within each domain of the environmental sector,
there are sub-sectors:
(1) The environmental protection domain includes
protection of ambient air and climate, water
protection, treatment, supply and conservation,
waste management, remediation, protection of
biodiversity and landscape, noise and vibration
abatement, and other environmental protection
services.
(2) The resource management domain is divided into
management of natural resources, management
of energy resources, and other environmental
resource management activities.
(3) In addition, there are some goods and
services that exist across both domains.
These include environmental education and
training, environmental policy and legislation,
environmental research and development (or
eco-innovation), environmental health and
safety, environmental communications and public
awareness, and other environmental services.
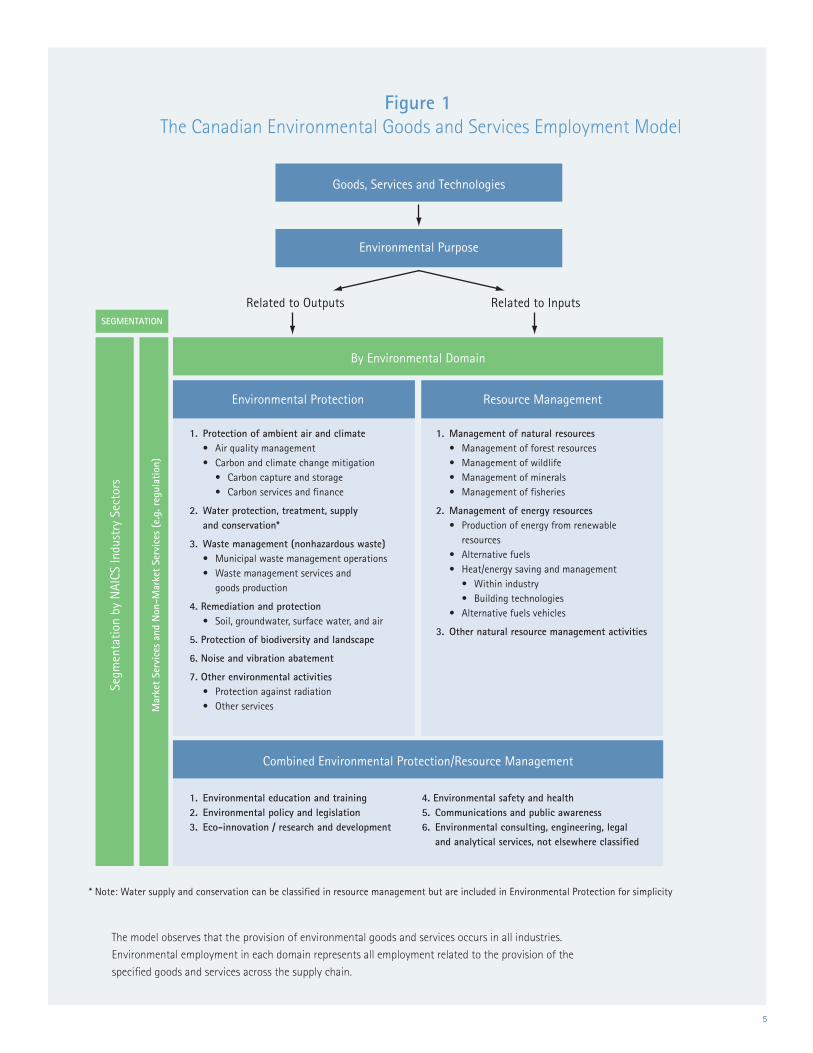
The model for classifying environmental domains for
measurement is illustrated in Figure 1.
5
Figure 1 The Canadian Environmental Goods and Services Employment Model
Goods, Services and Technologies
Environmental Purpose
By Environmental Domain
Combined Environmental Protection/Resource Management
Segm
enta
tion
by N
AICS
Indu
stry
Sec
tors
Mar
ket
Serv
ices
and
Non
-Mar
ket
Serv
ices
(e.
g. r
egul
atio
n)
Related to Outputs Related to Inputs
Environmental Protection Resource Management
1. Protection of ambient air and climate Air quality management Carbon and climate change mitigation Carbon capture and storage Carbon services and finance
2. Water protection, treatment, supply and conservation*
3. Waste management (nonhazardous waste) Municipal waste management operations Waste management services and goods production
4. Remediation and protection Soil, groundwater, surface water, and air
5. Protection of biodiversity and landscape
6. Noise and vibration abatement
7. Other environmental activities Protection against radiation Other services
1. Management of natural resources
2. Management of energy resources resources
3. Other natural resource management activities
1. Environmental education and training2. Environmental policy and legislation3. Eco-innovation / research and development
4. Environmental safety and health5. Communications and public awareness6. Environmental consulting, engineering, legal and analytical services, not elsewhere classified
SEGMENTATION
* Note: Water supply and conservation can be classified in resource management but are included in Environmental Protection for simplicity
The model observes that the provision of environmental goods and services occurs in all industries.
Environmental employment in each domain represents all employment related to the provision of the
specified goods and services across the supply chain.
6
EMERGING ENVIRONMENTAL MARKETS
Emerging areas of the environmental sector, namely carbon
& climate change mitigation and investments in energy
efficiency and renewable energy resources will drive the
greatest future growth for the environmental sector and should
be incorporated into future definitions and models of the
environmental sector.
Carbon & climate change mitigation
Very little data currently exists to measure employment growth
resulting from carbon & climate change mitigation activities.
However, several indicators suggest very high growth potential.
The global market for carbon credits has increased from $38
MM USD in 2000 to over $126 billion in 2008, averaging 175%
growth per year over the period. The Province of Alberta has
set aside $2 billion for carbon capture and storage technology.
Global retailer giant Wal-Mart now requires manufacturers
throughout the firm’s global supply chain to measure and
reduce their carbon footprint.
Activities in carbon & climate change mitigation have the
potential to have massive impacts on environmental sector
investment and labour demand. Emissions cap and trade
legislation in the EU and elsewhere has driven strong demand
for low-carbon products and services, as well as a host of new
professional and technical services to reduce, monitor, measure,
monetize, and mitigate carbon emissions. Even without
similar national legislation in Canada, provincial legislation
and preemptive measures taken by firms is driving strong
investment in the sector. National Canadian policy could also
drive various forms of eco-innovation, giving Canadian firms an
early-move advantage in North America.
Energy efficiency & renewable energy generation
Industry expenditures on energy efficiency were $1.97 billion in
2006 and grew at 16% per year between 2002 and 2006. Cost
reduction is the main driver for investment in energy efficiency
with 77% of firms investing in energy efficient technology
citing “sufficient return on investment” as a key driver of
investment. Government incentives for energy-efficiency
improvements in the residential and commercial sectors are
driving high growth in green construction. Between 2008 and
2009, the number of approved energy auditors in Canada grew
by 76% from 1,004 auditors to 1,770.
The renewable energy sector has experienced double-digit
growth annually over the past decade. This is expected to
continue in the next decade, accompanied by high market
growth for alternative fuels and alternative fuel vehicles.
Activities related to climate change adaptation, eco-
innovation, and environmental management practices will also
likely see strong growth in the future.
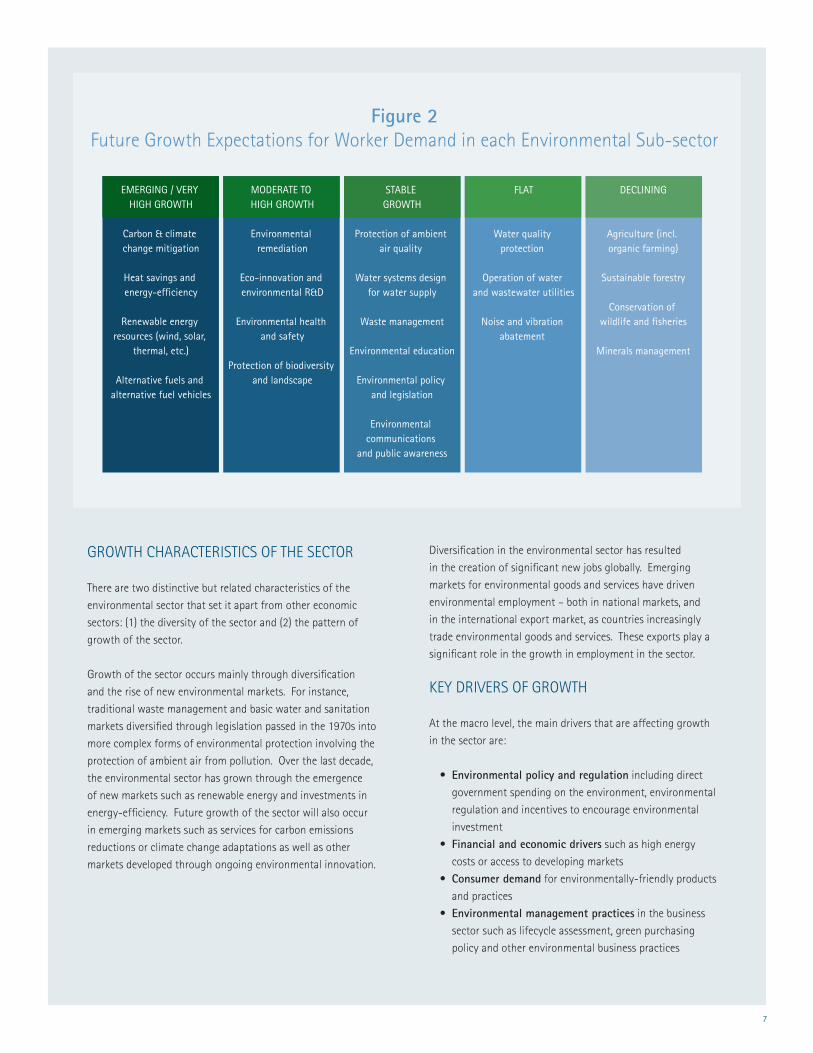
ASSESSMENT OF FUTURE GROWTH IN ENVIRONMENTAL SUB-SECTORS
Due to limited data availability on the sector, it is difficult to
estimate the exact rate of growth of the individual sub-sectors.
Analysis of the drivers and indicators of growth highlights that
the rates of growth for individual sub-sectors likely differs
significantly, with some sub-sectors experiencing very high
growth and others experiencing structural decline. Figure 2
shows a qualitative assessment of the future growth of sub-
sectors in the environmental sector, based on recent trends
and expert opinion on future prospects. The table represents
growth in demand for the total number of workers and does
not reflect replacement demand or demand for changing skills.
A Trend toward Prevention
Over the last decade there has been a gradual trend toward
pollution prevention activities as a replacement for pollution
abatement and control activities. This trend has, for instance,
resulted in a difference in the type of capital expenditures
firms made for environmental protection. As this trend
continues to evolve, it is blurring the distinction between the
environmental sector and traditional industries. For instance,
manufacturers initially introduced environmental innovations
such as energy-efficiency improvements to their products as a
means of adding value for differentiation in the marketplace.
As the trend continues, energy efficiency may be seen as a
characteristic common to products in the marketplace, making
it difficult to discern where the environmental sector ends and
other sectors begin.
7
GROWTH CHARACTERISTICS OF THE SECTOR
There are two distinctive but related characteristics of the
environmental sector that set it apart from other economic
sectors: (1) the diversity of the sector and (2) the pattern of
growth of the sector.
Growth of the sector occurs mainly through diversification
and the rise of new environmental markets. For instance,
traditional waste management and basic water and sanitation
markets diversified through legislation passed in the 1970s into
more complex forms of environmental protection involving the
protection of ambient air from pollution. Over the last decade,
the environmental sector has grown through the emergence
of new markets such as renewable energy and investments in
energy-efficiency. Future growth of the sector will also occur
in emerging markets such as services for carbon emissions
reductions or climate change adaptations as well as other
markets developed through ongoing environmental innovation.
Diversification in the environmental sector has resulted
in the creation of significant new jobs globally. Emerging
markets for environmental goods and services have driven
environmental employment – both in national markets, and
in the international export market, as countries increasingly
trade environmental goods and services. These exports play a
significant role in the growth in employment in the sector.
KEY DRIVERS OF GROWTH
At the macro level, the main drivers that are affecting growth
in the sector are:
• Environmental policy and regulation including direct
government spending on the environment, environmental
regulation and incentives to encourage environmental
investment
• Financial and economic drivers such as high energy
costs or access to developing markets
• Consumer demand for environmentally-friendly products
and practices
• Environmental management practices in the business
sector such as lifecycle assessment, green purchasing
policy and other environmental business practices
Figure 2Future Growth Expectations for Worker Demand in each Environmental Sub-sector
EMERGING / VERY HIGH GROWTH
Carbon & climate change mitigation
Heat savings and energy-efficiency
Renewable energy resources (wind, solar,
thermal, etc.)
Alternative fuels and alternative fuel vehicles
MODERATE TO HIGH GROWTH
Environmental remediation
Eco-innovation and environmental R&D
Environmental health and safety
Protection of biodiversity and landscape
STABLE GROWTH
Protection of ambient air quality
Water systems design for water supply
Waste management
Environmental education
Environmental policy and legislation
Environmental communications
and public awareness
DECLINING
Agriculture (incl. organic farming)
Sustainable forestry
Conservation of wildlife and fisheries
Minerals management
FLAT
Water quality protection
Operation of water and wastewater utilities
Noise and vibration abatement
8
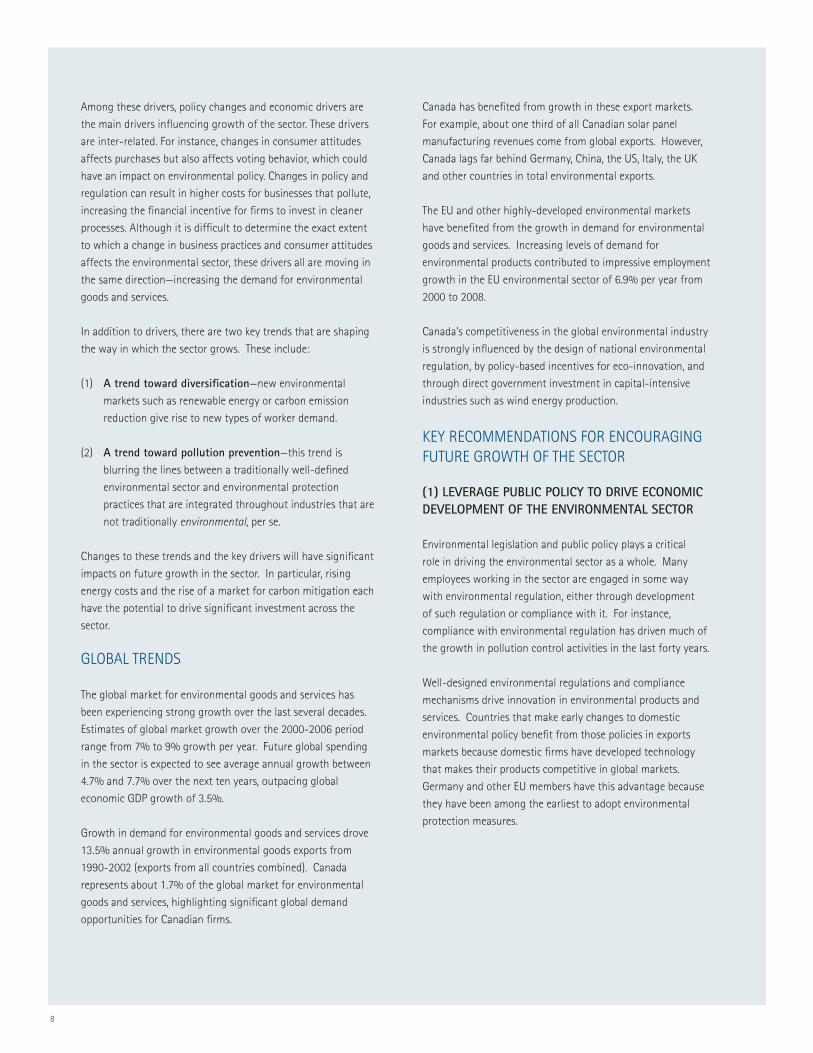
Among these drivers, policy changes and economic drivers are
the main drivers influencing growth of the sector. These drivers
are inter-related. For instance, changes in consumer attitudes
affects purchases but also affects voting behavior, which could
have an impact on environmental policy. Changes in policy and
regulation can result in higher costs for businesses that pollute,
increasing the financial incentive for firms to invest in cleaner
processes. Although it is difficult to determine the exact extent
to which a change in business practices and consumer attitudes
affects the environmental sector, these drivers all are moving in
the same direction—increasing the demand for environmental
goods and services.
In addition to drivers, there are two key trends that are shaping
the way in which the sector grows. These include:
(1) A trend toward diversification—new environmental
markets such as renewable energy or carbon emission
reduction give rise to new types of worker demand.
(2) A trend toward pollution prevention—this trend is
blurring the lines between a traditionally well-defined
environmental sector and environmental protection
practices that are integrated throughout industries that are
not traditionally environmental, per se.
Changes to these trends and the key drivers will have significant
impacts on future growth in the sector. In particular, rising
energy costs and the rise of a market for carbon mitigation each
have the potential to drive significant investment across the
sector.
GLOBAL TRENDS
The global market for environmental goods and services has
been experiencing strong growth over the last several decades.
Estimates of global market growth over the 2000-2006 period
range from 7% to 9% growth per year. Future global spending
in the sector is expected to see average annual growth between
4.7% and 7.7% over the next ten years, outpacing global
economic GDP growth of 3.5%.
Growth in demand for environmental goods and services drove
13.5% annual growth in environmental goods exports from
1990-2002 (exports from all countries combined). Canada
represents about 1.7% of the global market for environmental
goods and services, highlighting significant global demand
opportunities for Canadian firms.
Canada has benefited from growth in these export markets.
For example, about one third of all Canadian solar panel
manufacturing revenues come from global exports. However,
Canada lags far behind Germany, China, the US, Italy, the UK
and other countries in total environmental exports.
The EU and other highly-developed environmental markets
have benefited from the growth in demand for environmental
goods and services. Increasing levels of demand for
environmental products contributed to impressive employment
growth in the EU environmental sector of 6.9% per year from
2000 to 2008.
Canada’s competitiveness in the global environmental industry
is strongly influenced by the design of national environmental
regulation, by policy-based incentives for eco-innovation, and
through direct government investment in capital-intensive
industries such as wind energy production.
KEY RECOMMENDATIONS FOR ENCOURAGING FUTURE GROWTH OF THE SECTOR
(1) LEVERAGE PUBLIC POLICY TO DRIVE ECONOMIC DEVELOPMENT OF THE ENVIRONMENTAL SECTOR
Environmental legislation and public policy plays a critical
role in driving the environmental sector as a whole. Many
employees working in the sector are engaged in some way
with environmental regulation, either through development
of such regulation or compliance with it. For instance,
compliance with environmental regulation has driven much of
the growth in pollution control activities in the last forty years.
Well-designed environmental regulations and compliance
mechanisms drive innovation in environmental products and
services. Countries that make early changes to domestic
environmental policy benefit from those policies in exports
markets because domestic firms have developed technology
that makes their products competitive in global markets.
Germany and other EU members have this advantage because
they have been among the earliest to adopt environmental
protection measures.
9
There are several emerging opportunities for Canada to develop
a North America early-adopter advantage. Key growth areas
include markets for carbon emissions reductions, technology
for climate change adaptations, renewable energy and energy
efficiency markets, and markets for recycled materials. Clear rules
for climate change policy will give rise to growth opportunities
in carbon finance, demand for carbon accounting skills, carbon
trading, and a variety of investments in carbon emissions
reductions.
Recycling regulations are a good example of how different
requirements can have different employment effects.
Recycling policy in Canada has not placed many restrictions on
manufacturers to take responsibility for the waste generated by
products that they sell. The EU has enacted ‘take-back’ legislation
requiring manufactures to take responsibility for recycling of
products once they have reached the end of their useful lives.
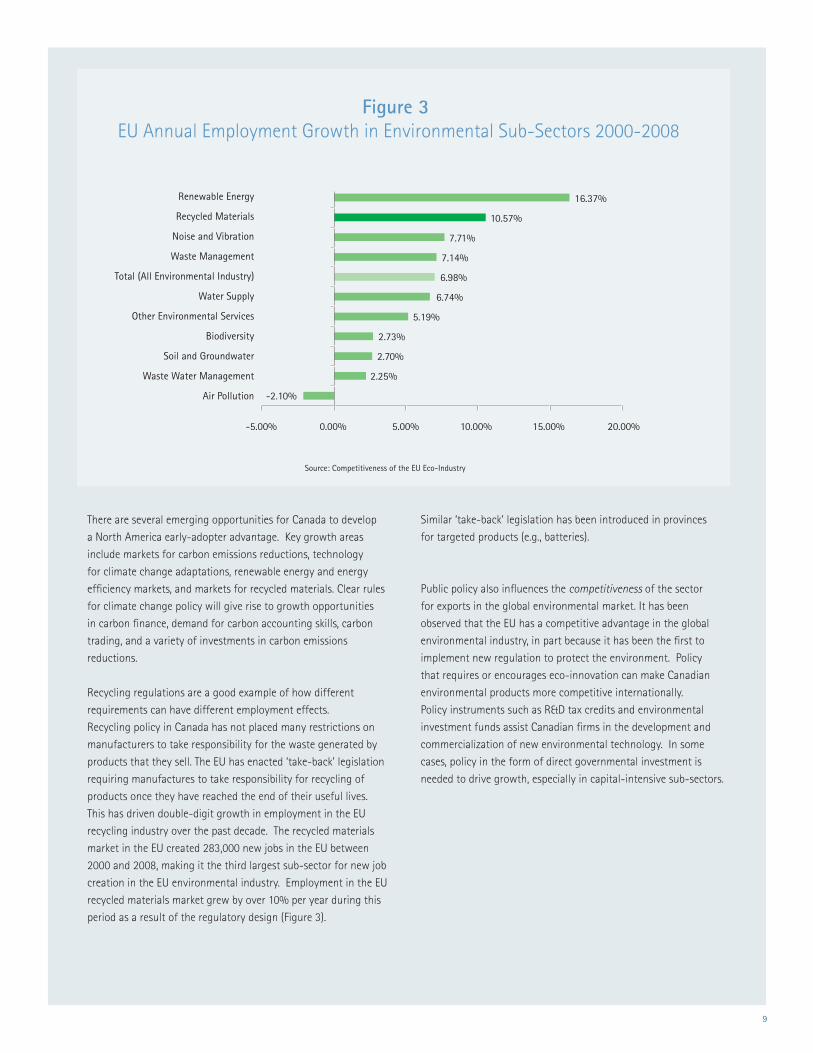
This has driven double-digit growth in employment in the EU
recycling industry over the past decade. The recycled materials
market in the EU created 283,000 new jobs in the EU between
2000 and 2008, making it the third largest sub-sector for new job
creation in the EU environmental industry. Employment in the EU
recycled materials market grew by over 10% per year during this
period as a result of the regulatory design (Figure 3).
Similar ‘take-back’ legislation has been introduced in provinces
for targeted products (e.g., batteries).
Public policy also influences the competitiveness of the sector
for exports in the global environmental market. It has been
observed that the EU has a competitive advantage in the global
environmental industry, in part because it has been the first to
implement new regulation to protect the environment. Policy
that requires or encourages eco-innovation can make Canadian
environmental products more competitive internationally.
Policy instruments such as R&D tax credits and environmental
investment funds assist Canadian firms in the development and
commercialization of new environmental technology. In some
cases, policy in the form of direct governmental investment is
needed to drive growth, especially in capital-intensive sub-sectors.
Renewable Energy
Recycled Materials
Noise and Vibration
Waste Management
Total (All Environmental Industry)
Water Supply
Other Environmental Services
Biodiversity
Soil and Groundwater
Waste Water Management
Air Pollution
16.37%
10.57%
7.71%
7.14%
6.98%
6.74%
5.19%
2.73%
2.70%
2.25%
-2.10%
-5.00% 0.00% 5.00% 10.00% 15.00% 20.00%
Figure 3 EU Annual Employment Growth in Environmental Sub-Sectors 2000-2008
Source: Competitiveness of the EU Eco-Industry
10
Since industry has traditionally viewed environmental regulation
compliance as an expense, most policy has been designed to look
at the economic costs vs. the environmental benefits of a policy.
Future evaluation of policy and regulatory design should evaluate
not only environmental quality benefits, but economic benefits
that can be achieved through policy, including new environmental
sector job creation. Since the sector grows mainly through the
emergence of new environmental markets, economic cost-benefit
analyses should be performed on environmental legislation to
estimate the job creation potential for various policy alternatives.
Ongoing policy economic analysis for all sub-sectors of the
environmental sector should be a priority for encouraging future
employment growth.
(2) STRENGTHEN LABOUR SUPPLY AND SKILLS FOR THE ENVIRONMENTAL SECTOR
Canada’s competitiveness in the environmental industry depends
upon the availability of a skilled workforce. For environmental
practitioners to be prepared, more coordination is needed
between employers and educational and training institutions.
Labour requirements in some industries are easily defined, such
as in the construction industry, which is largely comprised of
workers in a set of well-defined construction trades. This is not
the case with the environmental sector, which is highly complex
and is in a constant state of flux. The skills required in the sector
are constantly changing in response to new innovation, and the
evolution of emerging environmental markets.
Ignoring this complexity will likely result in an inefficient
labour market where skills of workers are not well-suited to
the specialized needs of employers. Such gaps will likely cause
adverse effects on Canada’s economic and employment potential.
Skills gaps must be analyzed in a highly detailed manner, with
special attention given to the significant differences in each
industry and environmental sub-sector. This should be performed
in a manner that considers the entire supply chain for each sub-
sector and the specific skills requirements throughout.
In particular, ongoing research should be conducted on the
requirements of employers in the high-growth segments of
the environmental sector, such as energy efficiency, alternative
energy generation, climate change mitigation and adaptation,
and other growth markets. Labour and skills requirements in
these markets can change significantly in response to legislation,
new technology, or changes in consumer or business-to-business
demand. Close monitoring of labour demand will help increase
coordination of educational and industry stakeholders, thereby
helping Canadian businesses to capture emerging growth
opportunities both at home and abroad.
(3) INCREASE THE STATISTICAL OBSERVATION OF THE ENVIRONMENTAL SECTOR
Statistics Canada and ECO Canada conduct several surveys on
the sector, however, due to the sector’s complexity, it is difficult
to design studies that account for all sub-sectors. Thus, some
environmental sub-sectors are well reported but other sub-sectors
are not well-tracked, particularly emerging growth areas. The
lack of detailed data on environmental employment reflects two
key aspects of the sector: (1) the sector is highly complex, being
comprised of numerous sub-divisions, and (2) as the sector grows
and matures, the level of diversification within the sector has
increased. As a result, a centralized source of information on all
sub-sectors and aspects of the environmental sector does not
currently exist in Canada.
During the writing of this report, extensive efforts were made
to identify statistics that may describe the sector. However, the
information that could be found was limited, making it difficult to
understand the size and growth of the sector and its sub-sectors.
The lack of statistical information on the environmental sector
is perhaps one of its greatest constraints to growth. Investors
have limited information on the development of environmental
markets to inform their investment decisions and policy-makers
have limited information on the impacts of regulatory decisions on
growth in the industry. Readily available information will facilitate
better policy-making to optimize growth of the sector, and timely
reporting of this information will assist firms to capture new
emerging opportunities as the environmental sector diversifies.
In particular, this information should capture details on
employment, revenues, and exports, as well as operating statistics
of Canadian firms engaged in environmental sub-sectors. Demand
for workers by occupation should also be included in this data
collection effort, as availability of skilled and specialized labour in
the environmental sector is key to its growth. Information tracking
should be designed to allow for easy comparisons with other
countries and jurisdictions within Canada. Using the Canadian
Environmental Goods and Services Sector Model (CEGSS), as
described in Section 3.1 of this report, would make the model and
resulting data comparable internationally.
This information should be collected by an organization critical
to the growth of Canada’s environmental industry, and should be
coordinated with sub-sector stakeholders and Statistics Canada.
The information will be most valuable if it is collected with a
mandate to increase Canada’s economic development throughout
the environmental sector, as well as to guide policy and economic
incentives to increase private sector investment.
11
Summary
Because the environmental sector is complex, being comprised
of a wide variety of activities, special attention must be given to
the framework for classifying and measuring the sector. A variety
of models are in use globally, however recently there has been a
trend toward international standardization through the use of the
Environmental Goods and Services Sector definition, developed
by Eurostat in consultation with Statistics Canada. The model
is designed to allow for estimation of environmental revenues,
exports, employment and other economic measures using existing
national accounts statistics. National accounts and environmental
accounts statistics in Canada differ somewhat from the EU and
the research team involved in this report has made adjustments to
the model to simplify and adapt it to the Canadian context. This
section gives a brief overview of the Canadian Environmental Goods
and Services Sector Model (CEGSS) and a review of the statistical
information available for the model in Canada.
Defining the sector
Due to the complex nature of the environmental sector, it is
necessary to examine its composition in order to understand the
trends affecting its growth. Employment in the sector is difficult to
measure and define for several reasons:
(1) The diverse and complex nature of the environmental sector
itself makes it difficult to track statistically.
(2) Analysis of the sector is further complicated by the nature of
environmental work activities. Skills used by environmental
practitioners typically include a mix of environmental skills
and a set of core technical skills that are not, in essence,
environmental.
(3) Measurement of employment in the environmental sector is
further complicated because the labour force is comprised
of a mix of workers employed in the provision of market goods and services (such as manufacturing of filters for
air quality protection or air quality testing services) and
nonmarket services (such as development of new legislation
and regulation).
Because of these complications, there has been a movement
toward an international standard for defining and measuring
the environmental sector. The omission of several key growth
areas in the 1999 framework led to a substantial revision to the
model. In September 2009, Eurostat and the Organization for
Economic Co-Operation and Development (OECD) published
The Environmental Goods and Services Industry Handbook1. The
handbook was developed in cooperation with Statistics Canada
Environmental Accounts Division and is the emerging global
standard for defining and measuring the environmental sector.
As part of this study, the research team reviewed the
Environmental Goods and Services Sector Handbook and it’s
applicability to data on the environmental industry in Canada.
While there are significant gaps in the data currently available
from existing surveys, the research team and ECO Canada viewed
the model as a positive step toward defining the sector as it
exists today and as it is likely to develop over future years. The
research team also made recommendations for adjustments to
the model to better reflect the composition of the environmental
sector in Canada. In the following section, we provide a brief
description of the Canadian Environmental Goods and Services
Sector which is used in this study to explore macro and micro
trends throughout the environmental sector.
1 The Handbook may be accessed from the Eurostat Working Papers Series and is available at the following link (last accessed February, 2010) http://epp.eurostat.ec.europa.eu/cache/ITY_OFFPUB/KS-RA-09-012/EN/KS-RA-09-012-EN.PDF
3.0 DEFINING THE ENVIRONMENTAL SECTOR
12
Figure 4 The Canadian Environmental Goods and Services Employment Model
Goods Services and Technologies
Environmental Purpose
By Environmental Domain
Combined Environmental Protection/Resource Management
Segm
enta
tion
by
NAI
CS
Indu
stry
Sec
tors
Mar
ket
Serv
ices
and
N
on-M
arke
t Se
rvic
es
(e.g
. reg
ulat
ion)
Related to Outputs Related to Inputs
Environmental Protection Resource Management
SEGMENTATION
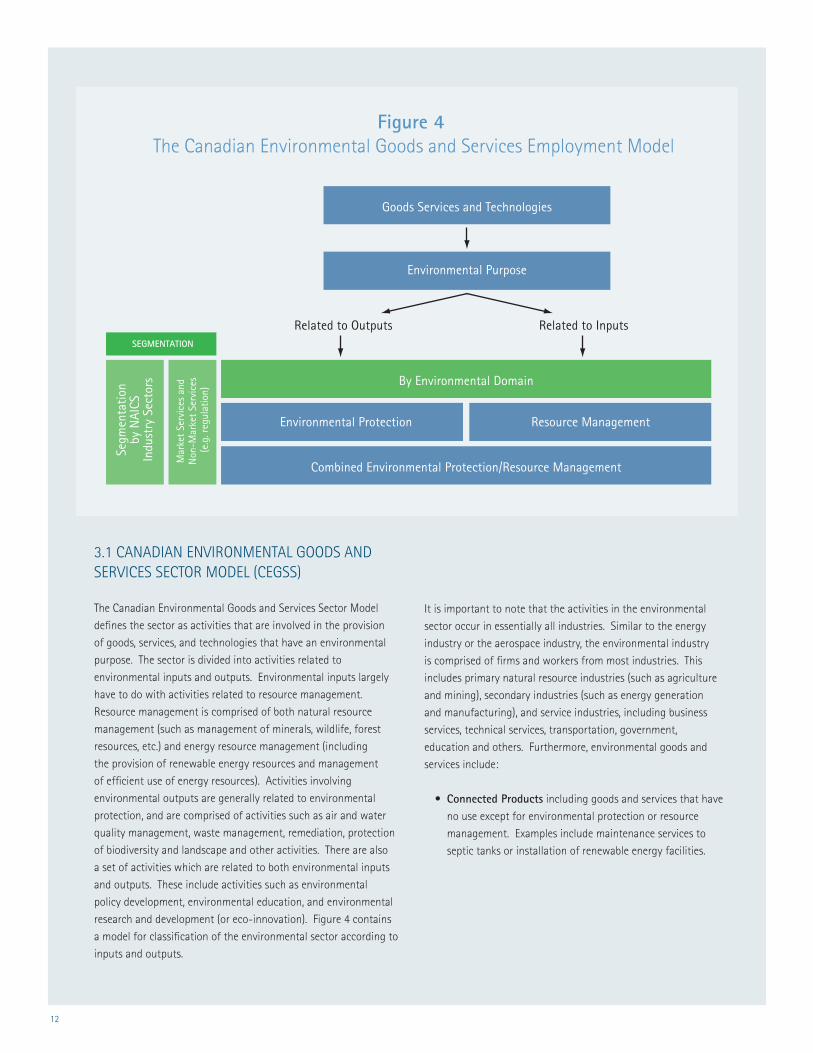
3.1 CANADIAN ENVIRONMENTAL GOODS AND SERVICES SECTOR MODEL (CEGSS)
The Canadian Environmental Goods and Services Sector Model
defines the sector as activities that are involved in the provision
of goods, services, and technologies that have an environmental
purpose. The sector is divided into activities related to
environmental inputs and outputs. Environmental inputs largely
have to do with activities related to resource management.
Resource management is comprised of both natural resource
management (such as management of minerals, wildlife, forest
resources, etc.) and energy resource management (including
the provision of renewable energy resources and management
of efficient use of energy resources). Activities involving
environmental outputs are generally related to environmental
protection, and are comprised of activities such as air and water
quality management, waste management, remediation, protection
of biodiversity and landscape and other activities. There are also
a set of activities which are related to both environmental inputs
and outputs. These include activities such as environmental
policy development, environmental education, and environmental
research and development (or eco-innovation). Figure 4 contains
a model for classification of the environmental sector according to
inputs and outputs.
It is important to note that the activities in the environmental
sector occur in essentially all industries. Similar to the energy
industry or the aerospace industry, the environmental industry
is comprised of firms and workers from most industries. This
includes primary natural resource industries (such as agriculture
and mining), secondary industries (such as energy generation
and manufacturing), and service industries, including business
services, technical services, transportation, government,
education and others. Furthermore, environmental goods and
services include:
• Connected Products including goods and services that have
no use except for environmental protection or resource
management. Examples include maintenance services to
septic tanks or installation of renewable energy facilities.
13
• Adapted goods which are less polluting or more resource
efficient than equivalent normal goods which furnish a similar
utility. This includes ‘cleaner’ goods, which help to prevent
pollution or environmental degradation because they are less
polluting at the time of their consumption and/or scrapping
compared to equivalent ‘normal’ goods. It also includes
‘resource efficient’ goods, which help to prevent natural
resource depletion because they consume fewer natural
resources in production.
• Environmental technologies which are technical processes,
installations, equipment (goods) and methods or knowledge
(services), the technical nature or purpose of which is
environmental.
• Ancillary goods and services that firms create for their own
consumption—such as design of energy efficient processes
that reduce costs and use of natural resources, but are fully
consumed internally.
• Both Market and Non-Market Services: Non-market
services are services that are not ’bought‘ and ’sold‘ in a strict
sense (e.g., there is no ’buyer‘ for creation of new regulation or
for some forms of environmental education).
3.1.1 CANADIAN CONTEXT
The Canadian Environmental Goods and Services Sector model is a
modified version of the Environmental Goods and Services Sector
Handbook published by Eurostat. The modifications include:
• IntheEurostatEGSS,education,training,policydevelopment,
communications, public relations and research and
development activities are classified under the main divisions
for resource management and environmental protection.
For instance, research and development for air quality
management is classified in EGSS Environmental Protection
Activities Division 1: protection of ambient air and climate.
In the Canadian EGSS model, these functions are classified
separately because statistical tracking for these activities is
not detailed enough to distinguish the type of environmental
protection activity. For instance, environmental research and
development statistics do not support distinctions between
research on air quality and research on water quality.
• UndertheResourceManagementdivision,managementof
energy resources has been modified to include all energy
resource management activities, even if they occur for
environmental protection. In the Canadian EGSS, energy
resource management is divided into: (1) Production of
energy from renewable resources, (2) Alternative fuels, (3)
Heat and energy savings management (energy-efficiency),
and (4) Alternative fuels vehicles. This change was made to
simplify the model so that all energy-related environmental
activities may be grouped together.
14
• Somesimilarsimplificationsweremadeinthedivisions
of Environmental Protection. This includes, for example,
consolidation of water management into a single category
in the Canadian EGSS (Water protection, treatment, supply,
and conservation). In the original EGSS, water management
is divided into two categories: (1) Management of water
resource availability – this is classified under resource
management, and (2) Water quality protection – classified
under environmental protection.
3.2 EMPLOYMENT DATA AVAILABILITY AND QUALITY
Currently, no centralized source of information for all aspects
of the environmental sector exists in Canada. The largest set
of statistics on the environmental industry is collected by the
Statistics Canada Environmental Accounts & Statistics Division.
The division conducts several surveys and produces analytical
publications based on survey data pertaining to various
components of the environmental industry.
Statistics Canada does not specifically measure employment in the
environmental sector. In 2003, the division explored four methods
for estimating environmental employment using existing survey
sources2, but did not draw conclusions on a preferred method for
estimating environmental employment using those surveys.
To measure employment in the sector, ECO Canada has conducted
its own survey of employers in Canada on a bi-annual basis. The
survey has traditionally collected information on the number of
environmental employees.
The lack of detailed data on environmental employment reflects
two key aspects of the environmental sector: (1) the sector is
highly complex, being comprised of numerous sub-sectors, and
(2) as the sector grows and matures, the level of diversification
within the sector has increased. In previous research dating back
to the early 1990s, environmental surveys focused primarily on
reductions in pollution, and less so on efficient use of natural
resources and energy resources. As the sector has matured,
there has been increasing attention paid to the energy efficiency
investments of firms and other matters related to energy. Still,
with the existing body of research on the sector in Canada,
there are significant gaps in the data, which make estimation of
employment in each sub-sector difficult.
To evaluate trends in Canadian environmental employment, the
research team drew upon a diverse set of secondary literature
and research, as well as the body of survey research conducted
by Statistics Canada, including the following surveys that are
conducted at regular intervals by the Environmental Accounts and
Statistics Division: Waste Management Industry Survey: Business
and Government Sector; Households and the Environment
Survey; Environment Industry Survey: Business Sector; Survey of
Environmental Protection Expenditures; Industrial Water Survey;
Agricultural Water Use Survey; and Survey of Drinking Water
Plants.
In addition to the surveys listed above, some information relevant
to the environmental sector may be gleaned from the 1996, 2001
and 2006 Census of Canada, the Labour Force Survey (monthly),
the Canadian Business Patterns Database, and other sources of
statistics published by Statistics Canada that cover a broad set
of topics, including topics relevant to the environment. It should
be noted that definitions differ significantly among the various
surveys available to describe the environmental sector. For this
study, the research team exercised caution in drawing conclusions
from the diverse sources of information. Readers are advised to
interpret the trends identified in this report while taking into
consideration that the findings are based on disparate sources.
2 See Working Paper ISBN: 0-662-36570-4: “Measuring Employment in the Environmental Industry” (Orok, 2003).

15
4.0 KEY EMERGING TRENDS
Summary
In interviews with key stakeholders, a number of emerging
growth areas were discussed as prime opportunities for growth
in the environmental industry. The following two areas were
mentioned in every interview with a key expert:
(1) A diverse set of activities prompted by efforts to reduce
carbon emissions and mitigate climate change; and
(2) Activities related to improvements in energy efficiency
(notably in the construction sector) and development of
renewable energy sources which reduce consumption of
environmental resources.
In addition, alternative fuels, alternative fuel vehicles,
adaptation to climate change, eco-innovation, and
environmental management practices were all mentioned as
emerging growth areas in the environmental sector.
Carbon and climate change mitigation will have wide-reaching
impacts on labour demand and skills. This will include
increased investment in technologies that reduce greenhouse
gas emissions by all sectors of the economy. This will drive
growth in the market for carbon offsets (activities that offset
carbon emissions). The market will necessitate changes in
accounting skills for carbon tax purposes. It will also drive
changes in the finance and commodities-trading industries as a
new market is organized for trading of carbon on a level similar
to other global commodities.
Activities to make improvements in energy efficiency will
drive changes in demand for environmental skills in the
construction sector. As homes and businesses take advantages
of energy efficiency incentives for retro-fits, there will be
growing demand for energy auditors, blower door testers and a
handful of other niche occupations. Energy efficiency is likely
to drive ongoing demand for workers in the manufacturing
industries, although strong total employment growth is not
expected. Energy efficiency will be a priority for development
in electronics, appliances, and other products with energy
requirements, and research and development for these products
will require electrical design skills.
Renewable energy technology including solar, wind, and
thermal energy generation will drive demand for workers to
install and maintain these systems. In the biofuels sector,
production capacity is expected to increase significantly
over the next few years but will not likely have dramatic
impacts on employment in the sector. Direct employment
in eco-innovation is difficult to measure and spending on
research and development drives cyclical changes in the
demand for workers as new technologies are developed
and implemented. Employment growth in climate change
adaptation will likely be large and project-driven. However,
many of these adaptations will not require workers with
specific environmental skills.
Other key growth trends in the sector are more likely
to impact demand for skills than demand for additional
workers. While the automotive manufacturing industry is
in decline, there is growth in the production of alternative
fuels vehicles. Improvements to the design of these vehicles
require ongoing skill and knowledge upgrades for engineers.
The implementation of environmental management practices
will cause changes in the skills that a variety of workers
require to be effective in their jobs.
4.1 CARBON & CLIMATE CHANGE MITIGATION
Under the Kyoto Protocol, Canada has a goal to reduce
carbon emissions to 6% below the 1990 levels. In 2007,
Canadian Ministry of Environment announced a revised
Climate Plan. Canada intends to reduce its annual carbon
emissions by approximately 20% below 2007 levels by
2020. While this plan does not attain the level of emissions
reduction that is encouraged in the Kyoto protocol it did call
for aggressive measures, including requirements for industry
to cut emissions in half by 2015.
In December 2007, Canada’s federal government began
to formally require industry to provide information on its
greenhouse gas (GHG) emissions and in March of 2008,
Environment Canada released Turning the Corner, which
outlined further details of the proposed climate change plan.
Canadian provinces have also participated in emissions-
trading schemes set up by various regional groups, and
Alberta has implemented its own trading program.
16
According to the national Climate Plan, companies will be able to
choose the most cost-effective way to meet their targets from a
range of options: in-house reductions, contributions to a capped
technology fund, domestic emissions trading and offsets, and access
to the Kyoto Protocol’s Clean Development Mechanism (CDM)3. The
introduction of the Climate Plan has prompted companies to make
preparations to reduce carbon emissions.
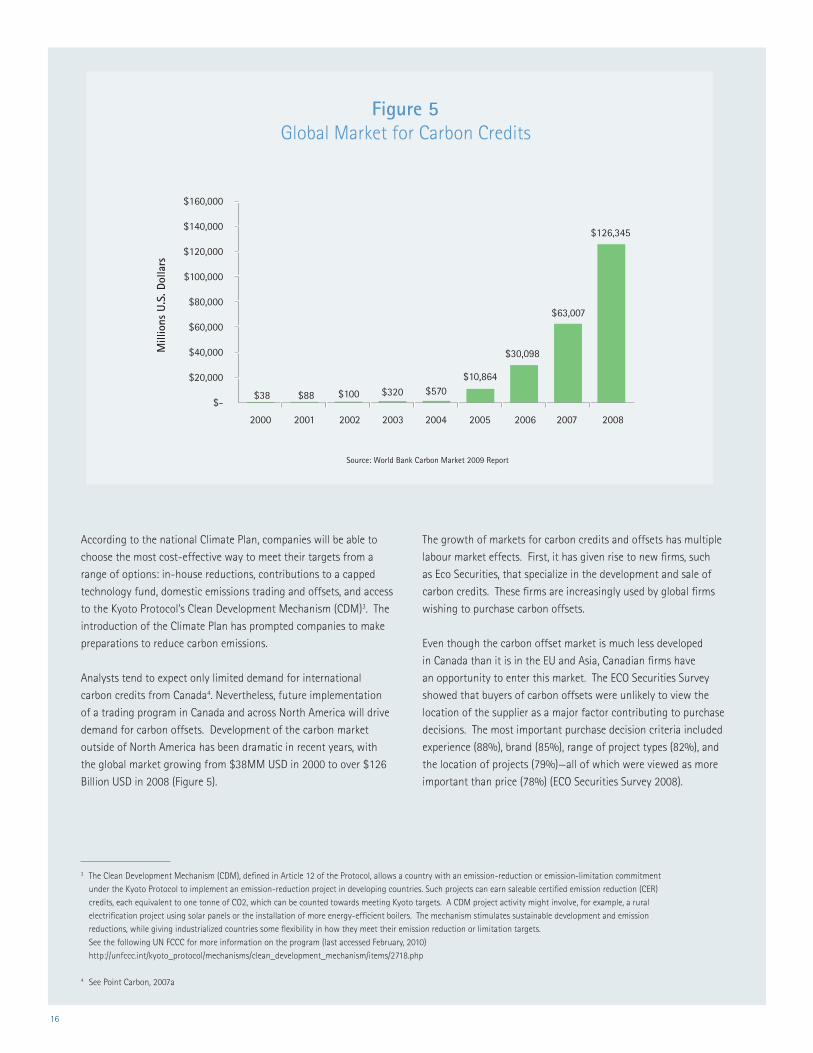
Analysts tend to expect only limited demand for international
carbon credits from Canada4. Nevertheless, future implementation
of a trading program in Canada and across North America will drive
demand for carbon offsets. Development of the carbon market
outside of North America has been dramatic in recent years, with
the global market growing from $38MM USD in 2000 to over $126
Billion USD in 2008 (Figure 5).
The growth of markets for carbon credits and offsets has multiple
labour market effects. First, it has given rise to new firms, such
as Eco Securities, that specialize in the development and sale of
carbon credits. These firms are increasingly used by global firms
wishing to purchase carbon offsets.
Even though the carbon offset market is much less developed
in Canada than it is in the EU and Asia, Canadian firms have
an opportunity to enter this market. The ECO Securities Survey
showed that buyers of carbon offsets were unlikely to view the
location of the supplier as a major factor contributing to purchase
decisions. The most important purchase decision criteria included
experience (88%), brand (85%), range of project types (82%), and
the location of projects (79%)—all of which were viewed as more
important than price (78%) (ECO Securities Survey 2008).
3 The Clean Development Mechanism (CDM), defined in Article 12 of the Protocol, allows a country with an emission-reduction or emission-limitation commitment under the Kyoto Protocol to implement an emission-reduction project in developing countries. Such projects can earn saleable certified emission reduction (CER) credits, each equivalent to one tonne of CO2, which can be counted towards meeting Kyoto targets. A CDM project activity might involve, for example, a rural electrification project using solar panels or the installation of more energy-efficient boilers. The mechanism stimulates sustainable development and emission reductions, while giving industrialized countries some flexibility in how they meet their emission reduction or limitation targets.
See the following UN FCCC for more information on the program (last accessed February, 2010) http://unfccc.int/kyoto_protocol/mechanisms/clean_development_mechanism/items/2718.php
4 See Point Carbon, 2007a
Figure 5 Global Market for Carbon Credits
2000 2001 2002 2003 2004 2005 2006 2007 2008
$38 $88 $100 $320 $570$10,864
$30,098
$63,007
$126,345
$160,000
$140,000
$120,000
$100,000
$80,000
$60,000
$40,000
$20,000
$-
Mill
ions
U.S
. Dol
lars
Source: World Bank Carbon Market 2009 Report

17
Other employment effects of this market will likely be felt in
finance and accounting, where demand for carbon accounting
skills will grow, as will finance for carbon reduction projects.
Understanding of carbon markets will increasingly become
prerequisite for credit officers as they consider the exposure
of loans to firms which must incur expenses to comply with
emissions reductions targets. Carbon emissions reductions are
expected to have a very wide and diverse set of effects on skills
required across many industries. While the details of effects of
growth of this market are difficult to predict at this point, the
consensus among the experts we spoke with was that the market
is growing significantly in anticipation of future regulation.
When such regulation comes into existence at a national level,
it is expected that the environmental sector will likely undergo a
significant expansion.
4.2 ENERGY EFFICIENCY
Spending on energy efficiency has grown dramatically over the
past few years. Canadian businesses made expenditures of $2
billion for energy-related environmental processes in 2006. From
2002 to 2006, industry spending on energy efficiency nearly
doubled (a 16% average annual growth rate). Energy efficiency
spending for environmental processes was almost evenly split
between capital expenditures (on environmental products) and
operating expenditures which are more labour-intensive (Table 2).
Similar demand may be observed in the commercial and residential
energy retrofitting sector. Natural Resources Canada’s ecoENERGY
program5, combined with provincial tax incentives has prompted
many businesses and consumers to make investments in their
facilities and homes to improve energy efficiency. Much of
this work is performed by workers in the construction industry.
Construction spending on energy efficiency is not well-tracked in
statistics, nor is the number of workers engaged in such activities.
A good indicator of growth is the number of certified energy
advisors under the ecoENERGY program. Under the program, an
energy audit must be performed by a certified advisor both before
and after the implementation of energy efficiency upgrades.
Between 2008 and 2009, the number of certified energy advisors
in Canada grew from 1,004 in 2008 to 1,770 in 2009, a 76%
increase (ecoENERGY Program).
Investment in energy efficiency is driven by financial benefits of
lower energy costs over time, with lower energy consumption as
an overall environmental benefit. As previously mentioned in this
report, firms have many reasons for investing in energy efficiency.
However, sufficient return on investment has been the most
important driver (Figure 6).
Annual Growth Years 2002 2004 2006 2002-2006
Operating Expenditures $ 523.0 $ 575.8 $ 1,009.0 18%
Capital Expenditures $ 583.3 $ 379.3 $ 964.0 13%
Total Expenditures $ 1,106.3 $ 955.1 $ 1,973.0 16%
(In Millions of Dollars)
Table 2 Industry Expenditures on energy-related
environmental processes and technologies
Source: Statistics Canada Survey of Environmental Protection Expenditures 2002, 2004, 2006
5 For more information on the EcoENERGY Program, see http://oee.nrcan.gc.ca/corporate/retrofit-summary.cfm Last accessed February, 2010
18
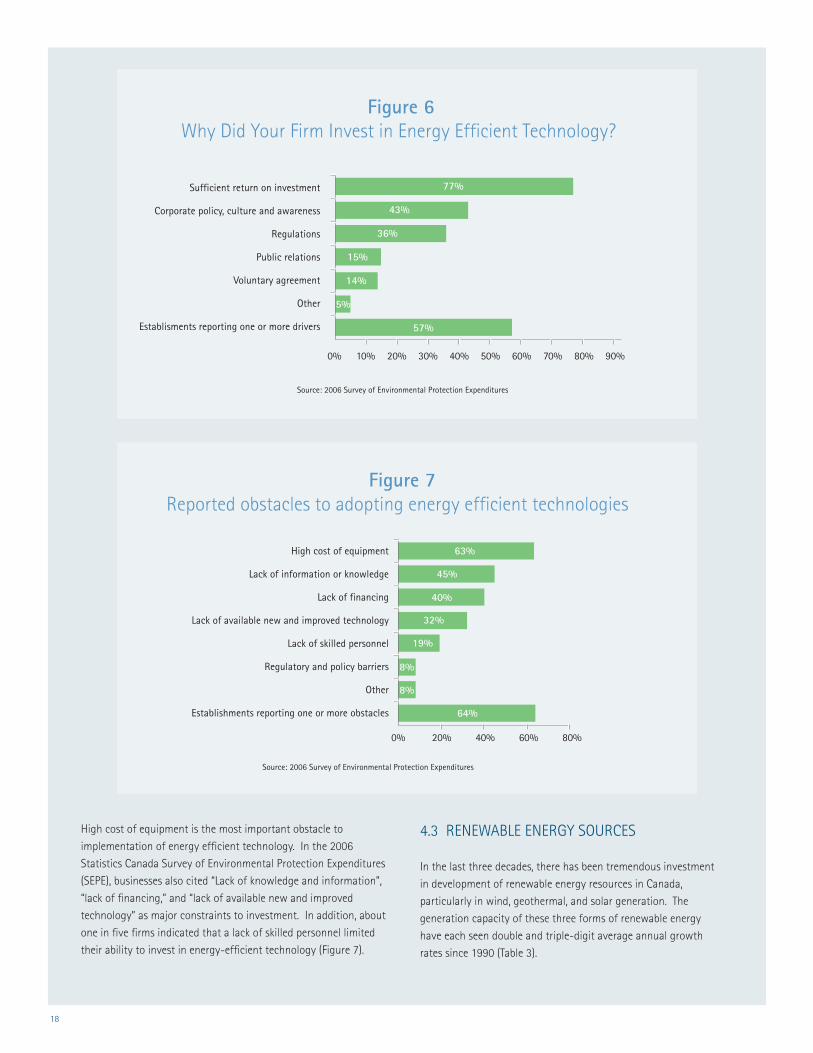
Figure 6Why Did Your Firm Invest in Energy Efficient Technology?
Source: 2006 Survey of Environmental Protection Expenditures
Sufficient return on investment
Corporate policy, culture and awareness
Regulations
Public relations
Voluntary agreement
Other
Establisments reporting one or more drivers
77%
43%
36%
15%
14%
5%
57%
0% 10% 20% 30% 40% 50% 60% 70% 80% 90%
Figure 7Reported obstacles to adopting energy efficient technologies
Source: 2006 Survey of Environmental Protection Expenditures
High cost of equipment
Lack of information or knowledge
Lack of financing
Lack of available new and improved technology
Lack of skilled personnel
Regulatory and policy barriers
Other
Establishments reporting one or more obstacles
0% 20% 40% 60% 80%
63%
45%
40%
32%
19%
64%
8%
8%
High cost of equipment is the most important obstacle to
implementation of energy efficient technology. In the 2006
Statistics Canada Survey of Environmental Protection Expenditures
(SEPE), businesses also cited “Lack of knowledge and information”,
“lack of financing,” and “lack of available new and improved
technology” as major constraints to investment. In addition, about
one in five firms indicated that a lack of skilled personnel limited
their ability to invest in energy-efficient technology (Figure 7).
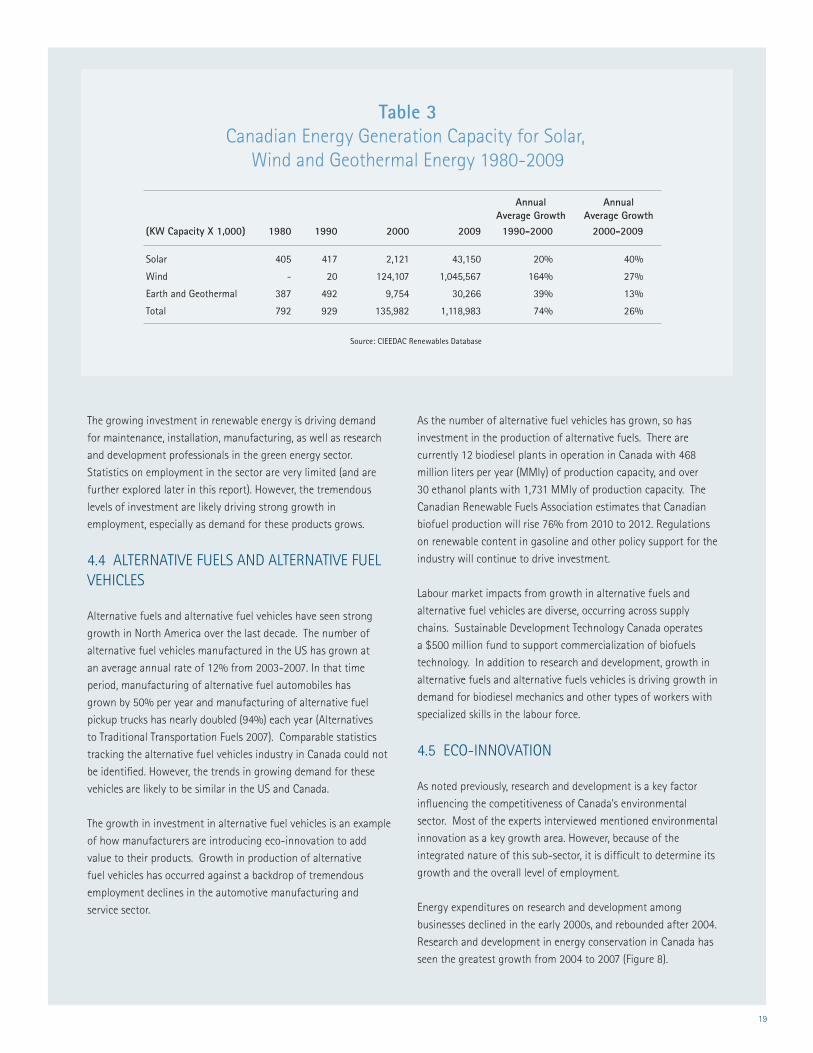
4.3 RENEWABLE ENERGY SOURCES
In the last three decades, there has been tremendous investment
in development of renewable energy resources in Canada,
particularly in wind, geothermal, and solar generation. The
generation capacity of these three forms of renewable energy
have each seen double and triple-digit average annual growth
rates since 1990 (Table 3).
19
Table 3Canadian Energy Generation Capacity for Solar,
Wind and Geothermal Energy 1980-2009
Source: CIEEDAC Renewables Database
(KW Capacity X 1,000) 1980 1990 2000 2009 1990-2000 2000-2009
Solar 405 417 2,121 43,150 20% 40%
Wind - 20 124,107 1,045,567 164% 27%
Earth and Geothermal 387 492 9,754 30,266 39% 13%
Total 792 929 135,982 1,118,983 74% 26%
Annual Average Growth
Annual Average Growth
The growing investment in renewable energy is driving demand
for maintenance, installation, manufacturing, as well as research
and development professionals in the green energy sector.
Statistics on employment in the sector are very limited (and are
further explored later in this report). However, the tremendous
levels of investment are likely driving strong growth in
employment, especially as demand for these products grows.
4.4 ALTERNATIVE FUELS AND ALTERNATIVE FUEL VEHICLES
Alternative fuels and alternative fuel vehicles have seen strong
growth in North America over the last decade. The number of
alternative fuel vehicles manufactured in the US has grown at
an average annual rate of 12% from 2003-2007. In that time
period, manufacturing of alternative fuel automobiles has
grown by 50% per year and manufacturing of alternative fuel
pickup trucks has nearly doubled (94%) each year (Alternatives
to Traditional Transportation Fuels 2007). Comparable statistics
tracking the alternative fuel vehicles industry in Canada could not
be identified. However, the trends in growing demand for these
vehicles are likely to be similar in the US and Canada.
The growth in investment in alternative fuel vehicles is an example
of how manufacturers are introducing eco-innovation to add
value to their products. Growth in production of alternative
fuel vehicles has occurred against a backdrop of tremendous
employment declines in the automotive manufacturing and
service sector.
As the number of alternative fuel vehicles has grown, so has
investment in the production of alternative fuels. There are
currently 12 biodiesel plants in operation in Canada with 468
million liters per year (MMly) of production capacity, and over
30 ethanol plants with 1,731 MMly of production capacity. The
Canadian Renewable Fuels Association estimates that Canadian
biofuel production will rise 76% from 2010 to 2012. Regulations
on renewable content in gasoline and other policy support for the
industry will continue to drive investment.
Labour market impacts from growth in alternative fuels and
alternative fuel vehicles are diverse, occurring across supply
chains. Sustainable Development Technology Canada operates
a $500 million fund to support commercialization of biofuels
technology. In addition to research and development, growth in
alternative fuels and alternative fuels vehicles is driving growth in
demand for biodiesel mechanics and other types of workers with
specialized skills in the labour force.
4.5 ECO-INNOVATION
As noted previously, research and development is a key factor
influencing the competitiveness of Canada’s environmental
sector. Most of the experts interviewed mentioned environmental
innovation as a key growth area. However, because of the
integrated nature of this sub-sector, it is difficult to determine its
growth and the overall level of employment.
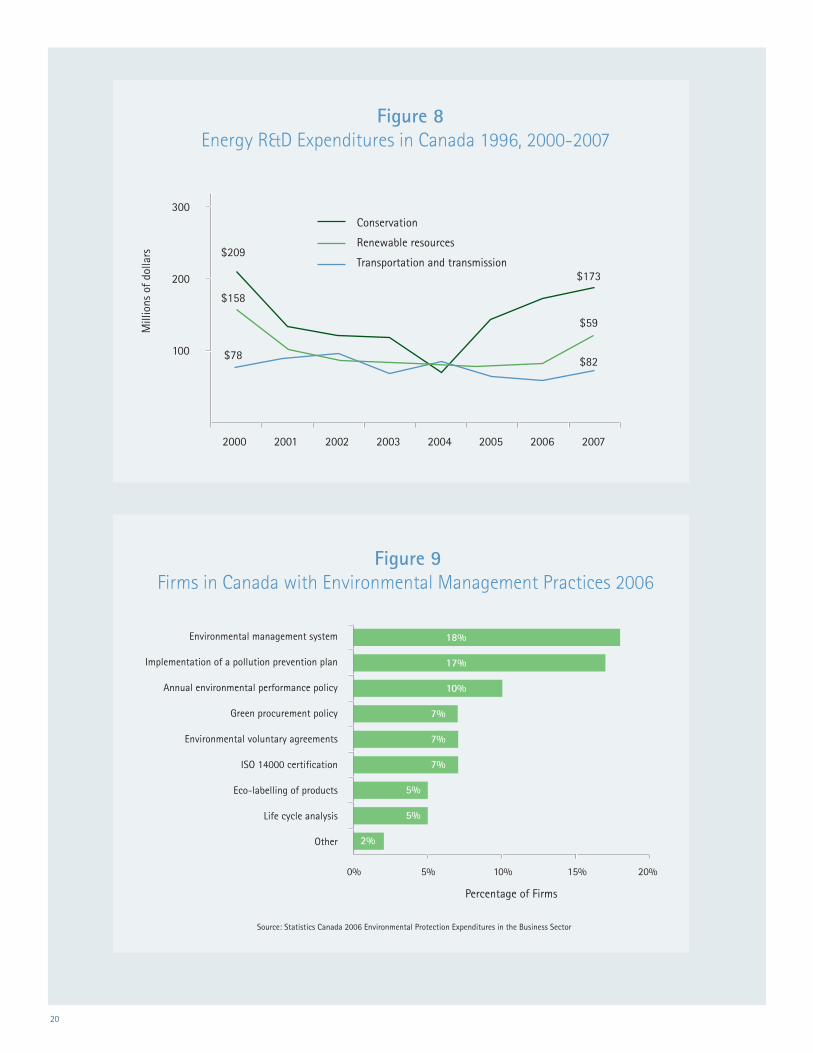
Energy expenditures on research and development among
businesses declined in the early 2000s, and rebounded after 2004.
Research and development in energy conservation in Canada has
seen the greatest growth from 2004 to 2007 (Figure 8).
20
Figure 8Energy R&D Expenditures in Canada 1996, 2000-2007
2000 2001 2002 2003 2004 2005 2006 2007
100
200
300Conservation
Renewable resources
Transportation and transmission$209
$158
$78 $82
$59
$173
Mill
ions
of d
olla
rs
Figure 9Firms in Canada with Environmental Management Practices 2006
Environmental management system
Implementation of a pollution prevention plan
Annual environmental performance policy
Green procurement policy
Environmental voluntary agreements
ISO 14000 certification
Eco-labelling of products
Life cycle analysis
Other
18%
17%
10%
7%
7%
7%
5%
5%
2%
0% 5% 10% 15% 20%
Percentage of Firms
Source: Statistics Canada 2006 Environmental Protection Expenditures in the Business Sector
21
Eco-innovation in resource industries (natural resources and
electric power) has seen growth from 1,525 research personnel in
1998 to over 2,664 workers in 2007—an annual average growth
rate of 5.7%. There has been significant growth in the agriculture
sector where research and development personnel have grown
from a mere 410 workers in 1998 to 1,320 workers in 2007.
4.6 ENVIRONMENTAL MANAGEMENT PRACTICES
Use of environmental management practices was identified as a
growth area within the environmental sector by some of the key
experts interviewed. Environmental management systems are in
use in Canada by 18% of firms in the manufacturing and resource
sectors. Seventeen percent of these firms have implemented
a pollution prevention plan and 10% have created an annual
environmental performance report. A smaller percentage of firms
have attained ISO 14000 certification, used green procurement
policy, or made voluntary environmental agreements. As of 2006,
only 5% of these firms used eco-labeling or life cycle analysis
(Figure 9).
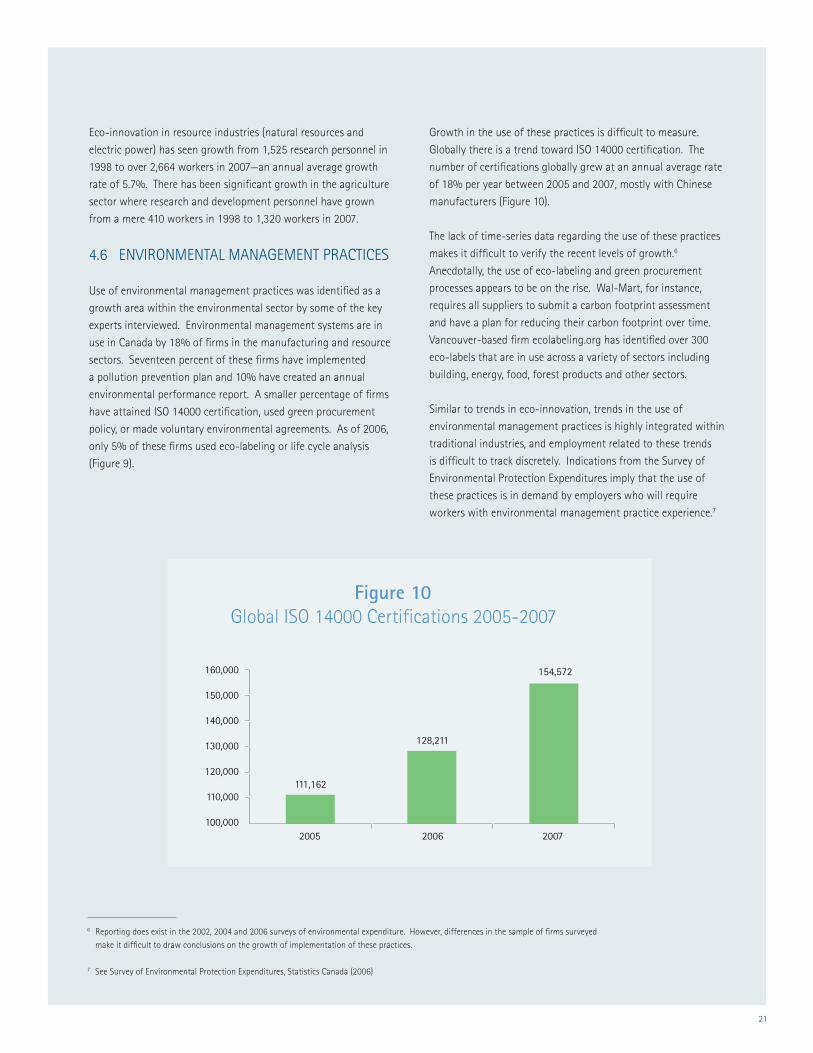
Growth in the use of these practices is difficult to measure.
Globally there is a trend toward ISO 14000 certification. The
number of certifications globally grew at an annual average rate
of 18% per year between 2005 and 2007, mostly with Chinese
manufacturers (Figure 10).
The lack of time-series data regarding the use of these practices
makes it difficult to verify the recent levels of growth.6
Anecdotally, the use of eco-labeling and green procurement
processes appears to be on the rise. Wal-Mart, for instance,
requires all suppliers to submit a carbon footprint assessment
and have a plan for reducing their carbon footprint over time.
Vancouver-based firm ecolabeling.org has identified over 300
eco-labels that are in use across a variety of sectors including
building, energy, food, forest products and other sectors.
Similar to trends in eco-innovation, trends in the use of
environmental management practices is highly integrated within
traditional industries, and employment related to these trends
is difficult to track discretely. Indications from the Survey of
Environmental Protection Expenditures imply that the use of
these practices is in demand by employers who will require
workers with environmental management practice experience.7
Figure 10 Global ISO 14000 Certifications 2005-2007
111,162
128,211
154,572
200720062005
160,000
150,000
140,000
130,000
120,000
110,000
100,000
6 Reporting does exist in the 2002, 2004 and 2006 surveys of environmental expenditure. However, differences in the sample of firms surveyed make it difficult to draw conclusions on the growth of implementation of these practices.
7 See Survey of Environmental Protection Expenditures, Statistics Canada (2006)
22
Summary
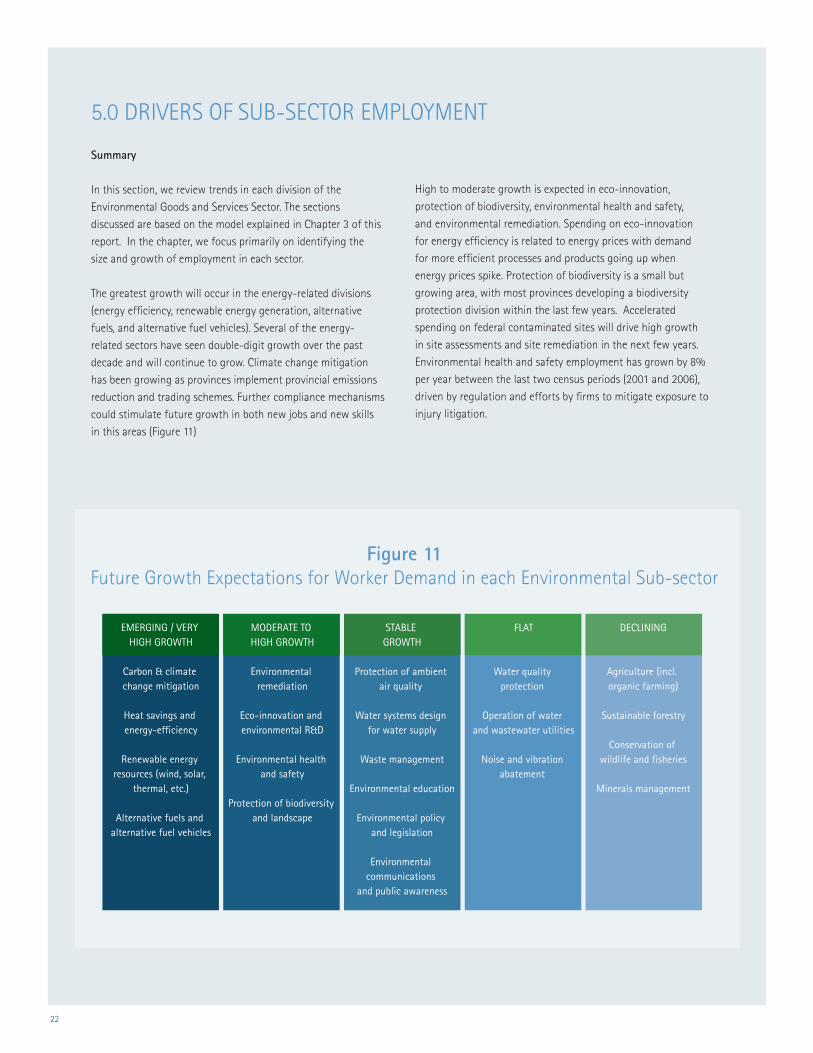
In this section, we review trends in each division of the
Environmental Goods and Services Sector. The sections
discussed are based on the model explained in Chapter 3 of this
report. In the chapter, we focus primarily on identifying the
size and growth of employment in each sector.
The greatest growth will occur in the energy-related divisions
(energy efficiency, renewable energy generation, alternative
fuels, and alternative fuel vehicles). Several of the energy-
related sectors have seen double-digit growth over the past
decade and will continue to grow. Climate change mitigation
has been growing as provinces implement provincial emissions
reduction and trading schemes. Further compliance mechanisms
could stimulate future growth in both new jobs and new skills
in this areas (Figure 11)
High to moderate growth is expected in eco-innovation,
protection of biodiversity, environmental health and safety,
and environmental remediation. Spending on eco-innovation
for energy efficiency is related to energy prices with demand
for more efficient processes and products going up when
energy prices spike. Protection of biodiversity is a small but
growing area, with most provinces developing a biodiversity
protection division within the last few years. Accelerated
spending on federal contaminated sites will drive high growth
in site assessments and site remediation in the next few years.
Environmental health and safety employment has grown by 8%
per year between the last two census periods (2001 and 2006),
driven by regulation and efforts by firms to mitigate exposure to
injury litigation.
Figure 11Future Growth Expectations for Worker Demand in each Environmental Sub-sector
EMERGING / VERY HIGH GROWTH
Carbon & climate change mitigation
Heat savings and energy-efficiency
Renewable energy resources (wind, solar,
thermal, etc.)
Alternative fuels and alternative fuel vehicles
MODERATE TO HIGH GROWTH
Environmental remediation
Eco-innovation and environmental R&D
Environmental health and safety
Protection of biodiversity and landscape
STABLE GROWTH
Protection of ambient air quality
Water systems design for water supply
Waste management
Environmental education
Environmental policy and legislation
Environmental communications
and public awareness
DECLINING
Agriculture (incl. organic farming)
Sustainable forestry
Conservation of wildlife and fisheries
Minerals management
FLAT
Water quality protection
Operation of water and wastewater utilities
Noise and vibration abatement
5.0 DRIVERS OF SUB-SECTOR EMPLOYMENT
23
Growth in some sectors has been flat for some time. These
include water quality protection, and water and wastewater
utilities. Industry capital expenditures for water quality
protection have been flat for the past decade and employment
in water utilities has been flat for several decades, with
essentially the same number of workers employed in the
sector today as were employed 20 years ago. Retirements of
these workers, however, will drive replacement demand.
Employment in the natural resources industries—agriculture,
forestry, fishing, and minerals (except oil and gas)—have
been in long-term structural decline. Most growth in
these areas is in changes in the skills required of workers.
There is significant growth in the number of farms using
organic farming practices, but the total number of workers
employed has declined. There is growth in demand for
forestry professionals in the government sector where
efforts are made to manage sustainable forests. However,
overall the demand for professionals and workers in all parts
of the forestry sector are in decline. Employment in the
minerals sector is highly cyclical, with employment driven
by commodity prices. The industry experiences long-term
structural declines in employment as technology and
innovation make mines more efficient.
The future growth expectations for worker demand in each
environmental sub-sector are discussed in detail in a separate
report entitled Future Growth Expectations for Worker Demand within Each Environmental Sub-Sector.
The greatest growth will occur in the energy-related divisions -
energy efficiency, renewable energy generation, alternative fuels and
alternative fuel vehicles, along with climate change mitigation.
24
6.0 GLOBAL TRENDS
Summary
As various types of environmental pollution have diversified, so
have the services to protect environmental quality, driving growth
and evolution of the environmental sector. Over the 1990-2000
period, global spending in the environmental industry grew at
about 5% per year. More recently (2000-2006), growth in the
sector has been stronger, with growth estimates ranging from
7% to 9% growth per year. Forecast estimates for the sector
range from a low of 4.5% to a high of 8% growth per year
through to 2020. According to the UK Department for Business
Enterprise and Regulatory Reform (BERR), the global market for
the environmental sector is in excess of £3 billion. Exports of
environmental goods are growing at more than twice the rate
of total merchandise exports. The US, Canada’s largest trading
partner, is the largest global environmental market, while Canada’s
domestic market represents about only 1.7% of the global market
for environmental goods and services.
Much of the growth is occurring in the emerging low-carbon
sector and in renewable energy. Countries with strong
environmental exports, especially in high-growth sub-sectors, are
experiencing strong environmental employment growth.
In addition to other factors, environmental regulation plays an
important role in this growth. Regulations are always becoming
more stringent, which drives demand for environmental products
and ongoing innovation in those products. Businesses that
anticipate future changes in regulation also play an important
role. Notably, global retailer Wal-Mart has required its suppliers
to submit carbon footprint assessments as well as plans to reduce
their footprint. Corporate policies like these have far-reaching
implications for suppliers throughout the global supply chain—
driving environmental investments throughout the economy.
6.1 GLOBAL ENVIRONMENTAL EMPLOYMENT GROWTH
Historical Growth
Since the 1990s, there have been several organizations that
have developed estimates of the market size of the global
environmental industry, including the Organisation for
Economic Co-operation and Development (OECD), ECOTEC
(www.ecotec.com), Environmental Business International (EBI),
Environmental Technologies Development Organization (ETDC),
UK Department for Business Enterprise and Regulatory Reform
(BERR) and German Institute for Economic Research (DIW
Berlin). These estimates vary somewhat in the definitions used
to define the environmental sector, which makes it difficult
to compare studies. However, looking at their findings over
time, we may discern that the industry has likely been growing
significantly over the last several years, experiencing something
in the range of 5% annual growth over the 1990s and growth
in the range of 7% to 9% per year in the period between 2000
and 2005 (Figure 12).
The US, Canada’s largest trading partner, is the largest global environmental market,
while Canada’s domestic market represents about only 1.7% of the global
market for environmental goods and services.
25
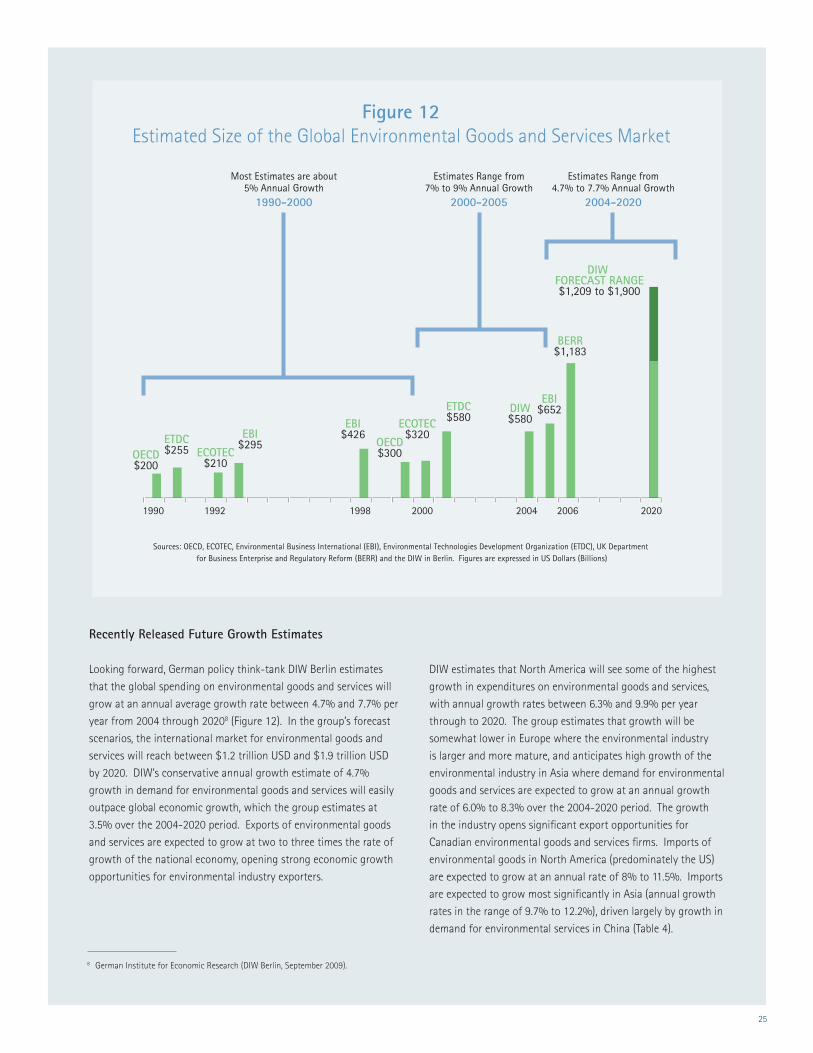
Figure 12 Estimated Size of the Global Environmental Goods and Services Market
Sources: OECD, ECOTEC, Environmental Business International (EBI), Environmental Technologies Development Organization (ETDC), UK Department for Business Enterprise and Regulatory Reform (BERR) and the DIW in Berlin. Figures are expressed in US Dollars (Billions)
1990 1992 1998 2000 2004 2006 2020
OECD$200
ETDC$255 ECOTEC
$210
EBI$295
EBI$426
OECD$300
ECOTEC$320
ETDC$580
DIW$580
EBI$652
BERR$1,183
DIW FORECAST RANGE$1,209 to $1,900
Most Estimates are about 5% Annual Growth
1990-2000
Estimates Range from 7% to 9% Annual Growth
2000-2005
Estimates Range from 4.7% to 7.7% Annual Growth
2004-2020
Recently Released Future Growth Estimates
Looking forward, German policy think-tank DIW Berlin estimates
that the global spending on environmental goods and services will
grow at an annual average growth rate between 4.7% and 7.7% per
year from 2004 through 20208 (Figure 12). In the group’s forecast
scenarios, the international market for environmental goods and
services will reach between $1.2 trillion USD and $1.9 trillion USD
by 2020. DIW’s conservative annual growth estimate of 4.7%
growth in demand for environmental goods and services will easily
outpace global economic growth, which the group estimates at
3.5% over the 2004-2020 period. Exports of environmental goods
and services are expected to grow at two to three times the rate of
growth of the national economy, opening strong economic growth
opportunities for environmental industry exporters.
DIW estimates that North America will see some of the highest
growth in expenditures on environmental goods and services,
with annual growth rates between 6.3% and 9.9% per year
through to 2020. The group estimates that growth will be
somewhat lower in Europe where the environmental industry
is larger and more mature, and anticipates high growth of the
environmental industry in Asia where demand for environmental
goods and services are expected to grow at an annual growth
rate of 6.0% to 8.3% over the 2004-2020 period. The growth
in the industry opens significant export opportunities for
Canadian environmental goods and services firms. Imports of
environmental goods in North America (predominately the US)
are expected to grow at an annual rate of 8% to 11.5%. Imports
are expected to grow most significantly in Asia (annual growth
rates in the range of 9.7% to 12.2%), driven largely by growth in
demand for environmental services in China (Table 4).
8 German Institute for Economic Research (DIW Berlin, September 2009).
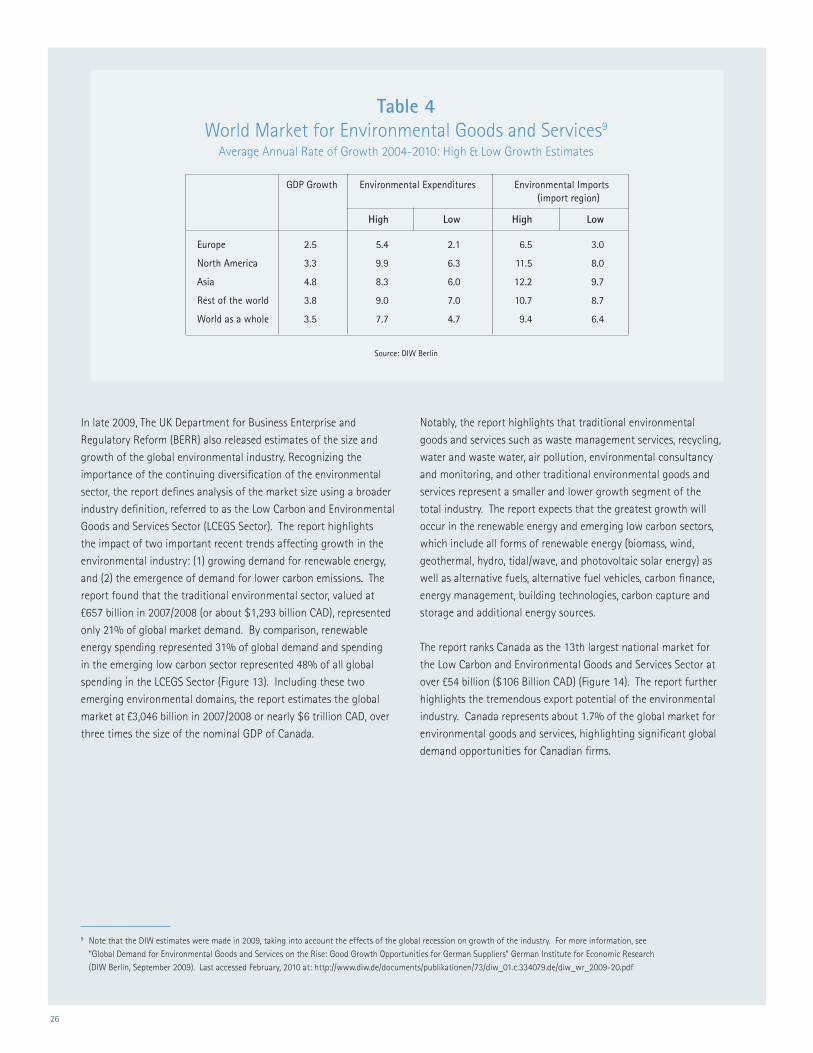
26
In late 2009, The UK Department for Business Enterprise and
Regulatory Reform (BERR) also released estimates of the size and
growth of the global environmental industry. Recognizing the
importance of the continuing diversification of the environmental
sector, the report defines analysis of the market size using a broader
industry definition, referred to as the Low Carbon and Environmental
Goods and Services Sector (LCEGS Sector). The report highlights
the impact of two important recent trends affecting growth in the
environmental industry: (1) growing demand for renewable energy,
and (2) the emergence of demand for lower carbon emissions. The
report found that the traditional environmental sector, valued at
£657 billion in 2007/2008 (or about $1,293 billion CAD), represented
only 21% of global market demand. By comparison, renewable
energy spending represented 31% of global demand and spending
in the emerging low carbon sector represented 48% of all global
spending in the LCEGS Sector (Figure 13). Including these two
emerging environmental domains, the report estimates the global
market at £3,046 billion in 2007/2008 or nearly $6 trillion CAD, over
three times the size of the nominal GDP of Canada.
Notably, the report highlights that traditional environmental
goods and services such as waste management services, recycling,
water and waste water, air pollution, environmental consultancy
and monitoring, and other traditional environmental goods and
services represent a smaller and lower growth segment of the
total industry. The report expects that the greatest growth will
occur in the renewable energy and emerging low carbon sectors,
which include all forms of renewable energy (biomass, wind,
geothermal, hydro, tidal/wave, and photovoltaic solar energy) as
well as alternative fuels, alternative fuel vehicles, carbon finance,
energy management, building technologies, carbon capture and
storage and additional energy sources.
The report ranks Canada as the 13th largest national market for
the Low Carbon and Environmental Goods and Services Sector at
over £54 billion ($106 Billion CAD) (Figure 14). The report further
highlights the tremendous export potential of the environmental
industry. Canada represents about 1.7% of the global market for
environmental goods and services, highlighting significant global
demand opportunities for Canadian firms.
9 Note that the DIW estimates were made in 2009, taking into account the effects of the global recession on growth of the industry. For more information, see “Global Demand for Environmental Goods and Services on the Rise: Good Growth Opportunities for German Suppliers” German Institute for Economic Research (DIW Berlin, September 2009). Last accessed February, 2010 at: http://www.diw.de/documents/publikationen/73/diw_01.c.334079.de/diw_wr_2009-20.pdf
Table 4World Market for Environmental Goods and Services9
Average Annual Rate of Growth 2004-2010: High & Low Growth Estimates
Source: DIW Berlin
GDP Growth Environmental Expenditures Environmental Imports (import region)
High Low High Low
Europe 2.5 5.4 2.1 6.5 3.0
North America 3.3 9.9 6.3 11.5 8.0
Asia 4.8 8.3 6.0 12.2 9.7
Rest of the world 3.8 9.0 7.0 10.7 8.7
World as a whole 3.5 7.7 4.7 9.4 6.4
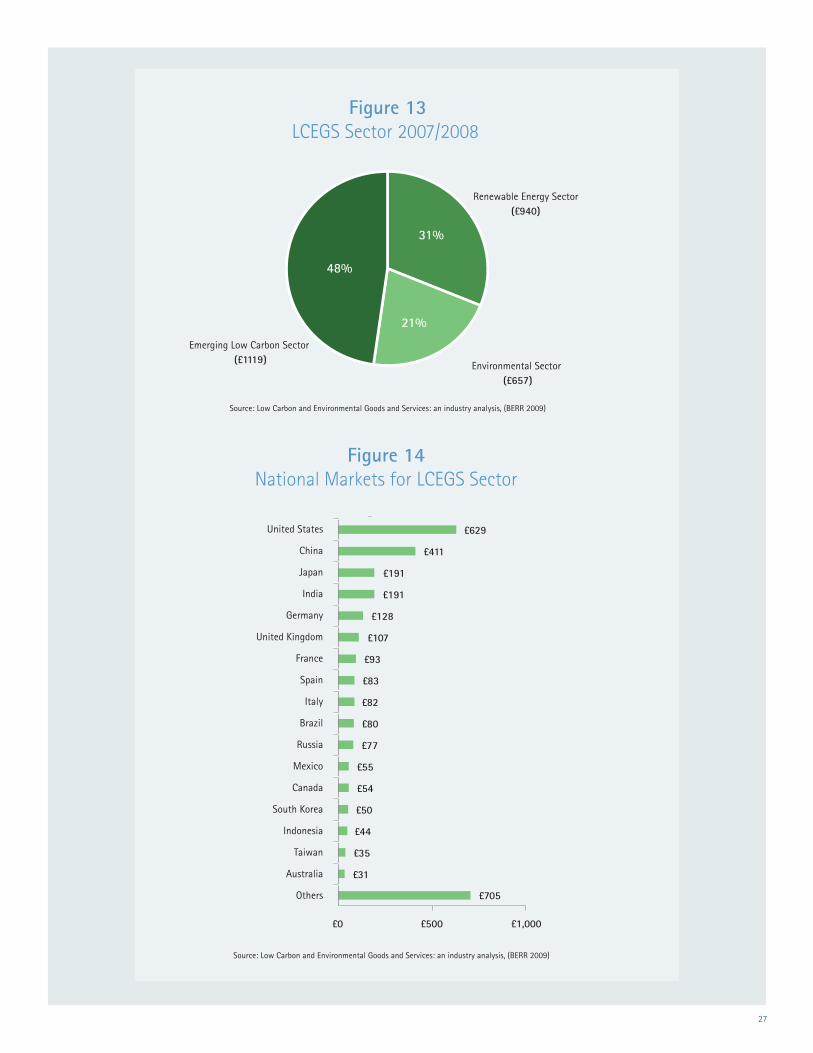
27
Source: Low Carbon and Environmental Goods and Services: an industry analysis, (BERR 2009)
48%
31%
21%
Emerging Low Carbon Sector (£1119) Environmental Sector
(£657)
Renewable Energy Sector(£940)
Figure 13LCEGS Sector 2007/2008
Source: Low Carbon and Environmental Goods and Services: an industry analysis, (BERR 2009)
Figure 14National Markets for LCEGS Sector
United States
China
Japan
India
Germany
United Kingdom
France
Spain
Italy
Brazil
Russia
Mexico
Canada
South Korea
Indonesia
Taiwan
Australia
Others
£629
£411
£191
£191
£128
£107
£93
£83
£82
£80
£77
£55
£54
£50
£44
£35
£31
£705
£0 £500 £1,000
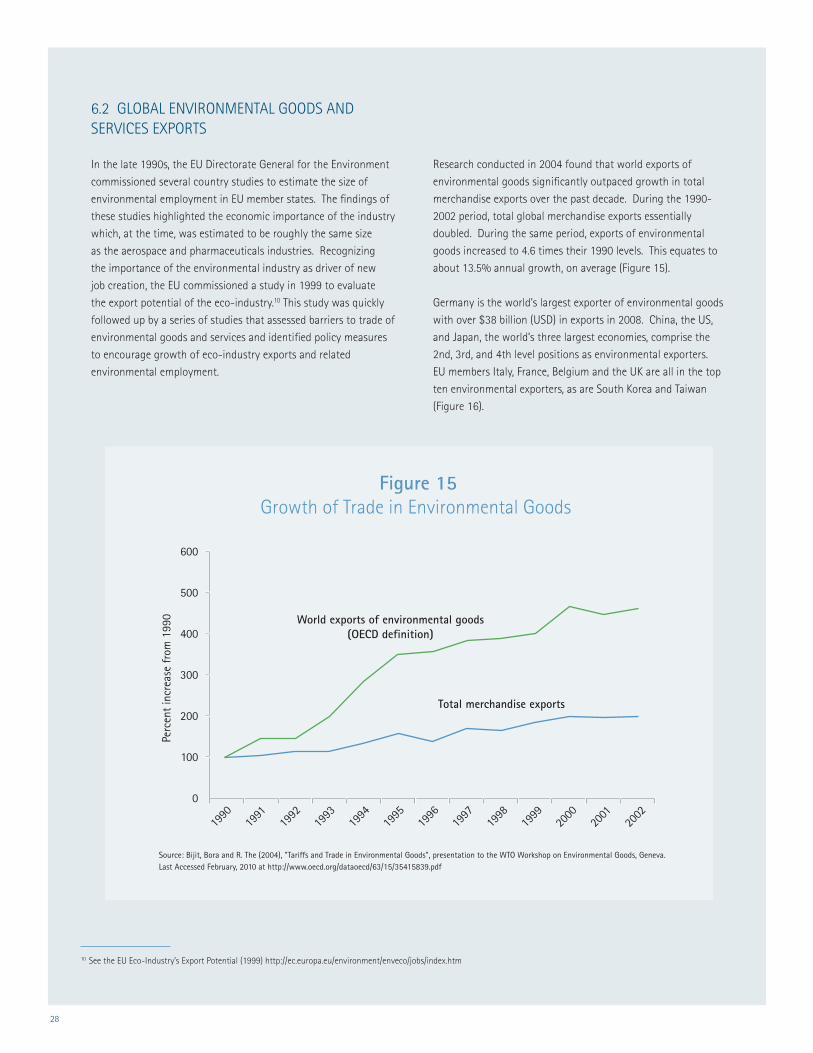
28
6.2 GLOBAL ENVIRONMENTAL GOODS AND SERVICES EXPORTS
In the late 1990s, the EU Directorate General for the Environment
commissioned several country studies to estimate the size of
environmental employment in EU member states. The findings of
these studies highlighted the economic importance of the industry
which, at the time, was estimated to be roughly the same size
as the aerospace and pharmaceuticals industries. Recognizing
the importance of the environmental industry as driver of new
job creation, the EU commissioned a study in 1999 to evaluate
the export potential of the eco-industry.10 This study was quickly
followed up by a series of studies that assessed barriers to trade of
environmental goods and services and identified policy measures
to encourage growth of eco-industry exports and related
environmental employment.
Research conducted in 2004 found that world exports of
environmental goods significantly outpaced growth in total
merchandise exports over the past decade. During the 1990-
2002 period, total global merchandise exports essentially
doubled. During the same period, exports of environmental
goods increased to 4.6 times their 1990 levels. This equates to
about 13.5% annual growth, on average (Figure 15).
Germany is the world’s largest exporter of environmental goods
with over $38 billion (USD) in exports in 2008. China, the US,
and Japan, the world’s three largest economies, comprise the
2nd, 3rd, and 4th level positions as environmental exporters.
EU members Italy, France, Belgium and the UK are all in the top
ten environmental exporters, as are South Korea and Taiwan
(Figure 16).
Figure 15Growth of Trade in Environmental Goods
1990
1991
1992
1993
1994
1995
1996
1997
1998
1999
2000
2001
2002
Perc
ent
incr
ease
from
199
0 World exports of environmental goods(OECD definition)
Total merchandise exports
600
500
400
300
200
100
0
Source: Bijit, Bora and R. The (2004), "Tariffs and Trade in Environmental Goods", presentation to the WTO Workshop on Environmental Goods, Geneva. Last Accessed February, 2010 at http://www.oecd.org/dataoecd/63/15/35415839.pdf
10 See the EU Eco-Industry’s Export Potential (1999) http://ec.europa.eu/environment/enveco/jobs/index.htm
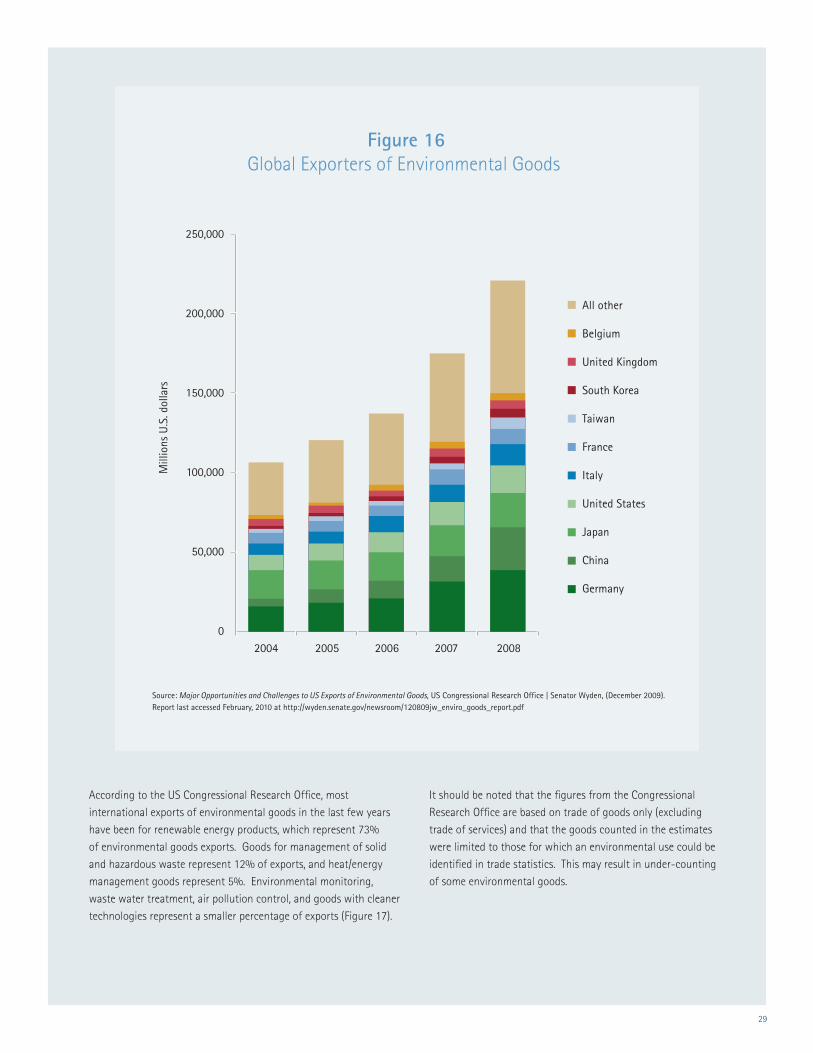
29
Figure 16Global Exporters of Environmental Goods
Source: Major Opportunities and Challenges to US Exports of Environmental Goods, US Congressional Research Office | Senator Wyden, (December 2009). Report last accessed February, 2010 at http://wyden.senate.gov/newsroom/120809jw_enviro_goods_report.pdf
All other
Belgium
United Kingdom
South Korea
Taiwan
France
Italy
United States
Japan
China
Germany
2004 2005 2006 2007 20080
50,000
100,000
150,000
200,000
250,000
Mill
ions
U.S
. dol
lars
According to the US Congressional Research Office, most
international exports of environmental goods in the last few years
have been for renewable energy products, which represent 73%
of environmental goods exports. Goods for management of solid
and hazardous waste represent 12% of exports, and heat/energy
management goods represent 5%. Environmental monitoring,
waste water treatment, air pollution control, and goods with cleaner
technologies represent a smaller percentage of exports (Figure 17).
It should be noted that the figures from the Congressional
Research Office are based on trade of goods only (excluding
trade of services) and that the goods counted in the estimates
were limited to those for which an environmental use could be
identified in trade statistics. This may result in under-counting
of some environmental goods.
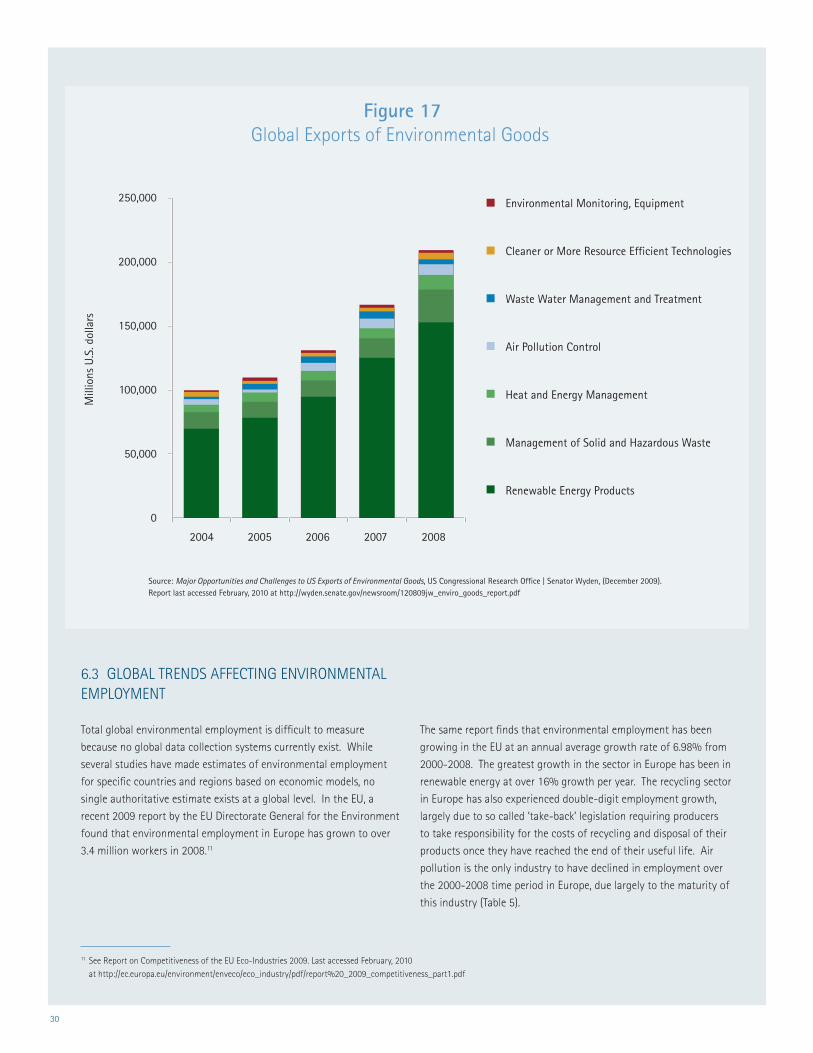
30
Figure 17Global Exports of Environmental Goods
Source: Major Opportunities and Challenges to US Exports of Environmental Goods, US Congressional Research Office | Senator Wyden, (December 2009). Report last accessed February, 2010 at http://wyden.senate.gov/newsroom/120809jw_enviro_goods_report.pdf
Environmental Monitoring, Equipment
Cleaner or More Resource Efficient Technologies
Waste Water Management and Treatment
Air Pollution Control
Heat and Energy Management
Management of Solid and Hazardous Waste
Renewable Energy Products
2004 2005 2006 2007 2008
0
50,000
100,000
150,000
200,000
250,000
Mill
ions
U.S
. dol
lars
6.3 GLOBAL TRENDS AFFECTING ENVIRONMENTAL EMPLOYMENT
Total global environmental employment is difficult to measure
because no global data collection systems currently exist. While
several studies have made estimates of environmental employment
for specific countries and regions based on economic models, no
single authoritative estimate exists at a global level. In the EU, a
recent 2009 report by the EU Directorate General for the Environment
found that environmental employment in Europe has grown to over
3.4 million workers in 2008.11
The same report finds that environmental employment has been
growing in the EU at an annual average growth rate of 6.98% from
2000-2008. The greatest growth in the sector in Europe has been in
renewable energy at over 16% growth per year. The recycling sector
in Europe has also experienced double-digit employment growth,
largely due to so called ‘take-back’ legislation requiring producers
to take responsibility for the costs of recycling and disposal of their
products once they have reached the end of their useful life. Air
pollution is the only industry to have declined in employment over
the 2000-2008 time period in Europe, due largely to the maturity of
this industry (Table 5).
11 See Report on Competitiveness of the EU Eco-Industries 2009. Last accessed February, 2010 at http://ec.europa.eu/environment/enveco/eco_industry/pdf/report%20_2009_competitiveness_part1.pdf
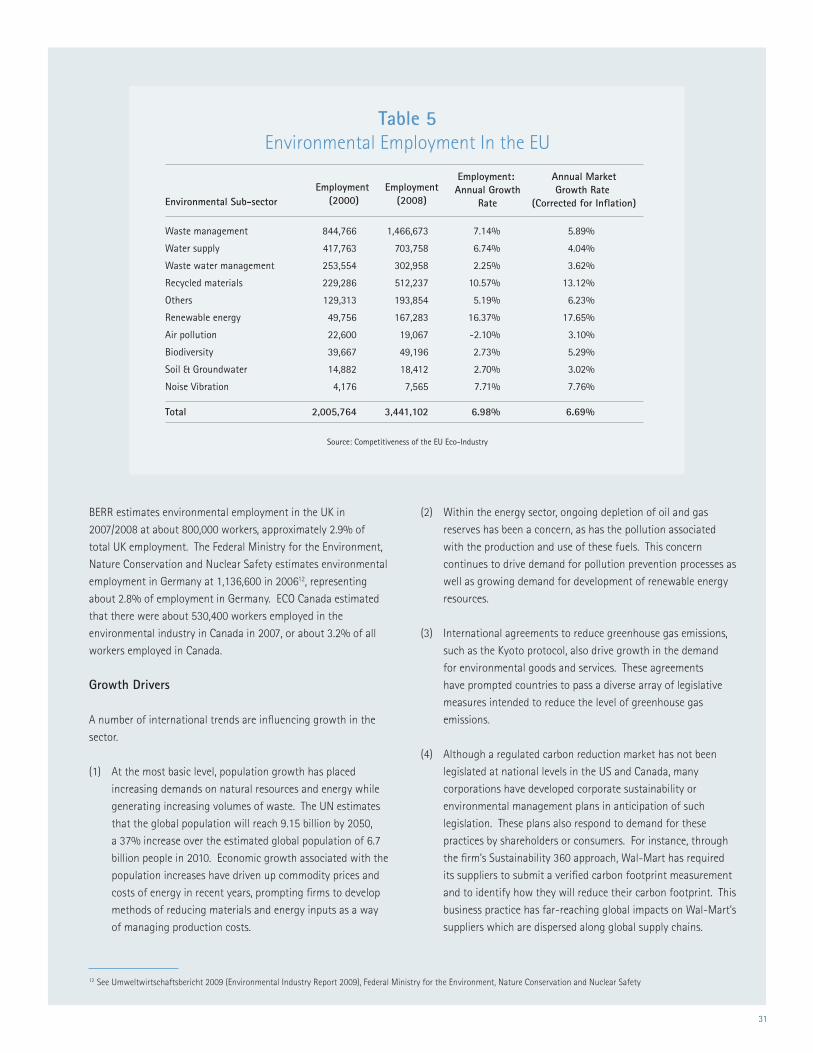
31
Table 5Environmental Employment In the EU
Source: Competitiveness of the EU Eco-Industry
Environmental Sub-sector
Waste management 844,766 1,466,673 7.14% 5.89%
Water supply 417,763 703,758 6.74% 4.04%
Waste water management 253,554 302,958 2.25% 3.62%
Recycled materials 229,286 512,237 10.57% 13.12%
Others 129,313 193,854 5.19% 6.23%
Renewable energy 49,756 167,283 16.37% 17.65%
Air pollution 22,600 19,067 -2.10% 3.10%
Biodiversity 39,667 49,196 2.73% 5.29%
Soil & Groundwater 14,882 18,412 2.70% 3.02%
Noise Vibration 4,176 7,565 7.71% 7.76%
Total 2,005,764 3,441,102 6.98% 6.69%
Employment (2000)
Employment(2008)
Employment: Annual Growth
Rate
Annual MarketGrowth Rate
(Corrected for Inflation)
BERR estimates environmental employment in the UK in
2007/2008 at about 800,000 workers, approximately 2.9% of
total UK employment. The Federal Ministry for the Environment,
Nature Conservation and Nuclear Safety estimates environmental
employment in Germany at 1,136,600 in 200612, representing
about 2.8% of employment in Germany. ECO Canada estimated
that there were about 530,400 workers employed in the
environmental industry in Canada in 2007, or about 3.2% of all
workers employed in Canada.
Growth Drivers
A number of international trends are influencing growth in the
sector.
(1) At the most basic level, population growth has placed
increasing demands on natural resources and energy while
generating increasing volumes of waste. The UN estimates
that the global population will reach 9.15 billion by 2050,
a 37% increase over the estimated global population of 6.7
billion people in 2010. Economic growth associated with the
population increases have driven up commodity prices and
costs of energy in recent years, prompting firms to develop
methods of reducing materials and energy inputs as a way
of managing production costs.
(2) Within the energy sector, ongoing depletion of oil and gas
reserves has been a concern, as has the pollution associated
with the production and use of these fuels. This concern
continues to drive demand for pollution prevention processes as
well as growing demand for development of renewable energy
resources.
(3) International agreements to reduce greenhouse gas emissions,
such as the Kyoto protocol, also drive growth in the demand
for environmental goods and services. These agreements
have prompted countries to pass a diverse array of legislative
measures intended to reduce the level of greenhouse gas
emissions.
(4) Although a regulated carbon reduction market has not been
legislated at national levels in the US and Canada, many
corporations have developed corporate sustainability or
environmental management plans in anticipation of such
legislation. These plans also respond to demand for these
practices by shareholders or consumers. For instance, through
the firm’s Sustainability 360 approach, Wal-Mart has required
its suppliers to submit a verified carbon footprint measurement
and to identify how they will reduce their carbon footprint. This
business practice has far-reaching global impacts on Wal-Mart’s
suppliers which are dispersed along global supply chains.
12 See Umweltwirtschaftsbericht 2009 (Environmental Industry Report 2009), Federal Ministry for the Environment, Nature Conservation and Nuclear Safety
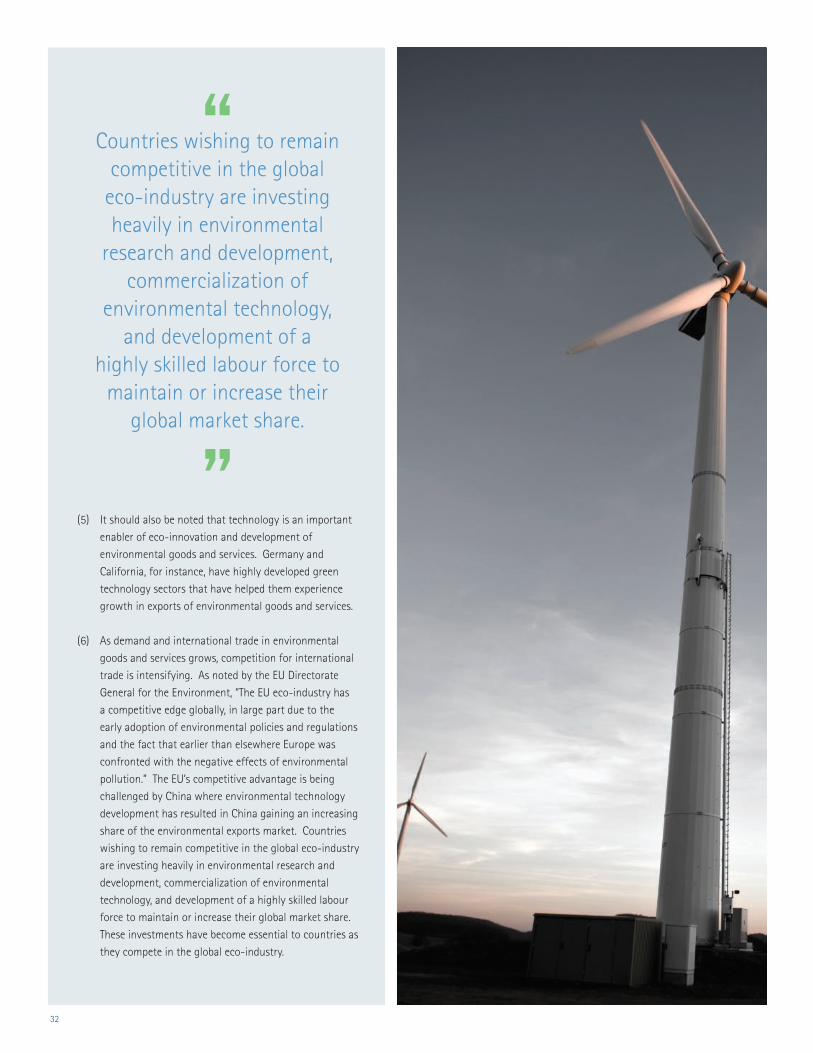
32
(5) It should also be noted that technology is an important
enabler of eco-innovation and development of
environmental goods and services. Germany and
California, for instance, have highly developed green
technology sectors that have helped them experience
growth in exports of environmental goods and services.
(6) As demand and international trade in environmental
goods and services grows, competition for international
trade is intensifying. As noted by the EU Directorate
General for the Environment, “The EU eco-industry has
a competitive edge globally, in large part due to the
early adoption of environmental policies and regulations
and the fact that earlier than elsewhere Europe was
confronted with the negative effects of environmental
pollution.” The EU’s competitive advantage is being
challenged by China where environmental technology
development has resulted in China gaining an increasing
share of the environmental exports market. Countries
wishing to remain competitive in the global eco-industry
are investing heavily in environmental research and
development, commercialization of environmental
technology, and development of a highly skilled labour
force to maintain or increase their global market share.
These investments have become essential to countries as
they compete in the global eco-industry.
Countries wishing to remain competitive in the global
eco-industry are investing heavily in environmental
research and development, commercialization of
environmental technology, and development of a
highly skilled labour force to maintain or increase their
global market share.
33
The trends that have been driving growth in the environmental
sector will likely continue to do so in the future. In addition to
these established trends, there are emerging trends as well as
uncertainties that will impact growth of employment in the sector.
In this section, some uncertainties that may have significant
impacts on the future growth of the sector are explored.
Uncertainties in the future can be grouped into three main
categories: (1) uncertainties on future international environmental
agreements, (2) uncertainties in future regulatory and policy
design, and (3) uncertainty in the level of future integration of
the environmental sector into all industries. Future international
agreements and regulations have the potential to introduce
dramatic changes in employment demand in the sector. Increased
integration of the sector into all industries is likely to continue
growing gradually over time as parts of the environmental sector
become difficult to distinguish from traditional industries.
International Environmental Agreements
At the time of writing of this report, the UN Global Climate Summit
in Copenhagen has concluded without providing clear direction on
the future of international climate change agreements. Essentially,
no substantive binding commitments to actions to mitigate climate
change were made, and the future of such agreements is uncertain,
as is Canada’s participation.
In a series of key informant interviews for this study, carbon
emission reductions were seen by every participant as a key growth
area for the environmental sector. Participation in future climate
change agreements will accelerate growth in this sector. However,
the probability and timing of such an international agreement
occurring in the future is uncertain.
Changes in Regulatory Mechanisms
It is estimated that developed countries spend roughly the same
percentage of GDP (2 %) on environmental protection.13 This
is based on similar legislation and regulations on pollutants.
Countries differ, however, on the regulatory mechanism used for
implementation and enforcement of this legislation. In the EU,
‘take-back’ mechanisms are in place to support growth in the
recycling industry. Producer ‘take-back’ is a product and waste
management system in which manufacturers are financially
responsible for the environmentally safe management of their
products when they are no longer useful to consumers. Pollution
permitting is another mechanism in use in the EU which has
driven demand for integrated environmental impact assessments
(air, land, and water) in order to obtain pollution permits.
Voluntary agreements and incentive structures are a more
commonly-used enforcement method in the US and Canada.
These choices in regulatory design and methods have impacts on
the growth of sub-sectors of the environmental sector and future
changes to this regulation can affect growth.
Integration of the Environmental Sector into Traditional Industries
Environmentally sustainable business practices have been
implemented by many firms. As environmental management
systems become more common in businesses and governments,
the distinction between environmental industries and all other
industries is being blurred. Traditional manufacturing businesses
are increasingly employing environmental technologies to add
value to their products or reduce costs. Convergence between
eco-industry and conventional manufacturing is taking place,
resulting in a transition from eco-friendly products from an
alternative to the standard. This trend is making the boundaries
of the environmental goods and services industry more difficult
to discern. The industry structure and form for green technology
is uncertain. Some experts view the trend in eco-innovation as
one that will independently generate employment growth, while
other experts view the integration of environmental business
practices as evidence that this segment of the environmental
sector is dissipating into an integrated characteristic common to
all business practice.
7.0 SOCIAL, ECONOMIC AND POLITICAL TRENDS
13 See Study on the Competitiveness of EU Eco-Industry
34
8.0 DRIVERS OF GROWTH IN CANADA’S ENVIRONMENTAL SECTOR
Summary
The Canadian environmental sector represents about 3.2% of
employment in Canada14, making it larger than the nation’s
aerospace or pharmaceutical industries. The dynamics that
affect growth of the sector are as diverse as the sector itself. At
the sub-sector level, unique drivers can play an important role
in shaping growth and these trends are discussed in the last
chapter which covers each sub-sector individually. This chapter
focuses on the macro-level factors that shape the sector. At a
macro level, the main drivers that are affecting growth are:
• Environmental policy and regulation including direct
government spending on the environment, environmental
regulation and incentives to encourage environmental
investment
• Financial and economic drivers such as high energy costs
or access to developing markets
• Consumer demand for environmentally-friendly products
and practices
• Environmental management practices in the business
sector such as lifecycle assessment, green purchasing policy
and other environmental business practices
These drivers are inter-related. For instance, changes in
consumer attitudes affects purchases but also affects voting
behaviour, which could have an impact on environmental policy.
Changes in policy and regulation can result in higher costs
for businesses that pollute, increasing the financial incentive
for firms to invest in cleaner processes. Among these drivers,
policy changes, particularly at the provincial level, and economic
drivers are the main drivers influencing growth of the sector.
It is difficult to determine the exact extent to which a change
in business practices and consumer attitudes affects the
environmental sector. These drivers all are moving in the same
direction—increasing the demand for environmental goods and
services.
In addition to drivers, there are two key trends that are
shaping the way in which the sector grows. These include:
(1) A trend toward pollution prevention—this trend is
blurring the lines between a traditionally well-defined
environmental sector and environmental protection
practices that are integrated throughout industries that
are not traditionally environmental, per se.
(2) A trend toward diversification—new environmental
markets such as renewable energy or carbon emission
reduction give rise to new types of worker demand.
Changes to these trends and the key drivers will have
significant impacts on future growth in the sector. In
particular, rising energy costs and the rise of a market for
carbon mitigation each have the potential to drive significant
investment across the sector.
Germany, the UK, the US, and other countries have
increasingly adopted policies that promote growth of the
environmental sector as a source of exports and an engine
of job creation. Investments in tracking and analysis of
the sector by economic development organizations in these
countries show how the industry is increasingly viewed as a
source of economic growth rather than a constraint to growth
of other industries. These changes have given rise to venture
capital and green technology commercialization funds that
seek to capture environmental sector growth opportunities.
This shift has contributed to global investments in clean
technology venture investment, which reached $8.4 billion
in 2008, up 38% from $6.1 billion in 2007, despite the global
recession and US credit crisis.15
14 ECO Canada 2007 Profile of Canadian Environmental Employment
15 See CleanTech (2008). Last accessed February, 2010 at http://cleantech.com/about/pressreleases/010609.cfm
35
8.1 POLICY AND REGULATION DRIVERS
Legislation and regulations are perhaps the most easily
identified driver of growth in the environmental sector. There
are four ways in which public policy has affected growth in the
environmental sector:
(1) Direct government spending on environmental services
(2) Employment demand resulting from actions taken to
comply with environmental legislation and regulations
(3) Policy compliance has resulted in technology related eco-
innovation which has made Canadian firms competitive for
exports of environmental goods and services
(4) Tax credit and other forms of policy-based financial
incentives have enabled investment in environmental
goods and services
Ongoing direct government spending on the environment offers
a level of stability to the environmental industry. Changes
to environmental regulations, which typically become more
stringent over time, have the greatest potential for affecting
growth in the environmental industry. Depending on the type
and level of regulatory change, the impact on employment in
the sector can be large or small.
Several studies have shown that the use of incentives for
environmental protection can result in lower costs for pollution
control when compared to traditional environmental compliance
methods.16 While incentives do not require environmental
policy compliance, they do promote innovation and the
rise of new markets. Competing products and services for
environmental protection are developed in the marketplace
as a result, driving ongoing improvements. Incentives such
as research and development tax credits further encourage
innovation. These innovations make the national markets more
flexible, and ongoing technology development makes Canadian
products more competitive internationally. Direct government
spending on the environment offers a level of stability to the
environmental industry.
16 See Cost Effectiveness and Environmental Effects of Incentive Systems; EPA (2001) Last accessed February, 2010 at http://yosemite.epa.gov/ee/epa/eermfile.nsf/vwAN/EE-0216B-04.pdf/$File/EE-0216B-04.pdf
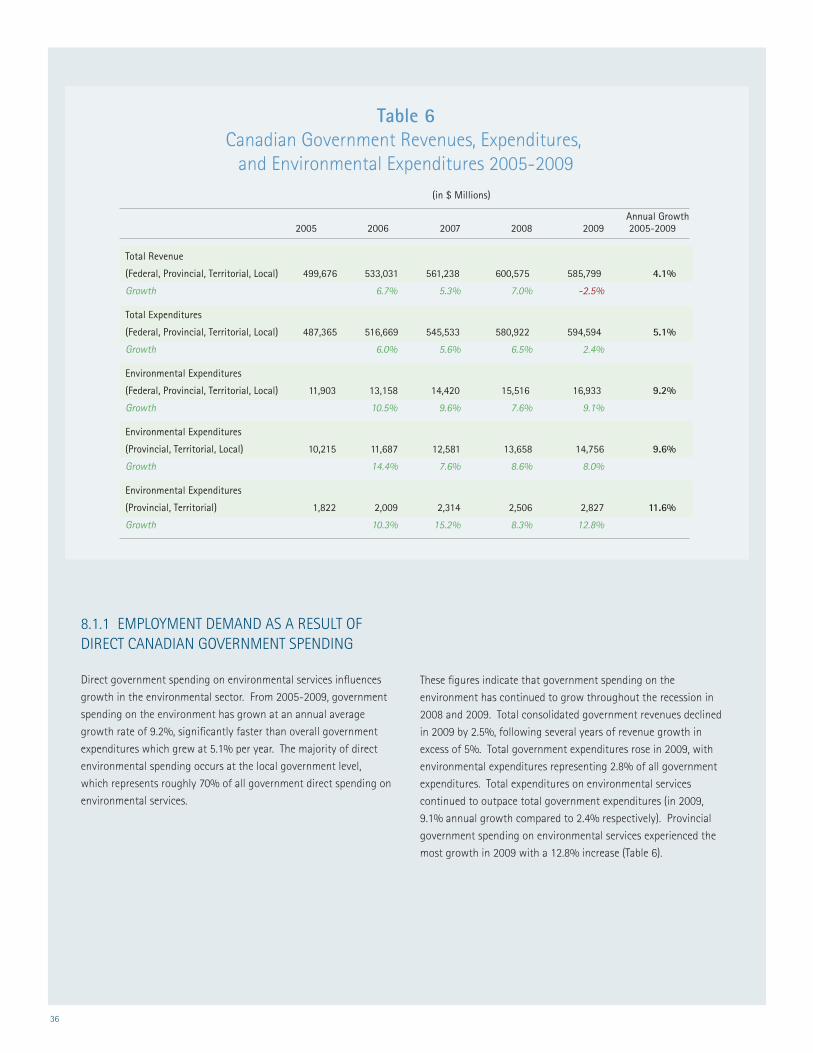
36
Table 6Canadian Government Revenues, Expenditures,
and Environmental Expenditures 2005-2009 (in $ Millions)
Annual Growth 2005 2006 2007 2008 2009 2005-2009
Total Revenue
(Federal, Provincial, Territorial, Local) 499,676 533,031 561,238 600,575 585,799 4.1%
Growth 6.7% 5.3% 7.0% -2.5%
Total Expenditures
(Federal, Provincial, Territorial, Local) 487,365 516,669 545,533 580,922 594,594 5.1%
Growth 6.0% 5.6% 6.5% 2.4%
Environmental Expenditures
(Federal, Provincial, Territorial, Local) 11,903 13,158 14,420 15,516 16,933 9.2%
Growth 10.5% 9.6% 7.6% 9.1%
Environmental Expenditures
(Provincial, Territorial, Local) 10,215 11,687 12,581 13,658 14,756 9.6%
Growth 14.4% 7.6% 8.6% 8.0%
Environmental Expenditures
(Provincial, Territorial) 1,822 2,009 2,314 2,506 2,827 11.6%
Growth 10.3% 15.2% 8.3% 12.8%
8.1.1 EMPLOYMENT DEMAND AS A RESULT OF DIRECT CANADIAN GOVERNMENT SPENDING
Direct government spending on environmental services influences
growth in the environmental sector. From 2005-2009, government
spending on the environment has grown at an annual average
growth rate of 9.2%, significantly faster than overall government
expenditures which grew at 5.1% per year. The majority of direct
environmental spending occurs at the local government level,
which represents roughly 70% of all government direct spending on
environmental services.
These figures indicate that government spending on the
environment has continued to grow throughout the recession in
2008 and 2009. Total consolidated government revenues declined
in 2009 by 2.5%, following several years of revenue growth in
excess of 5%. Total government expenditures rose in 2009, with
environmental expenditures representing 2.8% of all government
expenditures. Total expenditures on environmental services
continued to outpace total government expenditures (in 2009,
9.1% annual growth compared to 2.4% respectively). Provincial
government spending on environmental services experienced the
most growth in 2009 with a 12.8% increase (Table 6).
37
8.1.2 EMPLOYMENT DEMAND DRIVEN BY POLICY COMPLIANCE ACTIVITIES
Policy and regulatory measures taken by governments are
strongly tied to growth of the environmental sector as
private sector firms make investments to comply with federal,
state/provincial, and local regulations. The federal and
provincial governments in Canada both have jurisdiction over
environmental matters. Municipal governments are responsible
for solid waste management, water and sewage systems,
and noise issues, but also regulate use of certain substances.
Regulations at each level of government often overlap,
making compliance with environmental regulations complex.
Compliance activities often require a diverse set of specialized
workers, including:
• Attorneysandpolicyanalystswhichspecializein
environmental law
• Chemistsandnaturalsciencesprofessionalswhoperform
environmental consulting services to insure compliance
with regulations
• Emissionstesters,verifiers,andsimilartechnicianswho
assist with environmental compliance activities
• Landuseandplanningofficialswhodevelopandenforce
environmental policy
• Mechanical,electrical,chemical,andenvironmental
engineers who develop production systems that are able to
meet environmental regulatory guidelines, and
• Otherspecialists
This set of workers in the environmental sector is dispersed
throughout manufacturing industries, especially those which
are relatively heavy emitters of pollutants. They are also
employed in the professional, technical, and scientific services
industries.
Compliance with public policy regulations also drives demand
for environmental goods made by Canadian manufacturing
firms. Environmental manufacturers like General Electric benefit
from demand for environmental goods. This in turn drives
demand for manufacturing engineers and other professionals
who apply specialized environmental knowledge and skills in the
manufacturing process.
Climate Change and Greenhouse Gas Control
Climate change regulation is an emerging issue that will have
significant demand for skills related to measurement of carbon
footprints or water-use footprints as well as various forms of
carbon finance. The Province of Alberta was the first North
American jurisdiction to legislate the regulation of greenhouse
gas emissions from large industrial emitters. The Provinces of
British Columbia, Manitoba, Ontario and Québec have committed
to participating in the Western Climate Initiative along with seven
American States. Each of these regimes place a cap on permitted
emissions (in Alberta, based on emissions intensity) and permit at
least some degree of emissions reduction credit trading to achieve
compliance.
The federal government has also proposed climate change
legislation involving a proposed cap and trade system. Like Alberta,
it would be based on emissions intensity. However, more recent
statements from the federal government have suggested an
intention to adopt an approach similar to that generally outlined
by the Democrats in the United States. Until more details are
disclosed on the US approach, it is unclear what approach will be
taken by the Canadian government.
Federal Environmental Regulation
There are several pieces of federal legislation that have driven
growth in the environmental sector. The legislation itself, as
well as its implementation by regulatory bodies, has undergone
numerous changes over time, contributing to ongoing need for
firms to adjust and respond. In this section, we introduce the
main segments of federal environmental legislation, in their most
current form.
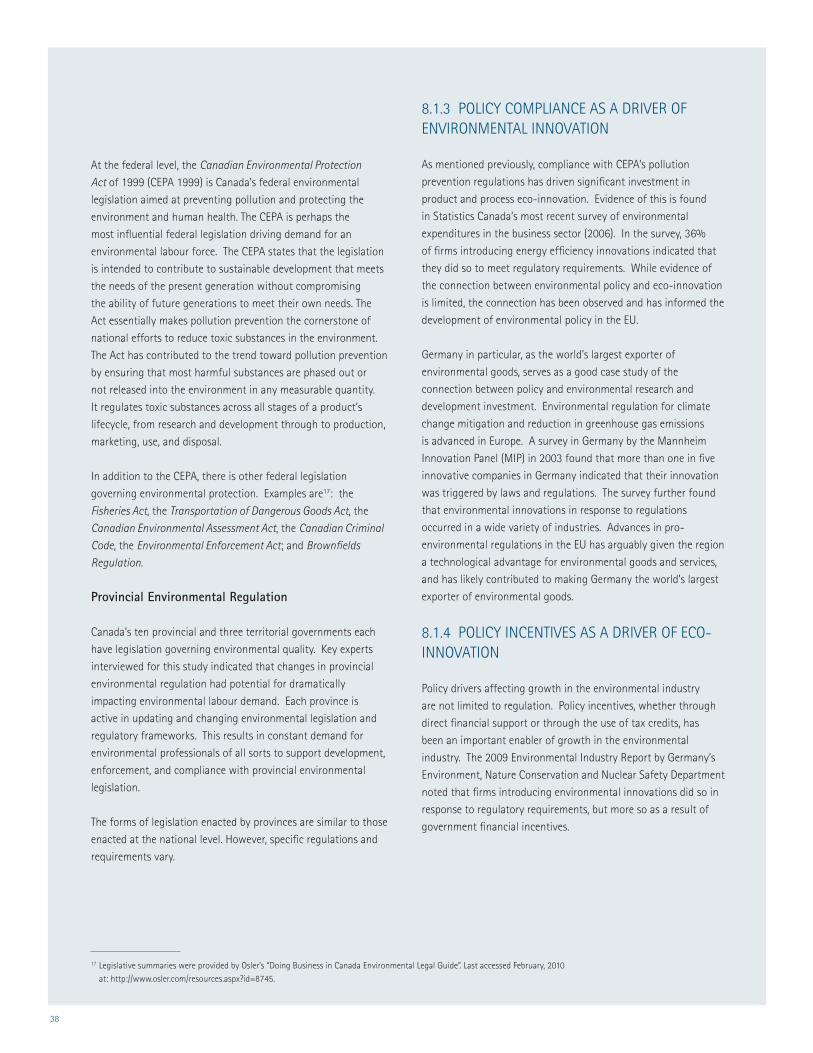
38
At the federal level, the Canadian Environmental Protection Act of 1999 (CEPA 1999) is Canada’s federal environmental
legislation aimed at preventing pollution and protecting the
environment and human health. The CEPA is perhaps the
most influential federal legislation driving demand for an
environmental labour force. The CEPA states that the legislation
is intended to contribute to sustainable development that meets
the needs of the present generation without compromising
the ability of future generations to meet their own needs. The
Act essentially makes pollution prevention the cornerstone of
national efforts to reduce toxic substances in the environment.
The Act has contributed to the trend toward pollution prevention
by ensuring that most harmful substances are phased out or
not released into the environment in any measurable quantity.
It regulates toxic substances across all stages of a product’s
lifecycle, from research and development through to production,
marketing, use, and disposal.
In addition to the CEPA, there is other federal legislation
governing environmental protection. Examples are17: the
Fisheries Act, the Transportation of Dangerous Goods Act, the
Canadian Environmental Assessment Act, the Canadian Criminal Code, the Environmental Enforcement Act; and Brownfields Regulation.
Provincial Environmental Regulation
Canada’s ten provincial and three territorial governments each
have legislation governing environmental quality. Key experts
interviewed for this study indicated that changes in provincial
environmental regulation had potential for dramatically
impacting environmental labour demand. Each province is
active in updating and changing environmental legislation and
regulatory frameworks. This results in constant demand for
environmental professionals of all sorts to support development,
enforcement, and compliance with provincial environmental
legislation.
The forms of legislation enacted by provinces are similar to those
enacted at the national level. However, specific regulations and
requirements vary.
8.1.3 POLICY COMPLIANCE AS A DRIVER OF ENVIRONMENTAL INNOVATION
As mentioned previously, compliance with CEPA’s pollution
prevention regulations has driven significant investment in
product and process eco-innovation. Evidence of this is found
in Statistics Canada’s most recent survey of environmental
expenditures in the business sector (2006). In the survey, 36%
of firms introducing energy efficiency innovations indicated that
they did so to meet regulatory requirements. While evidence of
the connection between environmental policy and eco-innovation
is limited, the connection has been observed and has informed the
development of environmental policy in the EU.
Germany in particular, as the world’s largest exporter of
environmental goods, serves as a good case study of the
connection between policy and environmental research and
development investment. Environmental regulation for climate
change mitigation and reduction in greenhouse gas emissions
is advanced in Europe. A survey in Germany by the Mannheim
Innovation Panel (MIP) in 2003 found that more than one in five
innovative companies in Germany indicated that their innovation
was triggered by laws and regulations. The survey further found
that environmental innovations in response to regulations
occurred in a wide variety of industries. Advances in pro-
environmental regulations in the EU has arguably given the region
a technological advantage for environmental goods and services,
and has likely contributed to making Germany the world’s largest
exporter of environmental goods.
8.1.4 POLICY INCENTIVES AS A DRIVER OF ECO-INNOVATION
Policy drivers affecting growth in the environmental industry
are not limited to regulation. Policy incentives, whether through
direct financial support or through the use of tax credits, has
been an important enabler of growth in the environmental
industry. The 2009 Environmental Industry Report by Germany’s
Environment, Nature Conservation and Nuclear Safety Department
noted that firms introducing environmental innovations did so in
response to regulatory requirements, but more so as a result of
government financial incentives.
17 Legislative summaries were provided by Osler’s “Doing Business in Canada Environmental Legal Guide”. Last accessed February, 2010 at: http://www.osler.com/resources.aspx?id=8745.
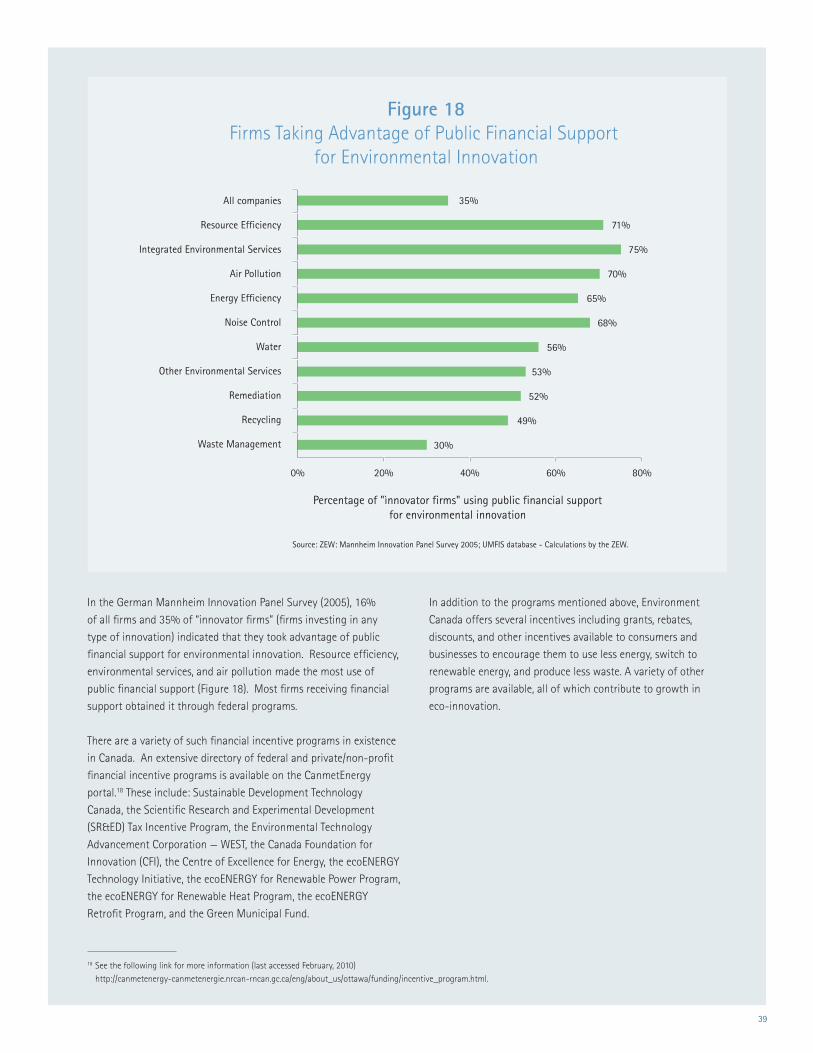
39
Figure 18Firms Taking Advantage of Public Financial Support
for Environmental Innovation
Source: ZEW: Mannheim Innovation Panel Survey 2005; UMFIS database - Calculations by the ZEW.
35%
71%
75%
70%
65%
68%
56%
53%
52%
49%
30%
All companies
Resource Efficiency
Integrated Environmental Services
Air Pollution
Energy Efficiency
Noise Control
Water
Other Environmental Services
Remediation
Recycling
Waste Management
Percentage of "ìnnovator firms" using public financial supportfor environmental innovation
0% 20% 40% 60% 80%
In the German Mannheim Innovation Panel Survey (2005), 16%
of all firms and 35% of “innovator firms” (firms investing in any
type of innovation) indicated that they took advantage of public
financial support for environmental innovation. Resource efficiency,
environmental services, and air pollution made the most use of
public financial support (Figure 18). Most firms receiving financial
support obtained it through federal programs.
There are a variety of such financial incentive programs in existence
in Canada. An extensive directory of federal and private/non-profit
financial incentive programs is available on the CanmetEnergy
portal.18 These include: Sustainable Development Technology
Canada, the Scientific Research and Experimental Development
(SR&ED) Tax Incentive Program, the Environmental Technology
Advancement Corporation — WEST, the Canada Foundation for
Innovation (CFI), the Centre of Excellence for Energy, the ecoENERGY
Technology Initiative, the ecoENERGY for Renewable Power Program,
the ecoENERGY for Renewable Heat Program, the ecoENERGY
Retrofit Program, and the Green Municipal Fund.
In addition to the programs mentioned above, Environment
Canada offers several incentives including grants, rebates,
discounts, and other incentives available to consumers and
businesses to encourage them to use less energy, switch to
renewable energy, and produce less waste. A variety of other
programs are available, all of which contribute to growth in
eco-innovation.
18 See the following link for more information (last accessed February, 2010) http://canmetenergy-canmetenergie.nrcan-rncan.gc.ca/eng/about_us/ottawa/funding/incentive_program.html.
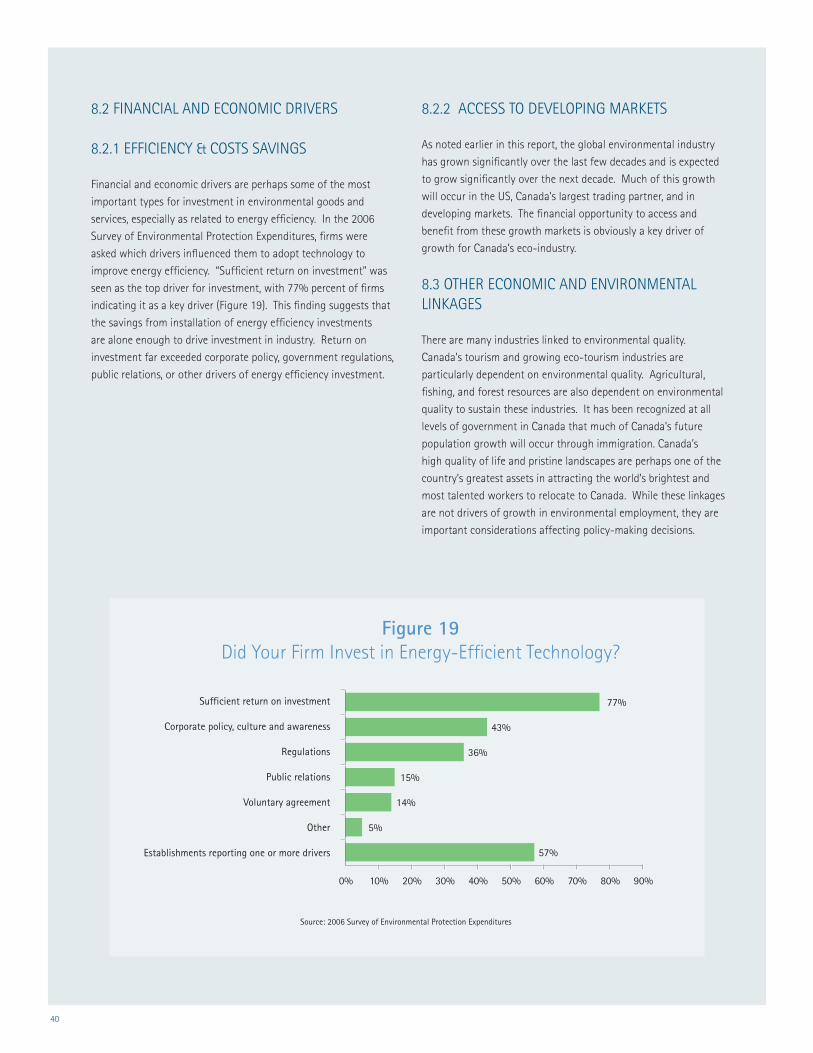
40
8.2 FINANCIAL AND ECONOMIC DRIVERS
8.2.1 EFFICIENCY & COSTS SAVINGS
Financial and economic drivers are perhaps some of the most
important types for investment in environmental goods and
services, especially as related to energy efficiency. In the 2006
Survey of Environmental Protection Expenditures, firms were
asked which drivers influenced them to adopt technology to
improve energy efficiency. “Sufficient return on investment” was
seen as the top driver for investment, with 77% percent of firms
indicating it as a key driver (Figure 19). This finding suggests that
the savings from installation of energy efficiency investments
are alone enough to drive investment in industry. Return on
investment far exceeded corporate policy, government regulations,
public relations, or other drivers of energy efficiency investment.
8.2.2 ACCESS TO DEVELOPING MARKETS
As noted earlier in this report, the global environmental industry
has grown significantly over the last few decades and is expected
to grow significantly over the next decade. Much of this growth
will occur in the US, Canada’s largest trading partner, and in
developing markets. The financial opportunity to access and
benefit from these growth markets is obviously a key driver of
growth for Canada’s eco-industry.
8.3 OTHER ECONOMIC AND ENVIRONMENTAL LINKAGES
There are many industries linked to environmental quality.
Canada’s tourism and growing eco-tourism industries are
particularly dependent on environmental quality. Agricultural,
fishing, and forest resources are also dependent on environmental
quality to sustain these industries. It has been recognized at all
levels of government in Canada that much of Canada’s future
population growth will occur through immigration. Canada’s
high quality of life and pristine landscapes are perhaps one of the
country’s greatest assets in attracting the world’s brightest and
most talented workers to relocate to Canada. While these linkages
are not drivers of growth in environmental employment, they are
important considerations affecting policy-making decisions.
Figure 19Did Your Firm Invest in Energy-Efficient Technology?
Source: 2006 Survey of Environmental Protection Expenditures
77%
43%
36%
15%
14%
5%
57%
0% 10% 20% 30% 40% 50% 60% 70% 80% 90%
Sufficient return on investment
Corporate policy, culture and awareness
Regulations
Public relations
Voluntary agreement
Other
Establishments reporting one or more drivers
41
8.4 CONSUMER AND BUSINESSES-TO-BUSINESS DEMAND
Consumer Attitudes
Public attitudes toward protection of the environment have been
the basis for much of the environmental legislation enacted
in the past 50 years. A longstanding consumer concern for
the environment supports ongoing government support for
environmental protection regulation. There are indications that
environmental concerns are affecting consumer purchasing
decisions and that a growing number of consumers are actively
seeking out environmentally friendly or green products and
services. These preferences are driving integration of sustainable
business practices and eco-innovation in essentially every
industry. A trend toward ’buying green‘ has influenced the way
that firms develop, market, package, and provide for future
disposal of their products. This trend indirectly drives demand
for environmental skills for managers and specialists throughout
the workforce.
Investigation of consumer attitudes toward the environment
and demand for eco-friendly products highlighted a mixed set
of findings. Clearly, consumer awareness and concern for the
environment has been strong for a long time. Consumer surveys
conducted by Gallop in the US since 1984 have asked consumers
which should be given preference—protection of the environment
or economic growth. Since 1984, there has not been a period
where the economy was given preference over the environment,
although concern for the economy over the environment increased
somewhat following the 2001-2002 recessionary period (Figure 20).
Figure 20Environment vs. Economy: Which should be given priority?
Source: Gallop USA
61
71 70
58 6266 68 65 67 70 67
57 5447 49 53
2819 20
2632
27 2430 28
2328
33 3642 44
36
80706050403020100
Sep,
1984
Apr, 19
90
Apr, 19
91
Apr, 19
95
Jul, 1
997
Apr, 19
98
Mar, 19
99
Apr, 19
99
Jan, 2
000
Apr, 20
00
Mar, 20
01
Mar, 20
02
Mar, 20
03
Mar, 20
04
Mar, 20
05
Mar, 19
92
Environment given priority
Economic growth given priority
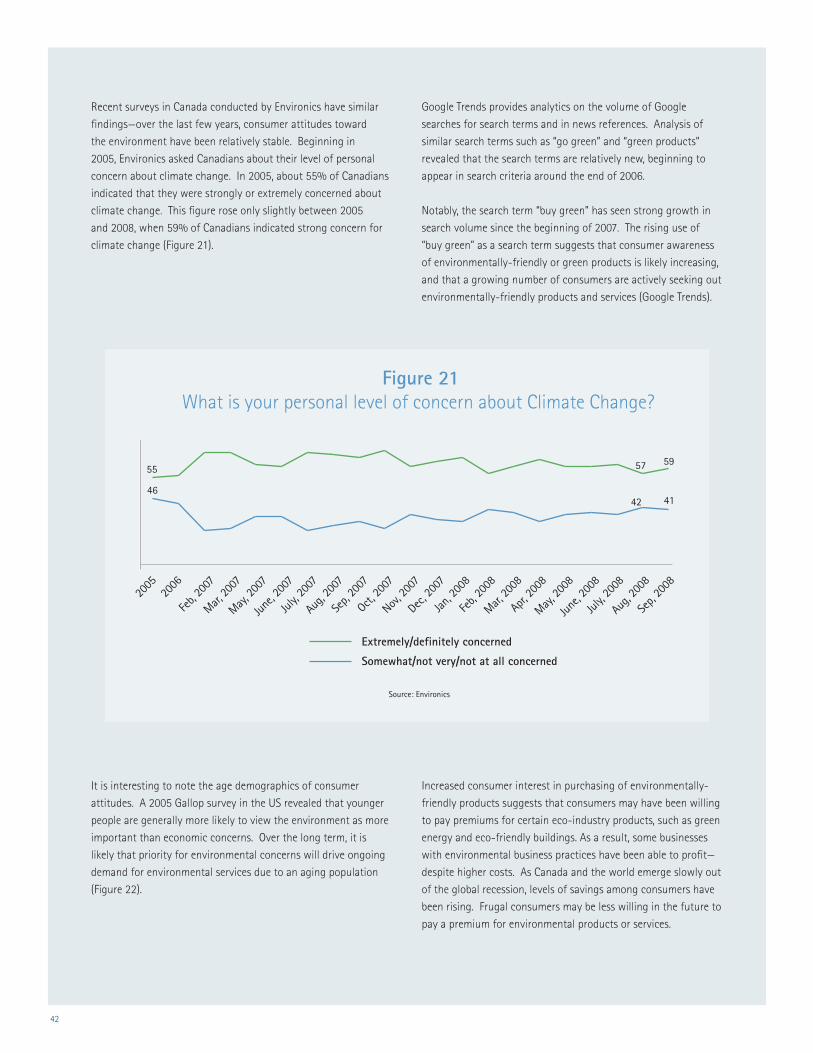
42
Recent surveys in Canada conducted by Environics have similar
findings—over the last few years, consumer attitudes toward
the environment have been relatively stable. Beginning in
2005, Environics asked Canadians about their level of personal
concern about climate change. In 2005, about 55% of Canadians
indicated that they were strongly or extremely concerned about
climate change. This figure rose only slightly between 2005
and 2008, when 59% of Canadians indicated strong concern for
climate change (Figure 21).
Google Trends provides analytics on the volume of Google
searches for search terms and in news references. Analysis of
similar search terms such as “go green” and “green products”
revealed that the search terms are relatively new, beginning to
appear in search criteria around the end of 2006.
Notably, the search term “buy green” has seen strong growth in
search volume since the beginning of 2007. The rising use of
“buy green” as a search term suggests that consumer awareness
of environmentally-friendly or green products is likely increasing,
and that a growing number of consumers are actively seeking out
environmentally-friendly products and services (Google Trends).
Figure 21What is your personal level of concern about Climate Change?
Source: Environics
Extremely/definitely concerned
Somewhat/not very/not at all concerned
46
55
42
57 59
41
2005
2006
Feb,
2007
May, 2
007
June
, 200
7
July,
2007
Aug, 2
007
Sep,
2007
May, 2
008
June
, 200
8
July,
2008
Aug, 2
008
Sep,
2008
Oct, 20
07
Nov, 2
007
Dec, 2
007
Jan, 2
008
Feb,
2008
Mar, 20
08
Apr, 20
08
Mar, 20
07
It is interesting to note the age demographics of consumer
attitudes. A 2005 Gallop survey in the US revealed that younger
people are generally more likely to view the environment as more
important than economic concerns. Over the long term, it is
likely that priority for environmental concerns will drive ongoing
demand for environmental services due to an aging population
(Figure 22).
Increased consumer interest in purchasing of environmentally-
friendly products suggests that consumers may have been willing
to pay premiums for certain eco-industry products, such as green
energy and eco-friendly buildings. As a result, some businesses
with environmental business practices have been able to profit—
despite higher costs. As Canada and the world emerge slowly out
of the global recession, levels of savings among consumers have
been rising. Frugal consumers may be less willing in the future to
pay a premium for environmental products or services.
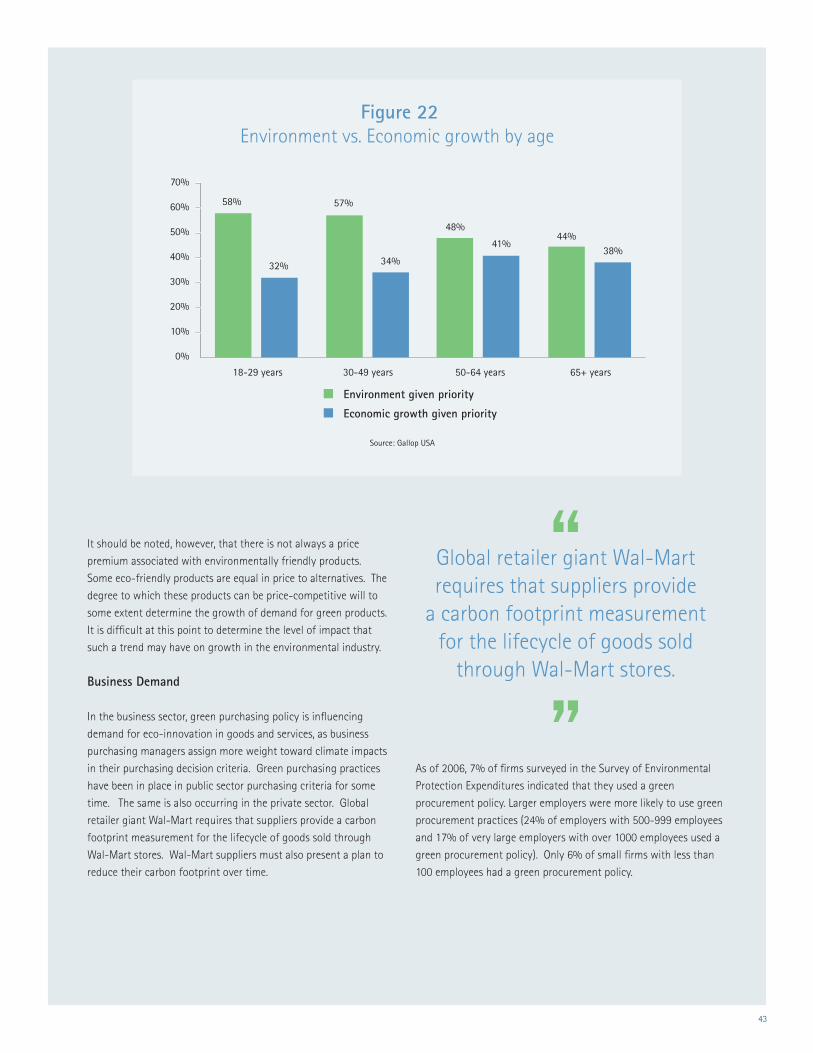
43
Figure 22Environment vs. Economic growth by age
58%
32%
57%
34%
48%
41%44%
38%
Environment given priority
Economic growth given priority
18-29 years 30-49 years 50-64 years 65+ years
70%
60%
50%
40%
30%
20%
10%
0%
Source: Gallop USA
It should be noted, however, that there is not always a price
premium associated with environmentally friendly products.
Some eco-friendly products are equal in price to alternatives. The
degree to which these products can be price-competitive will to
some extent determine the growth of demand for green products.
It is difficult at this point to determine the level of impact that
such a trend may have on growth in the environmental industry.
Business Demand
In the business sector, green purchasing policy is influencing
demand for eco-innovation in goods and services, as business
purchasing managers assign more weight toward climate impacts
in their purchasing decision criteria. Green purchasing practices
have been in place in public sector purchasing criteria for some
time. The same is also occurring in the private sector. Global
retailer giant Wal-Mart requires that suppliers provide a carbon
footprint measurement for the lifecycle of goods sold through
Wal-Mart stores. Wal-Mart suppliers must also present a plan to
reduce their carbon footprint over time.
As of 2006, 7% of firms surveyed in the Survey of Environmental
Protection Expenditures indicated that they used a green
procurement policy. Larger employers were more likely to use green
procurement practices (24% of employers with 500-999 employees
and 17% of very large employers with over 1000 employees used a
green procurement policy). Only 6% of small firms with less than
100 employees had a green procurement policy.
Global retailer giant Wal-Mart requires that suppliers provide
a carbon footprint measurement for the lifecycle of goods sold
through Wal-Mart stores.
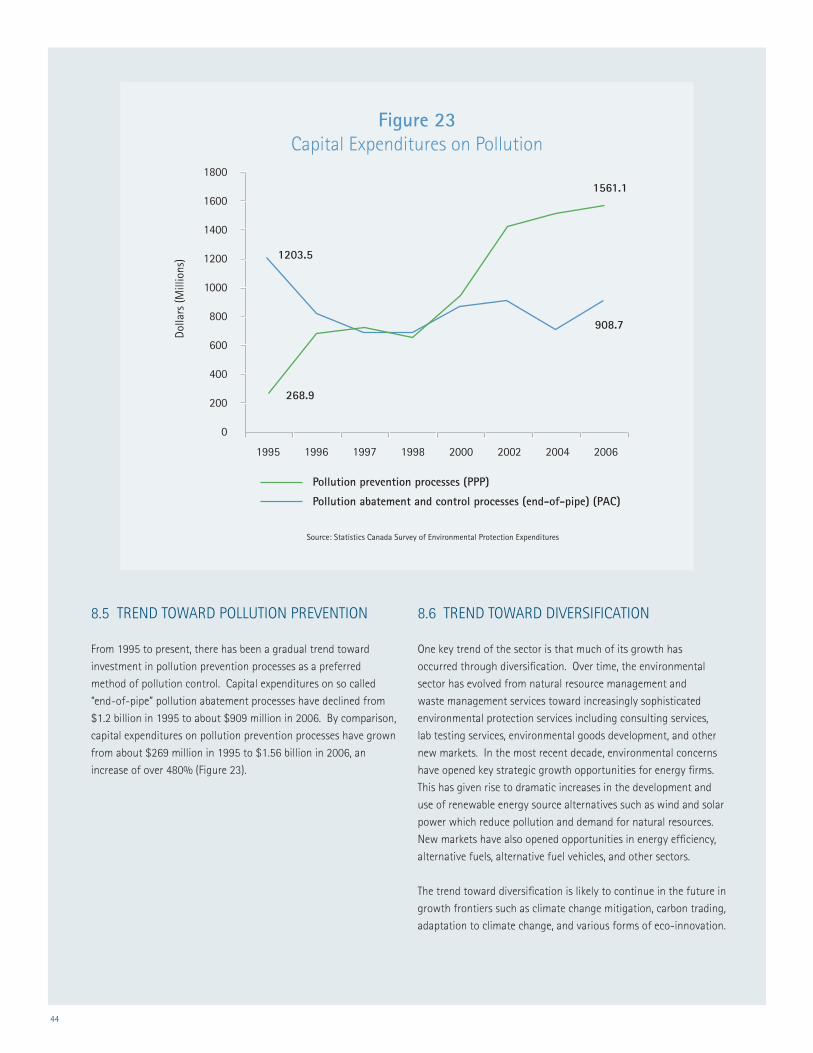
44
Figure 23Capital Expenditures on Pollution
Source: Statistics Canada Survey of Environmental Protection Expenditures
Pollution prevention processes (PPP)
Pollution abatement and control processes (end-of-pipe) (PAC)
1800
1600
1400
1200
1000
800
600
400
200
0
Dolla
rs (M
illio
ns)
1995 1996 1997 1998 2000 2002 2004 2006
1203.5
268.9
1561.1
908.7
8.5 TREND TOWARD POLLUTION PREVENTION
From 1995 to present, there has been a gradual trend toward
investment in pollution prevention processes as a preferred
method of pollution control. Capital expenditures on so called
“end-of-pipe” pollution abatement processes have declined from
$1.2 billion in 1995 to about $909 million in 2006. By comparison,
capital expenditures on pollution prevention processes have grown
from about $269 million in 1995 to $1.56 billion in 2006, an
increase of over 480% (Figure 23).
8.6 TREND TOWARD DIVERSIFICATION
One key trend of the sector is that much of its growth has
occurred through diversification. Over time, the environmental
sector has evolved from natural resource management and
waste management services toward increasingly sophisticated
environmental protection services including consulting services,
lab testing services, environmental goods development, and other
new markets. In the most recent decade, environmental concerns
have opened key strategic growth opportunities for energy firms.
This has given rise to dramatic increases in the development and
use of renewable energy source alternatives such as wind and solar
power which reduce pollution and demand for natural resources.
New markets have also opened opportunities in energy efficiency,
alternative fuels, alternative fuel vehicles, and other sectors.
The trend toward diversification is likely to continue in the future in
growth frontiers such as climate change mitigation, carbon trading,
adaptation to climate change, and various forms of eco-innovation.
45
These markets have been developing, to a greater extent in Europe,
and have in some cases seen tremendous growth, impacting the
skills required in the labour force. As noted in the report GreenTech: Made in Germany 2.0, the value of green technology emerging in
Germany and the EU is diversifying dramatically. This ’technology
atlas’ of green technology companies in Germany highlights the
incredible diversification of the German environmental industry and
how this diversification is expected to drive environmental revenues
for these firms from €1.4 billion in 2007 to over €3.1 billion in
2020, more than doubling the size of the German green technology
industry. Growth in development of the green technology sector
and exports of environmental technology and products is viewed by
government and industry in Germany as a key strategic economic
growth sector for Germany. Sigmar Gabriel, Federal Minister for
Germany’s Environment, Nature Conservation and Nuclear Safety
Department, noted in the 2009 Environmental Industry Report:
The report goes on to highlight how diversification in the
environmental sector resulted in the creation of over 291,000 new
jobs in Germany between 2004 and 2006, at an annual growth rate
of 9.4%. Total employment growth in Germany during the same
period was 1.6%.
’Environment and economy are opposites.’ If the
Environmental Economics report shows one thing, then
it is that this statement is false. As numerous scientific studies
show, the opposite is true: thinking economically and
ecologically is complimentary and doing so is clever—for
companies and the economy.
46
Key experts interviewed for this study had difficulty identifying
key structural constraints to growth of the environmental
sector. The lack of understanding of constraints to growth may
be connected to the limited amount of statistical information
collected on the environmental sector and its sub-sectors. Lack
of information on the sector limits the ability of investors to
identify opportunities in the sector. It further limits the ability
of policy analysts to develop policies that support economic
and employment growth in the sector. A lack of statistical
observation of the sector is the most important constraint
affecting growth of the sector.
Other constraints to growth of the environmental sector include
the size of capital-intensive investments in the sector, the level of
privatization of the sector, and the availability of skilled workers.
These constraints are sometimes related to regulations that affect
growth of the sector. An unfavourable regulatory environment
may also deter investment in capital-intensive industries. For
instance, non-privatization of regulated electric utilities and
waste management can limit growth of Canadian businesses in
these industries. Electric feed-in tariffs for renewable energy
generation recently enacted in Ontario are driving growth of the
solar and wind industries in the province19. Provinces without
similar incentives or support may experience slower growth on
renewable energy investment. These regulatory differences can
have profound effects on the level of investment and growth of
some environmental industries.
Limitations to Understanding Constraints
The European Commission Directorate General of the
Environment has recently performed a review of factors that limit
the competitiveness of the European eco-industry20. The report
developed a set of key recommendations on economic policy
changes that can remove constraints and strongly impact growth
in the sector. Interestingly, the top recommendation by the
research team is to increase the level of statistical data collection
on the EU environmental sector as a means of increasing
understanding of the sector.
The report observes that some sub-sectors are well reported,
especially if they do not fall within NACE industry classification.
The same is true in Canada where industries such as waste
management and environmental consulting services are well
tracked but other sub-sectors are not. The sub-sectors that are
not well-tracked include alternative energy systems, air quality
services, and emerging growth areas such as eco-innovation,
carbon emissions reductions, and climate change adaptation
activities.
Without detailed and regular statistical tracking of sub-sectors it
is difficult to determine even the size and growth of employment
in each sub-sector. Admittedly, tracking of the sector is difficult.
Statistics Canada conducts several surveys on the sector,
however, because of the sector’s complexity, it is difficult to
design survey instruments that account for all sub-sectors. This
is complicated by the nature of growth of the sector, which
largely occurs through diversification. By the time a survey is
designed, implemented, and reported, several years may have
passed, during which time the growth in the environmental
sector may change directionally and categorically.
The strategy for achieving this level of detailed reporting on
the environmental sector in the EU is to implement a new set
of guidelines to indirectly estimate growth characteristics of
the sector using existing survey data. This process has only
commenced in late 2009, and at the time of this report, only a
few countries have started to release information estimated in
this way. However, initial releases are providing insight into
the industry, which has given European policymakers strategic
information on which to base environmental policy decisions.
Increasing the statistical observation of the sector in Canada will
greatly improve the ability of policy-makers to design optimal
regulatory measures that will support growth of the sector.
This sort of information is also essential to investors wishing to
understand the growth prospects of industries when making
investment decisions.
19 For more information, see Information on Ontario’s Standard Offer Program: http://www.powerauthority.on.ca/Page.asp?PageID=122&ContentID=6858
20 See Study on the Competitiveness of EU Eco-industry NACE is the acronym for “Nomenclature statistique des activités économiques dans la Communauté européenne” (“statistical classification of economic activities in the European Community”).
9.0 CONSTRAINTS TO GROWTH OF THE CANADIAN EVIRONMENTAL SECTOR
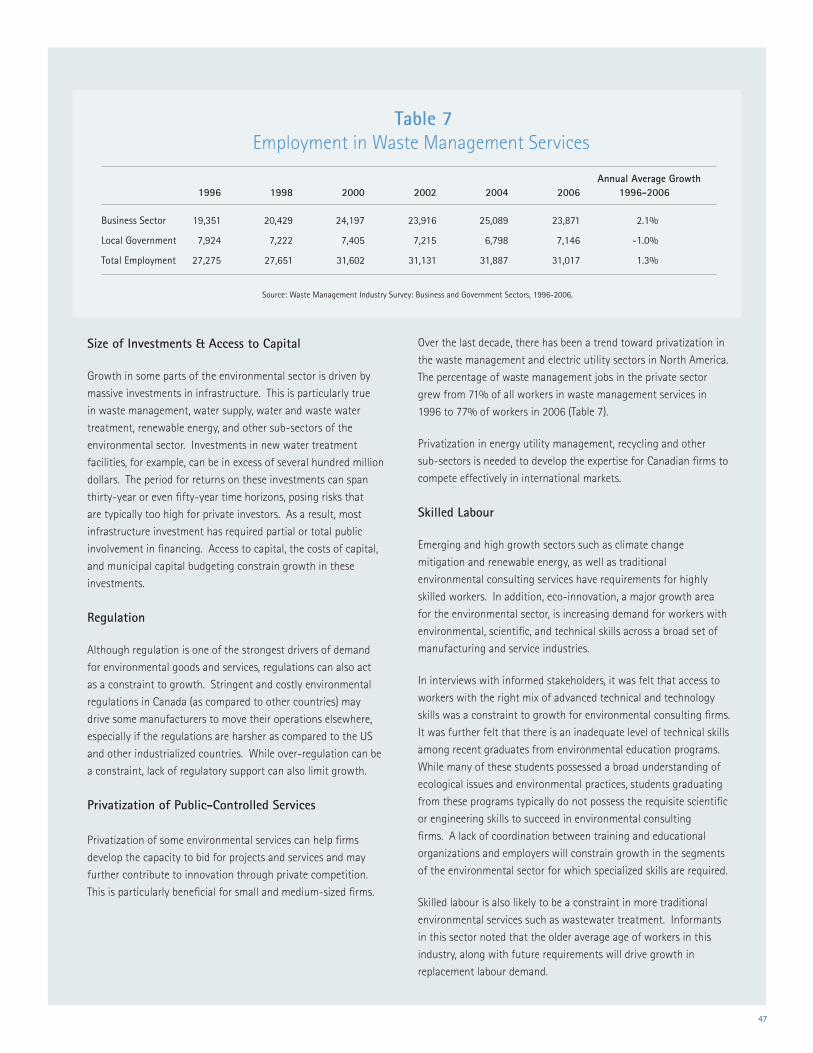
47
Table 7Employment in Waste Management Services
Source: Waste Management Industry Survey: Business and Government Sectors, 1996-2006.
1996 1998 2000 2002 2004 2006 1996-2006
Business Sector 19,351 20,429 24,197 23,916 25,089 23,871 2.1%
Local Government 7,924 7,222 7,405 7,215 6,798 7,146 -1.0%
Total Employment 27,275 27,651 31,602 31,131 31,887 31,017 1.3%
Annual Average Growth
Size of Investments & Access to Capital
Growth in some parts of the environmental sector is driven by
massive investments in infrastructure. This is particularly true
in waste management, water supply, water and waste water
treatment, renewable energy, and other sub-sectors of the
environmental sector. Investments in new water treatment
facilities, for example, can be in excess of several hundred million
dollars. The period for returns on these investments can span
thirty-year or even fifty-year time horizons, posing risks that
are typically too high for private investors. As a result, most
infrastructure investment has required partial or total public
involvement in financing. Access to capital, the costs of capital,
and municipal capital budgeting constrain growth in these
investments.
Regulation
Although regulation is one of the strongest drivers of demand
for environmental goods and services, regulations can also act
as a constraint to growth. Stringent and costly environmental
regulations in Canada (as compared to other countries) may
drive some manufacturers to move their operations elsewhere,
especially if the regulations are harsher as compared to the US
and other industrialized countries. While over-regulation can be
a constraint, lack of regulatory support can also limit growth.
Privatization of Public-Controlled Services
Privatization of some environmental services can help firms
develop the capacity to bid for projects and services and may
further contribute to innovation through private competition.
This is particularly beneficial for small and medium-sized firms.
Over the last decade, there has been a trend toward privatization in
the waste management and electric utility sectors in North America.
The percentage of waste management jobs in the private sector
grew from 71% of all workers in waste management services in
1996 to 77% of workers in 2006 (Table 7).
Privatization in energy utility management, recycling and other
sub-sectors is needed to develop the expertise for Canadian firms to
compete effectively in international markets.
Skilled Labour
Emerging and high growth sectors such as climate change
mitigation and renewable energy, as well as traditional
environmental consulting services have requirements for highly
skilled workers. In addition, eco-innovation, a major growth area
for the environmental sector, is increasing demand for workers with
environmental, scientific, and technical skills across a broad set of
manufacturing and service industries.
In interviews with informed stakeholders, it was felt that access to
workers with the right mix of advanced technical and technology
skills was a constraint to growth for environmental consulting firms.
It was further felt that there is an inadequate level of technical skills
among recent graduates from environmental education programs.
While many of these students possessed a broad understanding of
ecological issues and environmental practices, students graduating
from these programs typically do not possess the requisite scientific
or engineering skills to succeed in environmental consulting
firms. A lack of coordination between training and educational
organizations and employers will constrain growth in the segments
of the environmental sector for which specialized skills are required.
Skilled labour is also likely to be a constraint in more traditional
environmental services such as wastewater treatment. Informants
in this sector noted that the older average age of workers in this
industry, along with future requirements will drive growth in
replacement labour demand.

48

49
RESEARCH OBJECTIVES
ECO Canada has been collecting labour market information
relevant to the environmental sector for over 15 years. Due
to the dispersed and diversified nature of the sector itself, the
majority of available information has had limited applicability as
regional and other modalities are often so substantive that it is
hard to identify common denominators and monitor common
indicators.
Consequently, ECO Canada commissioned this study to obtain
baseline data from a macro and micro level, to help determine
the factors and drivers of change and growth within the
environmental sector, with a special focus on how those changes
impact employment and labour issues. Initial questions that the
study sought to answer included:
• Whoarethemajorplayersintheenvironmentalsector?
• Whatfactorsimpactortriggergrowth?Arethey
interrelated, and if so, how?
• Whatmacro/microlevelindicators(i.e.,social,economic,
and political) should be monitored in terms of their
potential impact on environmental employment?
• Howareidentifiedsocial,economicandotherissues(i.e.,
consumer demand, technology change) impacting the
sector’s many sub-sectors as well as related employment
and labour context?
• Howaremacro/microchangeswithintheenvironmental
sector impacting / impacted by changes in the regulatory
framework?
In the initial stages of the research, it became clear that the
current ECO Canada definition of the environmental sector may
not capture some of the most important recent trends occurring
in the sector. Defining the environmental sector therefore
became an important objective of the study. In particular, the
research team sought to develop a comprehensive definition of
the sector and its subsectors that reflect emerging trends and
new growth areas. It was desired that the definition conform to
international standards to allow for comparisons and it provide
for a framework that allows for long-term measurements of
environmental sub-sectors.
The steps taken in the research were performed in two phases as
follows:
Phase I Research
(1) Preliminary interviews with fourteen key experts in the
sector.
(2) A preliminary literature review on key trends impacting the
sector and its fifteen sub-sectors (using the pre-existing
definition of the sector).
(3) Development of a model for definition of the Canadian
environmental sector for the Environmental Trends Study.
(4) Recommendations for research for Phase II of the study.
Phase II Research
(5) Literature review and review of existing statistics on the
environmental sector (as redefined using the Canadian
Environmental Goods and Services Sector Employment
Model).
(6) Collection of secondary data and statistics on key macro/
micro trends in the environmental sector identified by
experts in Phase I research into a trends database.
(7) A combined literature and secondary data collection and
analysis of major macro drivers affecting growth in the
sector.
(8) Development of the report with key findings of the study.
APPENDIX A:
RESEARCH METHODOLOGY AND DATA SOURCES
50
PHASE I RESEARCH
The key expert interviews were conducted to identify perceptions
of the current and future key growth areas in the environmental
sector. The goal was to identify areas of the environmental
sector that are likely to experience significant changes in labour
demand in the near-term or long-term as a result of economic,
political, consumer market, or other forces. Specifically, the
interviews sought to uncover perceived drivers of demand for
environmental employment and the effects that drivers have on
occupational demand. Interviews were qualitative and designed
to identify any key growth areas that should be explored as
part of this study. The goal was to conduct interviews with
eight to twelve carefully selected respondents with a broad
understanding and knowledge of the environmental sector.
Respondent Profile and Screening Criteria
Respondents were asked to provide insight on the evolution of
the environmental sector and identify the most relevant existing
and emerging key sectors and sub-sectors that will have the
most impact on environmental employment in the future.
A total of fourteen experts participated in the study. ECO Canada
provided a list of eight experts that have very broad knowledge
of and experience in the sector. The list was also augmented
through a highly-selective screening process. Experts
participating in the study had to meet the following criteria:
• Participantswereprofessors,researchers,orother
individuals who study the environmental sector, or
industry experts recommended by ECO Canada who have
a broad understanding of the sector. Participants could
not be educators of environmental workers or experts in
a particular sub-sector—they needed to have high-level
strategic knowledge of changes occurring in the sector.
• Participantshadatleast10yearsofworkexperienceinthe
environmental sector (preference was given to experts with
longer tenure of experience).
• Participantshadabroadandinterdisciplinarybackgroundin
the sector.
PRELIMINARY LITERATURE REVIEW
The goals of the preliminary literature review were:
(1) Identify current perspectives on the definition of the
environmental sector with respect to the industries,
occupations, and skills that define the environmental labour
force.
(2) Identify paradigms used to define the sector that are in use
by industry, educational stakeholders, and others.
(3) Identify current perspectives with regard to changes in the
environmental labour force and emerging sectors within the
environmental sector.
(4) Collect statistics describing employment in the
environmental sector and within sub-sectors.
(5) Identify the recent historical growth of the environmental
sector and sub-sectors
(6) Identify drivers of the environmental sector and sub-sectors.
The goal was to identify areas of the environmental sector that
were likely to experience significant changes in labour demand
in the near-term or long-term as a result of economic, political,
consumer market, or other forces.
The RDA Team completed the following tasks in the initial
preliminary literature review:
(1) Collection and review of an international body of labour
market and demand research on the environmental sector
and sub-sectors.
(2) Collection and review of available statistics on the
environmental labour force in Canada (from Statistics
Canada)
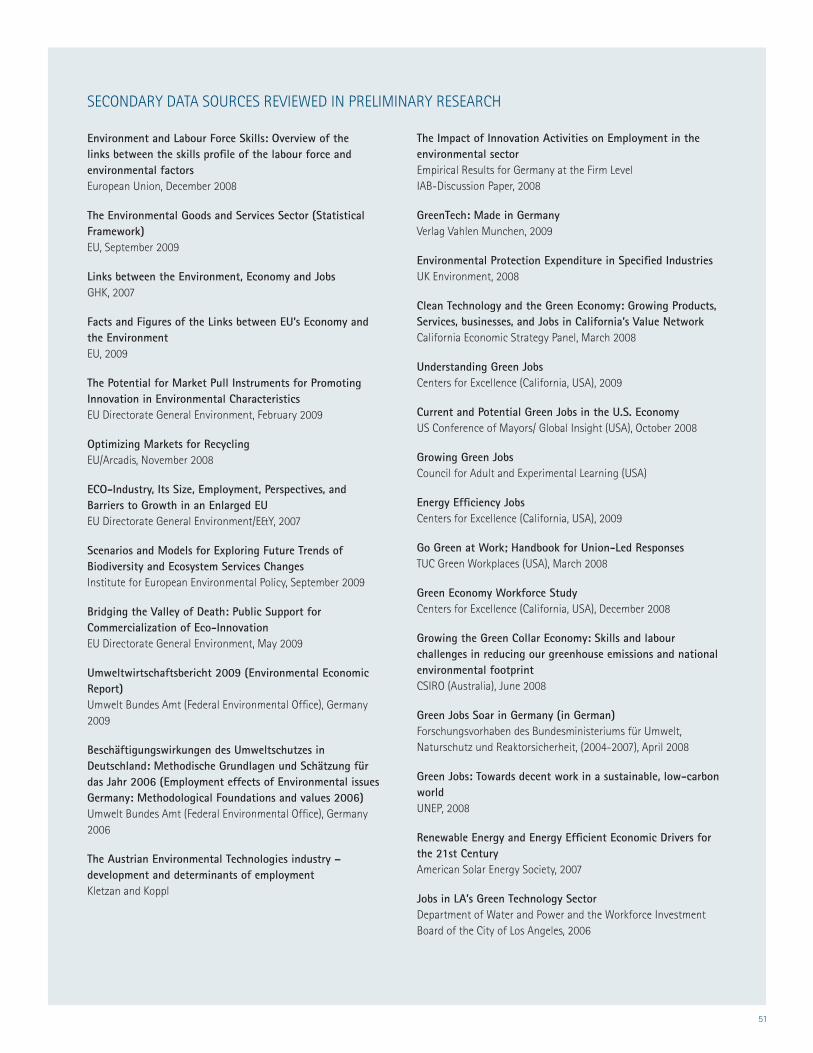
51
Environment and Labour Force Skills: Overview of the links between the skills profile of the labour force and environmental factorsEuropean Union, December 2008 The Environmental Goods and Services Sector (Statistical Framework)EU, September 2009 Links between the Environment, Economy and Jobs GHK, 2007 Facts and Figures of the Links between EU’s Economy and the EnvironmentEU, 2009 The Potential for Market Pull Instruments for Promoting Innovation in Environmental CharacteristicsEU Directorate General Environment, February 2009 Optimizing Markets for RecyclingEU/Arcadis, November 2008 ECO-Industry, Its Size, Employment, Perspectives, and Barriers to Growth in an Enlarged EUEU Directorate General Environment/E&Y, 2007 Scenarios and Models for Exploring Future Trends of Biodiversity and Ecosystem Services ChangesInstitute for European Environmental Policy, September 2009 Bridging the Valley of Death: Public Support for Commercialization of Eco-InnovationEU Directorate General Environment, May 2009 Umweltwirtschaftsbericht 2009 (Environmental Economic Report)Umwelt Bundes Amt (Federal Environmental Office), Germany 2009 Beschäftigungswirkungen des Umweltschutzes in Deutschland: Methodische Grundlagen und Schätzung für das Jahr 2006 (Employment effects of Environmental issues Germany: Methodological Foundations and values 2006)Umwelt Bundes Amt (Federal Environmental Office), Germany 2006 The Austrian Environmental Technologies industry – development and determinants of employmentKletzan and Koppl
The Impact of Innovation Activities on Employment in the environmental sectorEmpirical Results for Germany at the Firm LevelIAB-Discussion Paper, 2008 GreenTech: Made in GermanyVerlag Vahlen Munchen, 2009 Environmental Protection Expenditure in Specified IndustriesUK Environment, 2008 Clean Technology and the Green Economy: Growing Products, Services, businesses, and Jobs in California’s Value NetworkCalifornia Economic Strategy Panel, March 2008 Understanding Green Jobs Centers for Excellence (California, USA), 2009 Current and Potential Green Jobs in the U.S. EconomyUS Conference of Mayors/ Global Insight (USA), October 2008 Growing Green Jobs Council for Adult and Experimental Learning (USA) Energy Efficiency Jobs Centers for Excellence (California, USA), 2009 Go Green at Work; Handbook for Union-Led Responses TUC Green Workplaces (USA), March 2008 Green Economy Workforce StudyCenters for Excellence (California, USA), December 2008 Growing the Green Collar Economy: Skills and labour challenges in reducing our greenhouse emissions and national environmental footprintCSIRO (Australia), June 2008 Green Jobs Soar in Germany (in German)Forschungsvorhaben des Bundesministeriums für Umwelt, Naturschutz und Reaktorsicherheit, (2004-2007), April 2008 Green Jobs: Towards decent work in a sustainable, low-carbon worldUNEP, 2008 Renewable Energy and Energy Efficient Economic Drivers for the 21st CenturyAmerican Solar Energy Society, 2007 Jobs in LA’s Green Technology Sector Department of Water and Power and the Workforce Investment Board of the City of Los Angeles, 2006
SECONDARY DATA SOURCES REVIEWED IN PRELIMINARY RESEARCH
52
OUTCOMES FROM PHASE I
In the first phase of research, the research team identified a set of
key growth trends that are impacting environmental employment
in Canada. These were identified through the key expert interviews
and through an extensive secondary literature review.
In addition, during the first phase, the team developed a
classification system for defining environmental employment
in Canada into a set of measurable categories: the Canadian
Environmental Goods and Services Sector Model (CEGSS). The
model is well-aligned with future data sources that will become
available from Statistics Canada in 2010 from the Survey of
Environmental Goods and Services (currently in the field). Data
collection will be further supported by the implementation of the
North American Product Classification System (NAPCS) reporting
structure which will be in place by 2012. Statistics Canada will
begin to produce statistics by the type of products and services
that firms sell, which will provide insight into environmental
products and services sales in Canada.
PHASE II RESEARCH
In the second phase, the research team developed a report and
database of trend data that explores the key environmental
employment trends identified in Phase I, using the CEGSS as a
framework for defining, measuring, and exploring the sector.
The report was developed to compile data on the macro drivers
affecting environmental spending and environmental employment,
discuss the major players in the environmental sector, discuss
factors that are impacting growth in the sector, and identify major
emerging trends. At a micro level--within each subsector—a
separate report was designed to identify the drivers that are
affecting growth in the subsector, on a global scale and in Canada.
Where available, the research team collected employment
measurements and proxy data that describe the size and growth
of environmental employment. Because of the lack of data
on many of the subsectors, it was decided that the research
team should stop short of deriving indirect estimates for
environmental employment where no direct measurements exist.
The report gives context to the dynamics that are influencing the
environmental sector and environmental employment, describing
the size and growth of subsectors, highlighting the high-growth
areas, and discussing emerging trends and their potential impact
on environmental employment.
METHODOLOGY FOR DEVELOPMENT OF THE REPORT
The composition of the report involved the following
methodologies:
(1) Secondary Literature Review: Observations made in related
primary and secondary research were summarized to provide
context, analysis, commentary, and key findings of related
research. The literature review includes information reviewed
in Phase I and additional review on sub-topics as necessary.
(2) Secondary Data Collection: Secondary time series data was
collected that illustrates certain trends or further supports
and explains the subject.
(3) Secondary Data Analysis: The analysis of secondary data
typically involved identifying causal relationships using
mathematic, statistical, or econometric techniques.
(4) Key Expert Interviews: The text of the interviews completed in
Phase I was referenced.
(5) As-Needed Interviews: Domain experts were contacted to
collect specific information or data as required.
REPORT CHAPTER RESEARCH METHODS
Executive summary (Summarization from the Body of the Report)
Defining environmental employment Secondary literature review
Key emerging trends Key expert interviews, As-needed interviews, Secondary data collection,
Secondary data analysis
Drivers of employment in environmental sub-sectors Secondary data collection, Secondary data analysis, As-needed
interviews, Key expert interviews
Drivers of growth in Canada’s environmental sector Secondary literature review, Secondary data collection, Secondary
data analysis
Constraints to growth of the Canadian environmental sector Secondary literature review, Key expert interviews
Global trends Secondary literature review, Secondary data collection,
Secondary data analysis
53
World Bank. Carbon Finance Annual Report. World Bank website
2009
Statistics Canada. Labour force survey, 2009 [computer file]. Ottawa,
Ont.: Statistics Canada [producer]; Statistics Canada. 2009-12
Statistics Canada. Survey of Employment, Payroll, and Hours (SEPH),
2009 [computer file]. Ottawa, Ont.: Statistics Canada [producer];
Statistics Canada. 2009-12
Eurostat, OECD. The Environmental Goods and Services Industry
Handbook. Last accessed February 2010 at http://epp.eurostat.
ec.europa.eu/cache/ITY_OFFPUB/KS-RA-09-012/EN/KS-RA-09-012-
EN.PDF
Eurostat. SERIEE Manual: European System for the Collection of
Economic Data on the Environment (2008)
Eurostat, OECD. The environmental goods and services industry: a
manual for data collection and analysis. (1999)
Orok (2003) Working Paper ISBN: 0-662-36570-4: “Measuring
Employment in the Environmental Industry”
Sinclair-Desgagne (2008). HEC Montreal. Last accessed February
2010 at: http://www.uclouvain.be/cps/ucl/doc/core/documents/
sinclair2.pdf
Environmental Business International (EBI) [special data
aggregation]
Environmental Technologies Development Organization (ETDC)
Business Enterprise and Regulatory Reform (BERR) UK (2009). Low
Carbon and Environmental Goods and Services: an industry analysis
German Institute for Economic Research (DIW Berlin) (September
2009).
Eco-Industry’s Export Potential. Last Accessed February 2010 at
http://ec.europa.eu/environment/enveco/jobs/index.htm
European Union Directorate General Environment (1999) The EU
Bijit, Bora and R. The (2004), Tariffs and Trade in Environmental
Goods, presentation to the WTO Workshop on Environmental
Goods, Geneva. Last Accessed February 2010 at http://www.oecd.
org/dataoecd/63/15/35415839.pdf
US Congressional Research Office, Senator Wyden, (December
2009). Major Opportunities and Challenges to US Exports of
Environmental Goods. Last accessed February 2010 at http://
wyden.senate.gov/newsroom/120809jw_enviro_goods_report.pdf
European Union Directorate General Environment, 2009.
Competitiveness of the EU Eco-Industries. Last accessed February
2010 at: http://ec.europa.eu/environment/enveco/eco_industry/
pdf/report%20_2009_competitiveness_part1.pdf
Federal Ministry for the Environment, Nature Conservation and
Nuclear Safety, Germany, 2009
Umweltwirtschaftsbericht 2009 (Environmental Industry Report
2009)
“Overview of Canada’s Aerospace Industry” Last accessed February
2010 at
http://www.wrcoc-aic.org/Archive/Briefings/09Briefings/April09.pdf
Pharmahorizons. Pharmaceutical Industry Profile. Last accessed
February 2010 at
http://www.pharmahorizons.com/index.php/resources/canadian-
life-sciences-overview/
Environment Canada. Last accessed February 2010 at
http://www.ec.gc.ca/default.asp?lang=En&n=ECBC00D9-1
Statistics Canada, 2006, 2004, 2002, 2000, 1999, 1998, 1997, 1996,
1995 Survey of Environmental Expenditures in the Business Sector,
Statistics Canada 1995-2006
CleanTech, 2008. Cleantech Made in Germany 2.0 Last accessed
February, 2010 at
http://cleantech.com/about/pressreleases/010609.cfm
APPENDIX B:
SOURCES CITED
54
Environmental Protection Agency (USA) 2001. Cost Effectiveness
and Environmental Effects of Incentive Systems; Last Accessed
February 2010 at http://yosemite.epa.gov/ee/epa/eermfile.nsf/
vwAN/EE-0216B-04.pdf/$File/EE-0216B-04.pdf
Osler. “Doing Business in Canada Environmental Legal Guide” last
accessed at February 2010 at http://www.osler.com/resources.
aspx?id=8745
Mannheim Innovation Panel (MIP, 2003) [special data aggregation]
Mannheim Innovation Panel Survey 2005; UMFIS database,
Calculations by the ZEW.
Gallop USA (1984-2006) Mulitple surveys
Google Trends, last accessed February 2010 at http://www.google.
com/trends
Environics, 2008 “The Climate Change Challenge: What Canadians
Expect from their Governments” Presentation made to IPAC
Conference on Climate Change and Canadian Public Policy,
October 28, 2008
Ontario’s Standard Offer Program, 2009. Last accessed February
2010 at:
http://www.powerauthority.on.ca/Page.
asp?PageID=122&ContentID=6858
Statistics Canada 1996, 1998, 2000, 2002, 2004, 2006. Waste
Management Industry Survey: Business and Government Sectors,
Statistics Canada 1996-2006.
ECO Securities Survey 2008, ECO Securities
CIEEDAC Renewables Database, 2009. Last accessed February 2010
at:
http://www.cieedac.sfu.ca/CIEEDACweb/pubarticles/Reports%20
on%20Other%20Data/Renewable%20Energy%20Database%20
Final.pdf
Canadian Solar Industries Association, 2009. Labour Force Study.
Last accessed February 2010 at http://www.cansia.ca/market-
intelligence/market-research/labour-force-market
Environmental Protection Agency, 2009. Alternatives to Traditional
Transportation Fuels [computer file]
Natural Resources Canada, 2007. From Impacts to Adaptation:
Canada in a Changing Climate
OECD Stan Database, 2009. R&D Expenditures on Electricity, Gas &
Water Supply, by Country [computer file]
Statistics Canada, 2009. Research and Development Professionals
[computer file], CANSIM Table 358-0024
ISO.org 2008, 2007, 2006, 2005, The ISO Survey. Last accessed
February 2010 at:
http://www.iso.org/iso/iso_catalogue/management_standards/
certification/survey2008.pdf
Statistics Canada 1996, 2001, 2006. Census of Canada 1996, 2001,
2006
Statistics Canada, 2006. Census of Agriculture 2006: Sustainable
Development on Agricultural Land
Natural Resources Canada, Canmet Energy Survey of Active Solar
Thermal Collectors
Canadian Wind Energy Association (CANWEA), 2007. Global Wind
Energy Report 2007
Statistics Canada 2001, 2008. Canadian Vehicle Survey
Statistics Canada 1998, 1999, 2000, 2002, 2004. Environmental
Industry Survey. Statistics Canada
Federal Contaminated Sites Action Plan, 2009. Annual Report of
Spending on Federal Contaminated Sites. Last accessed February
2010 at http://www.federalcontaminatedsites.gc.ca
Statistics Canada 2009. Statistics Canada PSIS Database [computer
file] Special data aggregation prepared by request.

55
This project was funded by the Government of Canada’s Sector Council Program.
The opinions and interpretations in this publication are the author’s and do not necessarily
reflect those held by the Government of Canada.
Copyright © 2010 ECO Canada
All rights reserved. The use of any part of this publication, whether it is reproduced, stored in a retrieval
system, or transmitted in any form or means (including electronic, mechanical, photographic, photocopying
or recording), without the prior written permission of ECO Canada is an infringement of copyright law.
ECO Canada (2010). Canadian Environmental Sector Trends
Environmental Careers Organization of Canada.
56
Funded by the Government of Canada’s Sector Council Program
Suite 200, 308 - 11th Avenue S.E., Calgary, Alberta, Canada T2G 0Y2
Telephone: (403) 233-0748 Fax: (403) 269-9544
www.eco.ca


