The survival rate for childhood cancer has increased from 1970 to the present, with 5-year survival rates now approaching 80% (1). Coincident with this survivorship has been the recognition that survivors are at risk for subsequent neoplasms (2–15).
In this article, we analyzed the cumulative incidence patterns of subsequent neoplasms and risk factors related to the host, the disease, and the treatment among initial 5-year survivors in the Childhood Cancer Survivor Study (CCSS). Survivors had a mean of 22.7 years of follow-up and a median of 22.9 years (range = 5.0–36.7 years) of follow-up since their childhood cancer diagnosis. Among survivors who were found at the last contact to have died, the mean duration of follow-up was 10.6 years (median = 8.8 years, range = 5.0–33.1 years); among those still alive, the mean follow-up time was 23.8 years (median = 23.6 years, range = 7.0–36.7 years).
In 2001, we reported (3) 314 subsequent malignant neo-plasms in 298 survivors in this cohort and subsequently have reported (5,6,9–11,13,14) on specific risk groups for subsequent neoplasms, including a recent review of previously reported data (15). However, incidence and the spectrum of and risk factors for subsequent neoplasms have clearly changed with ongoing follow-up in the CCSS, for which the mean follow-up of the cohort now exceeds 20 years after childhood cancer diagnosis.
The occurrence of subsequent neoplasms has direct impact on the quantity and quality of life in cancer survivors. We have ex-panded our analyses of subsequent neoplasms in the CCSS to better understand incidence of and risk factors for these events as the survivor population ages.
Article
Subsequent Neoplasms in 5-Year Survivors of childhood cancer: the childhood cancer Survivor StudyDebra L. Friedman, John Whitton, Wendy Leisenring, Ann C. Mertens, Sue Hammond, Marilyn Stovall, Sarah S. Donaldson, Anna T. Meadows, Leslie L. Robison, Joseph P. Neglia
Manuscript received August 2, 2009; revised May 24, 2010; accepted May 25, 2010.
Correspondence to: Debra L. Friedman, MD, MS, Department of Pediatrics, Vanderbilt University School of Medicine and Vanderbilt-Ingram Cancer Center, 397 Preston Research Building, 2220 Pierce Ave, Nashville, TN 37232 (e-mail: [email protected]).
Background The occurrence of subsequent neoplasms has direct impact on the quantity and quality of life in cancer survi-vors. We have expanded our analysis of these events in the Childhood Cancer Survivor Study (CCSS) to better understand the occurrence of these events as the survivor population ages.
Methods The incidence of and risk for subsequent neoplasms occurring 5 years or more after the childhood cancer diag-nosis were determined among 14 359 5-year survivors in the CCSS who were treated from 1970 through 1986 and who were at a median age of 30 years (range = 5–56 years) for this analysis. At 30 years after childhood cancer diagnosis, we calculated cumulative incidence at 30 years of subsequent neoplasms and calculated stan-dardized incidence ratios (SIRs), excess absolute risks (EARs) for invasive second malignant neoplasms, and relative risks for subsequent neoplasms by use of multivariable Poisson regression.
Results Among 14 359 5-year survivors, 1402 subsequently developed 2703 neoplasms. Cumulative incidence at 30 years after the childhood cancer diagnosis was 20.5% (95% confidence interval [CI] = 19.1% to 21.8%) for all subsequent neoplasms, 7.9% (95% CI = 7.2% to 8.5%) for second malignant neoplasms (excluding nonmela-noma skin cancer), 9.1% (95% CI = 8.1% to 10.1%) for nonmelanoma skin cancer, and 3.1% (95% CI = 2.5% to 3.8%) for meningioma. Excess risk was evident for all primary diagnoses (EAR = 2.6 per 1000 person-years, 95% CI = 2.4 to 2.9 per 1000 person-years; SIR = 6.0, 95% CI = 5.5 to 6.4), with the highest being for Hodgkin lym-phoma (SIR = 8.7, 95% CI = 7.7 to 9.8) and Ewing sarcoma (SIR = 8.5, 95% CI = 6.2 to 11.7). In the Poisson mul-tivariable analysis, female sex, older age at diagnosis, earlier treatment era, diagnosis of Hodgkin lymphoma, and treatment with radiation therapy were associated with increased risk of subsequent neoplasm.
Conclusions As childhood cancer survivors progress through adulthood, risk of subsequent neoplasms increases. Patients surviving Hodgkin lymphoma are at greatest risk. There is no evidence of risk reduction with increasing dura-tion of follow-up.
Participants and MethodsThe CCSS CohortThe CCSS is a well-characterized cohort of survivors of childhood cancer that was constructed to evaluate hypotheses related to the long-term health outcomes of this unique population (www.stjude.org/ccss) (16,17). Eligibility included treatment at one of the collaborating institutions (Supplementary Table 1, available online) between January 1, 1970, and December 31, 1986, for leukemia, Hodgkin lymphoma, non-Hodgkin lym-phoma, neuroblastoma, soft tissue sarcoma, bone cancer, central nervous system malignancy, or kidney cancer that was diagnosed when the survivor was younger than 21 years and survival for at least 5 years after diagnosis. The human subjects committee at each institution approved the protocol, and informed consent was obtained.
There were 20 626 survivors eligible for the CCSS, of whom 3058 could not be located and 3205 refused to participate, result-ing in a cohort of 14 363 survivors. Patients who survived for at least 5 years and subsequently died were included in the cohort. This analysis was further limited to confirmed subsequent neo-plasms that occurred among the 14 359 cohort members, with a median age of 30 years (range = 5–56 years), for whom complete medical records were available.
Cancer Treatment InformationTherapeutic exposures were ascertained through abstraction of medical and radiation therapy records of each participant by use of a standardized protocol (16,17). This abstraction included diagno-sis, chemotherapy, radiation therapy, and surgical treatments.
Definition and Ascertainment of Subsequent NeoplasmsSubsequent neoplasms included the following three subsets that were exclusive of one another: 1) subsequent malignant neoplasms, which include only malignant diagnoses within the United States Surveillance, Epidemiology, and End Results (SEER) with an International Classification of Diseases for Oncology behavior code of 3, excluding nonmelanoma skin cancers; 2) nonmalignant meningioma; and 3) nonmelanoma skin cancers. All subsequent neoplasms were initially ascertained through self- or proxy report in questionnaires and/or death certificate. Subsequent neoplasms were then confirmed by pathology report or, when not available, confirmed by other medical records reviewed by study investiga-tors. Because the CCSS is a cohort of 5-year survivors, only subse-quent neoplasms occurring 5 years or more after the childhood cancer diagnosis were included in this analysis.
Statistical AnalysisCumulative incidence estimates of subsequent neoplasms were calculated by use of time from 5 years after childhood cancer diag-nosis to first occurrence of subsequent neoplasm, treating death as a competing risk event and censoring at the date of last contact (18). Standard errors of cumulative incidence estimates were calcu-lated and used to evaluate 95% confidence intervals (CIs) (19).
Risks for second malignant neoplasms were calculated by use of standardized incidence ratios (SIRs) and excess absolute risk (EAR) per 1000 person-years. Nonmalignant meningiomas and nonmela-noma skin cancers were not included in standardized incidence ratio or excess absolute risk calculations because they are not ascer-tained by SEER. Standardized incidence ratios of observed to expected malignancies were calculated by use of age-, sex-, and race-specific rates from SEER for the expected numbers of malig-nancies (20). All subsequent malignant neoplasms were counted in the numerator of standardized incidence ratios. Excess absolute risk was determined by subtracting the expected number of malig-nancies from the observed number, dividing the difference by the person-years of follow-up, and multiplying by 1000. Person-years of follow-up were calculated as the minimum time to subsequent malignancy, death, or last contact.
Relative risks (RRs) of developing subsequent neoplasm, second malignant neoplasm, meningioma, and nonmelanoma skin cancer were estimated for each host characteristic and therapeutic expo-sure by use of four Poisson multivariable regression models with age as the timescale (21,22). Risk factors that were identified a priori and used in the 2001 report (3) from the CCSS were in-cluded in the multivariable models. The primary focus was on treatment variables, and so the multivariable model included sex, age (in 5-year age groups), treatment era (1970–1974, 1975–1979, and 1980–1986), primary cancer diagnosis (as described above in CCSS cohort description), radiation exposure (yes or no), splenec-tomy (yes or no), and chemotherapeutic exposures (alkylating agents, anthracyclines, epipodophyllotoxins, or platinum agents) as
cONteXt AND cAVeAtS
Prior knowledgeSurvivors of childhood cancers are at increased risk for subsequent neoplasms.
Study designThe incidence of subsequent neoplasms between 5 and 30 years after a diagnosis of childhood cancer was determined in a cohort of childhood cancer survivors whose median age at this analysis was 30 years. The cumulative incidence at 30 years of subsequent neoplasms and risk for subsequent neoplasms were calculated.
ContributionCumulative incidence at 30 years after the childhood cancer diag-nosis was high for all subsequent neoplasms, especially for second malignant neoplasms, nonmelanoma skin cancer, and menin-gioma. Excess risk was observed for all primary diagnoses, the highest being for Hodgkin lymphoma and Ewing sarcoma. Factors associated with risk of subsequent neoplasms were female sex, older age at diagnosis, earlier treatment era, diagnosis of Hodgkin lymphoma, and treatment with radiation therapy. Risk did not appear to decrease with increasing follow-up time.
ImplicationsSurvivors of childhood cancers continue to be at increased risk of subsequent cancers. This risk is expected to increase as they age.
LimitationsDetails about radiation therapy dosimetry were not calculated for all participants. Nontherapeutic exposures (such as tobacco, alcohol, and diet) were not available for analysis. Data on subsequent neoplasms were initially obtained by self-report, but subsequently verified.
From the Editors
jnci.oxfordjournals.org JNCI | Articles 1085
categorical dose scores (0, 1, 2, or 3). These scores were deter-mined as follows: for each individual agent, the tertiles of the cu-mulative dose (0, 1, 2, or 3, with 0 indicating that the patient did not receive the agent) were determined. The tertiles were then summed for all of the agents within each of the four categories (alkylating agents, anthracyclines, epipodophyllotoxins, and/or platinum agents). Tertiles of these summed scores were then used in the regression model (23). For analysis of risk conferred by pri-mary cancer diagnosis, leukemia was chosen as the referent group because it is the most common primary cancer in the CCSS cohort. Treatment era cutoffs were chosen to be approximately the same length of time and reflected periods in which therapeutic exposures changed but then remained relatively stable over the defined interval. All statistical tests were two-sided.
resultsCharacteristics of the Cohort and of Subsequent NeoplasmsAmong the 14 359 CCSS survivors with 325 119 person-years of follow-up, 1402 had at least one subsequent neoplasm and a total of 2703 subsequent neoplasms had been reported. There were 802 second malignant neoplasms, 159 nonmalignant meningiomas (plus 11 malignant meningiomas that were included in the 802 second malignant neoplasms), 168 other benign or in situ neo-plasms, and 1574 nonmelanoma skin cancers. Among the 1402 survivors with a subsequent neoplasm, 732 had subsequent malig-nant neoplasm, of whom 621 had subsequent malignant neoplasm only and 111 also had nonmelanoma skin cancer, nonmalignant meningioma, and/or another benign or nonmalignant condition. Among the 670 survivors with no subsequent malignant neoplasm, 460 had nonmelanoma skin cancer (40 of whom also had nonma-lignant meningioma and/or another benign or nonmalignant con-dition) and 210 had neither subsequent malignant neoplasm nor nonmelanoma skin cancer. Sixty-seven of the 732 survivors with a subsequent malignant neoplasm had more than one subsequent malignant neoplasm.
The characteristics of the cohort with comparisons of survi-vors with and without subsequent neoplasms are shown in Table 1. In the overall CCSS cohort, a larger proportion of subsequent neoplasms occurred among women, those who were older at childhood cancer diagnosis, those who were treated with radia-tion therapy, and those who were treated for Hodgkin lym-phoma. A larger portion of survivors with subsequent neoplasms were also deceased at the time of the analysis, compared with those survivors who had not developed a subsequent neoplasm (Table 1).
The most frequent subsequent malignancies were nonmelanoma skin cancer (n = 1574) and breast cancer (n = 252). Associations between primary and secondary and subsequent neoplasms are shown in Table 2. There were 1402 second neoplasms and 1301 third or subsequent neoplasms in the cohort, with the greatest number occurring among survivors of Hodgkin lymphoma. Tumors of the central nervous system occurred most often after a primary diagnosis of a central nervous tumor or acute lymphoblastic leukemia. Second and subsequent solid organ and skin cancers most commonly followed a primary diagnosis of Hodgkin lymphoma.
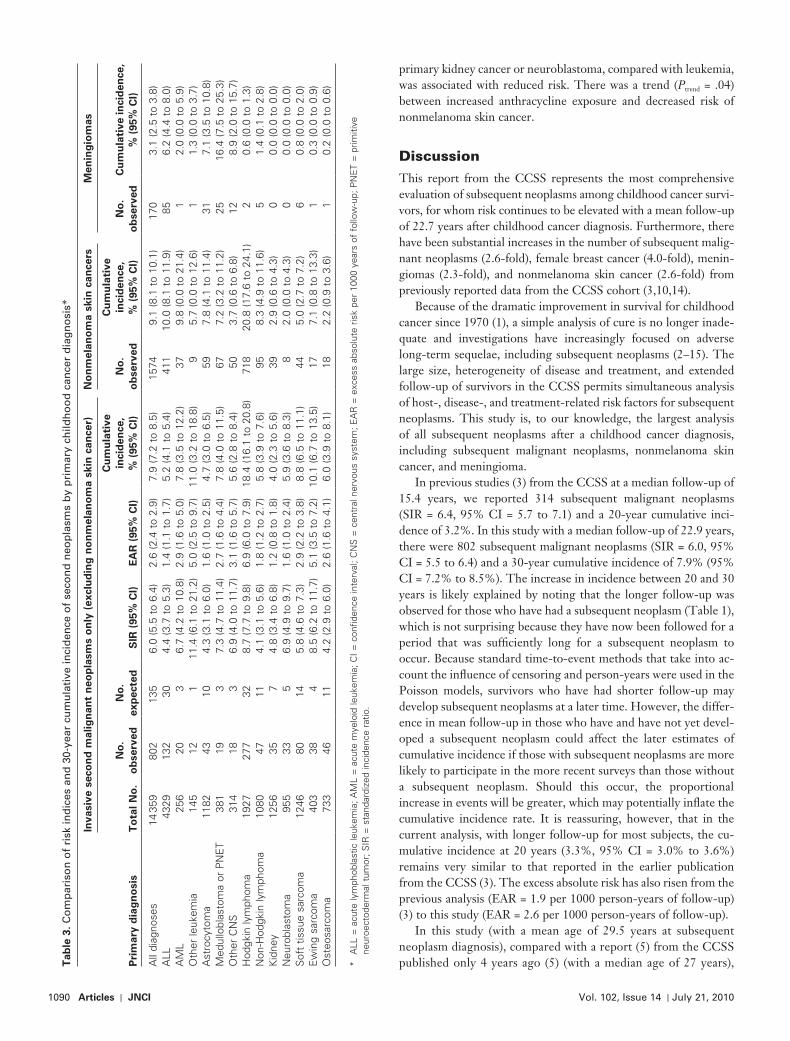
Cumulative Incidence of Subsequent NeoplasmsCumulative incidence at 30 years after childhood cancer diagnosis was 20.5% (95% CI = 19.1% to 21.8%) for all first of the sub-sequent neoplasms and was higher for patients treated with radia-tion therapy for their primary cancer than for those not receiving radiation therapy. The 30-year cumulative incidence by subse-quent neoplasm subtype was 7.9% (95% CI = 7.2% to 8.5%) for second malignant neoplasms, excluding nonmelanoma skin can-cer, 9.1% (95% CI = 8.1% to 10.1%) for nonmelanoma skin cancer, and 3.1% (95% CI = 2.5% to 3.8%) for meningiomas (Figure 1). The 30-year cumulative incidence for the first of the subsequent neoplasms by primary cancer diagnosis was 18.4% (95% CI = 16.1% to 20.8%) for Hodgkin lymphoma, 8.8% (95% CI = 6.5% to 11.1%) for soft tissue sarcoma, 6.0% (95% CI = 3.9% to 8.1%) for osteosarcoma, 10.1% (95% CI = 6.7% to 13.5%) for Ewing sarcoma, 5.9% (95% CI = 3.6% to 8.3%) for neuroblastoma, 5.8% (95% CI = 3.9% to 7.6%) for non-Hodgkin lymphoma, 5.6% (95% CI = 4.5% to 6.7%) for leukemia, 7.8% (95% CI = 4.0% to 11.5%) for medulloblastoma, 4.7% (95% CI = 3.0% to 6.5%) for astrocytoma, and 4.0% (95% CI = 2.3% to 5.6%) for kidney cancer (Figure 2). Survivors of Hodgkin lym-phoma had the highest cumulative incidence of subsequent malig-nant neoplasms (18.4%, 95% CI = 16.1% to 20.8%) and nonmelanoma skin cancers (20.8%, 95% CI = 17.6% to 24.1%). The highest cumulative incidence of meningioma occurred among survivors of medulloblastoma (16.4%, 95% CI = 7.5% to 25.3%) (Table 3).
The 30-year cumulative incidence for selected subsequent cancers was 5.0% (95% CI = 4.2% to 5.9%) for female breast cancer, 0.4% (95% CI = 0.2% to 0.5%) for bone cancer, 0.9% (95% CI = 0.6% to 1.1%) for soft tissue sarcoma, 0.3% (95% CI = 0.2% to 0.4%) for leukemia, 0.4% (95% CI = 0.3% to 0.6%) for lymphoma, 0.7% (95% CI = 0.5% to 0.8%) for central nervous system tumor, 0.3% (95% CI = 0.2% to 0.5%) for head and neck cancer, 0.4% (95% CI = 0.2% to 0.6%) for small intes-tine and colorectal cancer, 0.1% (95% CI = 0.0% to 0.2%) for lung cancer, and 1.4% (95% CI = 1.1% to 1.6%) for thyroid cancer (data not shown).
Risk of Subsequent Malignant Neoplasms Compared With That in the General PopulationIncreased risk for a subsequent malignant neoplasm occurring at least 5 years after the childhood cancer diagnosis was found (SIR = 6.0, 95% CI = 5.5 to 6.4). Excess risk was evident for all primary diagnoses and was highest for Hodgkin lymphoma (SIR = 8.7, 95% CI = 7.7 to 9.8) and Ewing sarcoma (SIR = 8.5, 95% CI = 6.2 to 11.7). Increased excess absolute risk for subsequent malignant neoplasms per 1000 person-years was also found (EAR = 2.6, 95% CI = 2.4 to 2.9) and was highest for survivors of Hodgkin lymphoma (EAR = 6.9, 95% CI = 6.0 to 7.9) and Ewing sarcoma (EAR = 5.1, 95% CI = 3.5 to 7.2) (Table 3).
Among subsequent malignant neoplasms occurring 5 years or more after childhood cancer, risk was elevated for subsequent he-matopoietic, central nervous system, and solid organ cancers. Of particular note is the increased risk of solid organ malignancies that typically occur in older adults, such as head and neck tumors (SIR = 10.8, 95% CI = 7.8 to 15.0), small intestine and colorectal
cancer (SIR = 4.6, 95% CI = 3.2 to 6.8), and cancer of lung and bronchus (SIR = 3.4, 95% CI = 1.9 to 6.1) and of the female genital tract (SIR = 2.1, 95% CI = 1.4 to 3.2). The highest risks were observed for subsequent bone cancer (SIR = 19.0, 95% CI = 14.2 to 25.5), thyroid cancer (SIR = 10.9, 95% CI = 9.1 to 12.9), head and neck cancer (SIR = 10.8, 95% CI = 7.8 to 15.0), breast cancer (SIR = 9.8, 95% CI = 8.4 to 11.5), central nervous system malig-nancies (SIR = 10.4, 95% CI = 8.3 to 13.1), and soft tissue sarcoma (SIR = 8.1, 95% CI = 6.4 to 10.2) (Table 4).
Latency for Subsequent Malignant NeoplasmsThe median time to first occurrence of subsequent malignant neoplasms was 17.8 years (range = 5.0–35.2 years). Median la-tency between primary childhood cancer diagnosis and second
malignancy was shortest for leukemia (8.9 years, range = 5.0–31.1 years) and longest for small intestine and colorectal cancers (23.1 years, range = 7.0–29.4 years). Among those with a subsequent diagnosis of central nervous system tumors, malig-nant meningiomas occurred at much later time point (median = 22.9 years, range = 15.8–32.7 years) than glial tumors or medul-loblastoma (for glial tumors, median = 11.7 years, range = 6.0–25.5 years; and for medulloblastoma, median = 11.6 years, range = 8.0–14.6 years). Among those with subsequent hemato-poietic cancers, the latency between primary and secondary diagnosis was much shorter for a secondary diagnosis of leuke-mia (median = 8.9 years, range = 5.0–31.1 years) than for a secondary diagnosis of lymphoma (median = 18.5 years, range = 6.9–31.5 years) (Table 4).
Table 1. Characteristics of the Childhood Cancer Survivor Study cohort*
Mean years of follow-up (SD) 22.7 (6.8) 22.4 (6.8) 25.5 (6.7) <.001
* All statistical tests were two-sided. We use t tests for comparison of data with continuous variables and x2 tests for dichotomous data. CNS = central nervous system; SD = standard deviation.
Figure 1. Cumulative incidence of sec-ond neoplasms (SNs) at 30 years after initial cancer diagnosis. A) All SNs. Cumulative incidence of any SN, non-melanoma skin cancer (NMSC), second malignant neoplasm (SMN), and me-ningioma is shown. B) All SNs stratified by radiation therapy (RT) treatment or no RT.
was statistically significantly decreased by a diagnosis of kidney cancer. Compared with those survivors treated for their child-hood cancer in 1970–1974, risk of subsequent neoplasms was lower in those treated for their childhood cancer in 1975–1979 and 1980–1986. There was a high degree of association between treatment era and length of follow-up (however, no one in the more recent era has a longer follow-up than those in the earlier treatment era), and it is, therefore, difficult to separate these two possible sources of risk.
Risk factors differed somewhat by subtype of subsequent malig-nant neoplasm. Younger age at time of childhood cancer diagnosis was associated with increased risk for subsequent central nervous system tumors, thyroid cancer, and soft tissue and bone sarcoma, whereas older age was associated with increased risk for breast
Risk Factor Analyses for Subsequent NeoplasmsFour multivariable Poisson regression analyses were performed to assess host-, disease-, and treatment-related risk factors for all subsequent neoplasms, subsequent malignant neoplasms, menin-gioma, and nonmelanoma skin cancer (Table 5). When assessing risk associated with primary cancer diagnosis, leukemia survivors were the largest survivor group in the cohort and thus served as the referent population.
Risk of any subsequent neoplasm was increased by female sex (RR = 1.5, 95% CI = 1.3 to 1.5), older age at primary childhood cancer diagnosis (RR = 1.3 for age ≥15 years, 95% CI = 1.1 to 1.6), radiation therapy exposure (RR = 2.7, 95% CI = 2.2 to 3.3), and primary diagnosis of Hodgkin lymphoma (RR = 1.5, 95% CI = 1.1 to 1.9). Compared with that of leukemia survivors, risk
jnci.oxfordjournals.org JNCI | Articles 1089
bone sarcomas. Subsequent bone cancer risk was associated with primary diagnosis of kidney cancer and of soft tissue and bone sarcomas (compared with that of leukemia) and with increased dose of alkylating agents. Meningioma risk was increased by female sex, younger age at primary diagnosis, radiation therapy exposure, and treatment for central nervous system tumors. Risk of nonmelanoma skin cancer was increased by older age at primary diagnosis and exposure to radiation therapy. Treatment for
Figure 2. Cumulative incidence of second neoplasms (SNs) at 30 years after initial cancer diagnosis by childhood cancer diagnosis. Cumulative incidence of Hodgkin lymphoma (Hodgkins), non-Hodgkin lymphoma (NHL), neuroblastoma (NBL), central nervous system malignancies (all CNS), medulloblastoma or primitive neuroectodermal tumor (medullo/PNET), astrocytoma, Wilms tumor, all bone cancers, osteosarcoma (osteo), Ewing sarcoma (Ewings), and soft tissue sarcoma (STS) are shown.
cancer. Radiation therapy exposure was associated with increased risk for subsequent central nervous system tumors, soft tissue and bone sarcomas, and thyroid cancer. Risk of breast cancer was asso-ciated with a primary cancer diagnosis of Hodgkin lymphoma or neuroblastoma (compared with a primary diagnosis of leukemia) and with increasing anthracycline dose. Risk of soft tissue sarcoma was associated with primary diagnoses of central nervous system tumors, Hodgkin lymphoma, Wilms tumor, and soft tissue and
primary kidney cancer or neuroblastoma, compared with leukemia, was associated with reduced risk. There was a trend (Ptrend = .04) between increased anthracycline exposure and decreased risk of nonmelanoma skin cancer.
DiscussionThis report from the CCSS represents the most comprehensive evaluation of subsequent neoplasms among childhood cancer survi-vors, for whom risk continues to be elevated with a mean follow-up of 22.7 years after childhood cancer diagnosis. Furthermore, there have been substantial increases in the number of subsequent malig-nant neoplasms (2.6-fold), female breast cancer (4.0-fold), menin-giomas (2.3-fold), and nonmelanoma skin cancer (2.6-fold) from previously reported data from the CCSS cohort (3,10,14).
Because of the dramatic improvement in survival for childhood cancer since 1970 (1), a simple analysis of cure is no longer inade-quate and investigations have increasingly focused on adverse long-term sequelae, including subsequent neoplasms (2–15). The large size, heterogeneity of disease and treatment, and extended follow-up of survivors in the CCSS permits simultaneous analysis of host-, disease-, and treatment-related risk factors for subsequent neoplasms. This study is, to our knowledge, the largest analysis of all subsequent neoplasms after a childhood cancer diagnosis, including subsequent malignant neoplasms, nonmelanoma skin cancer, and meningioma.
In previous studies (3) from the CCSS at a median follow-up of 15.4 years, we reported 314 subsequent malignant neoplasms (SIR = 6.4, 95% CI = 5.7 to 7.1) and a 20-year cumulative inci-dence of 3.2%. In this study with a median follow-up of 22.9 years, there were 802 subsequent malignant neoplasms (SIR = 6.0, 95% CI = 5.5 to 6.4) and a 30-year cumulative incidence of 7.9% (95% CI = 7.2% to 8.5%). The increase in incidence between 20 and 30 years is likely explained by noting that the longer follow-up was observed for those who have had a subsequent neoplasm (Table 1), which is not surprising because they have now been followed for a period that was sufficiently long for a subsequent neoplasm to occur. Because standard time-to-event methods that take into ac-count the influence of censoring and person-years were used in the Poisson models, survivors who have had shorter follow-up may develop subsequent neoplasms at a later time. However, the differ-ence in mean follow-up in those who have and have not yet devel-oped a subsequent neoplasm could affect the later estimates of cumulative incidence if those with subsequent neoplasms are more likely to participate in the more recent surveys than those without a subsequent neoplasm. Should this occur, the proportional increase in events will be greater, which may potentially inflate the cumulative incidence rate. It is reassuring, however, that in the current analysis, with longer follow-up for most subjects, the cu-mulative incidence at 20 years (3.3%, 95% CI = 3.0% to 3.6%) remains very similar to that reported in the earlier publication from the CCSS (3). The excess absolute risk has also risen from the previous analysis (EAR = 1.9 per 1000 person-years of follow-up) (3) to this study (EAR = 2.6 per 1000 person-years of follow-up).
In this study (with a mean age of 29.5 years at subsequent neoplasm diagnosis), compared with a report (5) from the CCSS published only 4 years ago (5) (with a median age of 27 years),
jnci.oxfordjournals.org JNCI | Articles 1091
more survivors (99 vs 71 survivors in the previous report) devel-oped subsequent cancers that are more typical of cancers that develop in older adults, including cancers of the head and neck, gastrointestinal, respiratory, and genitourinary systems. Female breast cancer accounted for 23% of subsequent malignant neo-plasms in the cohort, with Hodgkin lymphoma survivors at the highest risk, consistent with previous reports from the CCSS (3,9) and others (2,24,25). Furthermore, consistent with previous studies with extended follow-up (2,12), incidence increased with ongoing follow-up. Subsequent sarcomas represented 15% of the subsequent malignant neoplasms, and risk was associated with exposure to anthracyclines, alkylating agents, and radiation therapy, consistent with previous studies (2,3,6,23–27). Risk was highest among survivors of sarcoma, central nervous system ma-lignancy, Hodgkin lymphoma, or kidney cancer. Among survi-vors of a childhood sarcoma, 23% of the subsequent malignant neoplasms were female breast cancer, which may also be associ-ated with genetic predisposition. This hypothesis is supported by previous analyses in the CCSS in which we reported increased risk of cancer among siblings of survivors of primary sarcoma (28), increased risk of breast cancer among survivors of sarcoma that had not been treated with radiation therapy (9), and increased risk of subsequent sarcoma among primary sarcoma survivors in the CCSS who also had a family history of cancer (6). Strong et al. (29) have also reported an association between child-hood soft tissue sarcoma and breast cancer among survivors of childhood soft tissue sarcoma and their close relatives. Thus, further studies in the CCSS and other large survivor cohorts are warranted of the interactions among genetic predisposition, disease, and treatment.
Subsequent central nervous system tumors (n = 77) represented 9.6% of all subsequent neoplasms in this study. It is of interest that, with ongoing time since childhood cancer diagnosis, meningiomas, with a longer latency period to development, are being reported in excess of malignant brain tumors. This observation is consistent with a previously reported data on 66 meningiomas from the CCSS (10) and with data from St Jude Children’s Research Hospital (7). In the CCSS, we found that risk of meningioma was associated with a primary diagnosis of central nervous system malignancies or leukemia. In addition, among long-term survivors of leukemia who were followed at St Jude Children’s Research Hospital, a primary diagnosis of leukemia was found to be associ-ated with risk of meningioma (7). However, meningioma risk has not been described in other childhood leukemia cohorts (12,30,31), which likely results from the lack of continuous follow-up that is required to detect this risk.
The most prevalent subsequent neoplasm reported among those in the CCSS cohort with a median of 22.9 years of follow-up was nonmelanoma skin cancer, with 1574 tumors identified in 533 individuals. To our knowledge, this number of nonmelanoma skin cancers after childhood cancer is the largest that has been reported with ongoing follow-up. Survivors of acute lymphoblastic leuke-mia and Hodgkin lymphoma were at the highest risk of nonmela-noma skin cancer, perhaps related to radiation therapy exposure, which was the strongest independent risk factor for risk in multi-variable analysis.
Radiation therapy increased risk of all subsequent neoplasms, which is consistent with previous reports (2–4,7,10,11,14,24,32), in which dose–response relationships have been demonstrated. However, in this analysis, we were limited to using radiation
Table 4. Observed and expected numbers of invasive second malignant neoplasms (SMNs) by second malignancy diagnosis*
Second malignancy diagnosis No. observed No. expected SIR (95% CI) Median time to SMN occurrence, y (range)
All invasive second malignancies 802 135 6.0 (5.5 to 6.4) 17.8 (5.0–35.2)Leukemia 41 7 6.1 (4.5 to 8.2) 8.9 (5.0–31.1)ALL 10 3 3.6 (2.0 to 6.8) 11.5 (6.1–26.5)AML 21 2 9.3 (6.1 to 14.3) 7.4 (5.0–25.0)CNS tumor 77 7 10.4 (8.3 to 13.1) 13.2 (6.0–32.7) Glial 52 6 8.9 (6.8 to 11.7) 11.7 (6.0–25.5) Medulloblastoma or PNET 6 0.7 7.5 (3.1 to 18.1) 11.6 (8.0–14.6) Meningioma (malignant) 11 0.05 87.8 (26.5 to 291.4) 22.9 (15.8–32.7)Breast cancer 188 19 9.8 (8.4 to 11.5) 21.3 (6.7–33.5)Melanoma 48 14 3.3 (2.4 to 4.5) 18.9 (5.6–35.2)Thyroid cancer 128 12 10.9 (9.1 to 12.9) 18.6 (6.3–34.0)Bone cancer 45 2 19.0 (14.2 to 25.5) 9.8 (5.3–26.7)Osteosarcoma 35 1 30.0 (21.3 to 42.1) 9.3 (5.3–24.0)Ewing sarcoma 4 0.6 6.7 (2.5 to 17.8) 9.3 (5.3–24.0)Lymphoma 33 19 1.8 (1.2 to 2.5) 18.5 (6.9–31.5)Hodgkin lymphoma 9 9 1.0 (0.5 to 1.9) 18.5 (7.2–29.1)Non-Hodgkin lymphoma 21 8 2.5 (1.6 to 4.0) 21.6 (6.9–31.5)Soft tissue sarcoma 73 9 8.1 (6.4 to 10.2) 15.2 (5.3–31.3)Kidney cancer 20 3 7.4 (4.6 to 11.6) 19.6 (6.3–28.4)Head and neck cancer 38 3 10.8 (7.8 to 15.0) 15.6 (5.3–30.9)Small intestine and colorectal cancer 27 6 4.6 (3.2 to 6.8) 23.1 (7.0–29.4)Lung and bronchus 11 3 3.4 (1.9 to 6.1) 20.3 (14.0–25.6)Female genital cancers 23 11 2.1 (1.4 to 3.2) 19.5 (10.4–32.9)Other cancers 50 19 2.6 (2.0 to 3.4) 21.0 (8.2–35.0)
* ALL = acute lymphoblastic leukemia; AML = acute myeloid leukemia; CI = confidence interval; CNS = central nervous system; PNET = primitive neuroectodermal tumor; SIR = standardized incidence ratio.
therapy as a yes or no variable and did not have precise anatomical locations of all subsequent neoplasms with which to conduct a detailed radiation dosimetry analyses. However, specific dosimetry analyses have been conducted separately for thyroid, central nervous system, and breast cancers, as reported elsewhere (11,33–35). For
thyroid cancer, a sigmoidal dose–response relationship existed with an increased risk of subsequent thyroid cancer with radiation doses as high as 29 Gy (11,34) and a decreased risk of secondary thyroid cancer at doses greater than 30 Gy. In contrast, the dose–response relationship was linear for brain tumors (33) and for breast cancer
Table 5. Multivariable analysis of risk of overall second neoplasms (SNs) and specific SNs by exposure and demographic variables*
Sex Male 1.0 (ref) 1.0 (ref) 1.0 (ref) 1.0 (ref) Female 1.5 (1.3 to 1.5) 1.4 (1.2 to 1.6) 1.6 (1.1 to 2.3) .01 1.1 (0.9 to 1.3)Age at diagnosis .002 <.001 .001 <.001 0–4 y 1.0 (ref) 1.0 (ref) 1.0 (ref) 1.0 (ref) 5–9 y 0.9 (0.8 to 1.1) 1.1 (0.8 to 1.3) 0.7 (0.5 to 1.1) 1.1 (0.8 to 1.6) 10–14 y 1.1 (0.9 to 1.3) 1.2 (1.0 to 1.5) 0.4 (0.2 to 0.6) 1.3 (1.0 to 1.9) ≥15 y 1.3 (1.1 to 1.6) 1.5 (1.2 to 1.9) 0.6 (0.3 to 1.1) 2.0 (1.4 to 2.8)Treatment era <.001 <.001 <.001 <.001 1970–1974 1.0 (ref) 1.0 (ref) 1.0 (ref) 1.0 (ref) 1975–1979 0.9 (0.7 to 1.0) 0.8 (0.7 to 0.9) 0.8 (0.5 to 1.3) 0.8 (0.7 to 1.0) 1980–1986 0.6 (0.5 to 0.7) 0.5 (0.5 to 0.6) 0.4 (0.3 to 0.7) 0.5 (0.4 to 0.6)Primary cancer diagnosis Leukemia 1.0 (ref) 1.0 (ref) 1.0 (ref) 1.0 (ref) CNS tumor 1.1 (0.8 to 1.3) 1.0 (0.8 to 1.3) 1.8 (1.1 to 2.7) 0.7 (0.5 to 1.1) Hodgkin lymphoma 1.5 (1.1 to 1.9) 1.6 (1.1 to 2.1) 0.1 (0.0 to 0.9) 1.3 (0.9 to 2.1) NHL 0.7 (0.6 to 1.0) 0.8 (0.6 to 1.1) 0.2 (0.0 to 0.9) 0.9 (0.6 to 1.3) Kidney 0.6 (0.4 to 0.8) 0.7 (0.5 to 1.0) 0.0 0.4 (0.2 to 0.7) Neuroblastoma 0.8 (0.5 to 1.1) 0.9 (0.6 to 1.3) 0.0 0.3 (0.1 to 0.8) Soft tissue 1.0 (0.8 to 1.3) 1.2 (0.9 to 1.5) 0.2 (0.1 to 0.7) 0.7 (0.5 to 1.1) Bone 1.1 (0.8 to 1.5) 1.1 (0.8 to 1.6) 0.1 (0.1 to 1.5) 0.6 (0.4 to 1.1)Radiation therapy exposure No 1.0 (ref) 1.0 (ref) 1.0 (ref) 1.0 (ref) Yes 2.7 (2.2 to 3.3) 2.6 (3.1 to 3.2) 16.6 (5.2 to 52.6) 4.1 (2.7 to 6.1)Splenectomy No 1.0 (ref) 1.0 (ref) 1.0 (ref) 1.0 (ref) Yes 1.2 (0.9 to 1.6) 1.3 (1.0 to 1.8) 0.7 (0.1 to 5.4) 1.3 (0.9 to 1.9)Alkylating agent score
.66 .34 .22 .25
0 1.0 (ref) 1.0 (ref) 1.0 (ref) 1.0 (ref) 1 1.0 (0.9 to 1.2) 1.0 (0.9 to 1.3) 0.8 (0.5 to 1.4) 1.0 (0.7 to 1.3) 2 1.0 (0.9 to 1.4) 1.2 (0.9 to 1.4) 0.8 (0.4 to 1.4) 1.0 (0.7 to 1.4) 3 1.0 (0.8 to 1.2) 1.0 (0.8 to 1.2) 0.4 (0.1 to 1.2) 0.8 (0.6 to 1.1)Anthracycline exposure
.72 .41 .12 .04
None 1.0 (ref) 1.0 (ref) 1.0 (ref) 1.0 (ref) 1–100 mg/m2 0.9 (0.6 to 1.3) 1.0 (0.7 to 1.5) 0.8 (0.3 to 2.1) 1.2 (0.7 to 2.0) 101–300 mg/m2 1.0 (0.9 to 1.3) 1.1 (0.9 to 1.4) 0.8 (0.5 to 1.9) 0.8 (0.6 to 1.2) ≥301 mg/m2 0.9 (0.7 to 1.1) 1.0 (0.8 to 1.3) 0.5 (0.2 to 1.2) 0.6 (0.4 to 0.9)Epipodophyllotoxin exposure
.85 .59 .39 .77
None 1.0 (ref) 1.0 (ref) 1.0 (ref) 1.0 (ref) 1–1000 mg/m2 1.3 (0.9 to 2.0) 1.4 (0.9 to 2.3) 1.8 (0.7 to 5.0) 2.5 (1.4 to 4.5) 1001–4000 mg/m2 1.1 (0.7 to 1.6) 1.3 (0.8 to 2.0) 0.0 1.4 (0.7 to 2.9) ≥4001 mg/m2 1.1 (0.7 to 1.7) 1.0 (0.6 to 1.6) 1.7 (0.6 to 4.3) 0.9 (0.4 to 1.9)Platinum exposure .96 .76 .60 .35 None 1.0 (ref) 1.0 (ref) 1.0 (ref) 1.0 (ref) 1–400 mg/m2 1.2 (0.7 to 1.8) 0.9 (0.5 to 1.5) 4.0 (1.5 to 11.1) 0.6 (0.2 to 1.8) 401–750 mg/m2 0.9 (0.5 to 1.7) 0.9 (0.5 to 1.8) 1.8 (0.2 to 14.8) 0.9 (0.1 to 2.9) ≥751 mg/m2 1.0 (0.5 to 2.1) 1.0 (0.5 to 2.4) 0.0 0.5 (0.1 to 4.0)
* CI = confidence interval; CNS = central nervous system; NHL = non-Hodgkin lymphoma; NMSC = nonmelanoma skin cancer; ref = referent; RR = relative risk.
† All factors shown are included together in a single model for each outcome. Poisson regression was performed, and all statistical tests were two-sided.
jnci.oxfordjournals.org JNCI | Articles 1093
in which the risk of subsequent breast cancer reached 11-fold for local breast doses of approximately 40 Gy compared with no radiation (35).
Sex and age at time of childhood cancer diagnosis were impor-tant host-related factors. Girls or women were at increased risk for subsequent neoplasms, largely driven by increased risk for breast and thyroid cancers, nonmelanoma skin cancer, and me-ningioma. These data are consistent with higher rates of some of these malignancies among women in the general population (1). Younger age at diagnosis (<10 years) increased risk for menin-gioma, malignant central nervous system tumor, sarcoma, and thyroid cancer, supporting data previously reported in the CCSS (3,6,10,11) and the Late Effects Study Group (36). Older age at diagnosis (ie, age 15–21 years) increased risk for breast cancer, nonmelanoma skin cancer, and other solid organ cancers (in-cluding head and neck, small intestine, and colorectal cancers). The association between age at time of treatment and breast cancer risk remains inconsistent across studies (2,24,25,37). The risk of breast cancer appears to be highest among those treated during the pubertal age period, which may represent the effect of radiation therapy delivery at the time of tissue proliferation. We further evaluated the association between treatment era for the Hodgkin lymphoma and breast cancer risk. The decrease in risk of breast cancer over treatment eras did not represent changes in therapy for this group of patients or their representation in the cohort, which increased in the cohort over successive treatment eras. However, as would be expected, the length of follow-up decreased with later treatment era. One possible explanation for the decreasing risk of subsequent neoplasm with later treatment era is the shorter follow-up for the later era. Therefore, the treat-ment era variable may be a surrogate for length of follow-up, which did not differ between survivors of Hodgkin lymphoma and other survivors in the cohort.
For nonmelanoma skin cancer, younger age at time of exposure to ionizing radiation has been reported as a risk factor in noncancer populations (38,39) and in survivors of hematopoietic stem cell trans-plantation (40). However, those treated at an older age for childhood cancer may have had higher cumulative environmental exposure to ultraviolet irradiation, which may work in concert with ionizing radi-ation exposure to increase risk of nonmelanoma skin cancer.
Since 1970, when the earliest group of survivors in this cohort was first diagnosed with childhood cancer, protocols for pediatric chemotherapy and radiation therapy have been modified to better balance toxicity and efficacy. The decreased risk of subsequent neoplasms in the more recent treatment era of the CCSS, although somewhat reassuring currently, may reflect a shorter follow-up period and, thus, may change with continued follow-up.
There are several limitations to this study. Our analysis focused largely on the contribution of disease and therapeutic exposures on subsequent malignancy risk. The role of nontherapeutic exposures (such as tobacco, alcohol, and diet) are important but were not captured in a manner to provide meaningful analyses for this cohort. Such exposures should be considered because they are potentially modifiable risk factors. Data on subsequent neoplasms were initially obtained by self-report, and ascertainment may have not been complete if survivors did not report them back to the cohort.
Furthermore, it is important to note that more contemporarily treated childhood cancer patients may have less exposure to ther-apies associated with risk of subsequent neoplasms. Therefore, one should take caution in extrapolating the high risk of subsequent neoplasms found in the CCSS cohort to that of more contempo-rarily treated patients. However, for the cohort of patients treated between 1970 and 1986, it is clear that continued surveillance for subsequent neoplasms is essential as their risk continues to increase as these survivors enter their third and subsequent decades of life. This continued surveillance is of particular importance because many adult survivors do not appreciate the health risks that are related to their childhood cancer and so do not have regular med-ical follow-up or practice recommended cancer screening (41–48). Continued follow-up of this cohort and collection of their biolog-ical specimens during follow-up should provide further insight into the contributions of the host, disease, treatment, and environ-ment to subsequent neoplasm risk. Follow-up of the newer cohort of survivors in the expanded CCSS cohort, treated between 1987 and 1999, should provide additional insight and better quantify risk of subsequent neoplasms among more contemporarily treated patients. These combined efforts will help direct prevention strat-egies for subsequent neoplasms after childhood cancer therapy and are essential so that efficacy of childhood cancer therapy can con-tinued to be appropriately balanced with toxicity and the successes in treatment are not overshadowed by risk of adverse long-term outcomes, such as subsequent neoplasms.
Supplementary Data
Supplementary data can be found at http://www.jnci.oxfordjournals .org/.
references 1. Ries LA, Eisner MP, Kosary CL, Krapcho M, Neyman N, Aminou R,
Waidron W, Ruhl J, Howlader N, Tatalovich Z, Cho H, Mariotto A, Eisner MP, Lewis DR, Cronin K, Chen HS, Feuer EJ, Stinchcomb DG, Edwards BK (eds). SEER. Cancer Statistics Review 1975–2003. Bethesda, MD: National Cancer Institute. http://seer.cancer.gov/csr/1975_2007. Accessed July 8, 2010.
2. Bhatia S, Yasui Y, Robison LL, et al. High risk of subsequent neoplasms continues with extended follow-up of childhood Hodgkin’s disease: report from the Late Effects Study Group. J Clin Oncol. 2003;21(23):4386–4394.
3. Neglia JP, Friedman DL, Yasui Y, et al. Second malignant neoplasms in five-year survivors of childhood cancer: childhood cancer survivor study. J Natl Cancer Inst. 2001;93(8):618–629.
4. Garwicz S, Anderson H, Olsen JH, et al. Second malignant neoplasms after cancer in childhood and adolescence: a population-based case- control study in the 5 Nordic countries. The Nordic Society for Pediatric Hematology and Oncology. The Association of the Nordic Cancer Registries. Int J Cancer. 2000;88(4):672–678.
5. Bassal M, Mertens AC, Taylor L, et al. Risk of selected subsequent carci-nomas in survivors of childhood cancer: a report from the Childhood Cancer Survivor Study. J Clin Oncol. 2006;24(3):476–483.
6. Henderson TO, Whitton J, Stovall M, et al. Secondary sarcomas in child-hood cancer survivors: a report from the Childhood Cancer Survivor Study. J Natl Cancer Inst. 2007;99(4):300–308.
7. Hijiya N, Hudson MM, Lensing S, et al. Cumulative incidence of sec-ondary neoplasms as a first event after childhood acute lymphoblastic leukemia. JAMA. 2007;297(11):1207–1215.
8. Jenkinson HC, Hawkins MM, Stiller CA, Winter DL, Marsden HB, Stevens MC. Long-term population-based risks of second malignant neo-plasms after childhood cancer in Britain. Br J Cancer. 2004;91(11): 1905–1910.
9. Kenney LB, Yasui Y, Inskip PD, et al. Breast cancer after childhood can-cer: a report from the Childhood Cancer Survivor Study. Ann Intern Med. 2004;141(8):590–597.
10. Neglia JP, Robison LL, Stovall M, et al. New primary neoplasms of the central nervous system in survivors of childhood cancer: a report from the Childhood Cancer Survivor Study. J Natl Cancer Inst. 2006;98(21):1528–1537.
11. Sigurdson AJ, Ronckers CM, Mertens AC, et al. Primary thyroid cancer after a first tumour in childhood (the Childhood Cancer Survivor Study): a nested case-control study. Lancet. 2005;365(9476):2014–2023.
12. Maule M, Scelo G, Pastore G, et al. Risk of second malignant neoplasms after childhood leukemia and lymphoma: an international study. J Natl Cancer Inst. 2007;99(10):790–800.
13. Bluhm EC, Ronckers C, Hayashi RJ, et al. Cause-specific mortality and second cancer incidence after non-Hodgkin lymphoma: a report from the Childhood Cancer Survivor Study. Blood. 2008;111(8):4014–4021.
14. Perkins JL, Liu Y, Mitby PA, et al. Nonmelanoma skin cancer in survivors of childhood and adolescent cancer: a report from the childhood cancer survivor study. J Clin Oncol. 2005;23(16):3733–3741.
15. Meadows AT, Friedman DL, Neglia JP, et al. Second neoplasms in survi-vors of childhood cancer: findings from the Childhood Cancer Survivor Study cohort. J Clin Oncol. 2009;27(14):2356–2362.
16. Robison LL, Mertens AC, Boice JD, et al. Study design and cohort char-acteristics of the Childhood Cancer Survivor Study: a multi-institutional collaborative project. Med Pediatr Oncol. 2002;38(4):229–239.
17. Leisenring WM, Mertens AC, Armstrong GT, et al. Pediatric cancer survivorship research: experience of the Childhood Cancer Survivor Study. J Clin Oncol. 2009;27(14):2319–2327.
18. Gooley TA, Leisenring W, Crowley J, Storer BE. Estimation of failure probabilities in the presence of competing risks: new representations of old estimators. Stat Med. 1999;18(6):695–706.
19. Marubini E, Valsecchi MG. Analysing Survival Data from Clinical Trials and Observational Studies. Chichester, UK: Wiley; 1995.
20. Surveillance, Epidemiology, and End Results (SEER) Program. SEER*Stat Database: Incidence—SEER 9 Regs Limited-Use, Nov 2008 Sub (1973-2006) <Katrina/Rita Population Adjustment>—Linked To County Attributes—Total U.S., 1969-2006 Counties. National Cancer Institute, DCCPS, Surveillance Research Program, Cancer Statistics Branch; 2009. www.seer.cancer.gov.
21. Breslow N, Day N. Statistical Methods in Cancer Research, Volume II—The Design and Analysis of Cohort Studies. Lyon, France: IARC Scientific Publications; 1987.
22. Yasui Y, Liu Y, Neglia JP, et al. A methodological issue in the analysis of second-primary cancer incidence in long-term survivors of childhood cancers. Am J Epidemiol. 2003;158(11):1108–1113.
23. Tucker MA, D’Angio GJ, Boice JD Jr, et al. Bone sarcomas linked to ra-diotherapy and chemotherapy in children. N Engl J Med. 1987;317(10): 588–593.
24. Constine LS, Tarbell N, Hudson MM, et al. Subsequent malignancies in children treated for Hodgkin’s disease: associations with gender and radi-ation dose. Int J Radiat Oncol Biol Phys. 2008;72(1):24–33.
25. Metayer C, Lynch CF, Clarke EA, et al. Second cancers among long-term survivors of Hodgkin’s disease diagnosed in childhood and adolescence. J Clin Oncol. 2000;18(12):2435–2443.
26. Bhatia S, Sklar C. Second cancers in survivors of childhood cancer. Nat Rev Cancer. 2002;2(2):124–132.
27. Taylor AJ, Winter DL, Pritchard-Jones K, et al. Second primary neo-plasms in survivors of Wilms’ tumour—a population-based cohort study from the British Childhood Cancer Survivor Study. Int J Cancer. 2008;122(9):2085–2093.
28. Friedman DL, Kadan-Lottick NS, Whitton J, et al. Increased risk of can-cer among siblings of long-term childhood cancer survivors: a report from the childhood cancer survivor study. Cancer Epidemiol Biomarkers Prev. 2005;14(8):1922–1927.
29. Strong LC, Stine M, Norsted TL. Cancer in survivors of childhood soft tissue sarcoma and their relatives. J Natl Cancer Inst. 1987;79(6): 1213–1220.
30. Bhatia S, Sather HN, Pabustan OB, Trigg ME, Gaynon PS, Robison LL. Low incidence of second neoplasms among children diagnosed with acute lymphoblastic leukemia after 1983. Blood. 2002;99(12):4257–4264.
31. Loning L, Zimmermann M, Reiter A, et al. Secondary neoplasms subse-quent to Berlin-Frankfurt-Munster therapy of acute lymphoblastic leuke-mia in childhood: significantly lower risk without cranial radiotherapy. Blood. 2000;95(9):2770–2775.
32. Travis LB, Hill DA, Dores GM, et al. Breast cancer following radio-therapy and chemotherapy among young women with Hodgkin disease. JAMA. 2003;290(4):465–475.
33. Inskip PD, Curtis RE. New malignancies following childhood cancer in the United States, 1973-2002. Int J Cancer. 2007;121(10):2233–2240.
34. Ronckers CM, Sigurdson AJ, Stovall M, et al. Thyroid cancer in child-hood cancer survivors: a detailed evaluation of radiation dose response and its modifiers. Radiat Res. 2006;166(4):618–628.
35. Inskip PD, Robison LL, Stovall M, et al. Radiation dose and breast cancer risk in the Childhood Cancer Survivor Study [published online ahead of print]. J Clin Oncol. 2009;27(24):3401–3907.
36. Tucker MA, Jones PH, Boice JD Jr, et al. Therapeutic radiation at a young age is linked to secondary thyroid cancer. The Late Effects Study Group. Cancer Res. 1991;51(11):2885–2888.
37. Bhatia S, Robison LL, Oberlin O, et al. Breast cancer and other second neoplasms after childhood Hodgkin’s disease. N Engl J Med. 1996; 334(12):745–751.
38. Ron E, Modan B, Preston D, Alfandary E, Stovall M, Boice JD Jr. Radiation-induced skin carcinomas of the head and neck. Radiat Res. 1991;125(3):318–325.
39. Shore RE, Moseson M, Xue X, Tse Y, Harley N, Pasternack BS. Skin cancer after X-ray treatment for scalp ringworm. Radiat Res. 2002; 157(4):410–418.
41. Kadan-Lottick NS, Robison LL, Gurney JG, et al. Childhood cancer survivors’ knowledge about their past diagnosis and treatment: Childhood Cancer Survivor Study. JAMA. 2002;287(14):1832–1839.
42. Nathan PC, Ford JS, Henderson TO, et al. Health behaviors, medical care, and interventions to promote healthy living in the Childhood Cancer Survivor Study cohort. J Clin Oncol. 2009;27(14):2363–2373.
43. Nathan PC, Greenberg ML, Ness KK, et al. Medical care in long-term survivors of childhood cancer: a report from the childhood cancer survivor study. J Clin Oncol. 2008;26(27):4401–4409.
44. Oeffinger KC, Mertens AC, Hudson MM, et al. Health care of young adult survivors of childhood cancer: a report from the Childhood Cancer Survivor Study. Ann Fam Med. 2004;2(1):61–70.
45. Oeffinger KC, Mertens AC, Sklar CA, et al. Chronic health conditions in adult survivors of childhood cancer. N Engl J Med. 2006;355(15): 1572–1582.
46. Cox CL, Oeffinger KC, Montgomery M, et al. Determinants of mam-mography screening participation in adult childhood cancer survivors: results from the Childhood Cancer Survivor Study. Oncol Nurs Forum. 2009;36(3):335–344.
47. Diller L, Chow EJ, Gurney JG, et al. Chronic disease in the Childhood Cancer Survivor Study cohort: a review of published findings. J Clin Oncol. 2009;27(14):2339–2355.
48. Oeffinger KC, Ford JS, Moskowitz CS, et al. Breast cancer surveillance practices among women previously treated with chest radiation for a child-hood cancer. JAMA. 2009;301(4):404–414.
FundingThis study is supported by National Institutes of Health (U24-CA55727 to L.L.R., Principal Investigator) and support to the University of Minnesota from the Children’s Cancer Research Fund, and support to St Jude Children’s Research Hospital from the American Lebanese Syrian Associated Charities (ALSAC).
NotesThe authors of the manuscript however had full responsibility for the design of the study, the collection of the data, the analysis and interpretation of the data, the decision to submit the manuscript for publication, and the writing of the manuscript.
jnci.oxfordjournals.org JNCI | Articles 1095
The CCSS is a collaborative, multi-institutional project, funded as a resource by the National Cancer Institute to promote and facilitate research among long-term survivors of cancer diagnosed during childhood and adolescence. Participating institutions and investigators are listed in Supplementary Table 1 (available online). Any investigator interested in potential use of this resource is encouraged to visit www.stjude.org/ccss.
Affiliations of authors: Vanderbilt-Ingram Cancer Center, Department of Pediatrics, Vanderbilt University School of Medicine, Nashville, TN (DLF); Division of Public Health Sciences and Clinical Research, Fred Hutchinson
Cancer Research Center, Seattle, WA (JW, WL); Department of Biostatistics, University of Washington, Seattle, WA (WL); Department of Pediatrics, Emory University, Atlanta, GA (ACM); Department of Pathology, Ohio State University School of Medicine, Nationwide Children’s Hospital, Columbus, OH (SH); Department of Radiation Physics, University of Texas MD Anderson Cancer Center, Houston, TX (MS); Department of Radiation Oncology, Stanford University School of Medicine, Stanford, CA (SSD); Department of Pediatrics, University of Pennsylvania, Philadelphia, PA (ATM); Department of Epidemiology and Cancer Control, St Jude Children’s Research Hospital, Memphis, TN (LLR); Department of Pediatrics, University of Minnesota, Minneapolis, MN (JPN).


![Improved detection of prostate cancer using a magneto ... · cancer, e.g., colorectal cancer [11], pancreatic cancer [12], cervical cancer [13], and lung cancer [14]. The onset of](https://static.documents.pub/doc/80x56/604ad0a83fb5d3755f7576ae/improved-detection-of-prostate-cancer-using-a-magneto-cancer-eg-colorectal.jpg)

![[Ghiduri][Cancer]Gastric Cancer](https://static.documents.pub/doc/80x56/55cf9399550346f57b9de771/ghiduricancergastric-cancer.jpg)


