Cancer Res Treat. 2015;47(2):127-141 pISSN 1598-2998, eISSN 2005-9256 http://dx.doi.org/10.4143/crt.2015.060 │ http://www.e-crt.org │ 127 Copyright ⓒ 2015 by the Korean Cancer Association This is an Open-Access article distributed under the terms of the Creative Commons Attribution Non-Commercial License (http://creativecommons.org/licenses/by-nc/3.0/) which permits unrestricted non-commercial use, distribution, and reproduction in any medium, provided the original work is properly cited. Open Access Cancer Statistics in Korea: Incidence, Mortality, Survival, and Prevalence in 2012 Special Article Purpose The aim of this study was to report nationwide cancer statistics in Korea, including incidence, mortality, survival, and prevalence, and their trends. Materials and Methods Incidence data from 1993 to 2012 were obtained from the Korea National Cancer Incidence Database, and vital status was followed through December 31, 2013. Mortality data from 1983 to 2012 were obtained from Statistics Korea. Crude and age-standardized rates for incidence, mortality, and prevalence, and relative survival were calculated. Results A total of 224,177 cancer cases and 73,759 cancer deaths were reported in 2012, and there were 1,234,879 prevalent cases identified in Korea as of January 1, 2013. Over the past 14 years (1999-2012), overall incidence rates have increased by 3.3% per year. The incidence rates of liver and cervical cancers have decreased, while those of thyroid, breast, prostate, and colorectal cancers have increased. Notably, incidence of thyroid cancer increased by 22.3% per year in both sexes and has been the most common cancer since 2009. The mortality for all cancers combined decreased by 2.7% per year from 2002 to 2012. Five-year relative survival rates of patients diag- nosed in the last 5 years (2008-2012) have improved by 26.9% compared with those from 1993 to1995. Conclusion Overall cancer mortality rates have declined since 2002 in Korea, while incidence has increased and survival has improved. Key words Incidence, Mortality, Survival, Prevalence, Neoplasms, Korea Introduction Cancer has been the leading cause of death in Korea since 1983 [1] and is the most burdensome disease [2]. More than 210,000 new cancer cases are diagnosed in Korea each year, and cancer is responsible for one in four deaths [3]. This article reports the most recent nationwide cancer statistics in Korea, including incidence, mortality, survival, prevalence, and their trends. 1. Data sources The Ministry of Health and Welfare, Korea, initiated a nationwide hospital-based cancer registry called the Korea Central Cancer Registry (KCCR) in 1980. The registry collected 80%-90% of cancer cases annually from more than 180 training hospitals throughout the country. In 1999, the KCCR expanded cancer registration to cover the entire population under the Population-Based Regional Cancer Registry Program. Details of the history, objectives, + + + + + + + + + + + + + + + + + + + + + + + + + + + + + + + + + + + + + + + + + + + + + + + + + + + + + + + + + + + + + + + + + + + + + + + + + + + + + + + + + + + + + + + + + + + + + + + + + + + + + + + + + + + + + + + + + + + + + + + + + + + + + + + + + + + + + + + + + + + + + + + + + + + + + + + + + + + + + + + + + + + + + + + + + + + + + + + + + + + + + + + + + + + + + + + + + + + + + + + + + + + + + + + + + + + + + + + + + + + + + + + + + + + + + + + + + + + + + + + + + + + + + + + + + + + + + + + + + + + + Correspondence: Young-Joo Won, PhD The Korea Central Cancer Registry, National Cancer Center, 323 Ilsan-ro, Ilsandong-gu, Goyang 410-769, Korea Tel: 82-31-920-2015 Fax: 82-31-920-2179 E-mail: [email protected]Received February 17, 2015 Accepted February 22, 2015 Published online March 3, 2015 Kyu-Won Jung, MS 1,2 Young-Joo Won, PhD 1,2 Hyun-Joo Kong, MS 1,2 Chang-Mo Oh, MD, PhD 1,2 Hyunsoon Cho, PhD 1,2 Duk Hyoung Lee, MD, PhD 2 Kang Hyun Lee, MD, PhD 1 1 The Korea Central Cancer Registry and 2 National Cancer Control Institute, National Cancer Center, Goyang, Korea
Transcript
Cancer Res Treat. 2015;47(2):127-141
pISSN 1598-2998, eISSN 2005-9256
http://dx.doi.org/10.4143/crt.2015.060
│ http://www.e-crt.org │ 127Copyright ⓒ 2015 by the Korean Cancer AssociationThis is an Open-Access article distributed under the terms of the Creative Commons Attribution Non-Commercial License (http://creativecommons.org/licenses/by-nc/3.0/)
which permits unrestricted non-commercial use, distribution, and reproduction in any medium, provided the original work is properly cited.
Open Access
Cancer Statistics in Korea: Incidence, Mortality, Survival, and Prevalence in 2012
Special Article
PurposeThe aim of this study was to report nationwide cancer statistics in Korea, includingincidence, mortality, survival, and prevalence, and their trends.
Materials and MethodsIncidence data from 1993 to 2012 were obtained from the Korea National Cancer Incidence Database, and vital status was followed through December 31, 2013. Mortality data from 1983 to 2012 were obtained from Statistics Korea. Crude andage-standardized rates for incidence, mortality, and prevalence, and relative survivalwere calculated.
ResultsA total of 224,177 cancer cases and 73,759 cancer deaths were reported in 2012,and there were 1,234,879 prevalent cases identified in Korea as of January 1, 2013.Over the past 14 years (1999-2012), overall incidence rates have increased by 3.3%per year. The incidence rates of liver and cervical cancers have decreased, while thoseof thyroid, breast, prostate, and colorectal cancers have increased. Notably, incidenceof thyroid cancer increased by 22.3% per year in both sexes and has been the mostcommon cancer since 2009. The mortality for all cancers combined decreased by2.7% per year from 2002 to 2012. Five-year relative survival rates of patients diag-nosed in the last 5 years (2008-2012) have improved by 26.9% compared with thosefrom 1993 to1995.
ConclusionOverall cancer mortality rates have declined since 2002 in Korea, while incidencehas increased and survival has improved.
Key wordsIncidence, Mortality, Survival, Prevalence, Neoplasms, Korea
Introduction
Cancer has been the leading cause of death in Korea since1983 [1] and is the most burdensome disease [2]. More than210,000 new cancer cases are diagnosed in Korea each year,and cancer is responsible for one in four deaths [3]. This article reports the most recent nationwide cancer statistics inKorea, including incidence, mortality, survival, prevalence,and their trends.
1. Data sources
The Ministry of Health and Welfare, Korea, initiated a nationwide hospital-based cancer registry called the KoreaCentral Cancer Registry (KCCR) in 1980. The registry collected 80%-90% of cancer cases annually from more than180 training hospitals throughout the country.
In 1999, the KCCR expanded cancer registration to coverthe entire population under the Population-Based RegionalCancer Registry Program. Details of the history, objectives,
Correspondence: Young-Joo Won, PhDThe Korea Central Cancer Registry, National Cancer Center, 323 Ilsan-ro, Ilsandong-gu, Goyang 410-769, KoreaTel: 82-31-920-2015Fax: 82-31-920-2179E-mail: [email protected]
Received February 17, 2015Accepted February 22, 2015Published online March 3, 2015
Kyu-Won Jung, MS1,2
Young-Joo Won, PhD1,2
Hyun-Joo Kong, MS1,2
Chang-Mo Oh, MD, PhD1,2
Hyunsoon Cho, PhD1,2
Duk Hyoung Lee, MD, PhD2
Kang Hyun Lee, MD, PhD1
1The Korea Central Cancer Registry and 2National Cancer Control Institute, National Cancer Center, Goyang, Korea
and activities of the KCCR have been documented elsewhere[4]. Incidence data for 1999-2012 were obtained from theKorea National Cancer Incidence Database (KNCI DB). Thecompleteness of incidence data for 2012 was 97.7%, as deter-mined by the Ajiki method [5].
Cancer cases were classified according to the InternationalClassification of Diseases for Oncology, third edition [6] andconverted according to the International Classification of Diseases, 10th edition (ICD-10) [7]. A total of 2,405,894 cancercases first diagnosed between 1993 and 2012 from the KNCIDB were used in the survival analysis, and vital status wasfollowed until December 31, 2013.
Mortality data from 1983 to 2012 were obtained from Statistics Korea [1]. Cause of death was coded and classifiedaccording to ICD-10 [7]. Population data were also obtainedfrom Statistics Korea using the resident registration popula-
tion on July 1 of specified years.
2. Analysis
Crude rates (CRs) and age-specific rates of cancer inci-dence and mortality were calculated. Age-standardized rates(ASRs) were calculated using Segi’s world standard popula-tion [8]. Cumulative risks of cancer, which represent theprobability of developing cancer during one’s lifetime, werealso calculated. Changes in the annual ASRs of cancer inci-dence were examined by calculating the annual percentagechange over a time period as (exp(b)–1)100, where b is theslope of the regression of log ASR for a given calendar year[9].
Prevalence was also calculated for assessment of cancerburden, which includes new and pre-existing cancer patients
Site/TypeNew cases Deaths Prevalent casesa)
Both Male Female Both Male Female Both Male FemaleAll sites 224,177 112,385 111,792 73,759 46,462 27,297 1,234,879 547,837 687,042Lip, oral cavity, 2,913 2,135 778 1,036 809 227 17,024 11,501 5,523and pharynx
CNS, central nervous system. a)Limited-duration prevalent cases on January 1, 2013; These patients who were diagnosed between January 1, 1999 and December 31, 2012 and were alive on January 1, 2013; Multiple primary cancer cases were countedmultiple times, b)Includes the gallbladder and other/unspecified parts of the biliary tract.
Table 1. Cancer incidence, prevalence, and deaths by sex in Korea, 2012
Kyu-Won Jung, Cancer Statistics in Korea, 2012
diagnosed during a given time period who were still aliveon an index date. Using the cancer incidence database datafrom 1999 to 2012, we defined prevalent cases as patientswho were diagnosed between January 1, 1999 and December31, 2012, and were still alive on January 1, 2013. We calcu-lated limited-duration prevalences, namely, 1- and 5-yearprevalences. For example, the 5-year prevalence was calcu-lated as the number of people alive on January 1, 2013 whohad been diagnosed with cancer within the previous 5 years.We applied this counting method using the SEER*Stat soft-ware [10] to calculate the number of cases while adjusting forpatients lost to follow-up.
The survival duration for each case was determined as theinterval between the date of initial diagnosis and the date ofdeath, date of loss to follow-up, or closing date for follow-up. Observed survival rates were calculated using the life-
table method and relative survival rates using the Ederer IImethod [11] were based on an algorithm written in SAS byPaul Dickman [12], with some minor modifications.
Selected Findings
1. Incidence
The overall number of incident cancer cases, deaths, andprevalent cases by sex and cancer site for 2012 in Korea areshown in Table 1. A total of 224,177 incident cancer cases and73,759 deaths were reported to occur in 2012. As of January1, 2013, 1,234,879 prevalent cancer cases diagnosed between
Crude incidence rate Age-standardized incidence rateSite/Type per 100,000 per 100,000a)
CNS, central nervous system. a)Age-adjusted using the world standard population, b)Includes the gallbladder and other/unspecified parts of the biliary tract.
Table 2. Crude and age-standardized cancer incidence rates by sex in Korea, 2012
VOLUME 47 NUMBER 2 APRIL 2015 129
Cancer Res Treat. 2015;47(2):127-141
130 CANCER RESEARCH AND TREATMENT
1999 and 2012 were identified. The cumulative risk of devel-oping cancer during one’s lifetime in 2012 was 37.5% formales and 34.9% for females.
The cancer incidence rates in 2012 by sex and cancer siteare shown in Table 2. The 2012 CRs per 100,000 of all sitescombined were 446.2 and 444.4 for males and females, respectively. The ASRs per 100,000 of all sites combined were326.4 and 290.1 for males and females, respectively. In males,the five leading primary cancer sites were stomach (CR, 82.7;ASR, 59.3), colon and rectum (CR, 69.3; ASR, 50.0), lung (CR,61.0; ASR, 44.3), liver (CR, 48.2; ASR, 34.3), and prostate (CR,36.8; ASR, 27.0), which together accounted for 66.8% of allnewly diagnosed cancers in 2012. In females, the most com-mon cancer site was thyroid (CR, 142.9; ASR, 102.4), followedby breast (CR, 65.7; ASR, 44.7), colon and rectum (CR, 45.9;ASR, 26.8), stomach (CR, 39.8; ASR, 23.5), and lung (CR, 26.8;ASR, 14.9), which together accounted for 72.3% of all newlydiagnosed cancers. Thyroid cancer alone accounted for 32.2%of incident cases (n=35,955) among females in 2012.
2. Mortality
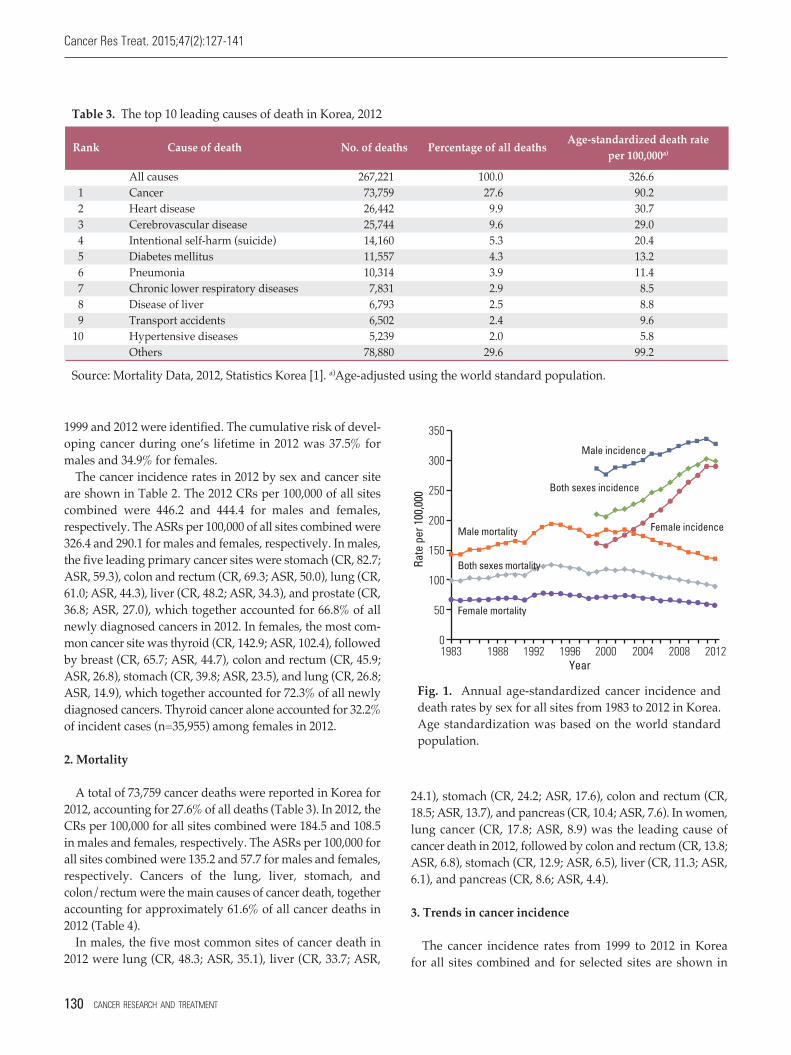
A total of 73,759 cancer deaths were reported in Korea for2012, accounting for 27.6% of all deaths (Table 3). In 2012, theCRs per 100,000 for all sites combined were 184.5 and 108.5in males and females, respectively. The ASRs per 100,000 forall sites combined were 135.2 and 57.7 for males and females,respectively. Cancers of the lung, liver, stomach, andcolon/rectum were the main causes of cancer death, togetheraccounting for approximately 61.6% of all cancer deaths in2012 (Table 4).
In males, the five most common sites of cancer death in2012 were lung (CR, 48.3; ASR, 35.1), liver (CR, 33.7; ASR,
24.1), stomach (CR, 24.2; ASR, 17.6), colon and rectum (CR,18.5; ASR, 13.7), and pancreas (CR, 10.4; ASR, 7.6). In women,lung cancer (CR, 17.8; ASR, 8.9) was the leading cause of cancer death in 2012, followed by colon and rectum (CR, 13.8;ASR, 6.8), stomach (CR, 12.9; ASR, 6.5), liver (CR, 11.3; ASR,6.1), and pancreas (CR, 8.6; ASR, 4.4).
3. Trends in cancer incidence
The cancer incidence rates from 1999 to 2012 in Korea for all sites combined and for selected sites are shown in
Table 3. The top 10 leading causes of death in Korea, 2012
Rank Cause of death No. of deaths Percentage of all deaths Age-standardized death rateper 100,000a)
Source: Mortality Data, 2012, Statistics Korea [1]. a)Age-adjusted using the world standard population.
350
300
250
200
150
100
50
01983 19921988 20001996 2004 2008 2012
Rate
per
100,0
00
Male mortality
Female mortality
Male incidence
Both sexes incidence
Female incidence
Year
Both sexes mortality
Fig. 1. Annual age-standardized cancer incidence anddeath rates by sex for all sites from 1983 to 2012 in Korea.Age standardization was based on the world standardpopulation.
Kyu-Won Jung, Cancer Statistics in Korea, 2012
Crude mortality rate Age-standardized mortality rateSite/Type per 100,000 per 100,000a)
CNS, central nervous system. a)Age-adjusted using the world standard population, b)Includes the gallbladder and other/unspecified parts of the biliary tract.
Table 4. Crude and age-standardized cancer mortality rates by sex in Korea, 2012
BStomachColon and rectumLiverLungBreastCervix uteriThyroid
Fig. 2. Trends in age-standardized incidences of selected cancers by sex from 1999 to 2012 in Korea. Age standardizationwas based on the world standard population. (A) Male. (B) Female.
VOLUME 47 NUMBER 2 APRIL 2015 131
Cancer Res Treat. 2015;47(2):127-141
132 CANCER RESEARCH AND TREATMENT
Tabl
e 5.T
rend
s in
canc
er in
ciden
ce ra
tes f
or b
oth
sexe
s fro
m 19
99 to
2012
in K
orea
APC
, ann
ual p
erce
ntag
e cha
nge;
CNS,
cent
ral n
ervo
us sy
stem
. APC
was
calcu
late
d us
ing
age-
stand
ardi
zed
incid
ence
dat
a bas
ed on
the w
orld
stan
dard
pop
ulat
ion.
a)Si
gnifi
cant
ly d
iffer
ent f
rom
zero
(p <
0.05
), b)
Inclu
des t
he g
allb
ladd
er an
d ot
her/
unsp
ecifi
ed p
arts
of th
e bili
ary
tract.
Site
/Typ
eYe
ar
1999
2000
2001
2002
2003
2004
2005
2006
2007
2008
2009
2010
2011
2012
A
PC
All
sites
210.5
20
5.1
216.7
22
0.1
227.8
23
5.0
247.9
25
2.1
263.4
27
5.8
286.6
29
2.9
302.8
29
9.0
3.3a)
Lip,
ora
l cav
ity, a
nd p
hary
nx3.6
4.4
3.6
3.7
3.8
3.8
3.8
3.8
3.9
4.0
3.8
4.0
4.0
3.9
0.4
Es
opha
gus
4.1
3.7
3.9
3.8
3.6
3.6
3.5
3.4
3.3
3.3
3.1
3.1
3.0
3.0
–2.2a)
Stom
ach
43.6
42.3
44.0
43.6
43.3
41.2
44.4
42.9
41.8
42.6
43.4
42.5
42.7
39.9
–0.3
Colo
n an
d re
ctum
20.4
21.0
22.9
24.7
26.9
28.6
31.0
32.5
33.8
34.9
36.9
36.9
38.1
37.3
5.3a)
Live
r27
.9 26
.7 27
.3 26
.5 25
.8 25
.6 25
.8 24
.6 24
.4 24
.1 23
.5 22
.8 22
.4 21
.1 –1
.9a)
Gallb
ladd
erb)
6.5
6.4
6.7
6.7
6.7
6.9
7.1
6.6
6.6
6.4
6.8
6.6
6.4
6.3
–0.2
Panc
reas
5.6
5.5
5.5
5.8
5.9
6.0
6.3
6.2
6.3
6.4
6.3
6.4
6.7
6.7
1.5a)
Lary
nx2.3
2.2
2.4
2.2
2.1
1.9
2.0
1.8
1.8
1.7
1.7
1.6
1.5
1.4
–3
.7a)
Lung
28.5
27.7
28.3
28.5
27.9
28.8
29.0
28.7
28.4
28.2
28.3
28.6
28.6
27.4
0.0
Brea
st10
.7 10
.8 12
.7 13
.9 14
.2 15
.0 16
.3 16
.9 18
.1 18
.9 19
.6 20
.6 22
.3 22
.6 6.0
a)
Cerv
ix u
teri
8.5
7.9
8.3
7.7
7.4
6.9
6.5
6.4
5.7
5.9
5.5
5.6
5.2
4.9
–4.2a)
Corp
us u
teri
1.4
1.3
1.5
1.7
1.9
1.9
2.0
2.1
2.2
2.4
2.6
2.6
2.7
2.7
5.6a)
Ova
ry2.7
2.5
2.5
2.6
2.7
2.7
2.8
2.8
3.1
2.9
2.8
3.0
2.9
3.1
1.4
a)
Pros
tate
3.1
2.7
3.6
3.9
4.8
6.0
6.3
7.3
8.6
9.8
10.6
11.0
11.9
11.6
13.0a)
Testi
s0.3
0.3
0.3
0.3
0.3
0.3
0.3
0.4
0.4
0.4
0.4
0.4
0.5
0.5
4.5
a)
Kidn
ey3.0
2.9
3.3
3.4
3.5
3.7
4.1
4.4
4.8
5.1
5.2
5.3
5.6
5.6
5.8
a)
Blad
der
4.6
4.6
4.9
4.7
5.1
5.1
5.1
4.9
5.0
4.8
4.6
4.7
4.6
4.3
–0.4
Brai
n an
d CN
S2.9
2.8
2.8
2.6
2.9
2.9
3.0
2.9
3.1
3.0
3.0
3.1
2.7
2.8
0.4
Th
yroi
d6.3
6.1
7.9
9.5
12
.8 17
.2 20
.7 25
.4 32
.8 41
.4 48
.1 53
.6 59
.1 62
.5 22
.3a)
Hod
gkin
lym
phom
a0.2
0.3
0.3
0.3
0.3
0.4
0.3
0.3
0.4
0.4
0.4
0.4
0.5
0.5
5.0
a)
Non
-Hod
gkin
lym
phom
a4.5
4.2
4.5
4.6
4.9
5.3
5.3
5.5
5.6
5.7
6.2
6.2
6.5
6.6
3.6
a)
Mul
tiple
mye
lom
a1.0
1.0
1.1
1.1
1.1
1.2
1.3
1.3
1.4
1.4
1.5
1.5
1.4
1.6
3.7
a)
Leuk
emia
4.7
4.3
4.7
4.8
4.8
4.8
4.7
4.9
4.8
5.0
5.1
5.0
5.2
4.9
0.9a)
Oth
er an
d ill
-def
ined
14.3
13.5
13.9
13.5
15.2
15.3
16.2
16.2
17.2
17.1
17.1
17.5
18.1
17.6
2.4a)
Kyu-Won Jung, Cancer Statistics in Korea, 2012
Tabl
e 6.T
rend
s in
canc
er in
ciden
ce ra
tes i
n m
ales
from
1999
to 20
12 in
Kor
ea
APC
, ann
ual p
erce
ntag
e cha
nge;
CNS,
cent
ral n
ervo
us sy
stem
. APC
was
calcu
late
d us
ing
age-
stand
ardi
zed
incid
ence
dat
a bas
ed on
the w
orld
stan
dard
pop
ulat
ion.
a)Si
gnifi
cant
ly d
iffer
ent f
rom
zero
(p <
0.05
), b)
Inclu
des t
he g
allb
ladd
er an
d ot
her/
unsp
ecifi
ed p
arts
of th
e bili
ary
tract.
Site
/Typ
eYe
ar
1999
2000
2001
2002
2003
2004
2005
2006
2007
2008
2009
2010
2011
2012
A
PC
All
sites
285.0
27
6.7
288.3
29
0.0
295.1
29
9.6
311.5
31
0.3
316.9
32
3.9
330.6
33
1.3
336.1
32
6.4
1.5a)
Lip,
ora
l cav
ity, a
nd p
hary
nx6.1
7.1
6.0
6.2
6.5
6.2
6.1
6.2
6.3
6.5
6.1
6.1
6.3
6.1
–0
.2 Es
opha
gus
8.8
8.0
8.3
8.2
7.7
7.7
7.6
7.2
7.0
7.0
6.6
6.5
6.2
6.1
–2.6a)
Stom
ach
66.2
65.0
67.2
66.6
66.0
62.3
66.9
65.4
63.1
64.5
65.0
63.3
63.7
59.3
–0.5a)
Colo
n an
d re
ctum
26.2
27.2
29.6
32.9
35.3
38.0
41.2
43.3
45.3
47.0
49.9
50.0
51.9
50.0
5.7a)
Live
r46
.8 44
.7 45
.1 43
.9 42
.3 42
.2 42
.6 40
.3 39
.8 39
.5 38
.2 36
.8 35
.9 34
.3 –2
.1a)
Gallb
ladd
erb)
8.1
7.8
8.2
8.1
7.8
8.4
8.7
8.1
7.9
7.6
8.1
8.2
7.6
7.6
–0.3
Panc
reas
7.8
7.6
7.6
7.9
7.7
8.0
8.3
8.0
8.2
8.4
8.1
8.0
8.6
8.4
0.8a)
Lary
nx4.9
4.5
5.1
4.7
4.5
4.1
4.3
3.8
3.8
3.5
3.6
3.4
3.2
3.0
–3
.7a)
Lung
51.4
49.8
51.1
51.0
50.0
50.8
50.9
49.2
48.7
47.6
47.5
47.5
46.4
44.3
–0.9a)
Brea
st0.2
0.3
0.2
0.3
0.2
0.2
0.2
0.2
0.1
0.3
0.2
0.2
0.2
0.2
–1
.1 Pr
osta
te8.4
7.2
9.5
10
.1 12
.5 15
.1 15
.8 18
.0 20
.9 23
.5 25
.2 26
.0 27
.7 27
.0 11
.6a)
Testi
s0.6
0.5
0.6
0.6
0.6
0.6
0.6
0.7
0.7
0.7
0.8
0.8
0.9
0.9
4.4
a)
Kidn
ey4.5
4.4
4.9
5.0
5.2
5.5
6.0
6.5
7.1
7.4
7.6
8.0
8.2
8.2
5.5
a)
Blad
der
9.0
9.0
9.4
9.0
9.7
9.8
9.8
9.6
9.4
9.2
8.7
8.8
8.8
8.1
–0.6
Brai
n an
d CN
S3.2
3.1
3.1
2.9
3.3
3.3
3.3
3.2
3.4
3.4
3.5
3.5
3.0
3.3
0.6
Th
yroi
d2.1
1.9
2.4
2.7
3.7
4.8
5.9
7.5
10
.0 13
.3 15
.6 18
.6 20
.4 23
.0 23
.6a)
Hod
gkin
lym
phom
a0.4
0.4
0.4
0.3
0.4
0.5
0.4
0.4
0.5
0.5
0.5
0.6
0.6
0.6
4.1
a)
Non
-Hod
gkin
lym
phom
a5.8
5.5
5.8
5.8
6.2
6.7
6.5
6.9
7.0
6.8
7.5
7.4
7.7
7.9
2.7
a)
Mul
tiple
mye
lom
a1.2
1.3
1.4
1.4
1.4
1.4
1.6
1.5
1.6
1.7
1.9
1.8
1.8
2.0
3.5
a)
Leuk
emia
5.5
5.0
5.4
5.8
5.5
5.7
5.6
5.6
5.7
5.8
6.0
6.0
6.1
5.9
1.0a)
Oth
er an
d ill
-def
ined
17.9
16.5
16.8
16.5
18.5
18.3
19.3
18.9
20.3
19.8
20.0
19.8
20.8
20.1
1.7a)
VOLUME 47 NUMBER 2 APRIL 2015 133
134 CANCER RESEARCH AND TREATMENT
Cancer Res Treat. 2015;47(2):127-141
Tabl
e 7.T
rend
s in
canc
er in
ciden
ce ra
tes i
n fe
mal
es fr
om 19
99 to
2012
in K
orea
APC
, ann
ual p
erce
ntag
e cha
nge;
CNS,
cent
ral n
ervo
us sy
stem
. APC
was
calcu
late
d us
ing
age-
stand
ardi
zed
incid
ence
dat
a bas
ed o
n th
e wor
ld st
anda
rd p
opul
atio
na)Si
gnifi
cant
ly d
iffer
ent f
rom
zero
(p <
0.05
), b)
Inclu
des t
he g
allb
ladd
er an
d ot
her/
unsp
ecifi
ed p
arts
of th
e bili
ary
tract.
Site
/Typ
eYe
ar
1999
2000
2001
2002
2003
2004
2005
2006
2007
2008
2009
2010
2011
2012
A
PCa)
All
sites
161.1
15
7.4
169.0
17
4.6
184.5
19
3.6
208.0
21
6.6
232.3
24
9.6
263.6
27
4.8
289.3
29
0.1
5.3a)
Lip,
ora
l cav
ity, a
nd p
hary
nx1.6
2.4
1.7
1.7
1.7
1.9
1.9
1.8
1.9
1.9
1.8
2.2
2.1
2.0
1.1
Es
opha
gus
0.6
0.6
0.6
0.5
0.6
0.5
0.4
0.5
0.5
0.5
0.4
0.4
0.4
0.5
–2.2a)
Stom
ach
26.7
25.2
26.2
26.3
25.9
24.7
26.8
25.1
24.8
25.1
25.7
25.3
25.3
23.5
–0.5
Colo
n an
d re
ctum
16.4
16.4
17.9
18.8
20.5
21.5
23.0
24.1
24.6
25.2
26.3
26.1
26.7
26.8
4.3a)
Live
r12
.3 11
.8 12
.2 11
.8 11
.5 11
.3 11
.4 11
.1 11
.1 10
.7 10
.6 10
.4 10
.4 9.5
–1
.6a)
Gallb
ladd
erb)
5.3
5.5
5.7
5.8
5.8
5.9
6.0
5.5
5.6
5.5
5.8
5.4
5.5
5.3
–0.2
Panc
reas
4.0
4.0
4.0
4.2
4.5
4.5
4.7
4.7
4.8
4.9
4.9
5.0
5.1
5.4
2.3a)
Lary
nx0.4
0.3
0.3
0.3
0.3
0.3
0.3
0.2
0.2
0.2
0.2
0.2
0.2
0.1
–7
.5a)
Lung
12.4
12.5
12.3
12.6
12.4
13.0
13.5
14.0
14.0
14.2
14.2
14.7
15.3
14.9
1.7a)
Brea
st20
.9 20
.9 24
.7 27
.2 27
.9 29
.4 32
.0 33
.3 35
.7 37
.2 38
.8 40
.7 44
.0 44
.7 6.1
a)
Cerv
ix u
teri
16.3
15.1
15.8
14.8
14.2
13.1
12.4
12.2
11.1
11.5
10.7
10.9
10.2
9.5
–4.0a)
Corp
us u
teri
2.8
2.6
3.0
3.3
3.8
3.7
3.9
4.0
4.2
4.7
5.1
5.1
5.3
5.3
5.8a)
Ova
ry5.0
4.8
4.8
5.0
5.1
5.2
5.4
5.4
5.9
5.6
5.4
5.9
5.8
6.0
1.7
a)
Kidn
ey1.7
1.8
1.9
2.0
2.1
2.2
2.5
2.7
2.8
3.0
3.2
3.0
3.4
3.2
5.7
a)
Blad
der
1.6
1.6
1.7
1.7
1.8
1.7
1.7
1.6
1.7
1.6
1.6
1.5
1.5
1.4
–1.0
Brai
n an
d CN
S2.6
2.5
2.5
2.4
2.6
2.6
2.8
2.7
2.9
2.7
2.6
2.7
2.4
2.4
0.1
Th
yroi
d10
.4 10
.1 13
.2 16
.2 21
.8 29
.6 35
.4 43
.3 55
.7 69
.5 80
.7 88
.8 98
.0 10
2.4
22.1a)
Hod
gkin
lym
phom
a 0.1
0.2
0.2
0.2
0.2
0.2
0.2
0.3
0.3
0.3
0.3
0.3
0.4
0.3
6.0
a)
Non
-Hod
gkin
lym
phom
a3.4
3.2
3.4
3.5
4.0
4.1
4.4
4.4
4.4
4.8
5.1
5.2
5.6
5.6
4.5
a)
Mul
tiple
mye
lom
a0.8
0.8
0.9
0.8
1.0
1.0
1.2
1.1
1.2
1.2
1.2
1.3
1.1
1.4
4.1
a)
Leuk
emia
3.9
3.8
4.1
4.0
4.1
4.1
4.0
4.4
4.2
4.3
4.2
4.1
4.5
4.1
0.7a)
Oth
er an
d ill
-def
ined
11.8
11.5
11.8
11.5
12.8
13.1
13.9
14.1
14.8
15.0
14.9
15.7
16.0
15.7
2.9a)
Tables 5-7. The incidence for all sites combined increased by3.3% per year (1.5% in males, 5.3% in females) from 1999 to2012. The increase in cancer incidence is also illustrated inFig. 1.
The incidence rates for colorectal and thyroid cancers havecontinued to increase in both sexes, as have those for prostatecancer in males and breast cancer in females (Fig. 2). In contrast, the incidences of liver cancer in both sexes, lungcancer in males, and cervical cancer in females have decreased. Notably, thyroid cancer increased rapidly, by22.3% per year in both sexes, and has been the most commoncancer since 2009. Improvements in the sensitivity of diag-nostic techniques for thyroid cancer, such as the advent ofultrasound and fine-needle aspiration, have enabled detec-tion of small-sized thyroid cancers, and screening rates haveincreased. Therefore, the increased incidence of thyroid cancer might reflect the identification of previously unde-tected diseases rather than a true increase in the occurrenceof thyroid cancer [13-16]. In addition, due to the constructionof a 1999-2012 KNCI DB, the completeness of the Korean cancer registry data has shown gradual improvement, andthis may have contributed, in part, to the gradual overall
increases in cancer incidence, particularly among elderly patients.
The incidence of some cancer sites in 2012, including stom-ach, colon and rectum, decreased compared to 2011. How-ever, these trends could be causes of random error, therefore,these results should be interpreted with caution.
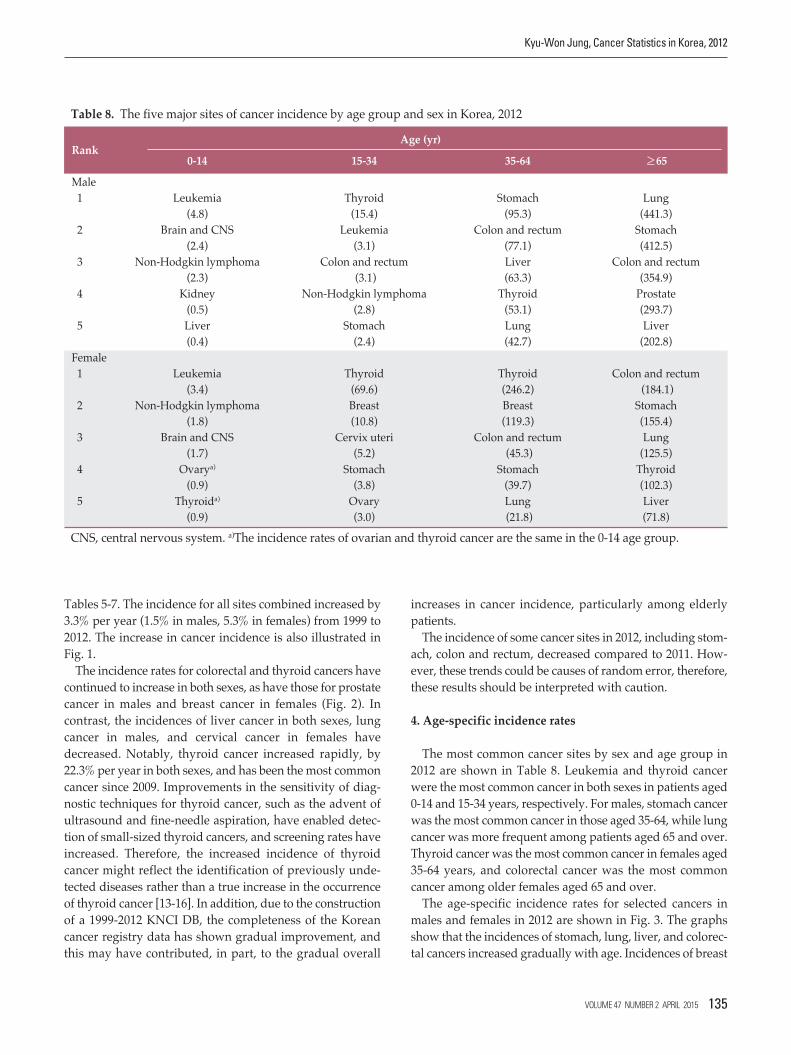
4. Age-specific incidence rates
The most common cancer sites by sex and age group in2012 are shown in Table 8. Leukemia and thyroid cancerwere the most common cancer in both sexes in patients aged0-14 and 15-34 years, respectively. For males, stomach cancerwas the most common cancer in those aged 35-64, while lungcancer was more frequent among patients aged 65 and over.Thyroid cancer was the most common cancer in females aged35-64 years, and colorectal cancer was the most common cancer among older females aged 65 and over.
The age-specific incidence rates for selected cancers inmales and females in 2012 are shown in Fig. 3. The graphsshow that the incidences of stomach, lung, liver, and colorec-tal cancers increased gradually with age. Incidences of breast
Kyu-Won Jung, Cancer Statistics in Korea, 2012
RankAge (yr)
0-14 15-34 35-64 ≥65
Male1 Leukemia Thyroid Stomach Lung
(4.8) (15.4) (95.3) (441.3)2 Brain and CNS Leukemia Colon and rectum Stomach
(2.4) (3.1) (77.1) (412.5)3 Non-Hodgkin lymphoma Colon and rectum Liver Colon and rectum
(0.9) (3.0) (21.8) (71.8)CNS, central nervous system. a)The incidence rates of ovarian and thyroid cancer are the same in the 0-14 age group.
Table 8. The five major sites of cancer incidence by age group and sex in Korea, 2012
VOLUME 47 NUMBER 2 APRIL 2015 135
and thyroid cancers in females were highest among patientsin their late 40s and early 50s, respectively, and leveled offthereafter. The age-specific pattern of breast cancer is differ-ent from those in Western countries [17].
5. Trends in cancer mortality
The trends in cancer deaths for all sites combined and forselected sites are shown in Figs. 1 and 4. ASRs of mortalityfor all sites combined decreased by 2.7% per year in both
sexes since 2002. Lung cancer surpassed stomach cancer asthe leading cause of cancer death in 1999 and is expected toaccount for 22.6% of all cancer deaths in 2012. However, theASRs of mortality due to lung cancer have decreased slightlyin both males and females since 2002. The ASRs of mortalitydue to stomach and cervical cancers have also shown a continuous decrease. Along with significant increases inprostate and female breast cancer incidence rates, mortalityrates of these cancers have also continued to increase.
Cancer Res Treat. 2015;47(2):127-141
136 CANCER RESEARCH AND TREATMENT
StomachColon and rectumLiverLungBreastCervix uteriThyroid
StomachColon and rectumLiverLungProstateThyroid
800
700
600
500
400
300
200
100
0
00-04
05-09
10-14
15-19
20-24
25-29
30-34
35-39
40-44
45-49
50-54
55-59
60-64
65-69
70-74
75-79
80-84 85
!
Age-
spec
ific
rate
per
100,0
00
Age group (yr)
A350
300
250
200
150
100
50
0
00-04
05-09
10-14
15-19
20-24
25-29
30-34
35-39
40-44
45-49
50-54
55-59
60-64
65-69
70-74
75-79
80-84 85
!
Age-
spec
ific
rate
per
100,0
00
Age group (yr)
B
Fig. 3. Age-specific incidence rates of major cancers for 2012 in Korea. (A) Male. (B) Female.
BStomachColon and rectumLiverLungBreastCervix uteriThyroid
StomachColon and rectumLiverLungProstateThyroid
Fig. 4. Annual age-standardized cancer mortalities of selected cancers by sex from 1983 to 2012 in Korea. Age standardizationwas based on the world standard population. (A) Male. (B) Female.
Fig. 5. Trends in relative survival by year of diagnosis from 1999 to 2012. (A) All sites for both sexes. (B) All sites except thyroid cancer for both sexes.
Non-Hodgkin
lymphoma
Thyroid
Stomach
Colon and rectum
Breast
Lung
Liver
Prostate
Cervix uteri
Non-Hodgkin lymphoma
Kidney
0 40,000 80,000 120,000 160,000 200,000 240,000
Under 1 yr
1-2 yr
2-5 yr
5-14 yr
Total
43,791
40,697
94,531
79,776
258,795
27,781
25,167
59,471
94,726
207,145
26,663
23,559
53,285
69,952
173,459
16,384
15,584
37,689
62,482
132,139
15,297
9,366
14,411
14,406
53,480
11,531
8,198
15,698
15,975
51,402
8,976
8,329
17,976
13,726
49,007
3,430
3,314
9,384
27,395
43,523
3,893
3,261
7,487
11,785
26,426
3,841
3,387
7,948
10,839
26,015
196,987
167,992
377,010
492,890
1,234,879
280,000
Thyroid StomachColon and
rectumBreast
Cancer prevalent cases
Lung Liver Cervix uteriProstate KidneyAll
cancers
Fig. 6. Prevalence of major cancer sites by time since diagnosis on January 1, 2013 in Korea.
Kyu-Won Jung, Cancer Statistics in Korea, 2012
6. Survival rates
The trends in relative survival for all sites combinedamong both sexes by year of diagnosis from 1999 to 2012 areshown in Fig. 5. The relative survival for all sites combinedincreased with year of diagnosis, and also increased whenwe excluded thyroid cancer cases in our analysis.
Table 9 shows the 5-year relative survival rates for four diagnosis periods: 1993-1995, 1996-2000, 2001-2005, and 2008-2012. The 5-year relative survival rate of patients diagnosedwith cancer in the most recent period (2008-2012) was 68.1%for all sites combined in both sexes (59.6% in males and 76.6%in females). When compared with earlier periods, notable improvements in the 5-year relative survival rates were observed for all sites combined. The higher cancer survival
rate in females might be explained in part by cancers common in females (e.g., thyroid and breast cancers) having relatively good prognoses.
When examined by year of diagnosis and cancer site, the5-year relative survival rates appeared to be higher for mostmajor cancers in patients diagnosed from 2008 to 2012 compared with those diagnosed from 1993 to 1995, with theexception of pancreatic cancer. The greatest improvementswere seen in cancers of the prostate, stomach, leukemia,lip/oral cavity/pharynx, and non-Hodgkin lymphoma. Theimproving survival rates could be attributable to early detec-tion and improved treatments [18,19]; however, this requiresfurther evaluation. Only pancreatic cancer showed no improvement in 5-year relative survival rate compared with 1993-1995. A lack of progress in early detection and
Crude prevalence rate Age-standardized prevalence rateSite/Type per 100,000a) per 100,000b)
CNS, central nervous system. a)Crude prevalence rate: number of prevalent cases divided by the corresponding person-yearsof observation; Prevalent cases were defined as patients who were diagnosed between January 1, 1999 and December 31, 2012and who were alive on January 1, 2013; Multiple primary cancer cases were counted multiple times, b)Age-adjusted using theworld standard population, c)Includes the gallbladder and other/unspecified parts of the biliary tract.
Table 10. Crude and age-standardized rates of cancer prevalence by sex on January 1, 2013 in Korea
VOLUME 47 NUMBER 2 APRIL 2015 139
Cancer Res Treat. 2015;47(2):127-141
140 CANCER RESEARCH AND TREATMENT
treatment could explain the observed absence of improve-ment in the survival rate for pancreatic cancer [20].
7. Prevalence rates
The cancer prevalence rates by sex and cancer site on January 1, 2013 in Korea are shown in Table 10. The CRs per100,000 of cancer prevalence for all sites combined were2,175.0 and 2,730.9 in males and females, respectively, and the ASRs per 100,000 of cancer prevalence for all sitescombined were 1,592.2 and 1,788.0 in males and females, respectively. In males, the five leading primary sites of cancerfor prevalence were stomach (CR, 546.5; ASR, 391.3), colonand rectum (CR, 410.9; ASR, 296.6), prostate (CR, 194.6; ASR,141.6), thyroid (CR, 162.5; ASR, 114.8), and liver (CR, 152.6;ASR, 109.7), which together accounted for 67.4% of all preva-lent cancer cases. In females, the most common cancer sitewas thyroid (CR, 866.0; ASR, 600.7), followed by breast (CR,523.0; ASR, 346.7), colon and rectum (CR, 278.1; ASR, 161.8),stomach (CR, 276.2; ASR, 162.9), and cervix uteri (CR, 173.0;ASR, 111.7), which together accounted for 77.5% of all preva-lent cancer cases.
The prevalence by time since diagnosis is shown in Fig. 6.For all cancers combined, the 2-year prevalence constituted29.6% of all prevalent cases. The 2-year prevalence, as a percentage of the total prevalence, was highest for thyroid(23.1%), followed by stomach (14.5%) and colon and rectum(13.8%), which had high incidence rates and good prognoses.
For all cancers combined in both sexes, the 2-5-year and > 5-year prevalences accounted for 30.5% and 39.9% of thetotal prevalence, respectively. The long-term prevalences for lung and liver cancers were relatively low due to low survival rates of lung and liver cancer patients.
Conflicts of Interest
Conflict of interest relevant to this article was not reported.
Acknowledgments
This work was supported by a research grant from the National Cancer Center (No. 1310220), Republic of Korea.The authors are indebted to Korea Central Cancer Registry(KCCR)-affiliated hospitals, non-KCCR-affiliated hospitals,11 regional cancer registries (the Busan, Daegu and Gyeong-buk, Gwangju and Jeonnam, Incheon, Daejeon, Ulsan, Gang-won, Chungbuk, Jeonbuk, Gyeongnam and Jejudo cancerregistries), the National Health Insurance Service and Statis-tics Korea for data collection.
1. Statistics Korea [Internet]. Daejeon: Statistics Korea; 2014[cited 2014 Jan 4]. Available from: http://kosis.kr.
2. Yoon SJ, Bae SC, Lee SI, Chang H, Jo HS, Sung JH, et al. Meas-uring the burden of disease in Korea. J Korean Med Sci. 2007;22:518-23.
3. Jung KW, Won YJ, Kong HJ, Oh CM, Lee DH, Lee JS. Cancerstatistics in Korea: incidence, mortality, survival, and preva-lence in 2011. Cancer Res Treat. 2014;46:109-23.
4. Shin HR, Won YJ, Jung KW, Kong HJ, Yim SH, Lee JK, et al.Nationwide cancer incidence in Korea, 1999~2001; first resultusing the national cancer incidence database. Cancer ResTreat. 2005;37:325-31.
5. Ajiki W, Tsukuma H, Oshima A. Index for evaluating com-pleteness of registration in population-based cancer registriesand estimation of registration rate at the Osaka Cancer Registry between 1966 and 1992 using this index. NihonKoshu Eisei Zasshi. 1998;45:1011-7.
6. Fritz A, Percy C, Jack A, Shanmugaratnam K, Sobin L, ParkinDM, et al. International classification of diseases for oncology.3rd ed. Geneva: World Health Organization; 2000.
7. World Health Organization. International statistical classifi-cation of diseases and related health problems. 10th rev.Geneva: World Health Organization; 1994.
8. Segi M. Cancer mortality for selected sites in 24 countries(1950-1957). Sendai: Tohoku University School of Medicine;1960.
9. Howlader N, Noone A, Krapcho M, Garshell J, Neyman N,Altekruse SF, et al. SEER cancer statistics review, 1975-2010.Bethesda, MD: National Cancer Institute; 2013.
10. National Cancer Institute. SEER*Stat Program, version 6.6.1[Internet]. Bethesda, MD: National Cancer Institute; 2013 [cited2013 Jan 4]. Available from: http://seer.cancer.gov/seerstat/.
11. Ederer F, Heise H. Instructions to IBM 650 programmers inprocessing survival computations. Methodological note. No.10. Bethesda, MD: National Cancer Institute; 1959.
12. Paul Dickman [Internet]. Stockholm: PaulDickman.com; 2014[cited 2014 Jan 14]. Available from: http//www.pauldickman.com.
13. Davies L, Welch HG. Increasing incidence of thyroid cancerin the United States, 1973-2002. JAMA. 2006;295:2164-7.
References
Kyu-Won Jung, Cancer Statistics in Korea, 2012
14. Enewold L, Zhu K, Ron E, Marrogi AJ, Stojadinovic A, PeoplesGE, et al. Rising thyroid cancer incidence in the United Statesby demographic and tumor characteristics, 1980-2005. CancerEpidemiol Biomarkers Prev. 2009;18:784-91.
15. Han MA, Choi KS, Lee HY, Kim Y, Jun JK, Park EC. Currentstatus of thyroid cancer screening in Korea: results from a nationwide interview survey. Asian Pac J Cancer Prev. 2011;12:1657-63.
16. Kim SY. Study to provide evidence of health screening servicefor thyroid cancer. Seoul: National Evidence-based HealthcareCollaborating Agency; 2012.
B, Pineros M, et al. Cancer incidence in five continents. Vol. 10(electronic version). Lyon: IARC Press; 2013.
18. Jung KW, Yim SH, Kong HJ, Hwang SY, Won YJ, Lee JK, et al.Cancer survival in Korea 1993-2002: a population-based study.J Korean Med Sci. 2007;22 Suppl:S5-10.
19. Gondos A, Bray F, Hakulinen T, Brenner H; EUNICE SurvivalWorking Group. Trends in cancer survival in 11 Europeanpopulations from 1990 to 2009: a model-based analysis. AnnOncol. 2009;20:564-73.
20. Dickman PW, Adami HO. Interpreting trends in cancer patient survival. J Intern Med. 2006;260:103-17.