+ All Categories
Home > Documents > Cane Run Watershed Council Meeting - University of Kentucky · 11/28/2011  · Update of UK Project...

Cane Run Watershed Council Meeting - University of Kentucky · 11/28/2011  · Update of UK Project...

Date post: 23-Jun-2020
Category:
Upload: others
View: 3 times
Download: 0 times
Share this document with a friend
56
Cane Run Watershed Council Meeting Monday, November 28, 2011 Northside Public Library, Lexington, KY Ben Krebs Lindell Ormsbee Ben Albritton Sarah Wightman Beth Finzer Amanda Gumbert Russ Turpin Charlie Denham Susan Byars Stephanie Jenkins Ernest Collins Sarah Gracey Angie Wingfield Tom Blues Jennifer Myatt Cindy King Update of UK Project (Amanda Gumbert) The watershed-based plan has been conditionally accepted and will be returned to DOW with changes in a few days, which means implementation can begin next year. BMP implementation is planned at the Kentucky Horse Park for the next year. o UK BAE senior design students are studying areas with erosion and nutrient-transfer problems for possible implementation. Education and outreach efforts will continue next year. o Watershed festivals? Other watersheds are doing small ice cream social-type events Amanda is in favor of these events, but it is unknown right now how the council will proceed with those. November 5 th tree-planting at Lexmark as part of a CSX program Legacy Trail Adopt-A-Plot (Susan/group discussion) The group did not come to total agreement, and we have exchanged information with Keith. Amanda did not want to commit herself and the whole group without agreement. Right now, the council has expressed interest, but has never confirmed participation. Discussion o Maintenance expectations A couple times of year in terms of maintenance
Transcript

Cane Run Watershed Council Meeting Monday, November 28, 2011

Northside Public Library, Lexington, KY

Ben Krebs

Lindell Ormsbee

Ben Albritton

Sarah Wightman

Beth Finzer

Amanda Gumbert

Russ Turpin

Charlie Denham

Susan Byars

Stephanie Jenkins

Ernest Collins

Sarah Gracey

Angie Wingfield

Tom Blues

Jennifer Myatt

Cindy King

Update of UK Project (Amanda Gumbert)

The watershed-based plan has been conditionally accepted and will be returned to DOW with

changes in a few days, which means implementation can begin next year.

BMP implementation is planned at the Kentucky Horse Park for the next year.

o UK BAE senior design students are studying areas with erosion and nutrient-transfer

problems for possible implementation.

Education and outreach efforts will continue next year.

o Watershed festivals?

Other watersheds are doing small ice cream social-type events

Amanda is in favor of these events, but it is unknown right now how the

council will proceed with those.

November 5th tree-planting at Lexmark as part of a CSX program

Legacy Trail Adopt-A-Plot (Susan/group discussion)

The group did not come to total agreement, and we have exchanged information with Keith.

Amanda did not want to commit herself and the whole group without agreement.

Right now, the council has expressed interest, but has never confirmed participation.

Discussion

o Maintenance expectations

A couple times of year in terms of maintenance

Weed and mulch beds, report vandalism, remove debris, etc. – Russ

Keith made it sound low input

How do we get mulch in? – Susan

How much work is it really?

Doodle poll to figure out when the best times for people to gather to care for the

plot – Sarah G.

o Plot size/location

How big are the plots?

Near Spindletop, get the neighborhood involved - Susan

o Benefits to the group/watershed

Good way to get publicity for the council

Lexmark had also expressed interest in adopting a plot near their property

Is pulling weeds an appropriate thing for the council? – Charlie

Maybe our function is best served elsewhere, but our name could get out there on

the Legacy Trail

Tie adopting a plot to a watershed festival - Stephanie

Tie service piece to a festival

Work with Master Gardeners in the watershed – Stephanie

Maybe not adopt a bed, but get together and remove bush honeysuckle - Russ

o Going forward

Susan will ask others in the Spindletop neighborhood and see if there’s interest

The council could try it for a year, and not renew if it didn’t work out - Amanda

Keith has our name, but we have not been assigned a plot yet - Ben

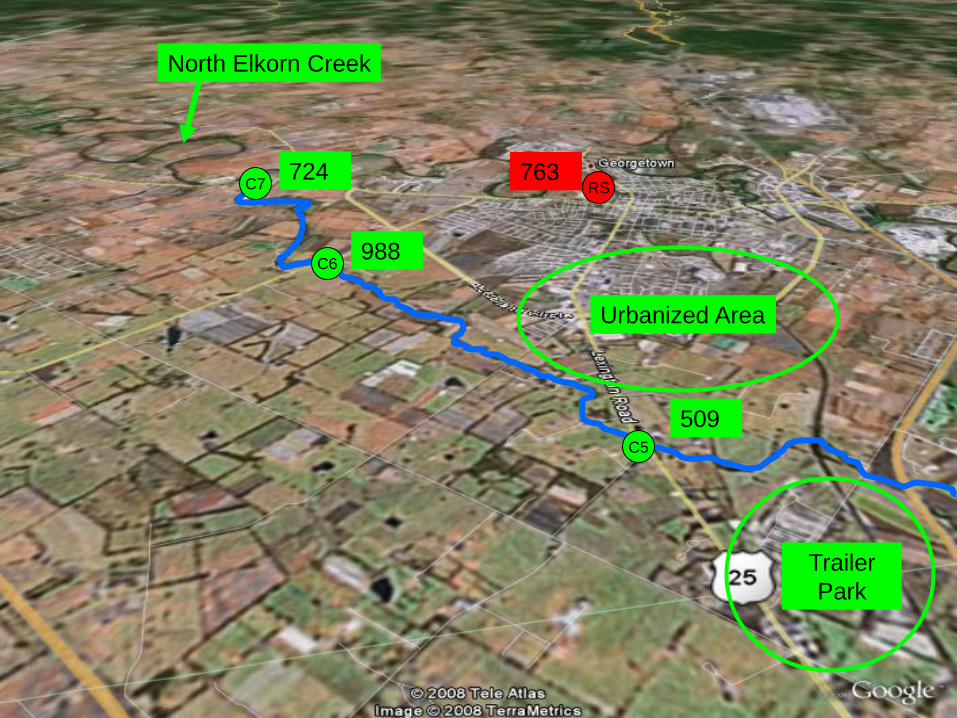
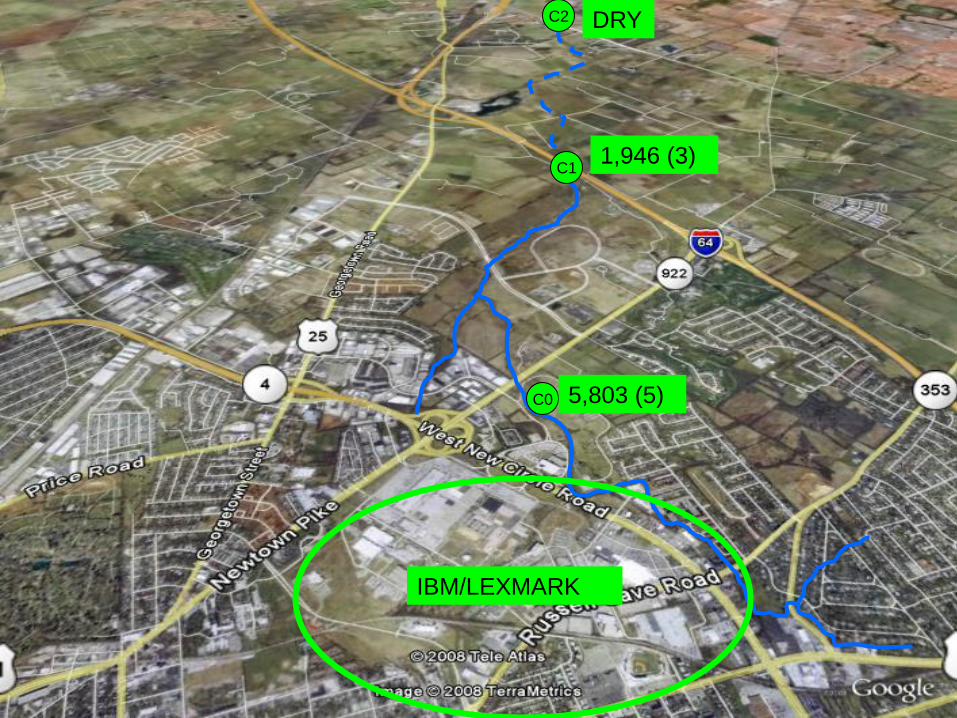
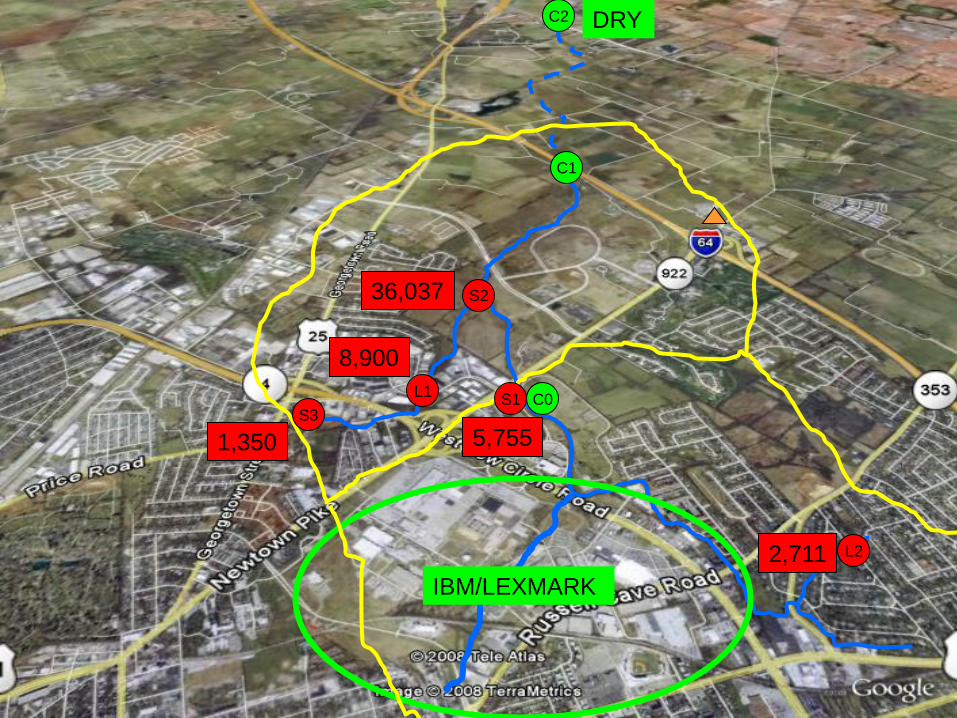
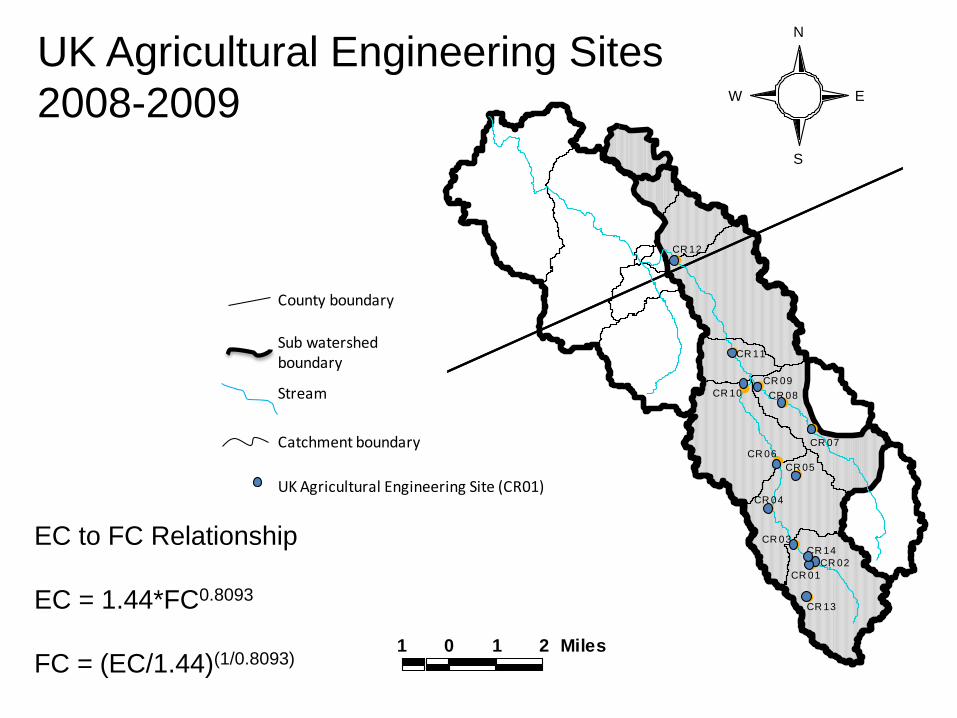
Pathogen TMDL Update (Lindell Ormsbee)

See attached PowerPoint for information

Pathogen TMDL Development Cane Run Watershed

Lindell Ormsbee, P.E., P.H., Ph.D., D.WRE, F.ASCE

Ben Albritton

What is a TMDL? • Number

– T. - Total – M. - Maximum – D. - Daily – L. - Load

• Document that contains a description of the problem, data, and calculations used to determine the TMDL, existing loads, load allocations, load reductions, and Imp. Plans.

• Process for restoring polluted waters by determining loads reductions for various point and non-point sources that if implemented should restore the stream to its designated use.

• Analysis to determine the TMDL.

Non-Permitted SourcesPermitted Sources

KPDES

Point

Sources

MS4

Sources

Non-MS4

Sources

Illegal Point

Sources

Non

Developed

Land

Developed

Land

Wasteload Allocation Load AllocationMOS

TMDL

Developed

Land

TMDL Components

TMDL Process

WQ Regs.

Monitoring

Assessment

305 (b) Reporting

303 (d) Listing

TMDL Scheduling

Model Selection

Data Collection

Analysis

Prelim Report

Agency Review

Public Comment

Final Report

Implementation

Monitoring

Designated Uses

• Every stream in Kentucky is assigned multiple designated uses: – Warm Water Aquatic Life

– Primary Contact Recreation

– Secondary Contact Recreation

– Drinking Water Supply

– Cold Water Aquatic Life

– Fish Consumption

Primary Contact Standards

• (a) Fecal coliform content or Escherichia coli content shall not exceed 200 colonies per 100 ml or

130 colonies per 100 ml respectively as a geometric

mean based on not less than five (5) samples taken

during a thirty (30) day period. Content also shall not

exceed 400 colonies per 100 ml in twenty (20)

percent or more of all samples taken during a thirty

(30) day period for fecal coliform or 240 colonies per

100 ml for Escherichia coli. These limits shall be

applicable during the recreation season of May 1

through October 31. Fecal coliform criteria listed in

subsection (2)(a) of this section shall apply during

the remainder of the year.

Secondary Contact Standards

• (a) Fecal coliform content shall not

exceed 1,000 colonies per 100 ml as a

thirty (30) day geometric mean based on

not less than five (5) samples; nor exceed

2,000 colonies per 100 ml in twenty (20)

percent or more of all samples taken

during a thirty (30) day period.

• Geometric Mean:

GM = X1*X2*…*Xn

n

2010 303(d) List of Cane Run

Creek Impaired Segments

Stream

Impaire

d

Segment

County Impairment Pollutant Potential Sources

Cane Run of

North Elkhorn

Creek

0.0 - 3.0 Scott Aquatic Life (NS), Primary

Contact Recreation (NS) Fecal Coliform Nonpoint Source Pollution

Cane Run of

North Elkhorn

Creek

3.0 - 9.6 Scott

Aquatic Life (NS), Primary

Contact

Recreation (NS)

Fecal Coliform

Point Source Pollution,

Nonpoint Source Pollution

Cane Run of

North Elkhorn

Creek

9.6 - 17.4 Fayette

Aquatic Life (NS), Primary

Contact Recreation (NS) &

Secondary Contact

Recreation (NS)

Fecal Coliform SSOs, Urban Stormwater

1 0 1 2 Miles

S

N

EW

County boundary

Sub watershedboundary

Stream

Catchment boundary

Impaired Stream Mile 3 to 6.72

Interstate Highway

Impaired Stream mile 6.72 to 9.6

Royal Springs watershed

Impaired Stream mile 9.6 to 17.4

I-64

New Circle Road

I-64/I-75

I-75

RM 3.0

RM 6.72

RM 9.6

Impaired Stream Mile 0 to 3

1 0 1 2 Miles

S

N

EW

Consol_1.shp

Rs-canerun.shp

Rs_only.shp

Lowercanerun.shpStream_connected.shp

Canerun.shp

Counties.shp

Roads.shp

Lower Cane Run

Royal Springs Intermittent Flow

Royal Springs Only

Interstate Highway

Stream

Catchment boundary

I-64

New Circle Road I-64/I-75

I-75

L6

L5

L4 L3

K3

U8

U7

U6

U5

U3

U2

U1

U4

K2

K1

L2

L1

KPDES Facility

1

2

3

Catchment IDU1

Permitted

Discharges

$$

$$

$

$$

$$$$$$

#S

$$

$

$

$$

$#S

#S

$$$$$$

$

$$

$

$$$

$

#S

#S

#S

$$

$

#S

$

$$

$

$$ $

#S#S

1 0 1 2 Miles

S

N

EW

Stream

Sub watershed Boundary

Pump Station

Manhole

Illicit

Discharges

in 2007

Karst in Kentucky: 55 percent of the state has potential

for karst

Cane Run Watershed

45 Square Miles

Georgetown Kentucky

Lexington Kentucky

#

#

Canerun Catchments

Royal Spring (Karst Groundwater Basin)

Groundwater Dye Trace Vector

# C2 ( USGS station, 03288200)

# Royal Spring (USGS Stat ion 03288110)

Sinkholes in Royal Springs Groundwater Basin

0.8 0 0.8 Miles

S

N

EW

#

#

Canerun Catchments

Royal Spring (Karst Groundwater Basin)

Groundwater Dye Trace Vector

# C2 ( USGS station, 03288200)

# Royal Spring (USGS Stat ion 03288110)

Sinkholes in Royal Springs Groundwater Basin

0.8 0 0.8 Miles

S

N

EW

L6

L5

K3 U8

U7

U6

U5

U3

U2

U1

U4

K2

K1

L2

L1

U1 Catchment ID

L3

L4

2

1

1

2

3

#

#

Canerun Catchments

Royal Spring (Karst Groundwater Basin)

Groundwater Dye Trace Vector

# C2 ( USGS station, 03288200)

# Royal Spring (USGS Stat ion 03288110)

Sinkholes in Royal Springs Groundwater Basin

0.8 0 0.8 Miles

S

N

EW

#

#

Canerun Catchments

Royal Spring (Karst Groundwater Basin)

Groundwater Dye Trace Vector

# C2 ( USGS station, 03288200)

# Royal Spring (USGS Stat ion 03288110)

Sinkholes in Royal Springs Groundwater Basin

0.8 0 0.8 Miles

S

N

EW

2

1

1

2

3

03288100)3 North Elkhorn Station (USGS 03288100)

#

#

Canerun Catchments

Royal Spring (Karst Groundwater Basin)

Groundwater Dye Trace Vector

# C2 ( USGS station, 03288200)

# Royal Spring (USGS Stat ion 03288110)

Sinkholes in Royal Springs Groundwater Basin

0.8 0 0.8 Miles

S

N

EW

#

#

Canerun Catchments

Royal Spring (Karst Groundwater Basin)

Groundwater Dye Trace Vector

# C2 ( USGS station, 03288200)

# Royal Spring (USGS Stat ion 03288110)

Sinkholes in Royal Springs Groundwater Basin

0.8 0 0.8 Miles

S

N

EW

2

1

1

2

Karst

Features

C2

C2

C2

RS

C2

C2

RS

RS

C2

#

#

#

####

#

####

#

#

#

###

###

##

#

#

#

###

##

####

##

##

############

#

#

#

#

###

$T

$T

$T$T

$T

$T$T$T

$T

$T

$T

$T

$T

$T

$T

$T

20

2 Miles

N

EW

S

Sanitary Sewer

Overflow Locations

Pump Station

Forced Main Line

Cane Run Trunk

Line

C6

C7

C5

C4

C3

C2

C0

C1

2002 Sample Results

Fecal Coliforms (col/100 ml)

FC Geomeans

0

1000

2000

3000

4000

5000

6000

7000

C0 C1 C3 C4 C5 C6 C7

Site

Fecal

Geo

mean

(cfu

/100 m

l)

2002

FC Geomeans (Wet Days)

0

1000

2000

3000

4000

5000

6000

7000

C0 C1 C2 C3 C4 C5 C6 C7

Site

Fecal

Geo

mean

(cfu

/100 m

l)

2002

FC Geomeans (Dry Days)

0

1000

2000

3000

4000

5000

6000

7000

C0 C1 C2 C3 C4 C5 C6 C7

Site

Fecal

Geo

mean

(cfu

/100 m

l)

2002

C5

C6

C7 724

988

509

North Elkorn Creek

Urbanized Area

Trailer

Park

763 RS

C1

C0

C2 DRY

1,946 (3)

5,803 (5)

IBM/LEXMARK

LFUCG Water Quality

Monitoring Stations

Station ID Station Description Sampling Dates Fecal

Geometric

Mean

Cfu/100 ml

CR-L1 Nandino Blvd Dec-01 to Apr 02 8,900

CR-L2 Silver Lane Nov-01 to Dec-01 2,711

CR-S1 Lexmark May-96 to Jun-02 5,755

CR-S2 Cold Stream Farm May-96 to Oct-96 36,037

CR-S3 US-25 May-98 to Nov-03 1,350

L2

C1

S2

L1 C0

C2 DRY

S1

IBM/LEXMARK

S3

2,711

36,037

1,350

8,900

5,755

##

#

#

##

#

###

#

#

#

#CR 01

CR 03

CR 04

CR 05

CR 06CR 07

CR 08

CR 09

CR 10

CR 11

CR 12

CR 13

CR 02

CR 14

1 0 1 2 Miles

S

N

EW

UK Agricultural Engineering Site (CR01)

County boundary

Sub watershedboundary

Stream

Catchment boundary

EC to FC Relationship

EC = 1.44*FC0.8093

FC = (EC/1.44)(1/0.8093)

UK Agricultural Engineering Sites

2008-2009

Station ID Station Description E. Coli Geometric

Mean cfu/100 ml)

Approximate Fecal

Coliform

Equivalence (cfu/100

ml)

CR01 Lexmark Park West 2970 12456

CR02 Lexmark Park East 5223 25022

CR03 Newtown Pike 3076 13008

CR04 Highlands 7003 35949

CR05 Coldstream Park 887 2798

CR06 UK Farm South I-75 3708 16386

CR07 UK Farm below Fasig-Tipton 1769 6566

CR08 UK Farm 1075 3548

CR09 UK Farm below Lake 716 2148

CR10 UK Farm above Confluence 630 1834

CR11 Berea Road 431 1147

CR12 Lisle Road 410 1078

CR13 Loudon Avenue 10760 61119

CR14 Lexmark below Subdivision 1199 4061

C4

C5

C1

KY Horse Park

UK Research Farm

C3

C2

CR12

CR11

CR10 CR09

CR07

CR06

CR08

410

431

630 716

1,075

1,769 3,708

C1

C0

C2

IBM/LEXMARK

CR06

CR04

CR03

CR05

887

3708

7,003

3,076

L2

C1

S2

L1 C0

C2

S1

CR04

CR03

IBM/LEXMARK

CR14

CR02

CR01

CR13

S3

2,970

3,076

7,003

1,199

5,223

10,760

Calculating the TMDL

• In order to determine the TMDL for a given

stream, we typically use a computer model

of a watershed.

• A watershed computer model is very

similar to a check book register. Instead

keeping track dollars and cents it keeps

track of the balance of flows and pollutant

loads for each day.

Computer Watershed Model

Balance

Date Transaction Item Deposit/Credit Payment/Debit $1,000.00

July 1 Check 101 for phone bill $100.00 $900.00

Travel reimbursement $50.00 $950.00

July 2 Check 102 for groceries $75.00 $875.00

July 3 Auto insurance bank draft $100.00 $775.00

Birthday check $25.00 $800.00

Water

storage

(acre*ft)

Date Event

Rainfall

(ac.ft/day)

Stream Flow

(ac.ft/day) 1000.00

July 1 Flow exits watershed 100.00 900.00

Rainfall on watershed 50.00 950.00

July 2 Flow exits watershed 75.00 875.00

July 3 Flow exits watershed 100.00 775.00

Rainfall on watershed 25.00 800.00

Computer Watershed Model Pollutant

storage on

land (g)

Date Event Mass IN (grams)

Mass OUT

(grams) 2000.00

July 1 Mass leaving land by washoff 300.00 1700.00

Mass entering land by deposition 50.00 1750.00

July 2 Mass entering land by deposition 50.00 1800.00

July 3 Mass leaving land by washoff 200.00 1600.00

Mass entering land by deposition 50.00 1650.00

Pollutant

storage in

reach (g)

Date Event Mass IN (grams)

Mass OUT

(grams) 500.00

July 1 Mass leaving reach by flow 250.00 250.00

Mass entering reach by washoff 300.00 550.00

July 2 Mass leaving reach by flow 350.00 200.00

July 3 Mass leaving reach by flow 50.00 150.00

Mass entering reach by washoff 200.00 350.00

Watershed Model Calibration/Validation

Model Calibration Model Validation

0

200

400

600

800

1000

1200

1400

1600

1800

1/1/2004 3/1/2004 5/1/2004 7/1/2004 9/1/2004 11/1/2004

Year

Flo

w (

cfs

)

Observed SimulatedCalibration Results at

Royals Spring Station

0.01

0.1

1

10

100

1000

10000

0.01 0.10 1.00 10.00 100.00

Stre

am F

low

in c

fs

Percent Chance Exceeded

Observed Flow (cfs) Simulated Flow (cfs)

-20

-15

-10

-5

0

5

10

15

20

1998 1999 2000 2001 2002 2003 2004 2005 2006 2007

% D

evi

atio

n

Year

Flow Calibration Results at

Outlet of Cane Run

1

10

100

1000

10000

100000

1000000

10000000

6/1

1/2

00

8

7/1

1/2

00

8

8/1

1/2

00

8

9/1

1/2

00

8

10

/11

/20

08

11

/11

/20

08

12

/11

/20

08

1/1

1/2

00

9

2/1

1/2

00

9

3/1

1/2

00

9

4/1

1/2

00

9

5/1

1/2

00

9

6/1

1/2

00

9

7/1

1/2

00

9

8/1

1/2

00

9

Simulated

Observed

Upper bound

Lower Bound

1

10

100

1000

10000

100000

1000000

Simulated

Observed

Upper Bound

Lower Bound

C03

C12

Fecal Coliform

Validation Results

UK Ag Stations

Watershed Model

Watershed Model,

e.g. HSPF

1. Start model with existing loads: LOADi

Fecal Coliform Loads

Flows

2. Decrease loads until criteria satisfied: LOADf

3. TMDL = LOADf 4. LR = LOADi - TMDL

Precipitation

Concentrations

Acute Criteria (Geomean)

(200 cfu/100 or 1000 cfu/100)

Chronic Criteria (< 20%)

(400 cfu/100 or 2000 cfu/100)

Non-Permitted SourcesPermitted Sources

KPDES

Point

Sources

MS4

Sources

Non-MS4

Sources

Illegal Point

Sources

Non

Developed

Land

Developed

Land

Wasteload Allocation Load AllocationMOS

TMDL

Developed

Land

TMDL Allocations


Recommended