Cap & Trade Program Options for California and the Region Ned Helme, President Center for Clean Air Policy Second Annual Climate Change Research Conference September 16, 2005 Sacramento, California
Transcript
Cap & Trade Program Options for California and the Region
Ned Helme, PresidentCenter for Clean Air Policy
Second Annual Climate Change Research ConferenceSeptember 16, 2005
Sacramento, California
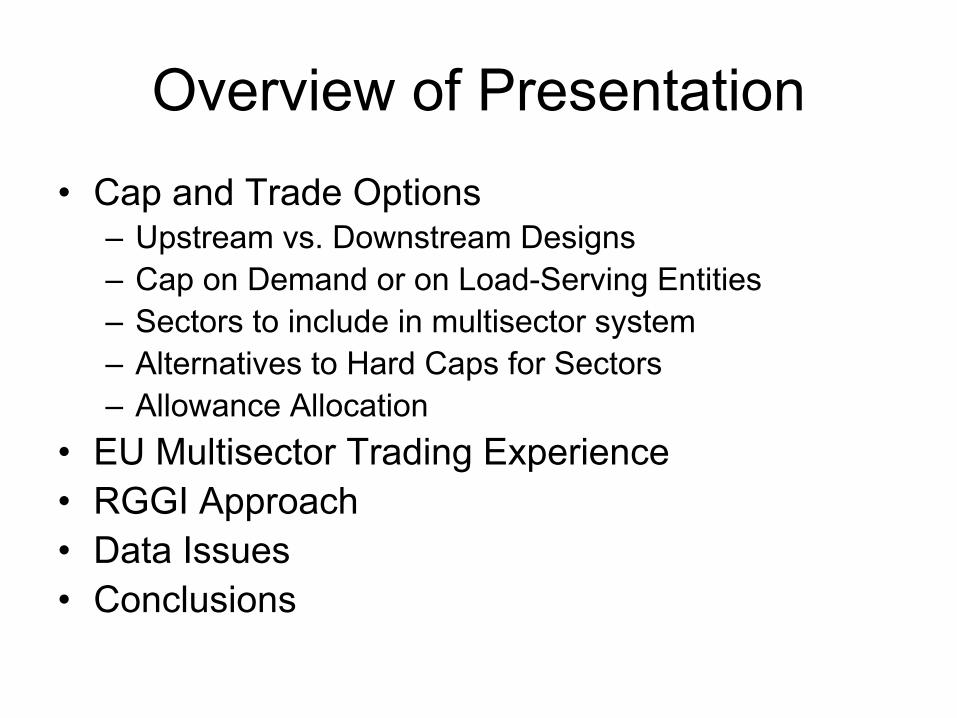
Overview of Presentation• Cap and Trade Options
– Upstream vs. Downstream Designs– Cap on Demand or on Load-Serving Entities– Sectors to include in multisector system– Alternatives to Hard Caps for Sectors– Allowance Allocation
• EU Multisector Trading Experience• RGGI Approach• Data Issues• Conclusions
Cap-and-Trade:Upstream Approach
• Upstream Approach: – Cap at the level of primary fossil fuel distributors – Allowances based on GHG emissions embodied in fuels sold– Designed to send price signals to fossil fuel consumers
• Pros: – Greater Coverage: virtually all fossil fuel use and GHG emissions –
potentially most cost effective approach– Administrative Feasibility: fewer industries and regulated entities
reduce the cost of reporting and data verification • Cons:
– Politically difficult as it looks like an energy tax– Price signal is primary incentive – may not induce sufficient energy
efficiency, fuel switching, and employment of end-use emissions treatment technologies – might need to be coupled with escape valve/price cap to avoid gasoline lines/ public resistance
Cap-and-Trade:Downstream Approach
• Downstream– Cap-and-Trade at the level of fuel users (large point sources)– Allowances for actual GHG emissions (preferred) or fuel used
• Pros:– Could spur greater technical innovation than upstream approach:
more proactive response to direct regulation (downstream) than to price changes (upstream)
– Greater political feasibility: easier to pass legislation covering large point sources rather than an economy-wide bill
– Greater familiarity: almost all existing trading programs have been a downstream model.
• Cons:– Lack of coverage: likely to regulate only larger emitters, not
buildings and vehicles– Greater transaction costs due to larger number of sources
Cap on Demand• Cap applied on load-serving entities instead of
electricity generators.– In-state distributors responsible to meet cap on carbon
content of electricity sold in CA• Pros:
– Cap can ensure emissions do not increase as a result of increased demand for power
– Leakage from outside the region is eliminated – covers emissions impact of CA electricity demand
– Creates incentive for distributors to pursue energy efficiency & renewable investments in CA
• Cons: – Significant challenges to track emissions based on demand– Danger of contract “shuffling” by out-of-state power sellers to
comply w/ CA law w/o making major GHG reductions
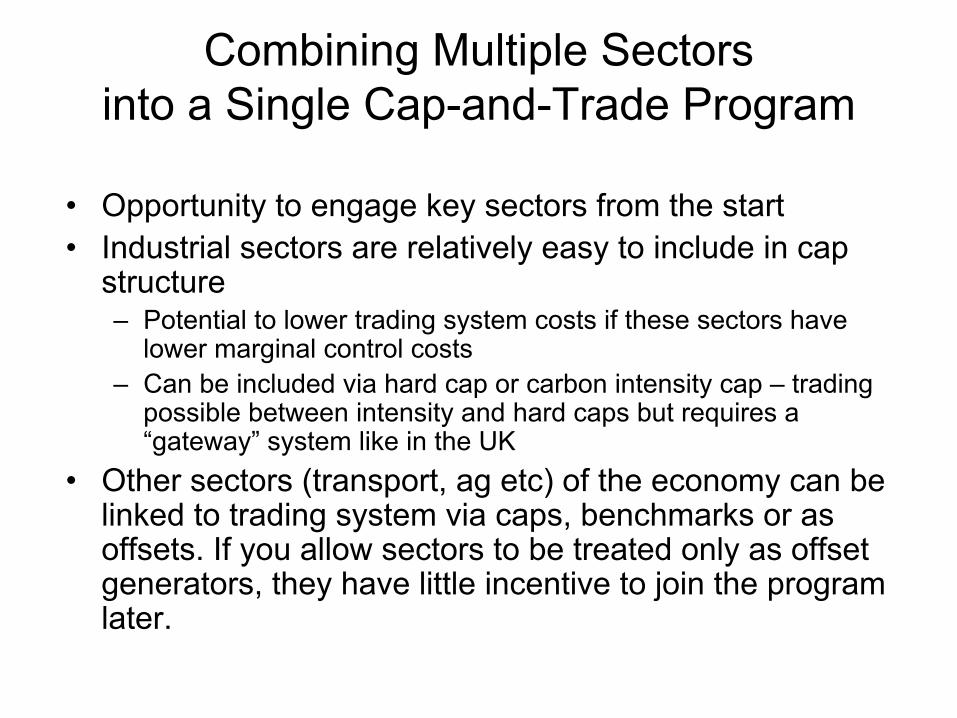
Combining Multiple Sectors into a Single Cap-and-Trade Program
• Opportunity to engage key sectors from the start• Industrial sectors are relatively easy to include in cap
structure– Potential to lower trading system costs if these sectors have
lower marginal control costs– Can be included via hard cap or carbon intensity cap – trading
possible between intensity and hard caps but requires a “gateway” system like in the UK
• Other sectors (transport, ag etc) of the economy can be linked to trading system via caps, benchmarks or as offsets. If you allow sectors to be treated only as offset generators, they have little incentive to join the program later.
Considerations in Choosing Which Sectors to Include
• Effect on competition – avoid sectors w/ many small facilities – can lead to leakage
• Administrative feasibility• Cost effectiveness• Prior existence of policies & measures• Transparency of Monitoring & verification
– process emissions difficult to regulate• Relative political power of sector
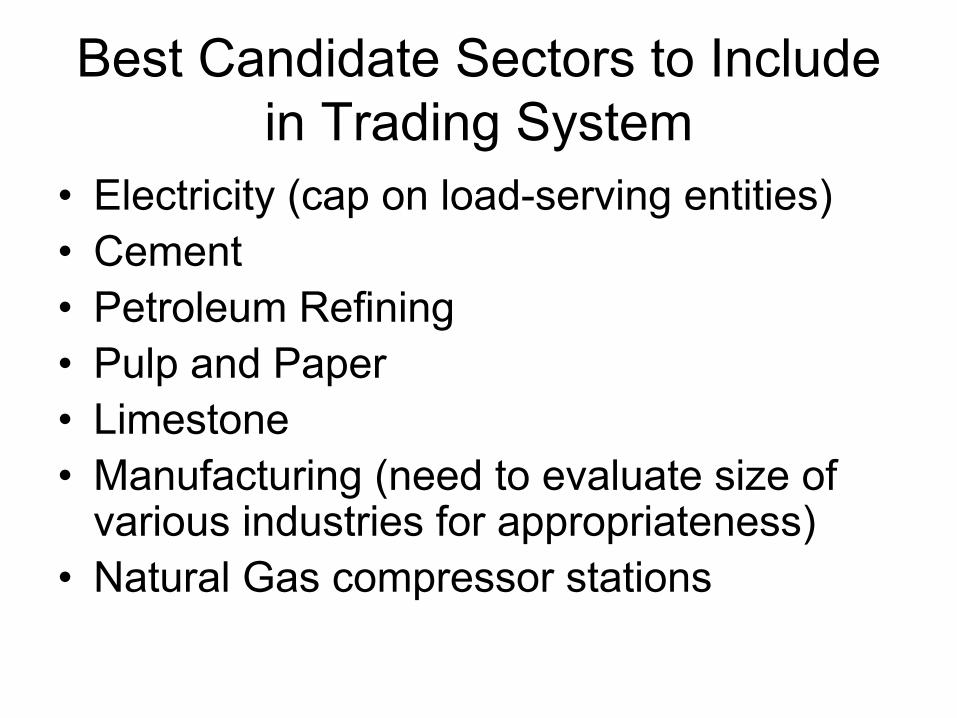
Best Candidate Sectors to Include in Trading System
• Electricity (cap on load-serving entities)• Cement• Petroleum Refining• Pulp and Paper• Limestone• Manufacturing (need to evaluate size of
various industries for appropriateness)• Natural Gas compressor stations
Alternatives to hard cap to manage sectors in trading system
1. Opt-in allowance system – companies in other sectors can elect to take on cap
2. Credit-based system (aka offsets) – Allowances awarded for reductions from baseline or
for carbon sequestered– Can require portion of redux be retired as
contribution toward state target– Ideal where overall emissions are hard to measure
while redux can be measured easily or where politics of inclusion of sector under the cap are problemmatic – e.g. no-till agriculture
Alternatives (continued)
3. No-lose target – company given target annual emissions level
• if it reduces below target level, generates allowances for sale equal to amount by which it is below target – awarded ex post each yr.
• If it misses target, no penalty
Sectors preferred for offsets or hybrid treatment
• Forestry and agricultural sinks• Manure management• Landfill methane recovery• Natural gas system methane leaks (other
than compressor stations)
Some Options for Incorporating Transportation Sector into a Cap-and-Trade Program
• Upstream: fuel producers hold allowances– Achieves broad coverage while imposing minimal
administrative burden– However, there are questions on the effectiveness of price
signals in encouraging technological innovation, or reductions in VMT (in cases where other transport modes are not available)
• Coupled w/ Pavley tailpipe standards this sends both price and regulatory signals to consumers and manufacturers
• BP will argue that Pavley plus carbon intensity regulation of refinery emissions is optimal solution
• Approach does not address aviation, heavy duty vehicles, or smart growth opportunities
Importance of Allowance Allocation
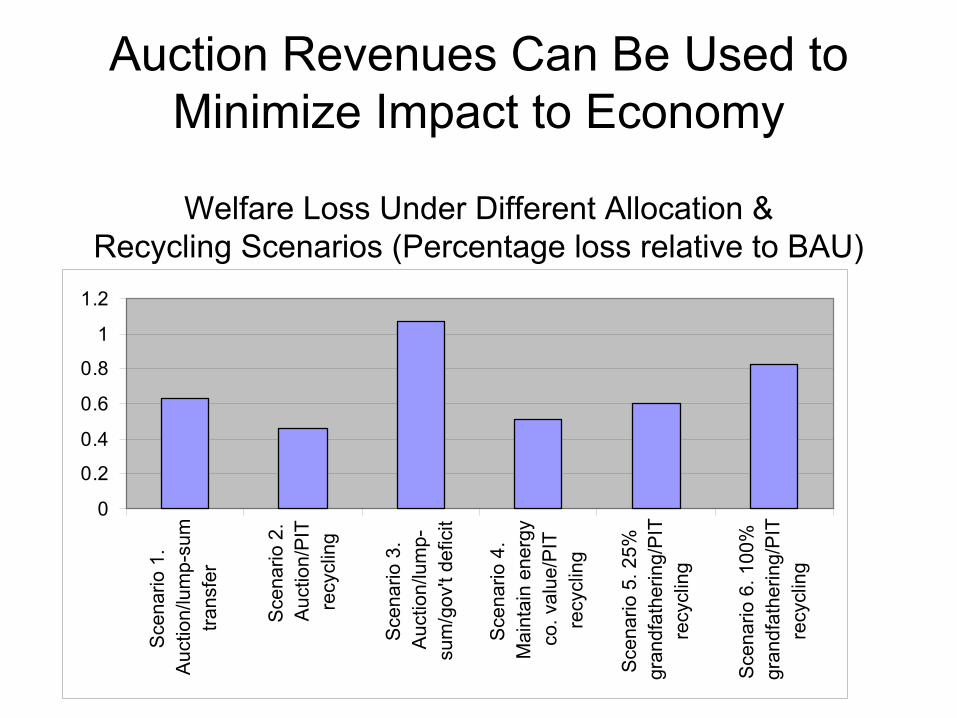
• Method chosen for allowance allocation can impact the equity and total cost to the economy of the trading program.
• CRA Report (2002)– The cost to the economy of a CO2 control program can be cut in
half by auctioning allowances and recycling revenues to maintaingovernment revenues and reduce marginal personal income tax rates in lieu of “grandfathering”.
– Only 9% of total allowances need to be grandfathered to affectedenergy sectors to hold shareholder equity unharmed and achieve 1990 emissions level economy-wide by 2015 in the U.S.
Auction Revenues Can Be Used to Minimize Impact to Economy
Welfare Loss Under Different Allocation & Recycling Scenarios (Percentage loss relative to BAU)
0
0.2
0.4
0.6
0.8
1
1.2
Sce
nario
1.
Auc
tion/
lum
p-su
mtra
nsfe
r
Sce
nario
2.
Auc
tion/
PIT
recy
clin
g
Sce
nario
3.
Auc
tion/
lum
p-su
m/g
ov't
defic
it
Sce
nario
4.
Mai
ntai
n en
ergy
co. v
alue
/PIT
recy
clin
g
Sce
nario
5. 2
5%gr
andf
athe
ring/
PIT
recy
clin
g
Sce
nario
6. 1
00%
gran
dfat
herin
g/P
ITre
cycl
ing
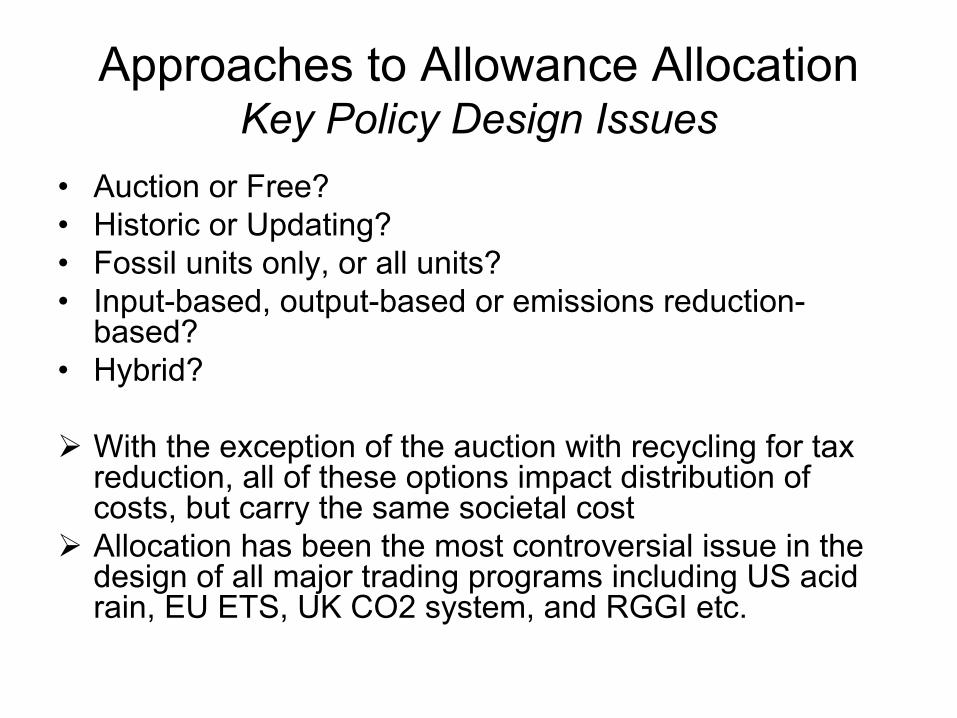
Approaches to Allowance AllocationKey Policy Design Issues
• Auction or Free?• Historic or Updating?• Fossil units only, or all units?• Input-based, output-based or emissions reduction-
based?• Hybrid?
With the exception of the auction with recycling for tax reduction, all of these options impact distribution of costs, but carry the same societal costAllocation has been the most controversial issue in the design of all major trading programs including US acid rain, EU ETS, UK CO2 system, and RGGI etc.
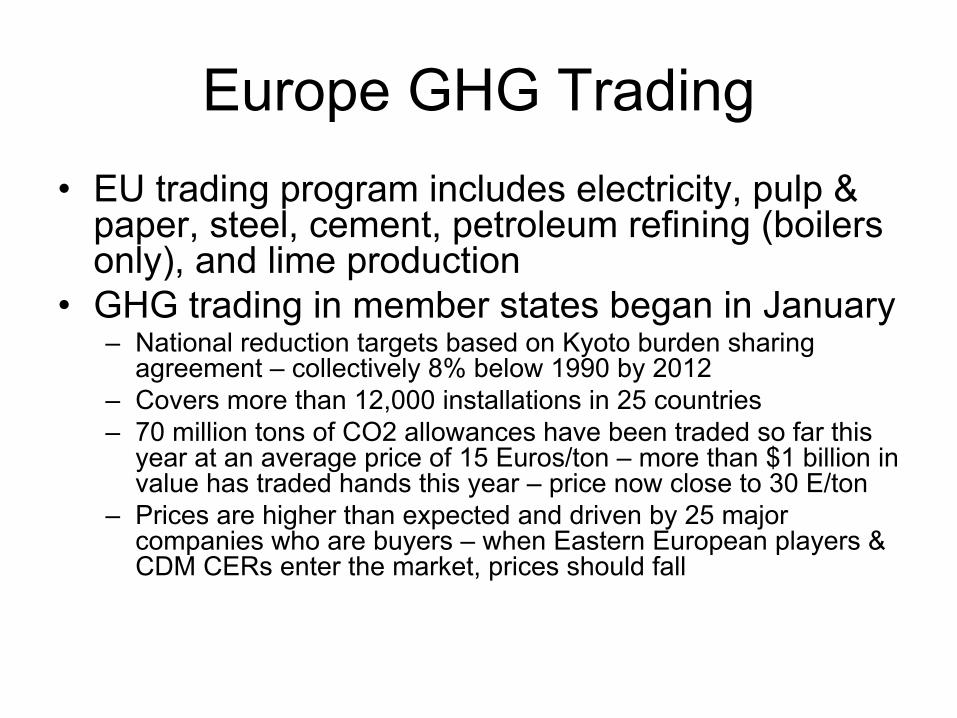
Europe GHG Trading• EU trading program includes electricity, pulp &
paper, steel, cement, petroleum refining (boilers only), and lime production
• GHG trading in member states began in January– National reduction targets based on Kyoto burden sharing
agreement – collectively 8% below 1990 by 2012– Covers more than 12,000 installations in 25 countries– 70 million tons of CO2 allowances have been traded so far this
year at an average price of 15 Euros/ton – more than $1 billion in value has traded hands this year – price now close to 30 E/ton
– Prices are higher than expected and driven by 25 major companies who are buyers – when Eastern European players & CDM CERs enter the market, prices should fall
EU Timing
• Three-year mandatory “warm-up” phase from 2005 to 2007– More than 45% of EU emissions covered by
trading system– Learning-by-doing
• Five-year mandatory Kyoto phase from 2008 to 2012– Allocations likely to be reduced in KP phase
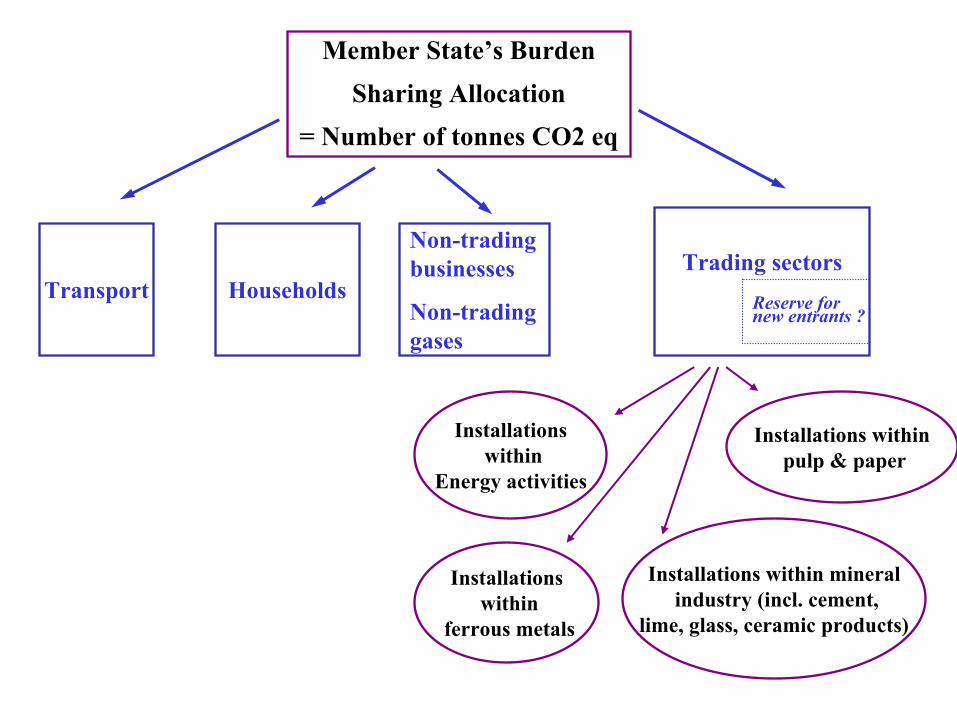
Member State’s Burden Sharing Allocation
= Number of tonnes CO2 eq
Transport Households
Non-trading businesses
Non-trading gases
Trading sectors
Installationswithin
Energy activities
Installationswithin
ferrous metals
Installations withinpulp & paper
Installations within mineralindustry (incl. cement,
lime, glass, ceramic products)
Reserve for new entrants ?
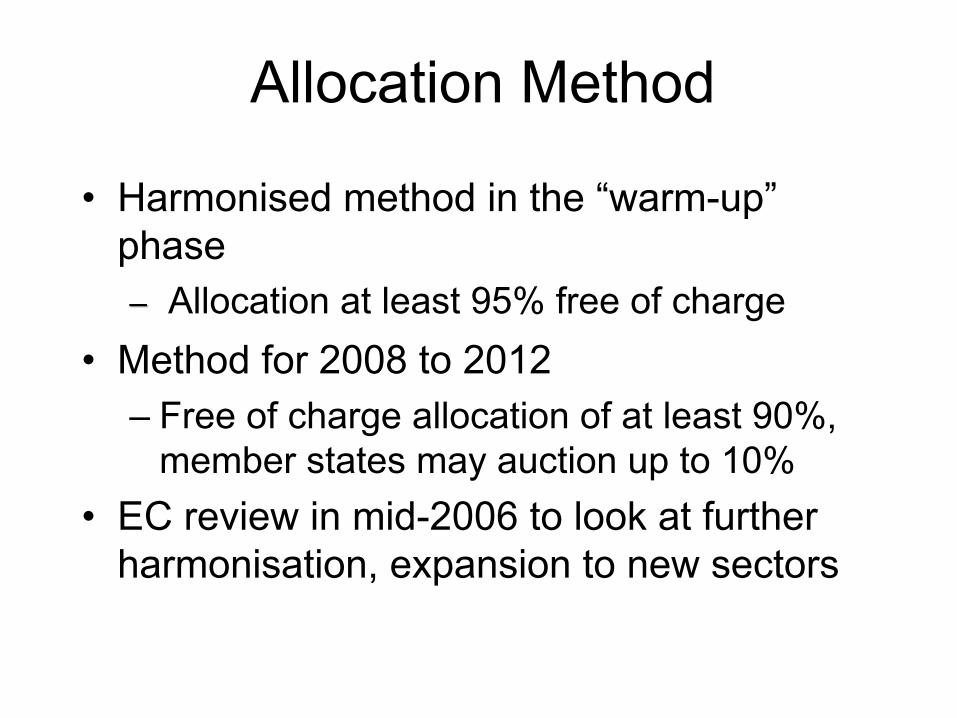
Allocation Method
• Harmonised method in the “warm-up”phase–– Allocation at least 95% free of charge
• Method for 2008 to 2012– Free of charge allocation of at least 90%,
member states may auction up to 10%• EC review in mid-2006 to look at further
harmonisation, expansion to new sectors
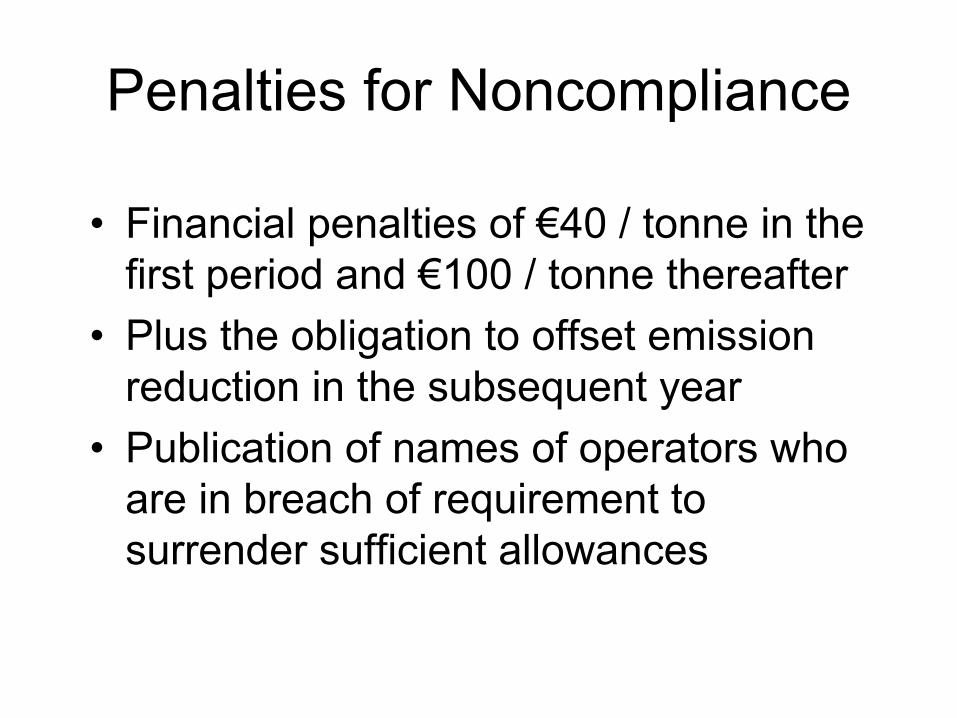
Penalties for Noncompliance
• Financial penalties of €40 / tonne in the first period and €100 / tonne thereafter
• Plus the obligation to offset emission reduction in the subsequent year
• Publication of names of operators who are in breach of requirement to surrender sufficient allowances
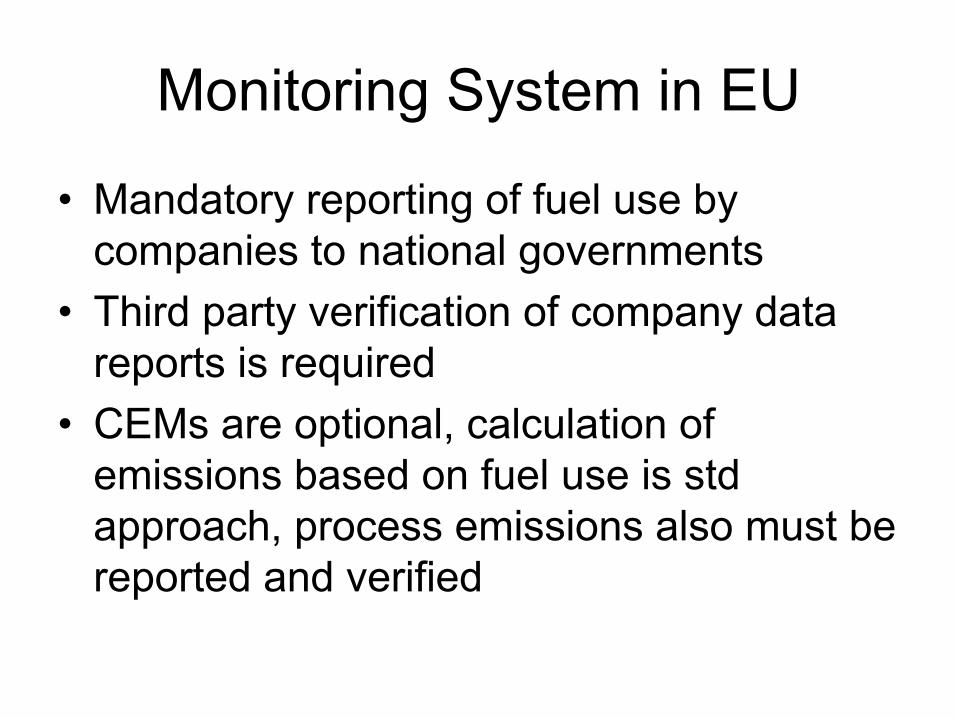
Monitoring System in EU
• Mandatory reporting of fuel use by companies to national governments
• Third party verification of company data reports is required
• CEMs are optional, calculation of emissions based on fuel use is std approach, process emissions also must be reported and verified
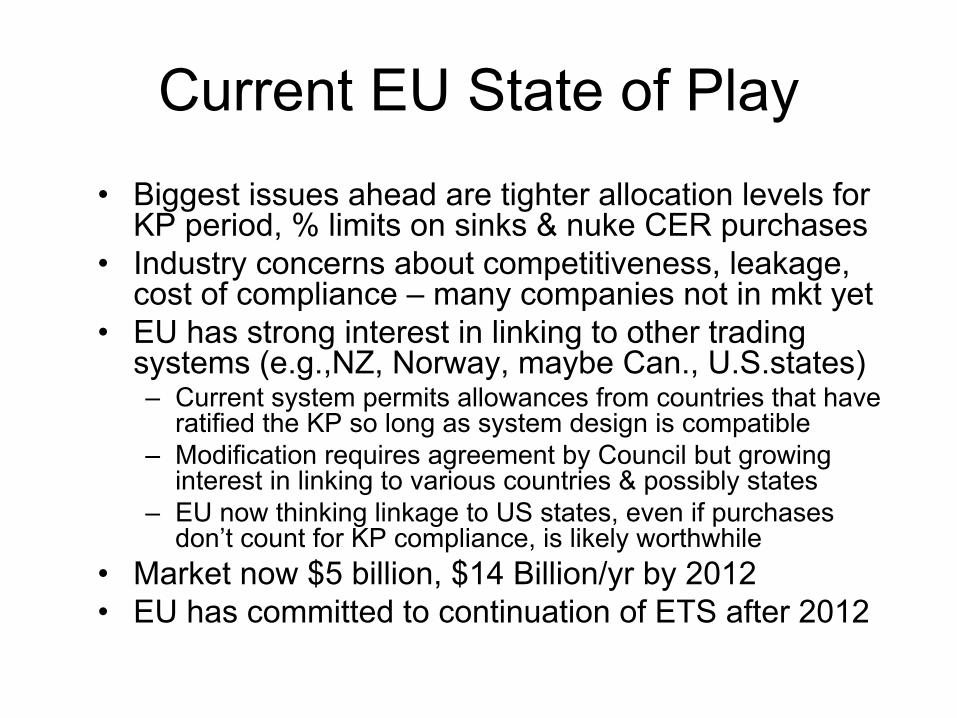
Current EU State of Play• Biggest issues ahead are tighter allocation levels for
KP period, % limits on sinks & nuke CER purchases• Industry concerns about competitiveness, leakage,
cost of compliance – many companies not in mkt yet• EU has strong interest in linking to other trading
systems (e.g.,NZ, Norway, maybe Can., U.S.states) – Current system permits allowances from countries that have
ratified the KP so long as system design is compatible– Modification requires agreement by Council but growing
interest in linking to various countries & possibly states– EU now thinking linkage to US states, even if purchases
don’t count for KP compliance, is likely worthwhile• Market now $5 billion, $14 Billion/yr by 2012• EU has committed to continuation of ETS after 2012
Regional Greenhouse Gas Initiative (RGGI) State of Play
• Draft MOU under consideration – commissioners to meet in late September
• System would cap emissions at 150 million tons (2000-2004 levels) in 2009 -15, 10% reduction below this level in 2015 -2020
• Generator-based system for 9 states• 75% of allowances allocated free, 20%
auctioned w/ revenues dedicated to EE/RE, 5% from each state to Strategic Carbon Fund to purchase reductions
RGGI Status• Compliance via offsets limited to 50% of target• 4 offset types currently: reforestation/afforestation,
heating oil/NG efficiency improvements, SF6, landfill gas• EU ETS allowances, Clean Development Mechanism
CERs (Kyoto – from developing country projects) eligible• More offset categories possible in future but will be
tightly monitored w/ standardized baselines established• Biggest issue has been potential for leakage from power
sales from neighboring coal and gas-fired units which could erode redux achieved by cap
• Good potential for linkage w/ W Coast C &Trade
Data Needs for a Multisector Cap and Trade System
• Mandatory reporting of fossil fuel use by facility –electric generators currently report CEM data electronically to EPA, no industrial reporting of CO2 from CA facilities
• Most cost-effective approach would be to rely on fuel use data and calculations for industrials
• EU started trading program before complete data reporting was in place w/o problem
• Process emissions are more challenging – will need third party verification system for this –introduces larger range of uncertainty in system
Data Needs (continued)
• If cap on load-serving entities is the approach taken for electric generation, improved reporting system for contracts for electricity imports would be desirable
• Monitoring of non-CA state RPS requirements and close coordination w/ CA PUC on interstate transmission links will be important steps to minimize contract “shuffling” by power sellers
Conclusions• Wide variety of trading options are possible and have
been tested in various settings• Ideally, would like to include as many sectors as
possible, link w/ other western states, and allow trading w/ RGGI and Kyoto countries to maximize cost effectiveness
• Lowering the cost of compliance increases political salability of program and permits tougher targets
• Preferable to include sectors in cap rather than as offsets – but politics may dictate offsets status to build support for program
• Data reporting should center on fossil fuel consumption by company – mandatory reporting a must
Conclusions (2)• In-depth analysis of non electricity sector reduction
opportunities should be carried out as part of decision process on which sectors to add to such a program
• Cap on load-serving entitities approach to electricity appears attractive for West Coast – avoids leakage
• This type of cap can be linked to trading w/ RGGI and other systems so long as there is no direct electricity interconnection – if NM, AZ move forward, would be desirable to follow same path
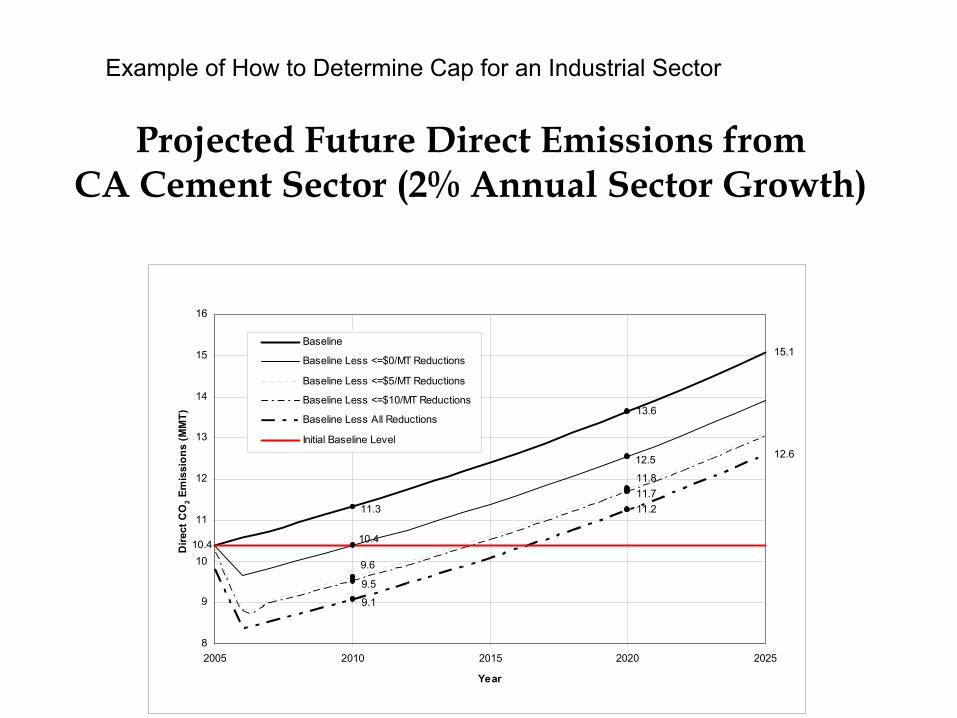
Projected Future Direct Emissions from CA Cement Sector (2% Annual Sector Growth)
15.1
13.6
11.3
12.5
10.410.4
11.8
9.6
11.7
9.5
12.6
11.2
9.1
8
9
10
11
12
13
14
15
16
2005 2010 2015 2020 2025
Year
Dire
ct C
O2 E
mis
sion
s (M
MT)
Baseline
Baseline Less <=$0/MT Reductions
Baseline Less <=$5/MT Reductions
Baseline Less <=$10/MT Reductions
Baseline Less All Reductions
Initial Baseline Level
Example of How to Determine Cap for an Industrial Sector
Data Needs (continued)
• Beyond broad approach, will also need specific reporting for particular industries. For example: – Reporting from refineries and chemical plants (if
included) needs to distinguish fossil fuels used as fuel and those used as feedstocks
– Refineries will need to report fuel use for all related activities such as separately-owned but jointly located hydrogen plants
– Reporting from cement kilns must include limestone or limestone-substitute use
– Reporting of intercompany transfers of fossil fuels