APPROVED: Mitty C. Plummer, Major Professor Phillip R. Foster, Committee Member J. Lynn Johnson, Committee Member Lee T. Slaughter, Industrial Representative, Consulting Engineer, TXU Albert B. Grubbs, Chair of the Department of Engineering Technology C. Neal Tate, Dean of the Robert B. Toulouse School of Graduate Studies DETERMINATION OF THE SHELF LIFE OF ALUMINUM ELECTROLYTIC CAPACITORS Edward McFaddin Wynne, B.S.E.E. Thesis Prepared for the Degree of MASTER OF SCIENCE UNIVERSITY OF NORTH TEXAS May, 2002
Transcript
UNIVERSITY OF NORTH TEXAS
May, 2002
APPROVED:
Mitty C. Plummer, Major ProfessorPhillip R. Foster, Committee MemberJ. Lynn Johnson, Committee MemberLee T. Slaughter, Industrial Representative, Consulting
Engineer, TXUAlbert B. Grubbs, Chair of the Department of Engineering
TechnologyC. Neal Tate, Dean of the Robert B. Toulouse School of
Graduate Studies
DETERMINATION OF THE SHELF LIFE OF ALUMINUM ELECTROLYTIC
CAPACITORS
Edward McFaddin Wynne, B.S.E.E.
Thesis Prepared for the Degree of
MASTER OF SCIENCE
Wynne, Edward McFaddin, Determination of the shelf life of aluminum
electrolytic capacitors. Master of Science (Engineering Technology), May 2002, 65 pp., 2
tables, 13 illustrations, references, 26 titles.
The aluminum electrolytic capacitor is used extensively in the electric utility
industry. A factor limiting the storage of spare capacitors is the integrity of the aluminum
oxide dielectric, which over time breaks down contributing to a shelf life currently
estimated at one nuclear power electric generating station to be approximately five years.
This project examined the electrical characteristics of naturally aged capacitors of
several different styles to determine if design parameters were still within limits.
Additionally, the effectiveness of a technique known as “Reforming” was examined to
determine its impact on those characteristics.
ii
ACKNOWLEDGMENTS
First and foremost, I wish to thank my wife, Susan, for the support she has given
me during the many hours I have spent on this thesis. Her understanding and
encouragement made this task easier.
I would also like to thank the members of my committee, Dr. Philip Foster and
Dr. Lynn Johnson for their support and time spent reviewing and providing comments on
this work. Mr. Lee Slaughter, my industrial representative, has been especially helpful
with the technical specifics of this research. His prior efforts for TXU related to
aluminum capacitors provided a strong foundation for this project. Mr. John Taylor’s
contribution to the effort was also significant. He provided me with good advice and aids
in developing my plans for this research.
Finally, I want to express my gratitude to Dr. Mitty Plummer, my advisor and
major professor for all of his guidance. He has been instrumental in my successful
completion of this thesis and my entire degree plan.
iii
TABLE OF CONTENTS
Page
ACKNOWLEDGMENTS............................................................................................... ii
LIST OF TABLES .......................................................................................................... v
LIST OF ILLUSTRATIONS .......................................................................................... vi
3. Reforming circuit from MIL-STD-1311B ................................................................ 16
4. Normal distribution one tail plotted with Matlab...................................................... 26
5. Student t distribution with 25 degrees of freedom, one tail test, plotted using Matlab................................................................................................................................... 27
6. Radial lead capacitor ................................................................................................. 29
7. Axial lead capacitor................................................................................................... 31
8. Can style capacitor .................................................................................................... 32
9. Keithley 3300 LCZ meter ......................................................................................... 33
10. DC leakage testing of can capacitors ........................................................................ 34
11. Reforming a group of 13 can style capacitors........................................................... 35
12. Can capacitor showing vent plug .............................................................................. 40
13. Can capacitor with slight terminal oxidation ............................................................ 41
1
CHAPTER 1
INTRODUCTION
Capacitors are either electrostatic or electrochemical devices that are made up of
various materials that will exhibit certain electrical behavior when exposed to external
stimuli (Kogler, 1999). They are energy storage devices and that energy can be dissipated
over a short or long period of time depending upon the application. Capacitors are used to
filter, couple, tune, block direct current, pass alternating current, power correction, and
electric motor starting (Dorf, 1997; Kogler, 1999). These passive components are
grouped according to their dielectric material and mechanical configuration (Dorf, 1997).
Commercially available capacitors come in a wide variety of types and values.
Electrolytic capacitors generally have the largest value of capacitance and are commonly
used in power supply filtering applications (Slaughter, 1996). As can be seen in figure 1,
aluminum electrolytic capacitors use aluminum as the base material (Dorf, 1997), and a
thin oxide layer on the order of 0.01 micron as the dielectric (Phillips Components,
1994). Because of their large capacitance values relative to size, aluminum electrolytic
capacitors are the most widely; used electrolytic capacitors in the electronics industry
(Electric Power Research Institute, 2000).
Nuclear power utilities have, as part of their operating license, limits imposed
upon the period of time certain systems and components may be out of service or in a
reduced reliability state before positive actions must be taken to place the plant into
inherently safer condition. These limits suggest an economic incentive to maintain a
ready supply of spare part
various styles and values
capacitors are maintained
and the world.
Aluminum electro
dielectric is not stable. W
continuously being produ
the dielectric strength wil
which exist in the materia
Materials, 1978). The pre
Figure 1, Structure of electrolytic capacitors
2
s. Due to the wide use of aluminum electrolytic capacitors of
in multiple systems and components, a large number of
at the various nuclear generating stations in the United States
lytic capacitors have a limited shelf life. The aluminum oxide
hen a capacitor is in use (voltage applied) the dielectric is
ced (healing). Because no healing takes place during storage,
l deplete due to dielectric polarization caused by impurities
l from manufacturing (American Society for Testing and
dominant effect on capacitors of this decrease in dielectric
3
strength is a large increase in the DC leakage current (DCL) (Greason & Critchley,
1986), the theory of which I have explained in chapter two.
There is not a set shelf life beyond which an electrolytic capacitor is guaranteed to
fail (Slaughter, 1996). Many manufacturers specify a typical shelf life for a capacitor or
an assembly containing capacitors. The manufacture’s stated shelf life for an aluminum
electrolytic capacitor can range from 2 to 10 years, depending on the quality of the
component (Kogler, 1999). Such a variation in shelf life can not be attributed only to
design and application variations. Instead, it is believed that the variations are based on
very conservative estimates of product life while in storage. The manufacturer will
typically specify time intervals that should be conservative under all normal conditions
(Davis & Funk, 1996). TXU Electric Comanche Peak Steam Electric Station established
a shelf life of five years on all aluminum electrolytic capacitors unless periodically
reformed (TXU Electric Comanche Peak SES, 1998).
The effect of aging on capacitors while in storage may be reduced or reversed by
performing periodic reconditioning (more commonly referred to as reforming) to restore
a capacitor’s internal properties (Davis & Funk, 1996). Different methods have been
described for reforming electrolytic capacitors. In general the process consists of
applying voltage to the capacitor without exceeding the specified leakage current. The
voltage is increased up to the rated value. This application of voltage tends to produce
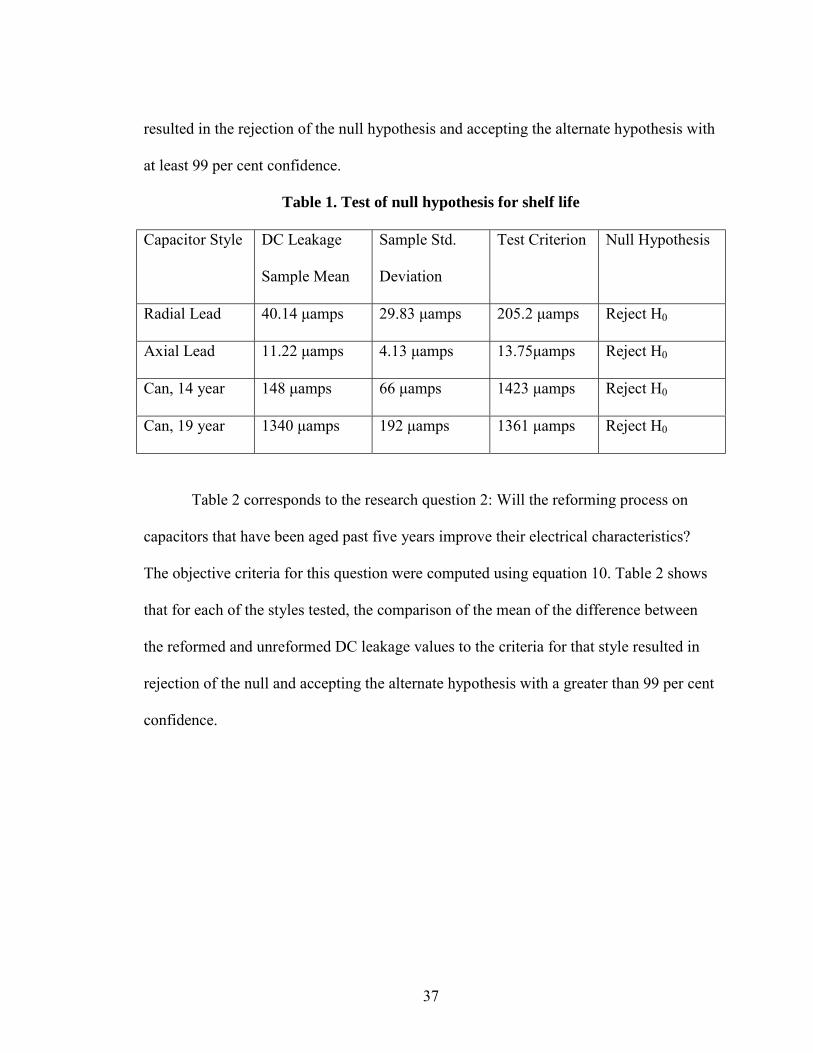
The second research question deals with the use of reforming to restore the
electrical characteristic of aged capacitors. Research question 2 was:
2. Will the reforming process on capacitors that have been aged past five years improve
their electrical characteristics?
The corresponding null hypothesis 2 (Ho)2 can be stated as follows: there is no
improvement in DC leakage due to the reforming process. This is represented by equation
(3) below:
µµµµAged - µµµµReformed = 0 (3)
Likewise, alternate hypothesis 2 (Ha)2 can be stated as follows: there is less DC
leakage after capacitors have been reformed. This is represented as equation (4) below:
µµµµAged - µµµµReformed > 0 (4)
Unlike research question 1, there are not multiple equations representing research
question 2. The capacitor response to reforming will be evaluated as it affects all styles.
Assumptions
The following assumptions applied to the research performed in this thesis:
1. Measuring and test equipment used in this research was assumed to provide accurate
measurements because all measuring and test equipment was calibrated by TXU’s
calibration laboratory.
2. Capacitors used in this research were assumed to be homogeneous by style and date
manufactured and representative samples of capacitors used in power supplies
throughout the industry. This was assumed as the capacitors were selected from spare
stock maintained by TXU for replacement of installed capacitors in power supplies
common to multiple power plants (Electric Power Research Institute, 2000).
7
3. Samples selected for testing were unused and naturally aged under typical warehouse
conditions during the period of their aging. This was assumed based upon the
required periodic surveillance of the TXU Comanche Peak warehouse system.
Limitations
This research had the following limitations:
1. Style and ratings of capacitors limited to available stock of aged capacitors.
2. No effect of condition of storage of capacitors prior to receipt at Comanche Peak
were included in the research.
3. Reforming technique used complied with Military Standard (U.S. Department of
Defense, 1979) and did not always exactly follow manufacture’s suggested technique.
4. Measurement of DC leakage applies a voltage to the test sample, which may result in
some reforming of dielectric.
5. Testing was performed only at TXU’s Procurement Overview testing facility.
Overview of the Remainder of the Research
Chapter 2 provides a review of literature related to the thesis. Specifically
discussed are aluminum electrolytic capacitor theory and design and the effects of natural
aging on capacitors. Chapter 2 also provides a discussion of reforming and the actions of
the applied voltage to the deteriorated aluminum oxide dielectric layer of the capacitors.
Chapter 3 provides the details of the research including research design, control of
variables, sample selection, test equipment and testing methodology. The statistical basis
for this research including sample size and objective criteria is provided as well.
8
Chapter 4 contains the testing results and analysis as well as observations made
during the testing. The conclusions reached from this research are discussed in chapter 5,
and Chapter 6 contains recommendations for further research in this area.
9
CHAPTER 2
REVIEW OF LITERATURE
The aluminum electrolytic capacitor is used extensively in the electric utility
industry. The need to maintain a supply of useful capacitors to replace failed components
in the generating plants requires knowledge of the practical shelf life of this type of
capacitor. A thorough understanding of capacitor theory as well as the effects of aging on
the electrical properties of the capacitor is necessary to correctly assign shelf life.
The nature of the electrical utility industry is changing. Traditionally, a regulated
monopoly, the industry is rapidly transitioning into a non-regulated competition arena.
There is an acknowledged need to minimize operational and maintenance cost to remain
competitive (TXU Corporation, 2000). The high cost of purchasing and testing the
required replacements parts, when coupled with the increased incidences of obsolescence
necessitating equivalency evaluation of proposed replacements mandates attempts to
extend shelf lives.
A review of literature was conducted in the following areas: Aluminum
electrolytic capacitor theory and design, effects of aging on capacitors, methods of shelf
life evaluations, recent studies on capacitor performance and reformation of capacitors.
10
Theory and Design
A capacitor consists basically of two conductors separated by a dielectric so as to
store an electric charge in a small volume. The capacitance is expressed as a ratio of
electric charge to the voltage applied. According to the Electric Power Research Institute
Capacitor Guide (Kogler, 1999) “… capacitance is dependent on 1) the dielectric
constant of the medium between the plates, (2) the surface area, of one plate, and 3) the
distance between the plates. (p.1).” Commercially available capacitors come in a wide
variety of types and values. Electrolytic capacitors generally have the largest value of
capacitance and are commonly used in power supply filtering applications (Slaughter,
1996).
The electrolytic capacitor was developed about 85 years ago and essentially
consists of an aluminum foil ribbon, on the surface of which is a thin film of aluminum
oxide formed electro-chemically, and a water-based electrolyte fluid which acts as the
opposing plate (Phillips Components, 1994). Over the years since their inception, there
have been continuous improvements in electrolytic capacitor design, and advancements
in their technology. One of the most significant was that of etching the anode plate
(Kaiser, 1995). In the modern capacitors, to reduce the size and increase the capacitance,
the surfaces of the aluminum foil with greater than 99.9 per cent purity is etched and the
electrode surface area is increased so that the foil can be used as the anode (Komatsu &
Shimizu, 1991). The oxide dielectric has a thickness on the order of 0.01 micron (Phillips
Components, 1994) and the electrolyte, usually a solution of ethylene glycol and adipic
or boric acid is the cathode. Since the cathode is a liquid, and electricity cannot be
conducted directly from it, an aluminum foil is used to play the role of the cathode. To
11
avoid contact between the electrodes, an electrolytic sheet is included. To prevent loss of
the electrolytic solution, capacitors are sealed in cases, usually of aluminum, with seals of
rubber (Komatsu & Shimizu, 1991) and (Phillips Components, 1994).
Since the aluminum oxide film acts as the dielectric, the configuration and
integrity of the film directly affects the performance of the capacitor. Formation of the
film on the foil…
Requires a continuous application of DC voltage at 140% to 200% of therated voltage for the capacitor being manufactured. The dielectricthickness of this aluminum oxide film is approximately 15 angstroms/volt(United Chemi-Con Inc, 1995)
During operation, the applied voltage tends to produce a dielectric oxide that maintains
the capacitor's characteristics. Spare capacitors are not energized therefor the dielectric
oxide layer is not maintained and the capacitor electrical characteristics will tend to
slowly change (Davis & Funk, 1996).
Practical capacitors are modeled and analyzed using equivalent circuits with
distributed parameters. Due to the design elements and construction, not only does a
capacitor have capacitance, but it also has a series resistance and inductance as well as a
parallel resistance allowing the flow of current (United Chemi-Con Inc, 1995). As a
result of these elements, at the terminals of a capacitor we see resistance that declines
with frequency. Because it is really not a pure resistance, it is called ESR or “Equivalent
Series Resistance (Kaiser, 1995). A useful diagram of this equivalent circuit, (figure 2)
allows the modeling of aluminum electrolytic capacitors and should be referred to
understand the effects of changes in the capacitors electrical characteristics. The
characteristics of interest are Equivalent Series Resistance, DC Leakage Current,
12
Capacitance, and Equivalent Series Inductance (Slaughter, 1996)and (United Chemi-Con
Inc, 1995).
L Rs
C
Rp
EQUIVALENT CIRCUIT
Figure 2
Equivalent Series Resistance (ESR) is made up of three basic constituents. These
are the resistance due to aluminum oxide thickness, due to the electrolyte/spacer
combination, and that due to the materials of construction e.g., the foil length, tabbing,
lead wires and ohmic contact resistance (United Chemi-Con Inc, 1995). ESR can be
calculated by measuring the initial dissipation factor (DF) at different frequencies and
using the relationship of equation (5) (Greason & Critchley, 1986)
ESR=DF/(2 πfC) (5)
The Rp resistance seen in the equivalent circuit is shunt resistance. This resistance
is due to the resistivity of the dielectric and case materials and to dielectric losses
(Slaughter, 1996). In an ideal capacitor, Rp would be infinitely high, as this high
resistance would prevent the flow of DC current in a charged capacitor. Leakage Current
13
(DCL) is a measure of the small amount of current allowed to pass within the capacitor
(United Chemi-Con Inc, 1995)
… due to very small foil impurity sites which are not homogeneous, andthe dielectric formed over these impurities does not create a strong bond.Leakage current is also determined by the following factors:
1. Capacitance value
2. Applied voltage versus rated voltage
3. Previous history.
The leakage current is proportional to the capacitance and decreases as theapplied voltage is reduced. (p. 2)
Due to the nonlinear V-I characteristics of aluminum electrolytic capacitors, leakage
current will decrease at a greater than linear rate as the applied voltage is decreased from
the capacitor’s rated voltage (Greason & Critchley, 1986).
As previously mentioned on page 3, capacitance is determined by effective plate
area and dielectric constant. Variances in either of those factors will generally be small
over capacitor life with the exception of the effects of electrolyte loss, since the
electrolyte acts as the cathode, one of the plates, in electrolytic capacitors (Kogler, 1999).
Gradually, during storage and/or operation, the electrolyte in an aluminumelectrolytic capacitor is lost by means of vapor transmission through theend seals. The rate of loss is directly dependent on the composition of theelectrolyte, the effectiveness of the end-seal, and the operating and/orstorage temperatures…. Electrolyte loss can be measured as weight loss.… after about 40% of the electrolyte has been lost… the ESR increasedrapidly, the capacitance decreased (p.37).
Therefore, the limiting factor determining the maximum possible capacitor life is the
evaporation through the seals that dries the electrolyte solution (Komatsu & Shimizu,
1991).
14
The last of the components in the equivalent circuit is Equivalent Series
Inductance (ESL). The inductance of a capacitor is a constant and is due primarily to the
capacitor terminal spacing. Since this factor is unchanging and a function of the
configuration of the capacitor, it is not a major component in any variations in electrical
function of the capacitor. Generally speaking, the inductance does not affect the overall
impedance unless the capacitor is operating at extremely high frequencies (United
Chemi-Con Inc, 1995).
Effects of Aging
The effect of aging on capacitors is generally studied from the perspective of
aging in use, that is, in an energized application (Denson & Domingos, 1996). From a
shelf life perspective, the concern is the effects of long term storage in an non-energized
state. Accelerated aging tests have shown that capacitors show a small decrease in
capacitance but proportionately larger increases in ESR and DC leakage current (Greason
& Critchley, 1986). The variation in capacitance is on the order of 10% and generally is
more than made up by the wide tolerances in the manufacturers rating of the capacitors.
The increase in ESR was on the order of 65% and DC leakage a magnitude of over 400%
(Greason & Critchley, 1986). The effect of these elevated values for ESR and DCL has
been shown to be a decrease in service life. As ESR goes up, the resistive heating of the
capacitor in service increases. The effect of elevated temperatures is an increase in the
rate of evaporation of the electrolyte, which in turns contributes to higher ESR values
(Harada, Katsuki, & Fujiwara, 1993). The increase in DC leakage current also
contributed to the effects of elevated temperature on the capacitor.
15
When an electrolytic capacitor is stored for an extended period of time,
particularly at elevated temperatures, the internal resistance can drop to a level where the
DC leakage current might exceed the rated value when initially energized. In many cases
the leakage current will return to normal low levels after a short period of operation as the
dielectric oxide layer is restored. However, in some cases when placed into service, the
initially higher leakage current will generate excessive internal gas, resulting in a rupture
of the rubber seals on the capacitor (Davis & Funk, 1996).
In the analysis of test results, (Greason & Critchley, 1986) concluded that the
increased ESR in aged capacitors was due to the increased resistivity of the electrolyte,
probably due to dryout. Improvements in the seals used by manufacturers have reduced
the vapor loss in capacitors (Komatsu & Shimizu, 1991) and other than tightly controlling
the environmental conditions of the storage of spare capacitors; little can be done to
reduce electrolyte loss in storage.
A capacitor performance project completed in 2000 found that normal aging from
time and temperature have little effect on filter capacitor’s behavior in linear power
supplies(Electric Power Research Institute, 2000). For some capacitors as old as 28 years,
there was some loss of electrolyte and capacitance decrease, especially in larger can style
capacitors, but as long as there was enough electrolyte left in the capacitor, the capacitor
would reform itself, either in the application circuit or by reforming outside of the circuit
(Electric Power Research Institute, 2000).
DC leakage current values can be reduced in stored capacitors by performing
periodic reconditioning (more commonly referred to as reforming) to restore a capacitors
internal properties (Davis & Funk, 1996).
16
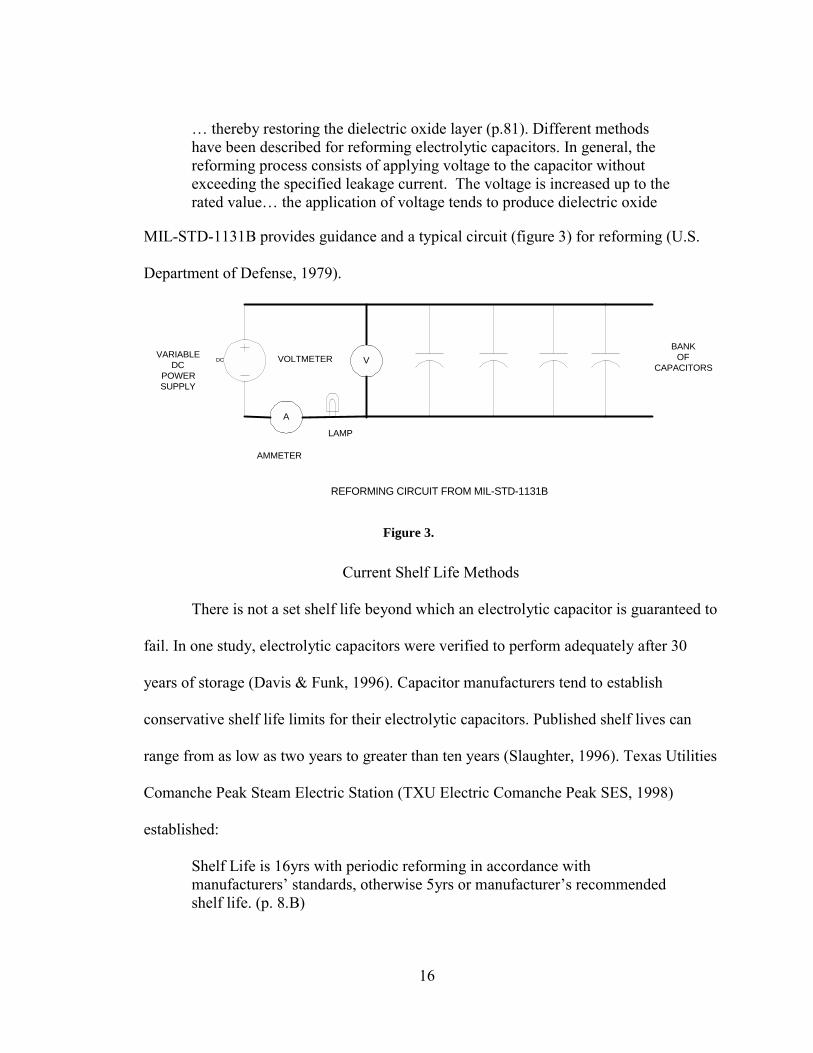
… thereby restoring the dielectric oxide layer (p.81). Different methodshave been described for reforming electrolytic capacitors. In general, thereforming process consists of applying voltage to the capacitor withoutexceeding the specified leakage current. The voltage is increased up to therated value… the application of voltage tends to produce dielectric oxide
MIL-STD-1131B provides guidance and a typical circuit (figure 3) for reforming (U.S.
Department of Defense, 1979).
DC
A
VARIABLEDC
POWERSUPPLY
AMMETER
BANKOF
CAPACITORSVOLTMETER
LAMP
V
REFORMING CIRCUIT FROM MIL-STD-1131B
Figure 3.
Current Shelf Life Methods
There is not a set shelf life beyond which an electrolytic capacitor is guaranteed to
fail. In one study, electrolytic capacitors were verified to perform adequately after 30
years of storage (Davis & Funk, 1996). Capacitor manufacturers tend to establish
conservative shelf life limits for their electrolytic capacitors. Published shelf lives can
range from as low as two years to greater than ten years (Slaughter, 1996). Texas Utilities
Comanche Peak Steam Electric Station (TXU Electric Comanche Peak SES, 1998)
established:
Shelf Life is 16yrs with periodic reforming in accordance withmanufacturers’ standards, otherwise 5yrs or manufacturer’s recommendedshelf life. (p. 8.B)
17
Such a variation in shelf life can not be attributed only to design and application
variations. Instead, it is believed that the variations are based on very conservative
estimates of product life while in storage and assumed storage at the most extreme
temperatures. From plant experience and limited studies, it appears that even the shelf life
of aluminum electrolytic capacitors may not be as limited as previously thought (Kogler,
1999).
Styles of Capacitors.
Capacitors are grouped according both to their dielectric material and their
mechanical configuration (Dorf, 1997). There are three major styles or types of these
capacitors; radial lead, axial lead, and cylindrical or can. There is a distinction between
the axial and radial lead-type and can-type aluminum capacitors (Kogler, 1999).
Axial and radial lead capacitors are those typically used on printed circuit boards
where space is at a premium. The sealing mechanism of these types of aluminum
electrolytic capacitors is also different than the can style and better prevents evaporation
of the electrolyte (Kogler, 1999). Manufacturer’s data indicates that the oxide film of
these style capacitors is quite stable at no load conditions (Vishay Sprague, 1995), and
these capacitors do not “deform”. This stability is credited to good anodizing techniques
that result in a superior oxide film (Kogler, 1999).
Can-type aluminum electrolytic capacitors are used in power supplies, converters
and inverters are typically of higher capacitance and have diameters greater than one inch
(Kogler, 1999). Typically can capacitors, especially the larger sizes have screw terminals
and vent plugs to act as relief of the electrolyte if excessive pressure builds up due to
heating, either ambient temperature or as a result of excessive current. Safe operating
18
voltages of can style capacitors can exceed 450 volt, but the construction has certain
inherent limitations that affect the use and performance of these capacitors (Phillips
Components, 1994). The larger plate areas of these capacitors make for appreciable
leakage currents.
Based on the differences between the styles and some anecdotal information
provided by various utilities, EPRI in the Capacitor Maintenance and Application Guide
(Kogler, 1999) has suggested that:
Can electrolytic capacitors, typically greater than 1 inch in length anddiameter and used in power supplies, converters and inverters, should havea shelf life of about 20 years, based upon storage temperatures.
Radial and axial lead electrolytic capacitors of the type used on printedcircuit boards should have a shelf life greater than the can electrolyticcapacitors. Radial and axial lead capacitors tend to have smaller volumesand better sealing mechanisms. (p. 2-6)
19
CHAPTER 3
METHODS AND MATERIALS
The review of literature in chapter 2 demonstrated the need to determine the shelf
lives of the different styles of aluminum electrolytic capacitors. The review further
indicated that, for those capacitors aged past their actual shelf life, the DC leakage current
may has risen to the point that failure will occur when energized or shortly after being
placed into service. Reforming is a method to reduce the DC leakage current of aged
capacitors to extend their shelf life. This research focused on determining if aluminum
electrolytic capacitors have a longer shelf life than previously assigned and if the
reforming technique does reduce the aged capacitors’ DC leakage current values.
The approach used in this research was to select unused capacitors that had been
naturally aged, as opposed to artificially accelerated aging, and that were representative
of capacitors used in power supply circuits at utility power plants and elsewhere in
industry. The capacitors were obtained from warehouse inventory at TXU’s Comanche
Peak Steam Electric Station and had been in storage under normal storage conditions for
periods of time greater than 5 years. Each capacitor was tested and the electrical
characteristics measured and compared to the published design characteristics of new
capacitors. A reforming process was performed and the testing and measurement
repeated. The post reforming values were then compared to the unreformed capacitor
values and the design values of new capacitors.
20
Research Design
This research was conducted in two steps, which corresponded to the two research
questions. The first part of the research addressing the question of shelf life used a post-
test only experimental design with a comparison to published design values. No pretest
measurements of values were possible in that the “test” was the natural aging of the
capacitors, and as such the test duration was as a minimum 5 years and in the case of one
style of capacitors 19 years. The selection of this experimental design was made as it
most closely matched the research question, “Is the shelf life of capacitors five years?”
The second research question dealing with the reforming process was modeled
with a pretest, test, post-test experimental design, in which the pretest measurements of
that experiment were the post-test measurement of the first experimental design. The
electrical characteristics of the aged capacitors measured in the first experiment were
compared to the values measured after those capacitors had been reformed. The result of
these comparative experiments allows the conclusions to be drawn that I discuss in
chapter 5 (Diamond, 1989). This research was designed to control those variables that
could be controlled and that would affect the capacitors electrical characteristics.
Variables that were not expected to affect the results or were uncontrollable (intervening
variable) were not controlled.
Controlled Variables
The independent variable or factor that was the primary interest of this research
was the age of the capacitor. This capacitor aging occurred during normal storage at
TXU’s Comanche Peak warehouses. Conditions during that storage were controlled and
monitored (TXU Electric Comanche Peak SES, 1999). The selection of the capacitors to
21
be aged occurred as a natural result of inventory stocking activities during the
construction phase of the two unit nuclear pressurized water reactor generating station.
The aged capacitors were examined for manufacturing dates to ensure that no possible
confusion with new or more recently manufactured samples occurred. For those
capacitors with no manufacturing dates marked on the case, a review of purchase and
issue history was performed to confirm date of receipt and verify no commingling of
variously aged pieces.
The reforming process effect on the capacitor was the other factor of primary
interest in this research and thus the other independent variable or factor. The military
standard (U.S. Department of Defense, 1979) and as well as manufacturers of capacitors
(Phillips Components, 1994) provided information on reformation circuits and controls to
prevent damage to the capacitors. The circuit used in this research to reform capacitors
was designed to closely match the diagrams shown in the manufacture’s literature and
military specification. The circuit set up was used on all capacitors reformed, with the
only variations being the values of the current limiting resistors and the voltage settings
used on the power supply. The rating of the capacitors reformed drove the selected
parameters.
The capacitor style and electrical ratings were the moderating variables associated
with the capacitors. As reviewed in Chapter 2, the shelf life of different styles of
capacitors was believed to vary, with cylindrical can capacitors having shorter shelf lives
than the radial or axial lead capacitors (Kogler, 1999). Capacitors selected to be tested
were of each of the three different styles. Capacitors used in this research were of
standard grades and common commercial ratings.
22
The moderating variable associated with the reforming process that could affect
the capacitors was regulation of the power supplies used to reform the capacitors.
Monitoring of the current and voltage output of the supplies using calibrated meters
ensured no variation in regulation. Additionally, all testing was performed using the same
meters during one cycle of normal calibration.
Uncontrolled Variables
The extraneous variables that were not expected to confound the results were not
controlled in this research nor were the intervening variables. Variations in the storage
environment of the capacitors during the many years of storage were not controlled any
tighter than the requirement of “Level B” storage. The warehouse storage procedures
required the temperature to be maintained between 40 and 140 degrees Fahrenheit (TXU
Electric Comanche Peak SES, 1999). A long-term variation of storage temperature of 100
degrees could possible affect the chemical breakdown of the dielectric film layer
(Slaughter, 1996). TXU warehouse procedures require notification and documentation of
the dates and duration of periods when the temperature in the warehouse exceeds 100
degrees. A review of non-conformance reports for TXU shows that the temperature
excursions over 100 degrees occur infrequently and usually last for less than 6 hours
(Simmon, 1999).
Control variations in manufacture of the capacitors was an intervening variable
that could have affected the results of the testing. Variations in the weld characteristics of
the lead to foil connection have been shown to result in differences in electrical
characteristics that may have impacted test results (Slaughter, 2001). ESR measurements
were recorded for all test specimens to identify any significant variations.
23
Required Sample Sizes
In every experiment, there is a risk that the experimenter will infer the wrong
decision from the test data. However, the amount of risk can be controlled by selecting
the proper sample size to use in the experiment (Diamond, 1989). The two different
research questions could have possibly required different sample sizes. The first question
dealing with the shelf life of the capacitors could be described as a comparison of means.
That is, the mean value of the DC leakage current for aged capacitors was compared to a
design maximum value. The determination of sample size for this question followed the
approach described as “Case 4” by Diamond (1989). In that case, the alpha and beta risks
were first chosen. A value for the desired minimum difference, δ, between the mean of
the aged capacitors’ DC leakage current and the design number chosen to accept that
there is a difference at those risk levels was then determined. The sample size was then
calculated for a normal distribution as a first approximation. The size of the sample was
then calculated using a student t distribution based on the preliminary normal distribution
sample size.
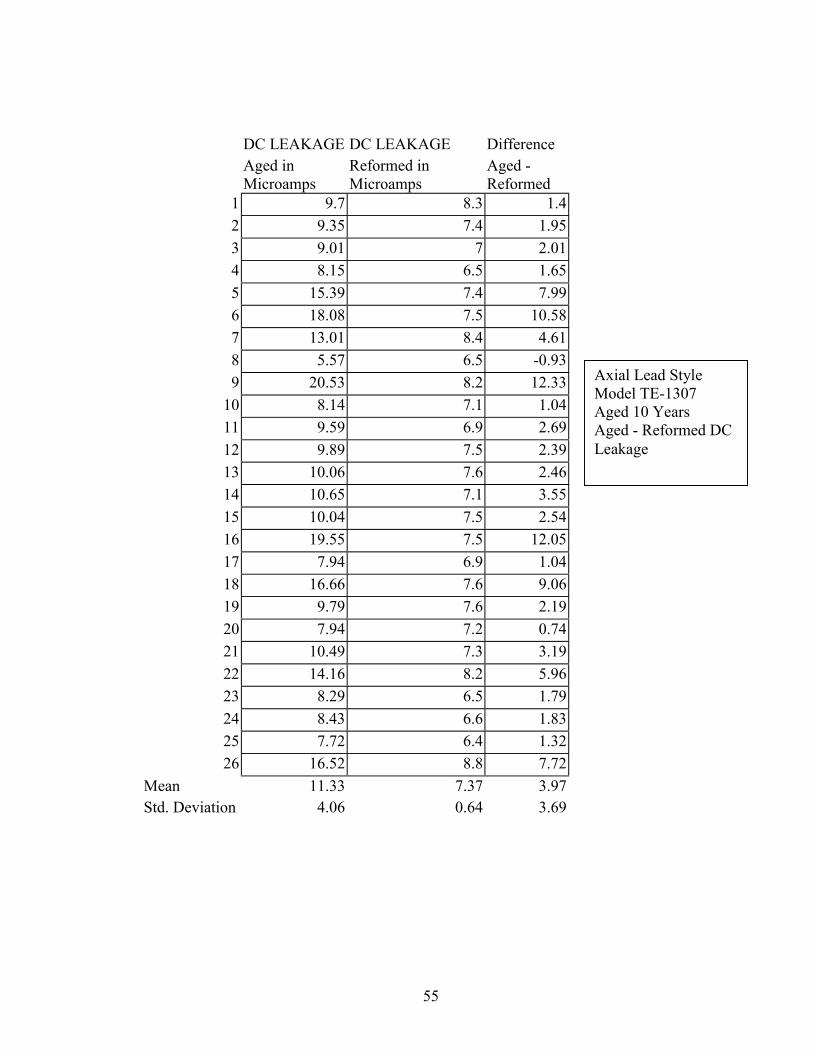
The second research question dealing with the effectiveness of the reforming
process is an example of a pair-comparison experiment (Diamond, 1989). In a pair-
comparison experiment, the experimenter is interested in determining the effect of a
process on a part. This method is to measure the trait of interest on a sample, in this case
the DC leakage current. The reform process is then performed on the sample and the DC
leakage re-measured. The difference between leakage currents before and after reforming
is the effect of reforming on the capacitor. The differences for all the capacitors tested
then become the data, which is analyzed to make the decision as to which hypothesis to
24
accept. The sample size for the pair-comparison test is made by letting the desired
improvement, δ, be equal to the standard deviation, σ, of the mean of the differences
measured. The required sample size is then calculated in the same manner as in the first
research question.
Alpha (α), Beta (β), and Delta (δ)
The assignment of values for the probabilities of committing type I (α) or type II
(β) errors was made based upon the consequences of committing those errors. Rejecting
the null hypothesis, H0, when it is true would, in the case of the first research question
result in allowing capacitors to be stored or used passed their allowed shelf life.
Committing a type II error, rejecting H1 when it was in fact true, would result in
disposing of spare parts that were still acceptable for use.
In the second research question, the consequence of committing a type I error
would mean that it would have been claimed that reforming capacitors restored the
desired lower DC leakage current levels when, in fact, it did not. This would result in
increases in labor cost to perform the process with no improvements gained. A type II
error would claim that reforming made no difference when, in fact, there was an
improvement. The type II error would have resulted in a missed opportunity to reduce
inventory and restocking cost associated with replacing aged unused capacitors.
It appears that the consequence of committing a type I error is greater that for type
II errors, at least in the first research question, in that unacceptable capacitors may be
retained. The pre-installation testing that occurs at nuclear facilities mitigates this
consequence making it unlikely that nuclear safety would be impacted. Because the
consequences of committing both types of errors were otherwise similar, the significance
25
of both types of errors were treated the same in this research. The probability of
committing a type I error, α, is generally chosen to be in the range of .01 to .1 (Kvanli,
Guynes, & Pavur, 1996b). For my research, I chose to minimize the probability of errors
to 1% and therefore chose the value of .01 for both α and β.
The term δ is the other factor necessary to determine the sample size. δ is the
difference between µ0 and the potential value of µ1 at which the β risk applies and is
termed delta. δ is the Greek letter delta (Diamond, 1989). The larger the amount of
difference, or improvement, the smaller the sample size at the same risk. Since no
information on the value of the DC leakage current for the aged capacitors was available
until they could be tested, delta as a function of population variance was chosen as the
approach used to deal with determination of sample size. A value of δ equal to one
standard deviation σ was specified for the second research question and that value was
also used for the first question. A larger value of delta would have allowed a smaller
sample size, but may have rejected H1 unnecessarily. The selection of one standard
deviation will result in approximately 68% of the measured values for the aged capacitors
being within plus or minus one sample standard deviation of the measured mean of the
samples (Kvanli, Guynes, & Pavur, 1996a).
First Approximation of Sample Size
For both research questions, the value of the population variance, σ2, is unknown
and only an estimate of σ2 could be obtained from the experiment; that estimate is S2.
Using an estimate of σ2 introduces an additional element of uncertainty into the
experiment and the decision making process. This additional uncertainty is taken into
26
account by using what is called the t distribution in place of the normal distribution when
the variance (σ2) is only estimated (Diamond, 1989). When calculating the sample size
using the t distribution, a first approximation is made using the normal distribution
(figure ). For this case, the sample size for a normal distribution at a specified α, β, and δ
is given by the equation (6) (Diamond, 1989):
N = (Uα + Uβ)2 σ2/δ2 (6)
For a single sided test with α and β chosen as 0.01, Uα = Uβ = 2.326. This results in a
normal distribution sample size of N = 21.641.
Figure 4. Normal distribution one tail plotted with Matlab.2.326
0Z
Reject the nullhypothesis
Fail to reject the nullhypothesis
27
Refined t Distribution Sample Size
The estimate of N obtained above is too low since the decision-making criterion
should be based on the t distribution instead of the normal distribution. Following the
guidance given by Diamond (1989), values for tα and tβ are obtained from table 3 with φ,
the degrees of freedom, set at N-1 = 20.641. The value obtained for tα and tβ, 2.53, was
substituted into the equation for sample size using t distribution:
Nt = (tα + tβ)2 σ2/δ2 (7)
Nt = (2.53 +2.53)2 σ2/δ2 = 25.6 (8)
Rounding up, the required sample size for both of the research questions were determined
to be 26.
Figure 5. Student t distribution with 25 degrees of freedom, one tail test, plotted with Matlab.
Fail to rejectnull hypothesis
Reject nullhypothesis
α = .01
0t 2.53
28
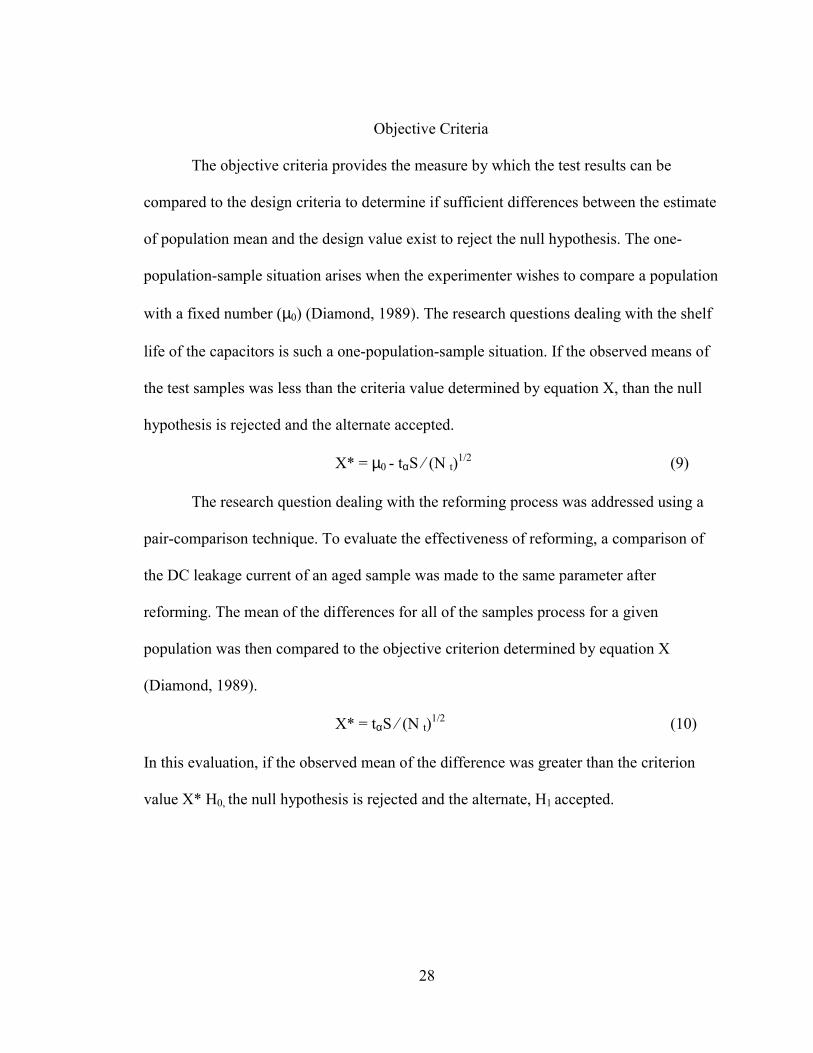
Objective Criteria
The objective criteria provides the measure by which the test results can be
compared to the design criteria to determine if sufficient differences between the estimate
of population mean and the design value exist to reject the null hypothesis. The one-
population-sample situation arises when the experimenter wishes to compare a population
with a fixed number (µ0) (Diamond, 1989). The research questions dealing with the shelf
life of the capacitors is such a one-population-sample situation. If the observed means of
the test samples was less than the criteria value determined by equation X, than the null
hypothesis is rejected and the alternate accepted.
X* = µ0 - tαS ! (N t)1/2 (9)
The research question dealing with the reforming process was addressed using a
pair-comparison technique. To evaluate the effectiveness of reforming, a comparison of
the DC leakage current of an aged sample was made to the same parameter after
reforming. The mean of the differences for all of the samples process for a given
population was then compared to the objective criterion determined by equation X
(Diamond, 1989).
X* = tαS ! (N t)1/2 (10)
In this evaluation, if the observed mean of the difference was greater than the criterion
value X* H0, the null hypothesis is rejected and the alternate, H1 accepted.
Test Capacitors
As previously stated, the capacitors which were used in this research were
obtained from the stock of the Comanche Peak Generation Station and had been naturally
aged for more than five years. With a required sample size of 26, the population from
which to select was limited to capacitor styles and ratings with existing quantities greater
than 26. An additional limiting criterion was the requirement of common date of
manufacture. Factoring all these requirements, and selecting one of each style of
capacitor; radial, axial and can, resulted in the selection of following capacitors.
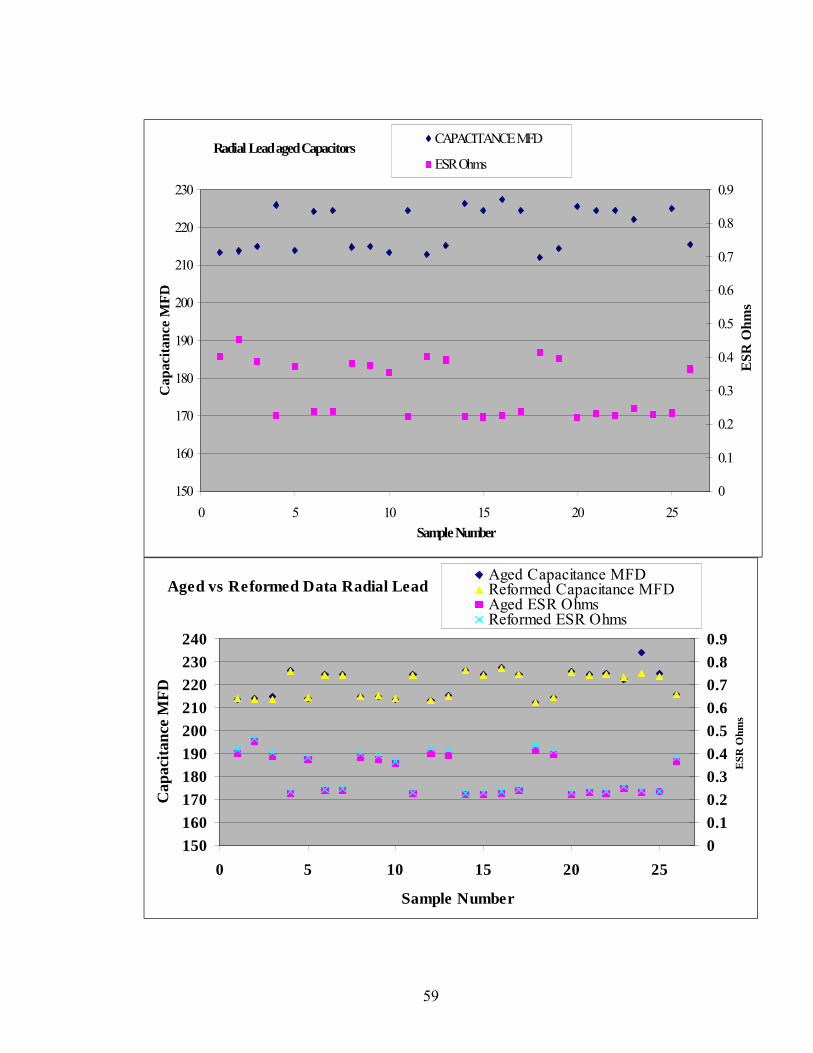
Radial Lead Capacitor
The capacitor selected as the example of radial lead style was the XICON™ XRL
series 220 MFD 50 VDC (see figure 5). The warehouse inventory for this part revealed
127 on hand; all of which were procured on the same purchase order and received in
1991. This capacitor has no date code markings, but labels received with the capacitors
Figure 6, Radial lead capacitor
29
30
showed the date of July 1991. Information from the product catalog was extracted to
determine the design DC Leakage using the following formula (Xicon Capacitors, 1993).
I = 0.02CV or 3 (μA) whichever is greater (after 5 minutes) applying the
rated DC working voltage at 20˚ C)
Where: C = rated Capacitance in μF.
V + rated DC working voltage.
Using this equation and 220 μF and 50 VDC gives the following:
I = 0.02 (220) (50) = 220 μA (11)
This style of capacitors is a commonly used printed circuit board mounted component.
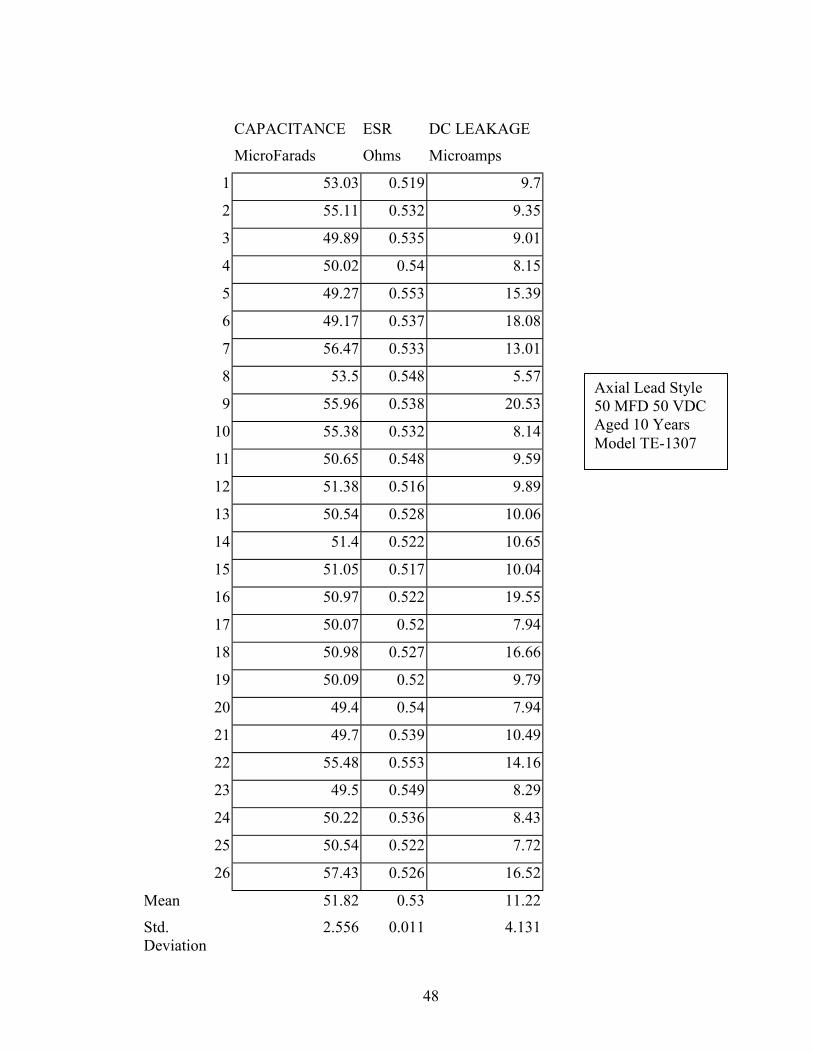
Axial Lead Capacitors
The capacitor selected as the example of radial lead style was the SPRAGUE™
Type TE, Littl-Lytic® TE1307, 50 MFD 50 VDC (figure 6). The warehouse inventory
for this part revealed 35 on hand; all with the same manufacturer date code of “9147”
which corresponded to the 47 week of 1991. The maximum design leakage current for all
type TE capacitors at + 25°C is 15μA except for case code “DD” which is 15.8μA. The
TE1307 is a case code “DD”(Vishay Sprague, 1995). These axial lead capacitors are
widely used in the power supplies in the nuclear instrumentation cabinets at Comanche
Peak and other nuclear utilities that use Westinghouse supplied nuclear instruments
(TXU Electric Comanche Peak SES, 2001).
Can Style Capacitors
The capacitor selected as th
Sprague Powerlytic® 36D model 5
250 VDC (figure ). The inventory
“8226” and 29 with date codes of “
selected for the testing which was
these capacitors is calculated by th
Imicroamps= K(CV) ½
I = 4 * (530 * 250)
These can style capacitors are com
devices.
Figure 7, Axial lead capacitor
31
e example of canister or “Can” style capacitors is a
30-250 DC. This capacitor has a rating of 530 MFD at
of these capacitors included 40 with date codes of
8747”. Samples of 26 of each of these date codes were
performed. The maximum DC Leakage current for
e following formula (Vishay Sprague, 1995):
where K = 4 @ 25°C
½ = 1456 μA = 1.456 mA (12)
monly used in power supplies as output filtering
32
Figure 8, Can style capacitor
Test Sequence
The test sequence followed for all the samples tested were similar. The samples of
the population were randomly selected from all of the available capacitors of the same
date code. In the case of the radial and axial lead capacitors, this random sample
technique consisted of a “grab bag” in that all of the samples were collected loosely in a
large bag and the required sample size of 26 were chosen by reaching into the bag and
removing that number, one at a time. For the can styles, since the total population from
which to chose was much smaller, the technique here differed in that instead of selecting
the samples to be tested, I selected the samples which were not to be tested. The selection
process was conducted the same, otherwise.
33
Once the samples were selected, the testing proceeded in the following order.
First, for a sample type and style, the capacitors were all tested for capacitance and ESR
values using a Keithley® model 3330 LCZ meter (Keithley Instruments Inc, 1991). After
those measurements were obtained, a DC leakage test was performed on the sample at the
rated voltage and duration specified by the manufacturers’ data sheets. Following the DC
leakage testing, the samples were reformed using the circuit diagramed in figure 2, with
the modification of the use of a current limiting resistor in place of the lamp shown on the
figure. The resistor was chosen to limit the current to not exceed the rated allowed DC
leakage current. Post reforming, all the initial testing was repeated after a minimum wait
of at least 24 hours. The results of the testing are documented in the appendixes and
discussed in chapter 4.
Figure 9, Keithley 3300 LCZ meter
34
Figure 10, DC leakage testing of can capacitors
35
Figure 11, Reforming a group of 13 can style capacitors
36
CHAPTER 4
RESULTS AND ANALYSIS
All testing of capacitors and reforming processes were conducted at TXU’s
Procurement Overview test facility. The temperature was maintained at 25 degrees
Celsius and all test equipment and power supplies were observed to be in calibration and
operated per established procedures. The results of the testing were recorded manually on
data sheets and later entered into Microsoft® Excel spreadsheet. The equations for testing
objective criterion as explained in chapter 3, were the primary test method employed to
analyze the test data. Additionally, observation of the samples appearances and
evaluation of capacitance and ESR was performed to identify any possible extreme
outlying results.
Tests of Objective Criteria
Tables 1 and 2 are based on the observed test data sheets (Appendix A) and show
the results of the testing of each of the sample populations compared to the objective
criteria. The tables show the sample population means, standard deviation and test
criterion.
Table 1 addresses the first research questions: Is the shelf life of the various styles
of aluminum electrolytic capacitors five years? For each of the styles and sample groups,
the objective criteria was computed using equation 9. As can be seen in Table 1, for each
sample population, the mean value of DC Leakage was less than the objective criteria and
37
resulted in the rejection of the null hypothesis and accepting the alternate hypothesis with
at least 99 per cent confidence.
Table 1. Test of null hypothesis for shelf life
Capacitor Style DC Leakage
Sample Mean
Sample Std.
Deviation
Test Criterion Null Hypothesis
Radial Lead 40.14 μamps 29.83 μamps 205.2 μamps Reject H0
Axial Lead 11.22 μamps 4.13 μamps 13.75μamps Reject H0
American Society for Testing and Materials. (1978). Test methods for a-c losscharacteristics and permitivity (dielectric constant) of solid electrical insulatingmaterials. Philidelphia, PA: American National Standards Institute.
Davis, E., & Funk, D. (1996). Instrument power supply tech notes (Technical Report TR-107044). Palo Alto, CA: Electric Power Research Institute.
Denson, W., & Domingos, H. (1996). Reliable applications of capacitors ( CAP). Rome,NY: Reliability Analysis Center.
Diamond, W. J. (1989). Practical experiment design for engineers and scientists ( seconded.). New York: Van Nostrand Reinhold.
Dorf, R. C. (1997). The electrical engineering handbook. Salem, MA: CRC Press.
Electric Power Research Institute. (2000). Capacitor performance monitoring project(Technical Report TR-1001257). Palo Alto, CA: Electric Power Research Institute.
Greason, W. D., & Critchley, J. (1986). Shelf-life evaluations of aluminum electrolyticcapacitors. IEEE Transactions on Components, Hybrids and Manufacturing Technology,CHMT-9(3), 293-299.
Harada, K., Katsuki, A., & Fujiwara, M. (1993). Use of ESR for deterioration diagnosisof electrolytic capacitor. IEEE Transactions on Power Electronics, 8(4), 355-361.
Kaiser, C. J. (1995). The capacitor handbook ( second ed.). Olathe, KS: CJ Publishing.
Keithley Instruments Inc. (1991). Operator's manual model 3330 LCZ meter (OwnersManual 330-900-01). Cleveland, OH: Keithley Instruments Inc.
64
Kogler, K. J. (1999). Capacitor maintenance and application guide (Technical ReportTR-112175). Palo Alto, CA: Electric Power Research Institute.
Komatsu, S., & Shimizu, H. (1991). New technologies endow aluminum electrolyticcapacitors with longer life. Journal of Electronic Engineering, 28(291), 52-55.
Kvanli, A. H., Guynes, C. S., & Pavur, R. J. (1996a). Chapter 6, continuous probabilitydistributions, Introduction to business statistics: A computer integrated, data analysisapproach (pp. 202). St. Paul, Minnesota: West Publishing.
Kvanli, A. H., Guynes, C. S., & Pavur, R. J. (1996b). Chapter 8: Hypothesis testing forthe mean and variance of a population, Introduction to business statistics: A computerintegrated, data analysis approach (pp. 272-320). St. Paul, Minnesota: West Publishing.