Page 1
CAPACITY-PROPORTIONAL UNSTRUCTURED
PEER-TO-PEER NETWORKS
A Thesis
by
CHANDAN RAMA REDDY
Submitted to the Office of Graduate Studies ofTexas A&M University
in partial fulfillment of the requirements for the degree of
MASTER OF SCIENCE
August 2009
Major Subject: Computer Engineering
Page 2
CAPACITY-PROPORTIONAL UNSTRUCTURED
PEER-TO-PEER NETWORKS
A Thesis
by
CHANDAN RAMA REDDY
Submitted to the Office of Graduate Studies ofTexas A&M University
in partial fulfillment of the requirements for the degree of
MASTER OF SCIENCE
Approved by:
Chair of Committee, Dmitri LoguinovCommittee Members, Riccardo Bettati
A. L. Narasimha ReddyHead of Department, Valerie Taylor
August 2009
Major Subject: Computer Engieering
Page 3
iii
ABSTRACT
Capacity Proportional Unstructured Peer-to-Peer Networks. (August 2009)
Chandan Rama Reddy, B.E., National Institute of Technology Karnataka
Chair of Advisory Committee: Dr. Dmitri Loguinov
Existing methods to utilize capacity-heterogeneity in a P2P system either rely
on constructing special overlays with capacity-proportional node degree or use topol-
ogy adaptation to match a node’s capacity with that of its neighbors. In existing
P2P networks, which are often characterized by diverse node capacities and high
churn, these methods may require large node degree or continuous topology adapta-
tion, potentially making them infeasible due to their high overhead. In this thesis,
we propose an unstructured P2P system that attempts to address these issues. We
first prove that the overall throughput of search queries in a heterogeneous network
is maximized if and only if traffic load through each node is proportional to its ca-
pacity. Our proposed system achieves this traffic distribution by biasing search walks
using the Metropolis-Hastings algorithm, without requiring any special underlying
topology. We then define two saturation metrics for measuring the performance of
overlay networks: one for quantifying their ability to support random walks and the
second for measuring their potential to handle the overhead caused by churn. Using
simulations, we finally compare our proposed method with Gia, an existing system
which uses topology adaptation, and find that the former performs better under all
studied conditions, both saturation metrics, and such end-to-end parameters as query
success rate, latency, and query-hits for various file replication schemes.
Page 5
v
ACKNOWLEDGMENTS
I would like to express my sincere gratitude to Dr. Dmitri Loguinov for being
my advisor and guiding me through this thesis. Interacting with him during this
research work was a great learning experience and I thank him for making me part
of the Internet Research Lab. I am thankful for his regular feedback and constant
motivation which helped me complete this thesis. I also thank Dr. A. L. Narasimha
Reddy and Dr. Ricardo Bettati for being part of my thesis committee.
I would like to acknowledge the company of all members of the Internet Research
Lab and in particular thank Xiaoming Wang and Derek Leonard for their help during
my research. I also thank my colleagues in CSG and friends in College Station for
keeping me in good spirits.
Last, but not least, I am indebted to my parents for their love and constant
support.
Page 6
vi
TABLE OF CONTENTS
CHAPTER Page
I INTRODUCTION . . . . . . . . . . . . . . . . . . . . . . . . . . . 1
1.1 Basics . . . . . . . . . . . . . . . . . . . . . . . . . . . . . . . . 1
1.2 Overlay Topology . . . . . . . . . . . . . . . . . . . . . . . . . . 3
1.3 Search Methodology . . . . . . . . . . . . . . . . . . . . . . . . 3
1.4 Replication Strategy . . . . . . . . . . . . . . . . . . . . . . . . 4
1.5 Our Contributions . . . . . . . . . . . . . . . . . . . . . . . . . 4
II RELATED WORK . . . . . . . . . . . . . . . . . . . . . . . . . . . 8
2.1 Complete System . . . . . . . . . . . . . . . . . . . . . . . . . . 8
2.2 Individual Components . . . . . . . . . . . . . . . . . . . . . . . 9
2.3 Other . . . . . . . . . . . . . . . . . . . . . . . . . . . . . . . . 10
III OPTIMAL NETWORK . . . . . . . . . . . . . . . . . . . . . . . . 11
3.1 Basics and Assumptions . . . . . . . . . . . . . . . . . . . . . . 11
3.2 Search Saturation Point . . . . . . . . . . . . . . . . . . . . . . 14
3.3 Centralized Construction . . . . . . . . . . . . . . . . . . . . . . 15
IV DESIGNING CAPACITY-PROPORTIONAL SYSTEM . . . . . . . 19
4.1 CPMH Framework . . . . . . . . . . . . . . . . . . . . . . . . . 19
4.1.1 Self Transitions . . . . . . . . . . . . . . . . . . . . . . . . 20
4.2 Topology Construction . . . . . . . . . . . . . . . . . . . . . . . 20
4.2.1 CPMH Walk Convergence . . . . . . . . . . . . . . . . . . 21
4.3 Search Methodology . . . . . . . . . . . . . . . . . . . . . . . . 23
4.4 Replication Strategy . . . . . . . . . . . . . . . . . . . . . . . . 23
V SIMULATOR . . . . . . . . . . . . . . . . . . . . . . . . . . . . . . 25
5.1 Architecture . . . . . . . . . . . . . . . . . . . . . . . . . . . . . 25
5.2 Event Handling . . . . . . . . . . . . . . . . . . . . . . . . . . . 26
5.3 Bootstrapping . . . . . . . . . . . . . . . . . . . . . . . . . . . . 28
5.4 Output . . . . . . . . . . . . . . . . . . . . . . . . . . . . . . . . 28
VI EVALUATION . . . . . . . . . . . . . . . . . . . . . . . . . . . . . 30
6.1 Topology Evaluation . . . . . . . . . . . . . . . . . . . . . . . . 31
Page 7
vii
CHAPTER Page
6.2 Replication Schemes . . . . . . . . . . . . . . . . . . . . . . . . 32
6.3 Static Network . . . . . . . . . . . . . . . . . . . . . . . . . . . 34
6.3.1 Query Success Rate . . . . . . . . . . . . . . . . . . . . . . 34
6.3.2 Query Latency . . . . . . . . . . . . . . . . . . . . . . . . 36
6.3.3 Query Hits . . . . . . . . . . . . . . . . . . . . . . . . . . 36
6.3.4 Message Backlog . . . . . . . . . . . . . . . . . . . . . . . 39
6.4 Dynamic Network . . . . . . . . . . . . . . . . . . . . . . . . . . 39
6.4.1 Churn Model . . . . . . . . . . . . . . . . . . . . . . . . . 41
6.4.2 Build Saturation Point . . . . . . . . . . . . . . . . . . . . 42
6.4.3 End-to-end Metrics . . . . . . . . . . . . . . . . . . . . . . 43
6.5 Incremental Deployment . . . . . . . . . . . . . . . . . . . . . . 43
VII CONCLUSION . . . . . . . . . . . . . . . . . . . . . . . . . . . . . 47
REFERENCES . . . . . . . . . . . . . . . . . . . . . . . . . . . . . . . . . . . 48
VITA . . . . . . . . . . . . . . . . . . . . . . . . . . . . . . . . . . . . . . . . 52
Page 8
viii
LIST OF TABLES
TABLE Page
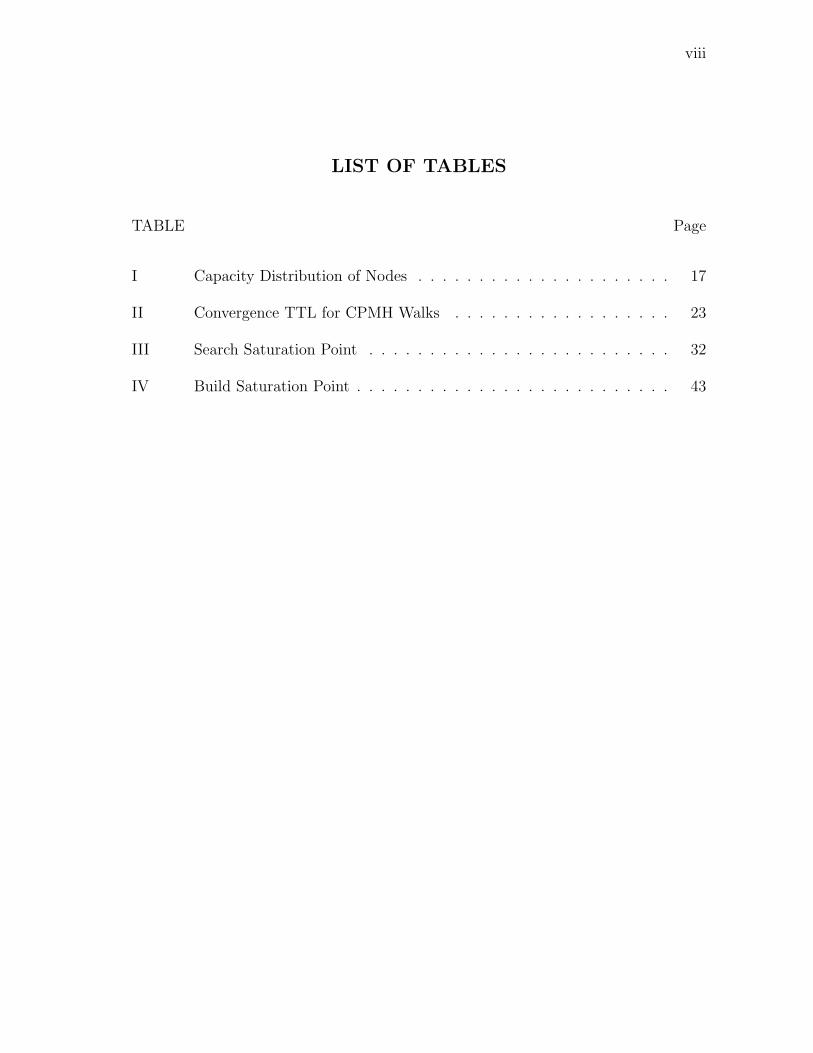
I Capacity Distribution of Nodes . . . . . . . . . . . . . . . . . . . . . 17
II Convergence TTL for CPMH Walks . . . . . . . . . . . . . . . . . . 23
III Search Saturation Point . . . . . . . . . . . . . . . . . . . . . . . . . 32
IV Build Saturation Point . . . . . . . . . . . . . . . . . . . . . . . . . . 43
Page 9
ix
LIST OF FIGURES
FIGURE Page
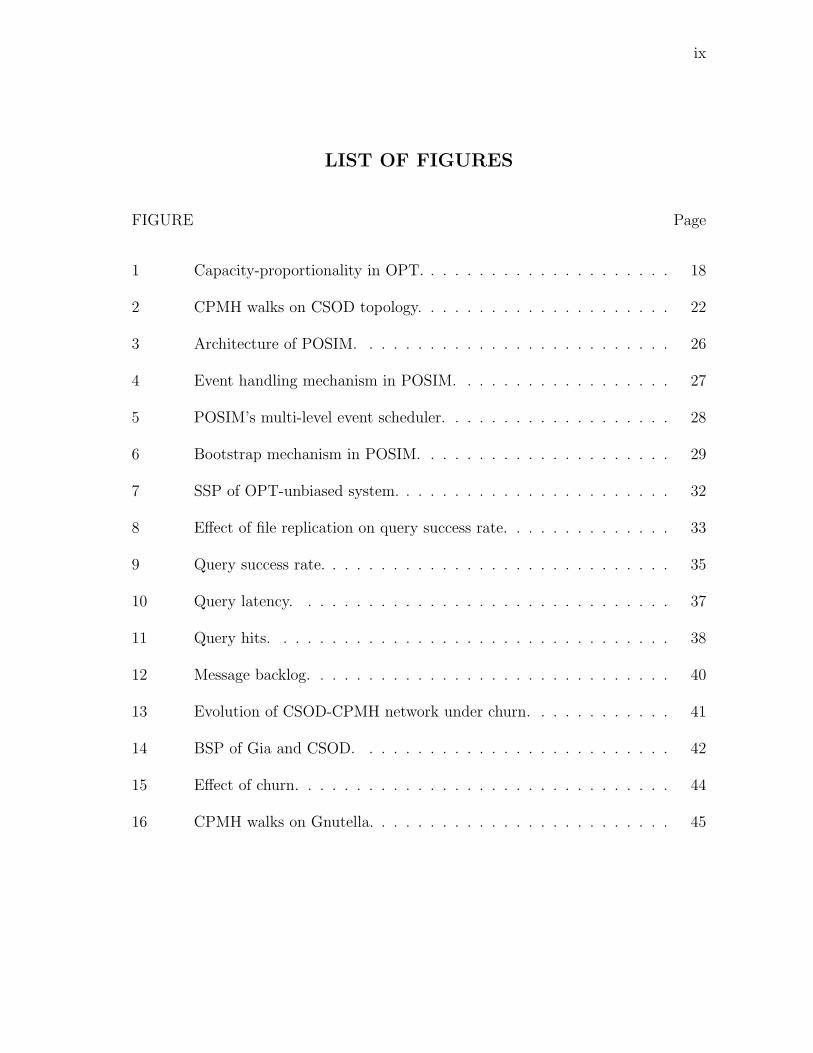
1 Capacity-proportionality in OPT. . . . . . . . . . . . . . . . . . . . . 18
2 CPMH walks on CSOD topology. . . . . . . . . . . . . . . . . . . . . 22
3 Architecture of POSIM. . . . . . . . . . . . . . . . . . . . . . . . . . 26
4 Event handling mechanism in POSIM. . . . . . . . . . . . . . . . . . 27
5 POSIM’s multi-level event scheduler. . . . . . . . . . . . . . . . . . . 28
6 Bootstrap mechanism in POSIM. . . . . . . . . . . . . . . . . . . . . 29
7 SSP of OPT-unbiased system. . . . . . . . . . . . . . . . . . . . . . . 32
8 Effect of file replication on query success rate. . . . . . . . . . . . . . 33
9 Query success rate. . . . . . . . . . . . . . . . . . . . . . . . . . . . . 35
10 Query latency. . . . . . . . . . . . . . . . . . . . . . . . . . . . . . . 37
11 Query hits. . . . . . . . . . . . . . . . . . . . . . . . . . . . . . . . . 38
12 Message backlog. . . . . . . . . . . . . . . . . . . . . . . . . . . . . . 40
13 Evolution of CSOD-CPMH network under churn. . . . . . . . . . . . 41
14 BSP of Gia and CSOD. . . . . . . . . . . . . . . . . . . . . . . . . . 42
15 Effect of churn. . . . . . . . . . . . . . . . . . . . . . . . . . . . . . . 44
16 CPMH walks on Gnutella. . . . . . . . . . . . . . . . . . . . . . . . . 45
Page 10
1
CHAPTER I
INTRODUCTION
Recent measurement study [20] shows that P2P overlay hosts are of varying capacities,
where capacity is defined as the number of requests that can be processed in unit time.
If a P2P system is not capacity-aware, the low-capacity nodes may be overwhelmed by
messages, even when many higher capacity peers in the network are still under-loaded.
Therefore node heterogeneity plays an important role while designing an unstructured
P2P system. In this thesis, we propose a system for maximizing throughput of a
heterogeneous unstructured P2P network by distributing the overlay traffic among
the peers proportional to their capacity.
1.1 Basics
There are three key components of an unstructured P2P system – overlay topology,
search methodology, and replication strategy. In this thesis, we assume an unstruc-
tured P2P network that utilizes random walks (as opposed to flooding [5], [27] or some
hybrid methods [16], [28]) for building these constituents of the system. Accordingly,
based on their purpose, there are three types of random walks: build, search, and
replication respectively. Build walks are used for selecting neighbors in the network.
A P2P node, seeking a new neighbor, starts a build walk with TTL = kb and se-
lects the peer at the end of the walk as its neighbor. The transition probability of
these random walks influences the topology of the resulting overlay. Once the graph
The journal model is IEEE/ACM Transactions on Networking.
Page 11
2
is built, search walks are subsequently used for discovering the desired content. A
P2P node, looking for a file, starts a random walk with TTL = ks and forwards
its query to other peers in the network. This query will be successful if the search
walk passes through a node that shares the required file. To increase query success
rate and achieve redundancy, nodes replicate their shared files to other peers. During
replication, a node i starts a replication walk with TTL = kr and selects one or more
nodes along the walk to hold pointers to all of i’s content. After replication, any query
for node i’s content can also be answered by one of its replicas thereby improving the
query success rate of the P2P system.
Node churn, which consists of peer join and leave events, is common in P2P
networks. During churn, nodes start build walks to restore their lost neighbors,
resulting in extra network traffic. P2P systems should handle churn dynamics without
getting backlogged and thereby inhibiting their ability to perform application-specific
tasks such as searching and replication. To quantify this overlay characteristic, we
define a metric called Build Saturation Point (BSP) as the maximum node departure
rate rc for which the average queue length at nodes E[Q] ≤ c, after a certain fixed
time t, for some constant queuing delay c. Networks with higher BSP experience less
overhead due to churn.
Nodes in a P2P network provide service to other peers by processing their build,
search, and replication requests. The capacity of a node quantifies its willingness to
accept requests from other nodes. Thus, we assume that node capacity Ci limits the
rate of processing of incoming messages and the number of replicas stored at a node.
As random walks generate significant traffic in the network, the maximum rate at
which walks can be completed in the overlay can be used to quantify the overlay’s
capacity. We call this maximum completion rate achieved as the Search Saturation
Point (SSP) of an overlay network. Networks having higher SSP can support higher
Page 12
3
query rates.
A well-designed P2P system should possess build, search, and replication com-
ponents that guarantee close to optimal saturation points and end-to-end parameters
such as query success rates. Next, we discuss the challenges involved in designing
these three components and then outline our proposed system to address those is-
sues.
1.2 Overlay Topology
Some P2P algorithms for heterogeneous networks rely on creating an overlay topology
where the node degree di is linearly proportional to its capacity Ci. But in real
networks, with diverse node capacities [20], this linear dependence often results in
nodes with very large degree. Such high degree may not be feasible in practice due to
the high overhead involved in maintaining a large number of neighbor connections.
Another method [3] to support heterogeneous networks is to match a node’s
capacity with that of its neighbors using dynamic topology adaptation, which involves
nodes constantly replacing their existing neighbors with better ones. Furthermore, in
a P2P network with heavy-tailed lifetimes [26], most of the nodes depart the system
quickly, causing an almost constant capacity-mismatch among neighbors. This may
trigger continuous adaptation resulting in a low BSP for the overlay.
1.3 Search Methodology
Search walks usually constitute a major portion of random walk traffic in the network.
To utilize the heterogeneity of overlay nodes, search load has to be distributed in the
network based on node capacity. To achieve this traffic distribution, existing search
methodologies rely on special overlay properties. For example, building an overlay
Page 13
4
with property di = Ci and then running unbiased search walks on this topology will
result in capacity-proportional search traffic through nodes. But due to churn in
P2P networks, it may be difficult to maintain such special overlays, and the resulting
deviations from the desired topology will reduce the SSP of these systems.
1.4 Replication Strategy
Replication involves maintaining pointers to files shared by other nodes in the network
and responding to queries for any of these replicated files. Therefore, replication
service provided by a node can be treated as an additional load on it. Also in a
heterogeneous network, higher capacity nodes receive more query walks than the
ones with lower capacity. Therefore the replication responsibility should also be
shared according to node capacities. Existing schemes like 1-hop replication [3], in
which replicas are stored on immediate neighbors, rely on the overlay topology to
place higher replication responsibility on high-capacity nodes. As discussed above,
the dependence on a special overlay makes it vulnerable to topology changes due to
churn.
As there is no well-known correlation between file-popularity and the capacity
of nodes sharing the file, 1-hop replication scheme is biased against files shared by
low-capacity peers.
1.5 Our Contributions
In this thesis, we first show the conditions for throughput-optimality in a P2P network
and also provide a framework for achieving it. This framework is then used for
designing our proposed system.
Given the number of nodes n, set of node capacities {C1, C2, . . . , Cn}, average
Page 14
5
degree d and random walk length k > 1, we define a network N and search algorithm
S to be throughput-optimal, if (N ,S) achieves the maximum SSP =∑n
i=1 Ci/k. We
prove that in a heterogeneous network, this optimality can be realized if the stationary
probability of random walks visiting a node i is
πi =Ci∑n
j=1 Cj
. (1)
Such walks result in capacity-proportional traffic through nodes in the network.
One of the observations we make here is that, when all nodes in the network are
congested, further increase in the input rate of random walks will decrease the rate
of completion of walks, even though the rate at which individual messages being
processed remains constant.
We then provide a framework called Capacity-Proportional Metropolis-Hastings
(CPMH) for achieving this optimal stationary distribution π. CPMH applies the
Metropolis-Hastings algorithm [4], [13], a Markov chain based sampling method, to
calculate the transition probability of random walks. CPMH does not impose ad-
ditional restrictions on the overlay topology to achieve capacity-proportionality. To
illustrate this, we apply CPMH on various topologies (such as BA [2] and Gnutella
[10]) and show the convergence of random walks to the target stationary distribution
given by (1).
Next, we build a heterogeneous P2P system by designing its three components
– topology, search and replication. We propose an overlay topology called Capacity
Scalable Out Degree (CSOD), in which the out-degree dout(i) of node i is given by
dout(i) = 4 + b15 log10 Cic. (2)
Observe that in CSOD the out-degree is not linearly-proportional to its capacity
and hence it is more scalable, when compared to the overlay topologies presented
Page 15
6
in [25]. Among the topologies evaluated with CPMH walks, CSOD achieves the
fastest convergence to the target π. On this topology, we use CPMH search walks for
achieving capacity-proportional query load among nodes in the network. We call our
resulting system CSOD-CPMH.
To address the drawbacks of existing replication schemes such as 1-hop replica-
tion, we propose a method called CPMH-replication. This scheme uses CPMH walks
for replication and places greater replication responsibility on higher capacity nodes,
without requiring a special overlay topology.
For evaluating our proposed system we have designed a discrete-event simulator
called POSIM. It can be used for analyzing various topology construction methods
and file replication techniques. In POSIM, the simulation scenario can be customized
using various models for node capacities, node lifetimes, query generation and file
popularity. POSIM has a modular architecture which separates the simulation sce-
nario from the P2P system specific components such as neighbor selection and query
propagation. This enables easy extensions to POSIM for simulating new overlay net-
works. POSIM has a multi-level event scheduler which can be optimized for faster
simulations, based on the event generation pattern of the simulated system.
Using POSIM, we perform simulation-based evaluation of the proposed CSOD-
CPMH system and compare its performance with Gia. Simulations show that CSOD-
CPMH has higher SSP = 27.75 walks/s when compared to Gia with SSP = 6.60
walks/s. Higher SSP shows the ability of the proposed system to support higher rate
of random walk traffic than Gia. CSOD-CPMH also has a higher BSP = 40 nodes/s,
which is 100 times that of Gia, quantifying its ability to handle more churn events.
CPMH-replication is evaluated by comparing it with 1-hop replication. The proposed
replication scheme is found to result in up to 20% higher query success rate.
We finally perform end-to-end evaluation of CPMH-CSOD using query metrics
Page 16
7
such as success rate, latency, query-hits and message backlog. CSOD-CPMH system
beats Gia in all these measures for various replication schemes. In a static network
with CPMH-replication, CSOD-CPMH achieves 15% higher query success rate, with
a tenth of query latency, and twice the number of query-hits when compared to Gia.
We also evaluate these networks under churn by simulating Poisson node arrivals with
Pareto lifetimes and find that CSOD-CPMH gets 20% higher query success rate at
half the latency when compared to Gia.
CPMH is shown to achieve the optimal capacity-proportional traffic through
nodes, without requiring any special overlay topology. This property enables an
incremental deployment of the proposed P2P components on existing networks such
as Gnutella.
The rest of the thesis is organized as follows. In Chapter II, we discuss related
work. In Chapter III, we establish optimality of capacity-proportional networks and
in Chapter IV, we describe the CPMH framework and build a capacity-proportional
system using it. In Chapter V, we describe the design of the P2P simulator used in
this research. In Chapter VI, we provide simulation results, and in Chapter VII we
conclude the thesis.
Page 17
8
CHAPTER II
RELATED WORK
Many random walk techniques [1], [7], [8], [17], [23] have been proposed to reduce the
overhead of flooding in unstructured P2P systems like Gnutella [10]. These methods
have been adapted [3], [25] for utilizing heterogeneity commonly observed [20] in
P2P networks. The existing methods rely on special topologies to provide greater
responsibility to high-capacity nodes, in an attempt to increase the throughput of the
system.
2.1 Complete System
Chawathe et al. [3] propose Gia, an unstructured P2P network in which nodes seek
suitable neighbors to match their capacity by a process called dynamic topology adap-
tation, which involves replacing existing neighbors with more suitable options based
on their capacity and degree. In Gia, the rate of adaptation of nodes is controlled by
their satisfaction level, which indicates whether their neighbors have enough capacity
to handle the arriving traffic. In addition to this, Gia uses a flow-control mechanism
to prevent overwhelming of nodes. Routing is performed by deterministically forward-
ing queries to the highest-capacity neighbor with enough flow tokens, thus reducing
the randomness of query walks. To minimize the effect of churn, Gia also defines
complicated neighbor selection rules which make it hard to fine tune and adapt to
networks with different capacity distributions.
Page 18
9
2.2 Individual Components
Prior work in [15], [25] proposes random walk techniques for designing individual
components such as topology and search for a heterogeneous P2P system. However
they do not attempt to optimize the system as a whole, which is our focus in this
thesis.
Vishnumurthy et al. [25] discuss several build and search walk strategies for
heterogeneous networks. In these methods, nodes maintain their out-degree dout(i)
linearly proportional to their capacity Ci and then bias the build walks to achieve an
in-degree din(i) = dout(i). To achieve this degree distribution, their proposed system
Swaplinks uses two kinds of build walks whose transition probabilities, for walking
from node i to j, are given by
p(i, j) =
1/din(i) j ∈ Nin(i),
0 j /∈ Nin(i),
(3)
p(i, j) =
1/dout(i) j ∈ Nout(i),
0 j /∈ Nout(i),
(4)
where Nin(i) and Nout(i) represent set of in- and out-neighbors of the node i respec-
tively. Build walks biased by (3) are used when a new node joins the network. And
when an existing node replaces one of its lost out- or in-neighbors, the walks are
biased by (3) or (4) respectively.
Kwong et al. [15] propose a protocol for building heterogeneous P2P networks,
where a node joining the network starts random walks to preferably connect to nodes
with high capacity per neighbor. In this system, the stationary probability of build
Page 19
10
walks is given by
πi =Ci/di∑n
j=1 Cj/dj
,
where n is the number of nodes in the network. The transition probability of these
walks is calculated using the Metropolis-Hastings algorithm [13].
2.3 Other
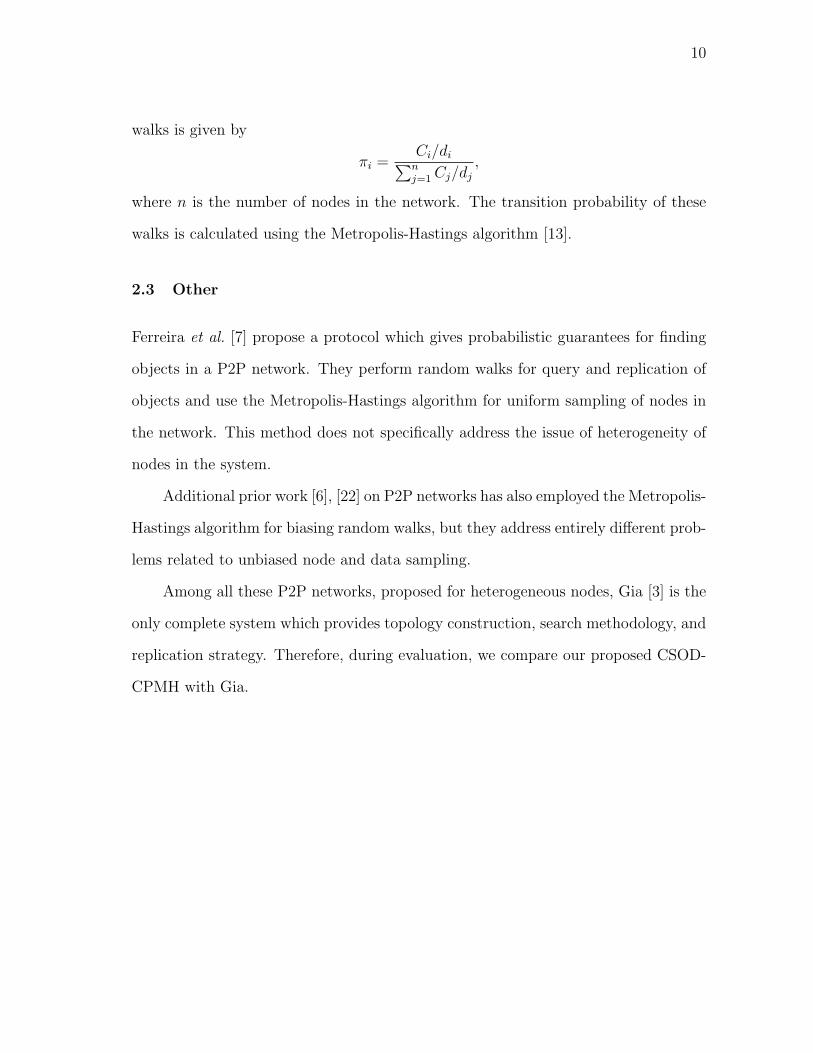
Ferreira et al. [7] propose a protocol which gives probabilistic guarantees for finding
objects in a P2P network. They perform random walks for query and replication of
objects and use the Metropolis-Hastings algorithm for uniform sampling of nodes in
the network. This method does not specifically address the issue of heterogeneity of
nodes in the system.
Additional prior work [6], [22] on P2P networks has also employed the Metropolis-
Hastings algorithm for biasing random walks, but they address entirely different prob-
lems related to unbiased node and data sampling.
Among all these P2P networks, proposed for heterogeneous nodes, Gia [3] is the
only complete system which provides topology construction, search methodology, and
replication strategy. Therefore, during evaluation, we compare our proposed CSOD-
CPMH with Gia.
Page 20
11
CHAPTER III
OPTIMAL NETWORK
In this section, we define an optimal network and provide the stationary distribution
of random walks required to realize this optimality.
3.1 Basics and Assumptions
The P2P systems considered in this thesis use random walks for key overlay operations
such as topology construction, search, and content replication. As a result, a major
part of the overlay traffic is due to random walks, and hence the rate of walks that
can be handled by a P2P system can determine its throughput. Therefore we define
a network to be throughput-optimal if it achieves the maximum rate of completion of
random walks.
As shown in [20], P2P networks are capacity-heterogeneous. Here, the capacity
Ci of a node i is the maximum rate at which it can handle incoming messages.
The traffic distribution among nodes in the network, due to random walks, can be
controlled by the stationary probability π of these walks. If T is the total traffic rate
in the network then the average rate of incoming messages at node i
Ti = πiT, (5)
where πi is the stationary probability for the walks to visit node i. Intuitively, to
achieve maximum completion of random walks in the network, the traffic distribution
among nodes should be proportional to their capacity. In this section, we provide a
simple proof for this.
Page 21
12
Consider a connected, undirected graph G with n nodes. In this network, random
walks are started, which jump according to a Markov chain with transition probability
matrix P . Walks are started from a node i at rate λi and continue for k hops. Let
Λ =∑n
i=1 λi be the total rate at which walks are started in the network and let M
be the completion rate of walks. At a node i, if Ti > Ci then messages are added
to its input queue which is processed by the node at rate Ci. By its definition, a
throughput-optimal network achieves maximum M =∑n
i=1 Ci/k, for a given n and
capacity distribution {Ci}. Theorem 1 finds the optimal πi to maximize M .
Lemma 1. Assume that random walks are started at each node with rate λi and
proceed according to a positive irreducible Markov chain with transition matrix P . If
k is larger than the mixing time of P , the following holds
Ti = πi
n∑j=1
λjk, (6)
where πi is the unique solution to π = π P .
Theorem 1. Assuming k is sufficiently large, the optimal stationary distribution of
random walks is
πi =Ci∑n
j=1 Cj
. (7)
Proof. Let T (h) be the arrival traffic rate of hop-h walks in the network, then the
rate at which this traffic reaches node i is
Ti(h) =πiT (h), (8)
where 1 ≤ h ≤ k. The rate at which these walks are handled by node i is
µi(h) =
Ti(h) Ti ≤ Ci,
Ti(h)Ti
Ci Ti ≥ Ci.
(9)
Page 22
13
Completion rate of walks in the network is the rate at which the last hop messages
of walks are handled. Therefore, for random walks with TTL = k, the completion
rate
M =n∑
i=1
µi(k). (10)
This completion rate is bounded by the rate at which random walks are started
in the network (i.e., M ≤ Λ) and by the total capacity of the nodes in the system
M ≤∑n
i=1 Ci
k. (11)
We next show that there exists πi such that M = Λ =∑n
i=1 Ci/k.
The minimum Λ for achieving maximum M is
Λ =
∑ni=1 Ci
k. (12)
But when Λ is more than the total capacity of the network, nodes get backlogged,
and M is reduced when compared to the no-backlog case. Therefore for maximizing
M ,
Λ ≤∑n
i=1 Ci
k. (13)
Consider the stationary distribution πo defined as
πoi =
Ci∑nj=1 Cj
. (14)
For Λ given by (12), the traffic rate at any node i
Ti = πoi Λk =
Ci∑nj=1 Cj
∑ni=1 Ci
kk = Ci.
Therefore, none of the nodes in the network is backlogged and the completion
Page 23
14
rate of the random walks
M =n∑
i=1
µi(k) =n∑
i=1
πiΛ =
∑ni=1 Ci
k.
Since the maximum M is achieved, the stationary distribution πo is optimal. We
next show its uniqueness.
For any other stationary distribution π′ 6= πo, there exist nodes j and m such
that π′j > πoj and π′m < πo
m. In this case, j is backlogged and therefore the completion
rate at j
µj(k) =T ′
i (k)πj
T ′πj
Cj ≤ Cj
k, (15)
since T ′(k)/T ′ ≤ 1/k.
Similarly, for fixed Λ, the completion rate at m
µm(k) = π′mT ′(k) < πomT (k) ≤ Cm
k, (16)
where T ′(k) ≤ T (k) due to backlog.
Therefore the maximum M is not achieved with π′, making it suboptimal. Hence,
M is maximized if and only if (7) holds.
Based on the stationary distribution π achieved by its random walks, a P2P
system supports certain maximum walk completion rate M . We next use this property
to quantify the capacity of P2P systems in supporting their search walks.
3.2 Search Saturation Point
End-to-end metrics like query success rate depend on various components of a P2P
system such as peer topology and replication strategy. Therefore to evaluate an
overlay network we need a metric which is independent of the file-replication strategy.
For this purpose, we define a new metric, we call Search Saturation Point (SSP), to
Page 24
15
express the capacity of an overlay topology in supporting its search walks.
Consider an overlay graph G with n nodes having capacity distribution {Ci} and
an average node degree d. In this network, random walks of length k are started
from randomly selected nodes. Let Λ be the rate at which these walks are started
and M be the completion rate of the walks. In such a network, as Λ increases, M
also increases till a certain point where the network is saturated. Beyond this point,
increase in Λ increases the message backlog at nodes and decreases M . We define the
unique maximum rate of completion of random walks M achieved in a given overlay
G as its SSP .
SSP = maxΛ
[M ]. (17)
In a P2P system using search walks, SSP quantifies the overlay’s ability to sup-
port search traffic. Unlike graph properties such as expansion (λ2), which character-
ize its topological properties, SSP is a more direct measure of the overlay’s effect on
queries which are run over it. During evaluation, we perform simulations to obtain
SSP of various P2P networks.
3.3 Centralized Construction
While comparing different overlays using SSP we need a standardized bound to get
the measure of the results. For this purpose, we create an optimal network (OPT)
which has the maximum SSP for a given capacity distribution {Ci}. In this section,
we outline a centralized construction of OPT using Algorithm 1.
To obtain optimal stationary distribution πo, we first construct a network in
which di = Ci. Then running unbiased random walks on this network will result in
Page 25
16
stationary distribution
πi =di∑n
j=1 dj
=Ci∑n
j=1 Cj
= πoi .
Algorithm 1 Create Optimal topology
1: C ← capacities of n nodes.
2: for each node i do
3: di ← C[i] . Required degree.
4: AS ← C . Available neighbor slots.
5: for each neighbor j of node i do
6: AS[j] ← 0 . Avoid duplicate edges.
7: end for
8: AS[i] ← 0 . Avoid self loops.
9: tas =∑n
j=1 AS[j] . Total available slots.
10: while (di > 0 && tas > 0) do
11: r ← getRandomNode(AS) . Biased by AS.
12: addEdge(i, r)
13: AS[r] ← 0 . Update available slots.
14: tas ← tas− C[r]
15: C[r] ← C[r]− 1 . Update unsatisfied degree.
16: C[i] ← C[i]− 1
17: di ← di − 1
18: end while
19: end for
Algorithm 1, first populates node capacities C generated from the given distri-
bution {Ci}. Here, for each node i, the goal is to select di = Ci neighbors from the
Page 26
17
Table I. Capacity Distribution of Nodes
Capacity Fraction
1 0.65
10 0.3
100 0.049
1000 0.001
available neighbor slots AS. While choosing neighbors of i, self-loops and duplicate
edges are prevented by not considering the available slots of i (Line 8) and its existing
neighbors (Lines 6, 13). Using this AS vector, a random neighbor r is selected in
Line 11 with probability
p(r) =AS[r]∑nj=1 AS[j]
,
which ensures that the generated graph is random, and nodes requiring high-degree
get sufficient neighbors. This step is continued till no more available slots are left or
the required degree di is met.
The graphs constructed using Algorithm 1 have di ≈ Ci. For generating graphs
with exact degree distributions one can use randomized variations of Havel-Hakimi
algorithm [9], [24]. But unlike these methods, which are designed to guarantee con-
nectivity and degree distribution, Algorithm 1 is faster and simpler due to its relaxed
constraints. This algorithm can also produce graphs with a degree distribution close
to the required distribution, even when the exact target degree-set is infeasible.
Algorithm 1 is applied to construct networks with 10, 000 nodes having capacity
distribution as shown in Table I, which is obtained by prior measurements [20] of the
Gnutella network. The target degree of nodes is twice their capacity, i.e., di = 2Ci.
In these simulations, Algorithm 1 generated connected graphs with the desired set of
Page 27
18
100
10210
0
101
102
103
104
node capacity (Ci)
aver
age
node
deg
ree
simulationcapacity proportional
(a) degree
100
10210
2
103
104
105
106
node capacity (Ci)
aver
age
node
traf
fic (
T i)
simulationcapacity proportional
(b) traffic
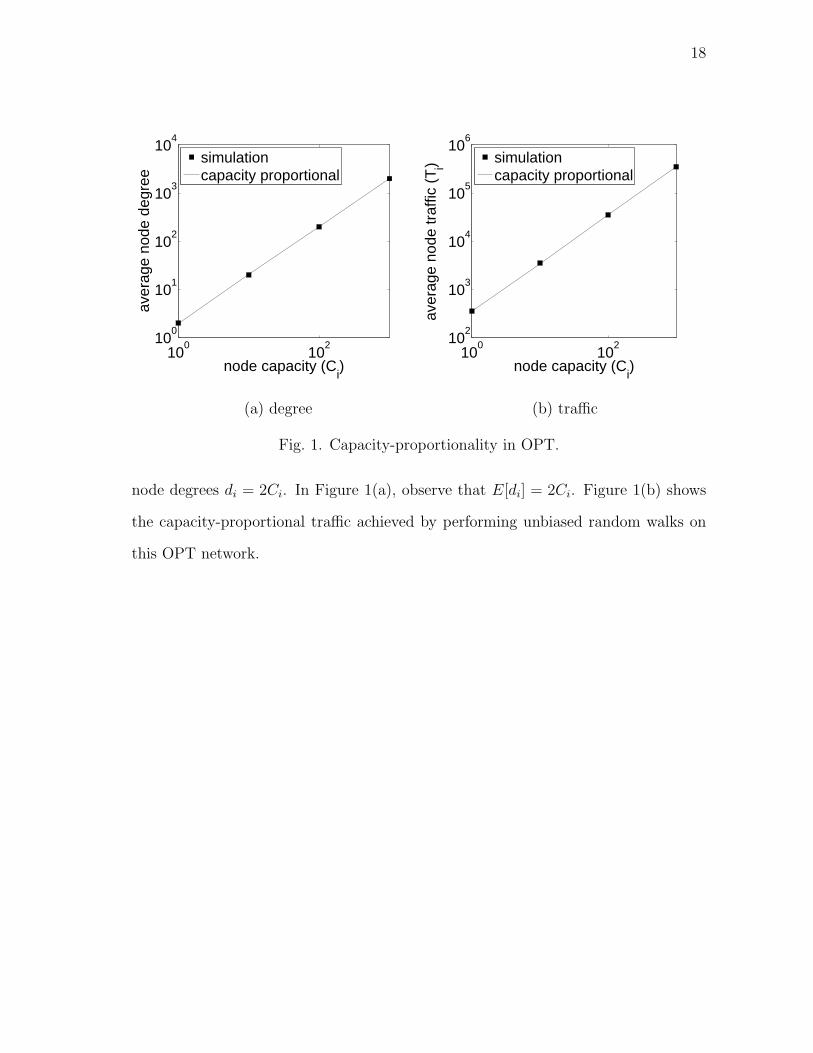
Fig. 1. Capacity-proportionality in OPT.
node degrees di = 2Ci. In Figure 1(a), observe that E[di] = 2Ci. Figure 1(b) shows
the capacity-proportional traffic achieved by performing unbiased random walks on
this OPT network.
Page 28
19
CHAPTER IV
DESIGNING CAPACITY-PROPORTIONAL SYSTEM
The previous section shows that in a throughput-optimal network, random walks
have capacity-proportional stationary probability given by (7). This section provides
a framework for designing these optimal random walks. This framework is then used
to build the components of our proposed P2P system.
4.1 CPMH Framework
The stationary distribution π of random walks depends on their transition probability
P , and the overlay topology Γ on which they are started. Therefore to achieve a
particular π, one can construct overlays with special properties, such as di = Ci, and
run random walks with certain P on these networks. But in a P2P network under
churn, maintaining such special overlays is challenging. Therefore it is desirable to
design a P which achieves the desired π, without requiring a certain topology. In this
direction, we use the Metropolis-Hastings algorithm, a Markov chain based sampling
method [4], [13], to find P , which achieves the optimal capacity-proportional πo. We
call this technique Capacity-Proportional Metropolis-Hastings (CPMH).
In CPMH, the next transition of a random walk, currently at node i, is found in
two steps. First, one of the neighbors j of node i is selected as a candidate-transition
based on probability
q(i, j) =
Cj/∑
x∈N(i) Cx j ∈ N(i),
0 j /∈ N(i),
(18)
Page 29
20
where N(i) is the set of neighbors of node i.
Next, the random walk transitions to the above selected node j with probability
α(i, j) or stays at node i with probability 1−α(i, j), where the acceptance probability
α is given by
α(i, j) =
min(1,
∑x∈N(i) Cx∑x∈N(j) Cx
)j ∈ N(i),
0 j /∈ N(i).
(19)
4.1.1 Self Transitions
In CPMH, self transition of a walk at node i occurs, when a selected candidate
transition (i → j) is rejected, with probability 1 − α(i, j). From (19), observe that
the acceptance probability α(i, j) is low for transitions from a high-capacity node i to
a low-capacity node j. Therefore, when a random walk hits a high-capacity node in
its path, it is likely to undergo self-transitions and stay there. But in a real network,
these self-transitions are just virtual hops and do not count toward network traffic.
Hence, the actual length of random walks passing through high-capacity nodes is
shorter. If the replication scheme ensures that high-capacity nodes in the network
share more resources, then walks passing through these high-capacity nodes may need
to visit fewer peers to get the required number of query hits. Therefore the TTL of
CPMH walks is implicitly adapted based on the capacity of nodes visited.
4.2 Topology Construction
In this section, we describe the overlay topology of our proposed system. In this
network, a new node i joining the system will start dout(i) build walks for selecting its
out-neighbors among existing peers. The desired out-degree dout(i) of node i is given
Page 30
21
by
dout(i) = a + bb log10 Cic, (20)
where a and b are constants. During simulations, we use a = 4 and b = 15 to achieve
an average degree equal to that of other networks evaluated in this thesis.
In (20), observe that the out-degree of a node is not linearly proportional to its
capacity and therefore it scales well in networks with wide-range of node capacities.
Hence we call this topology Capacity Scalable Out-Degree (CSOD).
The build walks used here are unbiased random walks, as in BA [2], which is a
network model for constructing graphs with heavy-tailed degree distribution. Instead,
if CPMH walks are used for construction, it results in nodes with in-degree linearly
proportional to their capacity. Such high degree may not be feasible in practice,
due to the overhead involved in maintaining a large set of neighbors. We assume
that, in a P2P network, the build traffic is insignificant compared to the volume of
search. Therefore the use of unbiased build walks has little effect on the capacity-
proportionality of traffic through nodes in the network.
Figure 2(a) shows the average node degree in a 10, 000 node CSOD network
having capacity distribution given by Table I. Figure 2(b) shows the average traffic
through nodes in this network, due to CPMH walks of TTL = 1024. Observe that
the node degree in the network is scalable with capacity but the traffic through nodes
is still capacity-proportional.
4.2.1 CPMH Walk Convergence
CPMH does not require a special topology such as CSOD for achieving capacity-
proportionality. To illustrate this, we show the convergence of CPMH walks to the
optimal stationary distribution πo, in topologies such as BA [2] and Gnutella [10],
Page 31
22
100
10210
0
101
102
103
104
node capacity (Ci)
aver
age
node
deg
ree
simulationcapacity proportional
(a) degree
100
102
102
103
104
105
node capacity (Ci)
aver
age
node
traf
fic (
T i)
simulationcapacity proportional
(b) traffic
Fig. 2. CPMH walks on CSOD topology.
which do not consider node capacity during construction.
To measure the convergence of random walks, a difference metric, defined in [30],
is used. If {x1, x2, . . . , xm} be the set of unique capacities of nodes in the network,
then the convergence error of CPMH walks is given by
c =1
2
m∑j=1
∣∣∣∣∣
∑i|Ci=xj
Ti∑ni=1 Ti
−∑
i|Ci=xjCi∑n
i=1 Ci
∣∣∣∣∣. (21)
On the evaluated topologies, CPMH walks are started at 50 walks/s. The TTL
of these walks is varied and the convergence c is calculated after 1000 s of simulation.
Using the above metric, we consider walks to be converged when c ≤ 0.01. Table
II shows the minimum TTL required to achieve convergence of CPMH walks on
various topologies. Observe that the capacity-aware CSOD topology achieves faster
convergence to πo than Gnutella and BA networks.
Page 32
23
Table II. Convergence TTL for CPMH Walks
Topology TTL
CSOD 50
Gnutella 620
BA 640
4.3 Search Methodology
In our proposed system, CPMH walks are used for propagating search requests. In
this network, a node i, looking for a file, will start a search walk of TTL = ts. When
this walk passes through a node containing the required file, a query-hit message is
sent back to i. The search walk would continue in the network till its TTL reduces
to 0 or the maximum number of query-hits, specified by the query-initiator i, are
reached. For a query to succeed, it should result in at least one query-hit message.
As CPMH walks are used for query propagation, the search load in the proposed
system is capacity-proportional.
To indicate the topology, and the type of search walks used, we call the proposed
system CSOD-CPMH.
4.4 Replication Strategy
In a P2P network, file replication involves storing replicas of shared files in other
nodes. Replication is used to improve the query success rate and reduce the query la-
tency by making the shared files available in the path of search walks. The replication
scheme determines the replica node selection criteria followed by a P2P node. One-
hop [3], and random-walk replication [7], [21] are the two most common replication
Page 33
24
schemes used in unstructured P2P networks. To ensure a capacity-proportional distri-
bution of replication load in the network, we propose to use the random-walk replica-
tion scheme with CPMH walks and call this strategy CPMH replication (CPMH-rep).
In this scheme, to achieve a replication factor r, every node starts a CPMH walk with
TTL = kr. This walk first transitions for hf hops and then starts replicating at
every unique node visited, till the required replication factor r is achieved or its TTL
reduces to 0. The value of hf depends on the mixing time of random walks on the
network.
Unlike 1-hop replication which requires capacity-proportional degree distribu-
tion, CPMH-rep does not depend on any special topology for achieving capacity-
proportional replication load. Therefore, CPMH-rep ensures the desired replica dis-
tribution even in dynamic networks under churn.
Since there is no well-known correlation between file popularity and capacity of
nodes sharing a file, 1-hop replication scheme is biased against files shared by low-
capacity nodes. Random-walk replication schemes, such as CPMH-rep, overcome
this problem by ensuring equal replication of files shared by all nodes in the network,
irrespective of their capacity.
Page 34
25
CHAPTER V
SIMULATOR
For evaluating the proposed P2P system and to compare it with existing networks, we
have built a simulator called POSIM (P2P Overlay SIMulator). One of the possible
problems faced while evaluating an existing system is the difficulty in reproducing
its results due to unavailability of the simulator used, or lack of a good description
of the simulator and the simulation scenario [18]. We intend to avoid this problem
by making POSIM freely available along with necessary documentation [19]. In this
section, we briefly describe the features of POSIM and evaluate it using the criteria
proposed by Naicken et al. in [18].
5.1 Architecture
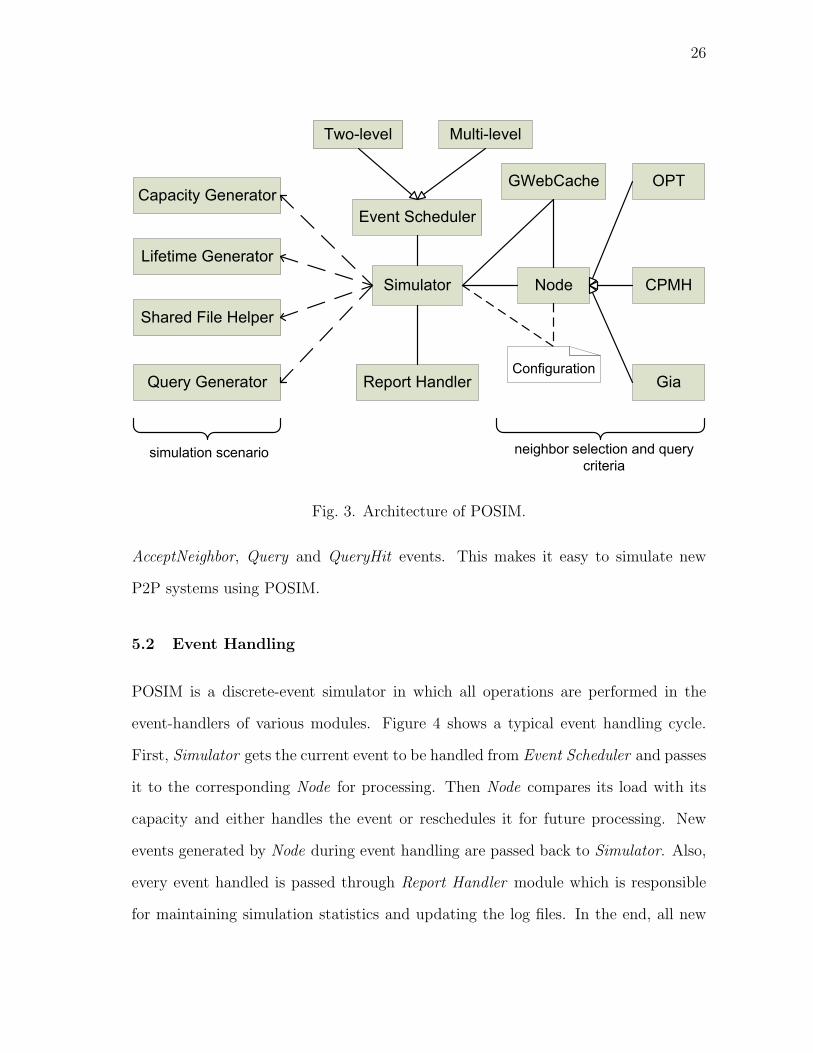
POSIM can be used to construct and evaluate different overlay topologies. Figure
3 shows the modular architecture of POSIM. It clearly separates the simulation sce-
nario from the neighbor selection and query criteria. The simulation scenario can be
defined using the capacity and lifetime distribution of nodes, popularity distribution
of shared files and query distribution among peers. There are different modules for
customizing these simulation parameters. In our simulations, we use Pareto distribu-
tion for node lifetimes and shared file popularity [29], and start queries as a Poisson
process. The neighbor selection and query forwarding rules depend on the P2P sys-
tem that is simulated and can be customized by defining a suitable Node module.
We have implemented nodes for OPT, CPMH and Gia systems, which can be ex-
tended for other networks by selectively overriding event-handlers for AddNeighbor,
Page 35
26
Simulator
Report Handler
Event Scheduler
Capacity Generator
Lifetime Generator
Shared File Helper
Query Generator
Two-level Multi-level
Node
OPT
CPMH
GiaConfiguration
neighbor selection and query
criteriasimulation scenario
GWebCache
Fig. 3. Architecture of POSIM.
AcceptNeighbor, Query and QueryHit events. This makes it easy to simulate new
P2P systems using POSIM.
5.2 Event Handling
POSIM is a discrete-event simulator in which all operations are performed in the
event-handlers of various modules. Figure 4 shows a typical event handling cycle.
First, Simulator gets the current event to be handled from Event Scheduler and passes
it to the corresponding Node for processing. Then Node compares its load with its
capacity and either handles the event or reschedules it for future processing. New
events generated by Node during event handling are passed back to Simulator. Also,
every event handled is passed through Report Handler module which is responsible
for maintaining simulation statistics and updating the log files. In the end, all new
Page 36
27
SimulatorEvent
SchedulerReport Handler
Node
1. get next event
9. schedule events
2. handle event
3. can handle
event?
4. handle or
reschedule event
5. {new events}
6. log event
8. {new events}
7. update logs
(next event)
Fig. 4. Event handling mechanism in POSIM.
events generated in this cycle are scheduled by Event Scheduler.
Unlike most of the existing P2P simulators [18], which are written in Java,
POSIM is implemented in C++. The core of POSIM is an event scheduler responsible
for scheduling millions of events generated by various modules of the simulator. A
simple event scheduler can be realized by a min-heap implementation of a priority
queue. But while building POSIM, we observed that the scheduler’s performance can
be improved by separating coarse and fine-grained events using 2-level or multi-level
event schedulers. Our 2-level scheduler has 2 min-heaps to store scheduled events. In
this scheduler, if the event to be scheduled is within δ time from the previous event,
it is inserted into the first heap. If the event is more distant, then it is stored in the
second heap. For processing a scheduled event, the earliest event from the two heaps
is selected.
Figure 5 shows the data structure of the multi-level scheduler. It consists of n
min-heaps, which store scheduled events in successive time intervals of length ∆. If
an event to be scheduled does not fall into one of these n time slots, then it is inserted
into an unsorted list of future events. When all these heaps become empty, the future
events in the next n∆ time slot are inserted into the n heaps. Use of multiple heaps
Page 37
28
H HnHFuture Events
t
sorted unsortedts ts+n∆
∆
...
Fig. 5. POSIM’s multi-level event scheduler.
reduces the number of elements m in a heap and therefore the insertion time of an
element O(log m) and extraction time of the minimum element O(log m) are also
reduced.
5.3 Bootstrapping
Bootstrapping is a mechanism through which a newly joined node learns about ex-
isting peers in the P2P network. GWebCache [12], [14] is a centralized bootstrapping
mechanism used by various Gnutella clients. POSIM also simulates the GWebCache
system as shown in Figure 6. When a Node is initialized, it contacts GWebCache
to get the bootstrap nodes for populating its local host-cache. Nodes also frequently
update their host-cache by exchanging ping and pong messages with their neighbors
as described in [3]. Entries in GWebCache are refreshed by nodes making the boot-
strap requests. In our simulations, we limit the cache size to 1000 entries and perform
random cache eviction when it is full.
5.4 Output
Most of the simulation parameters in POSIM can be configured through property
files and so it requires little code change to simulate different scenarios. During
simulations, one can collect query statistics like success percentage, latency (first
Page 38
29
GWebCache{central cache}
Simulator
Node{host-cache}
{bootstrap nodes}
update
host-cache
get bootstrap
nodes ping
update cache
Node{host-cache}
pong
Fig. 6. Bootstrap mechanism in POSIM.
query hit time), and the average number of query hits. In addition to these end-
to-end metrics, POSIM also supports evaluation of overlay topology using evolution
and distribution of node degree, traffic and congestion (message backlog) at nodes,
saturation points, and spectral properties (λ2 of the overlay graph). POSIM also
supports visualization of overlay graphs using Graphviz [11] by generating the .dot
representation.
With these features and its extensible design, POSIM can be used to simulate
new P2P systems enabling their direct comparison and critical evaluation of the
CSOD-CPMH network proposed in this thesis.
Page 39
30
CHAPTER VI
EVALUATION
In P2P systems using random walks for searching content in the network, user-
perceived metrics like query success rate can be maximized in two stages – 1) building
an overlay topology that supports high random walk completion rates, and 2) design-
ing a suitable replication scheme that ensures that shared files are present in paths
of these random walks, with high probability. On these lines, we follow a two-step
evaluation process, where we first compare the topology of various P2P networks in
supporting their search walks using SSP and then use end-to-end metrics to measure
the performance of these networks for different file replication schemes.
In this section, we perform a simulation-based evaluation of the proposed CSOD-
CPMH network and compare it with Gia-biased, OPT-unbiased, and CSOD-biased
systems. The naming convention followed here is: {topology}-{search walk}. For
example, the Gia-biased system uses the Gia topology, which is evolved by dynamic
topology adaptation [3], and capacity-biased search walks whose transition probability
is given by
p(i, j) =
Cj/∑
x∈N(i) Cx j ∈ N(i),
0 j /∈ N(i).
(22)
The OPT-unbiased system has the optimal topology constructed using Algorithm
1, and it uses unbiased walks for searching. As this system achieves optimal stationary
distribution πo, it is used as an upper bound while comparing various P2P systems.
The performance of CSOD-biased is also measured to evaluate the need for CPMH
search walks in the proposed CSOD-CPMH system.
Page 40
31
Flow-control in P2P systems is an additional mechanism to prevent message
backlog at nodes, but its benefits may be independent of the overlay topology and
the search strategy used. In this thesis, we focus on evaluating the effect of topology,
search and replication mechanisms on the throughput of P2P networks and so we
have not implemented flow-control mechanism in any of these systems.
6.1 Topology Evaluation
In this section, we perform simulations to calculate Search Saturation Point (SSP),
as defined in Section 3.2, of various overlay topologies.
In these simulations, we use search walks with ks = 1024 on networks with 10, 000
nodes having capacity distribution shown in Table I. In our experiments, to find SSP
of a network, we perform a binary search by varying the query rate Λ and measuring
the corresponding completion rate M . In every simulation, for a given Λ, the network
is allowed to stabilize before noting the corresponding M . Here, a network is said
to be stabilized if for 3 successive intervals, each of length 100 seconds, the rate of
completion of walks is within 5% of the previous completion rate. Figure 7(a) shows
this stabilization of M observed in the OPT-unbiased system, and Figure 7(b) plots
the SSP. Observe in the figure that the globally unique maximum M is 33.05 walks/s,
hence for the OPT-unbiased network SSP = 33.05.
Table III compares SSP of evaluated overlays. Observe that OPT-unbiased has
the highest SSP because, as discussed in Section 3.3, it achieves capacity-proportional
traffic through its nodes. The proposed CSOD-CPMH has higher SSP than Gia-biased
and CSOD-biased. Gia’s topology adaptation ensures that high-capacity nodes have
higher degree, but it does not achieve perfect capacity-proportionality, resulting in a
low SSP. CSOD-biased also has lower SSP when compared to CSOD-CPMH because
Page 41
32
0 500 10000
10
20
30
40
simulation time (seconds)
M (
wal
ks/s
)
(a) stabilization of M
0 50 100 1505
10
15
20
25
30
35
Λ (walks/s)
M (
wal
ks/s
)
33.05
(b) SSP = 33.05 walks/s
Fig. 7. SSP of OPT-unbiased system.
CSOD-biased uses capacity-biased search walks, which do not result in capacity-
proportional traffic, unlike the CPMH walks of CSOD-CPMH.
6.2 Replication Schemes
To evaluate the proposed CPMH replication, it is compared with 1-hop and no repli-
cation schemes. The replication factor for 1-hop replication scheme r = E[di] = 20.
For achieving this replication factor, during CPMH-rep, a node starts a replication
Table III. Search Saturation Point
Name SSP
OPT-unbiased 33.05
CSOD-CPMH 27.75
Gia-biased 6.60
CSOD-biased 5.94
Page 42
33
0 50 100 150 2000
20
40
60
80
100
query rate Λ (qps)
quer
y su
cces
s %
CPMH rep1−hop repno rep
(a) OPT-unbiased
0 50 100 150 2000
20
40
60
80
100
query rate Λ (qps)
quer
y su
cces
s %
CPMH rep1−hop repno rep
(b) CSOD-CPMH
0 50 100 150 2000
20
40
60
80
100
query rate Λ (qps)
quer
y su
cces
s %
CPMH rep1−hop repno rep
(c) CSOD-biased
0 50 100 150 2000
20
40
60
80
100
query rate Λ (qps)
quer
y su
cces
s %
CPMH rep1−hop repno rep
(d) Gia-biased
Fig. 8. Effect of file replication on query success rate.
Page 43
34
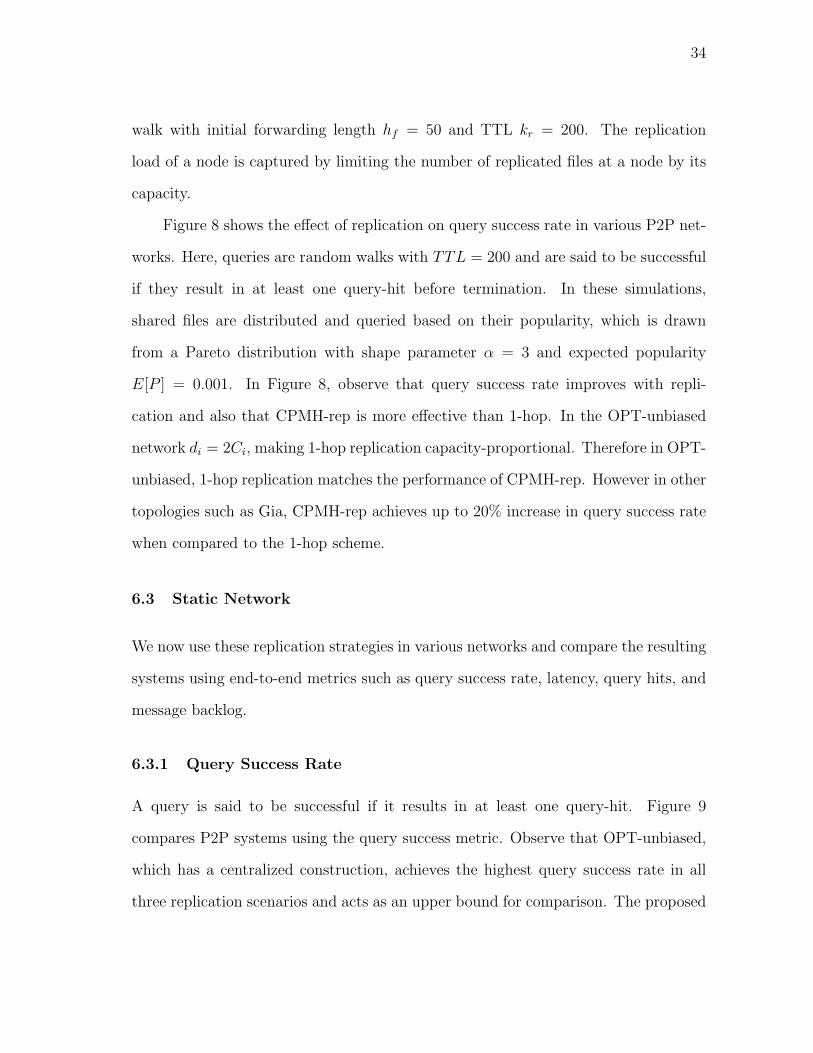
walk with initial forwarding length hf = 50 and TTL kr = 200. The replication
load of a node is captured by limiting the number of replicated files at a node by its
capacity.
Figure 8 shows the effect of replication on query success rate in various P2P net-
works. Here, queries are random walks with TTL = 200 and are said to be successful
if they result in at least one query-hit before termination. In these simulations,
shared files are distributed and queried based on their popularity, which is drawn
from a Pareto distribution with shape parameter α = 3 and expected popularity
E[P ] = 0.001. In Figure 8, observe that query success rate improves with repli-
cation and also that CPMH-rep is more effective than 1-hop. In the OPT-unbiased
network di = 2Ci, making 1-hop replication capacity-proportional. Therefore in OPT-
unbiased, 1-hop replication matches the performance of CPMH-rep. However in other
topologies such as Gia, CPMH-rep achieves up to 20% increase in query success rate
when compared to the 1-hop scheme.
6.3 Static Network
We now use these replication strategies in various networks and compare the resulting
systems using end-to-end metrics such as query success rate, latency, query hits, and
message backlog.
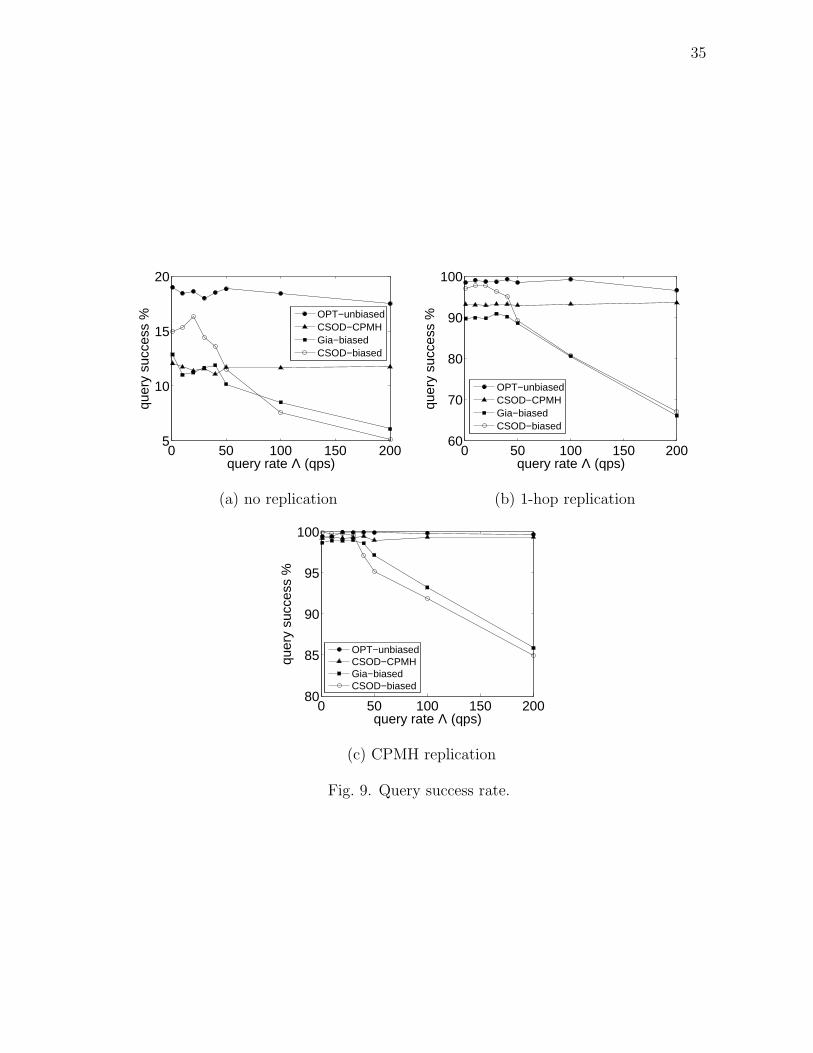
6.3.1 Query Success Rate
A query is said to be successful if it results in at least one query-hit. Figure 9
compares P2P systems using the query success metric. Observe that OPT-unbiased,
which has a centralized construction, achieves the highest query success rate in all
three replication scenarios and acts as an upper bound for comparison. The proposed
Page 44
35
0 50 100 150 2005
10
15
20
query rate Λ (qps)
quer
y su
cces
s %
OPT−unbiasedCSOD−CPMHGia−biasedCSOD−biased
(a) no replication
0 50 100 150 20060
70
80
90
100
query rate Λ (qps)
quer
y su
cces
s %
OPT−unbiasedCSOD−CPMHGia−biasedCSOD−biased
(b) 1-hop replication
0 50 100 150 20080
85
90
95
100
query rate Λ (qps)
quer
y su
cces
s %
OPT−unbiasedCSOD−CPMHGia−biasedCSOD−biased
(c) CPMH replication
Fig. 9. Query success rate.
Page 45
36
CSOD-CPMH achieves close to optimal query success rate under CPMH-replication.
Due to the capacity-proportionality realized in CSOD-CPMH, it balances the load in
the network and maintains a steady success percentage even at higher query rates.
This can be noticed by comparing it with CSOD-biased, which does not employ
capacity-proportional CPMH walks. When compared to Gia, CSOD-CPMH is up to
15% and 25% more successful with CPMH-rep and 1-hop replication respectively.
6.3.2 Query Latency
Query latency is the time to get the first result for a query. It shows the responsiveness
of the P2P system to the user, with lower latency indicating better responsiveness. In
these simulations, we measure the average query latency of all the successful queries
at a given Λ. Figure 10 compares different networks using query latency measured in
seconds. Observe that CSOD-CPMH has lower query latency than Gia and CSOD-
biased networks. With CPMH replication, one can get up to 10 times faster query
responses in the CSOD-CPMH network when compared to Gia.
The OPT-unbiased network has higher latency than CSOD-CPMH. This is be-
cause OPT-unbiased uses unbiased query walks which may visit low-capacity nodes
earlier in their path when compared to CPMH walks. Also, OPT is designed for
maximizing query completion rate and is not guaranteed to have minimum query
latency.
6.3.3 Query Hits
Total number of query-hits returned for all the queries started in a network can
also be used as an end-to-end metric to compare different P2P systems. In these
simulations, there is no limit set on the number of query-hits per query. Figure 11
shows the comparison using this metric. In all three schemes, the OPT-unbiased
Page 46
37
0 50 100 150 2000
50
100
150
200
250
query rate Λ (qps)
quer
y la
tenc
y (s
)
OPT−unbiasedCSOD−CPMHGia−biasedCSOD−biased
(a) no replication
0 50 100 150 2000
20
40
60
80
100
query rate Λ (qps)
quer
y la
tenc
y (s
)
OPT−unbiasedCSOD−CPMHGia−biasedCSOD−biased
(b) 1-hop replication
0 50 100 150 2000
10
20
30
40
50
query rate Λ (qps)
quer
y la
tenc
y (s
)
OPT−unbiasedCSOD−CPMHGia−biasedCSOD−biased
(c) CPMH replication
Fig. 10. Query latency.
Page 47
38
0 50 100 150 2000
1
2
3
4
5x 10
4
query rate Λ(qps)
quer
y hi
ts
OPT−unbiasedCSOD−CPMHGia−biasedCSOD−biased
(a) no replication
0 50 100 150 2000
1
2
3x 10
6
query rate Λ(qps)
quer
y hi
ts
OPT−unbiasedCSOD−CPMHGia−biasedCSOD−biased
(b) 1-hop replication
0 50 100 150 2000
1
2
3
4x 10
6
query rate Λ(qps)
quer
y hi
ts
OPT−unbiasedCSOD−CPMHGia−biasedCSOD−biased
(c) CPMH replication
Fig. 11. Query hits.
Page 48
39
system achieves the highest number of query-hits followed by CSOD-CPMH, which
gets up to twice the number of hits compared to Gia-biased. This shows that more
files can be discovered in a P2P system if the distribution of files and the query traffic
is capacity-proportional.
6.3.4 Message Backlog
In these simulations, we also measure the average number of messages backlogged,
i.e., waiting to be processed, at the nodes in the network. A node’s capacity limits
the number of messages it can process in a second. When a node is overloaded, the
incoming messages are added to an input queue of infinite length. For equal query
rates, the network topology achieving better capacity-proportional traffic distribu-
tion would have less backlog at its nodes. Figure 12 compares the average message
backlog for the four networks. Observe that CSOD-CPMH and OPT-unbiased net-
works, which achieve capacity-proportional traffic distribution, have lower backlog
when compared to Gia-biased and CSOD-biased. CSOD-CPMH has a slightly lower
backlog than the OPT-unbiased network due to lower total traffic in CSOD-CPMH
as a result of self-adjusting search walks, as discussed in Section 4.1.1 of Chapter IV.
6.4 Dynamic Network
Node churn is a common characteristic of existing P2P networks. This involves peers
leaving the network and rejoining at a later time. In this section, we first describe
the churn model used and then define a metric called Build Saturation Point (BSP)
to quantify the overhead incurred by P2P networks due to churn. We finally evaluate
the P2P systems under churn, using the end-to-end metrics defined in the previous
section.
Page 49
40
0 50 100 150 2000
5
10
15
20
query rate Λ (qps)
E[Q
] (m
essa
ges
/ nod
e)
OPT−unbiasedCSOD−CPMHGia−biasedCSOD−biased
(a) no replication
0 50 100 150 2000
5
10
15
20
query rate Λ (qps)
E[Q
] (m
essa
ges
/ nod
e)
OPT−unbiasedCSOD−CPMHGia−biasedCSOD−biased
(b) 1-hop replication
0 50 100 150 2000
5
10
15
20
query rate Λ (qps)
E[Q
] (m
essa
ges
/ nod
e)
OPT−unbiasedCSOD−CPMHGia−biasedCSOD−biased
(c) CPMH replication
Fig. 12. Message backlog.
Page 50
41
0 1 2 3 4 5x 10
4
0
2000
4000
6000
8000
10000
12000
t (seconds)
# no
des
aliv
e
(a) node count
0 1 2 3 4 5x 10
4
0
5
10
15
20
25
time t (seconds)
E[d
i]
(b) average degree
Fig. 13. Evolution of CSOD-CPMH network under churn.
6.4.1 Churn Model
Measurement studies [26] have found that P2P nodes have heavy-tailed lifetimes. To
measure the effect of churn on P2P networks, we have simulated nodes with Pareto
lifetimes. In our simulations, we initially construct an overlay of 10, 000 nodes and
then start churn events in this network. During the churn stage, new nodes with
Pareto lifetimes arrive as a Poisson process. To keep the expected node count in the
network constant, we match the node arrival and departure rates. If E[L] is the mean
node lifetime, then the departure rate of a node = 1/E[L] and that of a system with
n nodes is rc = n/E[L].
In these simulations expected node lifetime E[L] = 10, 000 seconds with Pareto
shape parameter α = 3. Therefore in the network with 10, 000 nodes, the departure
rate of the system (or churn rate) rc = 1 node/s. To match this rate, the node arrival
events have an exponential inter-arrival delay X with E[X] = 1/rc. Figure 13 shows
the evolution of node degree and system size of a CSOD-CPMH network under this
Page 51
42
10−2
100
10210
−2
100
102
rc (nodes/s)
E[Q
] (s)
GiaCSOD
400.4
Fig. 14. BSP of Gia and CSOD.
churn model. In the first 10, 000 seconds, the initial topology of 10, 000 nodes is
created and then churn is started as described in the model above.
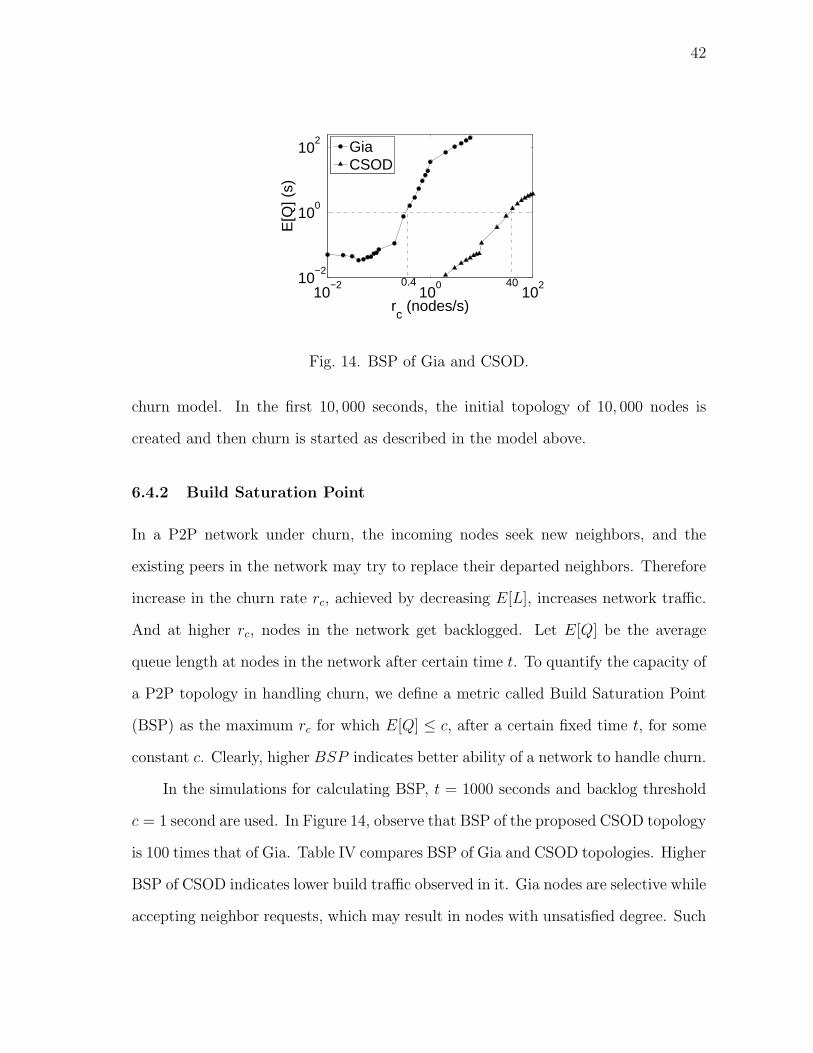
6.4.2 Build Saturation Point
In a P2P network under churn, the incoming nodes seek new neighbors, and the
existing peers in the network may try to replace their departed neighbors. Therefore
increase in the churn rate rc, achieved by decreasing E[L], increases network traffic.
And at higher rc, nodes in the network get backlogged. Let E[Q] be the average
queue length at nodes in the network after certain time t. To quantify the capacity of
a P2P topology in handling churn, we define a metric called Build Saturation Point
(BSP) as the maximum rc for which E[Q] ≤ c, after a certain fixed time t, for some
constant c. Clearly, higher BSP indicates better ability of a network to handle churn.
In the simulations for calculating BSP, t = 1000 seconds and backlog threshold
c = 1 second are used. In Figure 14, observe that BSP of the proposed CSOD topology
is 100 times that of Gia. Table IV compares BSP of Gia and CSOD topologies. Higher
BSP of CSOD indicates lower build traffic observed in it. Gia nodes are selective while
accepting neighbor requests, which may result in nodes with unsatisfied degree. Such
Page 52
43
Table IV. Build Saturation Point
Topology BSP (nodes/s)
Gia 0.4
CSOD 40
nodes start more build walks to get sufficient neighbors to maintain their connectivity.
This snow-balls into a large build traffic under churn, resulting in a low BSP for Gia.
6.4.3 End-to-end Metrics
In these simulations, we construct 10, 000 node networks and then start churn. Af-
ter 1, 000 seconds of churn, we start queries at a rate Λ and run the simulation for
500 seconds. Figure 15 compares these P2P networks under churn, using our end-to-
end query metrics. Observe that CSOD-CPMH beats Gia-biased in all three metrics
achieving 20% higher query success rate at half the latency. CSOD-CPMH has also
resulted in significantly higher query hits than Gia-biased. This shows the ability of
the proposed CSOD network in handling churn without performing topology adap-
tation as in Gia. Also Figure 15(d) shows the very high overhead incurred by Gia,
even at low query rates, due to its dynamic topology adaptation.
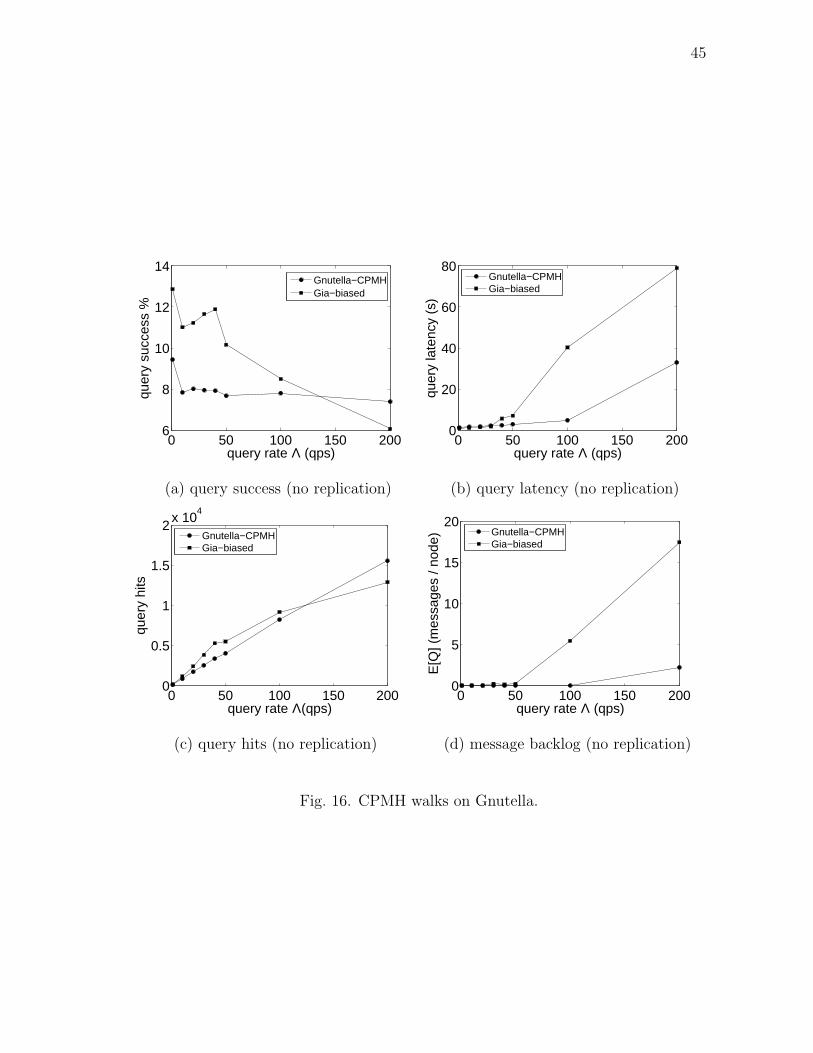
6.5 Incremental Deployment
In this section, we evaluate the effect of deploying CPMH query walks on existing
Gnutella network. Figure 16 compares the performance of Gnutella-CPMH with
Gia-biased. Observe that, at higher query rates, CPMH walks on Gnutella network
would result in higher performance than Gia-biased. Gnutella-CPMH has slightly
higher query success rate and query hits, but it has 50% lower latency and a third of
Page 53
44
0 50 100 150 20070
80
90
100
query rate Λ (qps)
quer
y su
cces
s %
CSOD−CPMHGia−biasedCSOD−biased
(a) query success (CPMH replication)
0 50 100 150 2000
10
20
30
query rate Λ (qps)
quer
y la
tenc
y (s
)
CSOD−CPMHGia−biasedCSOD−biased
(b) query latency (CPMH replication)
0 50 100 150 2000
2
4
6x 10
5
query rate (qps)
quer
y hi
ts
CSOD−CPMHGia−biasedCSOD−biased
(c) query hits (CPMH replication)
0 50 100 150 20010
−5
100
105
query rate Λ (qps)
E[Q
] (m
essa
ges
/ nod
e)
CSOD−CPMHGia−biasedCSOD−biased
(d) message backlog (CPMH replication)
Fig. 15. Effect of churn.
Page 54
45
0 50 100 150 2006
8
10
12
14
query rate Λ (qps)
quer
y su
cces
s %
Gnutella−CPMHGia−biased
(a) query success (no replication)
0 50 100 150 2000
20
40
60
80
query rate Λ (qps)
quer
y la
tenc
y (s
)
Gnutella−CPMHGia−biased
(b) query latency (no replication)
0 50 100 150 2000
0.5
1
1.5
2x 10
4
query rate Λ(qps)
quer
y hi
ts
Gnutella−CPMHGia−biased
(c) query hits (no replication)
0 50 100 150 2000
5
10
15
20
query rate Λ (qps)
E[Q
] (m
essa
ges
/ nod
e)
Gnutella−CPMHGia−biased
(d) message backlog (no replication)
Fig. 16. CPMH walks on Gnutella.
Page 55
46
message backlog when compared to Gia-biased. These results show the advantage in
incremental deployment of CPMH query walks on the existing Gnutella network.
Page 56
47
CHAPTER VII
CONCLUSION
This thesis has proved the optimality of capacity-proportional networks in supporting
heterogeneity in P2P systems. We provide a framework called CPMH, for achieving
the desired capacity-proportionality without requiring construction of a special over-
lay topology. Using this framework we propose CSOD-CPMH, an unstructured P2P
system for heterogeneous nodes. We have built POSIM, a discrete-event simulator
for overlay networks and have used it for evaluating our proposed system. We define
two saturation metrics for quantifying the topological characteristics of a P2P system
in supporting random walks and to measure its ability to handle the overhead due to
churn. The simulations have shown that CSOD-CPMH has higher saturation points
and performs better than Gia in terms of end-to-end metrics such as query success
rate for different replication schemes.
As a future work, we consider implementing a CPMH client and study the issues
involved in random walk techniques in real networks.
Page 57
48
REFERENCES
[1] L. A. Adamic, R. M. Lukose, A. R. Puniyani, and B. A. Huberman, “Search in
power-law networks,” Physical Review E, vol. 64, pp. 46135–46143, Sep. 2001.
[2] A.-L. Barabasi and R. Albert, “Emergence of scaling in random networks,” Sci-
ence, vol. 286, no. 5439, pp. 509–512, Oct. 1999.
[3] Y. Chawathe, S. Ratnasamy, L. Breslau, N. Lanham, and S. Shenker, “Making
Gnutella-like P2P systems scalable,” in Proc. ACM SIGCOMM, Aug. 2003, pp.
407–418.
[4] S. Chib and E. Greenberg, “Understanding the Metropolis-Hastings algorithm,”
The American Statistician, vol. 49, no. 4, pp. 327–335, Nov. 1995.
[5] V. Cholvi, P. Felber, and E. Biersack, “Efficient search in unstructured peer-to-
peer networks,” Euro. Trans. on Telecommun., vol. 15, no. 6, pp. 535–548, Nov.
2004.
[6] S. Datta and H. Kargupta, “Uniform data sampling from a peer-to-peer net-
work,” in Proc. IEEE ICDCS, Jun. 2007, p. 50.
[7] R. A. Ferreira, M. K. Ramanathan, A. Awan, A. Grama, and S. Jagannathan,
“Search with probabilistic guarantees in unstructured peer-to-peer networks,” in
Proc. IEEE P2P, Aug. 2005, pp. 165–172.
[8] C. Gkantsidis, M. Mihail, and A. Saberi, “Random walks in peer-to-peer net-
works,” in Proc. IEEE INFOCOM, Mar. 2004, pp. 120–130.
Page 58
49
[9] C. Gkantsidis, M. Mihail, and E. Zegura, “The Markov chain simulation method
for generating connected power law random graphs,” in Proc. ALENEX, Jan.
2003.
[10] Gnutella. [Online]. Available: http://www.gnutella.com, May 2009.
[11] Graphviz. [Online]. Available: http://www.graphviz.org, May 2009.
[12] GWebCache. [Online]. Available: http://www.gnucleus.com/gwebcache, May
2009.
[13] W. K. Hastings, “Monte Carlo sampling methods using Markov chains and their
applications,” Biometrika, vol. 57, no. 1, pp. 97–109, Apr. 1970.
[14] P. Karbhari, M. H. Ammar, A. Dhamdhere, H. Raj, G. F. Riley, and E. W.
Zegura, “Bootstrapping in Gnutella: A measurement study,” in Proc. PAM,
Apr. 2004, pp. 22–32.
[15] K.-W. Kwong and H. K. Tsang, “Building heterogeneous peer-to-peer networks:
Protocol and analysis,” IEEE/ACM Trans. Networking, vol. 16, no. 2, pp. 281–
292, Apr. 2008.
[16] B. T. Loo, R. Huebsch, and J. M. Hellerstein, “The case for a hybrid P2P search
infrastructure,” in Proc. IPTPS, Feb. 2004.
[17] Q. Lv, P. Cao, E. Cohen, K. Li, and S. Shenker, “Search and replication in
unstructured peer-to-peer networks,” in Proc. International Conference on Su-
percomputing, Jun. 2002, pp. 84–95.
[18] S. Naicken, B. Livingston, A. Basu, S. Rodhetbhai, I. Wakeman, and
D. Chalmers, “The state of peer-to-peer simulators and simulations,” ACM SIG-
COMM Comp. Comm. Rev., vol. 37, no. 2, pp. 95–98, Apr. 2007.
Page 59
50
[19] POSIM. [Online]. Available: http://posim.sourceforge.net, May 2009.
[20] S. Saroiu, P. K. Gummadi, and S. D. Gribble, “Analyzing the characteristics
of Napster and Gnutella hosts,” Multimedia Systems, vol. 9, pp. 170–184, Aug.
2003.
[21] N. Sarshar, P. O. Boykin, and V. P. Roychowdhury, “Percolation search in power
law networks: Making unstructured peer-to-peer networks scalable,” in Proc.
IEEE P2P, Aug. 2004, pp. 2–9.
[22] D. Stutzbach, R. Rejaie, N. Duffield, S. Sen, and W. Willinger, “On unbiased
sampling for unstructured peer-to-peer networks,” in Proc. ACM IMC, Apr.
2006, pp. 27–40.
[23] W. W. Terpstra, J. Kangasharju, C. Leng, and A. P. Buchmann, “Bubblestorm:
Resilient, probabilistic, and exhaustive peer-to-peer search,” in Proc. ACM SIG-
COMM, Aug. 2007, pp. 49–60.
[24] F. Viger and M. Latapy, “Efficient and simple generation of random simple
connected graphs with prescribed degree sequence,” in Proc. COCOON, Aug.
2005, pp. 440–449.
[25] V. Vishnumurthy and P. Francis, “On heterogeneous overlay construction and
random node selection in unstructured P2P networks,” in Proc. IEEE INFO-
COM, Apr. 2006, pp. 1–12.
[26] X. Wang, Z. Yao, and D. Loguinov, “Residual-based measurement of peer and
link lifetimes in Gnutella networks,” in Proc. IEEE INFOCOM, May 2007, pp.
391–399.
Page 60
51
[27] B. Yang and H. Garcia-Molina, “Improving search in peer-to-peer networks,” in
Proc. IEEE ICDCS, Nov. 2002, pp. 5–14.
[28] M. Zaharia and S. Keshav, “Gossip-based search selection in hybrid peer-to-peer
networks,” in Proc. IPTPS, Feb. 2006.
[29] S. Zhao, D. Stutzbach, and R. Rejaie, “Characterizing files in the modern
Gnutella network: A measurement study,” in Proc. MMCN, Jan. 2006.
[30] M. Zhong, K. Shen, and J. Seiferas, “The convergence-guaranteed random walk
and its applications in peer-to-peer networks,” IEEE Transactions on Computers,
vol. 57, no. 5, pp. 619–633, May 2008.
Page 61
52
VITA
Chandan Rama Reddy received his Bachelor of Engineering (B.E.) in computer
engineering from the National Institute of Technology Karnataka in Surathkal, India,
in May 2005. He then worked for two years at Trilogy India in Bangalore, India. He
began pursuing his Master of Science (M.S.) in computer engineering at Texas A&M
University in August 2007 and graduated in August 2009.
His research interests include creating tools for building large-scale systems and
the study of evolution of networks. He may be contacted at:
Chandan Rama Reddy
14/39, 47th ‘A’ Cross
8th Block Jayanagar
Bangalore - 560082
Karnataka, India.
The typist for this thesis was Chandan Rama Reddy.