19
Unit Number 100 CEPCI 397 User Added Equipment Add Equipment Edit Equipment
| Date post: | 15-Nov-2014 |
| Category: |
Documents |
| Upload: | jefersonlaroca |
| View: | 993 times |
| Download: | 202 times |

Unit Number 100
CEPCI 397
User Added Equipment
Add Equipment
Edit Equipment

Name Total Module Cost Grass Roots Cost Utility Used Efficiency Actual Usage Annual Utility Cost
Totals $ - $ - $ -

Material Classification Price ($/kg) Consumption (kg/h) Material Costs ($/y)
methanol Raw Material $ 0.525 8000 $ 34,952,400
Acetone Product $ (0.389) 30000 $ (97,117,740)
Economic Options
Cost of Land $ 1,250,000
Taxation Rate 42%
Annual Interest Rate 10%
Salvage Value $ 739,000
Working Capital $ 4,169,000
$ 7,390,000
Total Module Factor 1.18
Grass Roots Factor 0.50
Economic Information Calculated From Given Information
Revenue From Sales $ 93,360,000
$ 33,600,000
$ 3,516,200
$ -
$ 700,000
FCIL
CRM (Raw Materials Costs)
CUT (Cost of Utilities)
CWT (Waste Treatment Costs)
COL (Cost of Operating Labor)
Add Materials

Comd = 0.18*FCIL + 2.76*COL + 1.21*(CUT + CWT + CRM)
Multiplying factor for FCIL 0.18
2.76
1.21
$ 48,172,802
Factors Used in Calculation of Working Capital
A 0.10
B 0.10
C 0.10
Project Life (Years after Startup) 10
Construction period 2
Distribution of Fixed Capital Investment (must sum to one)
End of year One 60%
End of year Two 40%
End of year Three
End of year Four
End of year Five
Factors Used in Calculation of Cost of Manufacturing (COMd)
Multiplying factor for COL
Facotrs for CUT, CWT, and CRM
COMd
Working Capital = A*CRM + B*FCIL + C*COL

Discounted Profitibility Criterion Non-Discounted Profitibility Criteria
Net Present Value (millions) 125.77 Cumulative Cash Position (millions) 258.23
Discounted Cash Flow Rate of Return 12.72% Rate of Return on Investment 349.43%
Discounted Payback Period (years) 6.7 Payback Period (years) 4.1
Generate CFD
-1 0 1 2 3 4 5 6 7 8 9 10 11 12 13-20.0
0.0
20.0
40.0
60.0
80.0
100.0
120.0
140.0
Cash Flow Diagram
Project Life (Years)
Pro
jec
t V
alu
e (
mill
ion
s o
f d
olla
rs)

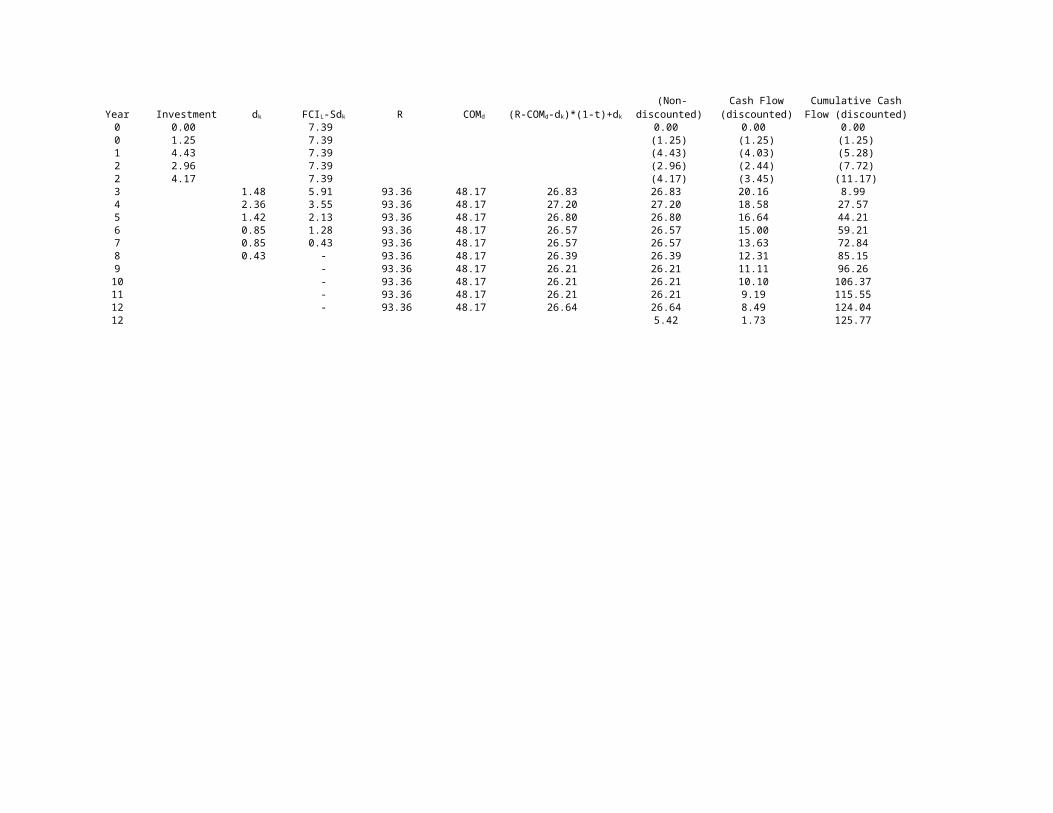
Year Investment R0 0.00 7.39 0.00 0.00 0.00 0.00 0 1.25 7.39 (1.25) (1.25) (1.25) (1.25)1 4.43 7.39 (4.43) (4.03) (5.28) (5.68)2 2.96 7.39 (2.96) (2.44) (7.72) (8.64)2 4.17 7.39 (4.17) (3.45) (11.17) (12.81)3 1.48 5.91 93.36 48.17 26.83 26.83 20.16 8.99 14.02 4 2.36 3.55 93.36 48.17 27.20 27.20 18.58 27.57 41.22 5 1.42 2.13 93.36 48.17 26.80 26.80 16.64 44.21 68.03 6 0.85 1.28 93.36 48.17 26.57 26.57 15.00 59.21 94.59 7 0.85 0.43 93.36 48.17 26.57 26.57 13.63 72.84 121.16 8 0.43 - 93.36 48.17 26.39 26.39 12.31 85.15 147.55 9 - 93.36 48.17 26.21 26.21 11.11 96.26 173.75
10 - 93.36 48.17 26.21 26.21 10.10 106.37 199.96 11 - 93.36 48.17 26.21 26.21 9.19 115.55 226.17 12 - 93.36 48.17 26.64 26.64 8.49 124.04 252.81 12 5.42 1.73 125.77 258.23
dk FCIL-Sdk COMd (R-COMd-dk)*(1-t)+dk
Cash Flow (Non-discounted)
Cash Flow (discounted)
Cumulative Cash Flow (discounted)
Cumulative Cash Flow (Non-discounted)

Probable Variation of Key Parameters over Plant Life
Lower Limit Upper Limit Base ValueFCIL -20% 30% $ 7,390,000
Price of Product -10% 10% $ 93,360,000 Working Capital -50% 10% $ 4,169,000
Income Tax Rate* -20% 20% 42%Interest Rate* -10% 20% 10%
Raw Material Price -10% 15% $ 33,600,000 Salvage Value -80% 20% $ 739,000
* Please note that variations for percentages are a percent of a percent.For example, a 10% variance on a 12% interst rate would imply a 1.2% uncertainty
Net Present Value Data
Low NPV -41.0High NPV 60.5
Bins Upper Value # points/bin Cumulative0 -41.0 0 01 -30.9 21 212 -20.7 56 773 -10.6 120 1974 -0.4 163 3605 9.7 237 5976 19.9 191 7887 30.0 137 9258 40.2 54 9799 50.3 15 994
10 60.5 6 1000
Run Economic Analysis
-60 -40 -20 0 20 40 60 80
0
250
500
750
1000
Net Present Value (millions of dollars)
Cum
ulat
ive
Num
ber
of D
ata
Poi
nts

Discounted Cash Flow Rate of Return Data
0.00High DCFROR 0.24
Bins Upper #/bin Cumulative0 0.00 0 01 0.03 12 122 0.05 45 573 0.07 102 1594 0.10 166 3255 0.12 222 5476 0.15 243 7907 0.17 137 9278 0.19 55 9829 0.22 14 996
10 0.24 4 1000
Discounted Payback Period Data
4.2High DPBP 16.0
Bins Upper #/bin Cumulative0 4.2 0 01 5.4 31 312 6.6 124 1553 7.7 135 2904 8.9 200 4905 10.1 61 5516 11.3 109 6607 12.4 125 7858 13.6 71 8569 14.8 51 907
10 16.0 19 926
Low DCFROR
Low DPBP
2.0 4.0 6.0 8.0 10.0 12.0 14.0 16.0 18.0
0
250
500
750
1000
DPBP (years)
Cum
ulat
ive
Num
ber
of D
ata
Poi
nts
0.00 0.05 0.10 0.15 0.20 0.25 0.30
0
250
500
750
1000
DCFROR
Cum
ulat
ive
Num
ber
of D
ata
Poi
nts
Cumulative Cash Position Data
Low CCP 2.85High CCP 185.53
Bins Upper Value # points/bin Cumulativive0 2.85 0 01 21.12 12 122 39.38 39 513 57.65 100 1514 75.92 156 3075 94.19 220 5276 112.46 233 7607 130.72 150 9108 148.99 63 9739 167.26 20 993
10 185.53 7 1000
Rate of Return on Investment Data
0%High ROROI 23%
Bins Upper Value # points/bin Cumulative0 0% 0 01 3% 24 242 5% 93 1173 7% 181 2984 9% 207 5055 12% 252 7576 14% 147 9047 16% 61 9658 18% 24 9899 21% 10 999
10 23% 1 1000
Low ROROI
0 20 40 60 80 100 120 140 160 180 200
0
250
500
750
1000
Cumulative Cash Position (millions of dollars)
Cum
ulat
ive
Num
ber
of D
ata
Poi
nts
0% 5% 10% 15% 20% 25%
0
250
500
750
1000
ROROI
Cu
mu
lativ
e N
um
be
r o
f D
ata
Po
ints

Payback Period Data
3.1High DPBP 8.7
Bins Upper #/bin Cumulative0 3.1 0 01 3.7 141 1412 4.3 391 5323 4.8 302 8344 5.4 109 9435 5.9 38 9816 6.5 11 9927 7.1 2 9948 7.6 1 9959 8.2 1 996
10 8.7 4 1000
Low DPBP
2.0 3.0 4.0 5.0 6.0 7.0 8.0 9.0 10.0
0
250
500
750
1000
PBP (years)
Cum
ulat
ive
Num
ber
of D
ata
Poi
nts

Power Preference
kilowatts 1 kW / kW
Hours per Operting Year 8322 Pressure Preference
barg 1 barg / barg
Cost ($/GJ)
Common Utilities Heat Duty Preference
Electricity (110V - 440V) 16.8 MJ/h 3.6 (MJ/h) / kW
Cooling Water (30°C to 45°C) 0.354
Refrigerated Water (15°C to 25°C) 4.43 Length Preference
meters 1 m / m
Steam from Boilers
Low Pressure (5 barg, 160°C) 6.08 Area Preference
Medium Pressure (10 barg, 184°C) 6.87 square meters 1 m^2 / m^2
High Pressure (41 barg, 254°C) 9.83
Volume Preference
Fuels cubic meters 1 m^3/m^3
Fuel Oil (no. 2) 6.0Natural Gas 6 Gas Flow Preference
Coal (FOB mine mouth) 1.07 cubic meters/s 1 m^3 / m^3
Thermal Systems Cost PreferenceModerately High (up to 330°C) 6.67 $/kg 1 kg / kg
High (up to 400°C) 7Very High (up to 600°C) 7.5 Flowrate Preference
kg/h 1 kg / kgRefrigeration
Moderately Low (5°C) 4.43 Energy Price PreferenceLow (-20°C) 7.89 $/Gigajoule 1 GJ / GJ
Very low (-50°C) 13.11
Cost ($/tonne)Waste Disposal (solid and liquid)
Non-Hazardous 36Hazardous 200
Cost of Steam used in Steam DrivesCost ($/GJ)
Steam used for steam-powered drives $ 9.83
Equipment Effeciencies
Pump Efficiency 85%Drive Efficiency 90%
Fan Efficiency 80%Furnace Efficiency 90%Turbine Efficiency 85%
Process Equipment
Operators per shift per equipment
Cost of Labor (per operator/year) $ 50,000
Update Preferences

Compressor Data (without electric motors)
Compressor TypeCentrifugal 2.2891 1.3604 -0.1027 2.7 5.8 11.5 450 3000Axial 2.2891 1.3604 -0.1027 3.8 8.0 15.9 450 3000Rotary 5.0355 -1.8002 0.8253 2.4 5.0 9.9 18 950Reciprocating 2.2891 1.3604 -0.1027 3.4 7.0 13.9 450 3000
Drive Data
Electric DrivesExplosion Proof 2.4604 1.4191 -0.1798 1.5 75 2600Totally Enclosed 1.956 1.7142 -0.2282 1.5 75 2600Open/Drip Proof 2.9508 1.0688 -0.1315 1.5 75 2600
Non-Electric DrivesGas Turbine -21.7702 13.2175 -1.5279 3.5 7500 23000Steam Turbine 2.6259 1.4398 -0.1776 3.5 70 7500Internal Combustion 2.7635 0.8574 -0.0098 2.0 10 10000
Fan Data (include electric motors)
Fan Type ThresholdCentrifugal Radial Fan 3.5391 -0.3533 0.4477 2.7 5.0 5.8 11.5 0.01 0.00 0.209 -0.033 1 100 0.16Centrifugal Backward curv 3.3471 -0.0734 0.3090 2.7 5.0 5.8 11.5 0.01 0.00 0.209 -0.033 1 100 0.16Axial Tube Fan 3.0414 -0.3375 0.4722 2.7 5.0 5.8 11.5 0.04 0.00 0.209 -0.033 1 100 0.16Axial Vane Fan 3.1761 -0.1373 0.3414 2.7 5.0 5.8 11.5 0.04 0.00 0.209 -0.033 1 100 0.16
Fired Heater DataBare Module Factor
Reactive Heaters CS Alloy Steel SSReformer Furnace 3.068 0.6597 0.0194 3000 100000 200 0.1405 -0.2698 0.1293 2.13 2.51 2.81Pyrolysis Furnace 2.3859 0.9721 -0.0206 3000 100000 200 0.1017 -0.1957 0.09403 2.13 2.51 2.81
Bare Module Factor
Non-reactive Heaters CS Alloy Steel SSProcess Heater 7.3488 -1.1666 0.2028 1000 100000 200 0.1347 -0.2368 0.1021 2.13 2.51 2.81
Steam Supreheat Factor
Thermal Fluid Heaters FbmHot Water 2.0829 0.9074 -0.0243 650 10750 200 -0.0163 0.0569 -0.0088 2.17
Molten Salt, Mineral Oil, 1.1979 1.4782 -0.0958 650 10750 200 -0.0163 0.0569 -0.0088 2.17Diphenyl Based Oils 2.2628 0.8581 0.0003 650 10750 200 -0.0163 0.0569 -0.0088 2.17Packaged Steam Boilers 6.9617 -1.48 0.3161 1200 9400 40 2.5941 -4.2348 1.7224 2.2 1.000 0.00184 3.35E-06
Heat Exchanger Data
Exchager TypeDouble Pipe 3.3444 0.2745 -0.0472 13.1467 -12.6574 3.0705 1.74 1.55 1 10 300
40 barg < P < 100 barg 0.6072 -0.912 0.3327P < 40 barg 0 0 0
Multiple Pipe 2.7652 0.7282 0.0783 13.1467 -12.6574 3.0705 1.74 1.55 10 100 30040 barg < P < 100 barg 0.6072 -0.912 0.3327
P < 40 barg 0 0 0Fixed tube, sheet, or U tu 4.3247 -0.303 0.1634 0.03881 -0.11272 0.08183 1.63 1.66 10.0 1000 140
tubes only > 5 barg -0.00164 -0.00627 0.0123Floating Head 4.8306 -0.8509 0.3187 0.03881 -0.11272 0.08183 1.63 1.66 10.0 1000 140
tubes only > 5barg -0.00164 -0.00627 0.0123Bayonet 4.2768 -0.0495 0.1431 0.03881 -0.11272 0.08183 1.63 1.66 10.0 1000 140
tubes only > 5 barg -0.00164 -0.00627 0.0123Kettle Reboiler 4.4646 -0.5277 0.3955 0.03881 -0.11272 0.08183 1.63 1.66 10.0 100 140
tubes only > 5 barg -0.00164 -0.00627 0.0123Scraped Wall 3.7803 0.8569 0.0349 13.1467 -12.6574 3.0705 1.74 1.55 2.0 20 300
40 barg < P < 100 barg 0.6072 -0.912 0.3327P < 40 barg 0 0 0
Teflon Tube 3.8062 0.8924 -0.1671 0 0 0 1.63 1.66 1.0 10 15Air Cooler 4.0336 0.2341 0.0497 -0.125 0.15361 -0.02861 0.96 1.21 10 10000 100Spiral Tube - shell and tub 3.9912 0.0668 0.243 -0.4045 0.1859 0 1.74 1.55 1 100 400tube only -0.2115 0.09717 0Spiral Plate 4.6561 -0.2947 0.2207 0 0 0 0.96 1.21 1 100 19Flat Plate 4.6656 -0.1557 0.1547 0 0 0 0.96 1.21 10 1000 19
K1 K2 K3 FBMCS FBMSS FBMNi Wmin(kW) Wmax(kW)
K1 K2 K3 FBM Wmin(kW) Wmax(kW)
K1 K2 K3 FBM Wmin(kW) Wmax(kW)
K1 K2 K3 FBMCS FBMfiberglass FBMSS FBMNi C1 C2 C3 Vmin(m3/s) Vmax(m3/s) Pmax(barg)
K1 K2 K3 Qmin(kW) Qmax(kW) Pmax(barg) C1 C2 C3
K1 K2 K3 Qmin(kW) Qmax(kW) Pmax(barg) C1 C2 C3
K1 K2 K3 Qmin(kW) Qmax(kW) Pmax(barg) C1 C2 C3 FT1 FT2 FT3
K1 K2 K3 C1 C2 C3 B1 B2 Amin(m2) Amax(m2) Pmax(barg)

Shell - CS CS Cu CS SS CS Ni CS TiExchanger Type Tube - CS Cu Cu SS SS Ni Ni Ti TiDouble Pipe 1.00 1.35 1.69 1.81 2.73 2.68 3.73 4.63 11.38Multiple Pipe 1.00 1.35 1.69 1.81 2.73 2.68 3.73 4.63 11.38Fixed tube, sheet, or U tu 1.00 1.35 1.69 1.81 2.73 2.68 3.73 4.63 11.38Floating Head 1.00 1.35 1.69 1.81 2.73 2.68 3.73 4.63 11.38Bayonet 1.00 1.35 1.69 1.81 2.73 2.68 3.73 4.63 11.38Kettle Reboiler 1.00 1.35 1.69 1.81 2.73 2.68 3.73 4.63 11.38Scraped Wall 1.00 1.35 1.69 1.81 2.73 2.68 3.73 4.63 11.38Spiral Tube 1.00 1.35 1.69 1.81 2.73 2.68 3.73 4.63 11.38
Shell MaterailType of Exchanger CS Cu SS Ni Ti
Teflon Tube Exchanger 1.00 1.20 1.30 1.40 3.30
Material In Contact with Process FluidType of Exchanger CS Cu SS Ni Ti
Spiral Plate 1.00 1.35 2.45 2.68 4.63Flat Plate 1.00 1.35 2.45 2.68 4.63
Tube MaterialType of Exchanger CS Al SS
Air Cooler 1.00 1.42 2.93
Pump Data (including electric drives)
Pump TypeCentrifugal pump 3.3892 0.0536 0.1538 -0.3935 0.3957 -0.00226 1.89 1.35 1.0 1.6 NA 2.3 4.4 NA 100 1 300Positive Displacement 3.4771 0.1350 0.14380 -0.245382 0.259016 -0.01363 1.89 1.35 1.0 1.4 1.3 2.7 4.7 10.7 100 1 100Reciprocating pump 3.8696 0.3161 0.12200 -0.2454 0.2590 -0.0136 1.89 1.35 1.0 1.5 1.3 2.4 4.0 6.4 100 0.1 200
Tank Data
Tank TypeFixed Roof 4.8509 -0.3973 0.1445 1.10 0 90 30000Floating Roof 5.9567 -0.7585 0.1749 1.10 0.00 1000 40000
Turbine Data
Turbine TypeAxial 2.7051 1.4398 -0.1776 NA 3.5 NA 6.1 11.7 NA 100 4000Radial 2.2476 1.4965 -0.1618 NA 3.5 NA 6.1 11.7 NA 100 1500
Vaporizer and Evaporator Data
Evaporator TypesForced Circulation 5.0238 0.3475 0.0703 5 1000 150 0.1578 -0.2992 0.1413Falling Film 3.9119 0.8627 -0.0088 50 500 150 0.1578 -0.2992 0.1413Agitated (Scraped Wall) 5 0.149 -0.0134 0.5 5 150 0.1578 -0.2992 0.1413Short Tube 5.2366 -0.6572 0.35 10 100 150 0.1578 -0.2992 0.1413Long Tube 4.642 0.3698 0.0025 100 10000 150 0.1578 -0.2992 0.1413
Vaporizer TypesJacketed Vessel 3.8751 0.3328 0.1901 1 100 320 0.1578 -0.2992 0.1413Internal Coil 4.038 0.09142 0.2766 1 100 320 0.1578 -0.2992 0.1413Jacketed Vessel w/ Coil 4.038 0.09142 0.2766 1 100 320 0.1578 -0.2992 0.1413
Evaporator Types CS Cu Alloy SS Ni Alloy TiForced Circulation 2.9 3.63 5.08 9.66 14.5Falling Film 2.25 2.81 3.94 7.49 11.25Agitated (Scraped Wall) 2.25 2.81 3.94 7.49 11.25Short Tube 2.9 3.63 5.08 9.66 14.5Long Tube 2.9 3.63 5.08 9.66 14.5
Vaporizer Types CS CuGlass Lined SS CoilsGlass Lined Ni CoilsSS SS Clad Ni Alloy Ni Alloy Clad Ti Ti CladJacketed Vessel 2.7 3.4 4.7 4.9 4.8 3.8 9.1 5.9 13.7 9.5Internal Coil 3.0 3.8 5.2 5.5 5.2 4.1 10.1 6.6 15.2 10.6Jacketed Vessel w/ Coil 3.0 3.8 5.2 5.5 5.2 4.1 10.1 6.6 15.2 10.6
Vessel Data (including data for distillation towers and packed columns)Vertical Vessels Horizontal Vessels
3.4974 0.4485 0.1074 0.3 520 3.5565 0.3776 0.0905 0.1 628 400
Vessel B-ValuesB1 B2 MOC Sieve Valve Demister
Horizontal 1.49 1.52 CS 1.0 1Vertical 2.25 1.82 SS 1.8 1.83 1.0
Fluorocarbon 1.8
Ni-alloy 5.6 5.58 5.6
Tray TypeSieve 2.9949 0.4465 0.3961 0.07 12.3 Materials of Construction
Valve 3.3322 0.4838 0.3434 0.7 10.5 1.0
Demister 3.2353 0.4838 0.3434 0.7 10.5 1.7
3.1
Tower Packing 3.6
Materials of Construction 7.1
Ceramic 3.0664 0.9744 0.0055 0.03 628 4.7
304 SS 3.2999 0.9744 0.0055 0.03 628 9.4Plastic Saddle 2.4493 0.9744 0.0055 0.03 628
Materail Factors, FM
K1 K2 K3 C1 C2 C3 B1 B2 FmCI FmCS FmCu FmSS FmNi FmTi Pmax(barg) Wmin(kW) Wmax(kW)
K1 K2 K3 B1 B2 Vmin(m3/s) Vmax(m3/s)
K1 K2 K3 FBMCI FBMCS FBMCu FBMSS FBMNi FBMTi Wmin(kW) Wmax(kW)
K1 K2 K3 Amin(m2) Amax(m2) Pmax(barg) C1 C2 C3
K1 K2 K3 Vmin(m3) Vmax(m3) Pmax(barg) C1 C2 C3
Bare Module Factors, FBM
Bare Module Factors, FBM
K1 K2 K3 Vmin Vmax K1 K2 K3 Vmin Vmax Pmax(barg)
FBM
Fq
K1 K2 K3 Amin(m2) Amax(m2)
FM CS
FM SS clad
FM SS
FM Ni clad
K1 K2 K3 Vmin(m3) Vmax(m3) FM Ni
FM Ti clad
FM Ti


