50
Cape Cod Second Homeowners Technical Report of 2017 Survey Findings Cape Cod Commission June 2017

Cape Cod Second Homeowners Technical Report of 2017 Survey Findings Cape Cod Commission
June 2017

Cape Cod Second Homeowners 2017 Acknowledgements
UMass Donahue Institute Applied Research & Program Evaluation
i
Acknowledgements
The Cape Cod Commission and the University of Massachusetts Donahue Institute would like to thank the Cape Cod Economic Development Council, a division of Barnstable County, for their generous funding of this project and their ongoing support through the Cape & Islands License Plate Fund for the implementation of the Cape Cod Comprehensive Economic Development Strategy, of which this survey is one element.

UMass Donahue Institute Applied Research & Program Evaluation
ii
Contents
Acknowledgements ..................................................................................................................... i
List of Tables and Figures ........................................................................................................ iii
Executive Summary .................................................................................................................... 5
Introduction ................................................................................................................................. 8
Methodology ................................................................................................................................ 9
Findings – Respondent Profile ................................................................................................ 11
Findings – Potential Impacts of Natural Environment on Second Home ............................ 18
Findings – Current Use of Second Home ............................................................................... 22
Findings – Plans to Use Second Home in the Future ............................................................ 25
Findings – Current Participation in Cape Cod Community and Economy .......................... 33
Appendix A – Survey ................................................................................................................ 41

Cape Cod Second Homeowners 2017 Tables and Figures
UMass Donahue Institute Applied Research & Program Evaluation
iii
List of Tables and Figures
Tables
Table 1: Response Rate by Region .............................................................................................................. 9
Table 2: Number of Respondents by Town ................................................................................................ 11
Table 3: Number of Respondents by Region .............................................................................................. 12
Table 4: Description of Cape Cod Second Homes ..................................................................................... 12
Table 5: Auxiliary Dwellings in Cape Cod Second Homes ......................................................................... 13
Table 6: Number of Bedrooms in Cape Cod Second Homes ..................................................................... 13
Table 7: How Second Home on Cape Cod was Acquired .......................................................................... 13
Table 8: Number of Years Family Has Owned Cape Cod Second Home .................................................. 14
Table 9: Number of Years Family Has Owned Any Property on Cape Cod ............................................... 14
Table 10: Size of Cape Cod Second Home Lots (Acres) ........................................................................... 14
Table 11: Number of Second Homes Owned on Cape .............................................................................. 15
Table 12: Second Home Owned by a Trust or Group of People ................................................................ 15
Table 13: Cape Cod Second Homeowners by Gender .............................................................................. 15
Table 14: Household Demographics of Cape Cod Second Homeowners and Household Members ........ 16
Table 15: Education of Cape Cod Second Homeowners ........................................................................... 17
Table 16: Income of Cape Cod Second Homeowners ............................................................................... 17
Table 17: Distance from the Coastline ........................................................................................................ 18
Table 18: Cape Cod Second Homes with Deeded Beach Access ............................................................. 18
Table 19: Cape Cod Second Homes Landscaping ..................................................................................... 19
Table 20: Cape Cod Second Homes Located in a Flood-Hazard Zone ..................................................... 19
Table 21: Cape Cod Second Homes with Flood Insurance ........................................................................ 19
Table 22: Cape Cod Second Homes Threatened by Coastal Erosion in the Past 5 Years ........................ 20
Table 23: Cape Cod Second Homes Threatened by Flooding in the Past 5 Years ................................... 20
Table 24: Cape Cod Second Homes and Anticipated Future Coastal Erosion and Flooding .................... 20
Table 25: Desired Hard Structures to Protect Homes Against Coastal Erosion or Flooding ...................... 21
Table 26: Decline in Pond or Coastal Water Quality near Cape Cod Second Homes ............................... 21
Table 27: Cape Cod Second Homes Rented Out in the Past Five Years .................................................. 22
Table 28: Second Homes with at Least One Year-Round Resident .......................................................... 22
Table 29: Average Number of Days Second Home Used by Owners per Month, Based on the Past Five Years ........................................................................................................................... 23
Table 30: Average Typical Occupancy of Second Homes per Month When Occupied by Owners, Based on the Past Five Years .................................................................................................... 23
Table 31: Average Number of Days Second Home Used by Renters per Month, Based on the Past Five Years ........................................................................................................................... 24
Table 32: Average Typical Occupancy of Second Homes per Month When Occupied by Renters, Based on the Past Five Years .................................................................................................... 24
Table 33: Plans to Make Additions to Second Home in the Next Five Years ............................................. 25

Cape Cod Second Homeowners 2017 Tables and Figures
UMass Donahue Institute Applied Research & Program Evaluation
iv
Table 34: Expected Amount of Use of Cape Cod Second Home in Five Years ......................................... 26
Table 35: Anticipated Use of Cape Cod Second Homes in Five Years ...................................................... 26
Table 36: Anticipated Use of Cape Cod Second Homes in Twenty Years ................................................. 27
Table 37: Reasons Planning to Sell or Gift a Cape Cod Second Home within the Next Twenty Years ........................................................................................................................................... 30
Table 38: Plans to Convert Cape Cod Second Home into Primary Residence in the Future .................... 30
Table 39: Future Employment Plans if Planning to Move Permanently to the Cape .................................. 31
Table 40: Expected Type of Work Once Move Permanently to the Cape .................................................. 31
Table 41: Percent of Respondents Planning to Convert Second Home to Primary Home ........................ 31
Table 42: Estimated Number of Second Home Conversions to Primary Residences within Twenty Years ........................................................................................................................................... 32
Table 43: Respondents Planning to Convert Second Home to Primary Residence that Have Ever Rented Out Their Home in the Past Five Years ......................................................................... 32
Table 44: Support of Any Arts and Cultural Organizations Based on Cape Cod ....................................... 33
Table 45: Support of Any Other Charitable Organizations or Non-Profits Based on Cape Cod ................ 33
Table 46: Number of Times per Year Cape Cod Second Homeowners Attend Cultural Activities ............ 34
Table 47: Percentage of Second Homeowners that Are Members of Social and/or Recreation Clubs on Cape Cod .................................................................................................................... 35
Table 48: Where Cape Cod Second Homeowners Shop for Items ............................................................ 35
Table 49: Use of Private Services by Cape Cod Second Homeowners ..................................................... 37
Table 50: Reasons Second Homeowners Choose Off-Cape Vendors ....................................................... 40
Figures
Figure 1: Intentions for Usage of Cape Cod Second Homes in the Short and Long Term ........................ 28
Figure 2: Intentions for Usage of Cape Cod Second Homes in the Next Five Years, Comparing 2008 and 2017 Findings .............................................................................................................. 28
Figure 3: Intentions for Usage of Cape Cod Second Homes in the Next 15–20 Years, Comparing 2008 and 2017 Findings .............................................................................................................. 29

Cape Cod Second Homeowners 2017 Executive Summary
UMass Donahue Institute Applied Research & Program Evaluation
5
Executive Summary
The University of Massachusetts Donahue Institute (UMDI) surveyed a random sample of 6,448 second homeowners on Cape Cod for the Cape Cod Commission in the spring of 2017. Twenty percent of those surveyed responded (n=1,293). This survey research is a follow-up to a 2008 study conducted to understand how second homes were being used, how they might be used in the future, and how second homeowners participate in the local economy. The 2017 study broadens the scope of the 2008 study to include information related to the potential impacts of environmental factors on second homeownership. The findings of this research will inform economic development and land-use planning across Cape Cod. Survey findings are reported for the Cape as a whole and by four Cape sub-regions: the Upper Cape, Mid Cape, Lower Cape, and Outer Cape.1
What are the key characteristics of second homes and their owners?
Nearly all (90%) respondents own just one home other than their primary residence; the remainder own two or more “second” homes. More than one-quarter of second homes are owned by trusts or groups. The majority (85%) of Cape Cod second homes are single-family homes, with an average of three bedrooms. Nearly 85% of respondents either purchased their second home or purchased the land and built a home. Fifteen percent inherited the house or property. On average, second homeowners and their immediate families have owned these properties for 23 years. Reported lot sizes varied widely, from .01 acres to 40 acres, with an average lot size of three-quarters of an acre. Differences in lot size across the regions are statistically significant, with second homes on the Mid Cape having smaller lot sizes than those on the Upper, Lower, and Outer Cape. Cape Cod second homeowners are above average in terms of age, education, and income. The average age of respondents is 65, a statistically significant increase from an average of 61 years on the 2008 survey. Eighty percent have a bachelor’s degree or higher, including one-half who hold an advanced degree. Moreover, about 70% have a pre-tax household income of $100,000 or higher. Differences in education and income across the regions are statistically significant, with respondents from the Lower and Outer Cape reporting higher levels of attainment and those from the Mid Cape with the lowest.
How are second homes currently used?
Respondents reported primarily making personal use of their home. Only 29% of respondents have ever rented their home over the past five years, with the largest group (18%) renting on a weekly basis solely during the in-season. Second homes are used most heavily in the summer and least in the winter. During July and August, an average of four family members used their second home, spending an average of 20 days. For second homeowners who rent their property, July and August also had the highest usage, with an average of five individuals occupying the home each month, spending an average of 22 days. Conversely, the winter months (December through March) show the lowest usage by both family members and renters. An average of one or two family members spend their time at second homes during winter months, with an average of three days per month. For rentals, typically one renter spends an average of five days staying at Cape Cod second homes during the winter months. 1 Cape towns by sub-region are: Upper Cape—Mashpee, Falmouth, Bourne, and Sandwich; Mid Cape—Dennis, Yarmouth, and Barnstable; Lower Cape—Chatham, Brewster, Harwich, and Orleans; and Outer Cape—Wellfleet, Truro, Eastham, and Provincetown.

Cape Cod Second Homeowners 2017 Executive Summary
UMass Donahue Institute Applied Research & Program Evaluation
6
There is a statistically significant difference across sub-regions in the number of days per month that second-homeowners rent their homes. In general, second-homeowners in the Upper Cape and Mid Cape rent their homes to more people and for more days per month than those from the Lower Cape and Outer Cape. The exceptions to this pattern are the summer months, when rental usage and occupancy are comparable across the regions.
How do second homeowners anticipate using their second homes in the future?
Very few respondents (4%) plan to make any additions—adding new bedrooms, building auxiliary dwellings, and/or subdividing property for additional building lots—in the next five years. The majority expect their personal usage of their second home to either stay the same (45%) or increase (39%) in the next five years. Very few (2%) anticipate a decrease in personal usage. Anticipated rental usage is stable, with nearly 80% of respondents stating that rental usage will remain the same or is not applicable (i.e., they do not plan to rent their property). Second homeowners described their anticipated usage of their second home in five years and then again in twenty years. The anticipated usage of second homes changes significantly from the near term to the longer term. Less than a quarter of respondents believe they will use their second home solely for personal family use in 20 years, down from nearly 60% in five years. Instead, the largest group (41%) plan to gift or sell their second home in 20 years, as compared with only 8% in five years. The primary reason given for plans to sell or hand down property is that respondents will no longer be able to use their property. In addition, there are a large number of homes whose status is uncertain. Nearly one-fifth of respondents are uncertain what they will do with their second homes in the next 20 years compared with 6% in the next five years. Respondents from the Outer Cape are significantly more likely to plan to rent their property compared with the other regions at both the five-year and twenty-year mark. At five years, respondents with second homes on the Upper Cape are significantly more likely to plan to sell or hand down their property compared with the other Cape regions.
How many second homeowners plan to move to or retire on the Cape?
Over the next twenty years, 19% of respondents anticipate converting their second home into their primary residence. 2 Extrapolating from the sample, this rate of conversion would imply that about 11,000 second homes on Cape Cod may be converted in the next 20 years. Second homeowners planning to convert their second home to their primary residence expect an average of two people to reside at their Cape residence for an average of 10 months per year following conversion. The conversion to primary homes will also affect employment on the Cape. Nearly 40% of those planning to convert their second home to a primary residence intend to work either part-time or full-time after moving to the Cape. Of those respondents who plan to work after moving to the Cape, 31% plan to work for an off-Cape employer, 11% plan to work for an on-Cape employer, and 16% plan to start or relocate a business.
2 Includes all respondents who answered that they are planning to convert their second home to their primary residence in either five years or in twenty years.

Cape Cod Second Homeowners 2017 Executive Summary
UMass Donahue Institute Applied Research & Program Evaluation
7
How do second homeowners participate in the Cape Cod community and economy?
Cape Cod second homeowners are actively involved in and supportive of the Cape Cod community. About three-quarters of respondents reported actively supporting both arts and cultural organizations and other nonprofit or charitable organizations based on the Cape, primarily through purchasing tickets/goods and making charitable contributions. Homeowners on the Lower Cape and Outer Cape reported significantly higher levels of support than those on the Mid Cape and Upper Cape. Furthermore, about 70% or more reported attending or visiting historical societies or museums, music concerts, art museums and galleries, and/or live theatre at least once annually while staying at their second home. Again, differences in attendance are statistically significant across regions, with second homeowners on the Outer Cape consistently reporting the most frequent attendance and those on the Upper Cape indicating the least. About one-fifth of respondents reported being members of a social and/or recreational club on Cape Cod. Differences across regions are again significant, but this time those representing the Upper Cape reported the highest rates of membership and those on the Outer Cape reported the lowest. Nearly all second homeowners purchase their groceries, hardware/building supplies, and garden supplies for their second home on-Cape. About 45–65% reported currently purchasing office supplies, sports/recreation items, clothing, and household furnishings on-Cape. The most commonly utilized on-Cape vendors for private services include construction services (76%), trade/repair services (76%), and landscape/yard services (68%). About one-half of respondents reported using on-Cape hospital emergency room, banking, and insurance services. Few second homeowners reported using on-Cape vendors for investment services, accounting services, primary care physicians, or medical specialists. When asked the primary reason for choosing an off-Cape vendor, three-fifths of respondents indicated that services are not needed while using their second home and about one-third already have an established service provider based off-Cape. Very few noted issues of cost (13%) or quality (4%) of services provided by on-Cape vendors.
How do second homeowners perceive potential impacts of environmental factors on second homeownership?
Seventy percent of all respondents’ second homes are located within one mile of the nearest coast, with 14% located on the coastline and 27% within one quarter of a mile. Differences to the nearest coastline are statistically significant across the regions, with residents of the Upper Cape and Outer Cape reporting shorter distances to the coastline. Second homeowners were asked a series of questions to learn about existing and anticipated environmental impacts. Less than 10% of respondents reported experiencing coastal erosion or flooding in the past five years. However, the percentage that anticipate being affected by coastal erosion or flooding increases substantially over time, with 7% predicting impacts in the next 5 years, 14% in the next 10 years, and 26% in the next 25 years. Anticipated environmental impacts vary across Cape regions, with residents on the Upper and Outer Cape—who reported having properties situated closer to the coastline—being significantly more likely to expect to experience a level of coastal erosion or flooding within the next 25 years. For those anticipating future impacts, only one-fifth reported plans to build hard structures—such as groynes perpendicular to the sea, offshore breakwaters parallel to the shore, seawalls/revetments, or another hard structure—to defend their second home. Finally, respondents were asked about changes in water quality since purchasing or constructing their home. Only 12% of second homeowners reported a decline in pond or coastal water quality near their second home during that period of time.

Cape Cod Second Homeowners 2017 Introduction
UMass Donahue Institute Applied Research & Program Evaluation
8
Introduction
Cape Cod has long been a popular location for second homes, with about 41% of all homes considered seasonal. 3 The proportion of seasonal homes varies by town, ranging from a low of 18% in Sandwich to a high of 73% in Truro.4 The Cape Cod Commission contracted with The University of Massachusetts Donahue Institute (UMDI) to build on their 2008 study of Cape Cod second homeowners5 to (1) continue to analyze their current use of and future plans for their properties, and (2) broaden the research scope to explore the potential impacts of environmental factors on second homeownership. The findings of this research will inform economic development and land-use planning across Cape Cod. Research questions were the following:
Use of Second Homes
1. What are the characteristics of a typical second home on Cape Cod?
2. How do second homeowners use their property month to month?
3. To what extent do second homeowners rent their property?
4. To what extent do second homeowners purchase goods and services locally?
5. To what extent do second homeowners use goods and services based on Cape Cod for their property?
6. What are second homeowners’ short- and long-term plans for their second home?
7. How many second homeowners want to move to / retire on Cape Cod? Do they plan to work after moving?
Perception of Potential Environmental Impacts
8. Have second homeowners noticed a decline in pond or coastal water quality near their second home?
9. Have second homeowners’ properties been threatened by coastal erosion or flooding in the past five years?
10. To what extent do second homeowners anticipate threats of coastal erosion or flooding in the future?
11. In what ways are second homeowners planning to address potential threats to property due to coastal erosion and rising sea level?
This report has the following sections:
Methodology: Provides information on the survey instrument, survey sample, response rate, and analysis.
Respondent Profile: Describes respondents and their second home properties. Findings: Summarizes findings regarding (1) potential impacts of the natural environment on
second homes, (2) current use of second homes, (3) plans for use of second homes in the future, and (4) current participation in the Cape Cod community and economy.
3 American Community Survey, US Census Bureau, 2014 5-year estimates. 4 http://www.statscapecod.org/towndata/housing.php 5 University of Massachusetts Donahue Institute. (2008). Survey of Cape Cod Second Homeowners: Technical Report of Findings. Prepared for the Cape Cod Commission.

Cape Cod Second Homeowners 2017 Methodology
UMass Donahue Institute Applied Research & Program Evaluation
9
Methodology
Survey Instrument
The 2017 Cape Cod second-homeowner survey was developed collaboratively by UMDI researchers and Cape Cod Commission staff. The starting point for the survey was the 2008 survey of second homeowners, with an additional focus on the potential impacts of coastal erosion, sea-level rise and water-quality issues on second homeowners. A copy of the survey can be found in Appendix A of this report.
Survey Sample
UMDI worked with the Cape Cod Commission and the assessors from each town to identify second homeowners through personal property taxpayer records, because the majority of homes subject to this tax are second homes. While some primary homes also pay this tax, the Cape Cod Commission and UMDI believe that this was the best way to obtain individual contact information for second homeowners and that the impact of having a small number of primary homes in the sample would not be significant. Assessor data collected for the 2017 survey showed that there are about 58,500 second homes on Cape Cod. A random sample of 6,448 second homeowners (1,612 per region) was identified, comprising 11% of all second homes. When the sample was selected, second homeowners who live abroad were removed from the sample, because the survey would have been closed by the time they received and returned their surveys. In April 2017, a scannable survey, including a cover letter with the address of the secondary home and a postage-paid business reply envelope, was mailed to the primary address of each second homeowner in the sample. A reminder postcard was mailed to the same address one week later. In addition, UMDI offered survey respondents the chance to win one of four $100 Visa gift cards as an incentive to increase the response rate.
Survey Response
Of the 6,448 surveys sent out, 1,293 completed surveys were returned in time to be included in the analysis, for a response rate of 20%. The response rate ranged from 17% in the Lower Cape to 23% in the Mid Cape, with an average of 323 surveys per region (Table 1). Using a 95% confidence level, the confidence interval (i.e., margin of error) for the survey findings is plus or minus six percentage points for items at the sub-region level and plus or minus three percentage points for items combined across the four sub-regions.
Table 1: Response Rate by Region
Number of Surveys
Distributed
Number of Surveys Received
Response Rate
Upper Cape 1,612 300 19
Mid Cape 1,612 364 23
Lower Cape 1,612 276 17
Outer Cape 1,612 352 22
Total 6,448 1,293 20

Cape Cod Second Homeowners 2017 Methodology
UMass Donahue Institute Applied Research & Program Evaluation
10
Analysis
The 1,293 survey responses are the basis of the analyses presented in the report. The total number of valid responses for any particular question may vary because some individuals did not answer one or more of the questions. Findings for each question are presented for each Cape region and for the regions combined. Findings include frequencies and percentages, as well as mean, median, and range where appropriate. Further analyses were conducted to determine whether differences between the four Cape regions are statistically significant. Chi-square tests were used for nominal data, Kruskal-Wallis for ordinal data, and one-way ANOVA for interval data. Where applicable, analyses were also conducted to determine differences between findings from the 2008 and 2017 surveys. Chi-square tests were used for nominal data, Wilcoxon-Mann-Whitney tests for ordinal data, and t-tests for interval data. A 95% confidence interval was used for all tests.

Cape Cod Second Homeowners 2017 Respondent Profile
UMass Donahue Institute Applied Research & Program Evaluation
11
Findings – Respondent Profile
This section presents key characteristics of respondents and their second homes. Property descriptors include location of second home, type and size of home and property, and length and means of ownership. Respondent descriptors include age, gender, number of people in household, educational attainment, and total household income.
Property Descriptors
Respondents first listed the town where their second home is located. The largest number of completed surveys is from individuals with second homes in Dennis, Falmouth, Eastham, and Harwich (Table 2).
Table 2: Number of Respondents by Town, n=1,293
Town Total %
Barnstable 92 7
Brewster 54 4
Bourne 48 4
Chatham 45 4
Dennis 181 14
Eastham 125 10
Falmouth 149 12
Harwich 128 10
Mashpee 71 6
Orleans 49 4
Provincetown 78 6
Sandwich 32 3
Truro 60 5
Wellfleet 89 7
Yarmouth 91 7
Missing Data 1 .1
Next, the 15 Cape towns were categorized into the following four regions:
Upper Cape: Bourne, Falmouth, Mashpee, Sandwich Mid Cape: Barnstable, Dennis, Yarmouth Lower Cape: Brewster, Chatham, Harwich, Orleans Outer Cape: Eastham, Provincetown, Truro, Wellfleet
The percentage of survey responses that came from each region ranges from 21% for the Lower Cape to 28% for the Mid Cape (Table 3).

Cape Cod Second Homeowners 2017 Respondent Profile
UMass Donahue Institute Applied Research & Program Evaluation
12
Table 3: Number of Respondents by Region, n=1,292
Total %
Upper Cape 300 23
Mid Cape 364 28
Lower Cape 276 21
Outer Cape 352 27
Note: Percentages do not sum to 100 due to rounding.
Comparing the current findings to the 2008 sample, we find the following statistically significant difference. The 2008 sample had a larger proportion of respondents with homes on the Lower Cape compared with the 2017 sample (27% vs. 21%). The 2017 sample has a larger proportion of respondents with homes on the Mid Cape compared with the 2008 sample (28% vs. 23%). Eighty-five percent of the second homes owned by these respondents are single-family homes (Table 4). The second-largest category of home type is condominium (9%). Second homeowners on the Outer Cape have a higher proportion of condominiums compared to the other regions. Differences across the regions are statistically significant.
Table 4: Description of Cape Cod Second Homes, n=1,287
Upper Cape n=273 (%)
Mid Cape n=364 (%)
Lower Cape n=351 (%)
Outer Cape n=299 (%)
Cape Regions Combined
(%)
Single Family 87 88 92 74 85
Condominium 8 7 3 17 9
Mobile Home 0 0 0 0 0
Two Family 1 0 0 2 1
Three Family 0 0 0 0 0
Multiple Home on One Parcel
1 0 1 2 1
Cottage in a Cottage Colony 3 4 3 5 4
Note: Some percentages do not sum to 100 due to rounding.
Comparing the current findings to the 2008 sample, we find the following statistically significant difference. The 2017 sample has a larger proportion of single-family homes compared with the 2008 sample (85% to 81%). The 2008 sample had a larger proportion of condominiums compared with the 2017 sample (12% to 9%). In addition, seven percent of respondents reported having an auxiliary dwelling, such as a guest cottage or an in-law apartment, within their second home or on their second home property (Table 5).

Cape Cod Second Homeowners 2017 Respondent Profile
UMass Donahue Institute Applied Research & Program Evaluation
13
Table 5: Auxiliary Dwellings in Cape Cod Second Homes, n=1,281
Upper Cape n=298 (%)
Mid Cape n=362 (%)
Lower Capen=271 (%)
Outer Cape n=350 (%)
Cape Regions Combined
(%)
Yes 7 4 8 8 7
No 93 96 92 92 93
Most respondents (87%) reported having two, three, or four bedrooms in their second homes, with the average second home having three bedrooms (Table 6). Five percent of respondents reported having either zero or one bedroom in their second homes, and the remaining 8% have five or more bedrooms.
Table 6: Number of Bedrooms in Cape Cod Second Homes, n=1,286
Upper Cape
n=299 Mid Cape n=361
Lower Cape n=275
Outer Cape n=351
Cape Regions Combined
No Bedrooms 0% 0% 0% 3% 1%
One Bedroom 3% 1% 2% 7% 4%
Two Bedrooms 18% 29% 16% 20% 21%
Three Bedrooms 47% 47% 42% 41% 44%
Four Bedrooms 21% 18% 29% 23% 22%
Five or More Bedrooms 11% 6% 11% 6% 8%
Average Number of Bedrooms 3 3 3 3 3
Average Number of Bedrooms in Houses with Five or More Bedrooms
6 6 5 6 6
Note: Some percentages do not sum to 100 due to rounding.
Respondents were asked to describe how they came to own their current Cape Cod second home (Table 7). Nearly three-quarters (73%) of respondents purchased their second home. In addition, 14% of respondents inherited their home and 11% purchased land and built their home. Very few respondents inherited the land and built a home or purchased a home and tore it down to build a new one.
Table 7: How Second Home on Cape Cod was Acquired, n=1,284
Upper Capen=299 (%)
Mid Cape n=359 (%)
Lower Capen=275 (%)
Outer Cape n=351 (%)
Cape Regions Combined
(%)
Purchased 73 76 74 70 73
Inherited or Gifted (in Part or in Whole) 17 15 13 10 14
Purchased Land and Built Home 8 7 10 19 11
Inherited Land and Built Home 1 0 1 1 1
Purchased Home and Tore it Down to Build a New One
2 3 3 1 2
Note: Some percentages do not sum to 100 due to rounding.

Cape Cod Second Homeowners 2017 Respondent Profile
UMass Donahue Institute Applied Research & Program Evaluation
14
Respondents were asked how long they or their immediate family have owned this particular second-home property. The length of time owning the second home varies widely across respondents, from newly owned to 100 years (Table 8). The average length of ownership for respondents and their immediate families is 23 years.
Table 8: Number of Years Family Has Owned Cape Cod Second Home, n=1,269
Upper Cape
n=292 Mid Cape n=357
Lower Cape n=274
Outer Cape n=346
Cape Regions Combined
Average 23 24 22 22 23
Median 17 20 18 18 18
Range 0–100 1–92 0–92 1–94 0–100
Respondents were also asked how long they or their immediate family owned property anywhere on the Cape (Table 9). Similar to the findings above, the length of time varies widely from newly owned to 117 years in length. The average length of time owning any property on Cape Cod is 27 years. There are no statistically significant differences across the Cape regions in the length of time second homes or any properties on Cape Cod have been owned.
Table 9: Number of Years Family Has Owned Any Property on Cape Cod, n=1,230
Upper Cape
n=278 Mid Cape n=347
Lower Capen=269
Outer Cape n=336
Cape Regions Combined
Average 28 28 27 25 27
Median 25 24 22 20 22
Range 0–100 0–117 0–99 0–99 0–117
Reported lot sizes of second homes vary widely from 0.01 to 40 acres (Table 10). The average lot size is about three-quarters of an acre and the median lot size is one-half of an acre. Differences across the regions are statistically significant, with second homes on the Mid Cape having significantly smaller lot sizes than those reported in the Upper, Lower, and Outer Cape.
Table 10: Size of Cape Cod Second Home Lots (Acres), n=1,009
Upper Cape n=221
Mid Cape n=277
Lower Cape n=239
Outer Cape n=272
Cape Regions Combined
Average Lot Size 0.80 0.50 0.89 0.86 0.76
Median Lot Size 0.47 0.33 0.50 0.67 0.50
Range of Lot Size 0.01–40 0.01–3.5 0.01–30 0.01–16 0.01–40
The majority of respondents own one second home on Cape Cod (Table 11). Ten percent of respondents reported owning more than one second home on Cape Cod, and for those who do own more than one second home, the average and median number owned is two.

Cape Cod Second Homeowners 2017 Respondent Profile
UMass Donahue Institute Applied Research & Program Evaluation
15
Table 11: Number of Second Homes Owned on Cape, n=1,182
Upper Capen=275 (%)
Mid Cape n=333 (%)
Lower Capen=257 (%)
Outer Cape n=317 (%)
Cape Regions Combined
(%)
One Home Owned 87 91 91 87 90
Two Homes Owned 9 9 9 10 9
Three or More Homes Owned 3 0 1 1 1
Note: Some percentages do not sum to 100 due to rounding.
More than a quarter of homes are owned by trusts or groups (Table 12). The Mid Cape and Outer Cape have the fewest homes owned by a trust or group, with 24% of all second homes owned in such a manner. At 30%, the Upper Cape has the highest proportion of homes owned by a group or trust. These differences are not statistically significant.
Table 12: Second Home Owned by a Trust or Group of People, n=1,256
Upper Cape
n=291 (%)
Mid Cape n=357 (%)
Lower Capen=271 (%)
Outer Cape n=337 (%)
Cape Regions Combined
(%)
Yes 30 24 29 24 27
No 70 76 71 76 73
Comparing the current findings to the 2008 sample, we find that the 2017 sample has a significantly larger proportion of second homes owned by a trust or group of people compared with the 2008 sample (27% to 20%).
Respondent Descriptors
Fifty-four percent of respondents are male and 47% are female (Table 13).
Table 13: Cape Cod Second Homeowners by Gender, n=1,255
Upper Cape
n=292 (%)
Mid Cape n=354 (%)
Lower Capen=264 (%)
Outer Cape n=345 (%)
Cape Regions Combined
(%)
Male 54 53 54 54 54
Female 46 47 46 46 47
Note: Some percentages do not sum to 100 due to rounding.
The average age of respondents is 65. The age of respondents is similar across the four Cape regions. The typical second home family, for the Cape as a whole and for each sub-region, has two adults and no children living in the home (Table 14).

Cape Cod Second Homeowners 2017 Respondent Profile
UMass Donahue Institute Applied Research & Program Evaluation
16
Table 14: Household Demographics of Cape Cod Second Homeowners and Household Members, n=1,225
Upper Cape, n=286
Respondent’s
Age # of Adults
# of TeensAges 14–18
# of Children Ages 0–13
Average 65 2 0 0
Median 66 2 0 0
Range 80 0–5 0–6 0–3
Mid Cape, n=346
Respondents
Age # of Adults
# of TeensAges 14–18
# of Children Ages 0–13
Average 65 2 0 0
Median 65 2 0 0
Range 68 0–5 0–4 0–3
Lower Cape, n=257
Respondents
Age # of Adults
# of TeensAges 14–18
# of Children Ages 0–13
Average 65 2 0 0
Median 65 2 0 0
Range 86 1–10 0–4 0–4
Outer Cape, n=336
Respondents
Age # of Adults
# of Teensages 14–18
# of Children Ages 0–13
Average 65 2 0 0
Median 65 2 0 0
Range 81 1–6 0–3 0–6
Cape Regions Combined
Respondents
Age # of Adults
# of TeensAges 14–18
# of Children Ages 0–13
Average 65 2 0 0
Median 65 2 0 0
Range 90 0–10 0–6 0–6
Comparing the current respondent profile to the 2008 sample, we find the following statistically significant differences. Comparative analysis reveals that 2017 respondents are significantly older than 2008 survey respondents. On average, 2017 respondents are 65 years old compared to 61 years for 2008 respondents. We also find that the average numbers of children and teens in their household were significantly larger in 2008, each being rounded up to an average of one per household in 2008 compared to being rounded down to an average of zero in 2017.

Cape Cod Second Homeowners 2017 Respondent Profile
UMass Donahue Institute Applied Research & Program Evaluation
17
Cape Cod second homeowners are generally well-educated. Eighty percent of respondents have a bachelor’s degree or higher, including 51% who hold a graduate degree (Table 15). The percentage of respondents with a bachelor’s or graduate degree varies across sub-regions from a low of 73% in the Mid Cape to a high of 87% in the Outer Cape. Differences in educational attainment across the regions are statistically significant.
Table 15: Education of Cape Cod Second Homeowners, n=1,255
Upper Capen=291 (%)
Mid Cape n=354 (%)
Lower Capen=267 (%)
Outer Cape n=343 (%)
Cape Regions Combined
(%)
Grade School 1 0 0 0 0
Some High School 0 0 0 0 0
High School Graduate 8 6 3 3 5
GED 0 1 0 1 0
Some College No Degree 6 11 5 6 7
Associate’s Degree 6 8 6 4 6
Bachelor’s Degree 32 31 32 24 29
Graduate Degree 46 42 54 63 51
Note: Some percentages do not sum to 100 due to rounding.
About 70% of respondents have a pre-tax household income of $100,000 or higher (Table 16). The percentage of respondents in this income bracket varies across sub-regions from a low of 65% in the Mid Cape to a high of 81% in the Lower Cape. Differences in household income across the regions are statistically significant.
Table 16: Income of Cape Cod Second Homeowners, n=1,034
Upper Capen=224 (%)
Mid Cape n=294 (%)
Lower Cape n=216 (%)
Outer Cape n=300 (%)
Cape Regions Combined
(%)
$24,999 or Less 1 1 1 1 1
$25,000 to $49,999 6 7 5 6 6
$50,000 to $74,999 12 13 7 10 11
$75,000 to $99,999 13 14 8 12 12
$100,000 to $199,999 22 34 37 35 32
$200,000 to $500,000 33 22 31 29 28
$500,000 or More 13 9 13 8 10
Note: Some percentages do not sum to 100 due to rounding.
Comparisons between 2008 and 2017 findings indicate that 2017 respondents reported significantly higher household incomes. Thirty-eight percent of 2017 respondents made at least $200,000 in total household income compared with 32% of 2008 respondents. This change may be attributable in part or full due to increases in salary and/or investment incomes that typically happen over time.
Cape Cod Second Homeowners 2017 Potential Impacts of Natural Environment
UMass Donahue Institute Applied Research & Program Evaluation
18
Findings – Potential Impacts of Natural Environment on Second Home
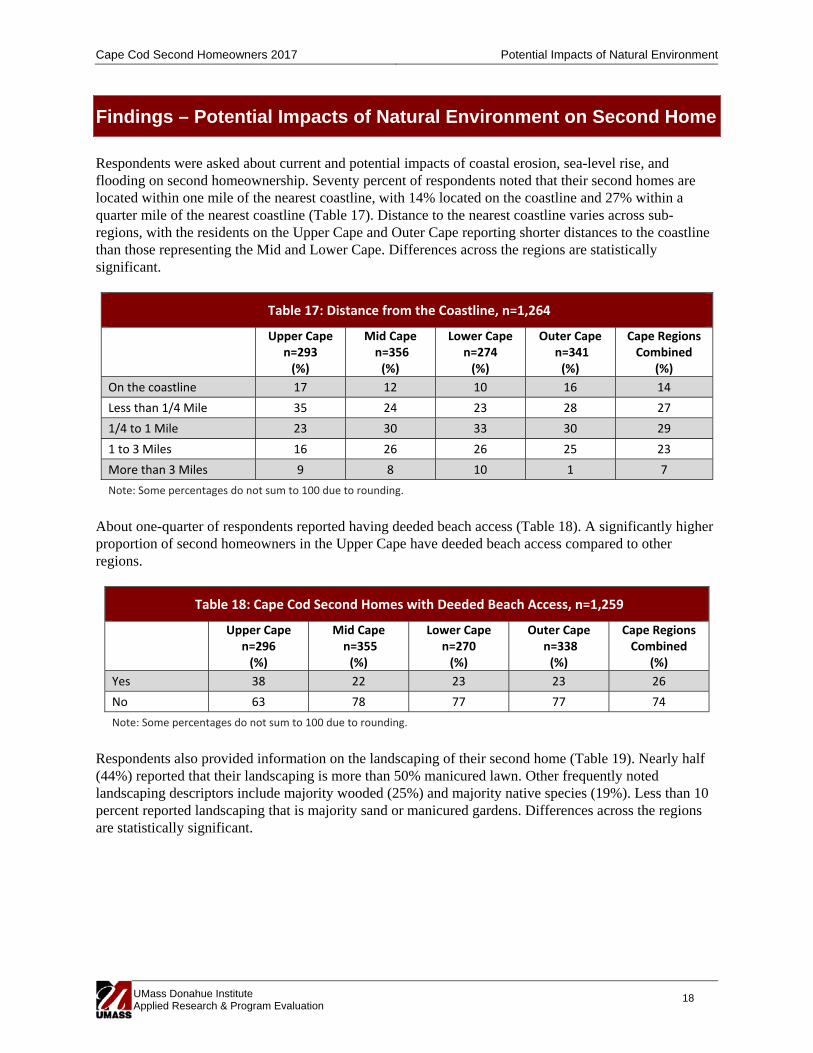
Respondents were asked about current and potential impacts of coastal erosion, sea-level rise, and flooding on second homeownership. Seventy percent of respondents noted that their second homes are located within one mile of the nearest coastline, with 14% located on the coastline and 27% within a quarter mile of the nearest coastline (Table 17). Distance to the nearest coastline varies across sub-regions, with the residents on the Upper Cape and Outer Cape reporting shorter distances to the coastline than those representing the Mid and Lower Cape. Differences across the regions are statistically significant.
Table 17: Distance from the Coastline, n=1,264
Upper Cape
n=293 (%)
Mid Cape n=356 (%)
Lower Capen=274 (%)
Outer Cape n=341 (%)
Cape Regions Combined
(%)
On the coastline 17 12 10 16 14
Less than 1/4 Mile 35 24 23 28 27
1/4 to 1 Mile 23 30 33 30 29
1 to 3 Miles 16 26 26 25 23
More than 3 Miles 9 8 10 1 7
Note: Some percentages do not sum to 100 due to rounding.
About one-quarter of respondents reported having deeded beach access (Table 18). A significantly higher proportion of second homeowners in the Upper Cape have deeded beach access compared to other regions.
Table 18: Cape Cod Second Homes with Deeded Beach Access, n=1,259
Upper Cape
n=296 (%)
Mid Cape n=355 (%)
Lower Capen=270 (%)
Outer Cape n=338 (%)
Cape Regions Combined
(%)
Yes 38 22 23 23 26
No 63 78 77 77 74
Note: Some percentages do not sum to 100 due to rounding.
Respondents also provided information on the landscaping of their second home (Table 19). Nearly half (44%) reported that their landscaping is more than 50% manicured lawn. Other frequently noted landscaping descriptors include majority wooded (25%) and majority native species (19%). Less than 10 percent reported landscaping that is majority sand or manicured gardens. Differences across the regions are statistically significant.

Cape Cod Second Homeowners 2017 Potential Impacts of Natural Environment
UMass Donahue Institute Applied Research & Program Evaluation
19
Table 19: Cape Cod Second Homes Landscaping, n=1,125
Upper Cape
n=263 (%)
Mid Cape n=312 (%)
Lower Capen=241 (%)
Outer Cape n=309 (%)
Cape Regions Combined
(%)
More than 50% Wooded 24 12 29 38 25
More than 50% Native Species 13 14 16 30 19
More than 50% Sand 3 7 2 10 6
More than 50% Manicured Lawn 54 61 50 12 44
More than 50% Manicured Gardens 7 6 3 10 7
Note: Some percentages do not sum to 100 due to rounding.
Sixteen percent of second homeowners reported that their second homes are located in a flood-hazard zone, with significantly higher proportions by those representing the Mid Cape and Upper Cape (Table 20).
Table 20: Cape Cod Second Homes Located in a Flood‐Hazard Zone, n=1,251
Upper Cape
n=292 (%)
Mid Cape n=356 (%)
Lower Capen=268 (%)
Outer Cape n=335 (%)
Cape Regions Combined
(%)
Yes 21 21 9 13 16
No 62 63 78 69 68
Don't Know 18 16 13 18 17
Note: Some percentages do not sum to 100 due to rounding.
About one-fifth of respondents noted they currently have flood insurance for their second home (Table 21). While most respondents without flood insurance do not live in a designated flood zone, ten percent are located in a flood zone but said that they do not have flood insurance because they do not have a mortgage.
Table 21: Cape Cod Second Homes with Flood Insurance, n=1,229
Upper Cape
n=287 (%)
Mid Cape n=347 (%)
Lower Capen=260 (%)
Outer Cape n=335 (%)
Cape Regions Combined
(%)
Yes, Required 14 14 10 14 13
Yes, Chose to Buy it 6 7 5 5 6
No, Not in Flood Zone 68 66 80 72 71
No, in Flood Zone but No Mortgage 12 13 5 9 10
Next, the survey asked a series of questions to learn about existing and anticipated environmental impacts on second homes on the Cape. First, second homeowners were asked whether their property has been threatened by coastal erosion or flooding over the last five years. Less than 5% of respondents reported that their property was threatened by either coastal erosion or flooding in the past five years (Tables 22 and 23). Differences are not statistically significant by Cape region.

Cape Cod Second Homeowners 2017 Potential Impacts of Natural Environment
UMass Donahue Institute Applied Research & Program Evaluation
20
Table 22: Cape Cod Second Homes Threatened by Coastal Erosion in the Past 5 Years, n=1,259
Upper Cape
n=291 (%)
Mid Capen=358 (%)
Lower Capen=270 (%)
Outer Cape n=340 (%)
Cape Regions Combined
(%)
Yes 5 4 2 6 4
No 95 96 98 94 96
Table 23: Cape Cod Second Homes Threatened by Flooding in the Past 5 Years, n=1,201
Upper Cape
n=282 (%)
Mid Capen=340 (%)
Lower Capen=261 (%)
Outer Cape n=313 (%)
Cape Regions Combined
(%)
Yes 5 4 2 3 3
No 95 96 98 97 97
Next, second homeowners were asked whether they anticipate that their property would be threatened by coastal erosion or flooding in the future (Table 24). The percentage predicting either ‘some’ or ‘significant’ coastal erosion and/or flooding increases substantially over time, with 7% predicting impacts in the next 5 years, 14% in the next 10 years, and 26% in the next 25 years. Anticipated environmental impacts vary across regions, with residents of the Upper and Outer Cape—who reported having properties situated closer to the coastline—being significantly more likely to expect either ‘some’ or ‘significant’ coastal erosion and/or flooding within the next 25 years. Nearly one-third of Upper and Outer Cape respondents anticipate that their property will be threatened by some level of coastal erosion or flooding within the next 25 years, compared with about one-fifth of Lower and Mid Cape respondents.
Table 24: Cape Cod Second Homes and Anticipated Future Coastal Erosion and Flooding
Upper Cape
(%) Mid Cape
(%) Lower Cape
(%) Outer Cape
(%)
Cape Regions Combined
(%)
Anticipate coastal erosion or flooding in the next 5 years (n=1,072)
No 92 95 95 92 94
Yes, Some 7 5 5 8 6
Yes, Significant 0.4 0.3 0.4 0.3 0.4
Anticipate coastal erosion or flooding in the next 10 years (n=1,062)
No 83 77 91 80 85
Yes, Some 16 9 6 16 12
Yes, Significant 1 4 3 4 3
Anticipate coastal erosion or flooding in the next 25 years (n=1,095)
No 69 79 83 69 75
Yes, Some 20 11 10 17 15
Yes, Significant 11 10 8 14 11
Note: Some percentages do not sum to 100 due to rounding.

Cape Cod Second Homeowners 2017 Potential Impacts of Natural Environment
UMass Donahue Institute Applied Research & Program Evaluation
21
For those anticipating future impacts, one-fifth of second homeowners reported wanting to build hard structures—such as groynes perpendicular to the sea, offshore breakwaters parallel to the shore, seawalls/revetments, or another hard structure—to defend their second home (Table 25).
Table 25: Desired Hard Structures to Protect Homes Against Coastal Erosion or Flooding, n=258
Upper Cape
n=70 (%)
Mid Cape n=60 (%)
Lower Capen=39 (%)
Outer Cape n=89 (%)
Cape Regions Combined
(%)
Want to Build Hard Structures
Yes 19 20 26 18 20
No 81 80 74 82 80
Desired Types of Hard Structures1
Groynes Perpendicular to the Sea 1 5 13 2 4
Offshore Breakwaters Parallel to the Shore 4 0 8 4 4
Seawalls or Revetments 4 0 5 2 3
Another Hard Structure 14 15 21 16 16 1 Includes only those respondents who (a) anticipate future flooding or coastal erosion, and (b) anticipate wanting to build one or more of these types of hard structures in the future.
Finally, respondents were asked about changes in water quality after they purchased or constructed their property. Twelve percent of second homeowners reported noticing a decline in pond or coastal water quality near their second home during this time period (Table 26).
Table 26: Decline in Pond or Coastal Water Quality near Cape Cod Second Homes, n=1,256
Upper Cape
n=292 (%)
Mid Cape n=355 (%)
Lower Capen=269 (%)
Outer Cape n=340 (%)
Cape Regions Combined
(%)
Yes 15 9 13 10 12
No 68 74 70 70 71
Don't Know 16 17 17 20 18
Note: Some percentages do not sum to 100 due to rounding.

Cape Cod Second Homeowners 2017 Current Use of Second Home
UMass Donahue Institute Applied Research & Program Evaluation
22
Findings – Current Use of Second Home
Seventy-one percent of respondents reported using their second home only for personal/family use over the past five years (Table 21). About one-quarter reported using their homes for both personal and rental use over the past five years, with the largest group (18%) renting their homes weekly during the in-season. Very few indicated using their second homes solely for rental purposes.
Table 27: Cape Cod Second Homes Rented Out in the Past Five Years, n=1,266
Upper Cape
n=296 (%)
Mid Cape n=360 (%)
Lower Capen=269 (%)
Outer Cape n=341 (%)
Cape Regions Combined
(%)
Yes, as a Year‐Round Rental 6 5 2 3 4
Yes, as a Month‐to‐Month Rental During the Off‐Season
3 1 0 0 1
Yes, as a Weekly Rental During the Off‐Season
0 1 1 1 1
Yes, as a Month‐to‐Month Rental During the In‐Season
1 1 1 3 2
Yes, as a Weekly Rental During the In‐Season
8 13 18 32 18
No, Second Home Not Rented 79 78 74 54 71
Other 1 1 1 4 2
Note: Some percentages do not sum to 100 due to rounding.
While the majority of second homes are solely for personal use, less than 10% of respondents indicated having a year-round resident (whether a renter, caretaker, or other) in their second home or auxiliary dwelling on their property (Table 28). For those with year-round residents, an average of two people reside year-round at the property.
Table 28: Second Homes with at Least One Year‐Round Resident, n=1,255
Upper Cape
n=292 Mid Cape n=355
Lower Cape n=268
Outer Cape n=340
Cape Regions Combined
Yes, in the Second Home or Auxiliary Dwelling
15% 8% 6% 8% 9%
No 85% 92% 94% 92% 91%
Average Number of Residents 2 2 2 1 2
Personal Usage
Second homes are most likely to be used by their owners and family members during the summer months. The average number of days typically spent by owners and their families range from three days in the winter months to twenty days during the month of August (Table 29). Typical monthly occupancy follows a similar pattern, with the lowest occupancy during winter months and the highest during summer months. The average occupancy ranges from an average of one person in January, March, November, and December to an average of four people in July and August (Table 30).

Cape Cod Second Homeowners 2017 Current Use of Second Home
UMass Donahue Institute Applied Research & Program Evaluation
23
Table 29: Average Number of Days Second Home Used by Owners per Month, Based on the Past Five Years, n=1,240
Upper Cape
n=290 Mid Cape n=343
Lower Cape n=266
Outer Cape n=341
Cape Regions Combined
January 3 3 3 3 3
February 3 3 3 2 3
March 3 3 3 3 3
April 5 5 5 5 5
May 8 9 8 8 8
June 14 15 13 14 14
July 19 20 20 18 19
August 20 20 20 18 20
September 12 13 13 12 12
October 7 8 8 8 8
November 4 4 4 4 4
December 4 3 4 3 3
Total 102 106 104 98 102
Table 30: Average Typical Occupancy of Second Homes per Month When Occupied by Owners, Based on the Past Five Years, n=1,240
Upper Cape
n=290 Mid Cape n=343
Lower Cape n=266
Outer Cape n=341
Cape Regions Combined
January 1 1 1 1 1
February 2 2 2 1 2
March 1 1 1 1 1
April 2 2 2 2 2
May 2 3 3 2 3
June 3 3 3 3 3
July 4 4 4 3 4
August 4 4 4 4 4
September 3 3 3 3 3
October 2 2 2 2 2
November 1 1 2 1 1
December 1 1 1 1 1
Rental Usage
Second homeowners who have rented their homes at any time during the past five years were asked to provide similar estimates of monthly days-in-use and occupancy numbers for their renters. The average number of days rented ranges from five days in the winter months to twenty-two days in July (Table 31). Typical monthly occupancy follows a similar pattern, with an average of one occupant during the coldest

Cape Cod Second Homeowners 2017 Current Use of Second Home
UMass Donahue Institute Applied Research & Program Evaluation
24
months and five occupants during July and August (Table 32). The differences in rental days and occupancy across the regions are statistically significant during the non-summer months, with the Upper Cape and the Mid Cape experiencing higher rates of rental usage in the spring, fall, and winter months compared with the Lower Cape and Outer Cape. Rental usage and occupancy rates during summer months are comparable across the regions.
Table 31: Average Number of Days Second Home Used by Renters per Month, Based on the Past Five Years, n=332
Upper Cape
n=54 Mid Cape n=72
Lower Cape n=62
Outer Cape n=144
Cape Regions Combined
January 14 8 2 3 6
February 12 7 2 3 5
March 13 7 2 3 5
April 13 8 2 3 6
May 14 7 2 4 6
June 14 11 6 9 10
July 20 22 21 22 22
August 19 22 22 20 21
September 15 11 6 8 9
October 14 8 2 4 6
November 13 8 2 3 5
December 13 7 2 2 5
Total 174 126 71 84 106
Table 32: Average Typical Occupancy of Second Homes per Month When Occupied by Renters, Based on the Past Five Years, n=332
Upper Cape
n=54 Mid Cape n=72
Lower Cape n=62
Outer Cape n=144
Cape Regions Combined
January 2 1 0 0 1
February 2 1 0 0 1
March 2 1 0 0 1
April 2 1 0 0 1
May 2 1 1 1 1
June 3 2 2 3 3
July 4 5 5 5 5
August 5 5 5 5 5
September 3 2 2 2 2
October 2 1 1 1 1
November 2 1 0 0 1
December 2 1 0 0 1

Cape Cod Second Homeowners 2017 Plans to Use Second Home in the Future
UMass Donahue Institute Applied Research & Program Evaluation
25
Findings – Plans to Use Second Home in the Future
This section provides information on planned additions and anticipated use of second homes in the near and extended future. Additional findings are presented for respondents who are planning to sell, hand-down, or gift their properties, as well as those who plan to convert their second homes to their primary residences. First, second homeowners were asked whether they plan to make any additions—adding bedrooms, building an auxiliary dwelling, or planning to subdivide their property—to their existing property in the next five years (Table 33). Very few reported planning such additions. Three percent of second homeowners plan to add new bedrooms to their existing home. On average, two bedrooms will be added. In addition, eight respondents (less than 1%) plan to build an auxiliary dwelling, such as a guest cottage or an in-law apartment, in the next five years. One respondent plans to subdivide their property and sell the lot that does not contain their second home.
Table 33: Plans to Make Additions to Second Home in the Next Five Years
# Who
Responded # Who Plan to Make Changes
Percentage
Add New Bedrooms 1,256 41 3.3
Build Auxiliary Dwelling 1,255 8 0.6
Subdivide Property for Additional Building Lots 1,233 1 0.1
Comparing responses to these questions from the 2008 and 2017 surveys, we find the following statistically significant differences. The 2008 sample had a larger proportion of respondents planning to add new bedrooms and auxiliary dwellings in the next five years. Five percent of 2008 respondents planned to add new bedrooms to their second homes compared with 3% of 2017 respondents. Two percent of 2008 respondents planned to add an auxiliary dwelling on their lot compared with less than one percent of 2017 respondents. Second homeowners also described to what extent they expect the personal and rental use of their second home to change in the next five years (Table 34). While the largest group of respondents (45%) expect their personal usage of their second home to remain the same, a substantial proportion (39%) anticipate increased personal use of their second homes in the next five years. Very few (2%) anticipate a decrease in personal usage. In terms of rental usage, respondents expect minimal change in the near future. Nearly 80% of respondents reported that rental usage is either ‘not applicable’ (i.e., they do not rent or plan to rent out their property) or will ‘remain the same.’ Four percent predict an increase in rental usage, and 9% predict a decrease during this time period. There are no statistically significant differences in expected personal or rental usage by region.

Cape Cod Second Homeowners 2017 Plans to Use Second Home in the Future
UMass Donahue Institute Applied Research & Program Evaluation
26
Table 34: Expected Amount of Use of Cape Cod Second Home in Five Years, n=1,292
Upper Cape
n=300 (%)
Mid Cape n=364 (%)
Lower Capen=276 (%)
Outer Cape n=352 (%)
Cape Regions Combined
(%)
Personal Use
Increase 38 41 39 39 39
Decrease 3 2 2 1 2
Remain About the Same 43 43 48 47 45
Don't Know 13 11 8 9 10
N/A 3 2 2 4 3
Rental Use
Increase 3 2 5 5 4
Decrease 4 7 7 16 9
Remain About the Same 14 17 16 26 19
Don't Know 12 8 9 8 9
N/A 68 66 63 45 60
Note: Some percentages do not sum to 100 due to rounding.
Second homeowners were asked to describe their anticipated use of their home in five years. Nearly 60% believe that they will continue to use their property solely for personal/family use (Table 35). Nearly 20% anticipate renting out their second home either partially or fully (i.e., seasonal rental, year-round rental, or both rental and personal use). More than 10 percent plan to convert their second home into their primary residence in the next five years. Finally, 8% plan to gift or sell their second home.
Table 35: Anticipated Use of Cape Cod Second Homes in Five Years, n=1,265
Upper Cape
n=292 (%)
Mid Cape n=358 (%)
Lower Cape n=270 (%)
Outer Cape n=345 (%)
Cape Regions Combined
(%)
Use it Only as a Second Home for Personal/Family Use
62 60 58 53 58
Use it Only as a Seasonal Rental 1 1 2 3 2
Use it Both as a Seasonal Rental and Second Home for Personal/Family Use
9 9 14 24 14
Use it Only as a Year‐Round Rental 4 2 1 2 2
Convert it to My Primary Residence 11 12 12 9 11
Hand it Down to a Family Member 4 4 3 1 3
Gift it to a Friend 0 0 0 0 0
Sell it 7 4 4 4 5
Don't Know 4 8 7 6 6
Note: Some percentages do not sum to 100 due to rounding.
Cape Cod Second Homeowners 2017 Plans to Use Second Home in the Future
UMass Donahue Institute Applied Research & Program Evaluation
27
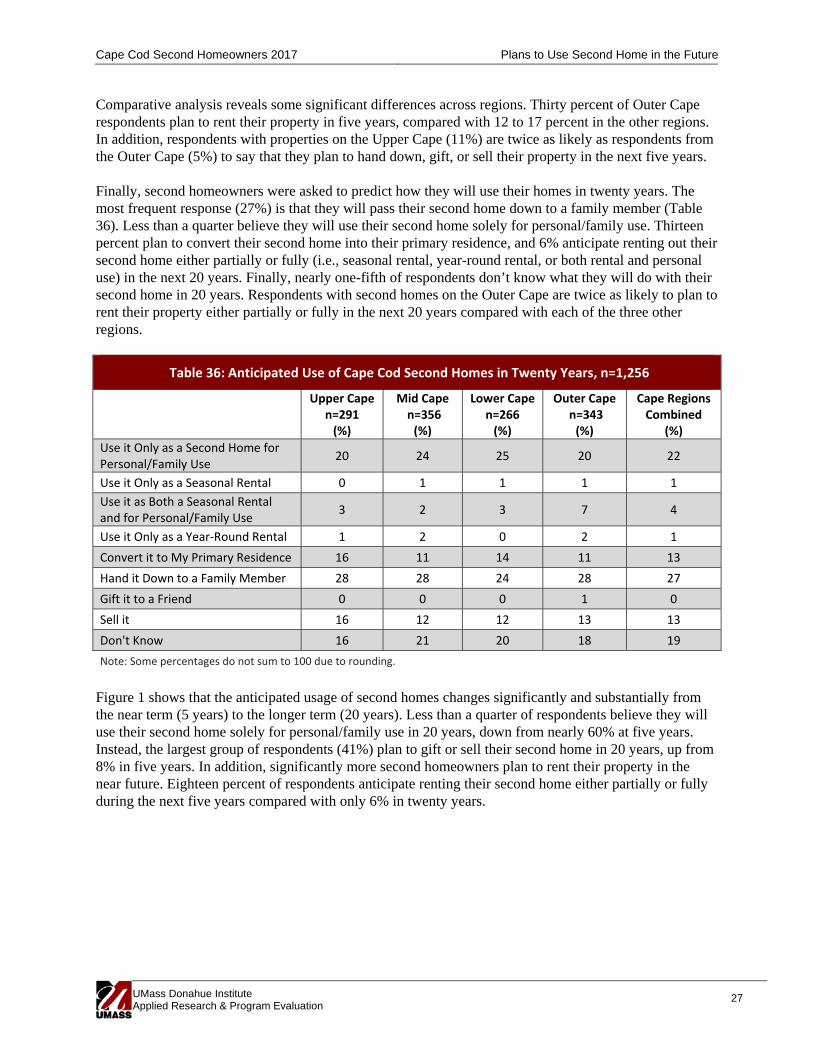
Comparative analysis reveals some significant differences across regions. Thirty percent of Outer Cape respondents plan to rent their property in five years, compared with 12 to 17 percent in the other regions. In addition, respondents with properties on the Upper Cape (11%) are twice as likely as respondents from the Outer Cape (5%) to say that they plan to hand down, gift, or sell their property in the next five years. Finally, second homeowners were asked to predict how they will use their homes in twenty years. The most frequent response (27%) is that they will pass their second home down to a family member (Table 36). Less than a quarter believe they will use their second home solely for personal/family use. Thirteen percent plan to convert their second home into their primary residence, and 6% anticipate renting out their second home either partially or fully (i.e., seasonal rental, year-round rental, or both rental and personal use) in the next 20 years. Finally, nearly one-fifth of respondents don’t know what they will do with their second home in 20 years. Respondents with second homes on the Outer Cape are twice as likely to plan to rent their property either partially or fully in the next 20 years compared with each of the three other regions.
Table 36: Anticipated Use of Cape Cod Second Homes in Twenty Years, n=1,256
Upper Cape
n=291 (%)
Mid Cape n=356 (%)
Lower Capen=266 (%)
Outer Cape n=343 (%)
Cape Regions Combined
(%)
Use it Only as a Second Home for Personal/Family Use
20 24 25 20 22
Use it Only as a Seasonal Rental 0 1 1 1 1
Use it as Both a Seasonal Rental and for Personal/Family Use
3 2 3 7 4
Use it Only as a Year‐Round Rental 1 2 0 2 1
Convert it to My Primary Residence 16 11 14 11 13
Hand it Down to a Family Member 28 28 24 28 27
Gift it to a Friend 0 0 0 1 0
Sell it 16 12 12 13 13
Don't Know 16 21 20 18 19
Note: Some percentages do not sum to 100 due to rounding.
Figure 1 shows that the anticipated usage of second homes changes significantly and substantially from the near term (5 years) to the longer term (20 years). Less than a quarter of respondents believe they will use their second home solely for personal/family use in 20 years, down from nearly 60% at five years. Instead, the largest group of respondents (41%) plan to gift or sell their second home in 20 years, up from 8% in five years. In addition, significantly more second homeowners plan to rent their property in the near future. Eighteen percent of respondents anticipate renting their second home either partially or fully during the next five years compared with only 6% in twenty years.

Cape Cod Second Homeowners 2017 Plans to Use Second Home in the Future
UMass Donahue Institute Applied Research & Program Evaluation
28
The responses for anticipated use of second homes in five years were significantly different between the 2008 and 2017 surveys. As highlighted in Figure 2, respondents from the 2008 survey were significantly more likely to plan to use their second home as a rental either solely or in combination with personal use (26% in 2008, 18% in 2017) and to convert their second home to their primary residence (11% in 2008, 8% in 2017). Respondents from the 2017 survey are significantly more likely to plan to sell, hand down, or gift their property (4% in 2008, 8% in 2017).
58%
18%
11% 8% 6%
22%
6%
13%
41%
19%
0%
20%
40%
60%
80%
Personal UsageOnly
Rental Usage -Partial or Only
Convert to PrimaryResidence
Hand Down, Gift,or Sell
Don't Know
Per
cent
age
of H
igh
Sch
ools
Figure 1: Intentions For Usage of Cape Cod Second Homes in the Short and Long Term
In 5 Years In 20 Years
59%
26%
8%4% 3%
58%
18%
11% 8% 6%
0%
20%
40%
60%
80%
Personal UsageOnly
Rental Usage -Partial or Only
Convert to PrimaryResidence
Hand Down, Gift,or Sell
Don't Know
Per
cent
age
of H
igh
Sch
ools
Figure 2: Intentions For Usage of Cape Cod Second Homes in the Next Five Years, Comparing 2008 and 2017 Findings
2008 2017

Cape Cod Second Homeowners 2017 Plans to Use Second Home in the Future
UMass Donahue Institute Applied Research & Program Evaluation
29
Similarly, Figure 3 shows that the responses for anticipated use of second homes in 15 to 20 years6 are significantly different across survey years. Respondents from the 2008 survey were significantly more likely to plan to use their second home solely for personal/family use (33% in 2008, 22% in 2017), to convert it to their primary residence (19% in 2008, 13% in 2017), and to plan to use it as a rental either solely or in combination with personal use (9% in 2008, 6% in 2017). Respondents from the 2017 survey are significantly more likely to plan to sell, hand down, or gift their property (23% in 2008, 41% in 2017).
:
Planning to Sell or Hand Down Property
Second homeowners anticipating to sell, gift, or hand down their property within the next twenty years (42% of respondents) provided reasons for this anticipated change. Nearly half believe they will no longer be able to use the property. Other reasons were selected by a much smaller number of respondents (Table 37 on the following page).
6 The 2008 survey asked for anticipated plans for second homes in 15 years and the 2017 survey asked for anticipated plans for second homes in 20 years.
33%
9%
19% 23%
16%
22%
6%
13%
41%
19%
0%
20%
40%
60%
80%
Personal UsageOnly
Rental Usage -Partial or Only
Convert to PrimaryResidence
Hand Down, Gift,or Sell
Don't Know
Per
cent
age
of H
igh
Sch
ools
Figure 3: Intentions For Usage of Cape Cod Second Homes in the Next 15–20 Years, Comparing 2008 and 2017 Findings
2008 2017

Cape Cod Second Homeowners 2017 Plans to Use Second Home in the Future
UMass Donahue Institute Applied Research & Program Evaluation
30
Table 37: Reasons Planning to Sell or Gift a Cape Cod Second Home within the Next Twenty Years, n=537
Upper Cape
n=133 (%)
Mid Cape n=154 (%)
Lower Cape n=103 (%)
Outer Cape n=147 (%)
Cape Regions Combined
(%)
Property is Too Large 2 1 0 1 1
Property is Not Large Enough 3 5 2 1 3
Property is Too Expensive to Maintain 10 5 6 8 7
Taxes on the Property are Too Expensive 10 5 8 6 7
Need the Sale Proceeds for Other Purposes 11 7 11 5 8
Want the Sale Proceeds for Other Purposes 11 10 10 11 11
No Longer Interested in Using the Property 8 10 9 10 9
No Longer Able to Use the Property 38 52 45 49 46
No Longer Wish to Have Property on Cape 5 5 10 6 6
Property at Risk Due to Coastal Erosion, Sea‐Level Rise, or Flooding
1 1 0 2 1
Note: Only those who answered that they were planning to sell, gift, or hand down their property in either 5 years or 20 years were included in this table. Percentages may not add to 100% because respondents could select multiple options.
Planning to Convert Property
Second homeowners who anticipate converting their property to their primary residence within the next 20 years (19% of respondents) provided further information on expected occupancy and months of residency. Those who anticipate moving to the Cape after converting their property typically expect two people to reside at their Cape residence for an average of 10 months per year (Table 38).
Table 38: Plans to Convert Cape Cod Second Home into Primary Residence in the Future
Upper Cape
n=64 Mid Cape n=61
Lower Cape n=52
Outer Cape n=54
Cape Regions Combined
Number of People Expected to Typically Reside at the Converted Property (n=231)
Average 2 2 2 2 2
Median 2 2 2 2 2
Range 1–7 1–4 1–4 1–4 1–7
Upper Cape
n=63 Mid Cape n=61
Lower Cape n=51
Outer Cape n=54
Cape Regions Combined
Number of Months Converted Property Expected to be Occupied (n=229)
Average 10 10 10 10 10
Median 12 11 11 10 10
Range 5–12 1–12 5–12 1–12 1–12
Note: Only those who reported planning to convert their property to their primary residence in either 5 years or 20 years are included in this calculation.
In addition, nearly 40% of second homeowners who plan to convert their second home into their primary residence intend to work, primarily part-time, after moving to the Cape (Table 39).

Cape Cod Second Homeowners 2017 Plans to Use Second Home in the Future
UMass Donahue Institute Applied Research & Program Evaluation
31
Table 39: Future Employment Plans if Planning to Move Permanently to the Cape, n=231
Upper Cape
n=64 (%)
Mid Cape n=60 (%)
Lower Capen=51 (%)
Outer Cape n=56 (%)
Cape Regions Combined
(%)
Work Full Time 2 2 6 9 4
Work Part Time 38 28 29 41 34
Do Not Expect to Work 61 70 65 50 61
Note: Only those who reported planning to convert their property to their primary residence in either 5 years or 20 years are included in this calculation. Some percentages do not sum to 100 due to rounding.
Of those who plan to work after moving to the Cape, 31% of respondents intend to work for an off-Cape employer, 11% intend to work for an on-Cape employer, and 16% plan to start or relocate a business (Table 40).
Table 40: Expected Type of Work Once Move Permanently to the Cape, n=113
Upper Cape
n=29 (%)
Mid Cape n=25 (%)
Lower Capen=24 (%)
Outer Cape n=35 (%)
Cape Regions Combined
(%)
Work for an Employer Based On‐Cape 14 4 4 17 11
Work for an Employer Based Off‐Cape 45 40 25 17 31
Start or Relocate Your Own Business 14 12 17 20 16
Freelance 0 8 8 3 4
Don't Know 28 36 46 43 38
Note: Only those who reported planning to convert their property to their primary residence in either 5 years or 20 years and anticipate working full or part‐time are included in this calculation. Some percentages do not sum to 100 due to rounding.
In total, over the next 20 years 19% of respondents anticipate converting their second home into their primary residence (Table 41). The rate of conversion from second home to primary residence ranges from 16% on the Outer Cape to 22% on the Upper Cape.
Table 41: Percent of Respondents Planning to Convert Second Home to Primary Home, n=1,281
Upper Cape
n=298
Mid Cape
n=359
Lower Cape
n=274
Outer Cape
n=350
Cape Regions
Combined
Total number anticipating converting in either next 5 or 20 years 66 64 53 57 240
Total percent anticipating converting in either next 5 or 20 years
22% 18% 19% 16% 19%
This implies that about 11,000 homes on Cape Cod may be converted to primary homes over the next 20 years (Table 42).

Cape Cod Second Homeowners 2017 Plans to Use Second Home in the Future
UMass Donahue Institute Applied Research & Program Evaluation
32
Table 42: Estimated Number of Second Home Conversions to Primary Residences within Twenty Years
Upper Cape Mid Cape Lower Cape Outer Cape
Cape Regions
Combined
Respondents who anticipate converting in next 20 years (%)
22% 18% 19% 16% 19%
Total Number of Second Homes 15,886 16,334 13,367 12,896 58,483
Estimated Number of Conversions 3,495 2,940 2,540 2,063 11,038
It is important to note the impact of property conversions on the rental market. Twenty-five percent of respondents who plan to move permanently to the Cape reported having rented out their second home at least once over the last five years (Table 43). That level of conversions would mean a loss of 3,113 homes that are sometimes available for rental.
Table 43: Respondents Planning to Convert Second Home to Primary Residence that Have Ever Rented Out Their Home in the Past Five Years, n=237
Upper Cape
n=66
Mid Cape
n=64
Lower Cape
n=52
Outer Cape
n=55
Cape Regions
Combined
Number that ever rented out their property during the past 5 years 9 15 12 25 61
Percentage that ever rented out their property during past 5 years
14% 23% 23% 46% 25%

Cape Cod Second Homeowners 2017 Participation in Community and Economy
UMass Donahue Institute Applied Research & Program Evaluation
33
Findings – Participation in Cape Cod Community and Economy
This section of the report includes information on respondents’ current participation in the Cape Cod community and local economy. Second homeowners were asked about their support of local nonprofits, attendance at cultural events, and purchase of goods and services. Community
About three-quarters of respondents reported that they currently support both arts and cultural organizations and other nonprofit or charitable organizations based on Cape Cod, primarily through purchasing tickets or goods and making charitable donations (Tables 44 and 45). Differences across the regions are statistically significant, with second homeowners on the Lower Cape and Outer Cape reporting higher rates of support of local nonprofits, including arts and cultural organizations, than those on the Mid Cape and Upper Cape.
Table 44: Support of Any Arts and Cultural Organizations Based on Cape Cod, n=1,249
Upper Cape
n=288 (%)
Mid Cape n=349 (%)
Lower Cape n=268 (%)
Outer Cape n=344 (%)
Cape RegionsCombined
(%)
Yes 68 72 76 79 74
No 32 28 24 21 26
Types of Support Reported
Making Charitable Donations 35 34 47 52 42
Paying Annual Membership Dues 22 21 26 35 26
Purchasing Tickets or Goods 55 56 58 66 59
Volunteering Time 9 7 11 13 10
Note: Percentages may equal more than 100% because respondents were able to choose multiple responses.
Table 45: Support of Any Other Charitable Organizations or Non‐Profits Based on Cape Cod, n=1,228
Upper Cape
n=282 (%)
Mid Cape n=342 (%)
Lower Capen=264 (%)
Outer Cape n=340 (%)
Cape Regions Combined
(%)
Yes 67 65 82 80 73
No 33 35 18 20 27
Types of Support Reported
Making Charitable Donations 45 44 63 61 53
Paying Annual Membership Dues 16 13 26 28 21
Purchasing Tickets or Goods 36 37 42 39 39
Volunteering Time 11 6 13 11 10
Note: Percentages may equal more than 100% because respondents were able to choose multiple responses

Cape Cod Second Homeowners 2017 Participation in Community and Economy
UMass Donahue Institute Applied Research & Program Evaluation
34
Respondents provided additional information about how often they participate in various cultural activities while staying on the Cape. About 70% of second homeowners visit history and/or art museums, attend live theatre, and attend concerts, each one to five times per year. Differences are statistically significant across regions, with second homeowners on the Outer Cape reporting the most attendance and those on the Upper Cape reporting the least attendance.
Table 46: Number of Times per Year Cape Cod Second Homeowners Attend Cultural Activities
Upper Cape(%)
n 1–5 visits 6–10 visits 11–15 visits 16+ visits Never
Historical Societies and Museums 259 68 5 2 0 26
Art Museums and Galleries 253 65 5 1 0 29
Live Theatre 249 60 4 0 0 36
Music Concerts 262 71 4 0 0 25
Mid Cape(%)
n 1–5 visits 6–10 visits 11–15 visits 16+ visits Never
Historical Societies and Museums 312 74 3 1 1 21
Art Museums and Galleries 303 60 9 1 2 28
Live Theatre 316 63 6 1 0 29
Music Concerts 314 69 8 1 2 20
Lower Cape(%)
n 1–5 visits 6–10 visits 11–15 visits 16+ visits Never
Historical Societies and Museums 249 76 6 1 0 17
Art Museums and Galleries 236 66 8 2 1 22
Live Theatre 250 63 6 2 0 29
Music Concerts 255 70 7 2 0 20
Outer Cape(%)
n 1–5 visits 6–10 visits 11–15 visits 16+ visits Never
Historical Societies and Museums 314 80 7 1 0 12
Art Museums and Galleries 325 56 17 9 7 11
Live Theatre 317 65 9 3 2 21
Music Concerts 321 66 14 2 1 16
Cape Regions Combined (%)
n 1–5 visits 6–10 visits 11–15 visits 16+ visits Never
Historical Societies and Museums 1134 75 5 1 0 19
Art Museums and Galleries 1117 61 10 4 3 22
Live Theatre 1132 63 6 1 1 29
Music Concerts 1152 69 9 1 1 20
Note: Some percentages do not sum to 100 due to rounding.

Cape Cod Second Homeowners 2017 Participation in Community and Economy
UMass Donahue Institute Applied Research & Program Evaluation
35
About one-fifth of second homeowners indicated that they are members of a social and/or recreational club on Cape Cod (Table 47). Differences across regions are significant, with second homeowners on the Upper Cape reporting the highest likelihood of membership and those on the Outer Cape the lowest.
Table 47: Percentage of Second Homeowners that Are Members of Social and/or Recreation Clubs on Cape Cod, n=1,227
Upper Cape
n=278 (%)
Mid Cape n=345 (%)
Lower Capen=268 (%)
Outer Cape n=336 (%)
Cape Regions Combined
(%)
Yes 29 21 21 16 21
No 71 79 80 85 79
Note: Some percentages do not sum to 100 due to rounding.
Local Economy
Respondents were asked about where they purchase goods for their second home. Nearly all second homeowners reported buying their groceries, hardware/building supplies, and garden supplies on the Cape (Table 48). In addition, more than three-quarters reported purchasing appliances for their second home locally. Fewer (about 50–60% of respondents) reported purchasing household furnishings, clothing, sports/recreation equipment, and office supplies on-Cape.
Table 48: Where Cape Cod Second Homeowners Shop for Items
Upper Cape (%)
n
Home Town or Neighboring Towns
On‐Cape
Elsewhere On‐Cape
Off‐Cape Online N/A
Groceries 285 93 2 3 0 3
Clothing 275 54 8 23 5 11
Sports/Recreation Equipment 271 47 7 21 5 21
Household Furnishing 277 45 14 28 4 9
Appliances 279 51 17 21 2 9
Office Supplies 274 45 6 11 3 35
Hardware/Building Supplies 278 83 9 3 0 5
Garden Supplies 282 82 8 3 1 7
Mid Cape (%)
n
Home Town or Neighboring Towns
On‐Cape
Elsewhere On‐Cape
Off‐Cape Online N/A
Groceries 347 95 1 3 0 1
Clothing 330 56 9 22 5 8
Sports/Recreation Equipment 313 54 7 13 4 21
Household Furnishing 341 60 15 17 2 7
Appliances 343 69 14 9 3 6

Cape Cod Second Homeowners 2017 Participation in Community and Economy
UMass Donahue Institute Applied Research & Program Evaluation
36
Office Supplies 323 38 7 10 3 43
Hardware/Building Supplies 343 86 7 3 0 3
Garden Supplies 347 92 3 2 0 4
Lower Cape (%)
n
Home Town or Neighboring Towns
On‐Cape
Elsewhere On‐Cape
Off‐Cape Online N/A
Groceries 266 98 1 1 0 0
Clothing 263 49 11 24 6 11
Sports/Recreation Equipment 259 43 13 21 7 16
Household Furnishing 252 39 29 22 2 8
Appliances 264 48 31 13 2 6
Office Supplies 260 40 10 12 4 35
Hardware/Building Supplies 264 85 12 1 0 2
Garden Supplies 263 90 6 1 0 2
Outer Cape (%)
n
Home Town or Neighboring Towns
On‐Cape
Elsewhere On‐Cape
Off‐Cape Online N/A
Groceries 344 92 4 4 0 1
Clothing 336 47 8 27 9 9
Sports/Recreation Equipment 337 44 9 19 7 21
Household Furnishing 331 33 21 31 6 9
Appliances 341 55 27 10 4 5
Office Supplies 332 35 8 14 6 37
Hardware/Building Supplies 343 91 4 3 0 2
Garden Supplies 340 87 7 3 0 4
Cape Regions Combined (%)
n
Home Town or Neighboring Towns
On‐Cape
Elsewhere On‐Cape
Off‐Cape Online N/A
Groceries 1242 94 2 3 0 1
Clothing 1204 51 9 24 6 10
Sports/Recreation Equipment 1180 47 9 18 6 20
Household Furnishing 1201 45 19 25 3 8
Appliances 1227 57 22 13 3 6
Office Supplies 1189 39 8 12 4 38
Hardware/Building Supplies 1228 87 8 3 0 3
Garden Supplies 1232 88 6 2 0 4
Note: Some percentages do not sum to 100 due to rounding.

Cape Cod Second Homeowners 2017 Participation in Community and Economy
UMass Donahue Institute Applied Research & Program Evaluation
37
Next, respondents were asked about their use of private services while staying in their second home (Table 49). About two-thirds of respondents do not use security services, private trash collection, or snow plowing while staying in their second home. The most commonly utilized on-Cape vendors include: construction services (76%), trade/repair services (76%), and landscape/yard services (68%). About one-half use on-Cape services for hospital emergency rooms, banking, and insurance. Few second homeowners use on-Cape vendors for investment, accounting services, primary care physicians, or medical specialists.
Table 49: Use of Private Services by Cape Cod Second Homeowners
Upper Cape (%)
n
Do Not Use Use
On‐Cape Vendor
Use Off‐Cape Vendor
Unsure if Use On‐ or Off‐Cape
Vendor
Private Trash Collection 273 71 25 1 3
Snow Plowing 272 56 42 0 2
Landscape/Yard Service 281 28 69 1 2
Security Service 265 62 28 8 3
Construction Services 272 18 77 4 1
Banking 274 21 41 38 1
Investment Services 266 43 3 53 2
Accounting Services 268 48 3 48 1
Insurance Services 270 17 34 47 2
Legal Services 271 38 21 40 2
Primary Care Physician 270 29 10 60 1
Medical Specialist 272 32 13 55 1
Hospital Emergency Room/ Acute Care Center
277 21 50 26 4
Trade/Repair Services 278 17 67 14 3
Mid Cape (%)
n
Do Not Use Use
On‐Cape Vendor
Use Off‐Cape Vendor
Unsure if Use On‐ or Off‐Cape
Vendor
Private Trash Collection 346 62 36 1 1
Snow Plowing 335 69 30 0 1
Landscape/Yard Service 348 31 67 1 1
Security Service 319 69 23 5 3
Construction Services 339 25 71 3 1
Banking 343 24 45 28 2
Investment Services 326 48 5 46 1
Accounting Services 327 54 4 41 1

Cape Cod Second Homeowners 2017 Participation in Community and Economy
UMass Donahue Institute Applied Research & Program Evaluation
38
Insurance Services 340 17 40 42 1
Legal Services 330 42 19 38 1
Primary Care Physician 337 34 7 59 1
Medical Specialist 332 35 11 54 1
Hospital Emergency Room/ Acute Care Center
335 23 57 18 2
Trade/Repair Services 339 17 74 8 1
Lower Cape (%)
n
Do Not Use Use
On‐Cape Vendor
Use Off‐Cape Vendor
Unsure if Use On‐ or Off‐Cape
Vendor
Private Trash Collection 268 66 34 0 0
Snow Plowing 266 67 34 0 0
Landscape/Yard Service 264 24 76 0 0
Security Service 260 62 32 5 1
Construction Services 263 21 76 2 1
Banking 262 22 40 37 1
Investment Services 263 41 3 54 2
Accounting Services 264 50 3 47 1
Insurance Services 262 15 39 46 1
Legal Services 263 31 27 41 0
Primary Care Physician 263 34 9 57 0
Medical Specialist 263 34 12 53 1
Hospital Emergency Room/ Acute Care Center
261 25 54 18 3
Trade/Repair Services 264 11 82 6 1
Outer Cape (%)
n
Do Not Use Use
On‐Cape Vendor
Use Off‐Cape Vendor
Unsure if Use On‐ or Off‐Cape
Vendor
Private Trash Collection 336 58 42 0 1
Snow Plowing 337 60 39 0 1
Landscape/Yard Service 345 38 62 0 0
Security Service 327 71 25 3 1
Construction Services 339 18 80 2 0
Banking 337 24 43 31 2
Investment Services 331 46 3 49 2
Accounting Services 331 51 6 41 1
Insurance Services 338 17 54 29 0
Legal Services 330 36 33 30 2
Primary Care Physician 333 32 11 55 2

Cape Cod Second Homeowners 2017 Participation in Community and Economy
UMass Donahue Institute Applied Research & Program Evaluation
39
Medical Specialist 327 34 11 54 1
Hospital Emergency Room/Acute Care Center
332 23 52 22 3
Trade/Repair Services 341 16 80 2 2
Cape Regions Combined (%)
n
Do Not Use Use
On‐Cape Vendor
Use Off‐Cape Vendor
Unsure if Use On‐ or Off‐Cape
Vendor
Private Trash Collection 1,223 64 35 0 1
Snow Plowing 1,210 63 36 0 1
Landscape/Yard Service 1,238 31 68 1 1
Security Service 1,171 66 27 5 2
Construction Services 1,213 21 76 3 1
Banking 1,216 23 43 33 2
Investment Services 1,186 45 4 50 1
Accounting Services 1,190 51 4 44 1
Insurance Services 1,210 17 42 41 1
Legal Services 1,194 37 25 37 1
Primary Care Physician 1,203 32 9 57 1
Medical Specialist 1,194 34 12 54 1
Hospital Emergency Room/ Acute Care Center
1,205 23 53 21 3
Trade/Repair Services 1,222 15 76 7 2
Note: Some percentages do not sum to 100 due to rounding.
Comparing the 2008 and 2017 surveys reveals the following significant differences. Respondents in 2008 were more likely to use the following on-Cape services than respondents in 2017: private trash collection (46% to 35%) and legal services (32% to 25%). Conversely, respondents in 2017 are more likely to use the following on-Cape services than respondents in 2008: construction services (76% to 70%), landscape/yard services (68% to 63%), and snow plowing (36% to 24%). When asked the primary reason for choosing an off-Cape vendor, three-fifths of respondents indicated that services are not needed while using their second home (Table 50). The next most frequently cited reason (35%) was already having a service provider based off-Cape. Fewer respondents pointed to cost (13%) or quality (4%) as their reason for choosing off-Cape vendors.

Cape Cod Second Homeowners 2017 Participation in Community and Economy
UMass Donahue Institute Applied Research & Program Evaluation
40
Table 50: Reasons Second Homeowners Choose Off‐Cape Vendors, n=1,219
Upper Cape
n=280 (%)
Mid Cape n=342 (%)
Lower Capen=266 (%)
Outer Cape n=331 (%)
Cape RegionsCombined
(%)
Service is Not Available on Cape Cod 13 12 15 23 16
Already Have Service Provider Based Off‐Cape
31 32 36 41 35
Service Is Not Needed While Using Second Home
66 58 62 55 60
Price of the Vendor is Higher on Cape Cod
13 13 12 15 13
Quality of the Service Is Lower on Cape Cod
6 4 2 6 4
N/A 9 13 10 14 12
Note: Percentages may equal more than 100% because respondents were able to choose multiple responses.

Cape Cod Second Homeowners 2017 Appendix A – Survey
UMass Donahue Institute Applied Research & Program Evaluation
41
Appendix A – Survey

Cape Cod Second Homeowners 2017 Appendix A – Survey
UMass Donahue Institute Applied Research & Program Evaluation
42

Cape Cod Second Homeowners 2017 Appendix A – Survey
UMass Donahue Institute Applied Research & Program Evaluation
43

Cape Cod Second Homeowners 2017 Appendix A – Survey
UMass Donahue Institute Applied Research & Program Evaluation
44

Cape Cod Second Homeowners 2017 Appendix A – Survey
UMass Donahue Institute Applied Research & Program Evaluation
45

Cape Cod Second Homeowners 2017 Appendix A – Survey
UMass Donahue Institute Applied Research & Program Evaluation
46
Cape Cod Second Homeowners 2017 Appendix A – Survey
UMass Donahue Institute Applied Research & Program Evaluation
47

Cape Cod Second Homeowners 2017 Appendix A – Survey
UMass Donahue Institute Applied Research & Program Evaluation
48

Cape Cod Second Homeowners 2017 Appendix A – Survey
UMass Donahue Institute Applied Research & Program Evaluation
49


