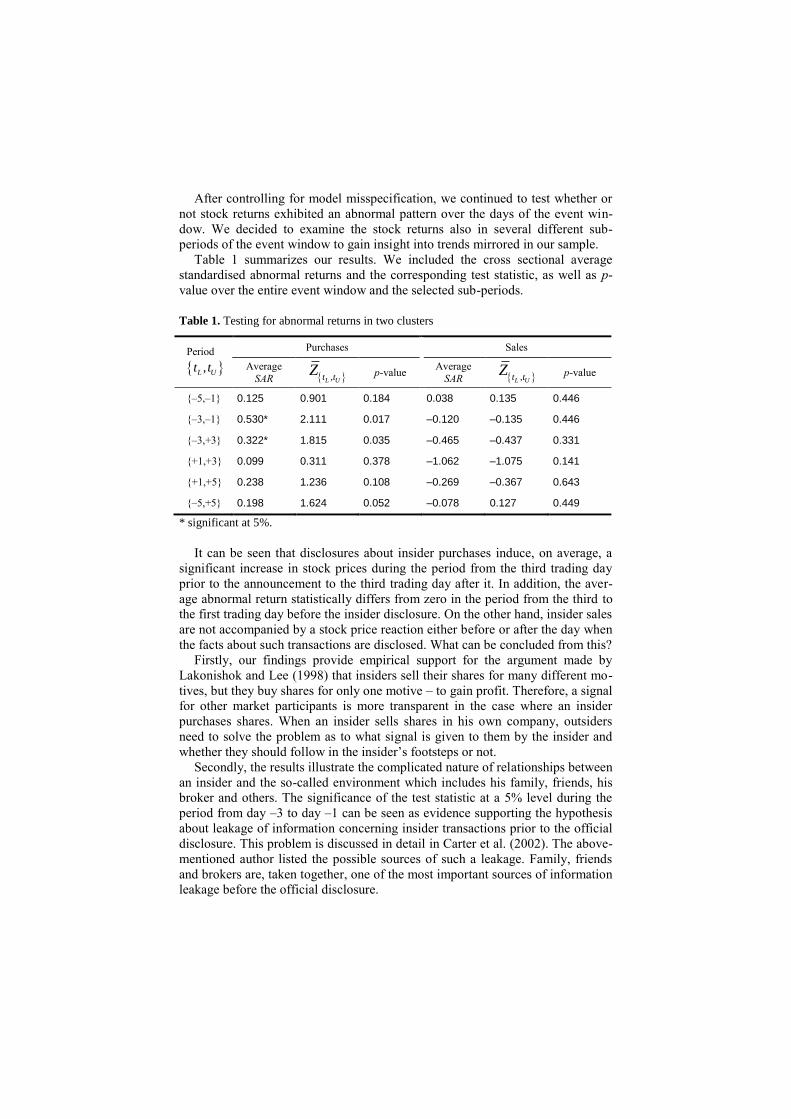
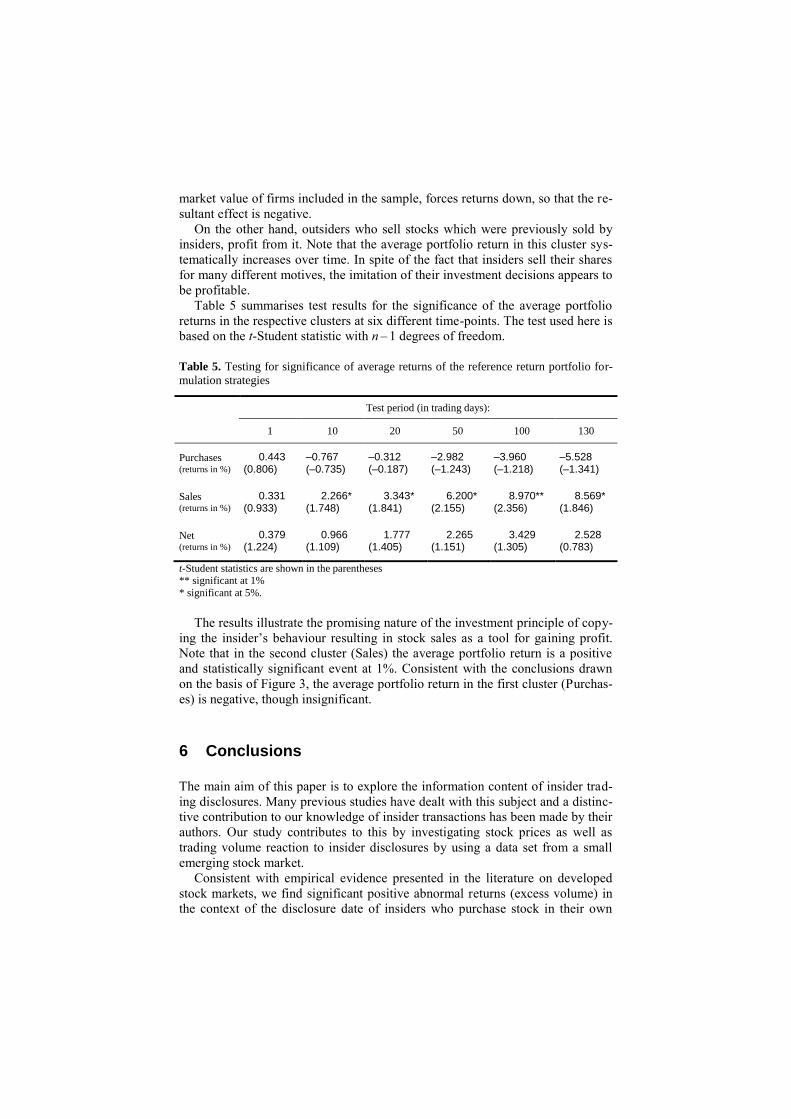
The informational content of insider trading disclosures: Empirical results for the Polish stock market Henryk Gurgul * , Paweł Majdosz *** Department of Applied Mathematics, University of Science and Technology, ul. Al. Mickiewicza 30, 30-059 Krakow, Poland (e-mail: [email protected]) ** Department of Quantitative Methods, School of Economics and Computer Science, ul. Św. Filipa 17, 31-150 Kraków, Poland (e-mail: [email protected]) Abstract In this paper we try to answer the question as to whether insider trading disclosures convey valuable information to market participants, valuable in the sense of the profitability of an investment strategy that faithfully mirrors insider behaviour. Our interest in this subject is limited to the case of announce- ments concerning insider transactions issued over a six-year period on the War- saw Stock Exchange (WSE). Initially, we use event study methodology to check whether insider trading disclosures are accompanied by a performance of stock returns as well as trading volume. Two different models generating expected re- turns (expected volume) are employed to verify the robustness of our results. The first of these is the regime switching model, with the results then being recalcu- lated by using a GARCH-type models which seem to be most useful for dealing with some of the inconvenient statistical properties of stock return and trading volume data. Afterwards, a technique based on the reference return strategies is used to examine whether or not outsiders who imitate insider behaviour are able to profit from it. The major findings are as follows: Firstly, announcements about the sale of stocks by insiders convey no information to market participants. Sec- ondly, a statistically significant market response to insider disclosures of pur- chases of stocks in their own company can be observed in the three days prior to the announcement release for both return as well as trading volume series, and finally, outsiders who purchased stocks previously bought by insiders experience negative returns whereas outsiders disposing of stocks previously sold by insid- ers earned a return of 8.57% over the six-month period. JEL Classification: G14 Keywords: Insider trading, Event study, Switching Regressions, GARCH model We thank two anonymous referees for many valuable comments and suggestions. All remaining er- rors are our own responsibility.
Transcript
The informational content of insider trading
disclosures: Empirical results for the Polish
stock market
Henryk Gurgul *, Paweł Majdosz**
* Department of Applied Mathematics, University of Science and Technology,
ul. Al. Mickiewicza 30, 30-059 Krakow, Poland (e-mail: [email protected]) ** Department of Quantitative Methods, School of Economics and Computer Science,
ul. Św. Filipa 17, 31-150 Kraków, Poland (e-mail: [email protected])
Abstract In this paper we try to answer the question as to whether insider
trading disclosures convey valuable information to market participants, valuable
in the sense of the profitability of an investment strategy that faithfully mirrors
insider behaviour. Our interest in this subject is limited to the case of announce-
ments concerning insider transactions issued over a six-year period on the War-
saw Stock Exchange (WSE). Initially, we use event study methodology to check
whether insider trading disclosures are accompanied by a performance of stock
returns as well as trading volume. Two different models generating expected re-
turns (expected volume) are employed to verify the robustness of our results. The
first of these is the regime switching model, with the results then being recalcu-
lated by using a GARCH-type models which seem to be most useful for dealing
with some of the inconvenient statistical properties of stock return and trading
volume data. Afterwards, a technique based on the reference return strategies is
used to examine whether or not outsiders who imitate insider behaviour are able
to profit from it. The major findings are as follows: Firstly, announcements about
the sale of stocks by insiders convey no information to market participants. Sec-
ondly, a statistically significant market response to insider disclosures of pur-
chases of stocks in their own company can be observed in the three days prior to
the announcement release for both return as well as trading volume series, and
finally, outsiders who purchased stocks previously bought by insiders experience
negative returns whereas outsiders disposing of stocks previously sold by insid-
ers earned a return of 8.57% over the six-month period.
JEL Classification: G14
Keywords: Insider trading, Event study, Switching Regressions, GARCH model
We thank two anonymous referees for many valuable comments and suggestions. All remaining er-
rors are our own responsibility.
1 Introduction
Over recent years, we have been witnessing an increased number of theoretical
discussions devoted to insider activities on the stock market. This topic has been
considered from many different points of view. Economists, lawyers and philos-
ophers carry on disputing insiders’ rights to deal in stocks of their own firms.
Some of them set an important trend in the debate by researching the possible
implications of insider trading for insiders themselves, outsiders and other stock
market observers such as analysts. Many statements on this subject have a moral-
ising tone. It is indisputable that nobody should be able to profit from infor-
mation which is not available to other market participants or, even worse, from
spreading rumours concerning own company which then turn out to be untrue. In
this spirit, an insider trading prohibition is often argued for. On the other hand,
there exist circumstances under which insider trading is accompanied by benefits
for all market participants. For instance, in the case of a market crash (like that of
the autumn of 1987), only insiders fully realize that current stock prices do not
correctly reflect the real value of shares. For this reason, insiders are likely to
buy shares when other investors are, in general, prone to close their long posi-
tions. Without insider trading, panic selling of shares would get out of control.
In standard conditions however, public confidence in the financial market
would be undermined by unscrupulous use of insider knowledge. This is why in
many countries there are stringent government regulations against illegal insider
trading activities. Poland is one of these. According the Act on Trading in Finan-
cial Instruments, any information should be regarded as private concerning a fi-
nancial instrument, its issuer, or trading in a financial instrument which is yet
unpublished if it is possible that this information will influence the prices of a fi-
nancial instrument after its release. A notion of private information is then used
to determine who is an insider. Any person has this status with access to private
information due to being a member of the board as well as supervisory directors,
an employer or a shareholder. The list of insiders also includes auditors, solici-
tors, a brokers and any other person possessing private information, regardless of
its source. Defining the notion of an insider so widely requires so-called primary
insiders to be determined to whom especial legal restrictions are applied in order
to protect the interests of other investors. A primary insider is anyone who has
the closest relationships with the issuer of financial instruments, e.g. members of
the board and supervisory directors, auditors, solicitors, and so forth.
It should be emphasised that trading on the basis of private information is il-
legal in Poland and incurs serious penalties. However, with a few notable excep-
tions, sales and purchases of shares by insiders, even those classified as primary
ones, are generally allowable. There is only a requirement to notify about trans-
actions made by insiders. Such notification should take place no later than five
days after the transaction date if its total value exceeds 5,000 euro. For other
transactions the notification deadline is 31st January of the following year. As
mentioned above, over some periods, so-called ‘closed periods’, primary insiders
are not allowed sell and buy shares in the own companies. These periods are
mainly associated with the dates of publication of annual, 6-monthly as well as
quarterly reports and their lengths are equal to two months, one month and two
weeks immediately before publication, respectively.
In this paper, we do not adopt a judgemental role in such a difficult issue as to
whether insider trading is ethical. We are very reluctant to formulate advice or
suggestions addressed to insiders or any government whose target is to improve
market transparency by changing corporate behaviour and/or the legal system.
Instead, our interest is focused on (i) stock market response to announcements
about buying or selling shares by insiders, (ii) the profitability of investment
strategies based on the imitation of insider behaviour by buying shares which
were previously bought by insiders, and selling shares which were previously
sold by insiders.
The above-mentioned purpose of this contribution is accomplished by means
of an event study framework. This methodology is commonly employed in fi-
nancial and accounting research to investigate abnormal market performance as a
result of an event. Of prime importance as regards the accuracy of obtained re-
sults is the choice of an appropriate model to generate expected levels of any var-
iable under consideration. Therefore, tracking market behaviour in the context of
insider trading disclosures requires different econometric models of expected re-
turns and expected volume to be used, guaranteeing the robustness of findings
and correctness of conclusions. Two models are employed under this study to es-
timate the expected (non-disturbed by event) levels of returns and volume. The
Markov switching regression model enables the variance of variable under con-
sideration to change when the event occurs. This feature may appear to be par-
ticularly useful if it is impossible to eliminate all other (confounding) events tak-
ing place in the period over which stock returns and trading volume are
observed. However, the variance still remains unchanging under each regime. To
model changes in stock return (trading volume) in parallel with changes in its
variance the GARCH model is used.
Our results are as follows: Firstly, announcements of sale of stocks by insiders
bring no information besides that already incorporated in stock prices. Secondly,
a statistically significant market response to insider disclosures of purchases of
stocks their own company can be observed in the three days prior to the an-
nouncement release for both return as well as trading volume series. In parallel
with the analysis of how the market reacts to insider trading disclosures, we also
examine whether or not an investment strategy relying on copying of insider be-
haviour is profit-making. It turned that outsiders who purchased stocks previous-
ly bought by insiders experience negative returns whereas outsiders disposing
stocks previously sold by insiders earned a return of 8.57% over the six-month
period.
The remainder of this article proceeds as follows. In Section 2, a rough survey
of existing contributions which deal with the subject is presented. Section 3 out-
lines our methodology which is then used to identify market responses to an-
nouncements concerning insider trading. A brief data description as well as some
statistics of insider trading on the WSE over the analysed period are reported in
Section 4. Section 5 contains our empirical results and the final section con-
cludes the paper.
2 A brief literature review and main hypotheses
Empirical studies of insider trading can generally be classified into two catego-
ries. Some studies focus on the event of insider trading itself, where the central
issue is insider trading profitability and stock market efficiency. Studies of the
second type usually investigate insider trading behaviour in conjunction with an-
other corporate event, especially buybacks and stock splits.
It is characteristic that the previous contributions do not agree about the prof-
itability of insider trading and the informative content of insider trading. Empiri-
cal evidence provided by Kerr (1980), Lin and Howe (1990) as well as Holder-
ness and Sheehan (1985) seem to support the efficient market hypothesis (EMH)
in its strong form. It is worth remembering here that EMH was formulated by
Fama in 1970 and then extended in the following years (see Fama, 1970, 1991).
The above mentioned strong-form of EMH states that stock prices incorporate all
existing information, i.e. not only public information but also that unpublished,
regardless of information sources. On the other hand, Jaffe (1974), Seyhun
(1986, 1988), Madura and Wiant (1995) showed that insider activity is accompa-
nied by abnormal market performance (a significant positive effect on stock
prices). Raad and Wu (1995) report that insiders increase their buying activities
and decrease their selling activities before stock repurchase offers. While stock-
holders of firms with insider net selling activity earn positive excess returns,
those of firms with insider net buying activities earn larger and more significant
abnormal returns.
More recently, Seyhun (1998) documents the informative value of insider
trading. Seyhun also concludes that transaction volume and the position of the
insider within the company are positively correlated to relative performance. The
results show, on the other hand, that the relative performance negatively depends
on firm market capitalisation. According to Seyhun, this can be attributed to
more efficient pricing for large firms since they are more extensively covered by
analysts.
Ma, Sun and Austin (2000) document a significant increase in insider selling
prior to stock split announcements. They also find indices for a significant corre-
lation between insider sales and stock price run-up prior to stock split an-
nouncements. Their results suggest that portfolio diversification may be the dom-


![Al Malkawi [2010] Dividend Policy a Review of Theories and Empirical Evidence](https://static.documents.pub/doc/80x56/55409d39550346bb798b4b23/al-malkawi-2010-dividend-policy-a-review-of-theories-and-empirical-evidence.jpg)


