14
Pioneering retail banking Operating environment Competition and market share 04 Capitec in context 10 Capitec Bank Holdings Limited

Pioneering retail bankingOperating environmentCompetition and market share
04Capitec incontext
10 Capitec Bank Holdings Limited

Integrated Report 2013 11
Pioneering retail banking Capitec was established to provide essential banking services to all South Africans. It conducts its operations through Capitec Bank, a retail bank that has changed the landscape of South African banking.
The impact made by Capitec since its establishment is reflected in its being named a Great Brand of Tomorrow by Credit Suisse in 2010, one of only 27 brands worldwide to receive this award and the only South African brand to do so. Credit Suisse rated its top brands on the criteria of innovation, aspiration and scale.
Capitec was also named as the top performing company of the top 100 companies on the JSE in 2012 by the Sunday Times. This accolade is based on the 5 year growth performance of the share price. Capitec has won this accolade twice, the first time being in 2010.
Capitec was incorporated in South Afr ica on 23 November 1999, registered as a bank controlling company on 29 June 2001, and was listed in the Banks sector of the JSE Limited (‘JSE’) on 18 February 2002. Its corporate structure is detailed in chapter 2 of this report.
Capitec Bank provides innovative transacting, saving and unsecured credit products to individuals within South Africa. The building blocks of the business are affordability, accessibility, personal service and simplicity. The bank seeks to differentiate itself from other banks by providing a unique experience through price, positioning, service and product.
It defines retail banking as the basic needs of the consumer associated with transacting (receiving and paying money), saving money in times of surpluses and borrowing money in times of shortages as illustrated in the diagram on the next page.

Planned
Unplanned
BranchATMCash recyclerPOSMobileInternet
BiometricsDebit cardCellphoneInternet
Stop orderTransferPurchase at local/international card machinePurchase on internet/telephonePrepaid airtime/electricityCash withdrawalsDebit order
BiometricsDebit cardCellphoneInternet
Cash depositCheque depositSalary transferElectronic fundstransfer
Money out
Call savingsdeposit
Flexiblesavings plan
Fixed deposit
SurplusShortage
Consumption
Capitalexpenditure
1-month loan and multiloans
Medium-term – two-to-36-month loans
Long-term – 37-to-84-month loans
BranchATMCash recyclerPOSMobileInternet
Money in
12 Capitec Bank Holdings Limited

Integrated Report 2013 13
The bank has focused all its creative effort over the past few years on delivering a unique bank system that makes banking as easy and convenient as possible for clients. All accounts, access channels and information services are designed around this simplified approach to give clients value-added money management solutions.
The focus is on implementing solutions that assist retail bank clients (consumers who regularly deposit an income stream for a minimum defined period) to manage their money better and make use of their available funds more easily and conveniently.
Pioneering products The bank’s unique Global One product suite is customisable and offers single-point access to transacting, saving and credit. Global One provides a transaction account to every client, including lending clients, and interest is earned from the first rand.
The savings platform is open-ended with no restrictions to the features in each account. Clients can choose the number of accounts required, the deposit amounts preferred, whether the accounts are fixed and the terms of each savings option.
The credit platform calculates maximum loan value and term based on affordability and client behaviour, leaving clients to select the exact loan amount, term and repayment amounts that suit them. The credit offer is continuously adjusted and during the reporting period the maximum credit amount increased to R230 000 (2012: R150 000), the maximum credit term increased to 84 months (2012: 60 months) and pricing was reduced. The inclusion of higher-value loans with longer terms has attracted higher income clients and is expected to continue to do so. The implementation of stricter credit scoring criteria ensures that we don’t over-extend clients.
Simplified, transparent pricing The Global One transaction account and all ancillary accounts attract a single monthly administration fee of R4.50. Prices are fixed per transaction, regardless of the value, except for cash deposit fees which are fixed per R100.
Capitec Bank’s continued commitment to low-cost banking is reflected in the annual changes to transacting fees. Transaction fees did not increase in March 2011, and in March 2012 the only change to the fee structure was to reduce the cost of internet and mobile payments from R2.75 to R1.50. Fees from March 2013 remain unchanged except for withdrawals from Capitec Bank ATMs, which increased to R4.30 (2012: R4.00) and the cash deposit fees per R100 which increased to 50 cents for deposits at ATMs (2012: 40 cents) and R1 for branch deposits (2012: 80 cents).
SMSs are delivered on every transaction if requested and month-end messaging provides balances, fees incurred and interest paid to the client.
Positioning to enhance accessibility Capitec Bank’s multichannel distribution network provides clients with various solutions to meet their needs.
The branch network has expanded by approximately 50 branches per year for the past three years and branches are positioned in areas that make it convenient for clients to conduct their banking in the normal course of their daily activities. The careful selection of sites, in major shopping centres where consumer traffic is guaranteed, has also ensured steady client acquisition.
Banking hours are extended and include minimum hours from 08:00 to 17:00 on weekdays, 08:00 to 13:00 on Saturdays and 09:00 to 13:00 on Sundays.

14 Capitec Bank Holdings Limited
The ATM network has expanded to 640 own ATMs and 1 914 ATMs operated in partnership. Plans include the increased placement of ATMs independent of branches and expansion of the number of cash recycling machines. In addition, clients can make low-cost cash withdrawals through all Checkers, Shoprite, Pick n Pay, Boxer, Pep and selected Spar stores and any other retailer that provides a cash back at point-of-sale (POS) service.
Internet and mobile banking was introduced two years ago and the functionality of these services has recently been expanded. They are available to clients at no extra cost. These channels attract younger, higher income clients who prefer the convenience they offer.
Unique service Branch managers are the custodians of client service at Capitec Bank and are located in the front of branches to ensure a focus on service ownership and encourage feedback from clients regarding their experiences. Management continuously evaluates service delivery at the key points of client interface. This includes extensive visits to branches by senior executives to meet with clients.
The real-time delivery of all money management solutions, including the credit offer, makes it possible for clients to leave a branch with their needs having been addressed immediately. Paperless transacting simplifies and speeds up processes without compromising security and control for clients. A ‘cashless’ branch environment, which is accessible and inviting, minimises the risk of robbery and violence on the premises.
Growing client numbers per branch have put pressure on service time and quality over the past year. However, the planned branch expansion programme and the revised service process, which will be implemented during the coming year, are expected to improve the client experience and reduce the waiting time before service. The revised service process will include the following benefits:
• Side-by-side consulting to simplify processes• Product and service options are clearly set out for
clients to choose from, thereby supporting decision-making
• Agreement management with digital signatures• Central verification of electronic documentation• Re-engineered branch processes with integrated queue
management
Employees Capitec Bank’s success depends upon its ability to recruit and retain executive management and other key employees as our unique service experience depends on them. We employ a holistic talent management framework and our approach is to make Capitec Bank a great place to grow and develop.
At the end of the reporting period Capitec Bank employees numbered 8 308 (2012: 7 086). Employee turnover for the year amounted to 13.2% (2012: 12.0%) which is in line with the average annual staff turnover for the financial services industry of 13.2% as per the PricewaterhouseCooper (PwC) salary and wage move-ment trends report based on data to September 2012.
Talent acquisition The principle of hire for potential (attitude and aptitude) and train for skill is applied for entry-level positions. This is supported by a well-designed induction programme and ongoing learning interventions. Selection processes are detailed and thorough in determining the best fit.
In support of Capitec Bank’s service experience the focus is to appoint individuals in the branch network that can speak the client’s language and an effort is made to appoint people from each branch’s local community.

Firmfoundations
Management & leadership
Projects Sales Business support centre
Other support services
2012 2013
NUMBER OF EMPLOYEES ATTENDING COURSES
2 456 2 038
435
703
115
1 884
544
658
2 116 1 605
1 369
1 737
Integrated Report 2013 15
Internal career progression is guided by a promotional ratio of 80%, which has been successfully achieved over the past few years by effectively utilising job opportunities created by the growth of the business.
An internal sourcing function was established to deal with the volume of operational employees required for the expanding branch network. Unique candidate application methods and response handling are employed. Cost and time taken to recruit an employee and dependence on recruitment agencies have therefore decreased.
The implementation of an e-Recruitment system will facilitate quicker turnaround times, improved information management, better talent reach, improved consistency in communication with candidates and higher levels of engagement.
Talent management Capitec Bank has a positive image in the job market due to the growth of the organisation and the brand. Employee development must be accelerated and people management processes must be streamlined to meet the challenges of rapid growth. The talent management strategy is focused on developing employees on the job, ensuring that the right people, with the right skills and capabilities, are in the right roles and are engaged and focused on the right activities.
The talent management project started in 2012 is pro- gres sing well towards the development of an integrated talent management framework that includes best practice talent acquisition, role induction, talent identi-fication and development, and longer-term career and succession management. Line managers will be devel-oped and empowered to manage this process.
Learning and development Learning and development initiatives are focused on developing employees and their performance to support continued business growth. Learning programmes aim to enable employees to adapt to ongoing changes in the business and industry, to create pride in and loyalty to the brand (which strongly influences client service), to improve overall performance levels (including personal client service) and to improve the management and leadership capacity of employees and line managers.
Emphasis is placed on the reduction of time to compe-tence, the use of smarter technology and the translation of learning to improvements in business results and client satisfaction. The drive remains to empower employees, ensure personal growth and the succession of key indi-viduals through professional development opportunities. This includes opportunities such as the Study Assistance programme, an internal bursary scheme for employees.
During the reporting period, 730 employees were pro- moted (2012: 665) due to the success of ongoing development initiatives.
Training interventions grew to 8 625 (2012: 7 035) as illustrated below.
16 Capitec Bank Holdings Limited
Employee relations Constructive labour relations are fostered through employee-related policies, the communication of these policies to employees and constant monitoring that all policies and practices comply with the applicable legisla-tion. Two-way communication is consistently encouraged and the emphasis on acceptable conduct creates a culture that supports the growth of the company. During the reporting period there was no industrial action and no collective bargaining was required as Capitec Bank is a non- unionised bank.
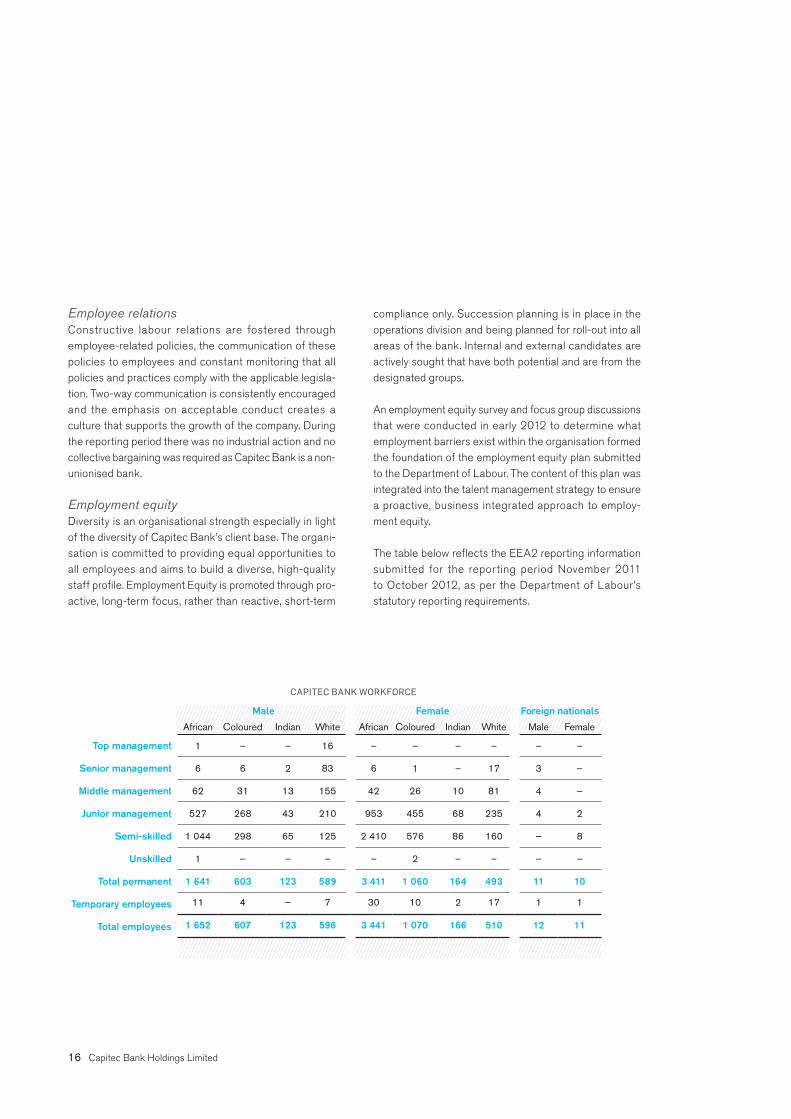
Employment equity Diversity is an organisational strength especially in light of the diversity of Capitec Bank’s client base. The organi- sation is committed to providing equal opportunities to all employees and aims to build a diverse, high-quality staff profile. Employment Equity is promoted through pro-active, long-term focus, rather than reactive, short-term
compliance only. Succession planning is in place in the operations division and being planned for roll-out into all areas of the bank. Internal and external candidates are actively sought that have both potential and are from the designated groups.
An employment equity survey and focus group discussions that were conducted in early 2012 to determine what employment barriers exist within the organisation formed the foundation of the employment equity plan submitted to the Department of Labour. The content of this plan was integrated into the talent management strategy to ensure a proactive, business integrated approach to employ- ment equity.
The table below reflects the EEA2 reporting information submitted for the reporting period November 2011 to October 2012, as per the Department of Labour’s statutory reporting requirements.
CAPITEC BANK WORKFORCE
Male Female Foreign nationalsAfrican Coloured Indian White African Coloured Indian White Male Female
Top management 1 – – 16 – – – – – –
Senior management 6 6 2 83 6 1 – 17 3 –
Middle management 62 31 13 155 42 26 10 81 4 –
Junior management 527 268 43 210 953 455 68 235 4 2
Semi-skilled 1 044 298 65 125 2 410 576 86 160 – 8
Unskilled 1 – – – – 2 – – – –
Total permanent 1 641 603 123 589 3 411 1 060 164 493 11 10
Temporary employees 11 4 – 7 30 10 2 17 1 1
Total employees 1 652 607 123 596 3 441 1 070 166 510 12 11

GDP GROWTH BY QUARTER (%)
1st quarter
3rd quarter
2nd quarter
4th quarter
2008 2009 2011 2012 2013
6.0
5.0
3.1
6.5
-1.7
1.8
4.5
2.9
3.5
1.8
-2.8
-6.3
4.5
3.1
2.3
4.0
3.2
1.71.0
4.6
2.1
1.2
3.4
2.5
2010
Integrated Report 2013 17
The global economy Recent volatility in the international capital markets and the global economy affected the South African economy as a whole and the volatility in global financial markets since 2008 has led to generally more difficult earnings conditions for the financial sector.
Declines in the economic growth of South Africa’s major trading partners, such as the European Union, have adversely impacted South Africa’s balance of trade and the global economic outlook remains relatively weak.
Economic conditions in South Africa The South African economy remains vulnerable to slowing global demand and declining domestic growth rates. South African GDP growth rates are reflected in the adjacent chart.
The South African National Treasury’s economic growth expectation for 2013 remains low at 2.7%, increasing to 3.5% for 2014 and 3.8% for 2015.
The total South African population grew from 44.8 million in 2001 to 51.8 million in 2011 according to Statistics South Africa (Stats SA) (Population census 2011), but 22.8% of South Africans of workable age are unemployed (Stats SA: Labour force survey December 2012). This remains one of the impediments to growth and, along with low economic growth, has led to labour unrest and civil protests in recent months.
Source: Stats SA
Operating environment
Inflation has steadily increased from 4.4% in 2010 to 5.7% for December 2012 driven by increasing energy costs and the rising cost of living. These factors place increased pressure on the disposable income of households.
The SARB repo rate, partly influenced by prevailing inflation rates, has remained at 5% since July 2012. The low ceiling rates on lending in terms of the National Credit Act of 2005 are therefore compressing net interest margins.

18 Capitec Bank Holdings Limited
The South African unsecured credit market The total South African credit market has been significantly influenced by various developments over the past five years. These developments led to increased use of unsecured credit, including also by higher income clients.
The National Credit Act of 2005 (‘NCA’) The NCA impacted the credit market in the following ways:• A restructuring of the credit industry from secured to unsecured
credit and the stagnation of the asset finance and hire purchase segments of the market
• Consumers using unsecured credit as life improvement finance• Increased unsecured credit amounts from a maximum of R10 000
to currently R230 000 and ongoing reduction of pricing• The opportunity to borrow larger amounts over a longer period at
a lower price, allowing consumers to maintain monthly instalments at levels similar to payments on smaller, shorter-term loans
• The disappearance of the many small informal lenders and the entry of the traditional banks into the unsecured credit market
• An increase in credit active clients with a proportionate increase in default clients
• The significant decline of employer-based lending to insignificant levels of the total unsecured credit market
The international credit crisis in 2008 The international credit crisis resulted in the following changes in the credit industry:• Large banks worldwide increased the requirements to obtain
mortgage bonds.• Credit criteria became more stringent and credit advanced
reduced significantly.• The number of mortgage clients has stagnated on 1.8 million
since 2007.• The number of secured credit agreements has declined by
1.5 million since 2007.• Mortgage bonds for home improvements and home furnishing
were retracted.• Pricing on mortgages increased to the riskier profile of client.• Pricing at prime minus levels changed to prime plus levels.
• Banks were encouraged to enter the unsecured market to seek alternative income streams.
Funding requirements for banks defined by Basel III The implementation of Basel III in January 2013 will lead to, amongst other things:• Increased funding and own capital requirements• Increased cost of funding in the shorter term• More conservative credit providing
Urbanisation, formal housing and electrification of houses Growing urbanisation, growth in formal housing and the elec-trification of houses has expanded the potential credit market. Statistics SA reflects that 2.6 million additional formal houses were provided between 2002 and 2010. The majority of these houses are provided with formal services such as electricity and water. This drives a significant demand for home furnishings, appliances and heating devices.
Growing middle class consumer segment AMPS research identifies an increase in consumers in the LSM5 – 7 categories from 31% of the population in 2001 to 49% in 2011. This growth confirms the increasing living standard of the average South African over the past 10 years.
Trends in the South African credit market The trends in the South African secured and unsecured credit market over the last number of years are reflected in the tables that follow.

Integrated Report 2013 19
2009 2010 2011
To 3rd quarter
2011
To 3rd quarter
2012
Trend
2010/2009
Trend
2011/2010
Trend
2012/2011
Agreement type R’m R’m R’m R’m R’m % % %
Mortgages 75 493 97 633 109 801 80 487 80 271 29 12 –
Secured credit 81 196 98 674 118 583 85 189 99 814 22 20 17
Credit facilities 25 776 33 998 53 974 37 378 51 038 32 59 37
Unsecured credit 32 874 51 976 83 314 56 862 73 723 58 60 30
Short-term credit 3 907 5 481 6 664 4 816 4 482 40 22 (7)
Total credit granted 219 246 287 761 372 336 264 732 309 328 31 29 17
Value of unsecured credit granted – size of agreements
R0K-R3K 866 867 1 296 892 1 034 – 50 16
R3.1K-R5K 1 948 2 092 2 953 2 037 1 877 7 41 (8)
R5.1K-R8K 3 211 3 717 5 003 3 469 3 461 16 35 –
R8.1K-R10K 2 833 3 084 4 147 2 858 2 991 9 34 5
R10.1K-R15K 6 292 7 308 8 731 6 261 5 995 16 19 (4)
> R15.1K 17 723 34 908 61 184 41 345 58 366 97 75 41
Total 32 874 51 976 83 314 56 862 73 723 58 60 30
Value of unsecured credit granted by income category
R0-R3 500 8 566 6 933 9 473 6 526 7 270 (19) 37 11
R3 501-R5 500 3 884 5 133 6 687 4 644 6 059 32 30 30
R5 501-R7 500 3 586 6 163 9 654 6 541 8 566 72 57 31
R7 501-R10K 3 735 6 420 9 690 6 728 8 833 72 51 31
R10.1K-R15K 5 866 11 323 18 016 12 370 15 360 93 59 24
> R15K 7 237 16 004 29 792 20 053 27 635 121 86 38
Total 32 874 51 976 83 314 56 862 73 723 58 60 30
Current portion of gross debtors book
Mortgages 627 808 653 115 696 132 685 431 729 184 4 7 6
Secured credit 183 761 194 179 225 341 215 191 248 614 6 16 16
Credit facilities 100 544 108 464 116 101 111 444 129 687 8 7 16
Unsecured credit 40 043 56 731 88 927 76 229 109 050 42 57 43
Short-term credit 554 627 805 694 568 13 28 (18)
Total 952 710 1 013 116 1 127 306 1 088 988 1 217 103 6 11 12

20 Capitec Bank Holdings Limited
The regulatory environment Capitec Bank operates in a highly regulated environment and any change in the enforcement of existing regulations, as well as proposed or future regulations, will impact the business.
South African regulatory agencies have broad jurisdiction over many aspects of the bank’s business, including permissible rates of interest and fees charged to borrowers, capital adequacy, marketing and selling practices, advertising, licensing agents, terms of business and permitted investments. The main legislation and bodies are detailed below.
Legislation or body Function
The Banks Act, 1990 Protect the public by regulating and supervising the entities which take
their deposits
South African Reserve Bank (the SARB) South Africa’s central bank is responsible for the regulation and
supervision of the banking sector in South Africa, with the purpose
of achieving a sound, efficient banking system in the interest of the
depositors of banks and the economy as a whole
The National Credit Act, 2005 (‘the NCA’) Legislation aimed at protecting certain types of consumers. The NCA
regulates the granting of consumer credit and provides for advanced
standards of consumer information. The NCA requires credit providers
to register with the NCR
National Credit Regulator (the NCR) The NCR oversees market regulation and supervision, including
unsecured lending
The National Payment System Act, 1998 Regulates the South African financial settlement system in line with
international practice and systematic risk management procedures
The Payment Association of South Africa (PASA) Facilitated the introduction of payment clearing house agreements and
agreements pertaining to settlement, clearing and netting agreements,
and rules to create certainty and reduce systemic and other risks in
interbank settlement
Consumer Protection Act, 2008 Regulates the relationship between suppliers and consumers in order
to protect the rights of the consumers
Electronic Communications and Transactions Act, 2002 Guarantees the validity of agreements concluded either partly or
wholly by a data message
Prevention of Organised Crime Act, 1998 (POCA) Deals with money laundering, racketeering and criminal and civil
forfeiture, and sets out the substantive money laundering offences
Financial Intelligence Centre Act, 2001 (FICA) FICA complements POCA and provides an administrative framework to
combat money laundering

Integrated Report 2013 21
Following the global economic and financial crisis, regulation and supervision of the global financial system have been and continue to be a priority for governments and supranational organisations. Specifically, the Basel Committee on Banking Supervision (BCBS) issued revised minimum global standards for banks which place enhanced emphasis on the consistency and quality of capital and on curtailing liquidity risk. The Basel III proposals were implemented from 1 January 2013 with various phase-in and transitional arrangements.
Lending in South Africa is highly regulated through the NCA, which is a consumer-focused statute that requires credit providers to perform a thorough assessment of the ability of prospective clients to repay any potential credit they may be granted. Any changes to the NCA will impact Capitec Bank’s business.
Credit ratings South Africa’s sovereign rating affects the South African banking sector as a whole. The current foreign currency credit ratings and long-term outlook for South Africa are BBB+ (Negative outlook), Baa1 (Negative outlook), BBB+ (Negative outlook) from Fitch, Moody’s Investors Service, Inc. (‘Moody’s’) and Standard & Poor’s, respectively, following a downgrade as at 1 October 2012.
Capitec Bank’s credit ratings affect its cost of funding. On 4 March 2013, Moody’s affirmed Capitec Bank’s A2.za/ P-1.za national-scale issuer’s ratings and changed the outlook from positive to stable. According to the rating agency, the outlook reflects their assessment of the risks associated with the continued challenging operating conditions in South Africa’s unsecured lending market, which they believe will weigh on the bank’s asset quality and profitability metrics.
On 28 March 2013 Moody’s assigned global scale Baa3/Prime-3 long and short-term deposit ratings to Capitec Bank. The ratings agency also assigned a D+ standalone bank financial strength rating. The ratings carry a stable outlook.
Capitec Bank is subject to competition from bank and non-bank unsecured lending providers. The stagnation of the secured credit market in South Africa in recent years has led to the four largest banks in South Africa expanding their operations in the unsecured credit market. Competitors are increasingly focusing on developing product offerings that are similar to Capitec Bank’s products and services, and compete for substantially the same clients.
Clients Capitec Bank has 4.7 million active clients who contribute to the transaction income stream of the bank, reflecting growth of 26% for the reporting period. Full bank clients, who deposit an income stream with the bank, do a minimum number of typical bank transactions each month and are the key contributors to the bank’s trans-action income number 1.8 million. Growth at Capitec Bank is primarily focused on acquiring these clients and the potential exists to attract the remaining 2.9 million existing clients to become full bank clients.
Capitec Bank’s full banking clients represent 12.8% of the 13.6 million employed South Africans (Stats SA: Labour force survey December 2012) indicating strong potential for growth.
The table below illustrates the trend in the number and percentage of adult South Africans who used formal banking for the past three years.
Number in millions % of total population
2010 20.9 63
2011 21.2 63
2012 22.5 67
Source: Finscope
Research indicates that Capitec Bank’s share of the total banking market has grown from 5.4% in 2010 to 9.1% in 2012, indicating that there is still significant growth potential.
Competition and market share

MARKET SHARE BY LSM GROUP (%)
LSM 4 LSM 5 LSM 6 LSM 7 LSM 8 LSM 9
2010 20122011
10124
12.68.0
9.1
10.77.9
6.1
12.39.0
6.4
7.98.1
5.4
7.44.13.8
5.94.1
2.5
Source: BA900 regulatory disclosure
MARKET SHARE OF RETAIL DEPOSITS
CapitecBank
AbsaBank
First- rand
Investec Nedbank StandardBank
Dec 2010 Dec 2012 Dec 2011
26.427.4
28.1
20.820.519.9
4.94.54.3
20.421.2
22.4 21.021.421.1
1.52.2
3.3
22 Capitec Bank Holdings Limited
The table below indicates the level of full bank usage in the industry. This includes the use of monthly electronic payment services, card purchases, transfers, internet and mobile banking. Significant opportunities still exist in this area. The large number of clients who draw all their cash soon after it is deposited in their accounts indicates that consumers don’t see the benefit of leaving money in their accounts because of low returns and unexpected fees.
Bank product usage
Number of clients
in millions
Full-service banking 9.6
Monthly cash withdrawals only 5.8
Do not withdraw all cash at once 3.4
Draw all cash at once 3.7
Source: Finscope
The challenge is to communicate the benefits of leaving money in their accounts and the convenience of accessing their money at low cost at retailers or via card purchases to clients. This communication will drive the acquisition of bank clients who use our full services.
Awareness measures conducted through Nielsen SA research indicate that over 35% of the market is still unaware of the value proposition of Capitec Bank. It is the ongoing objective of our marketing investment to differentiate and drive awareness of the bank’s unique offer in the market. Each year the awareness levels increase and more consumers are attracted to the unique solution the bank provides.
Our marketing investment was largely focused on the middle to lower segments of the market until 2010. Over the past two years, however, marketing and distribution investment has shifted to cover the middle to upper segments of the market. The chart to the right reflects the trend in our market share by LSM group for the last three years and shows that, while market share increased across
all LSM groups, the higher increases occurred in LSM groups 4, 5, 6 and 8. This indicates that Capitec Bank’s offer is generating significant acquisition of middle to upper income clients.
Savings Capitec Bank’s retail deposit book has grown consistently over recent years as client numbers have grown and the product offer has expanded to include fixed-term deposits.
The chart below illustrates the trend in market share relative to competitors.

RETAIL MARKET SHARE BY PRODUCT
60%
16%
14%
1%
6%
2% 1%
Residential mortgages
Other loans and advances
Leasing
Other mortgage advances
Credit cards
Overdrafts
Instalment sales
CapitecBank
AbsaBank
AfricanBank
First-rand
Nedbank StandardBank
Dec 2010 Dec 2012 Dec 2011
MARKET SHARE OTHER LOANS ANDADVANCES TO HOUSEHOLDS (%)
10124
10.313.6
30.032.1
33.2
12.212.910.8
13.913.013.0
13.311.510.8
16.8
17.313.910.4
Integrated Report 2013 23
Credit market share At the end of December 2012 the domestic loans and advances market book totalled R2 525 billion (excluding credit impairments). Total domestic household retail loans and advances comprised R1 258 billion of the market.
Capitec Bank participates only in the other loans and advances segment which represents the unsecured credit market and the trend in our market share is illustrated below.
Source: BA900 regulatory disclosure
At the end of December 2012 Capitec Bank had the second largest market share in the unsecured credit market having increased its market share by 3.4% during the year.


