84


Caraga Asset Account
for Mineral Resources:
2015-2018
Republic of the Philippines PHILIPPINE STATISTICS AUTHORITY
Regional Statistical Services Office XIII (Caraga)

The Caraga Asset Account for Mineral Resources: 2015-2018 is a publication periodically prepared by the
PHILIPPINE STATISTICS AUTHORITY (PSA) Regional Statistical Services Offices XIII (Caraga)
TERMS OF USE OF PSA PUBLICATIONS The PSA reserves its exclusive right to reproduce all its publications in whatever form. Any part of this publication should not be reproduced,
recopied, lend or repackaged for other parties for any commercial purposes without written permission from the PSA. Any part of this
publication may only be reproduced for internal use of the recipient/customer company. Should any portion of the data in this
publication are to be included in a report/article, the source of the data, the title of the publication and the PSA as publisher should always be cited. Any information derived from the manipulation of data contained
in the publication will no longer be the responsibility of PSA.
ISSN 2719 - 1257
Published by the Philippine Statistics Authority (PSA)
Regional Statistical Services Office XIII (Caraga) Freeman Building, J.C. Aquino Avenue, Barangay Imadejas,
Butuan City 8600 Philippines
December 2020
The Caraga Asset Account for Mineral
Resources: 2015-2018 is available in printed and electronic formats (Word/PDF in CD Rom). For details, please contact us at (085) 815 2878
Or email us at [email protected]

iii
FOREWORD
Caraga is considered as one of the regions in the country with rich
source of minerals. Mineral resources contribute to the region’s wealth and are
an asset in the economic growth of the area. The accounting of this asset is
considered vital for the formulation of comprehensive planning, policy, and decision
making in the region.
The Philippine Statistics Authority – Regional Statistical Services Office XIII
(PSA-RSSO XIII) continues its endeavor for Environment and Natural
Resources Accounting (ENRA) activities by focusing, this time, on the
accounting of mineral asset in the region. The compilation and estimation for
mineral resources covered the accounting period of 2015 to 2018. This
compilation was based on the United Nations System of Environmental-
Economic Accounting (SEEA) 2012 – Central Framework.
The publication of the Caraga asset account for mineral resources is a
product of the collaborative efforts of the Steering Committee and Technical
Working Group (TWG) composed of the data producers, data users, and
compilers in the region. The result of this accounting will serve as a baseline
information on the degradation and depletion of Caraga’s mineral resources and
its implication on the environmental assets of the region over the accounting
period. Further, this will provide awareness and necessary information to
the concerned agencies, institutions, local government units, and private
individuals on the path of sustainable development.
Finally, we would like to thank the Regional Statistics Committee
(RSC), and the Regional Development Council (RDC) of Caraga for their
invaluable support which are both instrumental in defining some policy implications for
successful utilization of the Mineral Asset Account in support for better planning and
decisions.
DENNIS S. MAPA, Ph.D. Undersecretary National Statistician and Civil Registrar General Philippine Statistics Authority

iv

v
MESSAGE FROM MINES AND GEOSCIENCES BUREAU XIII
The Mines and Geosciences Bureau (MGB) Regional Office No. XIII
commends the Philippine Statistics Authority for its remarkable initiative and
synergy with partner agencies to develop the Caraga Asset Account for
Mineral Resources. The Asset Account for Mineral Resources is timely and
relevant since Caraga Region has been dubbed as the new mining capital of
the Philippines due to its vast mineral resources and reserves and a host of
the majority of the operating metallic and non-metallic mines, and mineral
processing plants producing gold/silver bullions, and nickel & cobalt mixed
sulfides and scandium oxalate. With this, mining has become one of the vital
drivers of economic growth and social development. The significant
contributions of the minerals industry to regional progress are truly
indisputable with 10.4% share, at current prices, to the Gross Regional
Domestic Product for CY 2019.
Accordingly, the continuous mining operations has environmental
impacts. Thus, the creation of the Asset Account would greatly aid the MGB in
showcasing the economic and environmental contributions of mining at
regional level as it changes over time, and the evaluation and assessment of
the impacts of mining activities towards the sustainability of responsible
mining.
It is our cherished hope that this endeavor will continue to yield positive
results. Rest assured of the full support and commitment of MGB Regional
Office No. XIII in the transparency of providing significant and relevant data as
it is one with you in the constant improvement of the Caraga Asset Account
for Mineral Resources.
Salamat karajaw!
ENGR. GLENN MARCELO C. NOBLE Regional Director Mines and Geosciences Bureau Regional Office No. XIII

vi

vii
ACKNOWLEDGMENT
The Statistical Operations and Coordination Division (SOCD) of the
Philippine Statistics Authority-Regional Statistical Services Office XIII
(PSA – RSSO XIII) spearheaded the compilation of Caraga Asset Account for
Mineral Resources as its third (3rd) project in support for Caraga’s Economic-
Environmental and Natural Resources Accounting (EENRA). The accounting
of this asset followed the UN System of Environmental-Economic Accounting
(SEEA) 2012 Central Framework. In employing the framework, physical and
monetary accounts were established to present statistical information on the
depletion and degradation of the mineral resources within the accounting
period 2015 to 2018.
Sincere recognition is given to the members of the Caraga EENRA
Steering Committee and Technical Working Group from different agencies:
Mines and Geo-sciences Bureau (MGB), Department of Environment and
Natural Resources (DENR), and National Economic and Development
Authority (NEDA) for their active involvement and for imparting their
knowledge and expertise throughout this endeavor. We would also like to
extend our heartfelt gratitude to the Local Government Units (LGUs) and the
Provincial Mining Regulatory Board (PMRB) of each province in the region
who gave their full support during the data gathering/compilation.
Our utmost appreciation to the data producers, data users, and
compilers for their commitment and unwavering support to ensure the
success of the Asset Account for Mineral Resources publication as well as for
the active participation, suggestions, and recommendations imparted during
the activities conducted by PSA.
This endeavor would not be possible without the financial support from
the Macroeconomic Accounts Service (MAS) through the Philippine
Economic-Environmental and Natural Resources Accounting (PEENRA)
Project and the technical support of the Environment and Natural Resources
Accounts Division (ENRAD) throughout this venture, especially on the data
gaps.

viii
Kudos to everyone who contributed in the preparation and compilation
of the Caraga Asset Account for Mineral Resources: 2015-2018.
ROSALINDA C. APURA, D.M. Vice-chairperson Caraga EENRA Steering Committee PSA-Caraga Regional Director

ix
REGIONAL DEVELOPMENT COUNCIL RESOLUTION

x
xi

xii

xiii
REGIONAL STATISTICS COMMITTEE RESOLUTION

xiv

xv
TABLE OF CONTENTS
FOREWORD .................................................................................................. iii
MESSAGE FROM MINES AND GEOSCIENCES BUREAU XIII......................v
ACKNOWLEDGMENT .................................................................................. vii
REGIONAL DEVELOPMENT COUNCIL RESOLUTION ................................ ix
REGIONAL STATISTICS COMMITTEE RESOLUTION ............................... xiii
TABLE OF CONTENTS ................................................................................ xv
LIST OF FIGURES ...................................................................................... xvii
LIST OF TEXTUAL TABLES ...................................................................... xviii
LIST OF APPENDIX TABLES ...................................................................... xix
ACRONYMS ................................................................................................ xxi
DEFINITION OF TERMS............................................................................ xxiii
EXECUTIVE SUMMARY ........................................................................... xxvii
EXPLANATORY NOTES................................................................................ 1
Introduction ................................................................................................. 1
Objectives ................................................................................................... 6
CONCEPTUAL FRAMEWORK ...................................................................... 7
Framework for the Mineral Asset Accounts ................................................. 9
OPERATIONAL FRAMEWORK ................................................................... 11
Scope and Coverage ................................................................................ 11
Sources of Data ........................................................................................ 11
Methodology ............................................................................................. 12
RESULTS AND DISCUSSIONS ................................................................... 21
WAYS FORWARD IN IMPROVING THE DATA SUPPORT
AND ESTIMATION ....................................................................................... 37
APPENDICES .............................................................................................. 39
APPENDIX A (Physical Asset Accounts) ................................................... 40
APPENDIX B (Monetary Asset Accounts) ................................................. 43
APPENDIX C (Mineral Production) ........................................................... 46
APPENDIX D (Historical Prices)................................................................ 47
APPENDIX E (Categorization of Mineral Resources) ................................ 48
APPENDIX F (Social Discount Rate Memorandum) .................................. 50

xvi
STEERING COMMITTEE ............................................................................. 51
TECHNICAL WORKING GROUP ................................................................. 52
REFERENCES ............................................................................................. 53
xvii
LIST OF FIGURES
Figure 1 Stock of Nickel Ore Reserve, Caraga: 2015-2018 (in Million Wet Metric Ton)……………………………….............21
Figure 2 Percent Distribution of Nickel Ore Reserve by Class (Class A, B, and C), Caraga: 2015-2018………………………..22
Figure 3 Stock, Additions and Reductions to Stock of Class A Nickel Ore Reserve, Caraga: 2015-2018 (in Million Wet Metric Ton)……………………..………………….23
Figure 4 Stock of Gold Ore Reserve, Caraga: 2015-2018 (in Million Wet Metric Ton)………..…………………………........25
Figure 5 Percent Distribution of Gold Ore Reserve by Class (Class A and Class B), Caraga: 2015-2018…………………….26
Figure 6 Stock, Additions and Reductions to Stock of Class A Gold Ore Reserve, Caraga: 2015-2018 (in Million Wet Metric Ton)………………………….…………..…27
Figure 7 Stock of Metallurgical Chromite Reserve, Caraga: 2015-2018 (in Million Wet Metric Ton)….…….………..29
Figure 8 Percent Distribution of Metallurgical Chromite Reserve in Class A, B, and C, Caraga: 2015-2018.………………………30
Figure 9 Stock and Reductions to Stock of Class A Metallurgical Chromite Reserve, Caraga: 2015-2018 (in Thousand Wet Metric Ton)……………………………………31
Figure 10 Resource Rent by Mineral Commodity, Caraga: 2015-2018 (in Billion Pesos)…………………………....33
Figure 11 Valuation of Nickel Ore Asset at 10 Percent Discount Rate, Caraga: 2015-2018 (in Billion Pesos)……………………………………………………34
Figure 12 Valuation of Gold Ore Asset at 10 PercentDiscount Rate, Caraga: 2015-2018 (in Billion Pesos)……………………………………………………35
Figure 13 Valuation of Metallurgical Chromite Asset at 10 Percent Discount Rate, Caraga: 2015-2018 (in Million Pesos)…………………………………………………...36

xviii
LIST OF TEXTUAL TABLES
Table 1 Contribution of Nickel Ore, Gold Ore, and Chromite Ore Mining to the Gross Value Added (GVA) of Mining and Quarrying (MAQ) Industry in the Philippines at 2018 Constant Prices in Million Pesos: 2015-2018………………………………………..2
Table 2 Percent Contribution of Mining and Quarrying to Gross Regional Product (GRDP) and to Total Employment in Caraga: 2015-2018 (at Constant 2000 Prices)………………..3
Table 3 Mineral Production by Commodity, Caraga: 2015-2018 (in Wet Metric Ton)………………………………………………….4
Table 4 Production of Mineral Products and By-Products in Caraga: 2015-2018………………………………………………….4
Table 5 Basic Structure for Mineral Asset Account……………………...10
Table 6 Physical Asset Account for Nickel Ore Class A, Caraga: 2015-2018 (in Million Wet Metric Ton)………………...24
Table 7 Estimated Asset Life of Class A Nickel Ore Reserve Caraga: 2015-2018…………………………………….…………..25
Table 8 Physical Asset Account for Gold Ore Class A, Caraga: 2015-2018 (in Million Wet Metric Ton)………………...28
Table 9 Estimated Asset Life of Class A Gold Ore Reserve, Caraga, 2015-2018…………………………………...……………28
Table 10 Physical Asset Account for Metallurgical Chromite Class A, Caraga: 2015-2018 (in Thousand Wet Metric Ton)….30
Table 11 Estimated Asset Life of Class A Metallurgical Chromite Reserve, Caraga: 2015-2018……………………………………..32

xix
LIST OF APPENDIX TABLES
APPENDIX A: Physical Asset Accounts
Table 6a Physical Asset Account for Nickel Ore Class B, Caraga: 2015-2018 (in Wet Metric Ton)…………………………40
Table 6b Physical Asset Account for Nickel Ore Class C, Caraga: 2015-2018 (in Wet Metric Ton)………………………...40
Table 8a Physical Asset Accounts for Gold Ore Class B, Caraga: 2015-2018 (in Wet Metric Ton)…………………………41
Table 10a Physical Asset Account for Metallurgical Chromite Class B, Caraga: 2015-2018 (in Wet Metric Ton)………………41
Table 10b Physical Asset Account for Metallurgical Chromite Class C, Caraga: 2015-2018 (in Wet Metric Ton)………………42
APPENDIX B: Monetary Asset Accounts
Table 12 Monetary Asset Account for Nickel Ore Class A at 10 Percent Discount Rate, Caraga: 2015-2018 (in Peso)……………………………………..43
Table 13 Monetary Asset Account for Gold Ore Class A at 10 Percent Discount Rate, Caraga: 2015-2018 (in Peso)……………………………………..44
Table 14 Monetary Asset Account for Metallurgical Chromite Class A at 10 Percent Discount Rate, Caraga: 2015-2018 (in Peso)……………………………………..45
APPENDIX B: Mineral Production
Table 15 Estimation of Gold Ore Production, Caraga: 2015-2018 …...............................................................46
Table 16a Estimated Mineral Production by Commodity, Caraga: 2015-2018 (in Dry Metric Ton)………………………….46
Table 16b Gross Value of Production by Ore in Peso, at Dry Metric Ton, Caraga: 2015-2018……………………….….46
Table 17 Gross Value of by-Products Production, Caraga: 2015-2018…………………………………………………………...46

xx
APPENDIX D: Historical Prices
Table 18 Historical Metal Prices……………………………………….........47
Table 19
Table 20
Historical Treasury Bill Rates…………………………….…..…..47
Categorization of Mineral Resources…………………………....48

xxi
ACRONYMS
BSP Bangko Sentral ng Pilipinas
DENR Department of Environment and Natural Resources
DMPF Declaration of Mining Project Feasibility
DMT Dry Metric Ton
EENRA Economic-Environmental and Natural Resources Accounting
EIA Environmental Impact Assessment
ENRAD Environment and Natural Resources Accounts Division
FAME Fishery, Agro-forestry, Mineral and Eco-tourism
FDES Framework for Development of Environment Statistics
GVA Gross Value Added
GO Gross Output
GRDP Gross Regional Domestic Product
LGU Local Government Unit
LME London Metal Exchange
MAS Macroeconomic Accounts Service
MAQ Mining and Quarrying
MGB Mines and Geosciences Bureau
MPSA Mineral Production Sharing Agreement
MSME Micro, Small, and Medium Enterprise
NEDA National Economic and Development Authority
NPV Net Present Value
xxii
PEENRA Philippine Economic-Environmental and Natural Resources
Accounting
PMRB Provincial Mining Regulatory Board
RDC Regional Development Council
RDP Regional Development Plan
RR Resource Rent
RSC Regional Statistics Committee
RSSO Regional Statistical Services Office
SDG Sustainable Development Goal
SEEA System of Environmental – Economic Accounting
SNA System of National Accounts
SOCD Statistical Operation and Coordination Division
TWG Technical Working Group
UN FDES United Nations Framework for the Development of Environment
Statistics
UNFC United Nations Framework Classification for Fossil Energy and
Mineral Reserves and Resources
UNSC United Nations Statistical Commission
WMT Wet Metric Ton

1 Consolidated Department of Environment and Natural Resources Administrative Order for the Implementing Rules and Regulations of Republic Act (RA) No. 7942, otherwise known as “The Philippine Mining Act of 1995” 2 Revised Implementing Rules and Regulations of RA No. 7076, otherwise known as the “People’s Small-Scale Mining Act of 1991”
xxiii
DEFINITION OF TERMS
The definitions of the following terms are based on the Department of
Environment and Natural Resources Administrative Order Nos. 2010-211 and
2015-032, and Britannica Dictionary:
Discount Rate (hurdle rate) is the minimum rate of return on the project or
investment.
Financial or Technical Assistance Agreement (FTAA) means a contract
involving financial or technical assistance for large-scale exploration,
development and utilization of mineral resources.
Force Majeure means acts or circumstances beyond the reasonable control
of Contractor/Permit Holder/Permittee/Lessee.
Gold (Au) is a dense, soft, highly malleable and ductile precious metal with a
lustrous yellow color which often occurs in free elemental (native) form, as
nuggets or grains, in rocks, in veins, and in alluvial deposits. It is widely used
for jewelry, goldware or coinage, dental material, investment products and in
the electric and electronics industry.
Metallic Minerals are minerals with brilliant appearance, quite opaque to
light, giving a black or very dark streak, and from which a metallic
element/component can be extracted/utilized for profit.
Metallurgical Chromite is a relatively hard, metallic, black oxide mineral of
chromium and iron with a molecular formula of (FeCr2O4), that is the chief
commercial source of chromium can be used as a refractory material and as
alloying element for production of corrosion resistant super alloys, and
stainless steel.
xxiv
Minerals refer to all naturally occurring inorganic substances in solid, liquid,
gas or any intermediate state excluding energy materials such as coal,
petroleum, natural gas, radioactive materials and geothermal energy.
Mineral Agreement is a contract between the Government and a Contractor,
involving Mineral Production Sharing Agreement, Co-Production Agreement
or Joint Venture Agreement.
Mineral Processing means the milling, beneficiation, leaching, smelting,
cyanidation, calcination or upgrading of ores, minerals, rocks, mill tailings,
mine waste and/or other metallurgical by products or by similar means to
convert the same into marketable products.
Mineral Products are materials derived from ores, minerals and/or rocks and
prepared into a marketable state by mineral processing.
Mineral Reservations refer to areas established and proclaimed as such by
the President upon the recommendation of the Director through the Secretary,
including all submerged lands within the contiguous zone and Executive
Economic Zone.
Mineral Resources are any concentration of ores, minerals and/or rocks with
proven or potential economic value.
Mining is the activity, occupation, and industry concerned with the extraction
of valuable minerals or other geological materials from the Earth.
Mining Operations mean mining activities involving exploration, feasibility
study, development and utilization.
Moisture Content is the percentage moisture content equals the weight of
moisture divided by the initial weight before drying multiplied by 100.
Nickel (Ni) is a silvery-white lustrous metal, and is markedly resistant to
oxidation and corrosion and high electrical and thermal, which makes it
extremely useful for the development of stainless and heat-resistant steels.
.
3 Dictionary of Mining Engineer
xxv
Nickel-Cobalt Mixed Sulfide is an intermediary product of nickel refining that
is a mixture of nickel and cobalt sulfides extracted from low-grade laterite ore,
which contains about 40%-60% of nickel by weight.
Ore means naturally occurring substance or material from which a mineral or
an element can be mined and/or processed for profit.
Ore Reserve is the term usually restricted to one of which the grade and
tonnage have been established with reasonable assurance by drilling and
other means.3
Permittee means the holder of an exploration permit or Mineral Processing
Permit issued under the Implementing Rules and Regulations of the Philippine
Mining Act of 1995 (RA No. 7942), and People’s Small-scale Mining Act of
1991 (RA No. 7076).
Permit Holder means a holder of any mining permit or Mineral Processing
Permit issued under the Implementing Rules and Regulations of
RA Nos. 7942, and 7076 except permits that authorize exploration activities
only.
Quarry means an open pit, mine or excavation, where stone, sand, gravel, or
mineral is obtained from open faces, with or without a waste rock overburden.
Quarrying means the surface exploitation of stone or mineral deposits from
the earth’s crust.
Resource Rent is the total revenue that can be generated from the extraction
of the natural resources, less the cost of extracting the resources (including
the normal return of investment).
Scandium (Sc) is a silvery white, moderately soft and classified as a rare
earth metal. It has low density and high melting point which suggest
applications as an alloying agent for lightweight metals for military and high-
performance applications. The main application by volume is in aluminium
scandium alloys for the aerospace industry and for sports equipment.

xxvi
Scandium Oxalate Hydrate is a chemical compound with a molecular
formula of Sc2(C2O2)3.H2O which appears as a white crystal powder, which
can be refined to produce Scandium.

4 Caraga Regional Development Council. Caraga Today 20205 System of Environmental – Economic Accounting 2012- Central Framework 6 Philippine Information Agency (October 1, 2019)
xxvii
EXECUTIVE SUMMARY
Caraga is endowed with abundant natural resources, encompassing
agriculture, fishery, forestry, minerals, and eco-tourism destinations. Hence,
the Regional Development Council (RDC) has zeroed in on strategic
programs and initiatives towards securing Caraga’s position as the Fishery,
Agro-forestry, Mineral and Eco-tourism (FAME) Center in the country.4 Thus,
environmental accounting is also necessary to evaluate the present status of
the environment and implement measures or reforms to boost the economic
development of the region.
The United Nations Statistical Commission (UNSC) on its forty-third
session, adopted the System on Environment-Economic Accounting (SEEA)
Central Framework as the first international statistical standard for
environmental-economic accounting. The environment and its relationship to
the economy has been put to the core of official statistics and was based on
agreed concepts, classifications, definitions, and accounting rules. Also, it
enables the information to be organized into tables and accounts in a unified
and in conceptually clear manner.5 SEEA reorganizes the relevant
environment statistics according to stocks and flows within and between the
environment and the economy based on the principles of the System of
National Accounts (SNA). In this way, it creates links between environment
statistics and SNA and facilitates the analysis of relationships between the
economy and the environment.
Caraga, particularly Surigao del Norte, has been known as the mining
capital in the country since out of 50 metallic mines operating in the
Philippines, 25 operate in the region with one of two nickel processing plants
and one of two gold processing plants are also in the region.6 Using the UN
SEEA Central Framework-2012, environmental capital such as mineral
resources was measured through asset accounts. Asset accounts record the
opening and closing stocks of the mineral assets owing to the changes of

xxviii
stocks (additions and reductions to stocks) over an accounting period. It also
assess whether current patterns of economic activities are depleting or
degrading the available environmental assets. In addition, the framework is
also for understanding the interactions between the economy and the
environment.
Available data of Caraga’s mineral assets were compiled covering the
accounting to 2018. This report presents the physical and monetary accounts
for nickel ore, gold ore, and metallurgical chromite. The mineral reserves were
classified according to the criteria derived from the United Nations Framework
Classification for Fossil Energy and Mineral Reserves and Resources
(UNFC-2009) as Class A - Commercially Recoverable Resources; Class B -
Potentially Commercially Recoverable Resources; and Class C - Non-
commercial and other Known Deposits. However, due to the insufficient data
from the previous years, backtracking was done to complete the accounting.
In monetary terms, the Net Present Value (NPV) approach was applied on
the valuation of the mineral assets which only focused on Class A reserves.
The values of the mineral reserves were estimated which were observed that
these are dependent on the fluctuation of foreign exchange rates, and the
evolution of market prices. Moreover, nickel ore mining was estimated to have
the highest contribution to the economy as the resource rent.
Addressing the data gaps encountered in this study was a major
challenge but needed to support the completion of the estimation of the
mineral accounting in the region. Furthermore, the estimation of the resource
value in the region can also be improved with available, sufficient and properly
recorded data.

1
EXPLANATORY NOTES
Introduction
The growing population and the economic development of the region
led to the extraction of the natural resources resulting to unbalance biological
diversity of the environment. Mining activities typically cause impacts on the
environments such as on land, air, water, flora, fauna and the people who
basically depend on these resources. Today, environmental accounting is
considered as one of the areas for extensive research. Thus, the
environmental asset accounting is necessary to monitor the level of
exploitation of resources through figures. With the Environmental Impact
Assessment (EIA) and partaking in the National Greening Program (NGP), the
Department of Environment and Natural Resources (DENR) required mining
companies to secure ISO 14001 certification which sets out the criteria for an
environmental management system, and abiding Executive Order No. 79 in
ensuring environmental protection and responsible mining in the utilization of
mineral resources.7 Especially, the region reportedly hold half of the
Mindanao’s mineral deposit.
Coordination between the government and communities as well as
better access to financial resources can boost the mining industry. The
booming industry can create better opportunities to contribute to the
attainment of various Sustainable Development Goals (SDGs) through its
significant effect on Gross Regional Domestic Product (GRDP), inducements
effect on flourishing establishment, increase number of Micro, Small, and
Medium Enterprise (MSME), and influxes of more investments and improve of
the total revenue. This will lead to more savings or deposits, strengthen bank
growth, and availability of loan portfolio. The industry also increases the
capacity for more household spending and enhances human capital
development. As a result, it increases volume of imported goods to the
community and lift export earnings. 7
Executive Order No. 79, “Institutionalizing and Implementing Reforms in the Philippine Mining Sector Providing Policies and Guidelines to Ensure Environmental Protection and Responsible Mining in the Utilization of Mineral Resources”

2
Moreover, mining industry can significantly impact local, regional, and
national socio-economic status by fostering economic development and social
inclusion. Mining industry contributed to reduce poverty, promote gender
equal opportunity, give decent work (offer training and apprenticeship
program), and endorse industry innovation and infrastructure development.
Table 1. Contribution of Nickel Ore, Gold Ore, and Chromite Ore Mining to the Gross Value Added (GVA) of Mining and Quarrying (MAQ) Industry in the Philippines
at 2018 Constant Prices, in Million Pesos: 2015-2018 Level Percentage Share to the
GVA of MAQ 2015 2016 2017 2018 2015 2016 2017 2018
Total MAQ 148,589 156,807 160,065 163,322
Mining of nickel ore 25,542 20,574 18,518 17,740 17.2 13.1 11.6 10.9 Mining of gold and other precious metal ore*
23,401 25,292 25,871 25,071 15.7 16.1 16.2 15.4
Mining of chromite ore** 155 151 222 443 0.1 0.1 0.1 0.3 Note: *Included other precious metal ores (e.g. mining of silver ores) but majority of the sub-industry came from mining of gold ore. **Unpublished figure and only available in the worksheet level. Mining of chromite ore is included in the Stone quarrying and other mining and quarrying. Source: Philippine Statistics Authority
The total value of MAQ in the country increased from 148,589 million
pesos in 2015 to 163,322 million pesos in 2018. Mining of nickel ore in 2015
contributed 17.2 percent to the total Gross Value Added (GVA) of MAQ
industry. From 2015 to 2018, it recorded an annual decrease from 17.2
percent to 10.9 percent share, respectively. On the other hand, the
contribution of mining of gold and other precious metal ores shows a
fluctuating trend with the highest contribution to MAQ of 16.2 percent
amounted to 25,871 million pesos in 2017. Mining of chromite ore in the
country also contributed 0.1 percent from 2015 to 2017 and increased to 0.3
percent in 2018 which translated to 443 million pesos. (Table 1)

3
Table 2. Percent Contribution of Mining and Quarrying to Gross Regional Domestic Product (GRDP) at Constant 2000 Prices and to Total Employment in Caraga: 2015-2018
Mining and Quarring Industry 2015 2016 2017 2018
Contribution to GRDP 22.5 20.5 18.2 16.8 Share to Total Employment 5.3 3.5 3.3 2.6 Source: Philippine Statistics Authority
In 2015, mining and quarrying industry in the region contributed 22.5
percent to the total GRDP at constant 2000 prices. From 2015 to 2018, a
declining trend was observed with 20.5 percent in 2016, 18.2 percent in 2017,
and 16.8 percent in 2018. Moreover, in 2015, mining and quarrying industry
generated 5.3 percent to the total employment of Caraga, 3.5 percent in 2016,
3.3 percent in 2017, and 2.6 percent in 2018. (Table 2)
The region is producing and processing mineral commodities
particularly but not limited to nickel ore, nickel-cobalt mixed sulfide, scandium
oxalate, gold, silver, and metallurgical chromite. Nickel is a component of
many industrial and consumer products, including stainless steel, batteries,
magnetic and electrical equipment. As presented, mineral production for
nickel ore decreased from 2015 to 2018 with 46.56 million Wet Metric Ton
(WMT) to 30.81 million WMT. This was due to the suspension of the mining
firms for not meeting up the environmental standard, fluctuating metal price in
the world market, and force majeure circumstances (e.g. non operation due to
security problem). (Table 3)
The estimated production of gold ore in 2015 was 1.05 million WMT
and decreased its production in the succeeding years as shown in Table 3.
Gold ore production in 2016 dropped to 0.86 million WMT and slightly
decreased to 0.72 million WMT in 2017. Moreover, closure of some gold mine
operation under Mineral Production Sharing Agreement (MPSA) operated in
2018 resulted to a lower gold ore production with 0.57 million WMT as
reported by the MGB Caraga. (Table 3)

8 Mines and Geosciences Bureau: Chromite Commodity Profile 2016. Page 1
4
Table 3. Mineral Production by Commodity, Caraga: 2015-2018 (in Wet Metric Ton)
Commodity 2015 2016 2017 2018
Nickel Ore 46,556,119.05 36,428,484.23 32,901,676.76 30,808,109.08 Gold Ore 1,054,844.55 856,949.84 719,344.67 566,545.46 Metallurgical Chromite
3,296.56 2,847.67 - -
Note: "-" No mineral production due to environmental compliance Source: Mines and Geosciences Bureau-Caraga/Mines and Geosciences-Central Office/Philippines Statistics Authority
Over the years, there were only few metallurgical chromite mine that
operated in the Philippines due to the struggle to sustain production in the
face of marketing problems which has been the cause of major concern
among chromite producers.8 The region produced metallurgical chromite with
46% Chromium (III) oxide (Cr2O3) which occur as residual deposits. Chromite
is the most important ore of chromium.8 It has a wide range of usage in
industries such as an additive endowing alloy to enhance hardness and
resistance to corrosion and oxidation which made chromium indispensable in
countless everyday applications. The production of metallurgical chromite in
2015 was 3,296.56 WMT and decreased to 2,847.67 WMT in 2016. (Table 3)
Table 4. Production of Mineral Products and By-Products in Caraga: 2015-2018
Commodity 2015 2016 2017 2018
Gold bullion (kg) 4,877.00 4,625.00 3,187.00 2,894.18 Silver bullion (kg) 1,870.13 2,755.53 1,013.92 567.46
Nickel/Cobalt Mixed Sulfides (DMT) 50,924.00 54, 053.28 59,225.65 45,864.60
Scandium Oxalate (dry-kg) - - - 4,515.00 Note: "-" Denotes no mineral production Source: Mines and Geosciences Bureau-Caraga/Mines and Geosciences-Central Office/Philippines Statistics Authority
Gold is usually associated with silver in nature and is recovered as a
by-product of gold ore refining which is being done in the region. Gold is
chiefly used for jewelry and is also ideal for electronic and electrical
appliances being a good semi-conductor. Based on the available information,

9 See Appendix C Table 15 10 Retrieved from http://www.mgb.gov.ph/attachments/article/742/Nickel%20leads%20in%20H
1%202019.pdf
5
216,289.64 WMT of gold ore would produce a kilogram of gold in 2015,
185,286.45 WMT in 2016, 225,712.17 WMT in 2017, and 195,753.36 WMT of
ore per kilogram of gold were produced in 2018.9 The region produced
4,877.00 kg gold bullion with an average fineness of 670.5 in 2015. However,
the production declined to 4,625.00 kg in 2016, 3,187.00 kg in 2017, and
2,849.18 kg in 2018. On the other hand, silver has long been valued as a
precious metal and is used in many pre-modern monetary systems in bullion
coins, sometimes alongside gold. Silver bullion produced during the
accounting period has a fluctuating trend. However, silver bullion can be
observed to have the highest production of 2,755.53 kg in 2016. Low
production of gold and silver bullion in 2018 is also due to the low production
of gold ore. (Table 4 and Table 15)
Nickel/cobalt mixed sulfide and scandium oxalate are mineral
by-products of the processing of nickeliferous ore.10 Production of
nickel/cobalt mixed sulfide fluctuates from 2015 to 2018. The highest
production was observed in the year 2017 with 59,225.65 Dry Metric Ton
(DMT) and has the lowest production of 45,864.60 DMT in 2018. (Table 4)
The production of scandium oxalate in 2018 is considered as a
technical breakthrough in the history of Philippine mining since it was the first
time to be recovered as a by-product of the process.10 Scandium is the lightest
rare earth element which has critical utilization areas such as the aerospace
industry, solid oxide fuel cells, electronics industry, and is also used in
metallurgical applications. As reported by Mines and Geosciences Bureau,
4,515.00 dry-kg of scandium oxalate was produced in 2018. (Table 4)

6
Objectives
Metallic mineral resources, as one of the drivers of the economic
development of the region, were accounted following the United Nations (UN)
System of Environmental-Economic Accounting (SEEA) 2012. This
compilation aims:
1. to assess the change over time whether the economic activity is
depleting and degrading the available mineral assets,
2. to determine the asset life of the mineral reserves as an input for
the developmental plan for the sustainability of the economic
activity, and
3. to determine the contribution of mining industry to the economy
of the region.

11 Ibid, footnote no. 5
7
CONCEPTUAL FRAMEWORK
Environmental Assets
Environmental assets are the naturally occurring living and non-living
components of the Earth and constitute the biophysical environment, which
may provide benefits to humanity. As defined in Central Framework,
environmental assets are viewed in terms of the individual components
(timber, water, soil, land, minerals, and energy) that make up the
environment, with no direct account taken of the interactions between these
components as part of ecosystems. Thus, exploration will have an impact on
the welfare and endowment of the future generation.
Stock Accounts
The SEEA Central Framework developed by the UN is a multipurpose
conceptual framework intended for understanding the interactions between
the economy and the environment, and for describing the stocks and changes
in stocks of environmental assets.11 It puts statistics on the environment and
its relationship to the economy and the environment at the core of official
statistics. The environmental capital can be measured through the asset
accounts. The asset accounts record the opening and closing stocks of the
environmental assets and the different types of changes in the stocks over an
accounting period. It also assesses the patterns of economic activity whether
these are depleting and degrading the available environmental assets.
SEEA Central Framework applies the accounting concepts, structures,
rules and principles of the System of National Accounts (SNA). In principle,
when accounting for environmental assets in physical terms include all
environmental assets whether or not they have a monetary value. In mineral
resources, the scope is known deposits. Accounting for changes in the stocks
of environmental assets presents various measurement challenges, thus,
understanding the dynamics is important in making a reasonable assessment
of certain environmental assets. In the Central Framework, consistent with the

8
SNA, the scope of valuation is limited to the benefits that accrue to economic
owners. The use of natural inputs by the economy is linked to changes in the
stock of environmental assets that generate those inputs.
Valuation (NPV)
Basically, governments have a level of ownership of influence over the
extraction of environmental assets, valuation of these assets in monetary
terms may provide useful information for assessing future streams of income
for government. The prices at which assets are bought or sold are the basis of
decisions by investors, producers, consumers and other economic agents.
Ideally, observable market prices should be used to value all assets, and
every item should be valued as if it were being acquired on the date to which
the estimate of the stock relates. These enable the values of different types of
assets and allow the formation of opening and closing values of stocks that
can be used to assess national and institutional sector estimates of wealth in
monetary terms.
The SEEA emphasized that the important consideration in application
of general principles of valuation of environmental assets is to estimate the
value of the asset in situ rather than after its removal. Using the discounted
value of future return or commonly referred to as the Net Present Value (NPV)
which uses projections of the future rate of extraction of the asset, together
with projections of its price, to generate a time series of expected return, the
value of the asset can be determined.

9
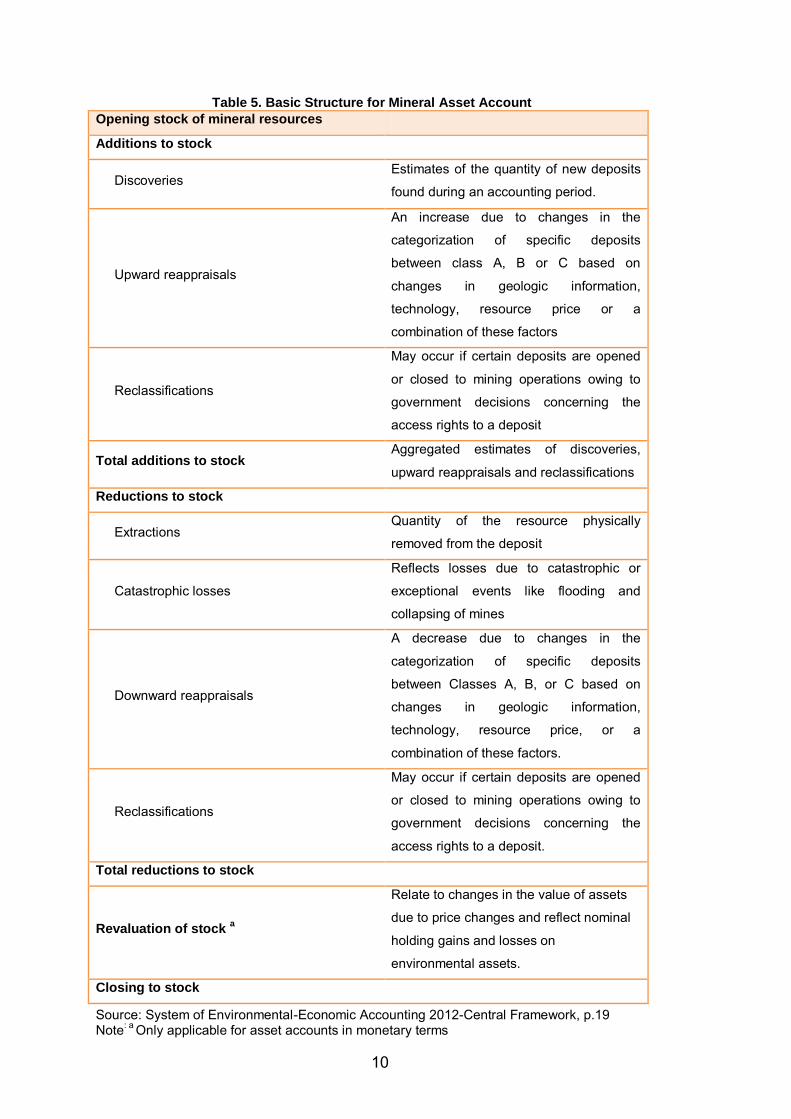
Framework for the Mineral Asset Accounts
The closing and opening stocks were measured following the
estimation of the mineral asset of SEEA Central Framework as shown in
Table 5. It started with the opening stock of the environmental asset and
ended with the closing stock of environmental assets. In physical terms, the
changes between the beginning and the end of the accounting period were
recorded as either additions to the stock or reductions to the stock. In
monetary terms, the same entries are made but an additional entry was
included to record the revaluation of the stock of environmental assets. This
entry accounts for the changes in the value of assets over an accounting
period that is due to movements in the price of the assets or to changes to
assumptions underlying the NPV approaches that are typically used to value
mineral resources.
Source: System of Environmental-Economic Accounting 2012-Central Framework, p.19 Note: a Only applicable for asset accounts in monetary terms
10
Table 5. Basic Structure for Mineral Asset Account
Opening stock of mineral resources
Additions to stock
DiscoveriesEstimates of the quantity of new deposits
found during an accounting period.
Upward reappraisals
An increase due to changes in the
categorization of specific deposits
between class A, B or C based on
changes in geologic information,
technology, resource price or a
combination of these factors
Reclassifications
May occur if certain deposits are opened
or closed to mining operations owing to
government decisions concerning the
access rights to a deposit
Total additions to stock Aggregated estimates of discoveries,
upward reappraisals and reclassifications
Reductions to stock
ExtractionsQuantity of the resource physically
removed from the deposit
Catastrophic losses
Reflects losses due to catastrophic or
exceptional events like flooding and
collapsing of mines
Downward reappraisals
A decrease due to changes in the
categorization of specific deposits
between Classes A, B, or C based on
changes in geologic information,
technology, resource price, or a
combination of these factors.
Reclassifications
May occur if certain deposits are opened
or closed to mining operations owing to
government decisions concerning the
access rights to a deposit.
Total reductions to stock
Revaluation of stock a
Relate to changes in the value of assets
due to price changes and reflect nominal
holding gains and losses on
environmental assets.
Closing to stock
11
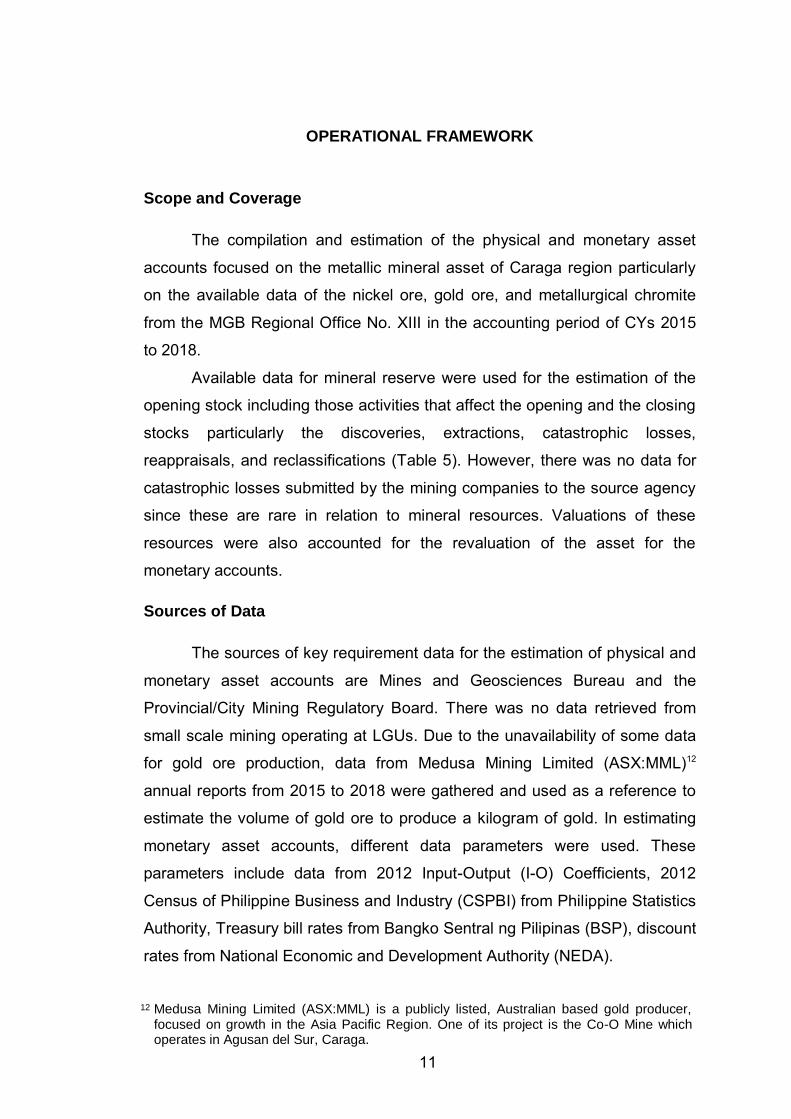
OPERATIONAL FRAMEWORK
Scope and Coverage
The compilation and estimation of the physical and monetary asset
accounts focused on the metallic mineral asset of Caraga region particularly
on the available data of the nickel ore, gold ore, and metallurgical chromite
from the MGB Regional Office No. XIII in the accounting period of CYs 2015
to 2018.
Available data for mineral reserve were used for the estimation of the
opening stock including those activities that affect the opening and the closing
stocks particularly the discoveries, extractions, catastrophic losses,
reappraisals, and reclassifications (Table 5). However, there was no data for
catastrophic losses submitted by the mining companies to the source agency
since these are rare in relation to mineral resources. Valuations of these
resources were also accounted for the revaluation of the asset for the
monetary accounts.
Sources of Data
The sources of key requirement data for the estimation of physical and
monetary asset accounts are Mines and Geosciences Bureau and the
Provincial/City Mining Regulatory Board. There was no data retrieved from
small scale mining operating at LGUs. Due to the unavailability of some data
for gold ore production, data from Medusa Mining Limited (ASX:MML)12
annual reports from 2015 to 2018 were gathered and used as a reference to
estimate the volume of gold ore to produce a kilogram of gold. In estimating
monetary asset accounts, different data parameters were used. These
parameters include data from 2012 Input-Output (I-O) Coefficients, 2012
Census of Philippine Business and Industry (CSPBI) from Philippine Statistics
Authority, Treasury bill rates from Bangko Sentral ng Pilipinas (BSP), discount
rates from National Economic and Development Authority (NEDA).
12 Medusa Mining Limited (ASX:MML) is a publicly listed, Australian based gold producer, focused on growth in the Asia Pacific Region. One of its project is the Co-O Mine which operates in Agusan del Sur, Caraga.

13 See Appendix E Table 20 for Categorization of Mineral Resources
12
Methodology
Physical Asset Account
Data for metallic minerals such as nickel ore, gold ore, and
metallurgical chromite were compiled for the structure of the physical asset
accounts. As recommended in the SEEA-Central Framework 2012, the United
Nations Framework Classification for Fossil Energy and Mineral Reserves and
Resources 2009 (UNFC-2009) was used to determine whether and to what
extent, projects for the extraction and exploration of the resources have been
confirmed, developed or planned.13 The underlying resources were classified
based on the maturity of the project according to the UNFC-2009 criteria
affecting their extraction:
1. Economic and Social Viability (E)
2. Field project status and feasibility (F)
3. Geological knowledge (G)
Known deposits were classified in three classes according to the
criteria derived from the UNFC-2009:
Class A: Commercially recoverable resources (includes the
commercial projects on production, approved for development, and
justified for development);
Class B: Potentially commercially recoverable resources (potentially
commercial projects that include development pending and
development on hold); and
Class C: Non-commercial and other known deposits (development
unclarified and not viable).
The compilation of physical asset accounts denotes the changes in the
opening and closing stocks of mineral resources in the region. Stocks
increased due to discoveries, reclassifications and reappraisals accounted.
Moreover, the decrease in stocks of resources is attributed to the extractions
and downward reappraisals being accounted for.
13
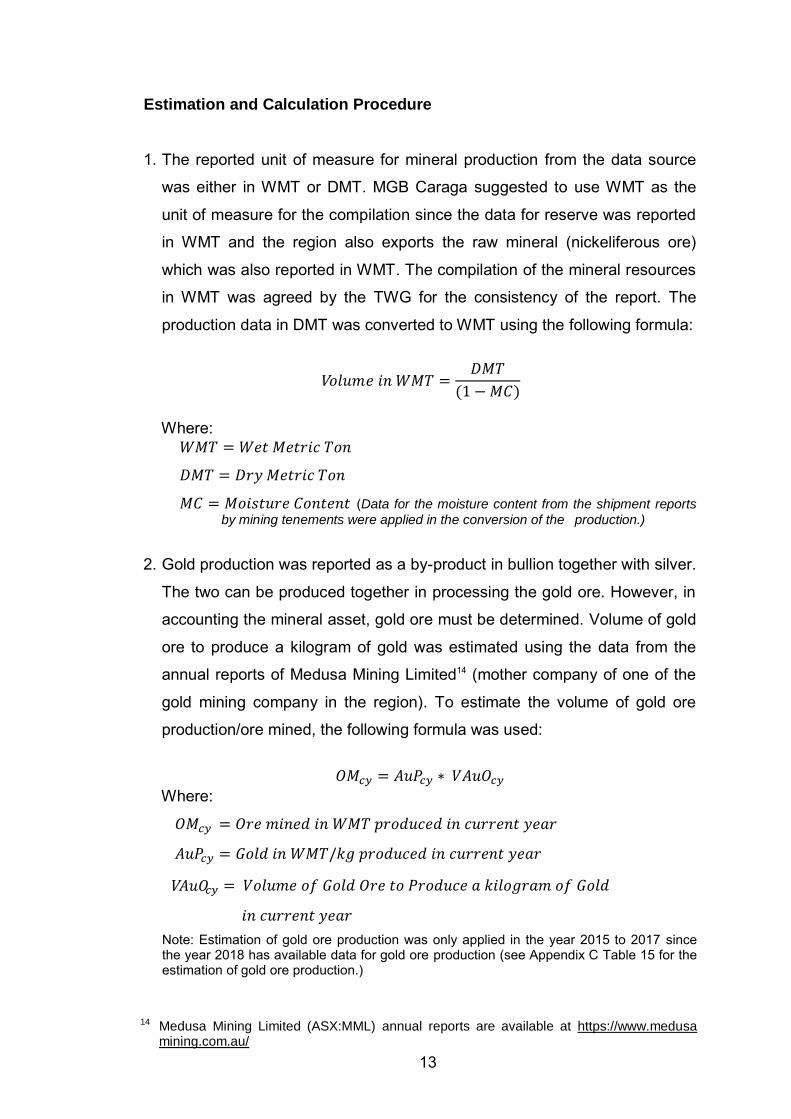
Estimation and Calculation Procedure
1. The reported unit of measure for mineral production from the data source
was either in WMT or DMT. MGB Caraga suggested to use WMT as the
unit of measure for the compilation since the data for reserve was reported
in WMT and the region also exports the raw mineral (nickeliferous ore)
which was also reported in WMT. The compilation of the mineral resources
in WMT was agreed by the TWG for the consistency of the report. The
production data in DMT was converted to WMT using the following formula:
V
Where:
(Data for the moisture content from the shipment reports
by mining tenements were applied in the conversion of the production.)
2. Gold production was reported as a by-product in bullion together with silver.
The two can be produced together in processing the gold ore. However, in
accounting the mineral asset, gold ore must be determined. Volume of gold
ore to produce a kilogram of gold was estimated using the data from the
annual reports of Medusa Mining Limited14 (mother company of one of the
gold mining company in the region). To estimate the volume of gold ore
production/ore mined, the following formula was used:
Where:
Note: Estimation of gold ore production was only applied in the year 2015 to 2017 since the year 2018 has available data for gold ore production (see Appendix C Table 15 for the estimation of gold ore production.)
14 Medusa Mining Limited (ASX:MML) annual reports are available at https://www.medusa mining.com.au/
V

14 Ibid, footnote no. 5
14
3. Opening stock basically revolves around the volume of the ore reserve.
Stock of the asset before the beginning of the accounting period or the
closing stock of the previous year serves as the opening stock for the
succeeding year. However, due to unavailability of some reserves from
the previous years, backtracking and imputation were utilized to estimate
the stock using the following formula:
Where:
4. Discovery is based on the establishment of geological knowledge of the
company. However, data for discovery was not explicitly seen from the
reports of the data source. Date of approval for the Declaration of Mining
Project Feasibility (DMPF) was determined to record the reserve for the
period in which projects have feasibility studies.
5. Reappraisal was estimated by comparing the data on current and
previous reserves after deducting production data for the previous year.
This was obtained through the following formula:
Where:
Note: The obtained results were classified as upward reappraisal (if positive) or downward reappraisal (if negative). Either upward reappraisals (additions) or downward reappraisal (reduction) reflect changes due to the use of updated information that permits a reassessment of the physical size of the stock. The reassessments may also relate to changes in the assessed quality or grade of the natural resource, or changes in the economic viability of extraction (including those due to changes in extraction technology) that are not solely due to changes in the price of the natural resource. The use of updated information may require the revision of estimates for previous periods to ensure a continuity of time series.14
15
5. Data for reclassification was not readily available, however, there are ways
to record using derived indicators. Reserve reclassification was obtained
through the criteria set under the UNFC-2009 classification system. It may
occur if certain deposits are opened or closed to mining operations owing to
government decisions concerning access rights to a deposit. Mineral
reserves that were reclassified to other categories were recorded in the
reclassification.
The reserve was classified to Class B, recorded as reclassification
addition to stock due to the production activity on hold/or where justification
as commercial development may be subject to significant delay for a year.
On the other hand, if the production activity is on hold/or where justification
as commercial development may be subject to significant delay exceeds
one year, the reserve will be classified to Class C.
Monetary Asset Account
Monetary asset account was estimated using the NPV approach. NPV
is the value of an asset determined by estimating the stream of income
expected to be earned in the future, and discounting the future income back to
the present accounting period as defined in the SEEA 2012- Central
Framework. To compute the NPV, the Resource Rent (RR), asset life, and
appropriate discount rate must be determined.
1. Estimation of Resource Rent
Resource rent is the surplus value taken to be returned to the asset life. To
derive the resource rent, data parameters such as Net Operating Surplus
(NOS) and return to produced assets must be determined. It was estimated
using the following;
1.1. NOS was estimated through determining the Gross Output (GO)
and Gross Operating Surplus (GOS).

16
1.1.a. GO is the gross value in PhP reported or by multiplying
the price value to the volume of extraction. This is
expressed through the following equation:
Note: However, data for GO was also reported in the production report of MGB which corresponds to the volume of production.
1.1.b. To derive the GOS, operating cost is deducted from GO;
i.e.,
Where:
GOS = Gross Operating Surplus (in PhP)
GO = Gross Output (in PhP)
1.1.c. NOS was determined by deducting the Consumption of
Fixed Capital from the GOS.
Where:
NOS = Net Operating Surplus (in PhP)
GOS = Gross Operating Surplus (in PhP)
CFC = Consumption of Fixed Capital (in PhP)
1.2. To estimate the return to produce assets, different data
parameters should be determined. These include the ratio of
book value to revenue, value of produced assets, and T-bill rates.
1.2.a. Ratio of Book Value to Revenue was expressed through
the following:
Note: Book value of fixed capital and revenue was derived from the 2012 Census of Philippine Business and Industry (CSPBI) for mining and quarrying industry in the region as a base year.

17
1.2.b. After obtaining the ratio of book value to revenue, the value of
produced assets was then estimated through the following
formula:
Va a
1.2.c. To estimate the return to produce assets, the following equation
was expressed:
Va a
T-bill rate is the rate on short‐term debt instruments issued by the
National Government (NG) for the purpose of generating funds needed to
finance outstanding obligations.15 The data for the T-bills were from the official
data of the BSP website for the year 2015 to 2018 in all maturities.
1.1. Estimation of the resource rent (in PhP) was calculated through the
following formula:
Where:
NOS = Net Operating Surplus
IE = Interest Expense
2. Asset life for nickel ore, gold ore, and metallurgical chromite reserve were
determined through dividing the closing stock of the given year by the actual
extraction. The calculation is presented in the following formula:
15 Department of Economic Research/Department of Economic Statistics. FAQ Interest Rates, page 6.available at bsp.gov.ph/downloads/Publications/FAQs/intrates.pdf

16 Formula was from UN SEEA Central Framework- 2012
18
3. Estimation of Resource Value using NPV
To come up at a resource value, the derived RR was discounted using the
NPV and discount rate of 10 percent from the updated social discount rate
of the Philippines and as per agreed with the TWG.
Resource Value (RV) was then computed using NPV through the
following formula.16
∑
Where:
Vt= value of the asset of time t
N = asset life
RR = resource rent
R = nominal discount rate
The computed resource value in a given period is the resulting value
for the reserve at respective discount rates. The unit of resource value in
every period was applied respectively by multiplying the unit of resource
value to the changes to stocks. The unit of resource value was obtained
through the following:

19
Revaluation in every period was determined through the following
formula:
Where:
CS = Closing Stock
OS = Opening Stock
AS = Addition to Stock
RS = Reduction to Stock
The value of the closing stock for the monetary asset account can also
be determined and counterchecked through the following:

20

21
RESULTS AND DISCUSSIONS
Physical Asset Accounts
The mineral reserves of Caraga for nickel ore, gold ore, and
metallurgical chromite were estimated from CYs 2015 to 2018 based on the
information available at the time of estimation. Backtracking and imputation
were utilized to estimate the stocks due to unavailability of some data for
mineral reserves. These were classified as Class A, Class B, and Class C
according to the criteria recommended by the 2012 SEEA Central Framework.
A. Nickel Ore
The stocks of nickel ore reserve from 2015 to 2018 exhibited a
fluctuating trend as shown in Figure 1. In 2015, the opening stock of nickel ore
reserve in the region was estimated at 509.37 million WMT. At the end of
2015, it posted a closing stock of 473.66 million WMT. The decrease of the
reserve was due to the higher extraction of nickel ore compared to additions
to stock.
Figure 1. Stock of Nickel Ore Reserve, Caraga: 2015-2018 (in Million Wet Metric Ton)
473.7 476.0
539.0
476.2
2015 2016 2017 2018
in M
illion W
et M
etr
ic T
on
22
From 2015 to 2018, nickel ore reserve in 2015 was considered as the
lowest estimated reserve. It slightly increased to 476.03 million WMT in 2016
due to the addition to stocks. Moreover, reserve in 2017 recorded the highest
with 538.97 million WMT. The increase in the reserve was mainly attributed to
upward reappraisals. In 2018, the estimated volume of nickel ore reserve in
Caraga posted at 476.18 million WMT. (Figure 1)
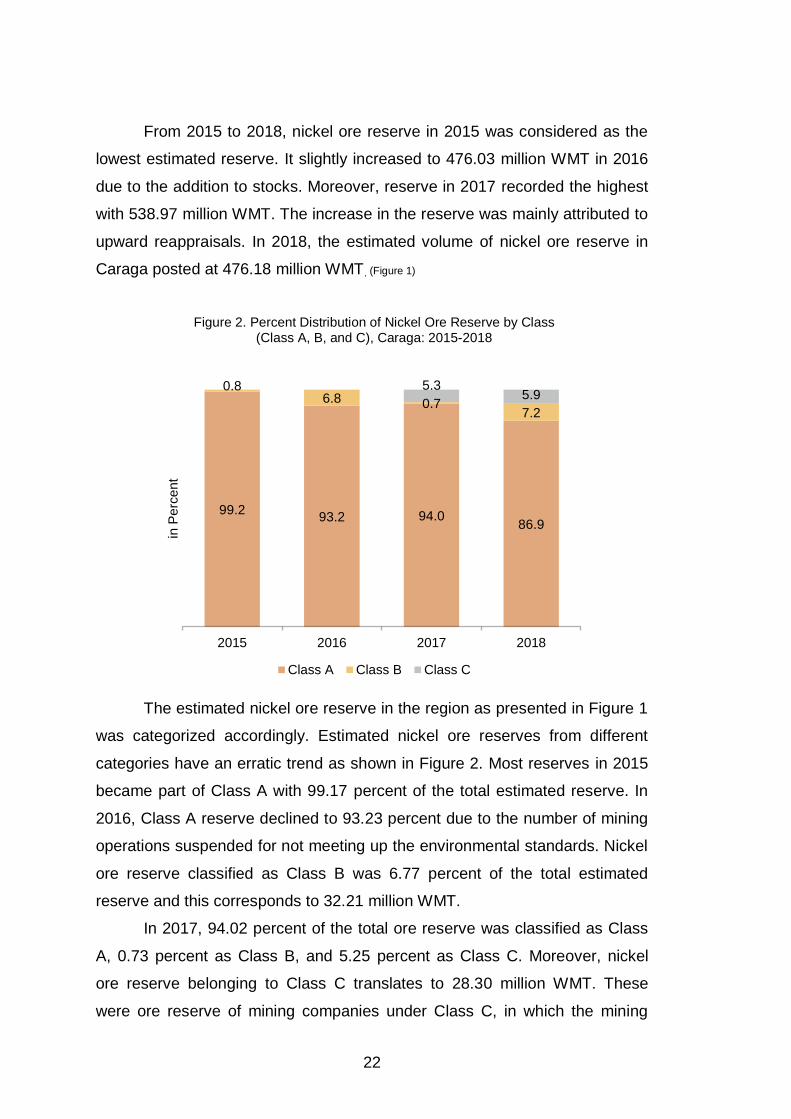
Figure 2. Percent Distribution of Nickel Ore Reserve by Class (Class A, B, and C), Caraga: 2015-2018
The estimated nickel ore reserve in the region as presented in Figure 1
was categorized accordingly. Estimated nickel ore reserves from different
categories have an erratic trend as shown in Figure 2. Most reserves in 2015
became part of Class A with 99.17 percent of the total estimated reserve. In
2016, Class A reserve declined to 93.23 percent due to the number of mining
operations suspended for not meeting up the environmental standards. Nickel
ore reserve classified as Class B was 6.77 percent of the total estimated
reserve and this corresponds to 32.21 million WMT.
In 2017, 94.02 percent of the total ore reserve was classified as Class
A, 0.73 percent as Class B, and 5.25 percent as Class C. Moreover, nickel
ore reserve belonging to Class C translates to 28.30 million WMT. These
were ore reserve of mining companies under Class C, in which the mining
99.2 93.2 94.0
86.9
0.8 6.8 0.7
7.2
5.3 5.9
2015 2016 2017 2018
in P
erc
en
t
Class A Class B Class C

23
activities specifically mining production were on hold and/or where justification
as commercial development may be subject to significant delay.
Class A nickel ore reserve dropped to 86.90 percent of the total
reserve in 2018. Other categories were recorded at 7.16 percent as Class B
or equivalent to 34.10 million WMT and 5.94 percent as Class C or 28.3
million WMT. (Tables 6b and 6c, and Figure 2)
Figure 3. Stock, Additions and Reductions to Stock of Class A Nickel Ore Reserve, Caraga: 2015-2018 (in Million Wet Metric Ton)
Stock of Class A nickel ore shows a fluctuating trend owing to the
accounted changes of stocks (additions and reductions to stocks) from 2015
to 2018. Nickel ore reserve in 2015 was estimated at 469.75 million WMT and
slightly declined to 443.82 million WMT in 2016. Moreover, 2017 recorded the
highest reserve of 506.75 million WMT and fell off to 413.78 million WMT in
2018. This was the least estimated closing stock for the whole accounting
period.
The mineral reserve increased due to the discoveries, upward
reappraisals, and reclassifications. The discovery of 10.85 million WMT was
recorded in 2015. Although no reported discoveries in succeeding years,
reserves increased most likely because of the upward reappraisals and
reclassifications. The estimated reappraisal in 2016 was 39.71 million WMT
and spiked to 95.91 million WMT in 2017. In 2018, reappraisal was recorded
at 25.37 million WMT. There were no reported reclassified reserves from
10.8 39.7
95.9
29.3 50.5
65.6 33.0
122.3
469.7 443.8
506.8
413.8
2015 2016 2017 2018
in M
illio
n W
et M
etr
ic T
on
Additions to Stock Reductions to Stock Stock

24
other category (Class B) in 2015, 2016, and 2017. However, a reclassified
reserve of 3.91 million WMT in 2018 contributed to the growth of the Class A
reserve which totaled to 29.3 million WMT in addition to stock. (Table 6, and Figure 3)
Table 6. Physical Asset Account for Nickel Ore Class A, Caraga: 2015-2018 (in Million Wet Metric Ton) 2015 2016 2017 2018
Opening stock 509.37 469.75 443.82 506.75
Additions to stock Discoveries 10.85 - - -
Upward reappraisals - 39.71 95.91 25.37
Reclassifications - - - 3.91
Total additions to stock 10.85 39.71 95.91 29.28
Reductions to stock Extractions 46.56 36.43 32.90 30.81
Catastrophic losses - - - -
Downward reappraisals - 0.91 0.07 57.57
Reclassifications 3.91 28.30 - 33.87
Total reductions to stock 50.47 65.64 32.97 122.25
Closing stock 469.75 443.82 506.75 413.78 Note: "-" Denotes no recorded data Philippine Statistics Authority Caraga Estimation
The decline of stocks was mainly because of the extractions of nickel
ore reserve, downward reappraisals and reclassified reserves. The extraction
of nickel ore had a decreasing trend from 46.56 million WMT in 2015, 36.43
million WMT in 2016, 32.90 million WMT in 2017, and 30.81 million WMT in
2018. However, not all extracted nickel ore were directly sold. Some of those
were stockpiled due to cut off grade and low metal price. Furthermore,
downward reappraisals also affect the decline of the reserve. In 2015, there
was no recorded downward reappraisal. However, in 2016 it was estimated at
0.91 million WMT and declined to 0.07 million WMT in 2017. In 2018, an
estimated downward reappraisal was recorded at 57.57 million WMT.
Furthermore, nickel ore reserve from Class A reclassified to Class B also
contributed to the decline of the closing stock annually. In 2015, 3.91 million
WMT was reclassified to other category and 28.30 million WMT in 2016.
There was no recorded reclassified reserve in 2017, however, 33.87 million
WMT was reclassified in 2018. The total estimated reduction to stocks varies
from the year 2015 to 2018. The year 2018 has the highest reduction to stock

25
with 122.25 million WMT. On the other hand, the lowest estimated reduction
to stock was recorded in 2017 with 32.97 million WMT. (Table 6, and Figure 3)
Table 7. Estimated Asset Life of Class A Nickel Ore Reserve, Caraga: 2015-2018
Year Total Reserve
(in million WMT) Extraction
(in million WMT) Asset Life (in Years)
2015 469.75 46.56 10.09 2016 443.82 36.43 12.18 2017 506.75 32.90 15.40 2018 413.78 30.81 13.43
Source: Philippine Statistics Authority-Caraga
With the estimated volume of reserve and extraction in the respective
years, the asset life of mineral reserve was determined. The asset life of
nickel ore in 2015 was projected to last for 10.09 years as shown in Table 7.
In 2017, the estimated mine life was 15.40 years which was considered as the
longest asset life from 2015 to 2018. The increase of its mine life was
attributed to a higher estimated volume of stock and a decline in extraction. In
addition, the estimated average length of time before the nickel ore reserves
will be exhausted was 12.78 years. (Table 7)
B. Gold Ore
Figure 4. Stock of Gold Ore Reserve, Caraga: 2015-2018 (in Million Wet Metric Ton)
3.9
3.1 3.0
3.3
2015 2016 2017 2018
in M
illio
n W
et M
etr
ic T
on

26
As shown in Figure 4, the volume of reserve posted a fluctuating trend
from 2015 to 2018. In 2015, the reserve was estimated at 3.91 million WMT
which recorded as the highest gold ore reserve. The extraction of the gold ore
diminished the reserve which was also the reason of the decline of the
estimated reserve in 2016 with 3.05 million WMT. In 2017, the region held an
estimated gold ore reserve of 3.04 million WMT. As of 2018, the estimated
gold ore reserve increased which posted 3.30 million WMT. The increase of
the volume of the gold ore reserve was due to the decrease in estimated
reductions to stock particularly extraction and increase addition to stock.
(Figure 4)
Figure 5. Percent Distribution of Gold Ore Reserve by Class (Class A and Class B), Caraga: 2015-2018
Gold ore reserve contribution of Class A and Class B during the
accounting period 2015 to 2018 is shown in Figure 5. Based on the available
information, a hundred percent of gold ore reserve was categorized as Class
A from 2015 to 2017. In 2018, half of the total reserve was under Class A and
the other half was Class B. (Table 8b, and Figure 5)
100.0 100.0 100.0
50.0
50.0
2015 2016 2017 2018
in P
erc
en
t
Class A Class B
27
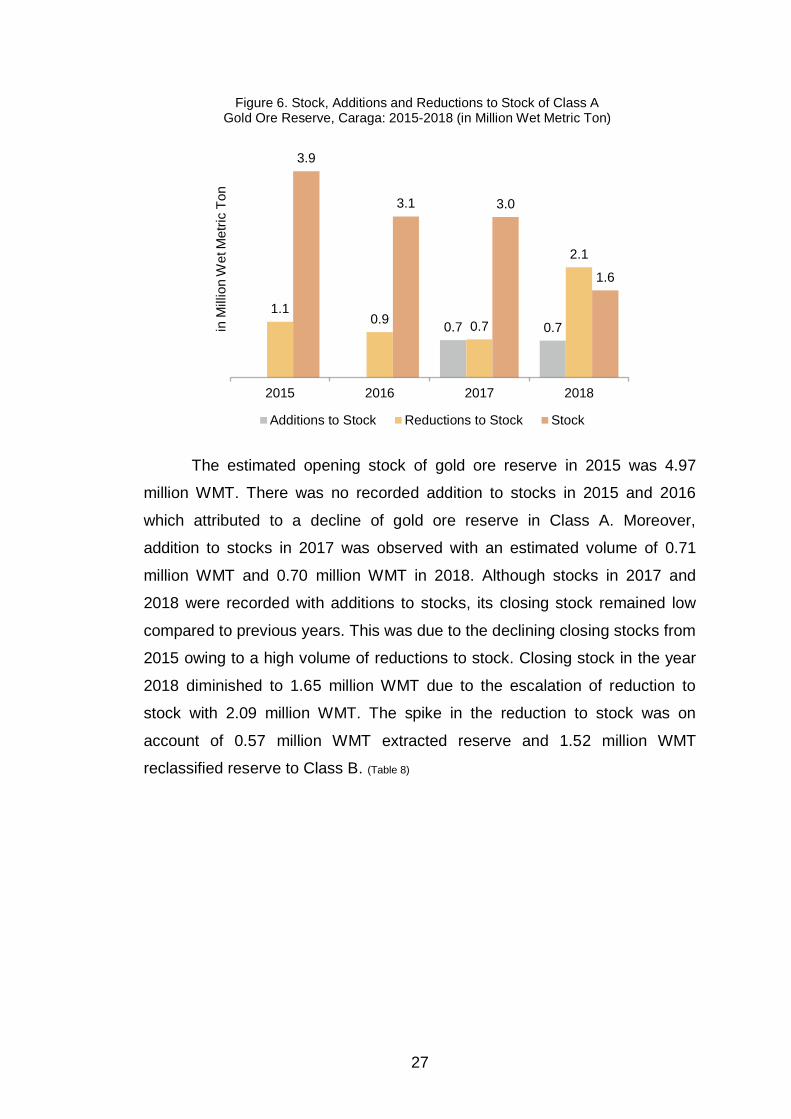
Figure 6. Stock, Additions and Reductions to Stock of Class A Gold Ore Reserve, Caraga: 2015-2018 (in Million Wet Metric Ton)
The estimated opening stock of gold ore reserve in 2015 was 4.97
million WMT. There was no recorded addition to stocks in 2015 and 2016
which attributed to a decline of gold ore reserve in Class A. Moreover,
addition to stocks in 2017 was observed with an estimated volume of 0.71
million WMT and 0.70 million WMT in 2018. Although stocks in 2017 and
2018 were recorded with additions to stocks, its closing stock remained low
compared to previous years. This was due to the declining closing stocks from
2015 owing to a high volume of reductions to stock. Closing stock in the year
2018 diminished to 1.65 million WMT due to the escalation of reduction to
stock with 2.09 million WMT. The spike in the reduction to stock was on
account of 0.57 million WMT extracted reserve and 1.52 million WMT
reclassified reserve to Class B. (Table 8)
0.7 0.7
1.1 0.9
0.7
2.1
3.9
3.1 3.0
1.6
2015 2016 2017 2018
in M
illio
n W
et M
etr
ic T
on
Additions to Stock Reductions to Stock Stock

28
Table 8. Physical Asset Account for Gold Ore Class A, Caraga: 2015-2018 (in Million Wet Metric Ton) 2015 2016 2017 2018
Opening stock 4.97 3.91 3.05 3.04 Additions to stock Discoveries - - - - Upward reappraisals - - 0.71 0.70 Reclassifications - - - - Total additions to stock - - 0.71 0.70 Reductions to stock Extractions 1.05 0.86 0.72 0.57 Catastrophic losses - - - - Downward reappraisals - - - - Reclassifications - - - 1.52 Total reductions to stock 1.05 0.86 0.72 2.09 Closing stock 3.91 3.05 3.04 1.65 Note: "-" Denotes no recorded data Philippine Statistics Authority Caraga Estimation
Table 9 shows the projected asset life of gold ore reserve from 2015 to
2018. The estimated economically exploitable reserves are not very large and
production has been declining. The gold reserve was sufficient until 4 years
between the years 2015 to 2017. Moreover, asset life of 2.89 years for the
2018 reserve was estimated before it is depleted. On average, it was
forecasted that the gold ore reserve would last for 3.60 years unless no new
reserve converted economically which could extend the life of the reserves
further. (Table 9)
Table 9. Estimated Asset Life of Class A Gold Ore Reserve, Caraga: 2015-2018
Year Total Reserve
(in million WMT) Extraction
(in million WMT) Asset Life (in Years)
2015 3.91 1.05 3.72 2016 3.05 0.86 3.55 2017 3.04 0.72 4.22 2018 1.65 0.57 2.89
Source: Philippine Statistics Authority-Caraga

29
C. Metallurgical Chromite
Figure 7. Stock of Metallurgical Chromite Reserve, Caraga: 2015-2018 (in Million Wet Metric Ton)
Metallurgical chromite reserve in the region was estimated at 0.57 million
WMT in 2015 and 2016. In 2017, the reserve increased to 5.51 million WMT
due to the increase upward reappraisal of the known reserve based on the
geologic information. However, the recorded metallurgical chromite reserve in
the region in 2018 drastically fell to 0.31 million although there was no
extraction activity that could diminish the volume of economically mineable
mineral. (Figure 7)
0.6 0.6
5.5
0.3
2015 2016 2017 2018
in M
illio
n W
et M
etr
ic T
on
30
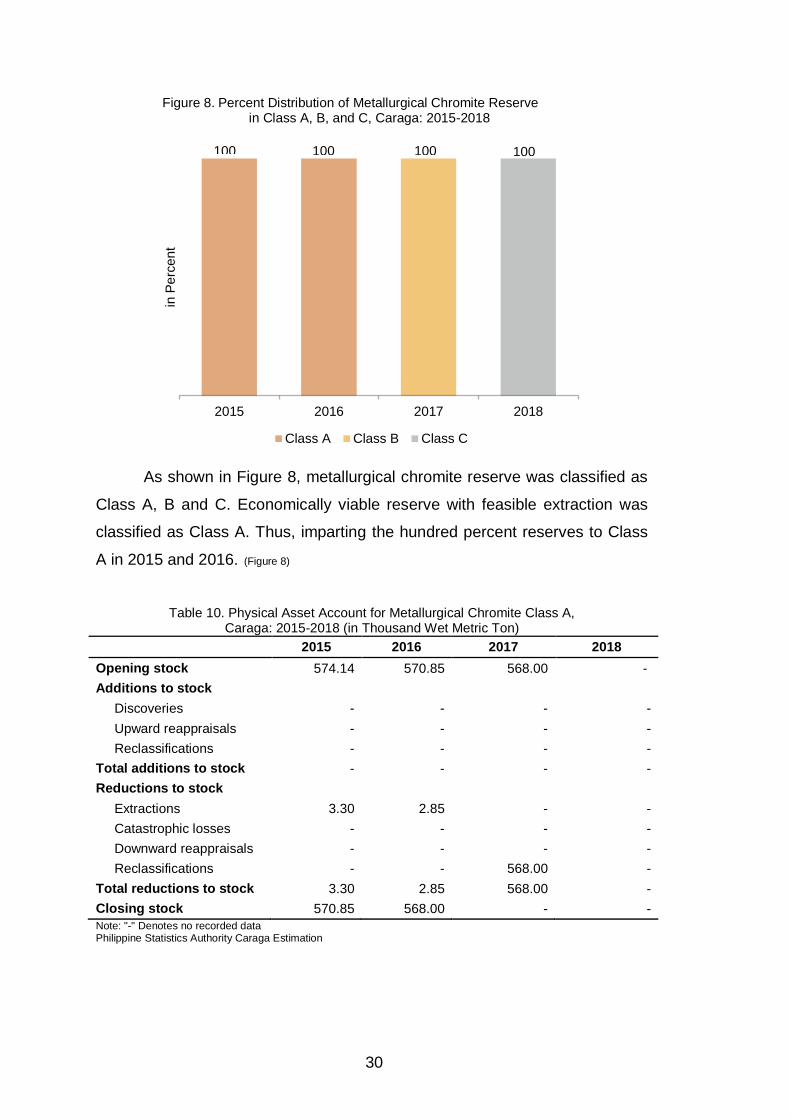
Figure 8. Percent Distribution of Metallurgical Chromite Reserve in Class A, B, and C, Caraga: 2015-2018
As shown in Figure 8, metallurgical chromite reserve was classified as
Class A, B and C. Economically viable reserve with feasible extraction was
classified as Class A. Thus, imparting the hundred percent reserves to Class
A in 2015 and 2016. (Figure 8)
Table 10. Physical Asset Account for Metallurgical Chromite Class A, Caraga: 2015-2018 (in Thousand Wet Metric Ton)
2015 2016 2017 2018
Opening stock 574.14 570.85 568.00 -
Additions to stock
Discoveries - - - -
Upward reappraisals - - - -
Reclassifications - - - -
Total additions to stock - - - -
Reductions to stock
Extractions 3.30 2.85 - -
Catastrophic losses - - - -
Downward reappraisals - - - -
Reclassifications - - 568.00 -
Total reductions to stock 3.30 2.85 568.00 -
Closing stock 570.85 568.00 - -
Note: "-" Denotes no recorded data Philippine Statistics Authority Caraga Estimation
2015 2016 2017 2018
in P
erc
en
t
Class A Class B Class C
100 100 100 100

31
Closing stock of 568.00 thousand WMT in 2016 was reclassified to
Class B on the grounds of project activity on hold by virtue of not meeting up
the environmental standards imposed by the regime. Whereas, 4.94 million
WMT estimated reserve in 2017 was recorded as upward reappraisal hence
summing up the 2017 Class B reserve to 5.51 million WMT. In pursuant with
the SEEA Central Framework, closing stock in 2017 was reclassified to Class
C since the reserve is not commercially viable due to the activity on hold for
more than a year. In addition, a reserve of 5.19 million WMT was estimated as
a downward reappraisal in 2018 Class C based on the geological information.
In 2018, the region recorded 0.31 million WMT Class C metallurgical
chromite. (Tables 10, 10a, and 10b)
Figure 9. Stock and Reductions to Stock of Class A Metallurgical Chromite Reserve, Caraga: 2015-2018 (in Thousand Wet Metric Ton)
Figure 9 shows that the stock and reductions to stock of Class A
metallurgical chromite reserve had a declining trend. There was no recorded
additions to stock that would increase the volume of reserve in 2015 and
2016. Thus, closing stock decreases as reductions to stock increases.
Opening stock for the accounting period was estimated at 574.14 thousand
WMT and decreased to 570.8 thousand due to the reduction to stock with
3.3 2.8
570.8 568.0
2015 2016 2017 2018
in T
ho
usa
nd
We
t M
etr
ic T
on
Reductions to Stock Stock

32
3.30 thousand WMT in 2015. In 2016, the stock for Class A metallurgical
chromite was extracted with 2.85 thousand WMT which denotes a decline of
reserve to 568.00 thousand WMT. (Table 10, and Figure 9)
Table 11. Estimated Asset Life of Class A Metallurgical Chromite Reserve, Caraga: 2015-2018
Year Total Reserve
(in WMT) Extraction (in WMT)
Asset Life (in Years)
2015 570.85 3.30 173.16 2016 568.00 2.85 199.46 2017 - - - 2018 - - -
Note: (-) denotes reclassified reserve Source: Philippine Statistics Authority-Caraga
The estimated mine life of metallurgical chromite shows an increasing
behavior as presented in the table above. Reserve for the year 2015 was
projected to last 173.16 years. On the other hand, it would take 199.46 years
before the reserve in 2016 will be depleted. However, asset life used in the
estimation of the monetary asset account was 50 years in 2015 and 11 years
in 2016. This was estimated using its ratio. This is also in accordance with the
MPSA that shall have a term of 25 years from effective date. (Table 11)
Monetary Asset Accounts
The economic value of a mineral resource is measured by resource rent.
This is the economic return above the return needed to be earned from the
production of a mineral and the costs of extracting the mineral. Resource rent
from mining industry can be also categorize into differential rent, scarcity rent
and entrepreneurial rent depending on the situation of certain mining
company. However, these three categories may exist at once or its
combination. Differential rent refers to the excess profit that may arise owing
to differences in the quality of the land.17
Hayes, Adam. (2019, August). Economic Rent. Retrieved from https://www.investopedia. com/terms/e/economicrent.asp
17

18 Department of Economic Research/Department of Economic Statistics. FAQ Interest Rates, page 9.available at bsp.gov.ph/downloads/Publications/FAQs/intrates.pdf
19 See T-bill rate definition with footnote no. 15
33
Resource rent has been estimated for minerals such as nickel ore, gold
ore, and metallurgical chromite in the region from 2015 to 2018 in which
available data from national accounts, Central Office-MGB, and regional MGB
were the basis. The estimation of monetary asset accounts for mineral
resources was only for reserves classified in Class A.
Figure 10. Resource Rent by Mineral Commodity, Caraga: 2015-2018 (in Billion Pesos)
Note: (*) denotes in million pesos
As presented in Figure 10, resource rent by mineral commodity has
distinct trends. Nickel ore has the highest rent to the environment
notwithstanding the depletion of 15.33 billion PhP resource rent in 2015 to
0.79 billion PhP in 2018. The sharp fall in 2018 was due to the increase of
T-bill rate as a result of policy rate hikes by the BSP and the US Federal
Reserve as reported by the Department of Economic Research/Department of
Economic Statistics,18 and to insure investment to finance the government
projects as per definition of the T-bill19
15.3
10.0
7.5
0.8
3.0 3.4
2.0 1.0
0.0* 0.0*
2015 2016 2017 2018
in B
illion
Pe
so
s
Nickel Ore Gold Ore Metallurgical Chromite

34
This can also indemnify which can be recovered by the government
through appropriate taxes of the mining industry as a rent for mining the
environment as discussed in RA 7942. (Table 19, and Figure 10)
On the other hand, resource rent of gold ore was volatile which
generated at 2.97 billion PhP in 2015. The rent climbed to 3.39 billion PhP in
2016 and decline to 2.03 billion PhP in 2017. It declined further to 1.04 billion
PhP in 2018. In addition, metallurgical chromite has the lowest contribution to
the economy in terms of rent to the environment. Its estimated resource rent
escalated from 0.67 million PhP to 5.63 million PhP. (Figure 10)
Figure 11. Valuation of Nickel Ore Asset at 10 Percent Discount Rate, Caraga: 2015-2018 (in Billion Pesos)
The monetary behavior of nickel ore at respective discount rates shows
a decreasing trend. At a 10 percent discount rate, a unit of resource value of
200.47 PhP per WMT was computed which amounted to 94.17 billion PhP of
nickel ore reserve in 2015. The value of reserve in 2016 declined to 68.35
billion PhP which was quoted with 154.01 PhP of nickel ore per WMT. At a
resource value of 112.61 PhP per WMT of nickel ore in 2017, it was estimated
to generate 57.07 billion PhP. However, the price dropped to 13.59 PhP per
WMT of nickel ore in 2018 at 10 percent discount rate which translated to 5.63
billion PhP. (Table 12, and Figure 11)
94.2
68.4
57.1
5.6
2015 2016 2017 2018
in B
illion
Pe
so
s

35
Figure 12. Valuation of Gold Ore Asset at 10 Percent Discount Rate, Caraga: 2015-2018 (in Billion Pesos)
The estimated value of unexploited gold ore from the respected periods
exhibited an erratic trend at different 10 percent discount rate. This discount
rate was applied to project the rationalize income in valuing the future benefits
and the present cost.
In 2015, gold ore was valued at 2,403.44 PhP per WMT which posted
9.40 billion PhP at a 10 percent discount rate. The highest approximated
value of gold ore was 10.74 billion PhP which was quoted at 3,516.51 PhP
per WMT in 2016. The value of gold ore decreased to 6.43 billion PhP in
2017 with a rate of 2,115.52 PhP per WMT. In 2018, the value declined to
2.60 billion PhP at 1,575.64 PhP per WMT of gold ore. (Table 13, and Figure 12)
Among the respected years at 10 percent discount rate, the year 2016
had the highest estimated price of gold ore per WMT which shows a positive
recorded revaluation. This reflects a gain on the mineral asset as a result of
an increased change in its price over an accounting period. However, the
years 2015, 2017, and 2018 had a negative revaluation due to the decline in
the estimated price of gold ore over an accounting period. (Table 13)
9.4
10.7
6.4
2.6
2015 2016 2017 2018
in B
illion
Pe
so
s
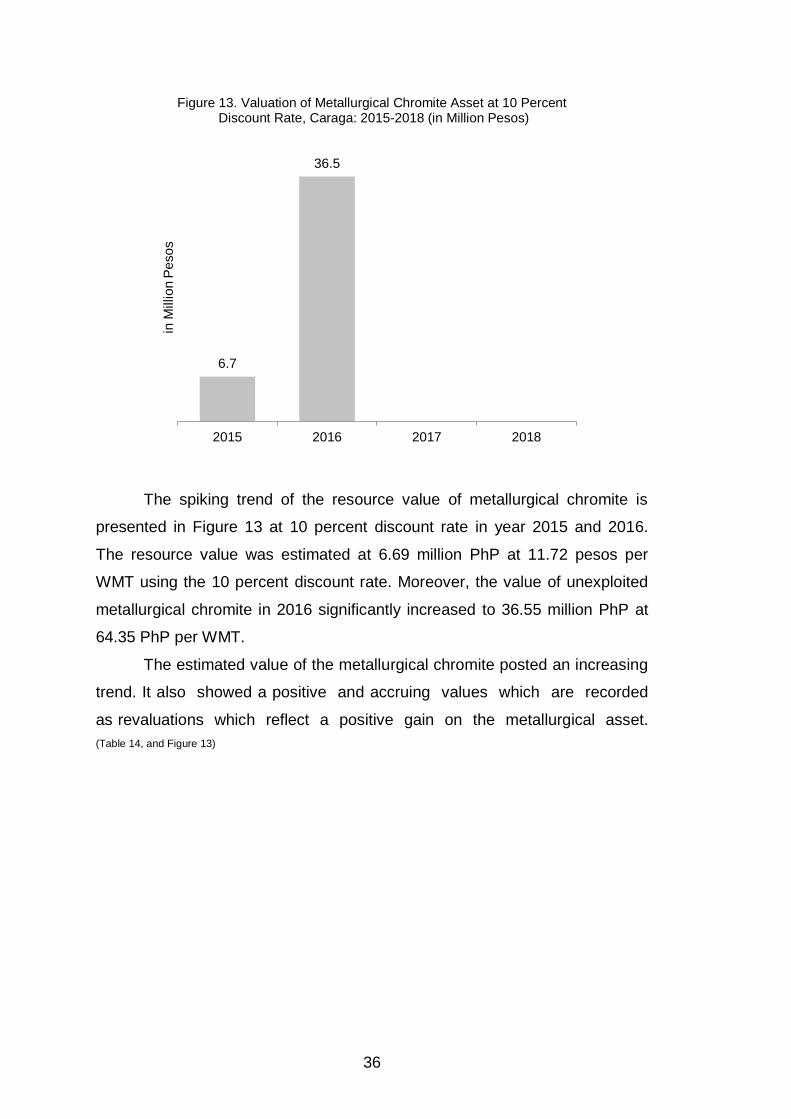
36
Figure 13. Valuation of Metallurgical Chromite Asset at 10 Percent Discount Rate, Caraga: 2015-2018 (in Million Pesos)
The spiking trend of the resource value of metallurgical chromite is
presented in Figure 13 at 10 percent discount rate in year 2015 and 2016.
The resource value was estimated at 6.69 million PhP at 11.72 pesos per
WMT using the 10 percent discount rate. Moreover, the value of unexploited
metallurgical chromite in 2016 significantly increased to 36.55 million PhP at
64.35 PhP per WMT.
The estimated value of the metallurgical chromite posted an increasing
trend. It also showed a positive and accruing values which are recorded
as revaluations which reflect a positive gain on the metallurgical asset.
(Table 14, and Figure 13)
6.7
36.5
2015 2016 2017 2018
in M
illio
n P
eso
s

37
WAYS FORWARD IN IMPROVING THE DATA SUPPORT AND ESTIMATION
1) Update the accounting of the mineral asset to measure and monitor the
environmental economic asset of the region;
2) Enhance and organize systematic database from the data sources for
a more complete and accurate data/information to obtain reliable
statistics of the mineral asset accounting;
3) Encourage active participation of LGU and the mining establishments
especially in the submission of data/information.

38

39
APPENDICES
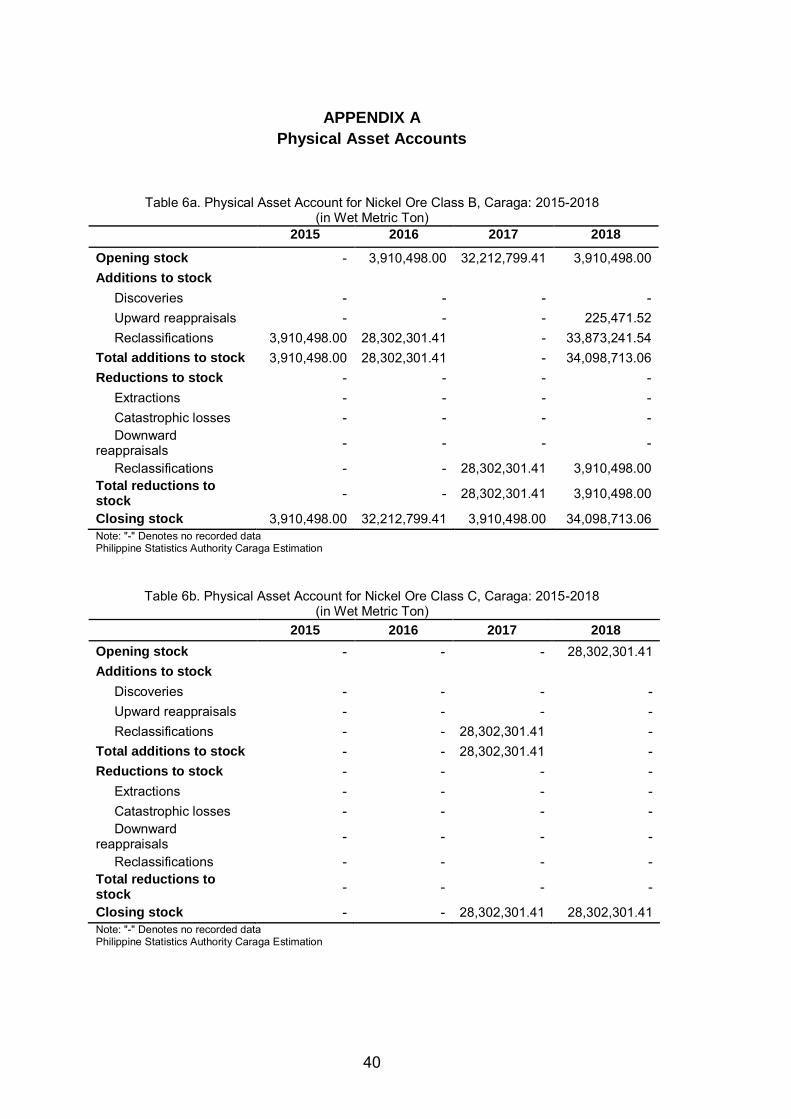
40
APPENDIX A
Physical Asset Accounts
Table 6a. Physical Asset Account for Nickel Ore Class B, Caraga: 2015-2018 (in Wet Metric Ton)
2015 2016 2017 2018
Opening stock - 3,910,498.00 32,212,799.41 3,910,498.00 Additions to stock
Discoveries - - - - Upward reappraisals - - - 225,471.52 Reclassifications 3,910,498.00 28,302,301.41 - 33,873,241.54 Total additions to stock 3,910,498.00 28,302,301.41 - 34,098,713.06 Reductions to stock - - - - Extractions - - - - Catastrophic losses - - - - Downward reappraisals - - - -
Reclassifications - - 28,302,301.41 3,910,498.00 Total reductions to stock
- - 28,302,301.41 3,910,498.00
Closing stock 3,910,498.00 32,212,799.41 3,910,498.00 34,098,713.06 Note: "-" Denotes no recorded data Philippine Statistics Authority Caraga Estimation
Table 6b. Physical Asset Account for Nickel Ore Class C, Caraga: 2015-2018 (in Wet Metric Ton)
2015 2016 2017 2018
Opening stock - - - 28,302,301.41 Additions to stock
Discoveries - - - - Upward reappraisals - - - - Reclassifications - - 28,302,301.41 - Total additions to stock - - 28,302,301.41 - Reductions to stock - - - - Extractions - - - - Catastrophic losses - - - - Downward reappraisals - - - -
Reclassifications - - - - Total reductions to stock
- - - -
Closing stock - - 28,302,301.41 28,302,301.41 Note: "-" Denotes no recorded data Philippine Statistics Authority Caraga Estimation

41
Table 8a. Physical Asset Account for Gold Ore Class B, Caraga: 2015-2018 (in Wet Metric Ton)
2015 2016 2017 2018
Opening stock - - - - Additions to stock
Discoveries - - - - Upward reappraisals - - - 128,757.42 Reclassifications - - - 1,520,000.00 Total additions to stock - - - 1,648,757.42 Reductions to stock
Extractions - - - - Catastrophic losses - - - - Downward reappraisals - - - -
Reclassifications - - - - Total reductions to stock
- - - -
Closing stock - - - 1,648,757.42 Note: "-" Denotes no recorded data Philippine Statistics Authority Caraga Estimation
Table 10a. Physical Asset Account for Metallurgical Chromite Class B, Caraga: 2015-2018 (in Wet Metric Ton)
2015 2016 2017 2018
Opening stock - - - 5,507,966.00 Additions to stock
Discoveries - - - - Upward reappraisals - - 4,939,966.00 - Reclassifications - - 568,000.00 - Total additions to stock - - 5,507,966.00 - Reductions to stock
Extractions - - - - Catastrophic losses - - - - Downward reappraisals - - - - Reclassifications - - - 5,507,966.00 Total reductions to stock - - - 5,507,966.00 Closing stock - - 5,507,966.00 - Note: "-" Denotes no recorded data Philippine Statistics Authority Caraga Estimation

42
Table 10b. Physical Asset Account for Metallurgical Chromite Class C, Caraga: 2015-2018 (in Wet Metric Ton)
2015 2016 2017 2018
Opening stock - - - - Additions to stock
Discoveries - - - - Upward reappraisals - - - - Reclassifications - - - 5,507,966.00 Total additions to stock - - - 5,507,966.00 Reductions to stock
Extractions - - - - Catastrophic losses - - - - Downward reappraisals - - - 5,194,566.00 Reclassifications - - - - Total reductions to stock - - - 5,194,566.00 Closing stock - - - 313,400.00 Note: "-" Denotes no recorded data Philippine Statistics Authority Caraga Estimation
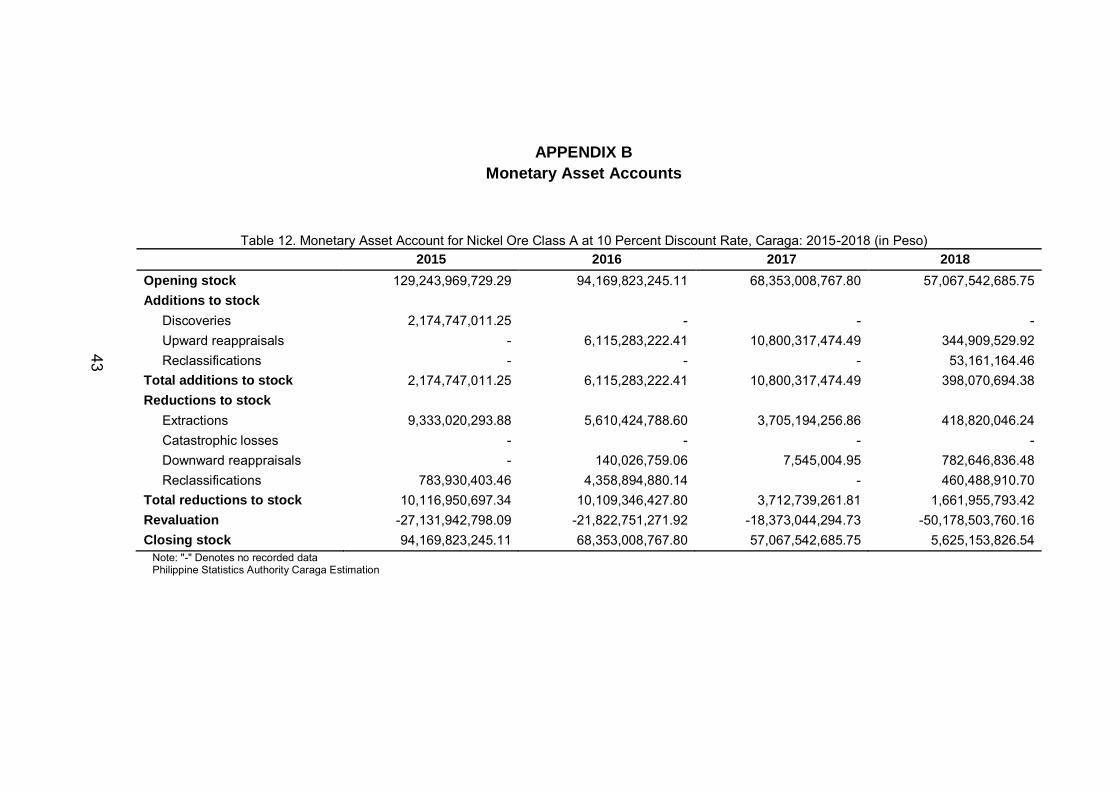
52
APPENDIX B Monetary Asset Accounts
Table 12. Monetary Asset Account for Nickel Ore Class A at 10 Percent Discount Rate, Caraga: 2015-2018 (in Peso) 2015 2016 2017 2018 Opening stock 129,243,969,729.29 94,169,823,245.11 68,353,008,767.80 57,067,542,685.75 Additions to stock Discoveries 2,174,747,011.25 - - - Upward reappraisals - 6,115,283,222.41 10,800,317,474.49 344,909,529.92 Reclassifications - - - 53,161,164.46 Total additions to stock 2,174,747,011.25 6,115,283,222.41 10,800,317,474.49 398,070,694.38 Reductions to stock Extractions 9,333,020,293.88 5,610,424,788.60 3,705,194,256.86 418,820,046.24 Catastrophic losses - - - - Downward reappraisals - 140,026,759.06 7,545,004.95 782,646,836.48 Reclassifications 783,930,403.46 4,358,894,880.14 - 460,488,910.70 Total reductions to stock 10,116,950,697.34 10,109,346,427.80 3,712,739,261.81 1,661,955,793.42 Revaluation -27,131,942,798.09 -21,822,751,271.92 -18,373,044,294.73 -50,178,503,760.16 Closing stock 94,169,823,245.11 68,353,008,767.80 57,067,542,685.75 5,625,153,826.54 Note: "-" Denotes no recorded data Philippine Statistics Authority Caraga Estimation
43

53
Table 13. Monetary Asset Account for Gold Ore Class A at 10 Percent Discount Rate, Caraga: 2015-2018 (in Peso) 2015 2016 2017 2018 Opening stock 14,349,854,633.25 9,399,519,480.78 10,739,132,506.70 6,431,177,174.87 Additions to stock Discoveries - - - - Upward reappraisals - - 1,492,351,856.23 1,095,544,040.93 Reclassifications - - Total additions to stock - - 1,492,351,856.23 1,095,544,040.93 Reductions to stock Extractions 2,535,253,677.17 3,013,476,420.93 1,521,787,184.91 892,669,253.17 Catastrophic losses - - - - Downward reappraisals - - - - Reclassifications - - - 2,394,966,265.94 Total reductions to stock 2,535,253,677.17 3,013,476,420.93 1,521,787,184.91 3,287,635,519.11 Revaluation -2,415,081,475.30 4,353,089,446.85 -4,278,520,003.14 -1,641,244,642.99 Closing stock 9,399,519,480.78 10,739,132,506.70 6,431,177,174.87 2,597,841,053.70 Note: "-" Denotes no recorded data Philippine Statistics Authority Caraga Estimation
44
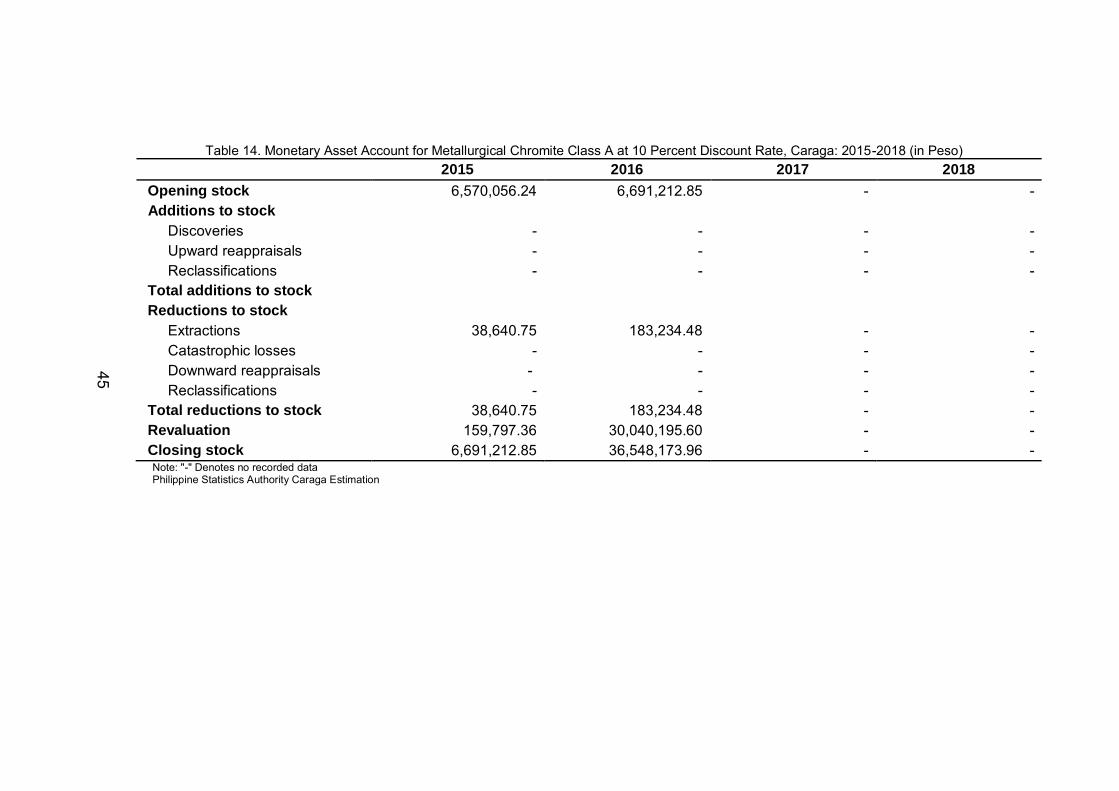
54
Table 14. Monetary Asset Account for Metallurgical Chromite Class A at 10 Percent Discount Rate, Caraga: 2015-2018 (in Peso) 2015 2016 2017 2018 Opening stock 6,570,056.24 6,691,212.85 - - Additions to stock Discoveries - - - - Upward reappraisals - - - - Reclassifications - - - - Total additions to stock Reductions to stock Extractions 38,640.75 183,234.48 - - Catastrophic losses - - - - Downward reappraisals - - - - Reclassifications - - - - Total reductions to stock 38,640.75 183,234.48 - - Revaluation 159,797.36 30,040,195.60 - - Closing stock 6,691,212.85 36,548,173.96 - - Note: "-" Denotes no recorded data Philippine Statistics Authority Caraga Estimation
45

46
APPENDIX C Mineral Production
Table 15. Estimation of Gold Ore Production, Caraga: 2015-2018 Commodity 2015 2016 2017 2018 Gold bullion (Kg) 4,877.00 4,625.00 3,187.00 2,894.18
WMT of Gold Ore/I kg of gold 216,289.64 185,286.45 225,712.17 195,753.36
Total Gold Ore (WMT) 1,054,844.55 856,949.84 719,344.67 566,545.46 Note: Available data for Medusa annual reports for 2015-2017 only were used as a reference for the estimation of gold ore to produce a kilo of gold available at http://www.medusamining.com.au/
Table 16a. Estimated Mineral Production by Commodity, Caraga: 2015-2018 (in Dry Metric Ton)
Commodity 2015 2016 2017 2018 Nickel Ore 31,104,081.57 23,846,556.49 21,699,775.10 20,238,572.00 Gold Ore 685,648.96 557,017.39 467,574.04 368,254.55 Metallurgical Chromite 560.05 2,620.00 - - Note: "-" Denotes no mineral production Source: Mines and Geosciences Bureau-Caraga/Mines and Geosciences-Central Office/Philippines Statistics Authority
Table 16b. Gross Value of Production by Ore in Peso at Dry Metric Ton, Caraga: 2015-2018
Commodity 2015 2016 2017 2018
Nickel Ore 32,077,607,396.97 18,897,211,940.39 19,784,540,918.84 22,766,268,459.00 Gold Ore 8,240,466,419.03 8,862,938,137.13 6,375,091,861.63 6,043,748,832.00 Metallurgical Chromite Ore 4,426,832.43 23,855,376.49 - - Note: "-" Denotes no gross value of production Source: Mines and Geosciences Bureau-Caraga/Mines and Geosciences-Central Office
Table 17. Gross Value of by-Products Production, Caraga: 2015-2018 Commodity 2015 2016 2017 2018
Gold bullion 8,240,466,419.03 8,862,938,137.13 6,375,091,861.63 6,043,748,832.00 Silver bullion 44,276,243.63 68,528,165.36 26,606,703.22 14,674,822.00 Nickel/Cobalt Mixed Sulfides
13,846,252,560.58 11,237,393,034.33 15,762,856,833.49 14,993,978,791.00
Scandium Oxalate - - - 137,632,563.00 Note: "-" Denotes no mineral production Source: Mines and Geosciences Bureau-Caraga/Mines and Geosciences-Central Office
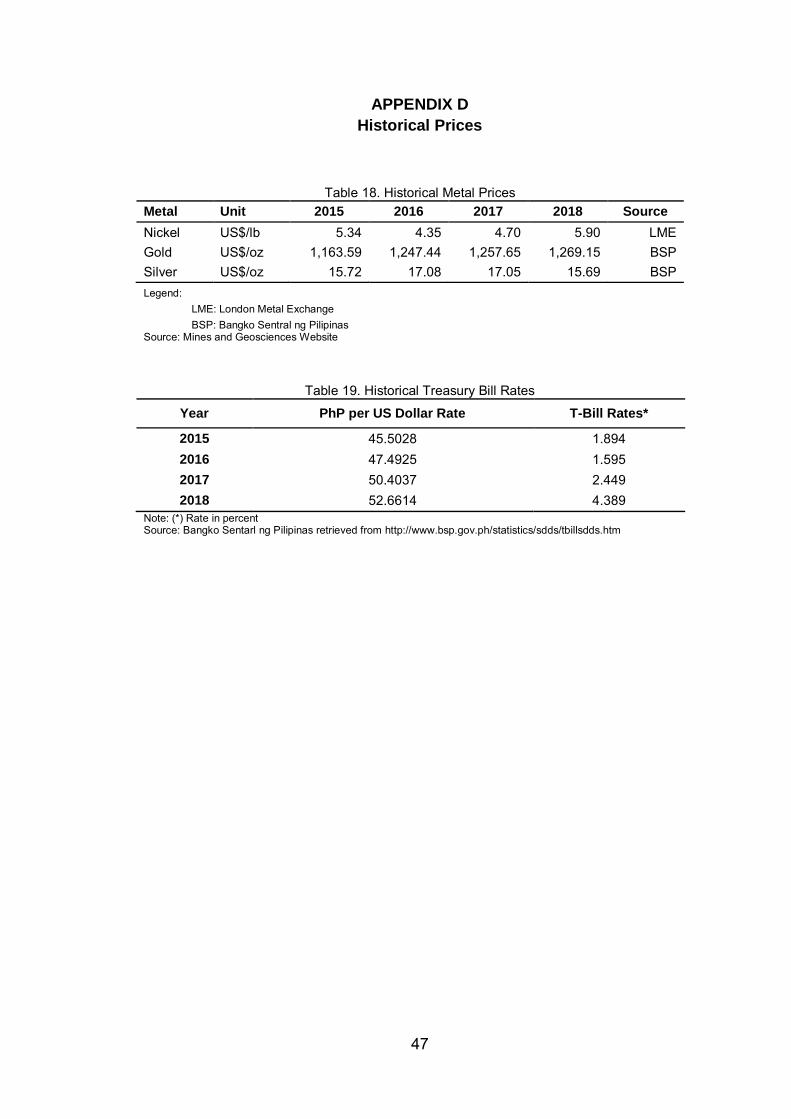
47
APPENDIX D Historical Prices
Table 18. Historical Metal Prices Metal Unit 2015 2016 2017 2018 Source Nickel US$/lb 5.34 4.35 4.70 5.90 LME Gold US$/oz 1,163.59 1,247.44 1,257.65 1,269.15 BSP Silver US$/oz 15.72 17.08 17.05 15.69 BSP Legend:
LME: London Metal Exchange BSP: Bangko Sentral ng Pilipinas
Source: Mines and Geosciences Website
Table 19. Historical Treasury Bill Rates
Year PhP per US Dollar Rate T-Bill Rates*
2015 45.5028 1.894 2016 47.4925 1.595 2017 50.4037 2.449 2018 52.6614 4.389
Note: (*) Rate in percent Source: Bangko Sentarl ng Pilipinas retrieved from http://www.bsp.gov.ph/statistics/sdds/tbillsdds.htm

48
APPENDIX E Categorization of Mineral Resources
Table 20. Categorization of Mineral Resources
SEEA Classes
Corresponding UNFC-2009 project categories E F G
Economic and social viability
Field project status and feasibility
Geologic knowledge
Known deposits
Class A: Commercially recoverable resourcesa
E1. Extraction and sale have been confirmed to be economically viable
F1. Feasibility of extraction by a defined development project or mining operation has been confirmed.
Quantities associated with a known deposit that can be estimated with a high (G1), moderate (G2) or low (G3) level of confidence
Class B. Potentially commercially recoverable resourcesb
E2. Extraction and sale are expected to become economically viable in the foreseeable futurec
F2.1. Project activities are ongoing to justify development in the foreseeable future
Or
F2.2. Project activities are on hold and/or where justification as a commercial development may be subject to significant delay
Class C. Non-commercial and other known depositsd
E3. Extraction and sale are not expected to become economically viable in the foreseeable future or evaluation is at too early a stage to determine economic viability
F2.2 Project activities are on hold and/or where justification as a commercial development may be subject to significant delay
Or
F2.3. There are no current plans to develop or to acquire additional data at the time due to limited potential

49
Or
F4. No development project or mining operation has been identified
Potential deposits (not included in SEEA)
Exploration projects Additional quantities in place
E3. Extraction and sale are not expected to become economically viable in the foreseeable future or evaluation is at too early a stage to determine economic viability
F3. Feasibility of extraction by a defined development project or mining operation cannot be evaluated due to limited technical data
Or
F4. No development project or mining operation has been identified
Estimated quantities associated with a potential deposit, based primarily on indirect evidence (G4)
Note a Including on-production projects, projects approved for development and projects justified for development. b Including economic and marginal development projects pending and development projects on hold. c Potential commercial projects may also satisfy the requirements for E1. d Including unclarified development projects, non-viable development projects, and additional quantities in place. Source: System on Environmental-Economic Accounting (SEEA) 2012 – Central Framework, p. 163 table 5.6

50
APPENDIX F
Social Discount Rate Memorandum

51
STEERING COMMITTEE
Chairperson: Atty. Bonifacio G. Uy National Economic and Development Authority (NEDA) – Caraga
Vice chairperson: Dir. Rosalinda C. Apura, D.M. Philippine Statistics Authority (PSA) – RSSO XIII
Members: Dir. Felix S. Alicer Department of Environment and Natural Resources (DENR) – Caraga
Engr. Glenn Marcelo C. Noble Mines and Geosciences Bureau (MGB) – Caraga

52
TECHNICAL WORKING GROUP
Department of Environment and Natural Resources (DENR)
PEO III Celeste N. Paler
Mr. Reymar L. Ballescas
Mines and Geosciences Bureau (MGB)
Engr. Brenice Ann M. Gendeve-Castillo
EMO Glynis Irene S. Buot
Engr. Crystal Sheen E. Tapales
Ms. Ivee Drea C. Zerda
National Economic and Development Authority (NEDA)
EDS II Marx Rev A. Buenavidez
Philippines Statistics Authority (PSA)
CSS Melchor B. Bautista
SSS Presa P. Villarina
Ms. Shenna Ace C. Bago
53
REFERENCES
Department of Economic Research/Department of Economic Statistics. FAQ Interest Rates. Retrieved from bsp.gov.ph/downloads/Publications/ FAQs/intrates.pdf
Department of Environment and Natural Resources Press Release (2017). Lopez Orders Closure of 23 Metallic Mines. Retrieved from http://caraga.denr.gov.ph/index.php/15-news-events/press-releases/ 520-lopez-orders-closure-of-23-metallic-mines?highlight=WyJjbG9zd XJlIiwib2YiLCJtaW5pbmciLCJtaW5pbmcncyIsIm1pbmluZyciLCJmaXJtcyIsImZpcm1zJyIsImNsb3N1cmUgb2YiLCJjbG9zdXJlIG9mIG1pbmluZyIsIm9mIG1pbmluZyIsIm9mIG1pbmluZyBmaXJtcyIsIm1pbmluZyBmaXJtcyJd
Hayes, Adam. (2019, August). Economic Rent. Retrieved from http://www. investopedia.com/terms/e/economicrent.asp
Mines and Geosciences Bureau (2019). Nickel leads production value in H1 2019. Retrieved from http://www.mgb.gov.ph/attachments/article/742/ Nickel%20leads%20in%20H1%202019.pdf
Mines and Geosciences Bureau Caraga (2016). THPAL Nickel Corporation conducts Public Consultation for its Scandium Recovery. Retrieved from https://www.mgbr13.ph/index.php/2016/03/17/thpal-nickel-corpo ration-conducts-public-consultation-for-its-scandium-recovery-project/
Mines and Geosciences Bureau Regional Office No. XIII. (2018). Caraga Region Mineral Profile 2017. Retrieved from http://www.mgbr13.ph/ MGB-R13DataFiles/MMD/2017/MineralStatistics/QuickFacts/Caraga% 20Region%20Mineral%20Profile.pdf
Philippine Environment and Natural Resources Accounting (1998). Philippine Asset Accounts: Forest, Land/Soil, Fishery, Mineral, and Water Resources. Retrieved from https://psa.gov.ph/sites/default/files/asset account_0.pdf
Philippine Information Agency (2019). 5th Caraga Mining Confab Opens in Surigao City. Philippine Information Agency Press Release. Retrieved from https://pia.gov.ph/news/articles/1028111#:~:text=Caraga%20Re gion%2C%20particularly%20Surigao%20del,are%20also%20in%20the%20region.
Philippine Information Agency. (2010). German government opens first Mindanao office in Caraga Region. Philippine Information Agency Press Release. http://archives.pia.gov.ph/?m=12&fi=p100327.htm& no=44

54
Philippine Statistics Authority Gross Regional Domestic Product 2016-2018. p-22.Retrieved from https://psa.gov.ph/sites/default/files/2016-2018 GRDP.pdf
Philippine Statistics Authority Gross Regional Domestic Product 2016-2018. H-14. Retrieved from https://psa.gov.ph/sites/default/files/2016-2018 GRDP.pdf


