Cargo Bikes in Transit Oriented Development: Concept and Route Clustering
Aziz Syam1, a, Bonivasius Prasetya2,b 1Student, Industrial-Engineering Department, Mercu Buana University, Jakarta, Indonesia
2 Lecturer, Industrial-Engineering Department, Mercu Buana University, Jakarta, Indonesia
[email protected], [email protected] Keywords: Cargo bikes, Transit Oriented Development, Center of Gravity, Sweep Algorithm
Abstract. The increasing growth of the e-commerce market makes the savings of the last mile
shipping compete with each other to provide third-party logistics services with the type of shipping
and competitive prices. The existence of Cargo bikes in Jakarta city has been popular since 2013
pioneered by the West Bike Messenger Service (WMS) community which provides bicycle shipping
services in several areas in Jakarta. Integration of rail transportation modes combined with cargo
bikes can provide opportunities for this system to develop from a local scale or a regional scale to a
city scale. This study will provide the concept of urban logistics in the TOD areas with bikes. The use
of sweep algorithm combined with Center of Gravity (COG), produce cluster delivery routes in three
TODs with different characteristics. TOD with the character U1 (Fatmawati) has 9 clusters, U2
(Cipete) has 6 clusters, and 7 clusters are owned by TOD with character R (Blok M).
Introduction
Prediction of e-commerce sales growth in Indonesia according to Statista institution reached Rp 219
trillion in 2022 which rose 133.5% from 2017. Comparison of e-commerce sales to retail in Indonesia
which reached 1.25% making Indonesia the first place in ASEAN in research conducted by the
Nomura Research Institute. This phenomenon certainly has a big influence on the development of
last-mile delivery especially in big cities in Indonesia including Jakarta.
Last-mile delivery is considered to be the most expensive part of the supply chain, 13% to 75% of the
total supply chain costs depend on several characteristics. Faced with the problem of the last-mile,
Parcel Delivery service providers must adapt their logistics organizations in cities to be more
economically and environmentally efficient and to fulfil more complex customer desires. [1] About a
quarter of urban traffic is related to goods transportation. When compared with rural shipping, the
process of shipping goods in the city is influenced by a significantly higher number of parameters. [2]
Urban logistics causes more pollution than long-distance shipments because of the short travel
frequency and many stop points which make fuel consumption sharply increase. Every 10 km per
stop, fuel consumption increases by 140%. [3]
Responding to the issue, urban logistics that grew rapidly along with the growth of e-commerce
contributed to the sustainability of a city. Previous research and implementation of sustainable urban
logistics has linked many environmentally friendly logistics with the selection of rail and
bicycle-based logistics modes of transportation. Bicycle couriers pick up and deliver goods by
bicycle. This type of urban logistics is most often found in the central business district of the
metropolitan area. [4]
The presence of Cargo bikes in the city of Jakarta has been popular since 2013 spearheaded by the
West Bike Messenger Service (WMS) community. In 2016, JNE as a large logistic company in
collaboration with WMS to provide innovative cargo bikes programs as a city-scale logistics option
that is environmentally friendly, the program was called 'JNE Eco Courier'. Research that has been
carried out suggests that logistics companies do not feel that bicycle couriers can have a relationship
1st International Conference on Engineering and Management in Industrial System (ICOEMIS 2019)
Copyright © 2019, the Authors. Published by Atlantis Press. This is an open access article under the CC BY-NC license (http://creativecommons.org/licenses/by-nc/4.0/).
Advances in Intelligent Systems Research, volume 173
275
with global networks, but allow for more local and regional coverage as a good option for
e-commerce related same-day delivery. [4]
The development of mass transportation-based areas or often called Transit Oriented Development
(TOD) is increasing in large cities in Indonesia, especially Jakarta. The development of the TOD area
in Jakarta currently focuses on the points of the MRT (Mass Rapid Train) station. Based on the
description of the background in terms of urban logistics, cargo bikes, and the TOD area, this study
will provide modeling that produces new ideas on the feasibility of applying cargo bikes in the TOD
area by simulating a cluster at each station point, from the time and capacity needed by cargo bikes to
obtain serving all points of demand in the TOD area that have certain characteristics.
Literature Review
Mumbai Dabbawalas is a lunch box delivery service system that uses informal bicycles but has the
capability to implement an appropriate, reliable and affordable urban logistics system for
middle-class people in Mumbai. After being awarded the Six Sigma title as a best practice in urban
logistics in India, since then, it has been quoted as a best practice of urban logistics in the Indian
context. [5] In the study found the facts that urban landscape, public policy, and infrastructure offer a
good match between supply and demand, so that the management principles used can be applied in
the management of other urban logistics.
In 2012, Maes & Vanelslander wrote a research journal relating to the use of bicycle couriers in a
modern logistics. The choice of using bicycle couriers in small volumes has proven to be the right
choice for dense urban areas. This study analyzes how bicycle couriers can economically balance the
transportation system using fossil fuels by comparing simulations of shipping schemes from these
two transports. The results showed that bicycle couriers can offer the same price as conventional
transportation, considering that logistics companies do not have warehouses in the city. Providing
professional services, bicycle couriers need large volumes so that a close relationship is needed
between the logistics company and that capacity. [4]
Bike cycle trial projects have been carried out in several companies, although in commercial
implementation and implementation recommendations are still lacking. This will only work,
however, if this mode of delivery is given greater consideration in city and transport planning. City
policymakers, a network of settings, infrastructure adjustments, appropriate city planning strategies,
pilot programs, collaboration with the private sector are the key to achieving integration between
large logistics companies such as DHL, Hermes, and TNT with bicycle cargoes in their supply chains.
[6–9]
In 2017, there is a study focuses on evaluating the operating performance of bicycle cargoes
compared to shipments using motorized vehicles. Consider the characteristics of traffic operations
related to travel speed, travel delays, delivery time and travel distance, and are associated with
parking locations, CO2, and emissions savings. The end result of this study shows the load of bicycles
as a city-scale shipping alternative that provides the benefits of a competitive environment and
long-distance shipping options in crowded cities such as NYC. [10]
Constraints on package delivery are not only related to congestion and shipping costs, but also
because of the difficulty of delivering faster but the right delivery in an unreliable and dynamic
environment. The article made by Zhang et al in 2018, intends to answer the question of how people
perceive by changing the distribution of the last mileage by bicycle or using pickup points. Taking an
example in Berlin, the simulation model represents the structure of the city (network, difference in
space) and the character of temporal traffic jams. This study resulted in the possibility of refilling
28% and emissions of 22% with the use of bicycle cargo options. [11]
Table 1. Cargo Bikes State of Art.
Advances in Intelligent Systems Research, volume 173
276
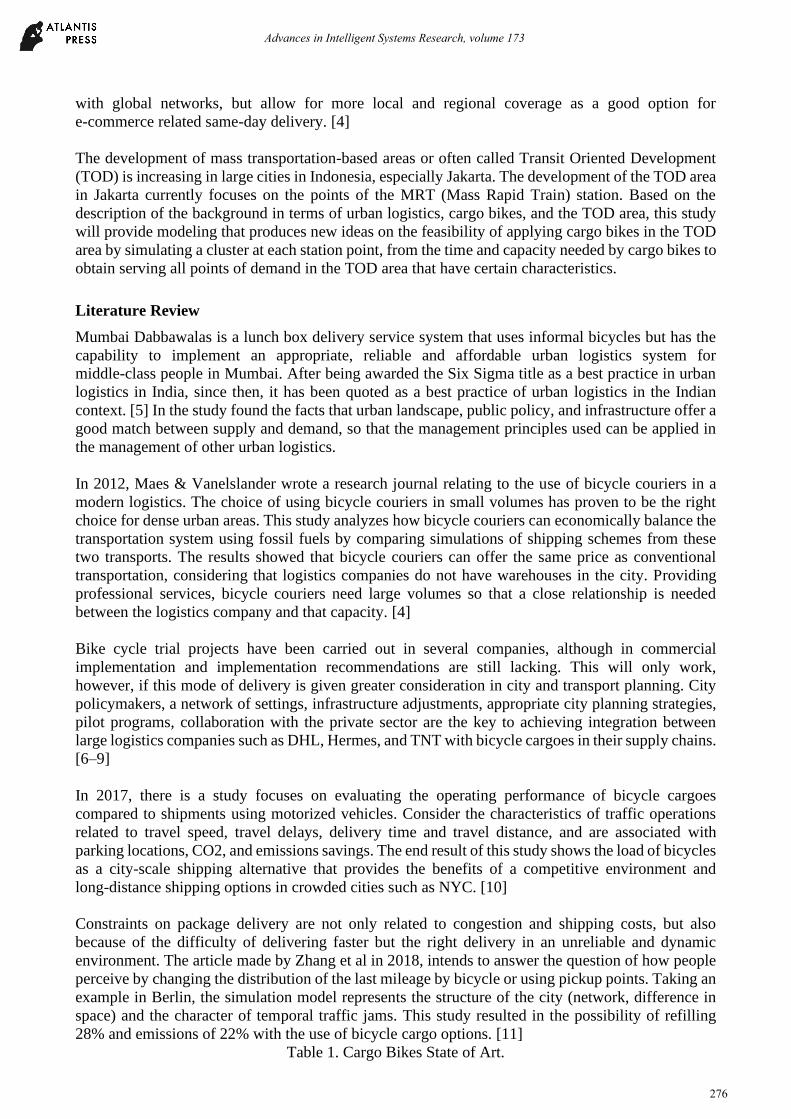
Year Author City Study Case Concept Recommendation Simulation
2012 Baindur, et al. Mumbai • •
2012 Maes, et al. Mumbai • •
2015 Schliwa, et al. London •
2017 Rudolph, et al. London • •
2017 Conway, et al. New York • •
2018 Zhang, et al. Berlin •
2019 Syam, Aziz Jakarta • •
The description of previous research on urban logistics with bicycle transportation modes has
provided many possibilities in applications and recommendations for implementation in large cities
with high density. As summarized in table 1 from the previous research, there is a research gap for
making urban logistical modeling simulations using bicycle transportation modes that are carried out
within the scope of densely populated urban development.
The potential of Jakarta as a metropolitan city that is developing transit-based areas commonly called
TOD, makes this study able to provide a concept and simulations for regional development that does
not only accommodate human movement in a city but also the movement of logistics with
environmentally friendly and sustainable solutions.
Research Methodology
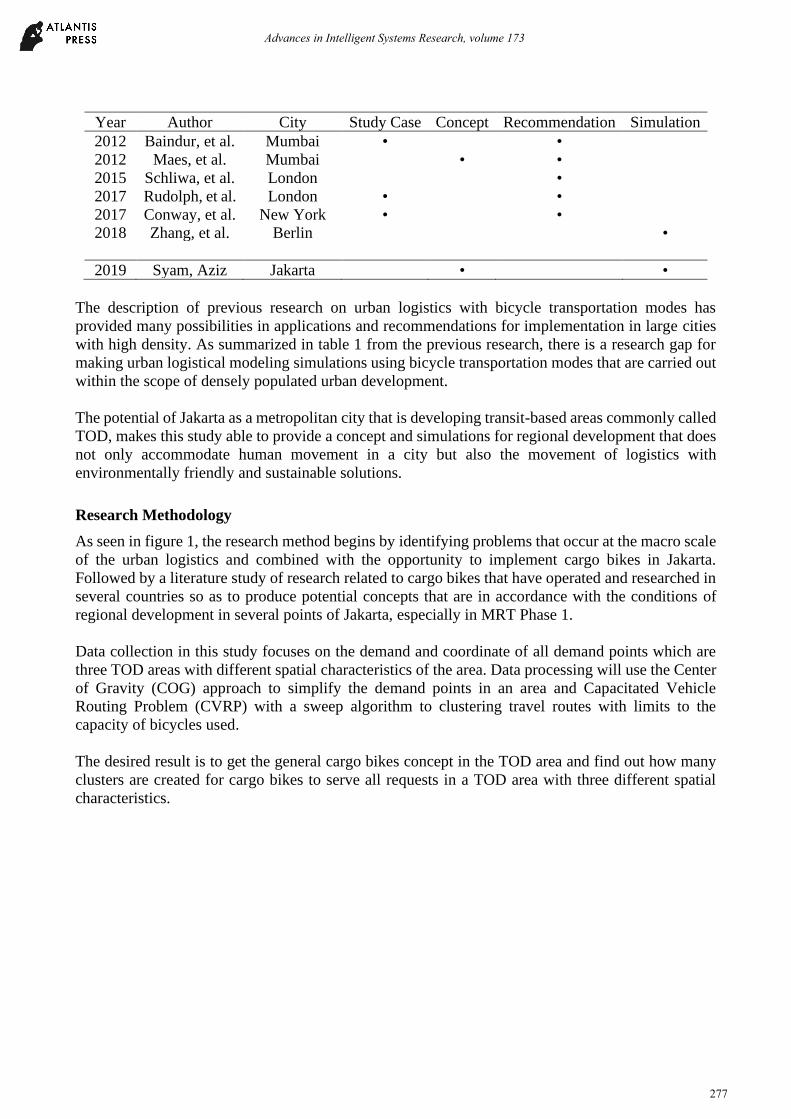
As seen in figure 1, the research method begins by identifying problems that occur at the macro scale
of the urban logistics and combined with the opportunity to implement cargo bikes in Jakarta.
Followed by a literature study of research related to cargo bikes that have operated and researched in
several countries so as to produce potential concepts that are in accordance with the conditions of
regional development in several points of Jakarta, especially in MRT Phase 1.
Data collection in this study focuses on the demand and coordinate of all demand points which are
three TOD areas with different spatial characteristics of the area. Data processing will use the Center
of Gravity (COG) approach to simplify the demand points in an area and Capacitated Vehicle
Routing Problem (CVRP) with a sweep algorithm to clustering travel routes with limits to the
capacity of bicycles used.
The desired result is to get the general cargo bikes concept in the TOD area and find out how many
clusters are created for cargo bikes to serve all requests in a TOD area with three different spatial
characteristics.
Advances in Intelligent Systems Research, volume 173
277
Problem Identification
Literature Study
Data Collection
Data Processing
Coordinate Customer Demand
Result
Conclusion
Cargo Bikes
Concept Clustering
CVRP
Sweep Algorithm
COG
Figure 1. Research Flow.
Data Collection
Data collection in this study focuses on the coordinates and demand of each building and plot of
blocks that are in the TOD range in an area of no more than 700m from the Jakarta Phase 1 MRT stop
station. Analysis of TOD selection used in this study is based on the TOD area character determined
by the study of the provincial government of DKI Jakarta. [12]
TOD Selection
Jakarta MRT Phase 1, which is scheduled to be operational in mid-2019, has 13 station points that
stretch from the South Jakarta area to Central Jakarta. Having a regional radius around the station
point as far as 700 m, there are seven stations that will be developed into transit-based areas or
commonly called Transit Oriented Development (TOD), the stations are Fatmawati, Cipete, Haji
Nawi, Blok A, Blok M, Sisingamangaraja, and Dukuh Atas.
Advances in Intelligent Systems Research, volume 173
278
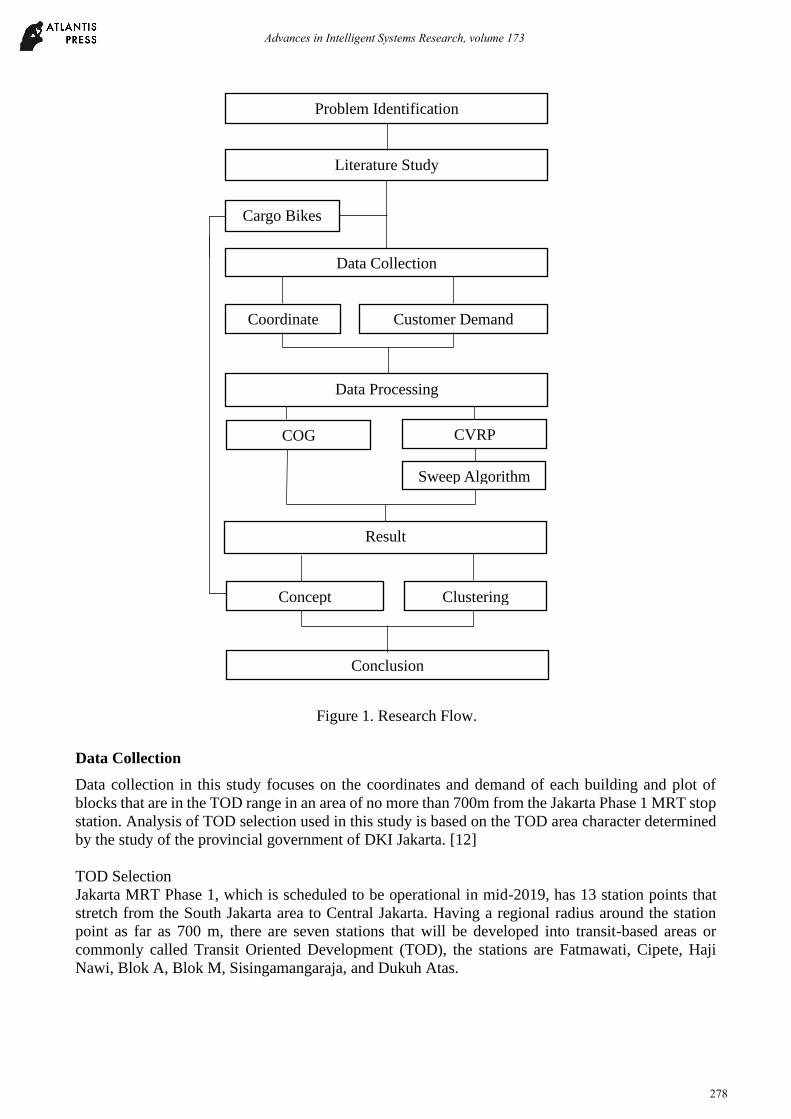
Table 2. TOD Characteristic.
Station Character Composition of Function
(commercial : residential) Density
Fatmawati U1 60 : 40 High
Cipete U2 40 : 60 High - Medium
Haji Nawi U2 40 : 60 High - Medium
Blok A U2 40 : 60 High - Medium
Blok M R 70 : 30 Highest
Sisingamangaraja U2 40 : 60 High - Medium
Dukung Atas R 70 : 30 Highest
As attached to table 2 the TOD area developed at seven Jakarta MRT stations in the first phase has a
character that is closely related to the conditions of land use planned by the Jakarta MRT in
collaboration with the regional government. Using a comparison between composition of function
and density, there are three characteristics of the development of TOD namely Regional with
commercial and residential versus 70: 30 with very high mixed-use, U-1 with a ratio of 60: 40 with
high diversity, and U2 with a ratio of 40: 60 with high-medium diversity.
The selection of three of the seven TODs planned will be developed based on the proximity of a
station to other stations, with the aim of obtaining more bound zones and minimal delivery times in
future developments, cargo bikes from one TOD to another TOD can be connected. Based on these
considerations, the Blok M TOD is chosen which represents the characteristics of the R, Cipete TOD
represents the U2 characteristics and Fatmawati TOD represents U1.
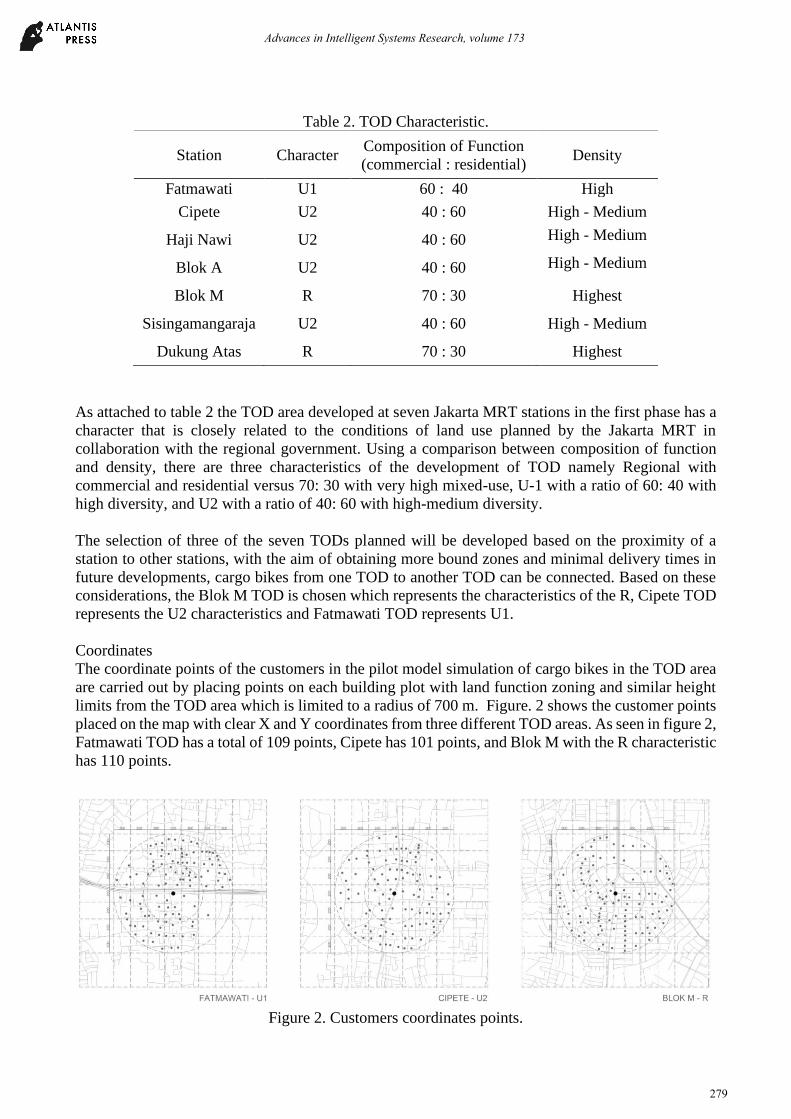
Coordinates
The coordinate points of the customers in the pilot model simulation of cargo bikes in the TOD area
are carried out by placing points on each building plot with land function zoning and similar height
limits from the TOD area which is limited to a radius of 700 m. Figure. 2 shows the customer points
placed on the map with clear X and Y coordinates from three different TOD areas. As seen in figure 2,
Fatmawati TOD has a total of 109 points, Cipete has 101 points, and Blok M with the R characteristic
has 110 points.
Figure 2. Customers coordinates points.
Advances in Intelligent Systems Research, volume 173
279
Demand
The use of data such as spatial-oriented data can provide relevant information about urban logistics.
[13] Demand data obtained from the number of floors category consisting of four categories
according to the spatial design of TOD area, namely category A with a height of 32, category B has a
height of 24 floors, C has a height of 16 floors and buildings that only have a maximum height of 4
floors are categorized as building groups D. Buildings A, B, and C on average have office and trade
functions, while category D functions more as a residence. The straight comparison is finally used as
a guide to demand obtained at each customer point and translated in units of kilograms, see table 3.
TOD Demand
Total A B C D
Fatmawati 1 3 11 94 109
Cipete 1 100 101
Blok M 8 102 110
Table 3. Demand data.
Fatmawati TOD has a total of 109 points, with 11 points type C, 1 point type A, 3 points type B, and
the remaining coordinates are zones of buildings with a height of 4 floors. Cipete TOD with U2
characteristic, has a total of 101 points, with mostly type D buildings and one point of type B. TOD
with characteristic R, Blok M has 8 points type C with the rest points are type D of 102.
Data Processing
Simplification with COG
Data processing starts from simplifying using the Center of Gravity (COG) method, the entire service
points in the indicated map are still in one block that not too far with a 200m distance limit. In
addition to consideration of distance, the service points must also have a similar demand category.
Figure 3 illustrates the transformation of service points from each TOD studied. Fatmawati TOD
which previously had 109 points, became 46 points, Cipete TOD which previously had 101 points,
simplified to 43 points, and Blok M TOD now has 48 points where there were 110 points previously.
Figure 3. Simplification of service points using Center of Gravity (COG)
Clustering
After the customer points are simplified using the COG method, data processing will be served by
bicycle couriers who have an 8kg capacity limit according to the restrictions of Westbike Messenger.
These limits will provide clusters of delivery routes for each TOD studied. Using the theory of sweep
algorithm, the customer's point is swept clockwise with a capacity limit of 8kg. It can be simulated if
Advances in Intelligent Systems Research, volume 173
280
the cargo bikes meet the specified capacity limit, then the bicycle must return to the hub before
traveling to the next cluster.
Result
Concept
The relationship between bicycles and public transportation nodes provides a combination of the
speed of the train and the flexibility of the bicycle, which is a synergy of mutualism on TOD. [14,15]
The big concept of last-mile delivery using bicycles in this TOD area in figure 4, is the integration of
each TOD served by the MRT, so that each hub in a station can be served with rail-based cargo that
has the right and fast scheduling. This research on non-road modes of urban logistics has also been
carried out to provide an option for a delivery system in densely populated urban areas that is more
sustainable and supports greener cities.
Research focuses on cargo bikes in the TOD area. Supporting adequate facilities in Transit Oriented
Development (TOD) for bike and pedestrian users will add value to the efficiency of a last-mile
delivery that adapts the area's infrastructure. The main concept that can be simulated is that each
MRT station studied is a logistics hub of the area served by the type of last-mile delivery using cargo
bicycles.
Figure 4. Cargo Bikes in Transit Oriented Development Concept
Figure 5. Delivery route clusters for cargo bikes in TOD
Cluster
Figure 5 shows the results of clustering using the cartesian diagram and sweep algorithm method,
obtained Fatmawati TOD has 9 clusters, Cipete TOD has fewer clusters, as many as 6 clusters and the
last Blok M TOD has 7 clusters. These clusters can be used as a reference for pick-up and delivery
routes in simulating cargo bikes operations
Conclusions
Advances in Intelligent Systems Research, volume 173
281
This study presents the concept of integrated city logistics between bicycles and rail systems in the
MRT Jakarta phase1. The incorporation of urban spatial in the form of Transit Oriented Development
(TOD) with an urban logistics system with regional scale using bicycles is expected to be able to
provide answers to the option of an energy-efficient and environmentally friendly logistics system.
The COG and sweep algorithm method produces a cluster of delivery cargo routes for three TODs
with different characteristics. TOD with characteristics of U1 has the most clusters with 9 clusters,
followed by TOD with characteristics of R of 7 clusters, and U2 has 6 clusters.
References
[1] Gevaers R, Van de Voorde E and Vanelslander T 2014 Cost Modelling and Simulation of
Last-mile Characteristics in an Innovative B2C Supply Chain Environment with Implications
on Urban Areas and Cities Procedia - Soc. Behav. Sci. 125 398–411
[2] Dablanc L 2007 Goods transport in large European cities: Difficult to organize, difficult to
modernize Transp. Res. Part A Policy Pract. 41 280–5
[3] Mårtensson L 2005 Volvo ’ s Environmental Strategy for next generation trucks
[4] Maes J and Vanelslander T 2012 The Use of Bicycle Messengers in the Logistics Chain,
Concepts Further Revised Procedia - Soc. Behav. Sci. 39 409–23
[5] Baindur D and Macário R M 2013 Mumbai lunch box delivery system: A transferable
benchmark in urban logistics? Res. Transp. Econ. 38 110–21
[6] Rudolph C and Gruber J 2017 Cargo cycles in commercial transport: Potentials, constraints,
and recommendations Res. Transp. Bus. Manag. 24 26–36
[7] Schliwa G, Armitage R, Aziz S, Evans J and Rhoades J 2015 Sustainable city logistics -
Making cargo cycles viable for urban freight transport Res. Transp. Bus. Manag. 15 50–7
[8] TFL 2009 Transport for London Cycle freight in London : A scoping study
[9] Gruber J, Kihm A and Lenz B 2014 Research in Transportation Business & Management A
new vehicle for urban freight ? An ex-ante evaluation of electric cargo bikes in courier services
RTBM 11 53–62
[10] Conway A, Cheng J, Kamga C and Wan D 2017 Cargo cycles for local delivery in New York
City: Performance and impacts Res. Transp. Bus. Manag. 24 90–100
[11] Zhang L, Matteis T, Thaller C and Liedtke G 2018 Simulation-based Assessment of Cargo
Bicycle and Pick-up Point in Urban Parcel Delivery Procedia Comput. Sci. 130 18–25
[12] Anon 2018 P RESENTASI Lap. Akhir Pengemb. Koridor MRT Jakarta
[13] Ducret R, Lemarié B and Roset A 2016 Cluster Analysis and Spatial Modeling for Urban
Freight. Identifying Homogeneous Urban Zones Based on Urban Form and Logistics
Characteristics Transp. Res. Procedia 12 301–13
[14] Kager R, Bertolini L and Te Brömmelstroet M 2016 Characterisation of and reflections on the
synergy of bicycles and public transport Transp. Res. Part A Policy Pract. 85 208–19
[15] Nigro A, Bertolini L and Moccia F D 2019 Land use and public transport integration in small
cities and towns: Assessment methodology and application J. Transp. Geogr. 74 110–24
Advances in Intelligent Systems Research, volume 173
282