44
Cargotec’s interim report January–March 2018 GOOD DEMAND IN HIAB CONTINUED
Cargotec’s interim report January–March 2018
GOOD DEMAND IN HIAB CONTINUED
CARGOTEC CORPORATION Q1 2018 INTERIM REPORT 24 APRIL 2018 AT 2.00 PM EEST
Cargotec’s January–March 2018 interim report: Good demand in Hiab continued
₋ Kalmar’s operating profit increased ₋ Good demand for Hiab’s solutions continued ₋ MacGregor is recovering slowly
From the beginning of 2018, Cargotec applies the new IFRS 15 and IFRS 9 accounting standards as well as the amendments to the IFRS 2 standard. More information on the new standards is available in Note 2, Accounting principles and new accounting standards. Cargotec has also aligned the definitions of the equipment, service and software businesses from the beginning of 2018. The data for the comparison period 2017 has been restated accordingly. Cargotec has published a stock exchange release on 28 March 2018 regarding the changes.
January–March 2018 in brief: Orders received at last year’s level
● Orders received increased by 1 percent and totalled EUR 863 (857) million. ● Order book amounted to EUR 1,684 (31 Dec 2017: 1,566) million at the end of the period. ● Sales decreased by 2 percent and totalled EUR 773 (792) million. ● Service sales totalled EUR 226 (224) million. ● Service and software sales represented 33 (33) percent of consolidated sales. ● Operating profit was EUR 53.2 (56.0) million, representing 6.9 (7.1) percent of sales. ● Operating profit excluding restructuring costs decreased by 3 percent and amounted to
EUR 57.0 (58.9) million, representing 7.4 (7.4) percent of sales. ● Cash flow from operations before financial items and taxes totalled EUR -3.7 (12.5) million. ● Net income for the period amounted to EUR 33.7 (36.2) million. ● Earnings per share was EUR 0.52 (0.56).
Outlook for 2018 unchanged Cargotec reiterates its outlook published on 8 February 2018 and expects its operating profit excluding restructuring costs for 2018 to improve from 2017 (EUR 258.6 million, IFRS 15 restated).
2/44
CARGOTEC CORPORATION Q1 2018 INTERIM REPORT 24 APRIL 2018 AT 2.00 PM EEST
Cargotec’s key figures
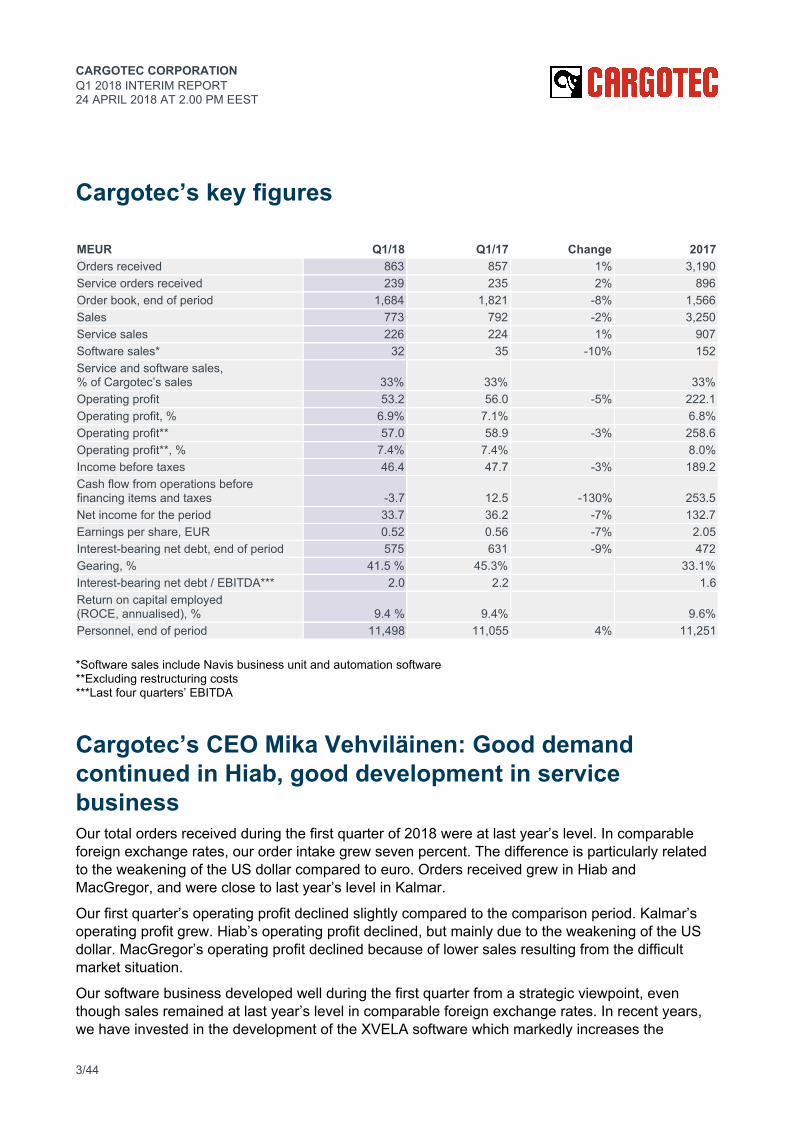
MEUR Q1/18 Q1/17 Change 2017 Orders received 863 857 1% 3,190 Service orders received 239 235 2% 896 Order book, end of period 1,684 1,821 -8% 1,566 Sales 773 792 -2% 3,250 Service sales 226 224 1% 907 Software sales* 32 35 -10% 152 Service and software sales, % of Cargotec’s sales 33% 33% 33% Operating profit 53.2 56.0 -5% 222.1 Operating profit, % 6.9% 7.1% 6.8% Operating profit** 57.0 58.9 -3% 258.6 Operating profit**, % 7.4% 7.4% 8.0% Income before taxes 46.4 47.7 -3% 189.2 Cash flow from operations before financing items and taxes -3.7 12.5 -130% 253.5 Net income for the period 33.7 36.2 -7% 132.7 Earnings per share, EUR 0.52 0.56 -7% 2.05 Interest-bearing net debt, end of period 575 631 -9% 472 Gearing, % 41.5 % 45.3% 33.1% Interest-bearing net debt / EBITDA*** 2.0 2.2 1.6 Return on capital employed (ROCE, annualised), % 9.4 % 9.4%
9.6%
Personnel, end of period 11,498 11,055 4% 11,251 *Software sales include Navis business unit and automation software **Excluding restructuring costs ***Last four quarters’ EBITDA
Cargotec’s CEO Mika Vehviläinen: Good demand continued in Hiab, good development in service business Our total orders received during the first quarter of 2018 were at last year’s level. In comparable foreign exchange rates, our order intake grew seven percent. The difference is particularly related to the weakening of the US dollar compared to euro. Orders received grew in Hiab and MacGregor, and were close to last year’s level in Kalmar.
Our first quarter’s operating profit declined slightly compared to the comparison period. Kalmar’s operating profit grew. Hiab’s operating profit declined, but mainly due to the weakening of the US dollar. MacGregor’s operating profit declined because of lower sales resulting from the difficult market situation.
Our software business developed well during the first quarter from a strategic viewpoint, even though sales remained at last year’s level in comparable foreign exchange rates. In recent years, we have invested in the development of the XVELA software which markedly increases the
3/44

CARGOTEC CORPORATION Q1 2018 INTERIM REPORT 24 APRIL 2018 AT 2.00 PM EEST
efficiency of the container handling chain. XVELA is a digital collaboration platform, which enables various parties in the chain to streamline the increasingly complex ocean supply chain, improve collaboration and deliver goods more efficiently. The commercialisation of XVELA is proceeding well and six carriers already use the software. A good example of the positive development in the software business was the agreement with Cosco Shipping Ports Ltd. for the Navis N4 terminal operating system. We proceeded well also in the service business: our service sales grew seven percent in comparable foreign exchange rates.
Reporting segments’ key figures
Orders received MEUR Q1/18 Q1/17 Change 2017 Kalmar 432 448 -3% 1,555 Hiab 307 288 7% 1,116 MacGregor 124 121 2% 521 Internal orders 0 0 -2 Total 863 857 1% 3,190
Order book MEUR 31 Mar 2018 31 Dec 2017 Change Kalmar 837 786 6% Hiab 329 300 10% MacGregor 519 481 8% Internal orders -1 -1 Total 1,684 1,566 8%
Sales MEUR Q1/18 Q1/17 Change 2017 Kalmar 371 364 2% 1,598 Hiab 276 270 2% 1,084 MacGregor 126 158 -20% 571 Internal sales 0 0 -2 Total 773 792 -2% 3,250
4/44
CARGOTEC CORPORATION Q1 2018 INTERIM REPORT 24 APRIL 2018 AT 2.00 PM EEST
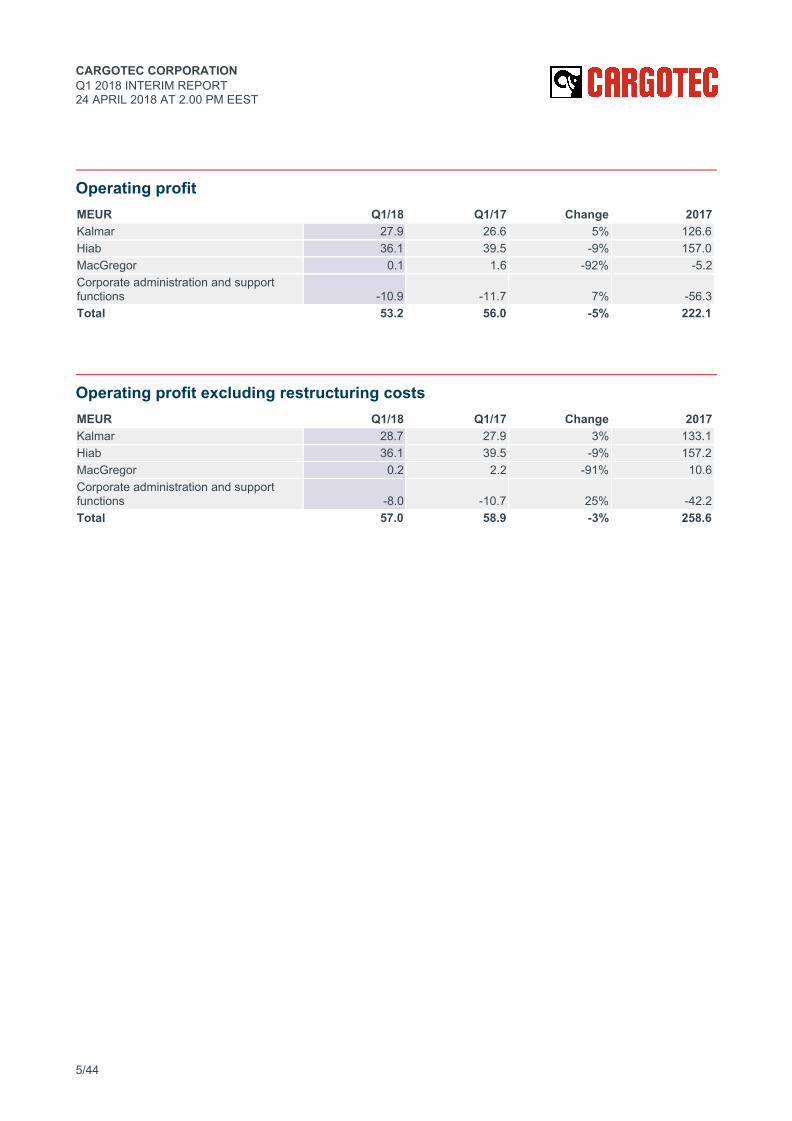
Operating profit MEUR Q1/18 Q1/17 Change 2017 Kalmar 27.9 26.6 5% 126.6 Hiab 36.1 39.5 -9% 157.0 MacGregor 0.1 1.6 -92% -5.2 Corporate administration and support functions -10.9 -11.7 7% -56.3 Total 53.2 56.0 -5% 222.1
Operating profit excluding restructuring costs MEUR Q1/18 Q1/17 Change 2017 Kalmar 28.7 27.9 3% 133.1 Hiab 36.1 39.5 -9% 157.2 MacGregor 0.2 2.2 -91% 10.6 Corporate administration and support functions -8.0 -10.7 25% -42.2 Total 57.0 58.9 -3% 258.6
5/44
CARGOTEC CORPORATION Q1 2018 INTERIM REPORT 24 APRIL 2018 AT 2.00 PM EEST
Press conference for analysts and media A press conference for analysts and media, combined with a live international telephone conference, will be arranged on 24 April at 3.00 p.m. EEST at Cargotec’s head office, Porkkalankatu 5, Helsinki. The event will be held in English. The report will be presented by CEO Mika Vehviläinen and Executive Vice President, CFO Mikko Puolakka. The presentation material will be available at www.cargotec.com by latest 2.30 p.m. EEST. The telephone conference, during which questions may be presented, can be accessed using the following numbers with access code 247024 and PIN code 000000: FI: +358 (0)9 7479 0360 SE: +46 (0)8 5033 6573 UK: +44 (0)330 336 9104 US: +1 929-477-0443 The event can also be viewed as a live webcast at www.cargotec.com. An on-demand version of the conference will be published at Cargotec’s website later during the day. For further information, please contact: Mikko Puolakka, Executive Vice President and CFO, tel. +358 20 777 4105 Hanna-Maria Heikkinen, Vice President, Investor Relations, tel. +358 20 777 4084 Cargotec (Nasdaq Helsinki: CGCBV) enables smarter cargo flow for a better everyday with its leading cargo handling solutions and services. Cargotec's business areas Kalmar, Hiab and MacGregor are pioneers in their fields. Through their unique position in ports, at sea and on roads, they optimise global cargo flows and create sustainable customer value. Cargotec's sales in 2017 totalled approximately EUR 3.2 billion and it employs over 11,000 people. www.cargotec.com
6/44
CARGOTEC CORPORATION Q1 2018 INTERIM REPORT 24 APRIL 2018 AT 2.00 PM EEST
Cargotec’s January–March 2018 interim report
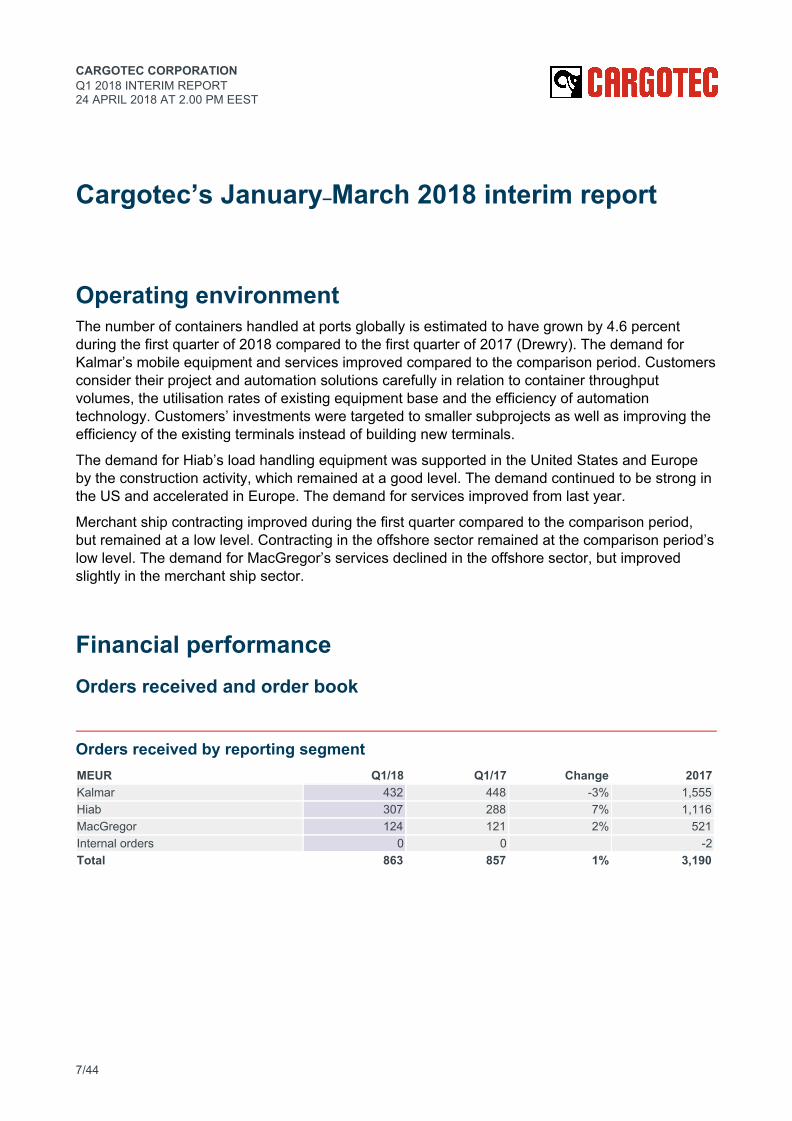
Operating environment The number of containers handled at ports globally is estimated to have grown by 4.6 percent during the first quarter of 2018 compared to the first quarter of 2017 (Drewry). The demand for Kalmar’s mobile equipment and services improved compared to the comparison period. Customers consider their project and automation solutions carefully in relation to container throughput volumes, the utilisation rates of existing equipment base and the efficiency of automation technology. Customers’ investments were targeted to smaller subprojects as well as improving the efficiency of the existing terminals instead of building new terminals.
The demand for Hiab’s load handling equipment was supported in the United States and Europe by the construction activity, which remained at a good level. The demand continued to be strong in the US and accelerated in Europe. The demand for services improved from last year.
Merchant ship contracting improved during the first quarter compared to the comparison period, but remained at a low level. Contracting in the offshore sector remained at the comparison period’s low level. The demand for MacGregor’s services declined in the offshore sector, but improved slightly in the merchant ship sector.
Financial performance Orders received and order book
Orders received by reporting segment MEUR Q1/18 Q1/17 Change 2017 Kalmar 432 448 -3% 1,555 Hiab 307 288 7% 1,116 MacGregor 124 121 2% 521 Internal orders 0 0 -2 Total 863 857 1% 3,190
7/44
CARGOTEC CORPORATION Q1 2018 INTERIM REPORT 24 APRIL 2018 AT 2.00 PM EEST
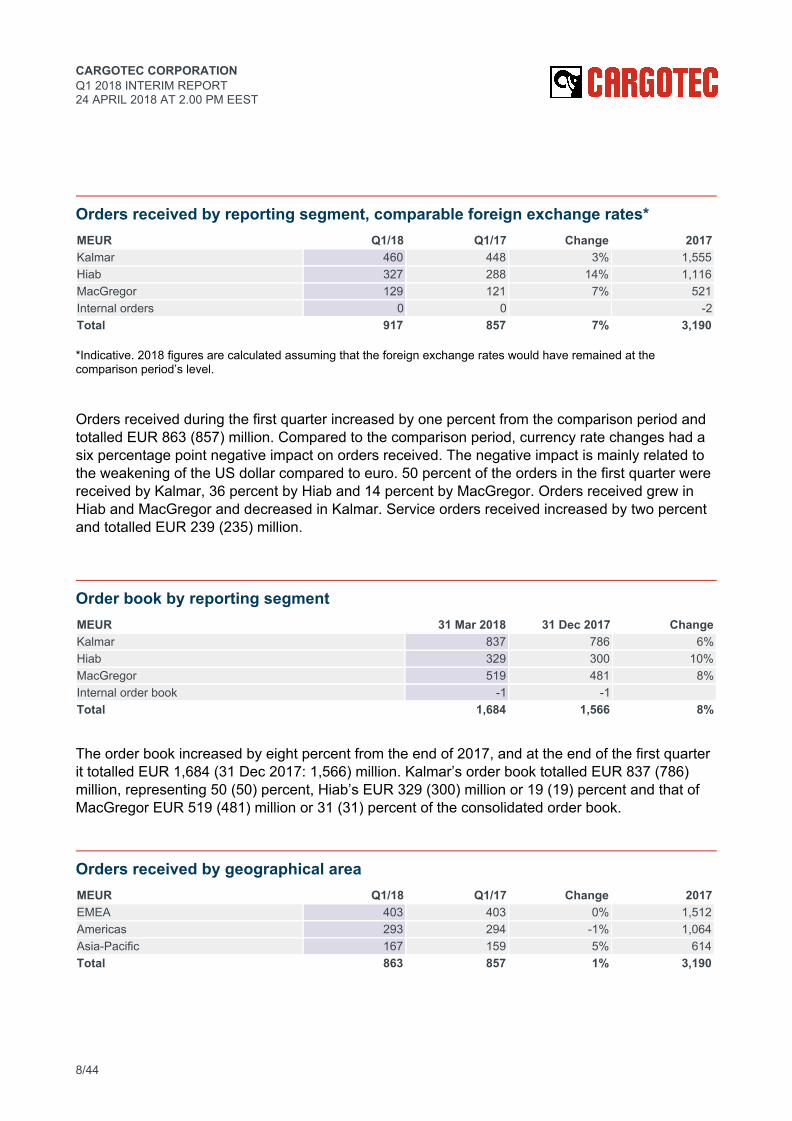
Orders received by reporting segment, comparable foreign exchange rates* MEUR Q1/18 Q1/17 Change 2017 Kalmar 460 448 3% 1,555 Hiab 327 288 14% 1,116 MacGregor 129 121 7% 521 Internal orders 0 0 -2 Total 917 857 7% 3,190 *Indicative. 2018 figures are calculated assuming that the foreign exchange rates would have remained at the comparison period’s level.
Orders received during the first quarter increased by one percent from the comparison period and totalled EUR 863 (857) million. Compared to the comparison period, currency rate changes had a six percentage point negative impact on orders received. The negative impact is mainly related to the weakening of the US dollar compared to euro. 50 percent of the orders in the first quarter were received by Kalmar, 36 percent by Hiab and 14 percent by MacGregor. Orders received grew in Hiab and MacGregor and decreased in Kalmar. Service orders received increased by two percent and totalled EUR 239 (235) million.
Order book by reporting segment MEUR 31 Mar 2018 31 Dec 2017 Change Kalmar 837 786 6% Hiab 329 300 10% MacGregor 519 481 8% Internal order book -1 -1 Total 1,684 1,566 8%
The order book increased by eight percent from the end of 2017, and at the end of the first quarter it totalled EUR 1,684 (31 Dec 2017: 1,566) million. Kalmar’s order book totalled EUR 837 (786) million, representing 50 (50) percent, Hiab’s EUR 329 (300) million or 19 (19) percent and that of MacGregor EUR 519 (481) million or 31 (31) percent of the consolidated order book.
Orders received by geographical area MEUR Q1/18 Q1/17 Change 2017 EMEA 403 403 0% 1,512 Americas 293 294 -1% 1,064 Asia-Pacific 167 159 5% 614 Total 863 857 1% 3,190
8/44
CARGOTEC CORPORATION Q1 2018 INTERIM REPORT 24 APRIL 2018 AT 2.00 PM EEST
In geographical terms, the share of orders received in the first quarter was 47 (47) percent in EMEA and 34 (34) percent in Americas. Asia-Pacific’s share of orders received was 19 (19) percent.
Sales
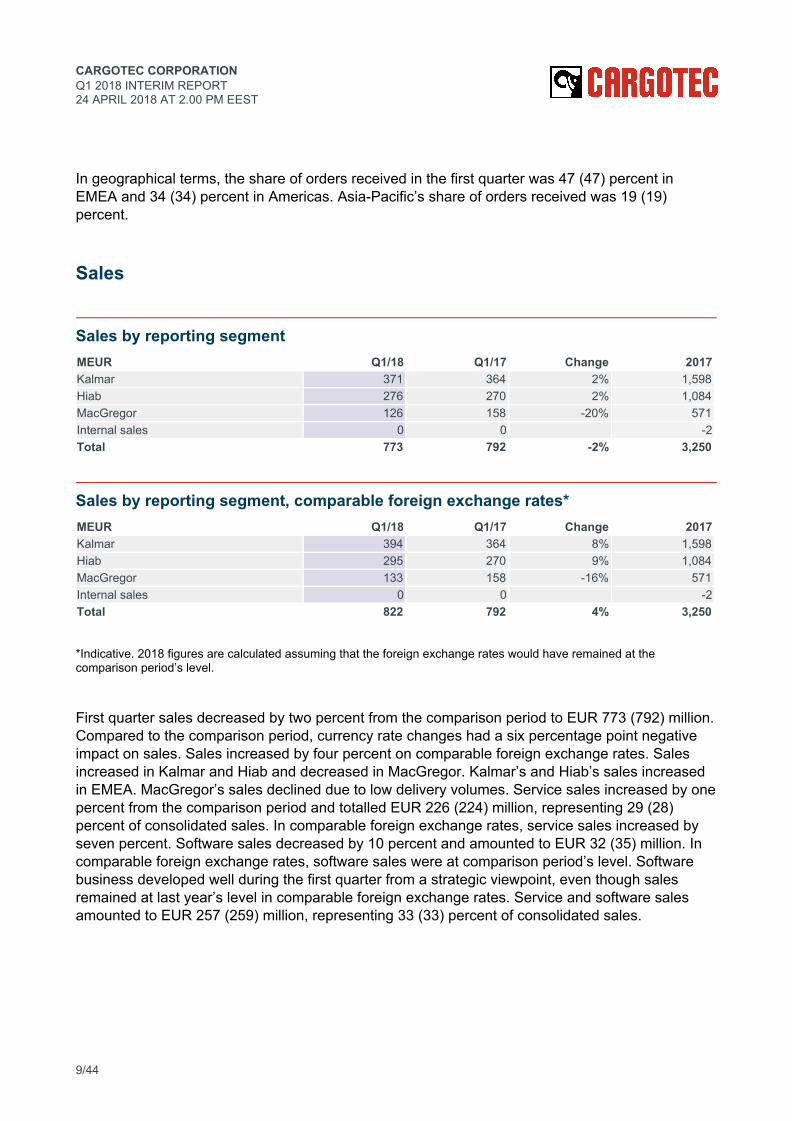
Sales by reporting segment MEUR Q1/18 Q1/17 Change 2017 Kalmar 371 364 2% 1,598 Hiab 276 270 2% 1,084 MacGregor 126 158 -20% 571 Internal sales 0 0 -2 Total 773 792 -2% 3,250
Sales by reporting segment, comparable foreign exchange rates* MEUR Q1/18 Q1/17 Change 2017 Kalmar 394 364 8% 1,598 Hiab 295 270 9% 1,084 MacGregor 133 158 -16% 571 Internal sales 0 0 -2 Total 822 792 4% 3,250 *Indicative. 2018 figures are calculated assuming that the foreign exchange rates would have remained at the comparison period’s level.
First quarter sales decreased by two percent from the comparison period to EUR 773 (792) million. Compared to the comparison period, currency rate changes had a six percentage point negative impact on sales. Sales increased by four percent on comparable foreign exchange rates. Sales increased in Kalmar and Hiab and decreased in MacGregor. Kalmar’s and Hiab’s sales increased in EMEA. MacGregor’s sales declined due to low delivery volumes. Service sales increased by one percent from the comparison period and totalled EUR 226 (224) million, representing 29 (28) percent of consolidated sales. In comparable foreign exchange rates, service sales increased by seven percent. Software sales decreased by 10 percent and amounted to EUR 32 (35) million. In comparable foreign exchange rates, software sales were at comparison period’s level. Software business developed well during the first quarter from a strategic viewpoint, even though sales remained at last year’s level in comparable foreign exchange rates. Service and software sales amounted to EUR 257 (259) million, representing 33 (33) percent of consolidated sales.
9/44
CARGOTEC CORPORATION Q1 2018 INTERIM REPORT 24 APRIL 2018 AT 2.00 PM EEST
Sales by geographical area MEUR Q1/18 Q1/17 Change 2017 EMEA 362 333 9% 1,423 Americas 254 263 -4% 1,034 Asia-Pacific 157 195 -20% 793 Total 773 792 -2% 3,250 In geographical terms, sales increased in EMEA during the first quarter and decreased in Americas and Asia-Pacific. EMEA’s share of consolidated sales was 47 (42) percent, Americas’ 33 (33) percent and Asia-Pacific’s 20 (25) percent.
Financial result
Operating profit by reporting segment MEUR Q1/18 Q1/17 Change 2017 Kalmar 27.9 26.6 5% 126.6 Hiab 36.1 39.5 -9% 157.0 MacGregor 0.1 1.6 -92% -5.2 Corporate administration and support functions -10.9 -11.7 7% -56.3 Total 53.2 56.0 -5% 222.1
Operating profit for the first quarter totalled EUR 53.2 (56.0) million. Operating profit includes EUR 3.8 (2.9) million in restructuring costs. EUR 0.8 (1.2) million of the restructuring costs were related to Kalmar, EUR 0.0 (0.0) million to Hiab, EUR 0.1 (0.6) million to MacGregor and EUR 2.9 (1.0) million to corporate administration and support functions in connection with the company-wide efficiency programme.
Operating profit excluding restructuring costs by reporting segment MEUR Q1/18 Q1/17 Change 2017 Kalmar 28.7 27.9 3% 133.1 Hiab 36.1 39.5 -9% 157.2 MacGregor 0.2 2.2 -91% 10.6 Corporate administration and support functions -8.0 -10.7 25% -42.2 Total 57.0 58.9 -3% 258.6 Operating profit for the first quarter, excluding restructuring costs, was EUR 57.0 (58.9) million, representing 7.4 (7.4) percent of sales. Excluding restructuring costs, operating profit for Kalmar amounted to EUR 28.7 (27.9) million, Hiab EUR 36.1 (39.5) million, and MacGregor EUR 0.2 (2.2) million. Kalmar’s operating profit excluding restructuring costs increased due to improved cost efficiency. Hiab’s operating profit declined due to weakening of US dollar compared to euro as well
10/44

CARGOTEC CORPORATION Q1 2018 INTERIM REPORT 24 APRIL 2018 AT 2.00 PM EEST
as investments in sales and service capabilities and digitalisation. MacGregor’s operating profit excluding restructuring costs decreased compared to the comparison period, as cost savings and more favorable sales mix did not fully compensate the decline in sales.
Net financing expenses and net income Net interest expenses for interest-bearing debt and assets for the first quarter totalled EUR 4.2 (3.5) million. Net financing expenses totalled EUR 6.8 (8.3) million. Net financing expenses decreased due to differences in foreign exchange rates.
Net income for the first quarter totalled EUR 33.7 (36.2) million, and earnings per share EUR 0.52 (0.56).
Balance sheet, cash flow and financing The consolidated balance sheet total was EUR 3,505 (31 Dec 2017: 3,569) million at the end of the first quarter. Equity attributable to the equity holders of the parent was EUR 1,381 (1,423) million, representing EUR 21,36 (22.06) per share. Property, plant and equipment on the balance sheet amounted to EUR 307 (311) million and intangible assets to EUR 1,235 (1,247) million.
Return on equity (ROE, annualised) in January–March was 9.6 (10.4) percent, and return on capital employed (ROCE, annualised) was 9.4 (9.4) percent. Cargotec’s financial target is to reach 15 percent return on capital employed in the next 3–5 years.
Cash flow from operating activities, before financial items and taxes, totalled EUR -3.7 (12.5) million in the first quarter. Cash flow decreased, as more capital was tied up in unfinished inventories due to improved demand in certain product categories in Kalmar and Hiab as well as supply chain issues. At the end of the first quarter, net working capital increased to EUR 206 million from the level of EUR 115 million at the end of 2017.
Cargotec’s liquidity position is healthy. At the end of the first quarter, interest-bearing net debt totalled EUR 575 (31 Dec 2017: 472) million. Interest-bearing debt amounted to EUR 793 (788) million, of which EUR 606 (667) million was current and EUR 187 (121) million non-current debt. On 31 March 2018, the average interest rate on the loan portfolio was 2.3 (31 December 2017: 2.3) percent. Cash and cash equivalents, loans receivable, and other interest-bearing assets totalled EUR 219 (31 Dec 2017: 317) million.
At the end of the first quarter, Cargotec’s total equity/total assets ratio was 40.9 (31 Dec 2017: 41.4) percent. Gearing was 41.5 (33.1) percent.
Corporate topics Research and development Research and product development expenditure in January–March totalled EUR 23.6 (22.7) million, representing 3.1 (2.9) percent of sales. EUR 0.1 (0.1) million was capitalised. Research and development investments were focused on digitalisation as well as projects that aim to improve the competitiveness and cost efficiency of products.
Kalmar In March, Kalmar introduced the latest-generation straddle and shuttle carriers which provide better reliability, productivity, driver comfort and safety through improvements in e.g. electric systems and
11/44
CARGOTEC CORPORATION Q1 2018 INTERIM REPORT 24 APRIL 2018 AT 2.00 PM EEST
working lights. Additionally, the Essential range of reachstackers, empty container handlers and forklifts was introduced in Latin America. The Essential range provides customers with build quality, high availability and excellent safety at a competitive price.
Hiab In February, Hiab opened Vision Lab which is the latest addition to the Test and Innovation Centre in Hudiksvall, Sweden. The new facility enables testing the latest technologies with imaging, visual and object recognition under different conditions. The goal is to improve existing sensors and create new smart sensors for all Hiab product lines as well as investigate the possibilities of augmented reality in the service and maintenance of Hiab’s equipment.
In March, Hiab opened a new installation and competence centre in Meppel, the Netherlands. This new centre offers FrameWorksTM subframes, truck bodies and complete vehicle solutions for the European customer base. It is also the global competence centre for Hiab FrameWorks installations as well as the distribution centre for FrameWorks kits. Hiab FrameWorks, launched in 2016, is a modular system that provides the customer a pre-manufactured, ready-to-install subframe that matches the chosen truck.
During the first quarter, Hiab continued to expand its spare parts web shop which now covers 42 countries. In Sweden, a new Services centre was opened in Södertälje to serve all Hiab customers in the area.
In March, Hiab launched the MULTILIFT hooklifts for the US market. The introduced hooklift models represent light, medium and heavy duty ranges. The key segments in US market for the hooklifts will be landscaping, waste & recycling, rock & dirt and municipal.
The new MULTILIFT COMMANDER container handling unit was also presented to the markets. This application is new for the commercial hooklift market and it enables handling containers safely and efficiently in locations where no infrastructure exists to load or unload containers from the truck. Uses for the MULTILIFT COMMANDER include cargo applications as well as large warehousing, fire and rescue, construction and project logistics, and infrastructure greenfield projects.
MacGregor In February, MacGregor and SeaFocus announced a collaboration agreement that will support the companies in creating new cooperation models to benefit maritime trade and drive industry innovation. With the agreement, MacGregor will participate in Intelligence Hunt®, a cooperation concept developed by SeaFocus, which brings companies and cross-faculty international university students together.
Capital expenditure Capital expenditure, excluding acquisitions and customer financing, totalled EUR 11.6 (10.1) million in January–March. Investments in customer financing were EUR 5.6 (8.0) million. Of the capital expenditure, EUR 2.4 (1.8) million concerned intangible assets, such as global systems that in future enable higher efficiency in operational activities as well as in support functions. Depreciation, amortisation and impairment amounted to EUR 18.3 (17.7) million.
Acquisitions in 2018 On 8 February 2018, MacGregor entered into an agreement to acquire the major businesses from TTS Group, a global provider of cargo handling equipment and services for merchant and offshore
12/44
CARGOTEC CORPORATION Q1 2018 INTERIM REPORT 24 APRIL 2018 AT 2.00 PM EEST
ships for an enterprise value of EUR 87 million. The combination of two highly complementary businesses will produce greater scale and diversification and will strengthen MacGregor's portfolio and market position in key markets for cargo and load handling equipment. Based on preliminary estimates, potential cost synergies are estimated to be around EUR 30-35 million on annual level and are expected to be reached within 3 years from closing. The sales of the business MacGregor aims to acquire totalled EUR 211 million in 2017 from which approximately 26% was related to service sales. The acquisition is subject to regulatory approvals from competition authorities, which are expected to be received during the third quarter of 2018.
In December 2017, MacGregor signed an agreement to acquire Rapp Marine Group (RMG) in order to strengthen its offering for the fishery and research vessel segment. MacGregor's existing portfolio includes already various deck handling equipment, such as cranes and booms, but with RMG, MacGregor is able to offer complete solutions with advanced winches and related control systems. The transaction was completed on 5 February 2018. The sales in 2017 were approximately EUR 40 million, of which approximately 30 percent was related to services.
Operational restructurings MacGregor announced on 9 November 2017 planned measures to achieve annual cost savings of approximately EUR 13 million by reorganising its operations and began statutory cooperation negotiations. The statutory cooperation negotiations were finalised in December, resulting in restructuring of operations and reducing approximately 170 full-time equivalents globally. The planned savings are estimated to be reached in 2018. The realised savings from the programme were approximately EUR 4.5 million in the first quarter of 2018.
In May 2017, Cargotec announced it will target EUR 50 million savings by reducing indirect purchasing spend, streamlining processes and planning Cargotec Business Services operations. Cargotec targets annual cost savings of EUR 50 million from 2020 and onwards. Approximately 2/3 of the savings will come from reductions in global indirect purchasing spend like logistics, external services and facilities. The remaining part of the savings will come from applying new technologies, like automation, in support processes and from the new Cargotec Business Services operations that has started its activities in Sofia, Bulgaria. During the first quarter of 2018, the realised savings from the programme amounted to around EUR 2 million. The estimated restructuring costs related to the programme are around EUR 30 million in 2018.
Kalmar has transferred the production of forklift trucks from Sweden to Poland as planned. At the same time, Kalmar invests in new, state of the art premises in Sweden and transforms the operations in Southern Sweden into a Business, Innovation and Technology Centre. The total benefits of the activities are estimated to amount to approximately EUR 13 million annually from 2018 onwards, of which around EUR 1 million were realised during the first quarter.
Personnel Cargotec employed 11,498 (31 Dec 2017: 11,251) people at the end the first quarter. Kalmar employed 5,702 (5,819) people, Hiab 3,466 (3,370), MacGregor 1,947 (1,859), and corporate administration and support functions 383 (203). The number of employees in corporate administration and support functions increased due to the establishment of Cargotec Business Service (CBS) centre in Bulgaria. The average number of employees in the first quarter was 11,334 (1–12/2017: 11,128).
13/44
CARGOTEC CORPORATION Q1 2018 INTERIM REPORT 24 APRIL 2018 AT 2.00 PM EEST
At the end of the first quarter, 10 (31 Dec 2017: 11) percent of the employees were located in Sweden, 8 (8) percent in Finland, and 44 (43) percent in the rest of Europe. Asia-Pacific personnel represented 21 (21) percent, North and South America 15 (15) percent, and the rest of the world 2 (2) percent of total employees.
Corporate responsibility Global challenges regarding climate change, sustainability and safety are increasingly visible at the cargo handling industry. Customers ask for more eco-efficient and safer solutions to ensure compliance with developing regulations, and to secure operational efficiency.
During the first quarter we progressed in realising our 2018 sustainability targets. Renewable energy was taken into use in all Swedish and Finnish locations where Cargotec is in a position to determine the electricity supplier. Cargotec’s industrial injury frequency rate (IIFR ) was 6.3 at the 1
end of the first quarter. As for safety, we continued with the implementation and development of our processes. The human rights risk assessment started, and we sent the first round of sustainability self-assessment survey questionnaires to our strategic suppliers.
Executive Board On 31 March 2018, Cargotec’s Executive Board consisted of Mika Vehviläinen, CEO; Mikko Puolakka, Executive Vice President, CFO; Mikko Pelkonen, Senior Vice President, Human Resources; Mikael Laine, Senior Vice President, Strategy; Soili Mäkinen; CIO (appointed to the Executive Board on 26 March 2018); and business area presidents Antti Kaunonen (Kalmar), Roland Sundén (Hiab), and Michel van Roozendaal (MacGregor). Outi Aaltonen, Senior Vice President, General Counsel, acts as Secretary to the Executive Board.
1 Number of injuries per million hours worked, last 12 months
14/44
CARGOTEC CORPORATION Q1 2018 INTERIM REPORT 24 APRIL 2018 AT 2.00 PM EEST
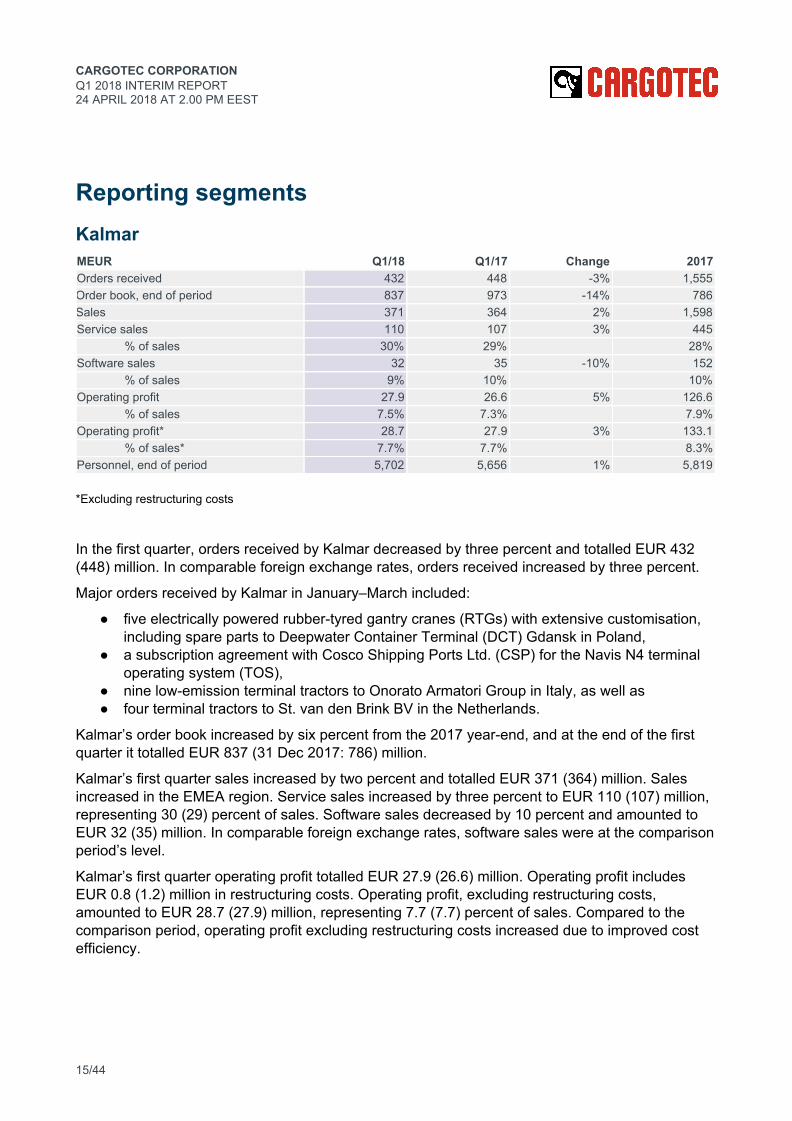
Reporting segments Kalmar MEUR Q1/18 Q1/17 Change 2017 Orders received 432 448 -3% 1,555 Order book, end of period 837 973 -14% 786 Sales 371 364 2% 1,598 Service sales 110 107 3% 445
% of sales 30% 29% 28% Software sales 32 35 -10% 152
% of sales 9% 10% 10% Operating profit 27.9 26.6 5% 126.6
% of sales 7.5% 7.3% 7.9% Operating profit* 28.7 27.9 3% 133.1
% of sales* 7.7% 7.7% 8.3% Personnel, end of period 5,702 5,656 1% 5,819 *Excluding restructuring costs
In the first quarter, orders received by Kalmar decreased by three percent and totalled EUR 432 (448) million. In comparable foreign exchange rates, orders received increased by three percent.
Major orders received by Kalmar in January–March included:
● five electrically powered rubber-tyred gantry cranes (RTGs) with extensive customisation, including spare parts to Deepwater Container Terminal (DCT) Gdansk in Poland,
● a subscription agreement with Cosco Shipping Ports Ltd. (CSP) for the Navis N4 terminal operating system (TOS),
● nine low-emission terminal tractors to Onorato Armatori Group in Italy, as well as ● four terminal tractors to St. van den Brink BV in the Netherlands.
Kalmar’s order book increased by six percent from the 2017 year-end, and at the end of the first quarter it totalled EUR 837 (31 Dec 2017: 786) million.
Kalmar’s first quarter sales increased by two percent and totalled EUR 371 (364) million. Sales increased in the EMEA region. Service sales increased by three percent to EUR 110 (107) million, representing 30 (29) percent of sales. Software sales decreased by 10 percent and amounted to EUR 32 (35) million. In comparable foreign exchange rates, software sales were at the comparison period’s level.
Kalmar’s first quarter operating profit totalled EUR 27.9 (26.6) million. Operating profit includes EUR 0.8 (1.2) million in restructuring costs. Operating profit, excluding restructuring costs, amounted to EUR 28.7 (27.9) million, representing 7.7 (7.7) percent of sales. Compared to the comparison period, operating profit excluding restructuring costs increased due to improved cost efficiency.
15/44
CARGOTEC CORPORATION Q1 2018 INTERIM REPORT 24 APRIL 2018 AT 2.00 PM EEST
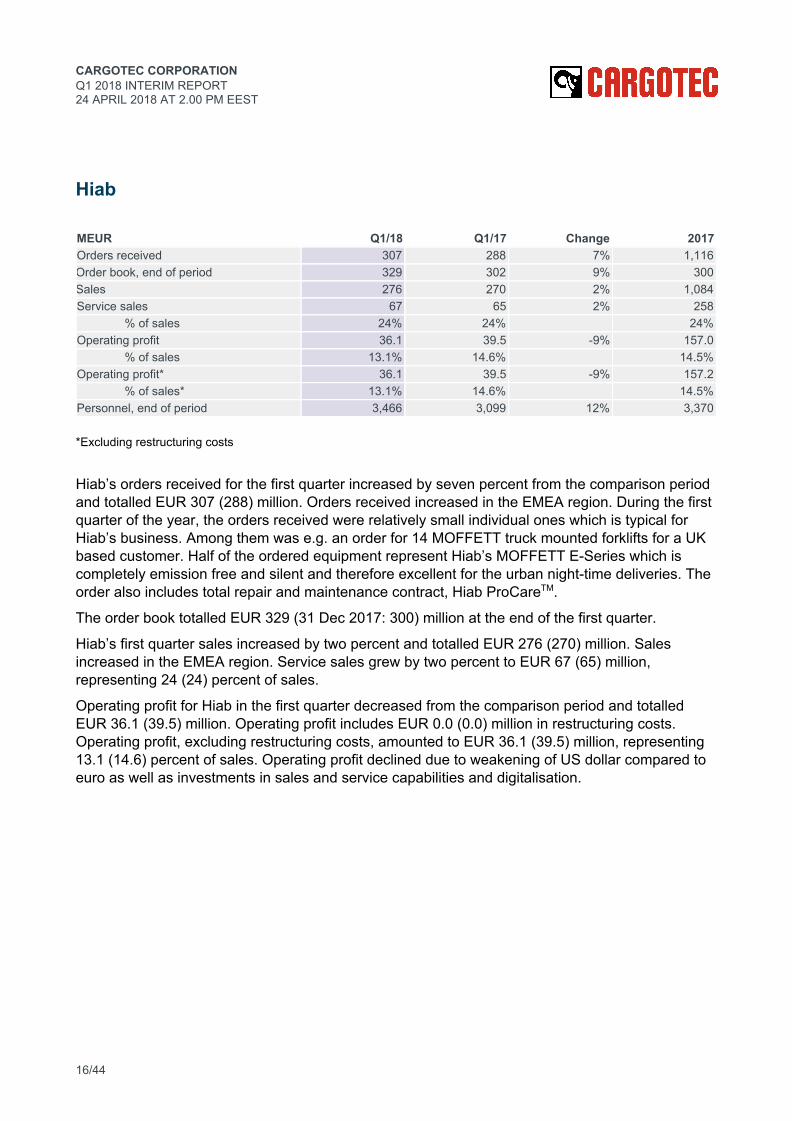
Hiab MEUR Q1/18 Q1/17 Change 2017 Orders received 307 288 7% 1,116 Order book, end of period 329 302 9% 300 Sales 276 270 2% 1,084 Service sales 67 65 2% 258
% of sales 24% 24% 24% Operating profit 36.1 39.5 -9% 157.0
% of sales 13.1% 14.6% 14.5% Operating profit* 36.1 39.5 -9% 157.2
% of sales* 13.1% 14.6% 14.5% Personnel, end of period 3,466 3,099 12% 3,370 *Excluding restructuring costs
Hiab’s orders received for the first quarter increased by seven percent from the comparison period and totalled EUR 307 (288) million. Orders received increased in the EMEA region. During the first quarter of the year, the orders received were relatively small individual ones which is typical for Hiab’s business. Among them was e.g. an order for 14 MOFFETT truck mounted forklifts for a UK based customer. Half of the ordered equipment represent Hiab’s MOFFETT E-Series which is completely emission free and silent and therefore excellent for the urban night-time deliveries. The order also includes total repair and maintenance contract, Hiab ProCareTM.
The order book totalled EUR 329 (31 Dec 2017: 300) million at the end of the first quarter.
Hiab’s first quarter sales increased by two percent and totalled EUR 276 (270) million. Sales increased in the EMEA region. Service sales grew by two percent to EUR 67 (65) million, representing 24 (24) percent of sales.
Operating profit for Hiab in the first quarter decreased from the comparison period and totalled EUR 36.1 (39.5) million. Operating profit includes EUR 0.0 (0.0) million in restructuring costs. Operating profit, excluding restructuring costs, amounted to EUR 36.1 (39.5) million, representing 13.1 (14.6) percent of sales. Operating profit declined due to weakening of US dollar compared to euro as well as investments in sales and service capabilities and digitalisation.
16/44

CARGOTEC CORPORATION Q1 2018 INTERIM REPORT 24 APRIL 2018 AT 2.00 PM EEST
MacGregor MEUR Q1/18 Q1/17 Change 2017 Orders received 124 121 2% 521 Order book, end of period 519 547 -5% 481 Sales 126 158 -20% 571 Service sales 49 52 -4% 205
% of sales 39% 33% 36% Operating profit 0.1 1.6 -92% -5.2
% of sales 0.1% 1.0% -0.9% Operating profit* 0.2 2.2 -91% 10.6
% of sales* 0.2% 1.4% 1.9% Personnel, end of period 1,947 2,064 -6% 1,859 *Excluding restructuring costs
MacGregor’s orders received in the first quarter increased by two percent from the comparison period to EUR 124 (121) million. Around three quarters of the orders received were related to merchant ships and around one quarter to the offshore sector. Orders received increased in Asia-Pacific.
Major orders received by MacGregor in January–March included:
● upgrading and optimising container stowage systems for three container vessels from Germany, as well as
● two inspection service agreements with dry bulk shipping operators.
MacGregor’s order book grew by eight percent from the 2017 year-end, totalling EUR 519 (31 Dec 2017: 481) million at the end of the first quarter. Around two thirds of the order book is merchant ship-related and one third is offshore vessel-related.
MacGregor’s first quarter sales decreased by 20 percent from the comparison period to EUR 126 (158) million. Sales declined due to low delivery volumes. The share of service sales was 39 (33) percent, or EUR 49 (52) million.
MacGregor’s operating profit for the first quarter totalled EUR 0.1 (1.6) million. Operating profit includes EUR 0.1 (0.6) million in restructuring costs. Operating profit, excluding restructuring costs, totalled EUR 0.2 (2.2) million, representing 0.2 (1.4) percent of sales. Operating profit excluding restructuring costs decreased compared to the comparison period, as cost savings and more favorable sales mix did not fully compensate the decline in sales.
17/44
CARGOTEC CORPORATION Q1 2018 INTERIM REPORT 24 APRIL 2018 AT 2.00 PM EEST
Annual General Meeting and shares Decisions taken at the Annual General Meeting Cargotec Corporation’s Annual General Meeting (AGM), held on 20 March 2018, adopted the financial statements and consolidated financial statements of year 2017. The meeting granted discharge from liability for the CEO and the members of the Board of Directors for the accounting period 1 January–31 December 2017. The AGM approved a dividend of EUR 1.04 to be paid for each class A share and a dividend of EUR 1.05 be paid for each class B share outstanding. The dividend shall be paid in two instalments, in March and September 2018. The first instalment was paid on 29 March 2018. The second instalment shall be paid in September 2018, and it shall be paid to shareholders who are registered as shareholders in the company's shareholder register on the dividend record date, which, together with the payment date, shall be confirmed by the Board of Directors in its meeting scheduled for 18 September 2018.
The AGM authorised the Board to decide on the repurchase of Cargotec's shares with non-restricted equity. The number of the Board members was confirmed at ten. Kimmo Alkio, Jorma Eloranta, Tapio Hakakari, Ilkka Herlin, Peter Immonen, Teresa Kemppi-Vasama, Johanna Lamminen, Kaisa Olkkonen, Teuvo Salminen and Heikki Soljama were re-elected to the Board of Directors. The AGM elected accounting firm PricewaterhouseCoopers Oy and authorised public accountant Tomi Hyryläinen as auditors. The auditors' fees were decided to be paid according to invoice approved by the company.
On 20 March 2018, Cargotec Corporation's Board of Directors elected by the Annual General Meeting elected at its organising meeting Ilkka Herlin to continue as Chairman of the Board. Tapio Hakakari was elected to continue as Vice Chairman. The Board also elected the Chairmen and the members for the Audit and Risk Committee as well as the Nomination and Compensation Committee.
Outi Aaltonen, Senior Vice President, General Counsel, will continue as Secretary to the Board. Cargotec published stock exchange releases on the decisions taken at the AGM as well as the Board of Directors’ organising meeting on 20 March 2018. The stock exchange releases and presentations of the members of the Board of Directors are available on Cargotec’s website at www.cargotec.com.
Shares and trading Share capital, own shares and share issue Cargotec Corporation’s share capital totalled EUR 64,304,880 at the end of March. The number of class B shares was 55,182,079, while the number of class A shares totalled 9,526,089.
On 20 March 2018, the Board of Directors of Cargotec Corporation decided on a directed share issue related to the reward payments for share-based incentive programmes. The share reward payments are related to Cargotec's share-based incentive programme 2015, as well as 2017 allocation of restricted shares programme 2016–2018 under the share-based incentive programme 2016.
In the share issue, 138,787 own class B shares held by the company have been transferred without consideration to the key employees participating in the share-based incentive programmes in accordance with the programme-specific terms and conditions. More detailed information about
18/44
CARGOTEC CORPORATION Q1 2018 INTERIM REPORT 24 APRIL 2018 AT 2.00 PM EEST
the launch and the terms and conditions of the programmes is available in stock exchange releases published on 10 February 2015 and on 10 February 2016.
The decision on the directed share issue is based on the authorisation granted to the Board of Directors by the Annual General Meeting on 18 March 2014. According to the authorisation, the Board of Directors can decide on a share issue amounting to a maximum of 952,000 class A shares and 5,448,000 class B shares. In accordance with the authorisation, previously 26,684 own class B shares were transferred on 18 March 2014, 28,030 shares on 31 March 2015, 27,601 shares on 31 March 2016 and 56,709 shares on 31 March 2017.
After the transfer of shares, Cargotec holds a total of 69,603 own class B shares, accounting for 0.11 percent of the total number of shares and 0.05 percent of the total number of votes. At the end of March, the number of outstanding class B shares totalled 55,112,476.
Share-based incentive programmes In February 2018, The Board of Directors of Cargotec Corporation has resolved on the performance criteria for the share-based incentive programme for the year 2018. The performance share programme, approved by the Board of Directors in 2017, includes three performance periods, calendar years 2017–2018, 2018–2019 and 2019–2020. Each performance period includes two measuring periods, both lasting for one calendar year. For the measuring periods, the Board of Directors will annually resolve on the performance criteria for each measuring period.
For the performance period of 2017-2018 started in 2017, the potential reward of the measuring period 2018 will be based on the business areas' Return on Capital Employed (ROCE, excluding restructuring costs) for the key employees of the business areas Kalmar, Hiab and MacGregor, and for Navis software divisions' key employees, on Navis' sales and on sales of Xvela business. For Cargotec Corporate key employees, the performance criterion is Cargotec's Return on Capital Employed (ROCE, excluding restructuring costs). After the end of the performance period, the Board of Directors will confirm the cumulative amount of rewards earned from the measuring periods 2017 and 2018, and potential rewards from the performance period 2017–2018 will be paid partly in Cargotec's class B shares and partly in cash in 2019. As a rule, no reward will be paid, if a key employee's employment or service ends before the reward payment. The shares paid as reward may not be transferred during an approximate one-year ownership and value creation period established for the shares.
For the new performance period of 2018–2019, the programme is directed to approximately 150 key employees, including the members of the Executive Board. The incentive programme supports increasing growth of the service and software business according to Cargotec's strategy. For the key employees of the business areas Kalmar, Hiab and MacGregor, the potential reward of the measuring period 2018 will be based on the business areas' service gross profit, and for Navis software divisions' key employees, on Navis' sales and on sales excluding TOS-business. For the Cargotec Corporate key employees, the performance criterion is Cargotec's service gross profit. The rewards to be paid on the basis of the performance period 2018-2019 will amount up to an approximate maximum total of 180,000 Cargotec's class B shares. In addition, the rewards include cash proportions that are intended to cover taxes and tax-related costs arising from the reward to the key employees. After the end of the performance period, the Board of Directors will confirm the cumulative amount of rewards earned from the measuring periods 2018 and 2019, and potential rewards from the performance period 2018–2019 will be paid partly in Cargotec's class B shares and partly in cash in 2020. As a rule, no reward will be paid, if a key employee's employment or service ends before the reward payment. The shares paid as reward may not be transferred during an approximate one-year ownership and value creation period established for the shares.
19/44
CARGOTEC CORPORATION Q1 2018 INTERIM REPORT 24 APRIL 2018 AT 2.00 PM EEST
Market capitalisation and trading At the end of March, the total market value of class B shares was EUR 2,384 (2,551) million, excluding own shares held by the company. The period-end market capitalisation, in which unlisted class A shares are valued at the average price of class B shares on the last trading day of the period, was EUR 2,798 (2,991) million, excluding own shares held by the company.
The class B share closed at EUR 43.26 (46.40) on the last trading day of March on Nasdaq Helsinki. The volume-weighted average share price for the financial period was EUR 47.21 (45.26), the highest quotation being EUR 51.30 (48.78) and the lowest EUR 43.04 (40.26). During the period, a total of 8 (10) million class B shares were traded on Nasdaq Helsinki, corresponding to a turnover of EUR 394 (445) million. In addition, according to Fidessa, a total of 13 (13) million class B shares were traded in several alternative marketplaces, such as Cboe CXE and LSE MTF, corresponding to a turnover of EUR 589 (576) million.
Short-term risks and uncertainties Developments in the global economy and cargo flows have a direct effect on Cargotec’s business environment and customers’ willingness to invest. A slowdown in global economic growth could reduce the growth in container traffic. Furthermore, the consolidation of ship companies and container terminal operators as well as the relatively low penetration of automation technology could postpone the customers’ investment decisions regarding container handling automation. Project executions may face risks related to schedule, cost and delivery guarantees. Furthermore, potential bottlenecks in the supply chain could postpone deliveries and have a negative impact on sales and results. Uncertainty may be increased by risks stemming from political instability, volatility on the currency and raw material markets, or from the financing sector. In addition, a possible trade war could have a significant impact on global flow of goods. Hiab’s demand is impacted by the development of the construction market. A significant share of Hiab’s orders are from the United States. Even though the cash flows are hedged for the existing order book, the weakening of the US dollar in the longer term could weaken Hiab’s results. Greater difficulty in obtaining financing would weaken customers’ liquidity and investments.
MacGregor's market situation still involves uncertainties. It is anticipated that the oversupply in the merchant ship market will take longer to balance out, since capacity will continue to increase while demand is expected to grow very moderately. At the same time, the low oil price and uncertainty regarding its development has led to an intense fall in investments by the oil industry and created oversupply in the offshore market. The concurrent deterioration in both markets has a negative impact on the financial situation of shipyards and ship owners, as well as ship operators. In the challenging market situation, customers may also try to postpone or cancel orders. In some cases the financial situation of customers may deteriorate significantly or even lead to customer insolvency.
Cargotec is involved in certain legal disputes and trials. The interpretation of international agreements and legislation may weaken the predictability of the end results of legal disputes and trials.
Risks regarding Cargotec’s acquisitions are related to for example the knowledge of the local markets, authority processes, customers, corporate culture as well as key employees.
There are also ethical risks related to the industries and the geographical scope where Cargotec operates in. Cargotec has increased its investments to develop ethical business practices and the related internal processes are continuously being developed further.
20/44

CARGOTEC CORPORATION Q1 2018 INTERIM REPORT 24 APRIL 2018 AT 2.00 PM EEST
More information on risks is available at www.cargotec.com, under Investors > Governance > Internal control and risk management.
Outlook for 2018 unchanged Cargotec reiterates its outlook published on 8 February 2018 and expects its operating profit excluding restructuring costs for 2018 to improve from 2017 (EUR 258.6 million, IFRS 15 restated).
Financial calendar 2018 Half year financial report January–June 2018, on Thursday, 19 July 2018 Interim report January–September 2018, on Friday, 26 October 2018
Helsinki, 24 April 2018 Cargotec Corporation Board of Directors
This interim report is unaudited.
21/44
CARGOTEC CORPORATION Q1 2018 INTERIM REPORT 24 APRIL 2018 AT 2.00 PM EEST
Consolidated statement of income
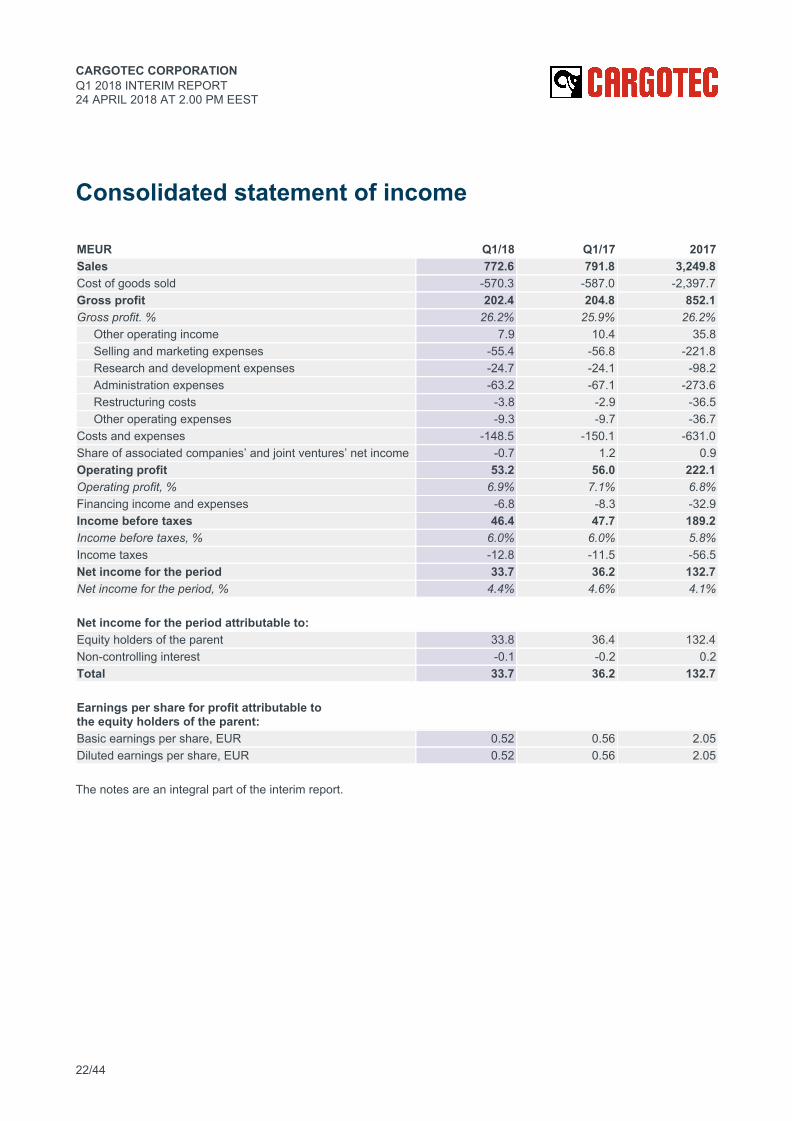
MEUR Q1/18 Q1/17 2017 Sales 772.6 791.8 3,249.8 Cost of goods sold -570.3 -587.0 -2,397.7 Gross profit 202.4 204.8 852.1 Gross profit. % 26.2% 25.9% 26.2%
Other operating income 7.9 10.4 35.8 Selling and marketing expenses -55.4 -56.8 -221.8 Research and development expenses -24.7 -24.1 -98.2 Administration expenses -63.2 -67.1 -273.6 Restructuring costs -3.8 -2.9 -36.5 Other operating expenses -9.3 -9.7 -36.7
Costs and expenses -148.5 -150.1 -631.0 Share of associated companies’ and joint ventures’ net income -0.7 1.2 0.9 Operating profit 53.2 56.0 222.1 Operating profit, % 6.9% 7.1% 6.8% Financing income and expenses -6.8 -8.3 -32.9 Income before taxes 46.4 47.7 189.2 Income before taxes, % 6.0% 6.0% 5.8% Income taxes -12.8 -11.5 -56.5 Net income for the period 33.7 36.2 132.7 Net income for the period, % 4.4% 4.6% 4.1% Net income for the period attributable to: Equity holders of the parent 33.8 36.4 132.4 Non-controlling interest -0.1 -0.2 0.2 Total 33.7 36.2 132.7 Earnings per share for profit attributable to the equity holders of the parent: Basic earnings per share, EUR 0.52 0.56 2.05 Diluted earnings per share, EUR 0.52 0.56 2.05 The notes are an integral part of the interim report.
22/44
CARGOTEC CORPORATION Q1 2018 INTERIM REPORT 24 APRIL 2018 AT 2.00 PM EEST
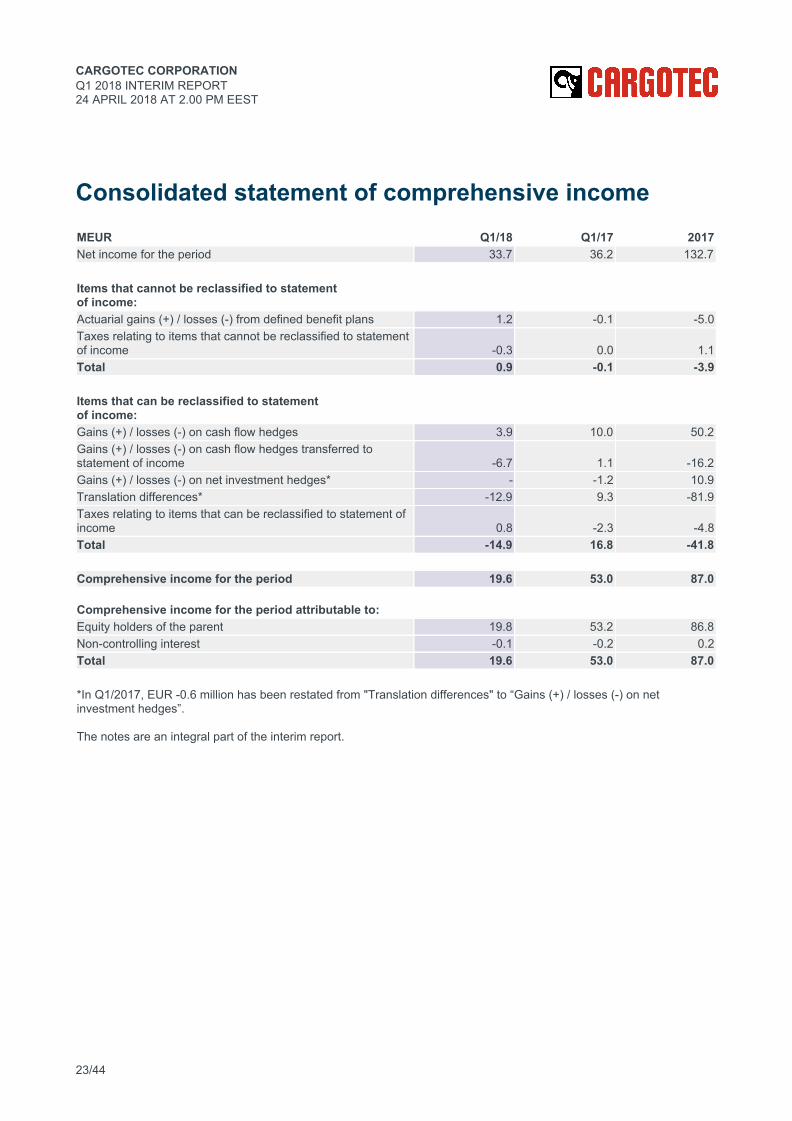
Consolidated statement of comprehensive income MEUR Q1/18 Q1/17 2017 Net income for the period 33.7 36.2 132.7 Items that cannot be reclassified to statement of income: Actuarial gains (+) / losses (-) from defined benefit plans 1.2 -0.1 -5.0 Taxes relating to items that cannot be reclassified to statement of income -0.3 0.0 1.1 Total 0.9 -0.1 -3.9 Items that can be reclassified to statement of income: Gains (+) / losses (-) on cash flow hedges 3.9 10.0 50.2 Gains (+) / losses (-) on cash flow hedges transferred to statement of income -6.7 1.1 -16.2 Gains (+) / losses (-) on net investment hedges* - -1.2 10.9 Translation differences* -12.9 9.3 -81.9 Taxes relating to items that can be reclassified to statement of income 0.8 -2.3 -4.8 Total -14.9 16.8 -41.8 Comprehensive income for the period 19.6 53.0 87.0 Comprehensive income for the period attributable to: Equity holders of the parent 19.8 53.2 86.8 Non-controlling interest -0.1 -0.2 0.2 Total 19.6 53.0 87.0 *In Q1/2017, EUR -0.6 million has been restated from "Translation differences" to “Gains (+) / losses (-) on net investment hedges”.
The notes are an integral part of the interim report.
23/44
CARGOTEC CORPORATION Q1 2018 INTERIM REPORT 24 APRIL 2018 AT 2.00 PM EEST
Consolidated balance sheet
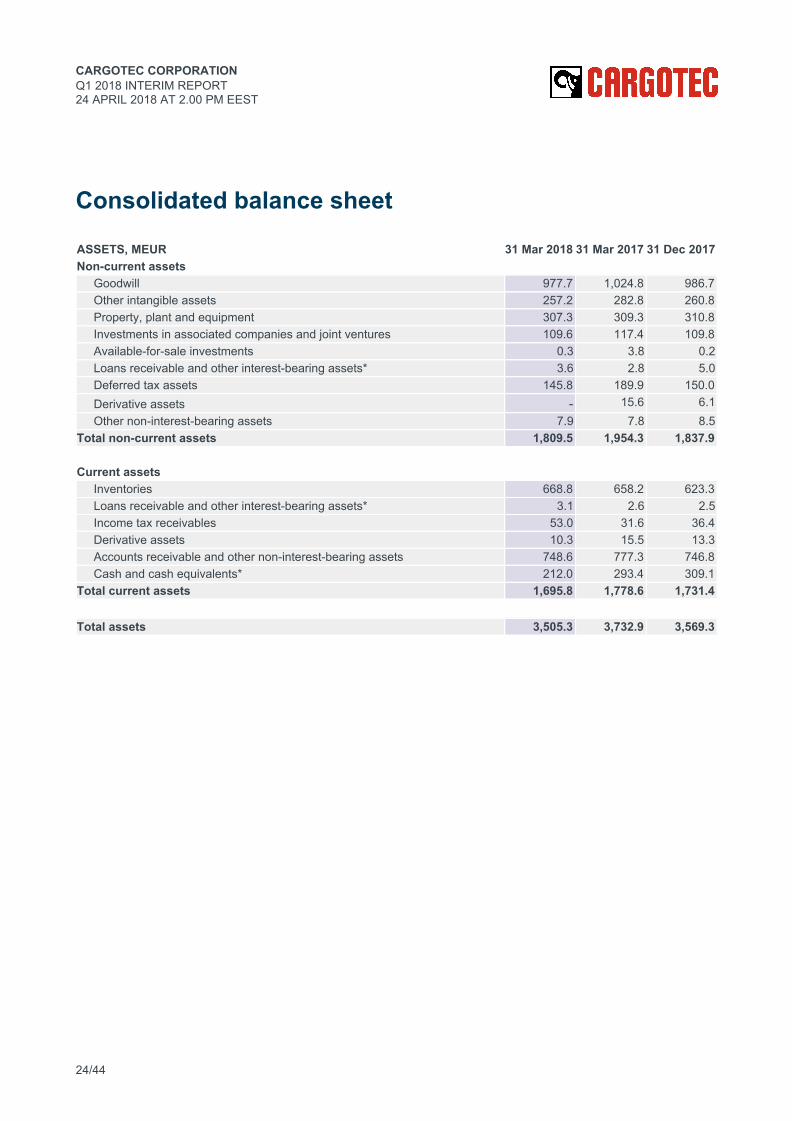
ASSETS, MEUR 31 Mar 2018 31 Mar 2017 31 Dec 2017 Non-current assets
Goodwill 977.7 1,024.8 986.7 Other intangible assets 257.2 282.8 260.8 Property, plant and equipment 307.3 309.3 310.8 Investments in associated companies and joint ventures 109.6 117.4 109.8 Available-for-sale investments 0.3 3.8 0.2 Loans receivable and other interest-bearing assets* 3.6 2.8 5.0 Deferred tax assets 145.8 189.9 150.0 Derivative assets - 15.6 6.1 Other non-interest-bearing assets 7.9 7.8 8.5
Total non-current assets 1,809.5 1,954.3 1,837.9 Current assets
Inventories 668.8 658.2 623.3 Loans receivable and other interest-bearing assets* 3.1 2.6 2.5 Income tax receivables 53.0 31.6 36.4 Derivative assets 10.3 15.5 13.3 Accounts receivable and other non-interest-bearing assets 748.6 777.3 746.8 Cash and cash equivalents* 212.0 293.4 309.1
Total current assets 1,695.8 1,778.6 1,731.4 Total assets 3,505.3 3,732.9 3,569.3
24/44
CARGOTEC CORPORATION Q1 2018 INTERIM REPORT 24 APRIL 2018 AT 2.00 PM EEST
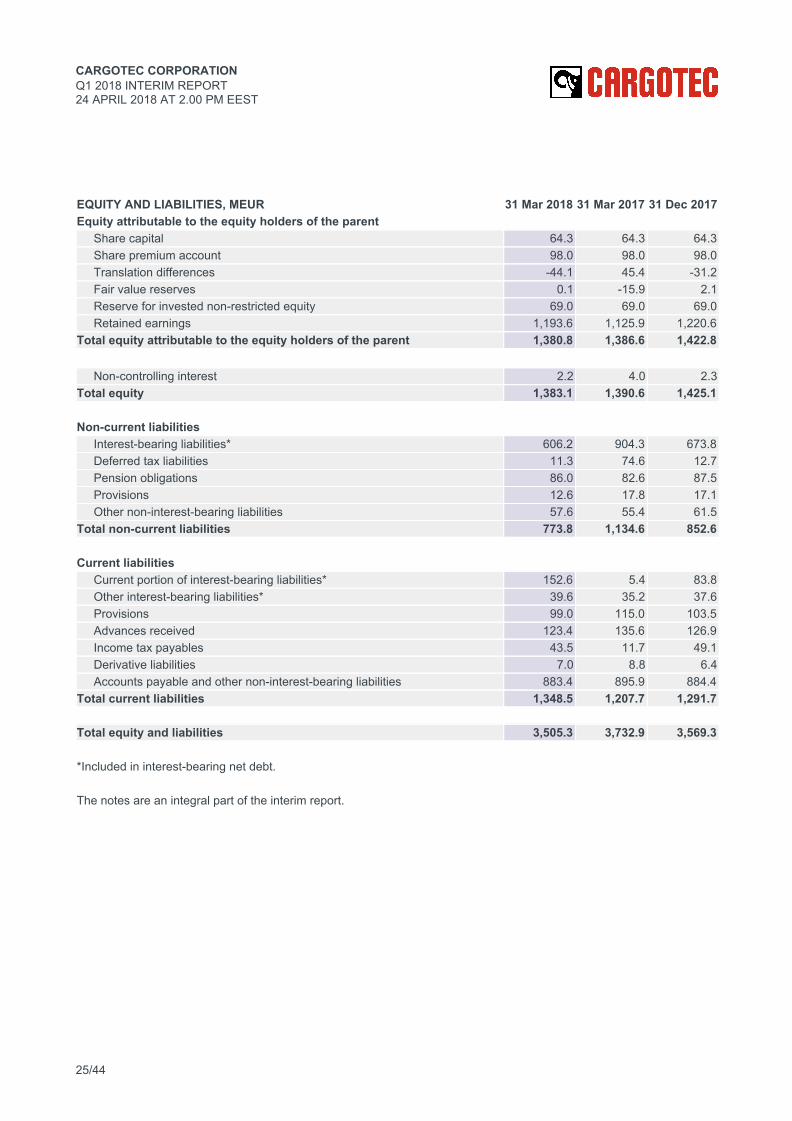
EQUITY AND LIABILITIES, MEUR 31 Mar 2018 31 Mar 2017 31 Dec 2017 Equity attributable to the equity holders of the parent
Share capital 64.3 64.3 64.3 Share premium account 98.0 98.0 98.0 Translation differences -44.1 45.4 -31.2 Fair value reserves 0.1 -15.9 2.1 Reserve for invested non-restricted equity 69.0 69.0 69.0 Retained earnings 1,193.6 1,125.9 1,220.6
Total equity attributable to the equity holders of the parent 1,380.8 1,386.6 1,422.8
Non-controlling interest 2.2 4.0 2.3 Total equity 1,383.1 1,390.6 1,425.1 Non-current liabilities
Interest-bearing liabilities* 606.2 904.3 673.8 Deferred tax liabilities 11.3 74.6 12.7 Pension obligations 86.0 82.6 87.5 Provisions 12.6 17.8 17.1 Other non-interest-bearing liabilities 57.6 55.4 61.5
Total non-current liabilities 773.8 1,134.6 852.6 Current liabilities
Current portion of interest-bearing liabilities* 152.6 5.4 83.8 Other interest-bearing liabilities* 39.6 35.2 37.6 Provisions 99.0 115.0 103.5 Advances received 123.4 135.6 126.9 Income tax payables 43.5 11.7 49.1 Derivative liabilities 7.0 8.8 6.4 Accounts payable and other non-interest-bearing liabilities 883.4 895.9 884.4
Total current liabilities 1,348.5 1,207.7 1,291.7 Total equity and liabilities 3,505.3 3,732.9 3,569.3 *Included in interest-bearing net debt. The notes are an integral part of the interim report.
25/44
CARGOTEC CORPORATION Q1 2018 INTERIM REPORT 24 APRIL 2018 AT 2.00 PM EEST
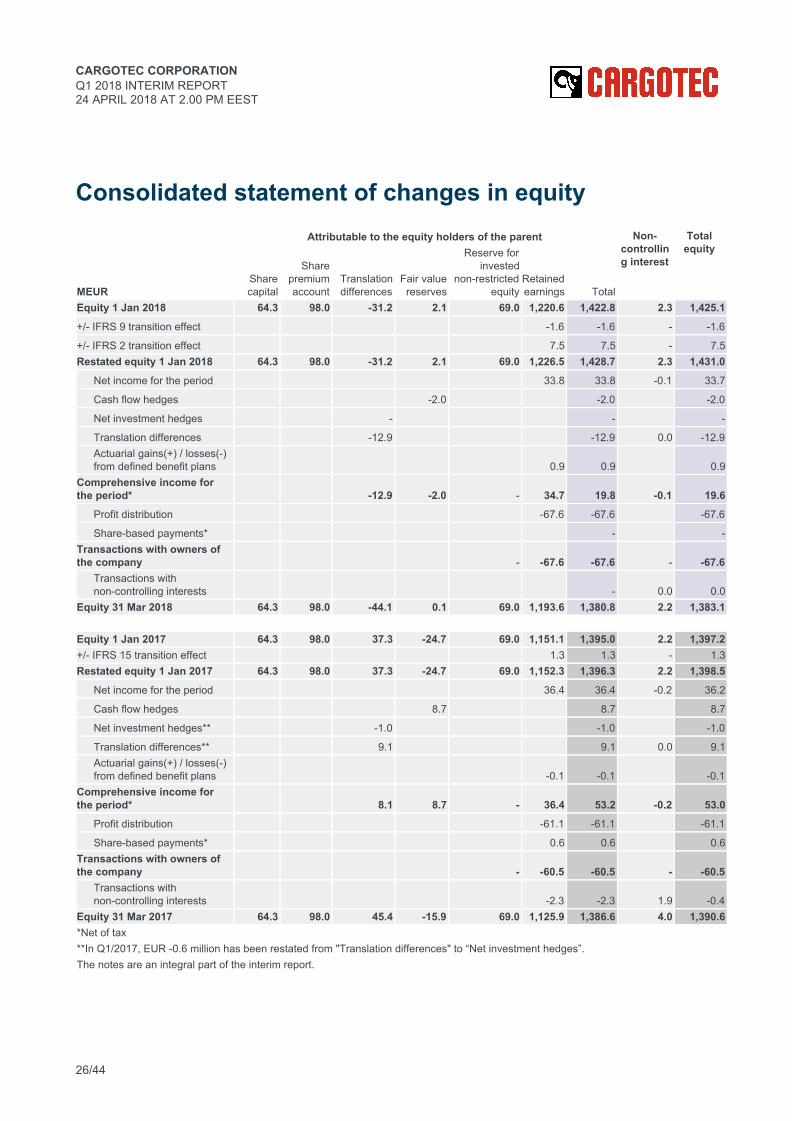
Consolidated statement of changes in equity
Attributable to the equity holders of the parent Non- controlling interest
Total equity
MEUR Share capital
Share premium account
Translation differences
Fair value reserves
Reserve for invested
non-restricted equity
Retained earnings Total
Equity 1 Jan 2018 64.3 98.0 -31.2 2.1 69.0 1,220.6 1,422.8 2.3 1,425.1
+/- IFRS 9 transition effect -1.6 -1.6 - -1.6
+/- IFRS 2 transition effect 7.5 7.5 - 7.5 Restated equity 1 Jan 2018 64.3 98.0 -31.2 2.1 69.0 1,226.5 1,428.7 2.3 1,431.0
Net income for the period 33.8 33.8 -0.1 33.7
Cash flow hedges -2.0 -2.0 -2.0
Net investment hedges - - -
Translation differences -12.9 -12.9 0.0 -12.9 Actuarial gains(+) / losses(-) from defined benefit plans 0.9 0.9 0.9
Comprehensive income for the period* -12.9 -2.0 - 34.7 19.8 -0.1 19.6
Profit distribution -67.6 -67.6 -67.6
Share-based payments* - - Transactions with owners of the company - -67.6 -67.6 - -67.6
Transactions with non-controlling interests - 0.0 0.0
Equity 31 Mar 2018 64.3 98.0 -44.1 0.1 69.0 1,193.6 1,380.8 2.2 1,383.1 Equity 1 Jan 2017 64.3 98.0 37.3 -24.7 69.0 1,151.1 1,395.0 2.2 1,397.2 +/- IFRS 15 transition effect 1.3 1.3 - 1.3 Restated equity 1 Jan 2017 64.3 98.0 37.3 -24.7 69.0 1,152.3 1,396.3 2.2 1,398.5
Net income for the period 36.4 36.4 -0.2 36.2
Cash flow hedges 8.7 8.7 8.7
Net investment hedges** -1.0 -1.0 -1.0
Translation differences** 9.1 9.1 0.0 9.1 Actuarial gains(+) / losses(-) from defined benefit plans -0.1 -0.1 -0.1
Comprehensive income for the period* 8.1 8.7 - 36.4 53.2 -0.2 53.0
Profit distribution -61.1 -61.1 -61.1
Share-based payments* 0.6 0.6 0.6 Transactions with owners of the company - -60.5 -60.5 - -60.5
Transactions with non-controlling interests -2.3 -2.3 1.9 -0.4
Equity 31 Mar 2017 64.3 98.0 45.4 -15.9 69.0 1,125.9 1,386.6 4.0 1,390.6 *Net of tax **In Q1/2017, EUR -0.6 million has been restated from "Translation differences" to “Net investment hedges”. The notes are an integral part of the interim report.
26/44
CARGOTEC CORPORATION Q1 2018 INTERIM REPORT 24 APRIL 2018 AT 2.00 PM EEST
Consolidated condensed statement of cash flows
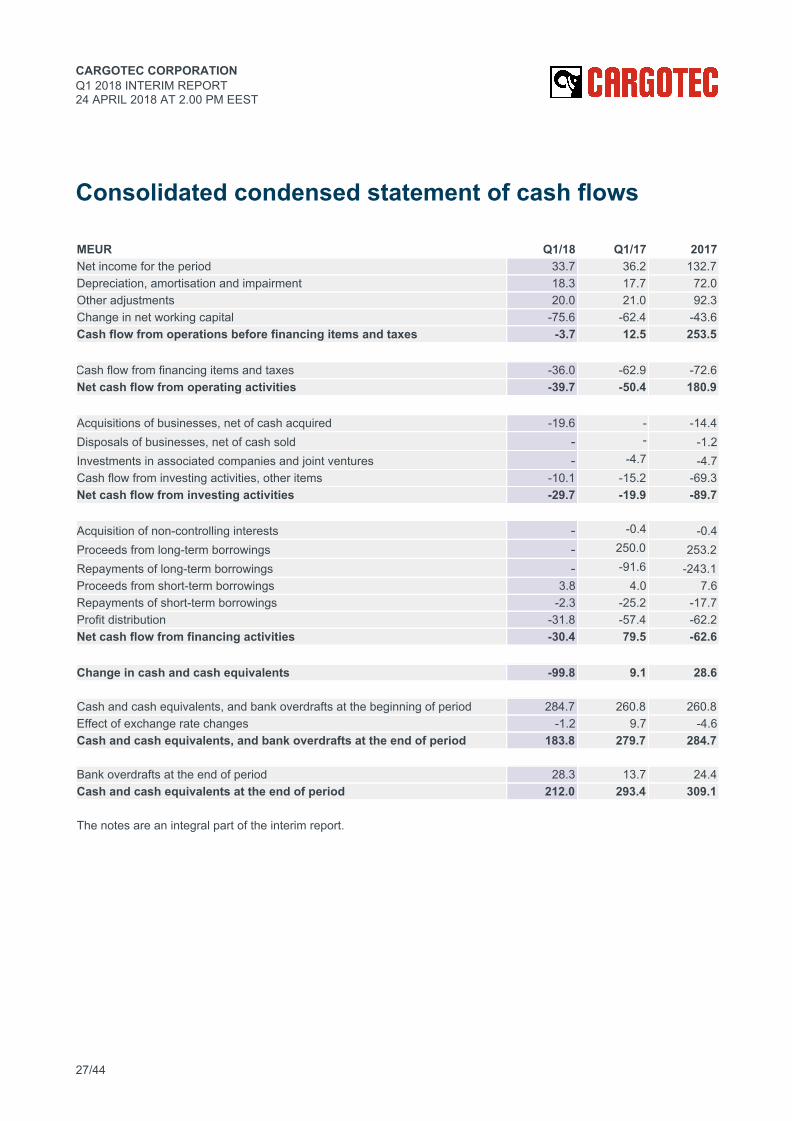
MEUR Q1/18 Q1/17 2017 Net income for the period 33.7 36.2 132.7 Depreciation, amortisation and impairment 18.3 17.7 72.0 Other adjustments 20.0 21.0 92.3 Change in net working capital -75.6 -62.4 -43.6 Cash flow from operations before financing items and taxes -3.7 12.5 253.5
Cash flow from financing items and taxes -36.0 -62.9 -72.6 Net cash flow from operating activities -39.7 -50.4 180.9 Acquisitions of businesses, net of cash acquired -19.6 - -14.4 Disposals of businesses, net of cash sold - - -1.2 Investments in associated companies and joint ventures - -4.7 -4.7 Cash flow from investing activities, other items -10.1 -15.2 -69.3 Net cash flow from investing activities -29.7 -19.9 -89.7 Acquisition of non-controlling interests - -0.4 -0.4 Proceeds from long-term borrowings - 250.0 253.2 Repayments of long-term borrowings - -91.6 -243.1 Proceeds from short-term borrowings 3.8 4.0 7.6 Repayments of short-term borrowings -2.3 -25.2 -17.7 Profit distribution -31.8 -57.4 -62.2 Net cash flow from financing activities -30.4 79.5 -62.6 Change in cash and cash equivalents -99.8 9.1 28.6 Cash and cash equivalents, and bank overdrafts at the beginning of period 284.7 260.8 260.8 Effect of exchange rate changes -1.2 9.7 -4.6 Cash and cash equivalents, and bank overdrafts at the end of period 183.8 279.7 284.7 Bank overdrafts at the end of period 28.3 13.7 24.4 Cash and cash equivalents at the end of period 212.0 293.4 309.1 The notes are an integral part of the interim report.
27/44
CARGOTEC CORPORATION Q1 2018 INTERIM REPORT 24 APRIL 2018 AT 2.00 PM EEST
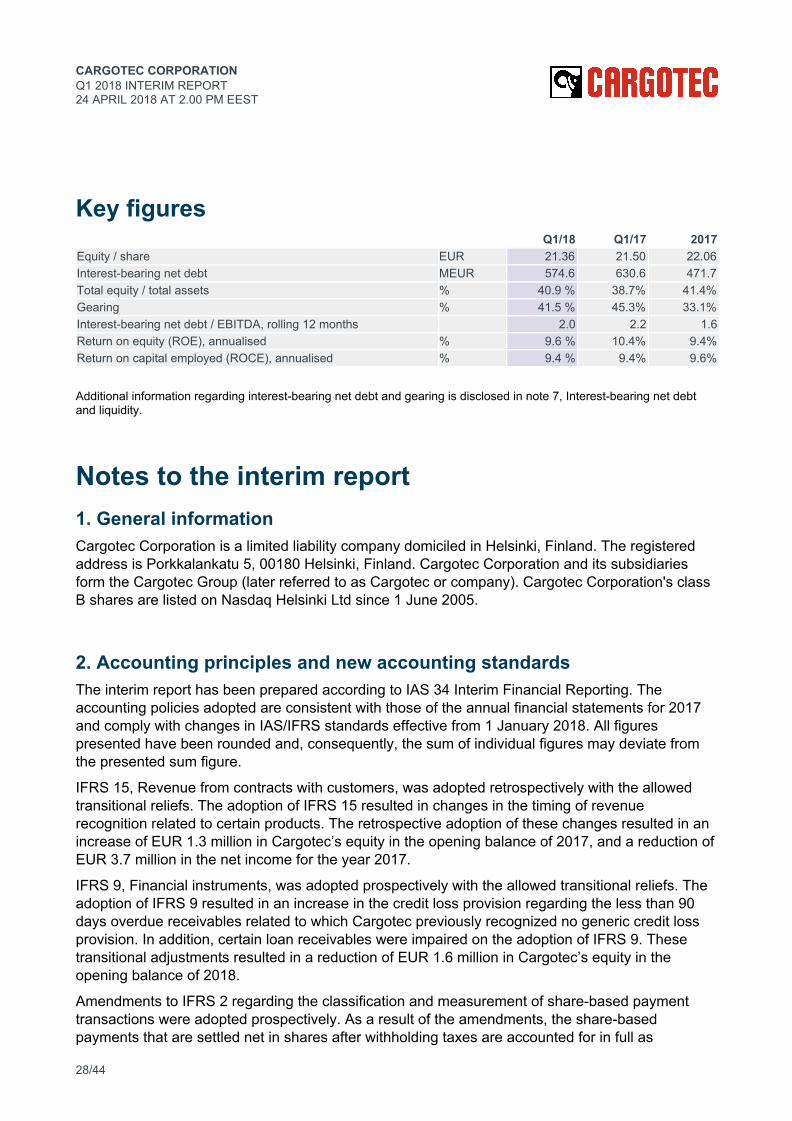
Key figures Q1/18 Q1/17 2017 Equity / share EUR 21.36 21.50 22.06 Interest-bearing net debt MEUR 574.6 630.6 471.7 Total equity / total assets % 40.9 % 38.7% 41.4% Gearing % 41.5 % 45.3% 33.1% Interest-bearing net debt / EBITDA, rolling 12 months 2.0 2.2 1.6 Return on equity (ROE), annualised % 9.6 % 10.4% 9.4% Return on capital employed (ROCE), annualised % 9.4 % 9.4% 9.6%
Additional information regarding interest-bearing net debt and gearing is disclosed in note 7, Interest-bearing net debt and liquidity.
Notes to the interim report 1. General information Cargotec Corporation is a limited liability company domiciled in Helsinki, Finland. The registered address is Porkkalankatu 5, 00180 Helsinki, Finland. Cargotec Corporation and its subsidiaries form the Cargotec Group (later referred to as Cargotec or company). Cargotec Corporation's class B shares are listed on Nasdaq Helsinki Ltd since 1 June 2005.
2. Accounting principles and new accounting standards The interim report has been prepared according to IAS 34 Interim Financial Reporting. The accounting policies adopted are consistent with those of the annual financial statements for 2017 and comply with changes in IAS/IFRS standards effective from 1 January 2018. All figures presented have been rounded and, consequently, the sum of individual figures may deviate from the presented sum figure.
IFRS 15, Revenue from contracts with customers, was adopted retrospectively with the allowed transitional reliefs. The adoption of IFRS 15 resulted in changes in the timing of revenue recognition related to certain products. The retrospective adoption of these changes resulted in an increase of EUR 1.3 million in Cargotec’s equity in the opening balance of 2017, and a reduction of EUR 3.7 million in the net income for the year 2017.
IFRS 9, Financial instruments, was adopted prospectively with the allowed transitional reliefs. The adoption of IFRS 9 resulted in an increase in the credit loss provision regarding the less than 90 days overdue receivables related to which Cargotec previously recognized no generic credit loss provision. In addition, certain loan receivables were impaired on the adoption of IFRS 9. These transitional adjustments resulted in a reduction of EUR 1.6 million in Cargotec’s equity in the opening balance of 2018.
Amendments to IFRS 2 regarding the classification and measurement of share-based payment transactions were adopted prospectively. As a result of the amendments, the share-based payments that are settled net in shares after withholding taxes are accounted for in full as
28/44
CARGOTEC CORPORATION Q1 2018 INTERIM REPORT 24 APRIL 2018 AT 2.00 PM EEST
equity-settled arrangements despite the fact that Cargotec pays in cash the taxes related to the rewards on behalf of the participants. The adoption of the IFRS 2 amendments resulted in an increase of EUR 7.5 million in Cargotec’s equity in the opening balance of 2018.
Cargotec's changed accounting principles regarding revenue from contracts with customers Sales include revenues from products and services sold net of sales taxes, discounts and translation differences from foreign currency denominated revenues. The revenue recognition criteria are usually applied separately to each contract, unless multiple contracts effectively form a single transaction, and within contracts, revenue recognition is determined separately for each distinct product or service. A product or service is considered to be a distinct performance obligation if it is separable from other contractual promises to the customer, and if the customer can benefit from it on its own or together with other readily available resources. Therefore, a single agreement including multiple deliverable elements may include one or more distinct items of revenue.
The transaction price allocated to distinct promised goods or services is based on the amount Cargotec expects to receive from the sale by taking into account the agreed contractual transaction price, and the assessment of impact of any related variable price elements, such as performance bonuses or late delivery penalties. The transaction price is allocated to distinct products and services in accordance with their relative fair values that are based either on list prices or expected production costs and margins, depending on the product or service.
Revenue is recognised separately for each distinct product or service either over time or at a certain point in time, based on fulfilment of the performance obligations and how the control of the product or service is transferred to the customer. The control is considered to be transferred over time if the benefit received from performance is produced and consumed simultaneously, or if the produced performance improves an asset controlled by the customer. In addition, control is considered to be transferred over time when delivering products with a highly customised design, if it is assessed that the product is not suitable as such or with minor modifications for another customer, and if Cargotec has a contractual right to a payment regarding the produced output. In other situations, revenue is recognised at the point in time when the control of the product is transferred to the customer. The timing of the transfer is primarily determined based on the transfer of risks and rewards. Depending on the type of product, applied delivery method and contract terms, the risks and rewards are considered to be transferred either in accordance with the applied delivery term, when the installation of the product is ready, or when the customer accepts the product.
If a customer contract is expected to be loss-making, the costs arising from the contract are estimated with the same principles that are applied to provisions and the expected loss is recognised immediately in the statement of income.
Revenue from sales of machines and equipment that are either manufactured in large quantities or their manufacturing requires no significant amount of design work is recognised at a point in time when the significant risks and rewards have been transferred to the buyer and the company no longer has the authority or control over the goods. When these products are sold without a delivery or installation, the revenue is recognised when the product is handed over or otherwise made available to the customer. If standard products are sold with a delivery but without installation, the timing of revenue recognition is stipulated by the applied Incoterm. If standard products are sold together with an installation service, the timing of revenue recognition is determined based on the
29/44
CARGOTEC CORPORATION Q1 2018 INTERIM REPORT 24 APRIL 2018 AT 2.00 PM EEST
complexity of the installation work. Complex installation services are considered to be performance obligations closely related to the installed products, and, therefore, the revenue from both is recognised only after the installation is completed. On the contrary, the non-complex installation services that are typically of short duration and low in value do not determine the timing of the product's revenue recognition.
Revenue from sales of machines and equipment, the manufacturing of which requires a significant amount of design work, is recognised over time by using the percentage of completion method if it is assessed that the product is not suitable as such or with minor modifications for another customer, and if Cargotec has a contractual right to a payment regarding the produced output. Due to this two-tier rule, the timing of the revenue recognition of these products is in practice determined by the payment terms of the contract. The percentage of completion is determined either by reference to the individual contract costs incurred to date as a percentage of the total estimated contract costs (cost-to-cost method) or by completion of a certain physical milestone (milestone method). If it is not possible to reliably estimate the outcome of a contract, costs are recognised as incurred and revenues only to an extent the corresponding costs are expected to be recovered.
Revenue from sales of ready-to-use software is recognised when the software is delivered or otherwise made available to the customer. Revenue is recognised at a point in time if the customer obtains a perpetual right to use it as it exists at the point in time at which the licence is granted. When the software sold with perpetual licence requires significant customer-specific customisation, the software licence and the customisation work are considered to be a combined performance obligation, and the related revenue is recognised by reference to the stage of completion based on the amount of work performed. If the outcome of a contract cannot be reliably estimated, the project costs are recognised in the statement of income during the period in which they are incurred, and the revenue related to the contract is recognised only to an amount corresponding with the costs incurred. If a software licence is sold for a defined period of time or as a service, the related revenue is recognised over the licence or service period.
Revenue from sales related to service contracts is recognised in accordance with the percentage of completion method when the outcome of the project can be reliably estimated. The stage of completion is determined by reference to the individual contract costs incurred to date as a percentage of the total estimated contract costs (cost-to-cost method) or by reference to the amount of service work performed from the expected total amount of service work to be performed (milestone method). The percentage of completion related to long-term and small value service contracts is not assessed on an individual contract level based on the costs incurred or amount of work performed, but it is based on an estimate of how the costs are generally incurred and services performed over a contract period with a similar length. When the services are delivered evenly over time, such as with software maintenance and support services and extended warranties, or require an undefined number of acts, the revenue is recognised on a straight-line basis over the contract period. If the outcome of a contract cannot be reliably estimated, the project costs are recognised in the statement of income during the period in which they are incurred, and the revenue only to the extent that the corresponding costs are expected to be recovered. Expected contract losses are recognised as expenses immediately. Revenue from short-term service orders is recognised when the service has been rendered.
Cargotec offers customer finance services to certain customer segments and distribution channels. In these transactions, Cargotec is involved in arranging financing to the customer or dealer either directly by itself, or in cooperation with a financing partner. It is typical that in these arrangements Cargotec continues to carry some level of residual value risk related to the sold product, or credit
30/44

CARGOTEC CORPORATION Q1 2018 INTERIM REPORT 24 APRIL 2018 AT 2.00 PM EEST
risk related to the end customer. Depending on the type and level of risk retained, Cargotec accounts for its sales under customer finance arrangements as normal sales, operating or finance leases, or financing arrangements in accordance with the true nature of the transaction.
Cargotec's changed accounting principles regarding financial assets Financial assets are classified in accordance with the applied measurement principle as financial assets at amortised cost, fair value through other comprehensive income, or fair value through profit or loss. Financial assets are classified at the initial recognition in accordance with the features and planned use of the asset. Financial assets are presented as non-current when their maturity exceeds one year.
Financial assets are measured at amortised cost if there is no intention to sell the asset and the expected contractual cash flow from it is based on interest and repayment of the principal amount. The loans and receivables measured at amortised cost mostly consist of accounts receivables and cash and cash equivalents. Loan receivables are measured initially at fair value plus transaction costs and less expected credit losses, and subsequently at amortised cost in accordance with the effective interest method. Changes in the amount of expected credit loss is reflected in the expected cash flows included in the amortised cost.
Accounts receivables are initially recognised at fair value less expected credit losses and subsequently at amortised cost less expected credit losses. Expected credit losses include two components. The first component is calculated mechanically by using a provision matrix in which the impairment is determined based on risk weights derived from the historical credit losses, and the ageing analysis of customer receivables. The second credit loss component is based on a qualitative forward-looking analysis based on which additional impairment exceeding the first credit loss component can be recognised to a receivable or group of receivables. Impairments and allowances are recognised in the statement of income under selling, general and administrative expenses. Bad debts are written off when an official announcement of liquidation or bankruptcy confirming that the receivable will not be collected is received.
Financial assets are measured at fair value through other comprehensive income if the asset can be sold before it matures and the contractual cash flow from it is based on interest and repayment of principal. The financial assets included in the class are measured initially at fair value plus transaction costs and less expected credit losses, and subsequently at fair value less expected credit losses. In addition, the effective portion of the fair value changes related to derivatives under hedge accounting are measured in accordance with this category throughout the hedge relationship.
Financial assets measured at fair value through profit or loss are those financial assets that do not belong to the previous classes, including equity investments, derivative instruments to which no hedge accounting is applied, and financial assets held for trading or from which the expected contractual cash flows on initial recognition are not solely based on interest and repayment of principal. The transaction costs and subsequent fair value changes of financial assets recognised at fair value through profit or loss are recognised directly in the statement of income.
Purchases and sales of derivative instruments are recognised on the trade date, while transactions in the other financial asset categories are recognised on the settlement date.
A financial asset is derecognised when the contractual rights to the cash flows from the asset expire or are transferred so that the material risks and rewards related to the ownership of the asset have been transferred to another party.
31/44
CARGOTEC CORPORATION Q1 2018 INTERIM REPORT 24 APRIL 2018 AT 2.00 PM EEST
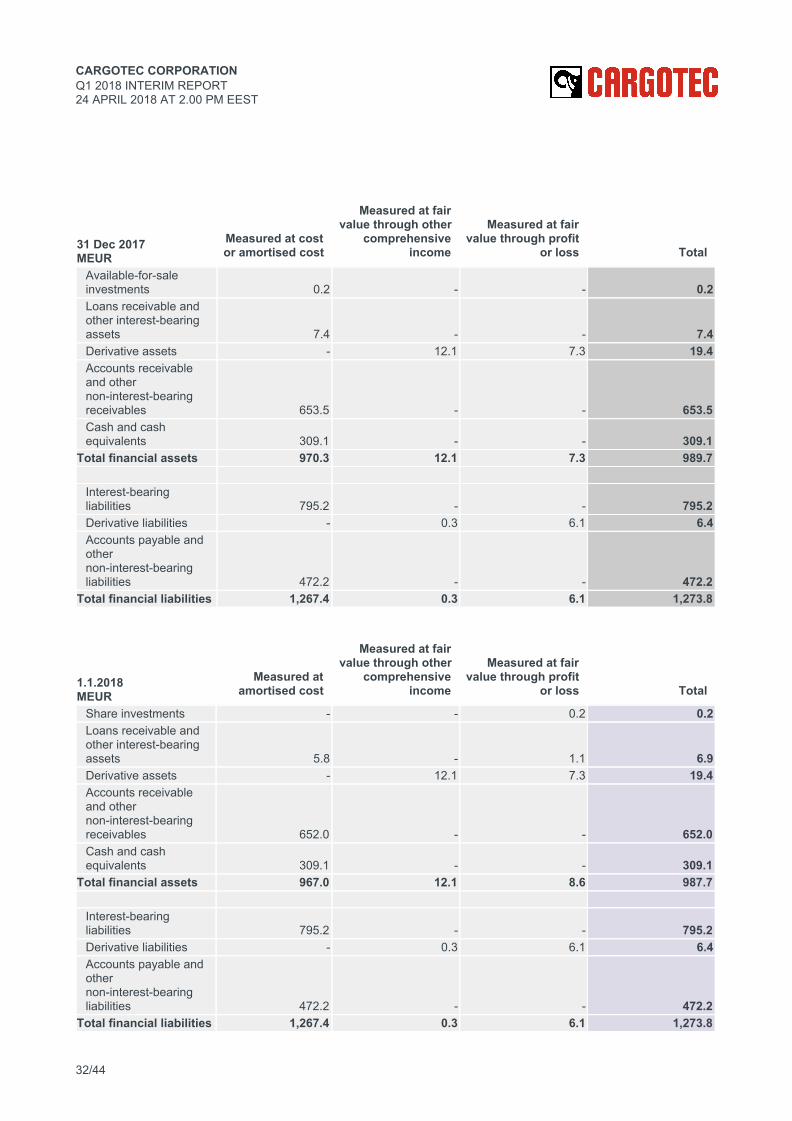
31 Dec 2017 MEUR
Measured at cost or amortised cost
Measured at fair value through other
comprehensive income
Measured at fair value through profit
or loss Total
Available-for-sale investments 0.2 - - 0.2 Loans receivable and other interest-bearing assets 7.4 - - 7.4 Derivative assets - 12.1 7.3 19.4 Accounts receivable and other non-interest-bearing receivables 653.5 - - 653.5 Cash and cash equivalents 309.1 - - 309.1
Total financial assets 970.3 12.1 7.3 989.7 Interest-bearing liabilities 795.2 - - 795.2 Derivative liabilities - 0.3 6.1 6.4 Accounts payable and other non-interest-bearing liabilities 472.2 - - 472.2
Total financial liabilities 1,267.4 0.3 6.1 1,273.8
1.1.2018 MEUR
Measured at amortised cost
Measured at fair value through other
comprehensive income
Measured at fair value through profit
or loss Total
Share investments - - 0.2 0.2 Loans receivable and other interest-bearing assets 5.8 - 1.1 6.9 Derivative assets - 12.1 7.3 19.4 Accounts receivable and other non-interest-bearing receivables 652.0 - - 652.0 Cash and cash equivalents 309.1 - - 309.1
Total financial assets 967.0 12.1 8.6 987.7 Interest-bearing liabilities 795.2 - - 795.2 Derivative liabilities - 0.3 6.1 6.4 Accounts payable and other non-interest-bearing liabilities 472.2 - - 472.2
Total financial liabilities 1,267.4 0.3 6.1 1,273.8
32/44

CARGOTEC CORPORATION Q1 2018 INTERIM REPORT 24 APRIL 2018 AT 2.00 PM EEST
Cargotec has recognised the following adjustments on 1 January 2018 due to adoption of IFRS 9:
Available-for-sale investments of EUR 0.2 million has been reclassified to share investments measured at fair value through profit or loss.
Loans receivable and other interest-bearing assets of EUR 1.1 million have been reclassified to financial assets measured at fair value through profit or loss, and an impairment of EUR 0.5 million has been recognised regarding the amounts measured at amortised cost.
An impairment of EUR 1.5 million has been recognised in accounts receivable and other non-interest-bearing assets due to the adoption of the new credit loss model.
Cargotec's changed accounting principles regarding share-based payments Cargotec Corporation has share-based incentive plans which include incentives paid as shares or in cash. The benefits granted in accordance with the incentive plan are valued at fair value at the grant date and are expensed on a straight-line basis over the vesting period. The fair value of the equity-settled incentives is the market value at the grant date. The share-based payments settled in equity instruments are not revalued subsequently, and the cost from these arrangements is recognised as an increase in equity. The cash-settled share-based incentives are valued at fair value at each closing until the settlement date and recognised as a liability. However, the net-settled arrangements in which Cargotec has an obligation to withhold income taxes related to the paid rewards, and, therefore, part of the reward is used to pay the income taxes, are treated in full as equity-settled share-based incentives despite the tax portion paid in cash. The gross-settled arrangements in which the earned rewards are determined in full as share-based payments settled in equity instruments on top of which Cargotec Corporation additionally pays taxes, if necessary, are treated as arrangements that consist of both equity-settled and cash-settled portions.
The expensed amount of the benefits is based on the group's estimate of the amount of benefits to be paid at the end of the vesting period. Market conditions and non-vesting conditions are considered in determining the fair value of the benefit. Instead, the non-market criteria, like profitability or increase in sales, are not considered in measuring the fair value of the benefit but the are taken into account when estimating the final amount of benefits. The estimate is updated on each reporting date and changes in estimates are recorded through the statement of income.
33/44

CARGOTEC CORPORATION Q1 2018 INTERIM REPORT 24 APRIL 2018 AT 2.00 PM EEST
3. Segment information Sales, MEUR Q1/18 Q1/17 2017 Kalmar 371 364 1,598 Hiab 276 270 1,084 MacGregor 126 158 571 Internal sales 0 0 -2 Total 773 792 3,250 Sales by geographical area, MEUR Q1/18 Q1/17 2017 EMEA 362 333 1,423 Asia-Pacific 157 195 793 Americas 254 263 1,034 Total 773 792 3,250 Sales by geographical area, % Q1/18 Q1/17 2017 EMEA 47% 42% 44% Asia-Pacific 20% 25% 24% Americas 33% 33% 32% Total 100% 100% 100% Operating profit and EBITDA, MEUR Q1/18 Q1/17 2017 Kalmar 27.9 26.6 126.6 Hiab 36.1 39.5 157.0 MacGregor 0.1 1.6 -5.2 Corporate administration and support functions -10.9 -11.7 -56.3 Operating profit 53.2 56.0 222.1 Depreciation and amortisation 18.3 17.7 72.0 EBITDA 71.5 73.7 294.2 Operating profit, % Q1/18 Q1/17 2017 Kalmar 7.5% 7.3% 7.9% Hiab 13.1% 14.6% 14.5% MacGregor 0.1% 1.0% -0.9% Cargotec 6.9% 7.1% 6.8% Restructuring costs, MEUR Q1/18 Q1/17 2017 Kalmar -0.8 -1.2 -6.4 Hiab - 0.0 -0.2 MacGregor -0.1 -0.6 -15.8 Corporate administration and support functions -2.9 -1.0 -14.1 Total -3.8 -2.9 -36.5 Operating profit excl. restructuring costs, MEUR Q1/18 Q1/17 2017 Kalmar 28.7 27.9 133.1 Hiab 36.1 39.5 157.2 MacGregor 0.2 2.2 10.6 Corporate administration and support functions -8.0 -10.7 -42.2 Total 57.0 58.9 258.6
34/44

CARGOTEC CORPORATION Q1 2018 INTERIM REPORT 24 APRIL 2018 AT 2.00 PM EEST
Operating profit excl. restructuring costs, % Q1/18 Q1/17 2017 Kalmar 7.7% 7.7% 8.3% Hiab 13.1% 14.6% 14.5% MacGregor 0.2% 1.4% 1.9% Cargotec 7.4% 7.4% 8.0% Orders received, MEUR Q1/18 Q1/17 2017 Kalmar 432 448 1,555 Hiab 307 288 1,116 MacGregor 124 121 521 Internal orders received 0 0 -2 Total 863 857 3,190 Orders received by geographical area, MEUR Q1/18 Q1/17 2017 EMEA 403 403 1,512 Asia-Pacific 167 159 614 Americas 293 294 1,064 Total 863 857 3,190 Orders received by geographical area, % Q1/18 Q1/17 2017 EMEA 47% 47% 48% Asia-Pacific 19% 19% 19% Americas 34% 34% 33% Total 100% 100% 100% Order book, MEUR 31 Mar 2018 31 Mar 2017 31 Dec 2017 Kalmar 837 973 786 Hiab 329 302 300 MacGregor 519 547 481 Internal order book -1 -1 -1 Total 1,684 1,821 1,566 Number of employees at the end of period 31 Mar 2018 31 Mar 2017 31 Dec 2017 Kalmar 5,702 5,656 5,819 Hiab 3,466 3,099 3,370 MacGregor 1,947 2,064 1,859 Corporate administration and support functions 383 236 203 Total 11,498 11,055 11,251 Average number of employees Q1/18 Q1/17 2017 Kalmar 5,727 5,666 5,740 Hiab 3,436 3,052 3,192 MacGregor 1,852 2,093 1,965 Corporate administration and support functions 319 232 232 Total 11,334 11,043 11,128
35/44
CARGOTEC CORPORATION Q1 2018 INTERIM REPORT 24 APRIL 2018 AT 2.00 PM EEST
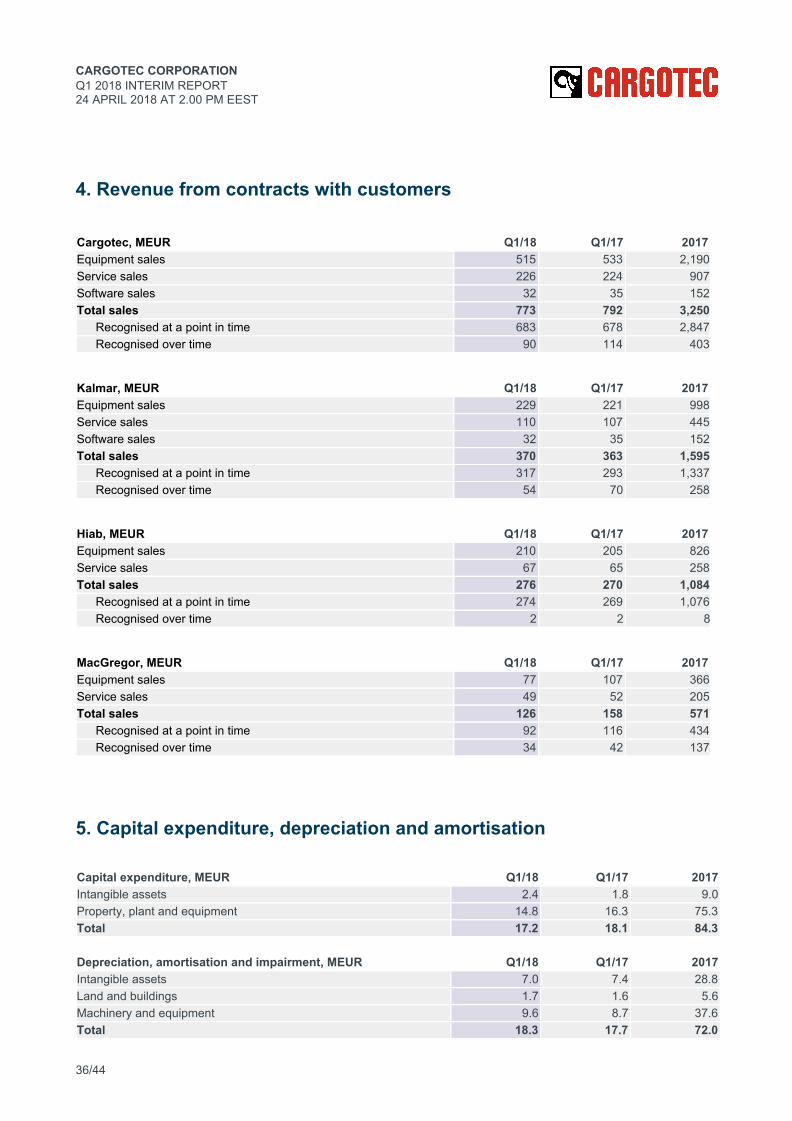
4. Revenue from contracts with customers
Cargotec, MEUR Q1/18 Q1/17 2017 Equipment sales 515 533 2,190Service sales 226 224 907Software sales 32 35 152Total sales 773 792 3,250
Recognised at a point in time 683 678 2,847Recognised over time 90 114 403
Kalmar, MEUR Q1/18 Q1/17 2017 Equipment sales 229 221 998Service sales 110 107 445Software sales 32 35 152Total sales 370 363 1,595
Recognised at a point in time 317 293 1,337Recognised over time 54 70 258
Hiab, MEUR Q1/18 Q1/17 2017 Equipment sales 210 205 826Service sales 67 65 258Total sales 276 270 1,084
Recognised at a point in time 274 269 1,076Recognised over time 2 2 8
MacGregor, MEUR Q1/18 Q1/17 2017 Equipment sales 77 107 366Service sales 49 52 205Total sales 126 158 571
Recognised at a point in time 92 116 434Recognised over time 34 42 137
5. Capital expenditure, depreciation and amortisation Capital expenditure, MEUR Q1/18 Q1/17 2017 Intangible assets 2.4 1.8 9.0 Property, plant and equipment 14.8 16.3 75.3 Total 17.2 18.1 84.3
Depreciation, amortisation and impairment, MEUR Q1/18 Q1/17 2017 Intangible assets 7.0 7.4 28.8 Land and buildings 1.7 1.6 5.6 Machinery and equipment 9.6 8.7 37.6 Total 18.3 17.7 72.0
36/44
CARGOTEC CORPORATION Q1 2018 INTERIM REPORT 24 APRIL 2018 AT 2.00 PM EEST
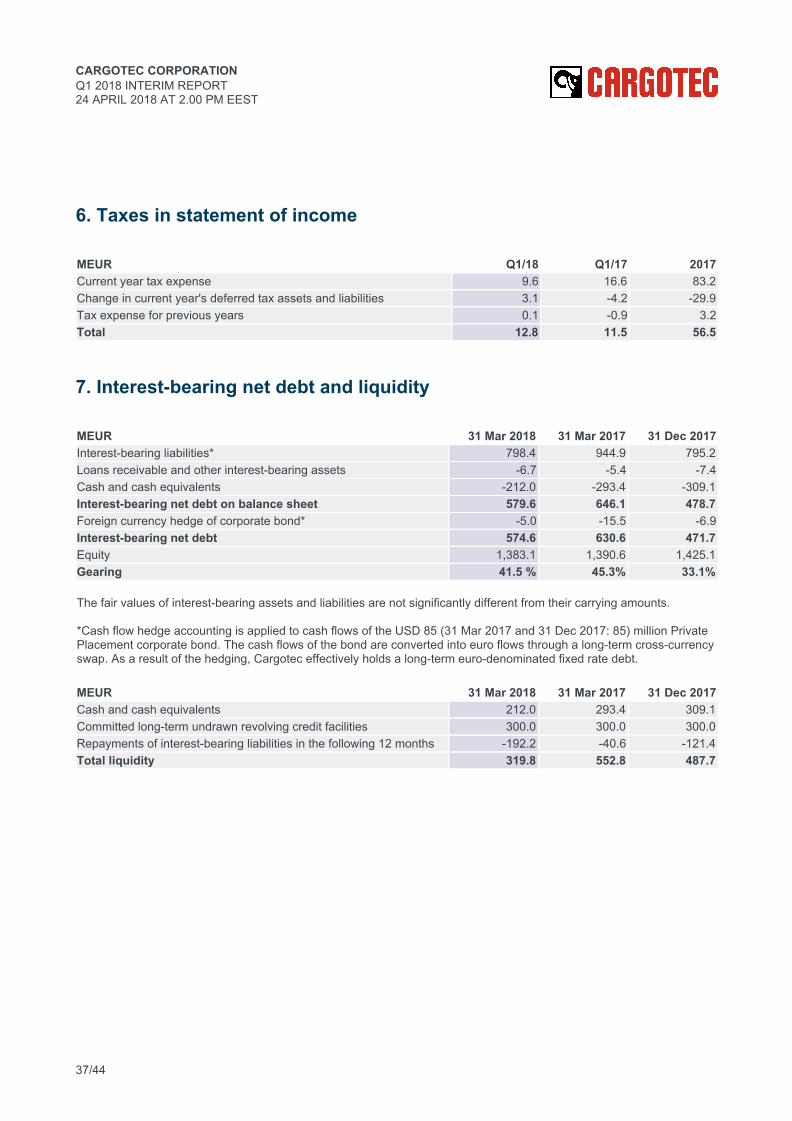
6. Taxes in statement of income MEUR Q1/18 Q1/17 2017 Current year tax expense 9.6 16.6 83.2 Change in current year's deferred tax assets and liabilities 3.1 -4.2 -29.9 Tax expense for previous years 0.1 -0.9 3.2 Total 12.8 11.5 56.5
7. Interest-bearing net debt and liquidity MEUR 31 Mar 2018 31 Mar 2017 31 Dec 2017 Interest-bearing liabilities* 798.4 944.9 795.2 Loans receivable and other interest-bearing assets -6.7 -5.4 -7.4 Cash and cash equivalents -212.0 -293.4 -309.1 Interest-bearing net debt on balance sheet 579.6 646.1 478.7 Foreign currency hedge of corporate bond* -5.0 -15.5 -6.9 Interest-bearing net debt 574.6 630.6 471.7 Equity 1,383.1 1,390.6 1,425.1 Gearing 41.5 % 45.3% 33.1%
The fair values of interest-bearing assets and liabilities are not significantly different from their carrying amounts. *Cash flow hedge accounting is applied to cash flows of the USD 85 (31 Mar 2017 and 31 Dec 2017: 85) million Private Placement corporate bond. The cash flows of the bond are converted into euro flows through a long-term cross-currency swap. As a result of the hedging, Cargotec effectively holds a long-term euro-denominated fixed rate debt. MEUR 31 Mar 2018 31 Mar 2017 31 Dec 2017 Cash and cash equivalents 212.0 293.4 309.1 Committed long-term undrawn revolving credit facilities 300.0 300.0 300.0 Repayments of interest-bearing liabilities in the following 12 months -192.2 -40.6 -121.4 Total liquidity 319.8 552.8 487.7
37/44
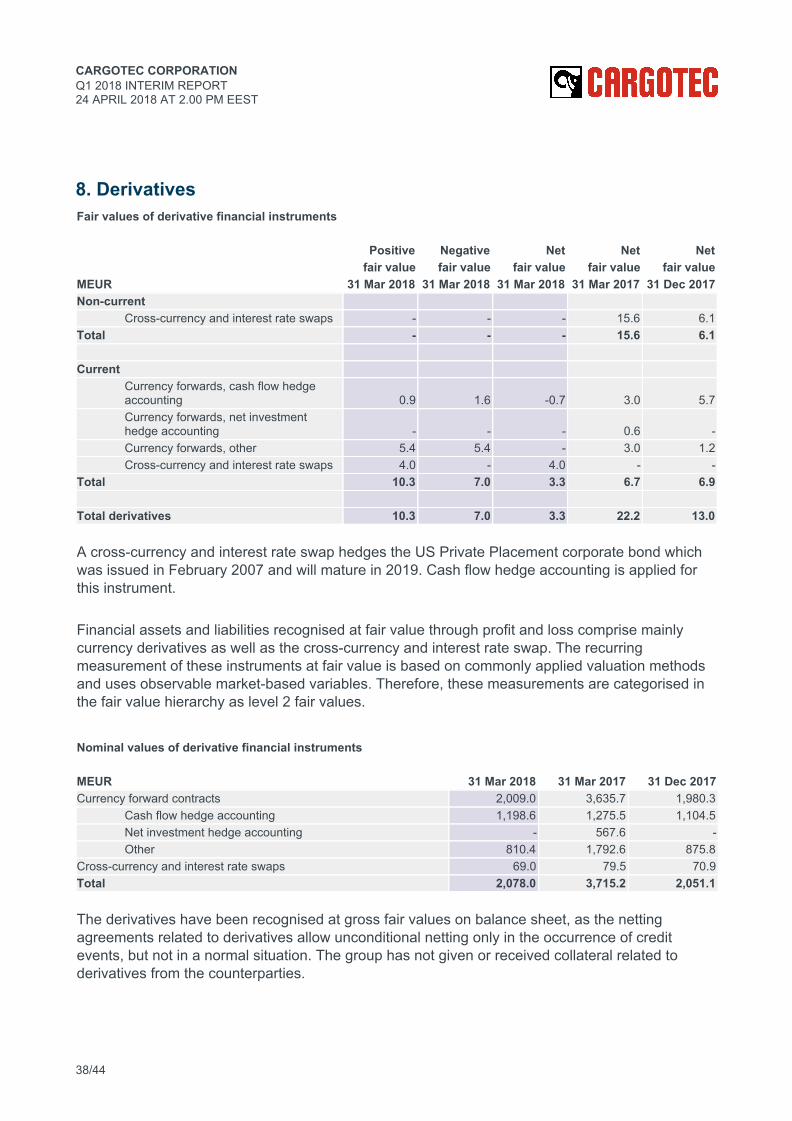
CARGOTEC CORPORATION Q1 2018 INTERIM REPORT 24 APRIL 2018 AT 2.00 PM EEST
8. Derivatives Fair values of derivative financial instruments Positive Negative Net Net Net fair value fair value fair value fair value fair value MEUR 31 Mar 2018 31 Mar 2018 31 Mar 2018 31 Mar 2017 31 Dec 2017 Non-current
Cross-currency and interest rate swaps - - - 15.6 6.1 Total - - - 15.6 6.1 Current
Currency forwards, cash flow hedge accounting 0.9 1.6 -0.7 3.0 5.7 Currency forwards, net investment hedge accounting - - - 0.6 - Currency forwards, other 5.4 5.4 - 3.0 1.2 Cross-currency and interest rate swaps 4.0 - 4.0 - -
Total 10.3 7.0 3.3 6.7 6.9 Total derivatives 10.3 7.0 3.3 22.2 13.0 A cross-currency and interest rate swap hedges the US Private Placement corporate bond which was issued in February 2007 and will mature in 2019. Cash flow hedge accounting is applied for this instrument. Financial assets and liabilities recognised at fair value through profit and loss comprise mainly currency derivatives as well as the cross-currency and interest rate swap. The recurring measurement of these instruments at fair value is based on commonly applied valuation methods and uses observable market-based variables. Therefore, these measurements are categorised in the fair value hierarchy as level 2 fair values.
Nominal values of derivative financial instruments MEUR 31 Mar 2018 31 Mar 2017 31 Dec 2017 Currency forward contracts 2,009.0 3,635.7 1,980.3
Cash flow hedge accounting 1,198.6 1,275.5 1,104.5 Net investment hedge accounting - 567.6 - Other 810.4 1,792.6 875.8
Cross-currency and interest rate swaps 69.0 79.5 70.9 Total 2,078.0 3,715.2 2,051.1 The derivatives have been recognised at gross fair values on balance sheet, as the netting agreements related to derivatives allow unconditional netting only in the occurrence of credit events, but not in a normal situation. The group has not given or received collateral related to derivatives from the counterparties.
38/44

CARGOTEC CORPORATION Q1 2018 INTERIM REPORT 24 APRIL 2018 AT 2.00 PM EEST
9. Commitments
MEUR 31 Mar 2018 31 Mar 2017 31 Dec 2017 Guarantees - 0.2 0.2 Customer financing 19.1 19.3 18.4 Operating leases 184.4 188.7 189.4 Other contingent liabilities 0.5 2.3 0.6 Total 204.0 210.5 208.6 Cargotec Corporation has guaranteed obligations of Cargotec companies arising from ordinary course of business. The total amount of these guarantees on 31 March 2018 was EUR 470.3 (31 Mar 2017: 401.1 and 31 Dec 2017: 461.2) million.
Certain products are sold under customer finance arrangements in which some level of risk is typically retained by Cargotec. When the level of retained risk is low and, therefore, not reflected on the balance sheet, it is reported in full as a contingent liability under commitments. No significant liabilities are expected to arise from the commitments related to customer financing. Cargotec leases globally a large part of the properties needed in the operations under non-cancellable operating leases with varying terms and conditions.
The future minimum lease payments under non-cancellable operating leases MEUR 31 Mar 2018 31 Mar 2017 31 Dec 2017 Less than 1 year 36.3 34.2 37.3 1–5 years 84.9 82.2 87.3 Over 5 years 63.3 72.4 64.8 Total 184.4 188.7 189.4 The aggregate operating lease expenses totalled EUR 12.5 (1–3/2017: 10.3 ja 1–12/2017: 40.1) million. Cargotec received in October 2016 a USD 13 million verdict in a local jury trial in Hempstead, USA. Verdict is related to business acquisition negotiations Cargotec USA had in 2010 and 2011. The negotiations were closed without results. The claim is based on Cargotec having breached confidentiality obligations related to the negotiations. Cargotec disputes the claim and has appealed to the Court of Appeals. There are also certain other legal claims and disputes based on various grounds pending against Cargotec around the world. Management believes that the outcome of these disputes will not have a material effect on Cargotec's financial position.
39/44
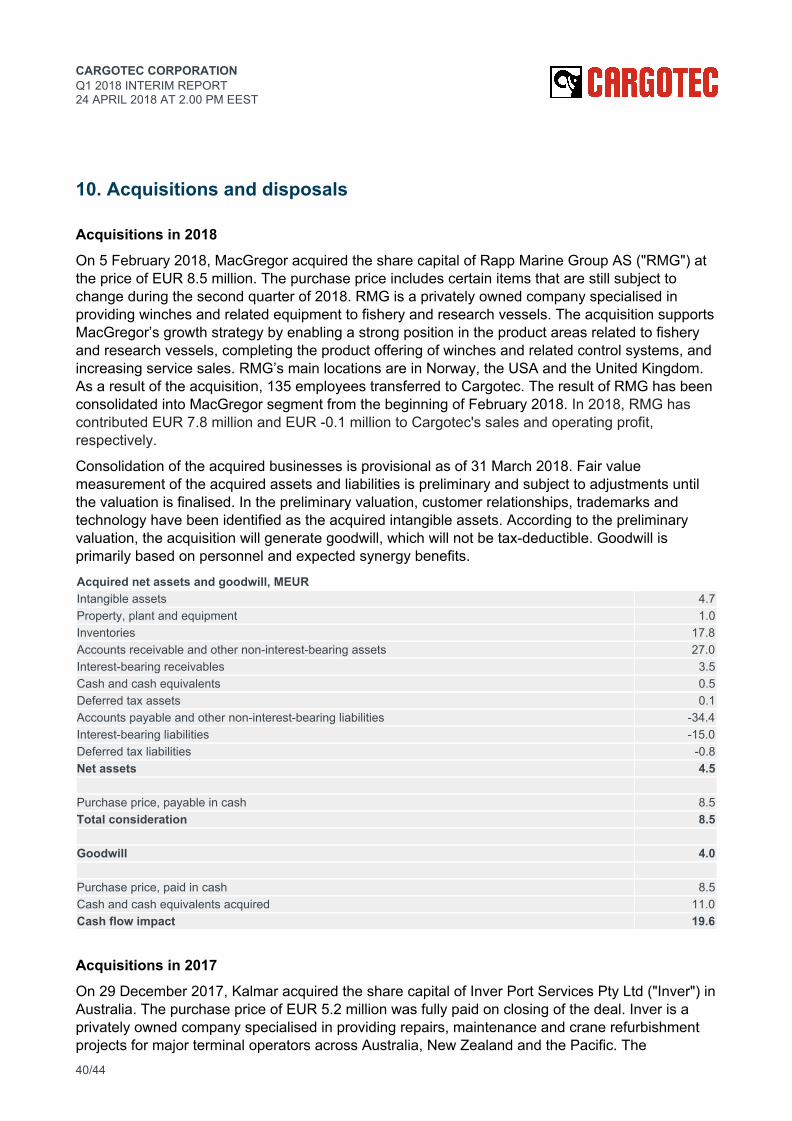
CARGOTEC CORPORATION Q1 2018 INTERIM REPORT 24 APRIL 2018 AT 2.00 PM EEST
10. Acquisitions and disposals Acquisitions in 2018 On 5 February 2018, MacGregor acquired the share capital of Rapp Marine Group AS ("RMG") at the price of EUR 8.5 million. The purchase price includes certain items that are still subject to change during the second quarter of 2018. RMG is a privately owned company specialised in providing winches and related equipment to fishery and research vessels. The acquisition supports MacGregor’s growth strategy by enabling a strong position in the product areas related to fishery and research vessels, completing the product offering of winches and related control systems, and increasing service sales. RMG’s main locations are in Norway, the USA and the United Kingdom. As a result of the acquisition, 135 employees transferred to Cargotec. The result of RMG has been consolidated into MacGregor segment from the beginning of February 2018. In 2018, RMG has contributed EUR 7.8 million and EUR -0.1 million to Cargotec's sales and operating profit, respectively.
Consolidation of the acquired businesses is provisional as of 31 March 2018. Fair value measurement of the acquired assets and liabilities is preliminary and subject to adjustments until the valuation is finalised. In the preliminary valuation, customer relationships, trademarks and technology have been identified as the acquired intangible assets. According to the preliminary valuation, the acquisition will generate goodwill, which will not be tax-deductible. Goodwill is primarily based on personnel and expected synergy benefits.
Acquired net assets and goodwill, MEUR Intangible assets 4.7 Property, plant and equipment 1.0 Inventories 17.8 Accounts receivable and other non-interest-bearing assets 27.0 Interest-bearing receivables 3.5 Cash and cash equivalents 0.5 Deferred tax assets 0.1 Accounts payable and other non-interest-bearing liabilities -34.4 Interest-bearing liabilities -15.0 Deferred tax liabilities -0.8 Net assets 4.5 Purchase price, payable in cash 8.5 Total consideration 8.5 Goodwill 4.0 Purchase price, paid in cash 8.5 Cash and cash equivalents acquired 11.0 Cash flow impact 19.6
Acquisitions in 2017 On 29 December 2017, Kalmar acquired the share capital of Inver Port Services Pty Ltd ("Inver") in Australia. The purchase price of EUR 5.2 million was fully paid on closing of the deal. Inver is a privately owned company specialised in providing repairs, maintenance and crane refurbishment projects for major terminal operators across Australia, New Zealand and the Pacific. The 40/44

CARGOTEC CORPORATION Q1 2018 INTERIM REPORT 24 APRIL 2018 AT 2.00 PM EEST
company's sales account for approximately EUR 5 million and it employs 23 people. The acquisition supports Kalmar’s strategic aim to grow in services while strengthening and broadening the existing service capabilities throughout Australia, New Zealand and the Pacific. The result of Inver has been consolidated into Kalmar segment from the beginning of January 2018.
On 3 October 2017, Hiab completed the acquisition of the Brazilian company Argos Guindastes Indústria e Comércio Ltda's ("Argos") share capital. Argos is a privately owned company specialized in loader cranes with a manufacturing facility in Brazil and an extensive distribution network in Latin America. Argos is one of the leading loader crane manufacturers in Brazil, and with the acquisition, Hiab is strengthening its strategy and market leadership by entering the Brazilian market. Additionally, the acquisition creates a strong foundation for Hiab's business in the whole region. As a result of the acquisition, approximately 60 employees transferred to Hiab. The purchase price consists of EUR 7.4 million paid on acquisition, EUR 2.8 million deferred consideration to be paid during the next three years, and a conditional payment that, subject to earn-out criteria, is due in 2021 and limited to a maximum amount of EUR 4.1 million. The contingent consideration has not been included in the preliminary purchase price allocation. The result of Argos has been consolidated into Hiab segment's result from the beginning of October 2017. In 2017, Argos contributed EUR 1.4 million and EUR -0.2 million to Cargotec's sales and operating profit, respectively. Had Argos been acquired on 1 January 2017, it would have increased Cargotec's full year sales by approximately EUR 6 million and decreased the operating profit by approximately EUR 1 million.
Consolidation of the acquired businesses is provisional as of 31 March 2018. Fair value measurement of the acquired assets and liabilities is preliminary and subject to adjustments until the valuation is finalised. In the preliminary valuation, customer relationships, trademarks and technology have been identified as the acquired intangible assets. According to the preliminary valuation, the acquisition will generate goodwill, which will not be tax-deductible. Goodwill is primarily based on personnel and expected synergy benefits.
Acquired net assets and goodwill, Argos and Inver, MEUR Intangible assets 3.7 Property, plant and equipment 2.7 Inventories 0.8 Accounts receivable and other non-interest-bearing assets 0.0 Accounts payable and other non-interest-bearing liabilities -0.1 Deferred tax liabilities -1.1 Net assets 5.9 Purchase price, payable in cash 15.4 Total consideration 15.4 Goodwill 9.4 Purchase price, paid in cash 12.5 Cash flow impact 12.5
The provisional allocation of goodwill arising from the acquisition is EUR 6.0 million to Hiab segment and EUR 3.5 million to Kalmar segment.
41/44

CARGOTEC CORPORATION Q1 2018 INTERIM REPORT 24 APRIL 2018 AT 2.00 PM EEST
Disposals in 2017
In April, as part of the reorganising programme, MacGregor sold the majority of its ownership in the British subsidiary Woodfield Systems Ltd to the company's management at a gross consideration of EUR 4.3 million including EUR 2.3 million of deferred consideration. The remaining 10% investment is accounted for as an associated company based on the level of influence retained by MacGregor. The transaction resulted one-time costs of approximately EUR 5 million.
Key exchange rates for the euro
Closing rates 31 Mar 2018 31 Mar 2017 31 Dec 2017 SEK 10.284 9.532 9.844 USD 1.232 1.069 1.199 Average rates Q1/18 Q1/17 2017 SEK 9.996 9.526 9.639 USD 1.225 1.065 1.131
42/44

CARGOTEC CORPORATION Q1 2018 INTERIM REPORT 24 APRIL 2018 AT 2.00 PM EEST
Calculation of key figures
Equity / share (EUR) = Total equity attributable to the equity holders of the parent Number of outstanding shares at the end of period
Total equity / total assets (%) = 100 x Total equity Total assets - advances received
Gearing (%) = 100 x Interest-bearing debt* - interest-bearing assets Total equity
Return on equity (ROE) (%) = 100 x Net income for the period Total equity (average for the period)
Return on capital employed (ROCE) (%) = 100 x Income before taxes + interest and other financing expenses Total assets - non-interest-bearing debt (average for the period)
Basic earnings / share (EUR) = Net income for the period attributable to the equity holders of the parent
Average number of outstanding shares during the period
Diluted earnings / share (EUR) = Net income for the period attributable to the equity holders of
the parent
Average number of outstanding diluted shares during the period
*Including foreign currency hedging of the USD Private Placement corporate bond.
In addition, Cargotec uses and presents alternative performance measures (APMs) to better convey underlying business performance and to enhance comparability from period to period. APMs are reported as complementary information.
The alternative performance measures used by Cargotec are:
Operating profit excluding restructuring costs (MEUR and % of sales) = Operating profit + restructuring costs
Interest-bearing net debt (MEUR) = Interest-bearing liabilities - loans receivable and other interest-bearing assets +/- foreign currency hedge of corporate bonds
Interest-bearing net debt / EBITDA, rolling 12 months =
Interest-bearing net debt
EBITDA (earnings before interest, taxes, depreciation and amortisation), rolling 12 months
43/44
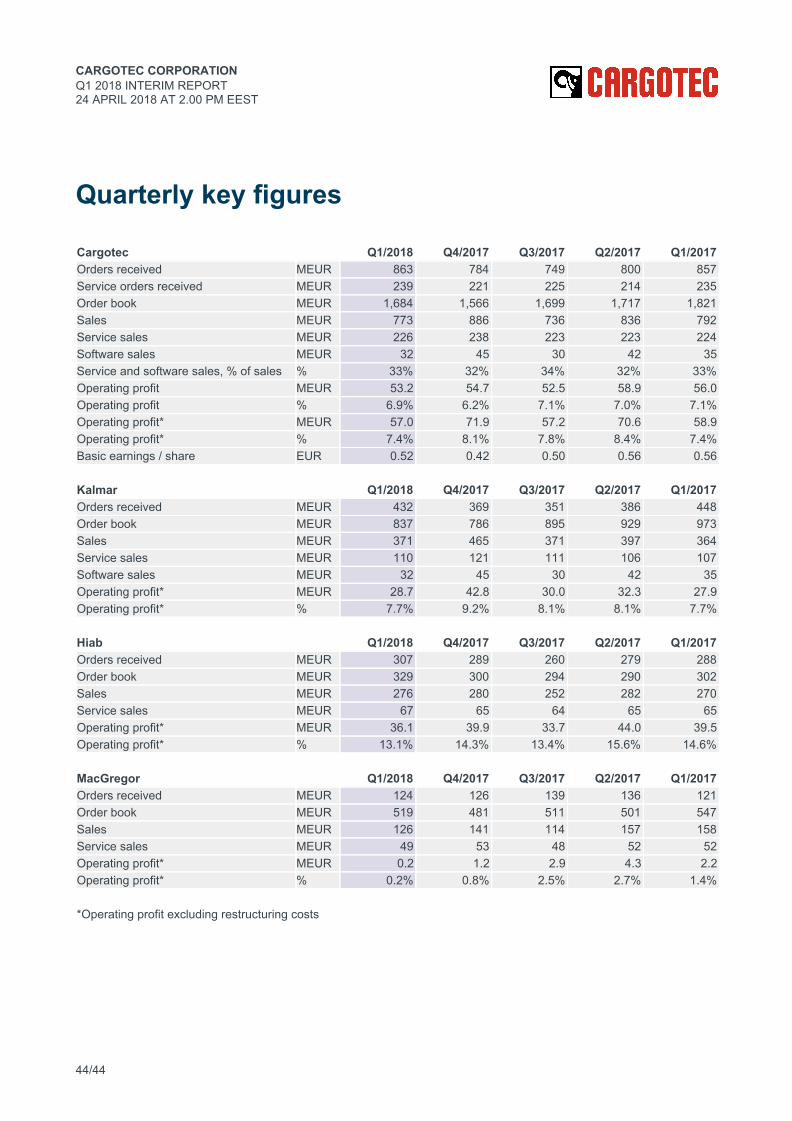
CARGOTEC CORPORATION Q1 2018 INTERIM REPORT 24 APRIL 2018 AT 2.00 PM EEST
Quarterly key figures
Cargotec Q1/2018 Q4/2017 Q3/2017 Q2/2017 Q1/2017 Orders received MEUR 863 784 749 800 857 Service orders received MEUR 239 221 225 214 235 Order book MEUR 1,684 1,566 1,699 1,717 1,821 Sales MEUR 773 886 736 836 792 Service sales MEUR 226 238 223 223 224 Software sales MEUR 32 45 30 42 35 Service and software sales, % of sales % 33% 32% 34% 32% 33% Operating profit MEUR 53.2 54.7 52.5 58.9 56.0 Operating profit % 6.9% 6.2% 7.1% 7.0% 7.1% Operating profit* MEUR 57.0 71.9 57.2 70.6 58.9 Operating profit* % 7.4% 8.1% 7.8% 8.4% 7.4% Basic earnings / share EUR 0.52 0.42 0.50 0.56 0.56 Kalmar Q1/2018 Q4/2017 Q3/2017 Q2/2017 Q1/2017 Orders received MEUR 432 369 351 386 448 Order book MEUR 837 786 895 929 973 Sales MEUR 371 465 371 397 364 Service sales MEUR 110 121 111 106 107 Software sales MEUR 32 45 30 42 35 Operating profit* MEUR 28.7 42.8 30.0 32.3 27.9 Operating profit* % 7.7% 9.2% 8.1% 8.1% 7.7% Hiab Q1/2018 Q4/2017 Q3/2017 Q2/2017 Q1/2017 Orders received MEUR 307 289 260 279 288 Order book MEUR 329 300 294 290 302 Sales MEUR 276 280 252 282 270 Service sales MEUR 67 65 64 65 65 Operating profit* MEUR 36.1 39.9 33.7 44.0 39.5 Operating profit* % 13.1% 14.3% 13.4% 15.6% 14.6% MacGregor Q1/2018 Q4/2017 Q3/2017 Q2/2017 Q1/2017 Orders received MEUR 124 126 139 136 121 Order book MEUR 519 481 511 501 547 Sales MEUR 126 141 114 157 158 Service sales MEUR 49 53 48 52 52 Operating profit* MEUR 0.2 1.2 2.9 4.3 2.2 Operating profit* % 0.2% 0.8% 2.5% 2.7% 1.4% *Operating profit excluding restructuring costs
44/44


