284 Anna Wzi¹tek-Kubiak, Ma³gorzata Jakubiak, Ma³gorzata Antczak Differences in productivity and its determinants among firms from the Czech Republic, Hungary, Poland and Germany. The case of the cosmetics industry Warsaw, August 2004 sa284 EN.qxd 02-10-04 18:52 Page 1
Differences in productivity and its determinants amongfirms from the Czech Republic, Hungary, Poland andGermany. The case of the cosmetics industry
WW aa rr ss aa ww ,, AA uu gg uu ss tt 22 00 00 44
sa284 EN.qxd 02-10-04 18:52 Page 1
Materials published here have a working paper character. They can be subject to furtherpublication. The views and opinions expressed here reflect the author(s) point of viewand not necessarily those of the CASE.
The paper was prepared under the research project entitled 'EU Integration and theProspects for Catch-Up Development in CEECs. The Determinants of the ProductivityGAP', carried out within the Fifth (EC) Framework Programme - Improving HumanResearch Potential and Socio-economic Knowledge Base (contract no. HPSE-CT-2001-00065.The publication was co-financed by the State Committee for Scientific Research andCASE - Center for Social and Economic Research.
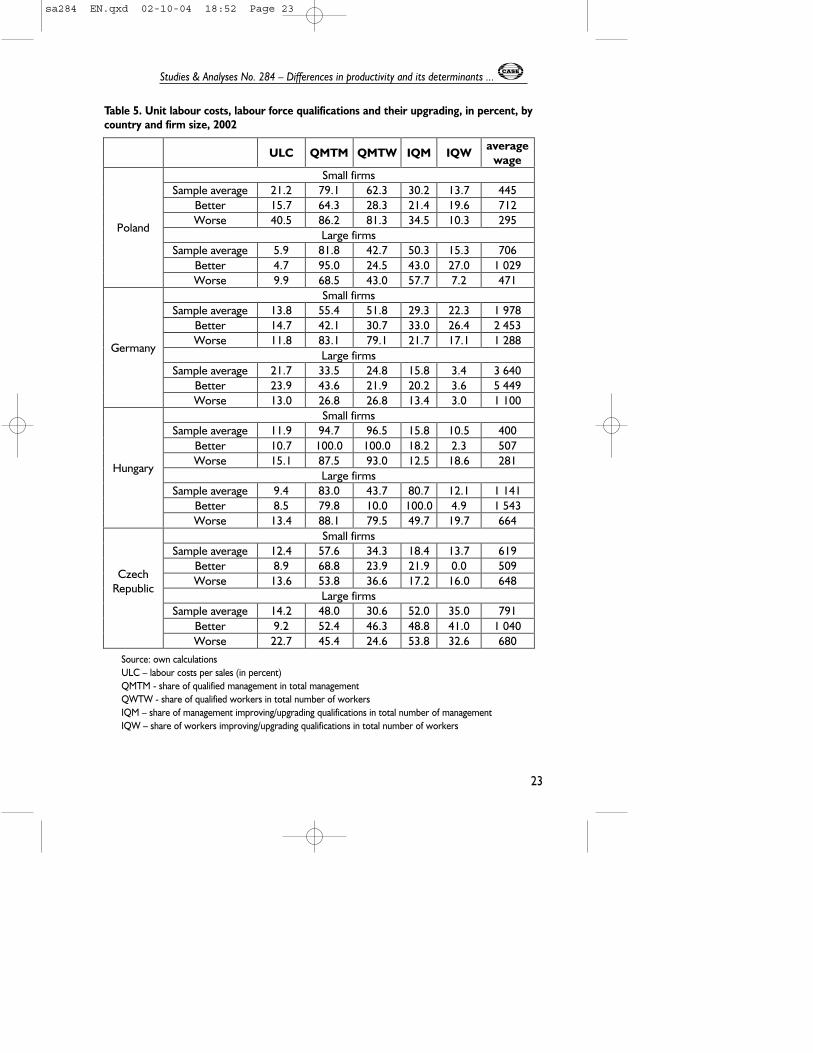
Table 5. Unit labour costs, labour force qualifications and their upgrading, in percent, by country and firm size, 2002 . . . . . . . . . . . . . . . . . . . . . . . . 23
Table 6. Fixed capital productivity, penetration rate of innovation,investment intensity, fixed capital intensity, and specialisation, by country,firm size and productivity grade, 2002 . . . . . . . . . . . . . . . . . . . . . . . . . . . 26
Figure 11. Competitive strategies, by cluster, large firms, 2002 . . . . . . . . 46
5
Studies & Analyses No. 284 – Differences in productivity and its determinants ...
sa284 EN.qxd 02-10-04 18:52 Page 5
6
Studies & Analyses No. 284 – A. Wzi¹tek-Kubiak, M. Jakubiak, M. Antczak
Ma³gorzata Antczak
Graduated from the Department of Economics at the Warsaw University (MA in1994). She has been collaborating with the CASE Foundation since 1994. Mrs.Antczak's research interests include economics of transition and Europeanintegration in Central and Eastern Europe and ownership changes in the Polishenterprise sector during transition. She has also been interested in fiscal aspects ofthe EU enlargement and fiscal convergence in acceding countries. Moreover, Mrs.Antczak has worked on issues of education financing and its influence on theelasticity of the labor market in Poland and conducted financial analysis ofenterprises quoted at the Warsaw Stock Exchange market.
Ma³gorzata Jakubiak
Collaborated with CASE from 1997. Her main areas of interest include internationaleconomics and macroeconomic policies. During 2000-2001 she was working at theCASE mission in Ukraine as resident consultant, developing macro-model of theUkraine's economy. She has published articles on trade flows, exchange rates,savings and investments in Poland and other CEE countries, and on diffusion ofinnovation. Graduated from the University of Sussex (UK; MA in 1997) and theDepartment of Economics at the University of Warsaw (MA in 1998).
Anna Wzi¹tek-Kubiak
Graduated in 1970 from the Department of Economics of Transport at the GdanskUniversity where she also received her PhD in 1973. In 1987 she was qualified asan assistant professor at the Department of Foreign Trade of the Warsaw School ofEconomics (SGH), at that time called the Main School of Planning and Statistics(SGPiS). In 1998 she received the title of a Professor. She has participated in andco-ordinated numerous research projects, also international, focusing on thedevelopment of economies undergoing transformation. Previously she specialised ininternational economic relations. She is an author and co-author of numerous booksand articles, some of which have been published abroad.
sa284 EN.qxd 02-10-04 18:52 Page 6
7
Studies & Analyses No. 284 – Differences in productivity and its determinants ...
Abstract
The paper assesses differences in productivity and its determinants amongenterprises manufacturing cosmetics and detergents (NACE 245) and located inGermany and in three EU new member states. The database collected throughconducting an identical survey in Germany, Poland, Czech Republic and Hungary wasused. The results of this firm-level study point on the role of the existence of 'dualeconomy' of some very highly and very low productive firms, especially among the smallenterprises from the new member states. Productivity gap vis-a-vis Germany in thislabour-intensive industry disappears in the case of some large enterprises from theCEECs. Generally, higher fixed capital intensity, higher investment rate, lower unit labourcosts, more employees improving skills, and higher use of modern communicationtechnology help in narrowing productivity gap. The paper ends with policyrecommendations.
sa284 EN.qxd 02-10-04 18:52 Page 7
8
Studies & Analyses No. 284 – A. Wzi¹tek-Kubiak, M. Jakubiak, M. Antczak
1. Introduction
In the literature the notion of productivity is commonly defined as the ratio of outputto input use. However, since there are many purposes for productivity measurement,many different measures are in use. Productivity is evaluated in order to tracetechnological change, to identify changes in technical efficiency and inefficiency, as well asreal cost savings in production. At the macro level productivity is a key in assessingstandards of living.
In the literature international comparisons of productivity are often used to evaluatechanges in competitiveness or the competitive advantages of market actors. Advantages inproductivity of a given firm are one basis for competing out its rivals on the market. This iswhy international comparison of productivity is of significant interest for individual firms, inparticular when comparison is narrowed to a specified range of similar products to reducethe extent to which measurement is affected by variations in product composition. This, inturn, places productivity analysis into competition theory. In other words, productivity is notonly linked with growth theory, the theory of the firm and national accounts but also withchanges in the market share of firms from one country at the cost of firms from othercountries, which – in turn - are transferred into differences in growth dynamics, standardsof living, and unevenness of changes in living standards among social strata.
On the one hand, over the last 14 years an intense process of restructuring of newEU member states’ firms has been taking place, alongside external and internalliberalisation. This has resulted in improvements in productivity for some firms andmarket exit for many others. The unevenness of improvements in productivity acrossfirms reflects differences in competitiveness between them. On the other hand, as aresult of inflows of foreign direct investment into transition countries, new and moreeffective firms with foreign capital participation have started to operate. Using cheap andrelatively well-educated labour and introducing modern technology and newmanagement techniques, they have increased the productivity of their firms. As a result,the process of productivity differentiation of firms in the new member states has beenintensified, this in turn impacting in terms of differences in the relative competitivepressure placed on old EU member firms on domestic and EU markets. In developedmarket economies low productivity firms tend to be squeezed out by high productivityfirms. In economies in transition, which by the 1990s had been only partially opened upand retained largely distorted and underdeveloped markets that were subject to highlyselective government policies, many low productive firms continued to operate. Itfollows from the changing market structure in the process of market transition. Today,
sa284 EN.qxd 02-10-04 18:52 Page 8
however, if they do not improve productivity they will be pushed out of the market, withnegative macroeconomic consequences.
The assumed differences in productivity levels between firms from the new memberstates, similar to those of the old member states, are widely used in the literature as thebasis for analysing the average productivity levels of industries in the new member states.However this obscures the high differentiation in productivity among firms. Neglectingthis runs the risk of missing the specifics of the transition process, as well as differencesin competitive pressures between these firms and the old member state firms. It is highlypossible that competitive pressures from new member state firms are limited to a handfulof firms and that most can simply be squeezed out of the market. This has importantconsequence for economic development, especially unemployment changes and poverty,which should be taken into account.
The aim of this paper is to illustrate differences in productivity levels and theirunderlying factors between firms from three new member states and Germany. Analysisis limited to factors internal to the enterprises. Using the cosmetics industry as a casestudy, we evaluate and analyse the relative labour and capital productivity and factors offirms in three new member states (the Czech Republic, Hungary and Poland) comparedto Germany. Policy implications are also outlined.
In the new member states the cosmetics industry is a branch that enjoys reasonablyhigh competitiveness. Over the last 5 years, for example, the share of Polish cosmeticsproduction on the domestic and EU markets has increased. In the cases of Hungary andthe Czech Republic, increasing shares on the EU market were accompanied by drops indomestic market shares. This indicates that new member states’ cosmetics firms havebeen increasing competitive pressure on EU producers within the enlarged EU market.
Competitive productivity implies the introduction of two separate approaches to theproductivity gap and factors of production: horizontal and vertical. The former concernscomparison of productivity levels and factors within each country, while the latter dealswith comparisons across countries, i.e., among their samples and sub-samples, as well asthe best and worst firms. To illustrate differences in productivity between firms from thethree new member states compared to Germany three layers of analysis are introduced:comparison between large and small firms’ samples, between better and worse sub-samples and between the three best and worst firms. Finally, cluster analysis is used toassign particular firms to groups that have common characteristics and the averageproductivity levels for these groups are checked. The analysis has a comparative character.
The paper is organised as follows. Section 2 starts with methodology. Section 3 dealswith the reliability of samples analysed in the paper. The sample averages and averages ofeach analysed branch of industry in each country are compared. Section 4 is apresentation of differences in productivity levels between the samples, sub-samples and
9
Studies & Analyses No. 284 – Differences in productivity and its determinants ...
sa284 EN.qxd 02-10-04 18:52 Page 9
firms across the analysed countries. Section 5 deals with the determinants of differencesin productivity between the three new member states and Germany. Section 6 showsdifferences in competition strategies between firms, with a breakdown into firms withdifferent productivity levels and across countries. Section 7 presents the results ofclustering firms into groups that share similar features. Conclusions from the analysis andpolicy implications wrap up the paper.
2. Methodology in brief
This paper focuses on differences in productivity levels and the factors underpinningthem in the cosmetics industry. The first method adopted is one of matched-plantcomparisons of firms producing cosmetics in four countries: the Czech Republic,Germany, Hungary and Poland. Cosmetics companies were matched in terms of size aswell productivity levels. Estimates of productivity levels and factors influencing them arederived from a single survey of companies producing cosmetics and detergents used in allfour countries. This approach serves to obtain a relatively consistent data framework andcomparable research results across countries.
Choice of productivity measures depends on its purpose. This paper explores singlefactor productivity measures: labour productivity (LPROD) and capital productivity(CPROD). LPROD is the value added per employee (in euros), while CPROD is valueadded per fixed asset. Both are based on a value added rather than gross output concept.Estimated value added is obtained as the difference between gross outputs and inputs(both converted into a common currency at an annual average exchange rate), afterwhich productivity comparisons were made. This meant that our measures weresensitive to changes in exchange rates as well as structures of production. the use ofnominal exchange rate stems from competitive approach employed in the paper1. Valueadded is influenced by material intensity of production and by type of product beingmanufactured in a given enterprise. Although production in the cosmetics industry isrelatively homogenous, one cannot rule out the possibility that the surveyed firmsdiffered in terms of the products they manufacture.
LPROD is based on employment rather than an hourly measure. It is possible thatproductivity measured per employee and productivity measured on an hourly base will
10
Studies & Analyses No. 284 – A. Wzi¹tek-Kubiak, M. Jakubiak, M. Antczak
1 Real exchange rates and purchasing power-adjusted exchange rates matter when analysis concernsinternational comparisons of economic development. Here, the emphasis is put on the competitive gains/looses(e. g. one firm pushing out another from a market), hence the use of nominal values (costs, prices) is moreappropriate.
sa284 EN.qxd 02-10-04 18:52 Page 10
differ. If we had measured productivity on an hourly base, the results for German firmswould have been higher2 and the productivity gap between Germany and the CEEs wider.
Two types of productivity determinants are taken into account: hard (such as fixedcapital intensity, penetration rate of innovation, investment intensity and specialization)and soft (human capital, share of services provided by suppliers, customers and otherstake-holders with whom the firms were contracted on a long-term basis, as well as emailand e-business). Looking at productivity from a competition perspective implies the needto consider differences in competition strategies. These are also included in the analysis.
Analysis is comprised of four layers. Firstly, the reliability of field research sampleaverages against industry averages are checked. Secondly, based on the number ofemployees in each country, two sub-samples of firms are distinguished: small (employing lessthan 50 employees) and large. These are then compared with each other as well as acrossthe analysed countries. Thirdly, in each of the sub-samples two groups are selected: better(LPROD above average) and worse enterprises. A comparison within each country andamong them is then made. Fourthly, comparison between the three best and three worstfirms across countries is made. Fifthly, we return from detailed analysis based on the divisionsof enterprises into better and worse firms back to the sample as a whole. Statisticalprocedure based on the selection of enterprises similar in terms of fixed capital intensity,labour costs, human capital, business environment, and use of modern communicationtechnologies was employed in order to obtain clusters of enterprises that share specifiedfeatures. Average productivity levels were calculated for these clusters in order to checkwhether firms with different characteristics really differ in terms of productivity. In otherwords, we wanted to check whether one can match the good or bad productivity scores ofthe surveyed firms from the cosmetics industry with the set of firm-specific potentialproductivity determinants. This is an alternative and complementary method to the analysispresented in the preceding sections.
3. Description of samples and their importance for choseneconomies
The calculations presented in this section are based on data from 116 enterprisesfrom the following industries: soap and detergent, cleaning and polishing preparations,
11
Studies & Analyses No. 284 – Differences in productivity and its determinants ...
2 At the level of the whole economy, the number of hours worked in Germany is lower than in any of theanalysed member states (39.6 hour/week in Germany, and 41.0 in Hungary, 41.4 in the Czech Republic and 41.5in Poland, according to the headline results of the Eurostat European Labour Force Survey 2003). The same isprobably true for the branch analysed here.
sa284 EN.qxd 02-10-04 18:52 Page 11
perfumes and toilet preparations (NACE 245). The sample consists of data from 22German, 38 Polish, 37 Czech and 19 Hungarian firms (see ). Observations were collectedon the basis of an identical survey conducted in Germany and in the three new memberstates.
Although the survey was constructed so as to make the results representative, it ishard to assess whether the obtained samples are typical for each country (see Table 2 andTable 4). Surveyed German firms seem to be more productive, pay higher wages to theiremployees and have similar ULC to the cosmetics industry average. Polish enterprises areless productive than the branch as a whole and pay lower wages. It seems that theGerman and Polish samples are not typical in terms of labour productivity. We lack datato verify whether the Hungarian reviewed enterprises are typical. There are argumentssuggesting that the Czech sample may be representative. Taken together, the sum of salesof all the surveyed firms accounts for 78% of the total sales of the cosmetics anddetergent industry in the Czech Republic in 2001. Total employment of all surveyed Polishfirms makes up 43% of total employment of Polish cosmetics firms. However, theGerman sample accounts only for 4% of sales and 5% of total employment of this branchin Germany.
The situation in the cosmetics and detergents industry is different in analysedcountries. The branch constitutes a relatively small, but dynamic, part of Polish andHungarian manufacturing. In 1997-2002, its share in Polish manufacturing increased from1.3% to 1.9% and the dynamics of productivity growth of the Polish cosmetics industry
12
Studies & Analyses No. 284 – A. Wzi¹tek-Kubiak, M. Jakubiak, M. Antczak
Table 1. Distribution of firms by size and country, 2002
Germany PolandCzech
RepublicHungary Total
Number of small firms 13 17 19 13 62Number of large firms 9 21 18 6 54Total 22 38 37 19 116
Source: own calculations.
Table 2. The cosmetics industry in Poland, Czech Republic and Germany, 2000-2002
Germany2000
Poland2002
Czech Republic2001
Average Wage (in euro) 3 181 847 621Unit Labour Costs - ULC 15.6 8.5 7.8Labour Productivity - LPROD 60 100 99 904 n. a.
LPROD = VA per employed in euro; ULC – labour costs per sales, in percentSource: own calculations.
sa284 EN.qxd 02-10-04 18:52 Page 12
(90.3%) was higher than the average for Polish manufacturing overall (81.5%). Similarly,the branch increased it share in manufacturing industry sales in Hungary; from 0.55% to0.64% in 1998-2001, and has been growing faster than the Hungarian manufacturingtaken as a whole. The situation for the sector in the Czech Republic looks somewhatdifferent. Until 1999, the Czech cosmetics and detergents industry was growing fasterthan the manufacturing average. However, since 2000 it has been developing slower thanoverall manufacturing. In effect, the labour productivity growth of Czech cosmetics anddetergents producers in 1997-2001 (21.4%) was nearly the same as for totalmanufacturing (22.8%). However, taking into account developments in 2000-2001, thebranch has most likely been declining in relation to other areas of Czech manufacturing.
Cosmetics and detergents industry sales in Germany grew slower than the Germanmanufacturing average throughout 1997-2000 (by 10.7%, while manufacturing salesincreased in real terms by 25.3%). More detailed data reveal that the branch was moredynamic in eastern and less dynamic in western areas. However, taking into account itsimportance for the rest of German manufacturing industry, it seems that this importancehas been continuously weakening in recent years.
Another issue that one should be aware of is the impact of business cycles onproductivity performance of different branches of manufacturing. Productivity growthtends to accelerate during periods of economic expansion and decelerate during periodsof recession or slowdown. A higher rate of capacity utilisation in a period of an upwardeconomic trend of an economy tends to be accompanied by growth in output measures,whereas input measures remain stable or grow less rapidly. This results in a rise inmeasured productivity levels. The converse holds for periods of slowdown. The businesscycle influences the use of different inputs of firms, hence impacting in turn on theirproductivity performance.
The year the survey was undertaken, 2002, was one of the economic slowdown inPoland and in the Czech Republic. Polish GDP increased by 1.4% in 2002, while theaverage growth in 1997-2001 was 3.5%. Similarly, Czech GDP grew by 1.5% in 2002,while it had been growing by 2.1% on average in the preceding years (1999-2001)3.However, 2002 was the last year of slowdown both in the Czech Republic and in Polandand both economies rebounded in 2003. Hungary has been expanding fastest on average,by 4.1%, in 1998-2003, although its rate of growth has been declining. With a GDPincrease of 3.5% in 2002, however, it recorded the fastest economic growth in thesample. Germany, with the slowest growing economy in the sample, slowed clearly in
13
Studies & Analyses No. 284 – Differences in productivity and its determinants ...
3 Low average growth in 1999-2001 is due to the low 1999 number; it was still the effect of the 1997Czech currency crisis.
sa284 EN.qxd 02-10-04 18:52 Page 13
2002, with GDP expanding by only 0.1%, while 2003 was even worse for the Germaneconomy. Domestic production fell by -0.1% in real terms and the economy has not yetrebounded. Differences in business cycles between the surveyed countries is thereforeclear. While the temporal slowdown was coming to an end in Poland and the CzechRepublic and the growth was moderate in Hungary in 2002, Germany was still in themidst of recession. This suggests that the productivity of the German firms in the samplemay be underestimated. However, the differences should not be significant, asproduction in all the analysed economies slowed in 2002.
Another factor external to enterprises that influences differences in estimatedproductivity levels among countries is government policy. Differences in tax policybetween the four countries, mainly in excise duty on cosmetics produced in Polandbefore 1 May 20044, results in an overestimation of the evaluated relative productivitylevels of this branch in Poland, for example. Differences in policy toward small andmedium size enterprises (SME) between countries also impacts in terms of differences inproductivity. In the new member states, at least in Poland (Hashi, Balcerowicz, 2004),policy towards SME is less active than in the old member states. This means that the
14
Studies & Analyses No. 284 – A. Wzi¹tek-Kubiak, M. Jakubiak, M. Antczak
4 Excise rate for cosmetics was 25% before May 2004, and 10% after.
Table 3. Basic indicators for the industrial sector, manufacturing and the cosmetics anddetergents industry in Poland, industry totals and surveyed firms, 2002
Source: own calculations based on GUS statistics and Polish sample* - Investment outlays per employee were calculated for sections: manufacture of chemicals and chemical
products (240 in NACE Rev. 1).** - Labour productivity calculated as sales per employee.
sa284 EN.qxd 02-10-04 18:52 Page 14
business environment for SMEs in the old member states to a much greater extentsupports their development and therefore also affects differences in productivitybetween the countries.
Table 3 shows differences in the average productivity levels between the surveyedPolish large and small firms as well as between averages in the cosmetics industry. Theproductivity of small firms in this survey, as compared to the average of the Polishcosmetics industry, was very low. The opposite was observed in the case of large firms,where productivity was above the average for Polish cosmetics and detergentsproduction. This indicates that there are some very productive firms among large Polishenterprises in this survey. Some of them probably have foreign capital involvement.
4. Differences in productivity levels
In open and developed market economies differences in productivity level amongfirms producing similar products tend not to be large. In the case of homogenousproducts, high productivity firms tend to push low productivity firms out of the market.To remain and to expand on the market low-productive firms are forced to increaseproductivity, which results in a narrowing of the productivity gap between them. Intransition economies this process can be distorted for some years. The process ofchanging market structure has a long-term character and a lot of very low productivityfirms can remain on the market for several years. Although liberalisation of new memberstates began more than 10 years ago, the structure of these markets is still fragile and inthe process of forming.
In the literature dealing with the productivity gap between new and old memberstates it is widely assumed that differences in productivity levels between firms in newmember states are similar to differences in productivity levels between old member statefirms. This assumption allows for analysis of productivity gap based on average data forgiven branches of industry. However, analysis of the competitiveness of the CzechRepublic, Hungary and Poland (Wziatek-Kubiak, Winek, 2004), as well analysis of thePolish economy, (Maczynska, 2001) shed new light on this issue. On the one hand,differences in the levels of unit labour costs, unit intermediate costs, unit cash flows, aswell as rates of investment across branches of manufacturing in the Czech Republic,Hungary and Poland have tended to be much bigger than in the case of the EU. On theother hand, however, analysis of the Polish economy reveals that many firms with verylow productivity continue to operate and do manage to sell their products. As such, thequestion arises as to whether, when analysing the productivity gap between new and old
15
Studies & Analyses No. 284 – Differences in productivity and its determinants ...
sa284 EN.qxd 02-10-04 18:52 Page 15
the member countries, it is sufficient to use sample averages as a base or whether it isnecessary to introduce an additional framework or cross-section analysis.
In terms of labour productivity levels (LPROD) the three new member states firms’samples differ considerably from their Germany counterparts.
Firstly, average labour productivity of the small firms samples from three newmember states was from 2.5 to 8 times smaller than for the large ones (Table 4). Theopposite was in the case for Germany.
Secondly, of the samples of small firms from the analysed countries the highestproductivity was noted in German small firms and the lowest in Hungarian. Poland’s and theCzech Republic’s small firms’ sample were both somewhere between the two. If oneassumes that only small firms compete on the market it is highly possible that Hungarian firmswould be pushed out altogether.
Thirdly, the situation was completely different in the case of samples of large firms. Themost productive was the sample of Polish firms. Their average LPROD was 20% higher thantheir German counterparts and twofold higher than their Czech and Hungarian ones. Theaverage CPROD of Polish the sample of large firms was fourfold larger than Germany’s and30% higher than in the Czech Republic and Hungary (Table 4). Even if one takes into accountthe higher (25% up to 1 May 2004) excise tax on cosmetics in Poland, which increased theevaluated level of productivity of Polish cosmetics firms, its sample of large firms would stillhave been the most productive. Summing up, of the four countries large firms’ samples, thePolish one was distinguished by its high CPROD and LPROD, while Germany’s by its highLPROD and very low CPROD. The productivity of Czech and Hungarian large firms’samples were similar, but much lower than their Polish and Germany counterparts.
The much higher standard deviation of productivity levels for new member statefirms than German firms calls for more in-depth analysis and a new framework.Introducing, as a criterion for classification, average productivity levels in samples of givenfirms, two sub-samples have been separated (Table 4): a ‘better’ sample - with higherthan the average sample’s productivity level and a ‘worse’ sample – characterised bylower than average productivity. Although in each analysed country the number of‘better’ firms was much smaller than ‘worse’ firms, the share of sales for ‘better’ firmswas very high. For example, in the Polish case the share of sales of ‘better’ firms in thelarge firm sample exceeded 80% and in the case of the Czech Republic and Hungary over75%. This means that the productivity performance impact of ‘better’ firms impact verymuch the average productivity levels of new member state firms’ samples. Since, in termsof productivity level ‘better’ firms are differentiated from the ‘worse’ sub-sample andimpact the average productivity levels of new member state firms’ samples, acomparative analysis of these sub-samples is required to shed new light on the differencesin productivity levels of the new member states compared to Germany.
16
Studies & Analyses No. 284 – A. Wzi¹tek-Kubiak, M. Jakubiak, M. Antczak
sa284 EN.qxd 02-10-04 18:52 Page 16
17
Studies & Analyses No. 284 – Differences in productivity and its determinants ...
Table 4. Labour (LPROD) and capital productivity (CPROD) of the surveyedfirms, 2002
Large firmsSample average 18 40 085 1.6Better 5 82 960 5.5
Czech Republic
Worse 13 20 950 0.7Source: own calculationsLPROD = VA/employee (in euro)CPROD = VA/fixed assets (in euro)
sa284 EN.qxd 02-10-04 18:52 Page 17
Firstly, differences in average LPROD levels between the two sub-samples of newmember state firms’ samples were higher than between the average LPROD of small andlarge samples. This confirms the legitimacy of the introduced classification (Table 4).
Secondly, differences in LPROD between two the outlined sub-samples for each ofthe new member states were much larger than in the case of Germany. For example,LPROD of the ‘better’ Polish small firms’ sub-samples was 6.6 times higher than thefigure for the ‘worse’ sub-sample (figure 2). In the case of the Czech and Hungary thesedifferences were smaller (3 and 2.7 times, respectively), but still higher than in the caseof Germany (1.8 times). Within the large firms sample, differences in LPROD betweenthe ‘better’ and ‘worse’ sub-samples were smaller than in the case of small samples butstill higher in the three new member states than in Germany. This implies that the processof restructuring of many new member state firms, especially small ones, was very partialand did not result in radical improvement in their productivity. In the nearest future manyof these firms will likely be pushed out of the market.
Thirdly, the gap in productivity between the ‘worse’ small firms’ sub-samples of thenew member states and Germany was much wider than the gap in average productivitybetween the small firms’ samples. For example, if average LPROD of the Polish small firms’sample was 5 times lower than its Germany counterpart, in the case of the ‘worse’ firms’sub-samples this difference was 11 times (see ). Average data obscures the intensity of theselection processes of new member state firms that is set to take place in the near future.
Fourthly, the low average level of productivity of the new member states sample doesnot downgrade the possibility of some successful firms emerging. Of the ‘better’ small
18
Studies & Analyses No. 284 – A. Wzi¹tek-Kubiak, M. Jakubiak, M. Antczak
Figure 1. Labour productivity (LPROD), by country, firm size and productivity grade, 2002
0
20 000
40 000
60 000
80 000
100 000
120 000
140 000
160 000
PL GE HU CZ PL GE HU CZ PL GE HU CZ PL GE HU CZ
Smal l better Smal l worse Large better Large worse
Source: own calculationsNotes: numbers are in euros per employee
sa284 EN.qxd 02-10-04 18:52 Page 18
firms sub-samples for the three new member states some firms also had reasonably highLPROD5.
Differentiation in productivity level is more acute among the small than the largefirm sample of the three new member states. The fact that the gap in productivity
19
Studies & Analyses No. 284 – Differences in productivity and its determinants ...
Figure 2. Labour (CPROD) and capital (CPROD) productivity for ‘better’ and ‘worse’ sub-samples, by country and firm size, 2002
6.6
5.3
1.8
3.1 3.33.9
2.7
4.03.4
2.4
0.6 0.4
4.8
1.4
5.3
7.9
0123456789
Small Large Small Large Small Large Small Large
PL GE HU CZ
PROD
CPROD
Source: own calculations
5 although relative (compared to Germany), the LPROD for the Polish small firms’ sample was very low, withLPROD of one out of three firms similar to the best Germany firm.
Figure 3. Labour productivity of the ‘better’ and ‘worse’ sub-samples from new memberstates relative to German firms, by country and firm size, 2002
0.32
1.60
0.12
0.650.53
0.85
0.09
0.93
0.07
0.510.36
0.66
0.00.20.40.60.81.01.21.41.61,8
Smal l Large Smal l Large Smal l LargePL HU CZ
Better firms Worse firms
Source: own calculationsNotes: Productivity of respective German firms = 1.
sa284 EN.qxd 02-10-04 18:52 Page 19
between the ‘worse’ firms’ samples for the new member states and Germany was muchwider than in the case of the ‘better’ firms’ samples implies that the major problemfacing the new member states is the existence of very low productive firms stilloperating on the market. The gap in productivity of the three best firms of the newmember states as compared to Germany was much narrower than the productivity gapof three worst firms.
Differences in productivity level between the small firms’ sample of new memberstates compared to Germany will impact the scale of pushing out new members statessmall firms from the enlarged EU market and will result in economic growth, a change instandards of living, unemployment and income distribution, as well as poverty. The shareof sales of low productive firms in overall sales of the sample was very low, but their sharein employment was much higher. Pushing them out of the market would result in anincrease in unemployment, especially in Poland, which has the highest unemploymentrate and the greatest differences in LPROD within both, but in particular small firms,samples. This means there is an urgent need to expand and improve government policytowards SMEs in the new member states. The problem would appear to be the mostimportant and the most hard to solve for Poland’s small firms.
Fifthly, it worth mentioning that the LPROD of the ‘better’ small firms’ sub-samplesof new member states was lower than the LPROD for Germany’s ‘worse’ small firmssub-sample. This indicates that in the enlarged EU market, many ‘better’ (in countryterms) small firms from the new member states will be pushed out by relatively (incountry terms) ‘worse’ Germany firms. It also confirms that the average productivity ofthe new member firms’ sample obscure large differences in ability to compete amongfirms, as it does the scale of the process and its consequences.
In the case of the large firms’ sample, differences in productivity levels between‘better’ and ‘worse’ sub-samples for each country, as well as among ‘worse’ firms’ sub-samples between countries, were substantially smaller than among small firms’ samples.
In terms of the LPROD and CPROD of large firms, the most productive were foundin the Polish ‘better’ firms sub-sample and the three best Polish firms. This confirms theproductivity gap of the large German ‘better’ firms’ sub-samples against the Polish ones6.On the other hand, the LPROD and CPROD of large ‘worse’ Polish and Germany firms’sub-samples were similar, but decidedly higher than their Czech and Hungariancounterparts. This suggests that large ‘better’ firms from the analysed countries will likelycompete the ‘worse’ Hungarian and the Czech firms out of the market.
20
Studies & Analyses No. 284 – A. Wzi¹tek-Kubiak, M. Jakubiak, M. Antczak
6 Only in the case of one out of three of the ‘best’ Polish firms was CPROD lower than the CPROD of the threebest German firms. The LPROD of only one out of three ‘best’ Czech large firms was similar to Germany’s‘best’ firms.
sa284 EN.qxd 02-10-04 18:52 Page 20
Very high differences in LPROD between firms from the new member states’samples distinguished them from Germany. In Poland the average LPROD of the three‘best’ small and ‘best’ firms’ samples was between 20 (in the case of small) to 30 (in thecase of large) times bigger than the LPROD of the three worst ones. A much smallerwere differences was noted in the case of the Czech (7-8 times) and Hungary (6-15times) equivalents, but still much larger than in the case of Germany (4 times). In termsof productivity level the Germany firms’ samples were relatively most homogenous,while the Polish were the most differentiated.
Summing up1. Productivity of the small firm samples for the three new member states was much
lower than for the large ones. The converse held for Germany.2. Within the small firm samples the highest productivity level was noted in the German
firms samples and the lowest in the Hungarian. Within the large firm samples, thehighest productivity level was noted among Polish and also German firms and thelowest in their Hungarian and Czech counterparts. The German small firms’ sampleand Polish large firms’ samples have a higher productivity level in every measure ofproductivity.
3. The productivity levels of the small and large firms’ samples of the new memberstates were much more differentiated than was the case for the German samples.This concerns differences between the ‘better’ and ‘worse’ firms’ sub-samples foreach new member state, as well as difference between the ‘worse’ sub-samples ofthe new member states and their Germany counterpart. The fact that theproductivity level of Germany’s ‘worse’ and ‘better’ small firms’ samples was muchhigher than the ‘better’ small firms’ sub-samples for the new member states impliesthat Germany firms from lower sub-samples have the potential to push out firms of‘better’ sub-samples in the new member states. This has important implication forthe future development of the SME sector of the new member states and creates aneed to up the pace and scale of restructuring small firms. It raises issues of scale,forms and relevance of government policies towards SMEs in the new memberstates.
4. The levels of productivity of the large firms sampled from the new member stateswas less differentiated than for the small firm samples. The main problem of largefirms in these countries is not the lack of firms with high LPROD but the very lowlevel of productivity of ‘worse’ firms’ sub-samples from the new member states.
5. Analysis shows that high differences in productivity levels between firms is adistinguishing feature of the new members. It confirms that the process of shapingmarket structure of the three countries will be intensified in the near future. It alsoraises the problem of its macroeconomic implications.
21
Studies & Analyses No. 284 – Differences in productivity and its determinants ...
sa284 EN.qxd 02-10-04 18:52 Page 21
5. Factors influencing differences in productivity levels
The LPROD shows how productively labour is used to generate value added.However, it is only a partial productivity measure and partially reflects the productivity oflabour in terms of the individual capacity of workers. The LPROD depends to a largeextent on the presence and influence of the joint impact from other inputs, such as capitalproductivity, technical and organisational efficiency, the influence of economies of scaleand capacity utilisation. Levels of technology, embodied and disembodied, also affectlabour productivity. On the other hand, capital productivity as a partial measure is alsoinfluenced by the joint impact of a host of factors such as labour productivity, economiesof scale and capacity utilisation. The fact is that some similar factors impact LPROD andCPROD and this creates the danger of misinterpretation of research results. In the paperwe focus on LPROD.
In the paper four types of factors directly influencing LPROD level are considered:two of them consider human capital (the share of qualified employee and share ofemployees upgrading qualifications in total employment), the efficiency of use of labourcosts (unit labour costs, which represents the ratio of labour cost to sales) and FCI (therelation between fix assets and number of employees). Labour costs refer to totalcompensation, that is, wages and salaries before tax, employer’s social securitycontribution and pension and health contributions.
It is widely accepted that employee qualification levels impact LPROD. The problemis that evaluation of employee qualifications is a difficult and subjective matter, especiallygiven that we tend to base it on the opinions of company managers. This opinion isaffected, in turn, by qualification level of those who do the evaluating. The higher theirlevel of qualifications the higher the criteria of evaluation tend to be. The case of Polish andGermany ‘better’ large firms’ sub-samples, as compared to the ‘worse’ firms sub-samples(Table 5), as well as earlier research results from a project analysing the furniture industryand electro-technical and investment goods, appears to confirm this hypothesis. Ourhypothesis explains why the correlation between the LPROD level and share of employeesimproving qualifications was stronger than the correlation between LRPOD level and theshare of employees with high qualification level. The higher the LPROD the higher shareof employees, including workers, improving qualification. This suggests that the lowerLPROD is the lower is the perception of the need to improve qualification and possibly thelower the level of qualification. Only the large ‘better’ Germany better firms’ sample wasan exemption to this rule7. If the rule works on macro-economic scale it would indicatethat government support for improving labour forces qualifications is of great importance.
22
Studies & Analyses No. 284 – A. Wzi¹tek-Kubiak, M. Jakubiak, M. Antczak
7 Although the share of qualified Germany's employees was similar to the Czech and Polish ones, only a smallpart of the former had improved qualification.
sa284 EN.qxd 02-10-04 18:52 Page 22
23
Studies & Analyses No. 284 – Differences in productivity and its determinants ...
Table 5. Unit labour costs, labour force qualifications and their upgrading, in percent, bycountry and firm size, 2002
Large firmsSample average 14.2 48.0 30.6 52.0 35.0 791
Better 9.2 52.4 46.3 48.8 41.0 1 040
CzechRepublic
Worse 22.7 45.4 24.6 53.8 32.6 680Source: own calculationsULC – labour costs per sales (in percent)QMTM - share of qualified management in total managementQWTW - share of qualified workers in total number of workersIQM – share of management improving/upgrading qualifications in total number of managementIQW – share of workers improving/upgrading qualifications in total number of workers
sa284 EN.qxd 02-10-04 18:52 Page 23
A close relationship between LPROD level and share of employee improvingqualification has important implications. Firstly, it strengthens future negative selectionprocesses on the market, i.e., squeezing out of the market firms with low LPROD.Secondly, if firms with lower LPROD drop out of the market, and workers not improvingtheir qualifications loose their jobs, they will probably stay unemployed. They will mostlikely be unemployable for the more productive firms, which will capture the production.This would impact labour market structure and performance, resulting in increasingunemployment and impacting on future changes in poverty. Thirdly, the need to increaselevels of qualification of employees in firms with low productivity has implications forgovernment policy, which should aim to reverse this fact. This would create anopportunity to increase the productivity of low productive firms, as well as open up thepossibility of this labour force being re-employed if its firms go bankrupt.
In light of our research, it seems that managers in the new member states and inGermany firms tend to underestimate the need to improve the qualifications of theirworkers. As a rule, the share of employees that improved qualification was lower thanthat for the share of managers, although more managers than workers were qualified.Given technical progress, this above rule opens up a threat that the enlarged EU may beshort of qualified workers, which, in turn, could increase the productivity gap in relationto the US. This issue also has important implications for the Lisbon Strategy.
Unit labour costs (ULC), fixed capital intensity (FCI which is fixed assets peremployee) and fixed capital productivity (FCP is sales per fixed assets) are importantsources of productivity differences. The lower the ULC the higher the efficiency use oflabour costs. Various research indicates the strong impact of ULC on changes in marketshare in the analysed new member states (Wziatek-Kubiak and Winek, 2004). Partly thisis a result of high labour intensity of production in these countries. High correlation in oursamples between ULC and LPROD would appear also to confirms this.
ULC and LPROD are dependent on FCI. The higher FCI and FCP the higherproductivity should be. The lower FCI the lower substitution of labour by capital8.
Both the FCI and ULC of the new member states firms’ samples were very oftenmuch lower than the German firms’ samples (fig. 4). However, in this respect there weredifferences between the ‘worse’ and ‘better’ firms’ sub-samples. The ULC of the betterfirms’ sub-sample of new member states was lower than for their Germany counterpart.The converse held for the small ‘worse’ firms’ sub-samples of the new member statesand of the large Czech ‘worse’ firms’ sub-sample. This confirms that ULC was animportant source of LPROD differentiation between the two sub-samples.
24
Studies & Analyses No. 284 – A. Wzi¹tek-Kubiak, M. Jakubiak, M. Antczak
8 in our sample this concerned the Polish small firm sample
sa284 EN.qxd 02-10-04 18:52 Page 24
Another important reason for the gap in productivity between new member states wasvery low FCI9 and low FCP10. The impact of relatively (compared to Germany) low FCI onproductivity of the new member states was partly neutralized by relatively low ULC11. Thehigh level of FCI for the Czech Republic small firms’ sample and German ‘better’ large firms’sub-sample, which was accompanied by low FCP, suggest over-investment. However,comparison of differences in the levels of ULC and FCI with the levels of productivity, aswell as a regression model, indicates that these factors alone do not explain all thedifferences in productivity between the new member states and Germany.
Our aim is to illustrate the factors influencing the gap in productivity between thenew member states and Germany. Given, it seems, that Germany’s large firms’ samplewas over-invested, it was decided that in analysing the large firms’ sample the Polishsample would be taken as the point of reference.
The FCI of the Polish large firms’ sample was larger than for its Czech and Hungariancounterparts. However, the FCP of Polish firms was lower than for its Hungariancounterparts. This indicates that the high CPROD of the Polish large firms’ sample wasthe result not only of FCI and FCP, but other factors as well.
Comparison of FCI and FCP of large and small firm samples, as well as acrosscountries, indicates large-scale under-investment in the Polish and Hungarian small firms’
25
Studies & Analyses No. 284 – Differences in productivity and its determinants ...
Figure 4. Fixed capital intensity and unit labour costs, by country, firm size and productivity grade, 2002
05
1015202530354045
PL GE HU CZ PL GE HU CZ PL GE HU CZ PL GE HU CZSmall better Small worse Large better Large worse
0
20 000
40 000
60 000
80 000
10 000
12 000
14 000
ULC FCI
Source: own calculationsNotes: fixed capital intensity (FCI) = capital/employee, in euros, right scale
unit labour costs (ULC) – share of labour costs in total sales, in percent, left scale
9 FCI of the new member states was 4-5 time lower than Germany’s counterparts, except for the CzechRepublic.
10 Also in case of the Czech Republic.11 Except for Poland’s small firms’ sample.
sa284 EN.qxd 02-10-04 18:52 Page 25
26
Studies & Analyses No. 284 – A. Wzi¹tek-Kubiak, M. Jakubiak, M. Antczak
Table 6. Fixed capital productivity, penetration rate of innovation, investment intensity,fixed capital intensity, and specialisation, by country, firm size and productivity grade,2002
Large firmsSample average 5.9 23.1 0.04 24664 49.7Better 6.2 26.4 0.04 35017 12.0Worse 4.8 12.2 0.03 12389 57.2
Small firmsSample average 0.8 6.8 0.08 73049 86.2Better 1.7 16.0 0.10 41091 91.3Worse 0.7 5.6 0.08 81499 83.8
Large firmsSample average 2.6 4.6 0.02 25315 81.6Better 9.0 11.6 0.01 15017 84.2
CzechRepublic
Worse 1.2 3.0 0.02 29911 82.3Source: own calculationsFCP – fixed capital productivity, sales per fixed assets, in percentPROI – penetration rate of innovation, share of investment over existing fixed assets, in percentII – investment intensity, investment outlays to sales, in percentFCI – fixed capital intensity, fixed assets per unit of labour, in eurosSpecialisation - share of the sales of the two most important products in production, in percent
sa284 EN.qxd 02-10-04 18:52 Page 26
sample, where FCI was much lower than in the large firms’ samples and in the Germansmall firms’ sample. As far as the large firms’ sample and sub-samples are concerned, thesituation looks different. In the case of the ‘better’ firms’ sub-samples in the new memberstates only Czech large firms were under-invested, while in ‘worse’ firm sub-samples itwas Hungarian ones.
Comparison of levels of FCI for ‘better’ and ‘worse’ firms’ sub-samples of the threenew member states against their CPROD suggest the strong impact of FCI on theCPROD level. The very low FCI of the Hungarian and Poland’s small firm sample,accompanied by high FCP, means an urgent need to increase the investment rate. Overthe last three years the rate of investment in the Polish small firms’ sample has beenextremely low. A radical increase in the investment rate of Polish firms, especially smallones, is a basic prerequisite for improvement in their productivity and is importantdeterminant of economic growth in Polish manufacturing.
Differences in ULC, FCI and FCP between ‘better’ and ‘worse’ small firms’ sub-samples of new member explain to a high degree the differences in productivity betweenthem. This was not a case in the German small firms’ sub-samples. ULC of the ‘better’small firms’ sub-samples for German firms were higher than those of the ‘worse’, whilethe FCP of the ‘better’ was lower than for the ‘worse’ one. This implies differentiation inthe role of ULC, FCI and FCP in LPROD between ‘better’ and ‘worse’ firms’ sub-sampleswithin Germany and between it and the new member states. In the German case theimpact of the above factors on productivity was much weaker than in the three newmember states. This indicates that the higher level of productivity the lower role of ULCand FCI. Since the converse holds true, the role of investment in the improvement ofproductivity of low productive firms is crucial. This especially concerns the Polish andHungarian small firms’ sample. These research results have important policy implications.They affect above all the issue of the role of government in stimulating investment inPoland and Hungary, at least, especially given that in the last three years the gaps in theirFCI has been increasing. Without a radical increase in the investment rate, theproductivity of low productive firms will without doubt not improve.
Strong differences in productivity level between ‘better’ and ‘worse’ sub-samples ofnew member states was accompanied by differences in levels of ULC, FCI and FCP.
Firstly, the FCI of the Polish and Hungarian small firms’ sub-samples was lower thanfor their German counterparts. Only in the case of the Czech Republic were both smallfirms’ sub-samples’ FCI higher than in Germany. The fact that this was accompanied byvery low CPROD of Czech small firms’ sub-samples suggests their over-investment.
Secondly, the ULC and FCP of ‘better’ firms’ sub-samples for new member states isstrongly differentiated from the ‘worse’ ones. The ULC of ‘better’ small firms’ sub-samples of all new member states was much lower, while the FCP and FCI (except for
27
Studies & Analyses No. 284 – Differences in productivity and its determinants ...
sa284 EN.qxd 02-10-04 18:52 Page 27
the Czech Republic) were higher than in ‘worse’ ones. Efficiency of use of labour costsand level of fixed assets of the ‘better’ firms exceeded the level of ‘worse’ firms’ sub-samples. In the ‘worse’ firms’ sub-samples low relative FCI and high relative ULC impacton lower productivity. In the case of ‘better’ firms’ sub-samples, low FCI (but still higherthan for ‘worse’ ones) was partly neutralised by their low ULC. This suggests thatsubstitution of FCI by high productivity of labour in the ‘better’ sub-samples of newmember states has been taking place.
Summing up, FCI and ULC have been the most important factors responsible fordifferences in LPROD between large and small firms, between the samples of differentcountries as well as between sub-samples. High ULC and low FCI hamper LPRODgrowth. However, the higher level of productivity the lower impact of the ULC and FCI,even though there were some exemptions to this rule. This has important implicationsfor the government policy of new member states, especially Poland and Hungary. Itconfirms that an important prerequisite for improvement in productivity of such firms isthe creation of conditions conducive for investment activity.
Differences in FCP and in FCI should translate into differences in investment intensity.However, in this respect two different patterns of this relationship can be distinguished:(1) low FCI and FCP was accompanied by high intensity of investment and (2) low FCIand FCP were accompanied by low intensity of investment. The first model concerns‘worse’ sub-samples of large Polish and German firms. The second one concerns thePolish small firms’ sample.
On the one hand, lower FCI of ‘worse’ as compared to ‘better’ German and Polish largefirms’ sub-samples was accompanied by higher intensity of investment of ‘worse’ over‘better’ ones (Table 6 and Figure 5). On the other hand, the lower FCI of Polish large ‘worse’firms’ sub-samples than for their German counterparts was accompanied by a higherinvestment rate of the former. This suggests a better perception for development of Polishthan German large ‘worse’ firms. If this results in an improvement in productivity of Polishlarge firms from the ‘worse’ sub-sample one can expect increasing competition among suchfirms and in the ‘better’ large firms’ sub-sample for both countries. Lower CPROD of thePolish and German large ‘worse’ firms’ sample, which was accompanied by more investmentintensity than ‘better’ ones, indicates efforts by the former to improve productivity. This willresult in increasing competition between Poland’s and Germany’s large firms and the pushingout of new member states’ small firms (providing they produce the same product).
Investment intensity of the Polish small firms’ sample, which is characterised by farlower CPROD and LPROD than its Germany counterparts was the lowest among theanalysed countries. The fact that three best Polish small firms have not invested at all inthe last three years indicates the role of capital in exerting downward pressure on theproductivity growth of Polish small firms. This suggests that the gap in their productivity
28
Studies & Analyses No. 284 – A. Wzi¹tek-Kubiak, M. Jakubiak, M. Antczak
sa284 EN.qxd 02-10-04 18:52 Page 28
will increase, which may in turn result in many of them exiting from the market.Differences in specialisation (Table 6) between ‘worse’ and ‘better’ does not explain
differences in productivity and the correlation between specialisation and productivitylevels was also meaningless. Only in the cases of the Polish and the Czech Republic’s‘better’ firms’ sub-samples was specialisation higher than in the ‘worse’ sub-samples.
Surprisingly, the share of value of supplies and customers with whom firms havesigned long-term contracts was the highest for Polish samples. In many cases this sharewas higher for ‘worse’ than ‘better’ firms. Small differences across countries and amongsub-samples in this respect indicate the small impact of this factor on differences inproductivity.
Use of modern communications technology differs greatly between the new memberstates and Germany. An extremely small share of the Polish small firms’ sample use emailand www – in fact 3 times less than their Hungarian counterparts and 7 times less thanthan in Germany and the Czech Republic. The extremely low use of email, e-business andwww by Polish small firm is confirmed in other research. If e-banking is used by 100% oflarge Polish firms, it is used by only 10% of small ones (“Rzeczpospolita”, 2004a, 2004b).
A similar situation is noted in the sample of large Polish firms. The use of email wasmuch lower than the other countries surveyed. Although in most cases the use of suchcommunication in the ‘better’ firms’ sample was higher than in the ‘worse’ sample,though in this respect Polish large ‘better’ firms still lag behind. Given that analysis shows
29
Studies & Analyses No. 284 – Differences in productivity and its determinants ...
Figure 5. Fixed capital intensity and penetration rate of innovation, by country, firm sizeand productivity grade, 2002
200000150000100000
500000
Aver
erag
eBe
tter
Wor
seAv
erer
age
Bette
rW
orse
Aver
erag
eBe
tter
Wor
seAv
erer
age
Bette
rW
orse
Aver
erag
eBe
tter
Wor
seAv
erer
age
Bette
rW
orse
Aver
erag
eBe
tter
Wor
seAv
erer
age
Bette
rW
orse
Small Large Small Large Small Large Small LargePoland Germany Hungary Czech Republic
020406080100120
PRO
I
FC I PROI
Source: own calculationsNotes: fixed capital intensity (FCI) = capital/employee, in euro, left scale
penetration rate of innovation (PROI) – share of investment over existing fixed assets, in percent, right scale
sa284 EN.qxd 02-10-04 18:52 Page 29
that the higher the level of productivity the higher the use of this form of communication,the conclusion arises that the use of modern communication technology is conducive tohigher productivity levels. This leads into discussion of Polish government policy, whichshould be geared to improving the use of modern communications technology. Theproblem of EU policy in relation to Poland in this respect is of importance as well12.
30
Studies & Analyses No. 284 – A. Wzi¹tek-Kubiak, M. Jakubiak, M. Antczak
Table 7. Use of modern communications technology, networking and strategic planning,by country, firm size and productivity grade, in percent, 2002
Source: own calculationsSOSU - share of suppliers with whom a firm has signed long-term contractsSOCU – share of customers with whom a firm has signed long-term contractsSOST - share of other stake-holders with whom a firm has signed long-term contractsEMAIL – share of business contacts made by e-mailWWW – share of business contacts made through own web siteEBUS – share of business contacts made by e-businessSP - share of time spent on strategic planning
12 We refer to the discussion on the introduction in Poland of lower VAT for the use of modern communicationstechnology than is the case in other EU countries.
sa284 EN.qxd 02-10-04 18:52 Page 30
Table 7 shows that the higher the productivity level the higher the share of time spenton strategic planning. The share of time spent by managers on strategic planning in the‘better’ sub-samples13 was higher than for the ‘worse’ sub-samples. It is worthmentioning that managers in the new member states spent 2 times less time on strategicplanning than German managers.
6. Strategy of competition versus productivity
To evaluate differences in strategy of competition between the firms in the analysedcountries we introduce two complementary approaches. The first one seeks to pinpointcountry specifics and the second specifics that differentiate in terms of firms’ productivitylevels.
As far as the former approach is concerned, there were relatively large differences inthe strategy of competition between Germany and the three new member states. Themost important part of the German firms’ sample strategy was to reduce employment.More than 90% of surveyed firms put this factor in first place, followed by reduction ofother costs. Considering the high investment intensity of Germany the firms’ samples,which result in an increase in FCI, it seems that substitution of labour by capital will be acrucial factor in German firms’ fight to be competitive and a factor increasing theirproductivity. Except for the German ‘better’ sub-sample of large firms, the introductionof new products does not play an important role in the strategy of competition. Germanfirms’ strategy will have important macroeconomic consequences, mainly related todecreasing employment in the cosmetics industry in Germany. If German firms do notstart to improve their competitiveness and push foreign suppliers out of the marketunemployment will rise.
In the case of Polish and the Czech firms’ competition strategy, in contrast toGermany, the potential for reducing employment seems to be exhausted. Reduction ofother costs and (especially in the ‘better’ Czech sub-samples) and the introduction ofnew products are their key elements of their strategies of competition. However, theintroduction of this strategy demands an increase in the investment rate. The unfeasibilityof Polish firms to reduce employment and the important role played by the introductionof new products in the strategy of competition increase the importance of investment.This confirms that the basic prerequisite of increasing the productivity of Polish firms isan increase in investment intensity.
31
Studies & Analyses No. 284 – Differences in productivity and its determinants ...
13 except for the Czech and Polish ‘worse’ sub-samples of small firms
sa284 EN.qxd 02-10-04 18:52 Page 31
32
Studies & Analyses No. 284 – A. Wzi¹tek-Kubiak, M. Jakubiak, M. Antczak
Figu
re 6
. Com
petit
ive
stra
tegi
es, b
y co
untr
y, fi
rm s
ize
and
prod
uctiv
ity g
rade
, 200
2
0%10%
20%
30%
40%
50%
60%
70%
80%
90%
100%
Small
Larg
e
Polan
dG
erm
any
Hun
gary
Cze
ch R
epub
lic
Oth
er c
osts
redu
ctio
nN
ew p
rodu
cts i
ntro
duct
ion
Redu
ctio
n in
em
ploy
men
t
Avererage
Better
Worse
Avererage
Better
Worse
Avererage
Better
Worse
Avererage
Better
Worse
Avererage
Better
Worse
Avererage
Better
Worse
Avererage
Better
Worse
Avererage
Better
Worse
Small
Larg
eSm
allLa
rge
Small
Larg
e
Sour
ce: o
wn
calcu
latio
nsN
otes
: the
shar
e of
firm
s tha
t dec
lared
a w
illing
ness
to fo
llow
a g
iven
stra
tegy
sa284 EN.qxd 02-10-04 18:52 Page 32
33
Studies & Analyses No. 284 – Differences in productivity and its determinants ...
Figu
re 7
. Ass
essm
ent
of p
rodu
ctiv
ity d
eter
min
ants
in P
olan
d an
d G
erm
any,
by
firm
siz
e an
d pr
oduc
tivity
gra
de, 2
002
0%20%
40%
60%
80%
100%
Polan
dG
erm
any
low
erin
g em
ploy
men
t
mar
ketin
g ef
fort
sfo
reign
inve
stor
netw
orki
ng a
ctivi
ties
ow
n R&
Dpr
oduc
t qua
lity
of te
chno
logy
ratio
nalis
atio
n pr
oduc
tion
proc
ess
othe
r
Aver
age
Bette
rW
orse
Aver
age
Bette
rW
orse
Aver
age
Bette
rW
orse
Aver
age
Bette
rW
orse
Sour
ce: o
wn
calcu
latio
ns
sa284 EN.qxd 02-10-04 18:52 Page 33
The strategy of Hungarian firms is somewhat surprising. Its most important factor isintroducing new products. Very few firms consider reduction of other costs oremployment cuts. This is either because they have exhausted their potential to improveproductivity or have found new product markets in which they expect to be competitive.
Differences in productivity levels between the samples and sub-samples wereaccompanied by differences in firms’ strategy of competition. The introduction of newproducts plays the central role in the strategy of competition most often in the case ofhighly productive firms. In the case of firms with medium productivity, the introductionof new products and other costs of production play a major role. Reduction of other costsis the most frequently used tool in the strategy of competition of firms with lowproductivity. However, an important role here is also attached to the introduction newproducts. The exception to this rule is Germany, across all samples and sub-samples.Summing up, in terms of strategies of competition the productivity leaders mostfrequently use the introduction of new products. In the case of firms that are catching upfirms mainly in new member states this role is played by other cost reductions.Employment reductions play the major role only in case of German firms.
In strategy of productivity () there were no great differences between each countries’samples and between sub-samples within each country. However, some specifics werehighlighted. In the large Polish sub-sample the most frequent factor for increasingproductivity was expected to be networking activities, marketing efforts andrationalisation of production. In the German case it was own R&D, product quality oftechnology and rationalisation production processes. Own R&D continues to play only aminor role in Polish firms’ strategy of competition.
7. Cluster analysis
This part of the paper is based on the clustering of enterprises which are similar interms of fixed capital intensity, labour costs, human capital improvement, use of e-mailand stability of business contacts. Average productivity levels are then calculated for thesegroups in order to check whether firms of different characteristics differ in terms ofproductivity. In other words, we wanted to check whether we can link the set of firm-specific potential productivity determinants with good or bad productivity scores for thesurveyed firms from the cosmetic industry.
Cluster analysis is usually used to assign cases to groups. Group members share certainproperties in common and it is hoped that the resultant classification will provide some
34
Studies & Analyses No. 284 – A. Wzi¹tek-Kubiak, M. Jakubiak, M. Antczak
sa284 EN.qxd 02-10-04 18:52 Page 34
insight into a research topic. The procedure is widely used in the social sciences, includingeconomics. It suffices to mention the example of research by Neven (1994), who usedGerman industry-level data and clustered branches according to their factor intensities.After obtaining five clusters that differed in labour, capital and human capital intensity, hecalculated comparative advantages in trade with other countries for each of the clusters.Neven’s taxonomy has been widely used also for other countries (including the current newmember states), to assess whether they have a comparative advantage in producing labour-, capital-, and/or human capital-intensive commodities. Levin (1988) used firm level data andgrouped enterprises similar in terms of their learning through licensing, conducting theirown R&D and acquiring low-cost technological information. After obtaining three clustersthat shared the same R&D-related characteristics, he calculated their R&D intensities, aswell as product and process innovations, thus linking R&D spillovers with firms’ competitivestrategies.
Here, the method has been applied for the following reasons:• It is an alternative and complementary method to the analysis presented so far.• Enterprises are grouped according to sets of characteristics. In other words, we are
comparing firms which – at the same time – are similar according to many variables.• Observations from the overall sample are used, without discriminating for the
localisation of their business activities.• We are not assuming the existence of a productivity gap between German and CEE
enterprises a priori. In fact, the assumption seems to be correct when we look at thedata on productivity levels among large and small firms from Germany and from theCEECs – sometimes a gap exists between the firms in the sample, while in somecases (large Polish and German firms) it does not.
• The method clearly distinguishes between characteristics of the enterprises in thesample (possible factors influencing productivity) and the outcome – productivity levels.
7.1. Methodology
Firstly, all the firms in the sample were grouped according to five indicators. Theindicators were selected from the range of the already discussed measures and on thebasis of their potential relevance in explaining the productivity gap between German andCEE enterprises.
We have seen in the previous part of this paper that it is possible to distinguish a setof “hard” and “soft” potential productivity determinants for this sample of enterprises.The efficient use of labour and capital clearly influences labour productivity and it is acrucial factor in improving the productivity of the weakest firms. However, “softer”
35
Studies & Analyses No. 284 – Differences in productivity and its determinants ...
sa284 EN.qxd 02-10-04 18:52 Page 35
factors like improvements in employee qualifications, as well as stable business contactsand efficient communications are also possible factors important for achieving higherproductivity among the firms in the sample. Therefore, the following indicators werechosen to discriminate among all firms and calculate clusters of similar enterprises:
• unit labour costs (measuring the efficiency of the use of labour),• fixed capital intensity (fixed assets per employee, showing the efficiency of the use of
capital),• percentage of the workforce upgrading skills (improvement of human capital),• share of clients with whom the firm has long-term contracts (stability of business
environment),• percentage of business contacts made by e-mail (use of modern communications
technology).As earlier, we have assumed that firms of different sizes and oriented towards
different markets operate differently. Hence, cluster analysis was performed separatelyfor two sub-samples: small and large firms from the cosmetics industry.
Two clusters were obtained for small firms and three clusters for large firms samples.For each of the clusters, average productivity measures were calculated in order to assesswhether similar firms differ in terms of labour and capital productivity.
The reasons, for which data from all the countries were used together, withoutdiscriminating first in terms of localisation, were the following:
• We were primarily interested in obtaining firm-specific characteristics within eachsub-sample in this part of the analysis.
• This approach allows us to check, at firm-level data, whether the productivity gapbetween similar western German and CEEC enterprises really exists, withoutassuming it in the first place.
• The scarcity of the German data does not allow for any representative comparisonbetween western German and CEEC indicators. In this approach, we can easily seehow many enterprises entered a chosen cluster and at the same time be aware of theconstraints stemming from the overall small numbers of observations.With fixed assets intensity as one of the variables chosen for the selection of clusters,
clusters differ in size. Even when standardised, fixed capital intensity is the strongestdifferentiating factor, resulting in an unequal distribution of observations into particular clusters.
As in the previous section, the analysis is based on data from 116 firms, 22 of themlocated in Germany (7 in the west and 15 in the east14), 38 in Poland, 37 in the CzechRepublic and 19 in Hungary.
36
Studies & Analyses No. 284 – A. Wzi¹tek-Kubiak, M. Jakubiak, M. Antczak
14 Here, the difference between eastern and western German firms was included, as the number of firms fromone country did not matter in the selection, and as the same time this division yielded interesting results.
sa284 EN.qxd 02-10-04 18:52 Page 36
The procedure for each of the two subgroups started from the hierarchical clusteringmethod. On the basis of squared Euclidean distances, the optimal number of clusters wasspecified. It was two for small firms and three for large firms. Then, clustering procedurefor the two sub-samples was performed again with the specified number of clusters.
7.2. Clustering results – small cosmetics manufacturers
Surprisingly, the two groups of small firms selected on the basis of similar use ofcapital, labour and other factors did not differ much in terms of labour productivity. Theywere very different only when capital productivity was concerned. Nevertheless, a shortdescription of the two clusters is provided below.
Small enterprises from the cosmetics industry that have higher labour and capitalproductivity (cluster 1 in Table 8) are characterised by:
• higher than in cluster 2 unit labour costs (but the difference rather small),• around 20% of the workforce upgrading skills (more than in cluster 2),• managers spending 28% of their time on strategic planning (less than in cluster 2),• lower product innovation,• lower investment intensity, lower fixed capital intensity, but nearly 40% of investment
is put into new assets,• higher share of clients with long-term contracts (70%),• 45% of business contacts made by e-mail (much less than in cluster 2).
Enterprises clustered here did not differ from the other group in terms of scale ofproduction. 60% of sales of both clusters was down to their most important product.This category groups 53 small enterprises that are more productive than the remaining9. Almost all small German enterprises, almost all Polish and all Hungarian firms fell intothis category. The majority of Czech firms are also found here.
In contrast, firms with lower productivity (cluster 2) were characterised by:• lower ULC, similar wages,• less than 10% of workers upgrading skills,• managers spending nearly 40% of their time on strategic planning (more than in
cluster 1),• 2.5 times higher than in cluster 1 product innovation,• higher investment intensity; but 80% of investment goes on replacement of old
capital stock,• less stable business environment,• over 60% of business contacts via e-mail (better result).
This cluster consists mainly of Czech firms.
37
Studies & Analyses No. 284 – Differences in productivity and its determinants ...
sa284 EN.qxd 02-10-04 18:52 Page 37
It seems that among the surveyed small firms three rather “soft” factors, workersupgrading skills, investment in enlarging capital stock, and stable demand for themerchandise, are the only possible causes of the slightly higher average productivity ofthe first cluster of firms. This outcome is counterintuitive and suggests that there areother factors influencing productivity that are omitted here. The other reason is that thesample is not homogenous.15
In order to check for possible selection bias, both clusters were divided into groupsof more and less productive firms16. It turned out that both samples were nothomogenous in terms of labour productivity. There was one outlier in cluster 1 and twooutliers in cluster 2. These were firms that had labour productivity above or close to theaverage, plus two standard deviations. While 52 enterprises of cluster 1 had labourproductivity in the range of 0.2-87.5 thousand euros, one western German firm recordedLPROD at a level of 167,000 euro per employed17. Similarly, in cluster 2, all 7 Czech firmsrecorded labour productivity in the range of 17-45,000 euro and two enterprises (Polishand eastern German) were much more productive – 120,000 euro per employed onaverage.
Intra-cluster differences among the groups of outlined firms18 are given in columns 3-4 and 6-7 of Table 8. Because fixed capital intensity was strong the differentiating factorin the clustering procedure and intra-cluster differences of this variable are negligible andfixed capital intensity is not linked with much higher labour productivity. However, intra-cluster differences suggest that lower unit labour costs, together with employing aqualified labour force (judging by high labour costs and location in urban areas19),investment in new assets and a stable business environment, can explain the largedifferences in productivity levels between three highly productive “benchmark” firms andthe remaining small enterprises. In addition, a German firm from cluster 1 probably foundan advantage over the rest of the similar but less productive firms in frequent changes ofits main product (50 times per year on average) and in the good access to e-mail and theInternet.
Taking into account both inter- and intra-cluster differences, one can conclude thatdifferences in the use of capital are not linked with differences in labour productivity inthis sample of small cosmetics manufacturers. However, a qualified labour force, low unit
38
Studies & Analyses No. 284 – A. Wzi¹tek-Kubiak, M. Jakubiak, M. Antczak
15 in terms of productivity; outliers may cause that average results are biased.16 by LPROD17 With average LPROD of 36,300, all the firms in the range of 200-87,500 euro are well within the limits of
average+-2 standard deviations. However, every firm with LPROD above 98,400 is an outlier.18 Here, column 3 vs. column 4 and column 6 vs. column 7 of Table 8 are compared. The differences within
each cluster that are at the same time common for both clusters are listed.19 high value of the indicator of infrastructure.
sa284 EN.qxd 02-10-04 18:52 Page 38
labour costs, investment in the enlargement of capital stock and a stable businessenvironment are possible factors supporting higher than average productivity.
However, it is highly possible that there also exist other factors influencingproductivity levels among the small cosmetics and detergents producers of this sample.
39
Studies & Analyses No. 284 – Differences in productivity and its determinants ...
Table 8. Clusters of firms with similar characteristics, small enterprises, 2002
Source: own calculations* - number of firms in parentheses
sa284 EN.qxd 02-10-04 18:52 Page 39
These factors can be of different nature:• small firms of the cosmetics industry operating in CEE face different market
conditions than German enterprises. They operate on the still transforming markets,subject to external shocks (like sudden changes in the business environment);
• it is also possible that some of the small firms from the CEE are producing not onlycosmetics and detergents. They may be involved also in other forms of activities.Otherwise, with such low productivity, they should not have stayed on the market.
• small firms from Poland, Hungary, the Czech Republic and Germany may servecompletely different market segments, producing goods of a different value added.Hence we are comparing incomparable market segments.
We now turn to perceptions about ways of improving productivity by these firms andtheir competitive strategies. The average importance attached to particular strategies foreach of the two clusters are outlined in the graphs that follow. Less productiveenterprises of cluster 2 judge correctly that in order to be more productive they shouldre-organise and manufacture commodities of higher quality.20 Extending marketingefforts is their next priority. The more productive enterprises of cluster 1 have onaverage less concentrated views on the possible factors that influence their productivity,with the exception of assigning low importance to finding a foreign investor.
The small firms probably believe that they are using the labour factor relativelyefficiently and therefore do not see lowering employment either as a way to improveproductivity or as a tool to be more competitive. This with the notable difference of thealready mentioned western German firm in cluster 1 that sees lowering employment as
40
Studies & Analyses No. 284 – A. Wzi¹tek-Kubiak, M. Jakubiak, M. Antczak
Table 9. Distribution of firms among two clusters, small enterprises, 2002
20 Assuming that producing commodities with higher value added is the same as producing commodities ofhigher quality.
sa284 EN.qxd 02-10-04 18:52 Page 40
41
Studies & Analyses No. 284 – Differences in productivity and its determinants ...
Figure 8. Assessment of productivity determinants, by cluster, small firms, 2002
0.0 0.2 0.4 0.6 0.8 1.0
perc_I_empl
perc_mar
perc_netw
perc_R&D
perc_techn
perc_prod
cluster 2cluster 1
perc_FI
Source: own calculationsNotes: share of firms marking a given strategy as important
perc_prod – rationalisation of the processes of production,perc_techn – manufacturing higher quality or more technologically advanced products,perc_R&D – engaging in/extending own R&D,perc_netw – engaging in/extending networking activities,perc_FI – finding foreign investor,perc_mar – engaging in/extending marketing efforts,perc_l_empl – lowering employment.
Figure 9. Competitive strategies, by cluster, small firms, 2002
0.0 0.2 0.4 0.6 0.8 1.0
cluster 2cluster 1
comp_newprod
comp_costs
comp_empl
Source: own calculationsNotes: share of firms declaring to follow a given strategy.
comp_newprod – introducing new products,comp_empl – lowering employment,comp_costs – lowering other costs.
sa284 EN.qxd 02-10-04 18:52 Page 41
the primary tool for competitive gains (and is indeed more productive and has low unitlabour costs).
7.3. Clustering results – large cosmetics firms
The outcomes obtained for large enterprises in the cosmetics and detergentsindustry are more straightforward. As a result of hierarchical and k-means classifications,three clusters of large firms that differ in terms of characteristics and productivity levelswere obtained. One cluster (cluster 2 of Table 10) included firms with high labour and“middle” capital productivity, the other – the most numerous (with 41 firms, cluster 3) –included enterprises with low labour and high capital productivity and the last wascomposed of two outlying firms with “upper middle” productivity and low capitalproductivity, characterised by very high fixed capital intensity.
Let us start from a description of the second cluster, which groups enterprises withthe highest labour productivity (and “middle” capital productivity, see ). The clusterconsists of 11 large enterprises from Central and Eastern Europe (see ). It is worthmentioning that none of the western German firms fell into this category. However, thethree most productive Polish firms (and at the same time the most productive firms inthe whole sample of firms from all 4 countries) entered this cluster. The firms from thiscluster are on average characterised by:
• „middle“ scale of production; no different from cluster 3, around 50% of sales is dueto the first product,
• the lowest ULC, the lowest wages,• 26% of workers upgrading skills (lower than in less labour productive cluster 3),• managers spend less than 30% of their time on strategic planning,• the highest product innovation (on average, 4 products introduced every year),• high fixed capital intensity (nearly 4 times higher than in cluster 3),• very low and the lowest in this sample investment intensity; 36% of investment is put
into new assets,• 80% of contracts with clients of a long-term nature,• the most intensive users of modern telecommunications technologies.
The next group (cluster 3 of ) is the most numerous. These are 41 enterprises withthe lowest labour and the highest capital productivity. The firms are from both the CEEcountries and from western Germany. These firms share the following properties:
• „middle“ scale of production; no different from the most productive cluster 2, around50% of sales due to the primary product,
42
Studies & Analyses No. 284 – A. Wzi¹tek-Kubiak, M. Jakubiak, M. Antczak
sa284 EN.qxd 02-10-04 18:52 Page 42
• „middle“ ULC, relatively low (but higher than in cluster 2) wages,• 30% of workers upgrading skills (the best result),• managers spend less than 30% of their time on strategic planning,• average product innovation (on average, 3 products introduced every year),• the lowest fixed capital intensity,• relatively high investment intensity; 30% of investment is put into new assets,• 70% of contracts with clients of long-term nature,• average use of modern telecommunications technologies.
Finally, the last group (cluster 1 of ) is very small, and consists of only two firms: onewestern German and one Polish firm. These enterprises, relative to the rest of thesample, have high labour and low capital productivity, and are characterised by:
• large scale of production (100% of sales is due to the first two products),• the highest unit labour costs, very high wages (due to the high wages of the western
German firm),• over 90% of the workforce NOT upgrading skills (none in the western German firm,
only 20% in the Polish firm),
43
Studies & Analyses No. 284 – Differences in productivity and its determinants ...
Table 10. Clusters of firms with similar characteristics, large enterprises, 2002
Indicator cluster 1 cluster 2 cluster 3
LPROD 92 295 113 624 46 228CPROD 0.452 1.880 2.778share of the most important product in total sales 0.750 0.495 0.511unit labour costs (ULC) 0.236 0.048 0.108monthly labour costs per employed 5170.1 771.9 882.5share of workers upgrading skills 0.094 0.260 0.305share of time spent on strategic planning 0.155 0.288 0.276investment intensity (I/sales) 0.070 0.009 0.065share of investment into new assets 0.175 0.364 0.297fixed capital intensity 204 251.6 60 437.0 16 641.8product innovation during last 3 years 3 11 8share of clients with long-term contracts 0.875 0.791 0.710EMAIL 0.575 0.700 0.620WWW 0.625 0.536 0.459Indicator of infrastructure (0-1) 0.694 0.701 0.554Perception of competition (0-1) 0.500 0.464 0.499
Source: own calculations
sa284 EN.qxd 02-10-04 18:52 Page 43
• managers spend 85% of their time on current operational activities,• the lowest product innovation (on average, 1 new product per year),• the highest fixed capital intensity (12 times higher than in cluster 3),• the highest investment intensity, but only 18% of investment is put into new assets,• nearly all contracts with clients of long-term nature,• high use of modern communications technologies for business contacts.
In summation, the following firm-specific features (common to clusters 1 and 2 andat the same time different from cluster 3) can be linked with higher labour productivityin the analysed sample of large enterprises from the cosmetics and detergents industry:high fixed capital intensity, intensive use of modern telecommunications technologies,stability of business contacts and localisation in areas with better infrastructure. Inaddition, firms from cluster 2, which enjoy the highest labour productivity, have very lowunit labour costs, pay low wages, are very innovative and invest intensively in enlargingtheir existing capital stock. When compared with small firms of the same industry it isevident that business contacts are more stable for the group of large enterprises and evenin the group of the least productive large firms (cluster 3), over 70% of contracts withclients are of a long-term nature.
Investment in new assets and upgrading skills supports higher capital productivity.However, it seems that capital is most productive in enterprises where it is scarce (cluster 3).
The most productive firms (cluster 2) assess as perfect their competition strategiesas well as possible ways to further improve their productivity. They not only compete byintroducing frequent changes to products, half of them on average drive rivalcommodities out of the market by lowering employment and other costs (see Figure 11).
44
Studies & Analyses No. 284 – A. Wzi¹tek-Kubiak, M. Jakubiak, M. Antczak
Table 11. Distribution of firms between two clusters, large enterprises
Managers of two also highly labour productive firms of cluster 1 are less aware oftheir firms’ strategies. They declare that they compete by introducing new products,while in reality they introduce on average one product per year, which makes them theleast innovative group in the sample of large firms. They also compete also by loweringcosts other than those related to labour, although at the same time they judge, correctly,that they should have decreased employment in order to gain productivity (see Figure10). They also perceive the need to find a foreign investor, extend networking activitiesand/or engaging in R&D (see Figure 10). These strategies would probably help them inbecoming more innovative, thus increasing their productivity.
Enterprises grouped in cluster 3 can increase the productivity of their workers in twoways: either by producing commodities with higher value added or by loweringemployment, or both. Managers here perceive, rightly, the need to move up in the valuechain by declaring that manufacturing higher quality products and extending networkingactivities can help them most in productivity improvement. They also see the need to re-organise their enterprises but at the same time underestimate the role of decreasing
45
Studies & Analyses No. 284 – Differences in productivity and its determinants ...
Figure 10. Assessment of productivity determinants, by cluster, large firms, 2002
0.0 0.2 0.4 0.6 0.8 1.0
cluster 2cluster 1
cluster 3
perc_prod
perc_techn
perc_R&D
perc_netw
perc_FI
perc_mar
perc_I_empl
Source: own calculationsNotes: share of firms marking a given strategy as important.
perc_prod – rationalisation of the processes of production,perc_techn – manufacturing higher quality or more technologically advanced products,perc_R&D – engaging in/extending own R&D,perc_netw – engaging in/extending networking activities,perc_FI – finding foreign investor,perc_mar – engaging in/extending marketing efforts,perc_l_empl – lowering employment.
sa284 EN.qxd 02-10-04 18:52 Page 45
employment (see Figure 10). They also underestimate the role of finding a foreigninvestor. This is somewhat strange since these firms are under-invested and could gainadditional capital by finding a foreign investor. An explanation may be that the majority ofthese firms are already owned by foreign capital. However, if this is not the case, it seemsthat the management of these enterprises is not aware of the firms’ weaknesses.
46
Studies & Analyses No. 284 – A. Wzi¹tek-Kubiak, M. Jakubiak, M. Antczak
Figure 11. Competitive strategies, by cluster, large firms, 2002
0.0 0.2 0.4 0.6 0.8 1.0
cluster 2cluster 1
cluster 3
comp_newprod
comp_costs
comp_empl
Source: own calculationsNotes: share of firms declaring to follow a given strategy.
comp_newprod – introducing new products,comp_empl – lowering employment,comp_costs – lowering other costs.
sa284 EN.qxd 02-10-04 18:52 Page 46
Summary
Our field research was based on analysis across countries and among firms thatdiffered in terms of productivity levels, between what we termed ‘worse’ and ‘better’sub-samples, as well as between the three best and worst firms. Conclusions concerningcountry specifics and specifics of firms differing in terms of productivity levels are outlinedbelow.
1. The following features distinguish the firm samples for the three member states fromGermany:
• extremely high differentiation in productivity levels among firms in the large andsmall samples and much bigger than between the two samples. This is linked tothe process of shaping the market structure of the new member states, which isa major part of their transition. The productivity gap between firms in the ‘worse’sub-samples of the new member states and Germany was far greater than in caseof the ‘better’ firms’ sub-samples. The major problem of the new member statesis not the lack of highly productive firms but the continued operation of many verylow productive firms. This means that the selection process issue among the firmsin the surveyed countries will come to the fore in the nearest future.
• very low productivity level of small firms’ samples for the new member states.Since productivity of the ‘better’ sub-samples of small firms of the new memberstates was lower than Germany’s ‘worse’ sub-sample and the investment rate ofthe former was much lower than the latter, the continuation of the process ofdeep and wide selection and the squeezing out of small firms in the new memberstates is very likely to be taking place.
• large firms in the new member states produce comparable products, serve massmarkets and are highly productive. The most productive were Polish firms andthe least were their Czech and Hungarian counterparts. In-depth analysis of‘worse’ firms’ sub-samples shows that Polish and German firms will likely moveup the productivity ladder.21 This indicates increasing competition between Polishand German firms of this survey from today’s ‘better’ and ‘worse’ sub-samplesand increasing their competitive pressure on Czech and Hungarian firms.
• more labour intensive production and higher intensity of work per employee inthe new member states. The lower role played by R&D in strategy of
47
Studies & Analyses No. 284 – Differences in productivity and its determinants ...
21 The result refers to this sample, and may not be true for the whole branch, which has been loosing its relativeimportance to the rest of the manufacturing industry in Germany.
sa284 EN.qxd 02-10-04 18:52 Page 47
competition of these firms indicates that they will focus on a low technology typeof production
• very low capital intensity and investment rate, especially in Polish firms. Thisimplies low substitution of labour by capital, in contrast to German firms’strategy.
• Exhausting possibilities to lower employment in productivity improvement,especially in Poland.
• lower share of managers’ daily time spent on strategic planning, indicating a lessstable business environment.
• extremely low use of modern communications technology of Polish firms. 2. Specific conclusions for firms are based on comparisons between ‘better’ and ‘worse’
firms’ sub-samples. Lower productive firms are characterized by lower fixed capitalintensity and investment rate, higher unit labour costs, a lower share of employeeimproving qualifications and lower use of modern communications technology.
3. Research indicates that the higher the productivity the lower the role of fixed capitalintensity and unit labour costs. It was shown in the clustering analysis that in spite ofthe “hard” determinants of productivity, like labour costs and investment, achievinghigher productivity is also a question of sets of other, “soft”, factors related to goodmanagement. These are: ability to compete by being innovative and at the same timesecuring long-term contracts with clients and being up-to-date with moderncommunications technologies. Moreover, the correct assessment of a firm’s strengthand weaknesses helps very much in the efficient use of factors of production.
4. Clustering analysis also confirmed that small and large firms from the cosmetics anddetergents industry operating in the three new member states and in Germany haveindeed different productivity determinants and face different constraints. While it ispossible that the productivity of the small firms was influenced by factors notaccounted for in the survey, the results obtained for large firms are straightforward.Clustering analysis performed on the group of large cosmetics firms shows that lowlabour costs are still the advantage in new member states, especially in the CzechRepublic and Poland. If coupled with adequate investment and wise management, theycan lead to higher labour productivity than in the western German firms.
5. Firm-level analysis also shows that small firms are more aware of their businessenvironment and more adequately assess their own competitive strategies than largeenterprises. Views about ways to improve productivity among the group of largeenterprises are more blurred and only the most productive large firms evaluatecorrectly what they should do in order to be more productive.
6. There exist differences in productivity performance of rural and urban firms,irrespective of whether they are large or small or whether the are from CEE or
48
Studies & Analyses No. 284 – A. Wzi¹tek-Kubiak, M. Jakubiak, M. Antczak
sa284 EN.qxd 02-10-04 18:52 Page 48
Germany. Firms located in urban areas – which enjoy better infrastructure, betteraccess to a qualified labour force and modern technologies – are much moreproductive. In addition, smaller firms located in urban areas have productivity nodifferent from the productivity of large enterprises.
49
Studies & Analyses No. 284 – Differences in productivity and its determinants ...
sa284 EN.qxd 02-10-04 18:52 Page 49
Policy implications
Investment policyThe role of investment in productivity improvement, especially of low productive
firms, is crucial. The very low relative fixed capital intensity of the new member states,which is accompanied by low unit labour costs, high intensity of work and exhaustion ofthe potential to reduce employment are the main arguments supporting the urgent needto stimulate investment in the new member states. This is a prerequisite for moving upthe quality ladder and maintaining comparative advantages of lower costs of labour inthese countries. Given the hypothesis that the lower the productivity the higher the roleof fixed capital intensity in productivity improvement, there is an urgent need to createthe environment which will support the increase in the investment rate in thesecountries.
SME policyVery low productivity of SMEs of the new member states compared to Germany, as
well as very low fixed capital intensity and investment rates, low share of employeesimproving qualifications, as well as unstable business environments are the mainarguments for improvements in SME policy in the new member states. Since mostproduction in the analysed branch is of a labour-intensive character and low labour costsare still a key advantage of the new member states, the low mark-up on wages (especiallysocial security contributions) is of special importance. Another argument for theimprovement in SME policy is extremely high differentiation in productivity levels amongthe SMEs in the samples, suggesting a broad process of squeezing them out of the marketin the nearest future.22
Education and training policyDifferences between ‘better’ and ‘worse’ firms’ sub-samples in the share of
employees improving qualifications , reinforce the selection process on the market andhave important macroeconomic implications. The lower the level of productivity thesmaller the share of personnel upgrading skills. Thus, trainings as a determinant ofproductivity level influences and will continue to influence the process of selection offirms. If ‘better’ firms push out ‘worse’ firms from the market, the problem ofunemployed, which does not act to raise qualifications, will grow. Without further training
50
Studies & Analyses No. 284 – A. Wzi¹tek-Kubiak, M. Jakubiak, M. Antczak
22 This hypothesis is based on the assumption that the small firms in the samples produce the same products.However, it is very possible that small firms serve completely different market segments.
sa284 EN.qxd 02-10-04 18:52 Page 50
people will, furthermore, stay unemployed, adding to already large structuralunemployment in some of the new member states (especially in Poland). The issue ofgovernment policy in education and training, especially of workers who are, as ourresearch results reveals, much less involved in education and training than managers, istherefore being pushed high up the agenda. The problem is also related to the LisbonStrategy.
Regional policy The differences in productivity levels of rural and urban firms create the need for a
policy supporting investment in infrastructure and the development of rural areas.
51
Studies & Analyses No. 284 – Differences in productivity and its determinants ...
sa284 EN.qxd 02-10-04 18:52 Page 51
References
van Ark, B. and R. McGuckin (1999). International Comparisons of Labour Pand PerCapita Income. Monthly Labor Review. July.
Hashi I. and E. Balcerowicz (2004). The Comparative Analysis of State Aid andGovernment policy in Poland, Hungary, and Czech Republic. Opere at Studio proOeconomia. May.
Levin, R. C. (1998). Appropriability, R&D Spending, and Technological Performance. TheAmerican Economic Review, Vol. 78, No. 2.
Maczynska, E. (ed.) (2001). Enterprise Restructuring in the Process of Transformation ofPolish Economy (in Polish, “Restrukturyzacja przedsiêbiorstw w procesie transformacjigospodarki polskiej”). DIG: Warsaw.
Neven (1994). Trade Liberalization with Eastern Nations. How Sensitive? CEPR DiscussionPaper No. 1000. July.
Rzeczpospolita (2004a). Not very popular service (in Polish), published 23.07.2004 in dailyRzeczpospolita.
Rzeczpospolita (2004b). Careful with investments (in Polish), published 16.06.2004 in dailyRzeczpospolita.
Wzi¹tek-Kubiak, A. i D. Winek (2004). Changes in Market Shares Relevant Indicator ofChanges in Competitiveness? A Case of Poland. Opere at Studio pro Oeconomia. May.
52
Studies & Analyses No. 284 – A. Wzi¹tek-Kubiak, M. Jakubiak, M. Antczak