DOCKETED Docket Number: 19-BSTD-03 Project Title: 2022 Energy Code Pre-Rulemaking TN #: 234504 Document Title: CASE Report High Efficiency Boilers and Service Water Heating Description: Codes and Standards Enhancement (CASE) Initiative Report for the 2022 California Building Energy Efficiency Standards submitted by staff Filer: Haile Bucaneg Organization: California Energy Commission Submitter Role: Commission Staff Submission Date: 8/26/2020 12:08:50 PM Docketed Date: 8/26/2020
Transcript
DOCKETED Docket Number: 19-BSTD-03
Project Title: 2022 Energy Code Pre-Rulemaking
TN #: 234504
Document Title: CASE Report High Efficiency Boilers and Service Water
Heating
Description:
Codes and Standards Enhancement (CASE) Initiative Report
for the 2022 California Building Energy Efficiency Standards
submitted by staff
Filer: Haile Bucaneg
Organization: California Energy Commission
Submitter Role: Commission Staff
Submission Date: 8/26/2020 12:08:50 PM
Docketed Date: 8/26/2020
15Codes and Standards Enhancement (CASE) Initiative 2022 California Energy Code
High Efficiency Boilers and Service Water Heating
2022-NR-HVAC3-F | Nonresidential HVAC | August 2020 FINAL CASE REPORT Prepared by Energy Solutions Please submit comments to [email protected].
This report was prepared by the California Statewide Codes and Standards Enhancement (CASE) Program that is funded, in part, by California utility customers under the auspices of the California Public Utilities Commission. Copyright 2020 Pacific Gas and Electric Company, Southern California Edison, San Diego Gas & Electric Company, Los Angeles Department of Water and Power, and Sacramento Municipal Utility District. All rights reserved, except that this document may be used, copied, and distributed without modification.
Neither Pacific Gas and Electric Company, Southern California Edison, San Diego Gas & Electric Company, Los Angeles Department of Water and Power, Sacramento Municipal Utility District or any of its employees makes any warranty, express or implied; or assumes any legal liability or responsibility for the accuracy, completeness or usefulness of any data, information, method, product, policy or process disclosed in this document; or represents that its use will not infringe any privately-owned rights including, but not limited to, patents, trademarks or copyrights.
2022 Title 24, Part 6 Final CASE Report – 2022-NR-HVAC3-F | 1
Document Information Category: Codes and Standards
Keywords: Statewide Codes and Standards Enhancement (CASE) Initiative; California Statewide Utility Codes and Standards Team; Codes and Standards Enhancements; 2022 California Energy Code; 2022 Title 24, Part 6; efficiency; boiler; service water heating; HVAC; condensate; combustion; hydronic; thermal efficiency; trim control;
Authors: George M. Chapman, Sam Chussid, Simon Silverberg, and Shaojie Wang (Energy Solutions); Ben Lalor, Erica DiLello (NORESCO)
Prime Contractor: Energy Solutions
Project Management:
California Statewide Utility Codes and Standards Team: Pacific Gas and Electric Company, Southern California Edison, San Diego Gas & Electric Company, Los Angeles Department of Water and Power, Sacramento Municipal Utility District.
2022 Title 24, Part 6 Final CASE Report – 2022-NR-HVAC3-F | 2
Table of Contents 1. Introduction ______________________________________________________ 19
2. Measure Description _______________________________________________ 22 2.1 Measure Overview .............................................................................................. 22 2.2 Measure History ................................................................................................. 24 2.3 Summary of Proposed Changes to Code Documents ........................................ 29 2.4 Regulatory Context ............................................................................................. 31 2.5 Compliance and Enforcement ............................................................................ 34
4. Energy Savings ___________________________________________________ 51 4.1 Key Assumptions for Energy Savings Analysis .................................................. 51 4.2 Energy Savings Methodology per Prototypical Building ..................................... 53 4.3 Statewide Energy Savings Methodology ............................................................ 59 4.4 Per-Unit Energy Impacts Results ........................................................................ 61
5. Cost and Cost Effectiveness _________________________________________ 77 5.1 Energy Cost Savings Methodology ..................................................................... 77 5.2 Energy Cost Savings Results ............................................................................. 77 5.3 Incremental First Cost ........................................................................................ 90 5.4 Incremental Maintenance and Replacement Costs ............................................ 93 5.5 Cost Effectiveness .............................................................................................. 94
6. First-Year Statewide Impacts _______________________________________ 110 6.1 Statewide Energy and Energy Cost Savings .................................................... 110 6.2 Statewide Greenhouse Gas (GHG) Emissions Reductions .............................. 113 6.3 Statewide Water Use Impacts .......................................................................... 114 6.4 Statewide Material Impacts............................................................................... 114 6.5 Other Non-Energy Impacts ............................................................................... 117
7. Proposed Revisions to Code Language ______________________________ 118 7.1 Guide to Markup Language .............................................................................. 118 7.2 Standards ......................................................................................................... 118 7.3 Reference Appendices ..................................................................................... 122 7.4 ACM Reference Manual ................................................................................... 122 7.5 Compliance Manuals ........................................................................................ 126
2022 Title 24, Part 6 Final CASE Report – 2022-NR-HVAC3-F | 3
Table 5: System and Individual Unit Thresholds of Proposed Requirements ................ 23
Table 6: Nonresidential Boiler and Service Water Heater Market Actors and Roles ..... 38
Table 7: California Construction Industry, Establishments, Employment, and Payroll .. 41
Table 8: Specific Subsectors of the California Commercial Building Industry Impacted by Proposed Change to Code/Standard ...................................................................... 42
Table 9: California Building Designer and Energy Consultant Sectors .......................... 43
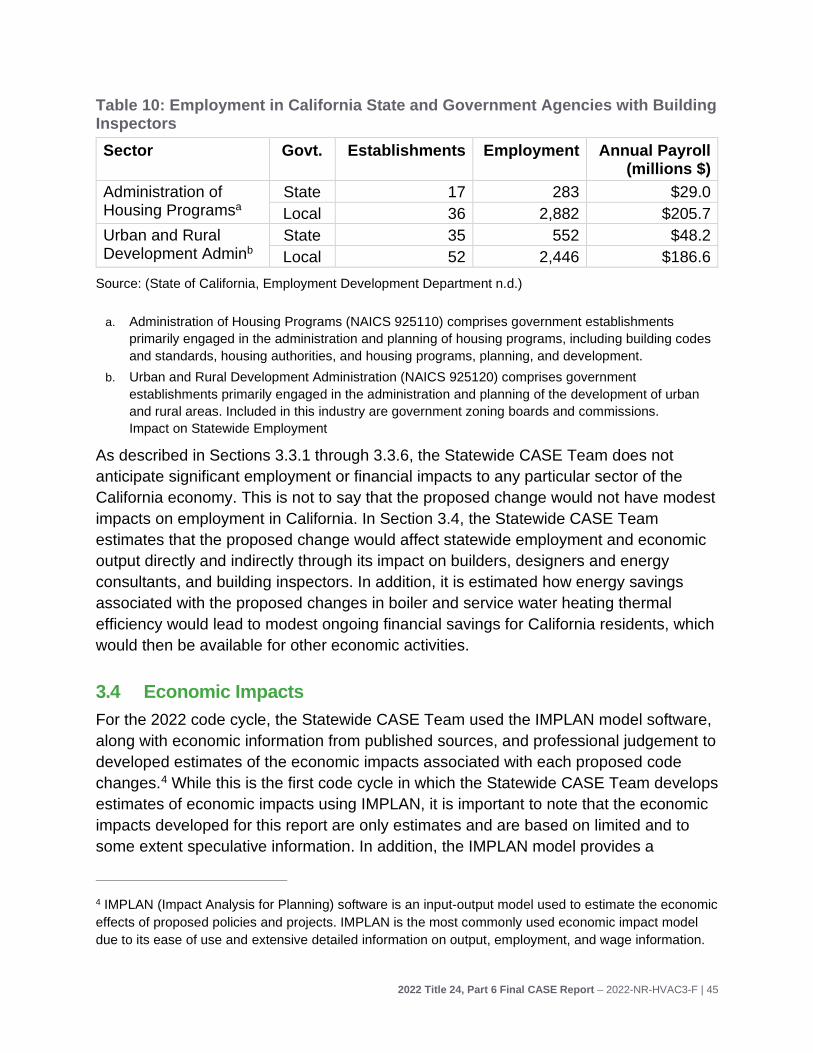
Table 10: Employment in California State and Government Agencies with Building Inspectors ................................................................................................................ 45
Table 11: Estimated Impact that Adoption of the Proposed Measure would have on the California Commercial Construction Sector ............................................................. 46
Table 12: Estimated Impact that Adoption of the Proposed Measure would have on the California Building Designers and Energy Consultants Sectors .............................. 47
Table 13: Estimated Impact that Adoption of the Proposed Measure would have on California Building Inspectors .................................................................................. 47
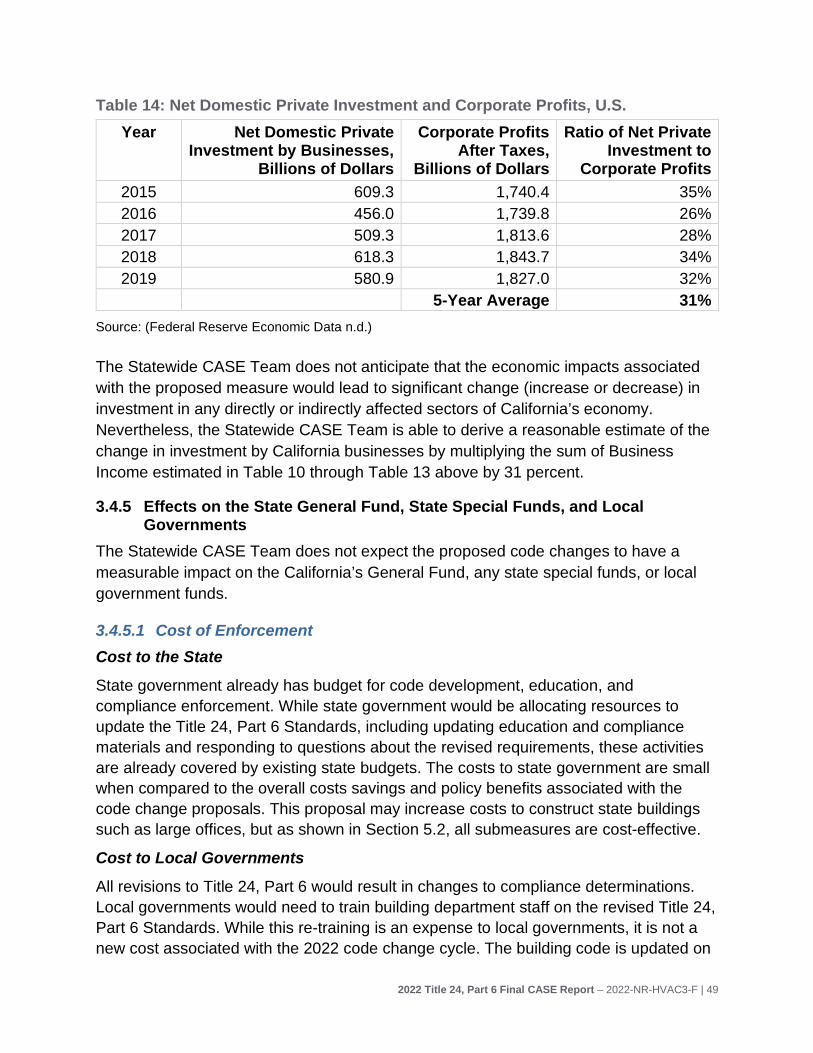
Table 14: Net Domestic Private Investment and Corporate Profits, U.S. ...................... 49
Table 15: Combustion Efficiency Table for Natural Gas ................................................ 53
2022 Title 24, Part 6 Final CASE Report – 2022-NR-HVAC3-F | 4
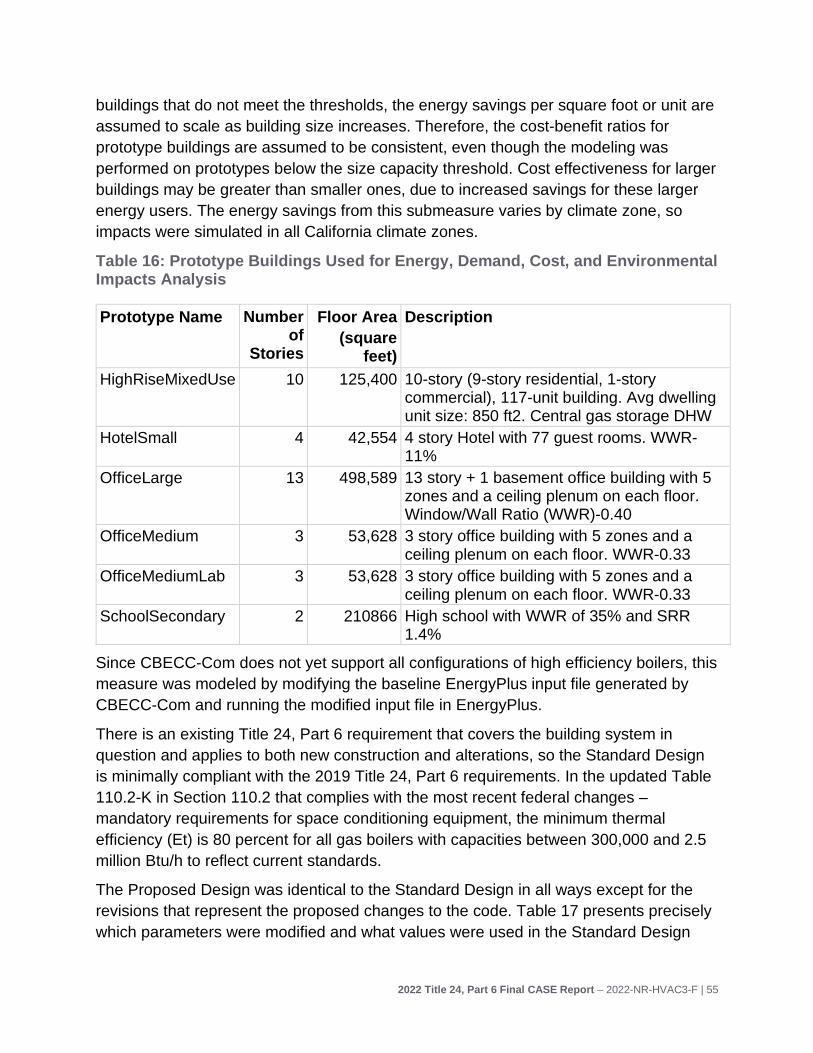
Table 16: Prototype Buildings Used for Energy, Demand, Cost, and Environmental Impacts Analysis ..................................................................................................... 55
Table 17: Modifications Made to Standard Design in Each Prototype to Simulate Proposed Code Change .......................................................................................... 56
Table 18: Prototype Buildings Used for Energy, Demand, Cost, and Environmental Impacts Analysis ..................................................................................................... 57
Table 19: Modifications Made to Standard Design in Each Prototype to Simulate Proposed Code Change .......................................................................................... 58
Table 20: Nonresidential Building Types and Associated Prototype Weighting ............ 61
Table 21: First-Year Energy Impacts Per Dwelling Unit – High Rise Mixed Use for Gas Boiler Systems – New Construction ........................................................................ 63
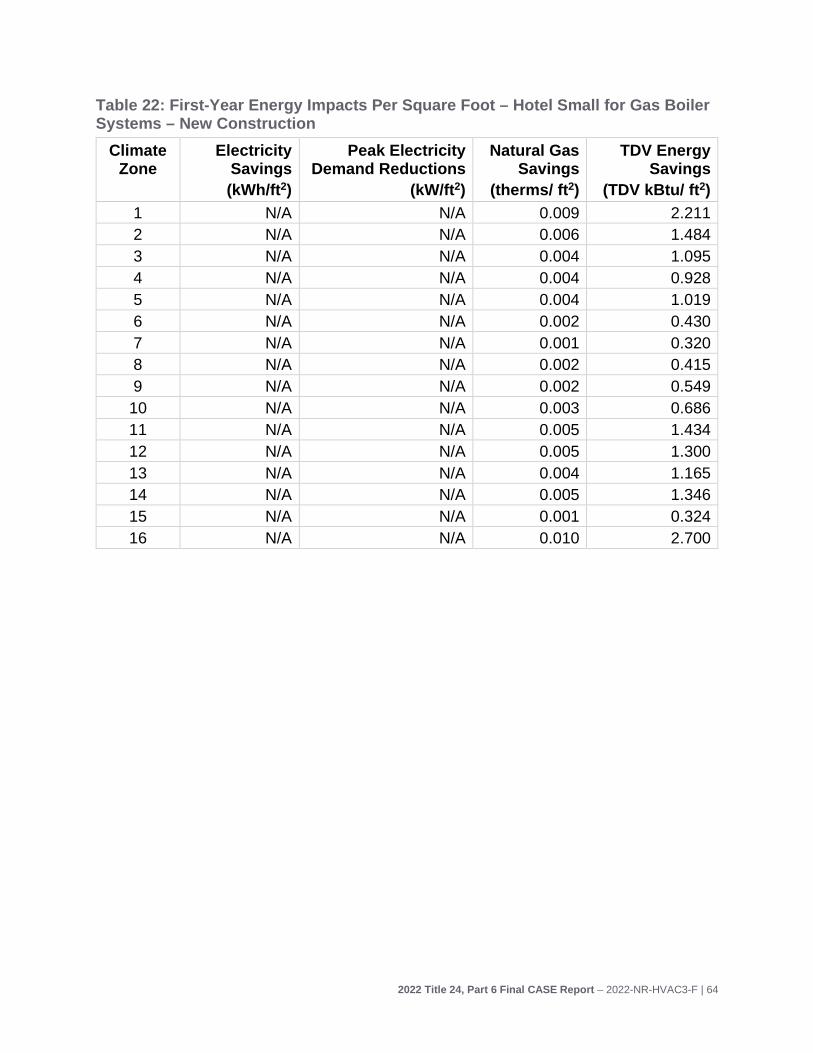
Table 22: First-Year Energy Impacts Per Square Foot – Hotel Small for Gas Boiler Systems – New Construction .................................................................................. 64
Table 23: First-Year Energy Impacts Per Square Foot – Office Large for Gas Boiler Systems – New Construction .................................................................................. 65
Table 24: First-Year Energy Impacts Per Square Foot – Office Medium for Gas Boiler Systems – New Construction .................................................................................. 66
Table 25: First-Year Energy Impacts Per Square Foot – Office Medium Lab for Gas Boiler Systems – New Construction ........................................................................ 67
Table 26: First-Year Energy Impacts Per Square Foot – School Secondary for Gas Boiler Systems – New Construction ........................................................................ 68
Table 27: First-Year Energy Impacts Per Square Foot – Hospital for Gas Boiler Systems – New Construction ................................................................................................. 69
Table 28: First-Year Energy Impacts Per Square Foot – Apartment High Rise for Gas Boiler Systems – New Construction ........................................................................ 70
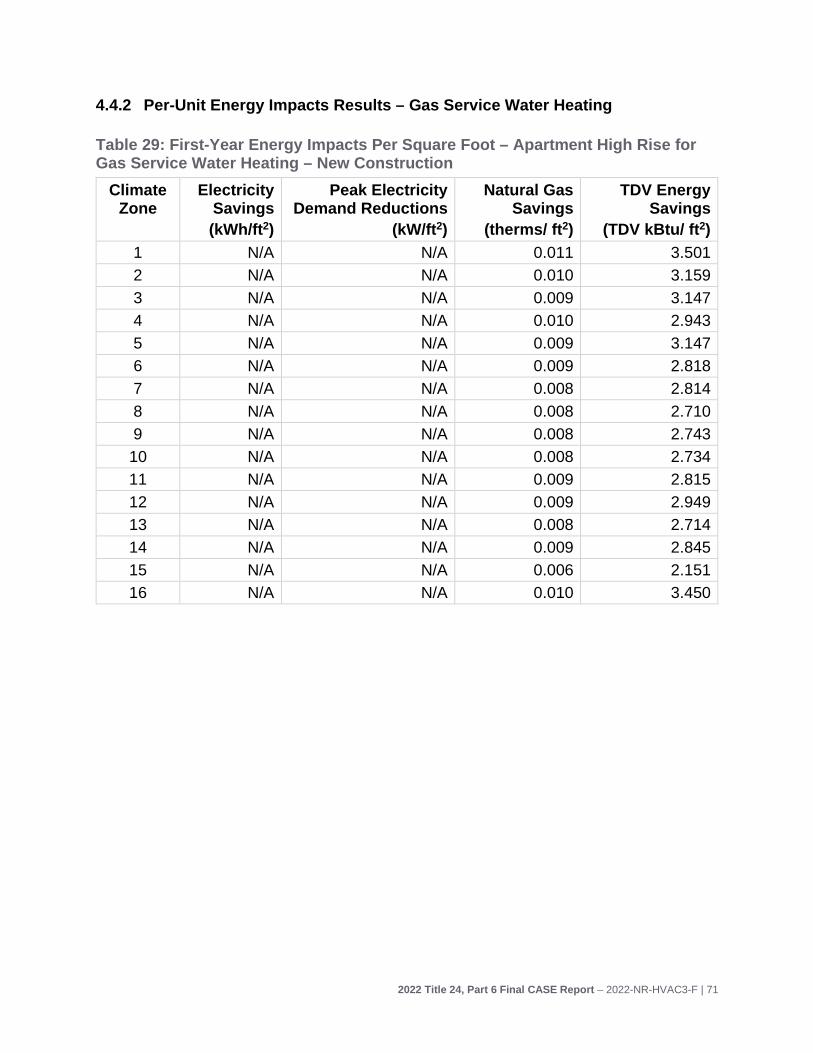
Table 29: First-Year Energy Impacts Per Square Foot – Apartment High Rise for Gas Service Water Heating – New Construction ............................................................ 71
Table 30: First-Year Energy Impacts Per Square Foot – Hotel Small for Gas Service Water Heating – New Construction ......................................................................... 72
Table 31: First-Year Energy Impacts Per Square Foot – Secondary School for Gas Service Water Heating – New Construction ............................................................ 73
Table 32: First-Year Energy Impacts Per Dwelling Unit – High Rise Mixed Use for Gas Service Water Heating – New Construction ............................................................ 74
2022 Title 24, Part 6 Final CASE Report – 2022-NR-HVAC3-F | 5
Table 33: First-Year Energy Impacts Per Square Foot – Hospital for Gas Service Water Heating – New Construction .................................................................................... 75
Table 34: First-Year Energy Impacts – 5 Million Btu/h Process Boiler for Oxygen Concentration- New Construction and Alterations ................................................... 76
Table 35: 2023 PV TDV Energy Cost Savings Over 15-Year Period of Analysis – Per Dwelling Unit– New Construction (HighRiseMixedUse) for Gas Boiler Systems ..... 78
Table 36: 2023 PV TDV Energy Cost Savings Over 15-Year Period of Analysis – Per Square Foot – New Construction (HotelSmall) for Gas Boiler Systems .................. 79
Table 37: 2023 PV TDV Energy Cost Savings Over 15-Year Period of Analysis – Per Square Foot – New Construction (OfficeLarge) for Gas Boiler Systems ................. 80
Table 38: 2023 PV TDV Energy Cost Savings Over 15-Year Period of Analysis – Per Square Foot – New Construction (OfficeMedium) for Gas Boiler Systems ............. 81
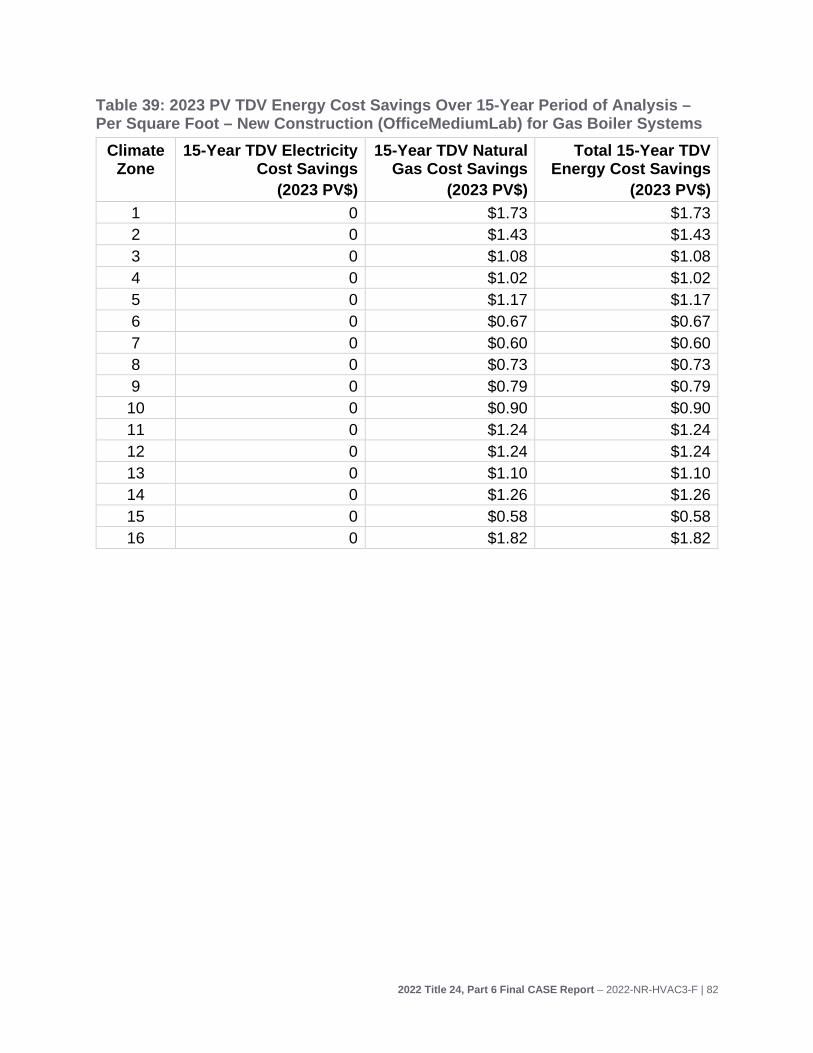
Table 39: 2023 PV TDV Energy Cost Savings Over 15-Year Period of Analysis – Per Square Foot – New Construction (OfficeMediumLab) for Gas Boiler Systems ....... 82
Table 40: 2023 PV TDV Energy Cost Savings Over 15-Year Period of Analysis – Per Square Foot – New Construction (SchoolSecondary) for Gas Boiler Systems ....... 83
Table 41: 2023 PV TDV Energy Cost Savings Over 15-Year Period of Analysis – Per Square Foot – New Construction (Hospital) for Gas Boiler Systems ....................... 84
Table 42: 2023 PV TDV Energy Cost Savings Over 15-Year Period of Analysis – Per Square Foot – New Construction (Apartment High Rise) for Gas Boiler Systems .. 85
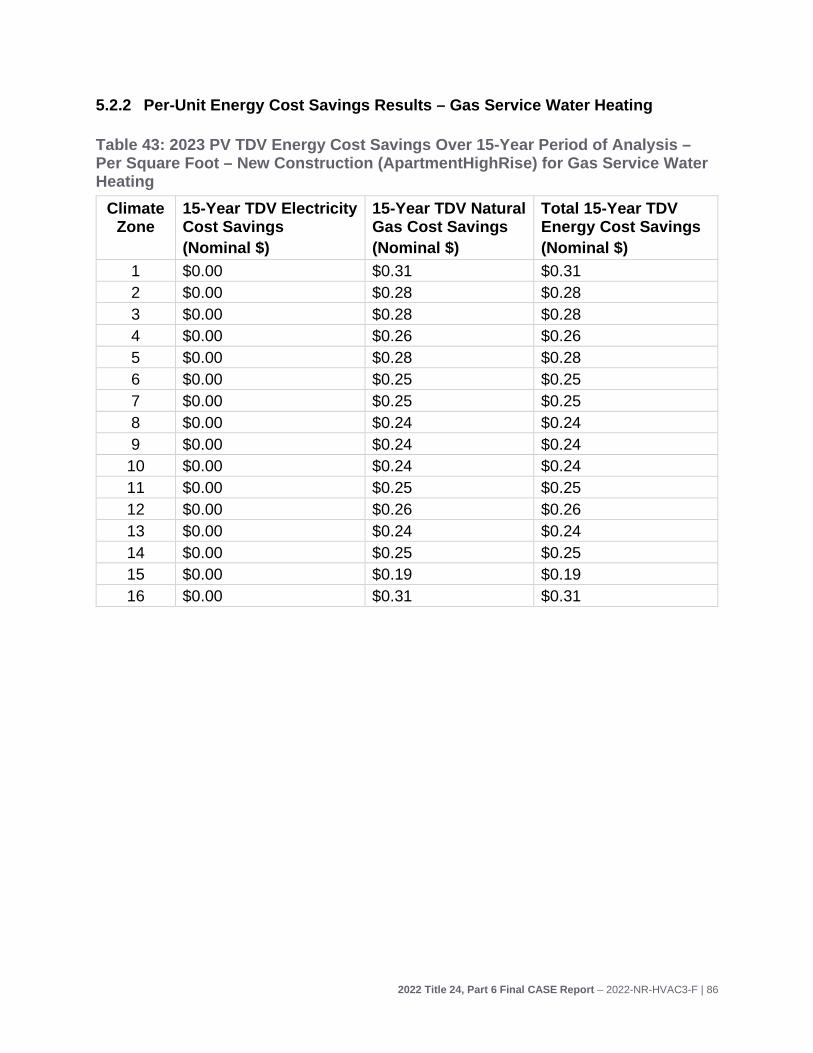
Table 43: 2023 PV TDV Energy Cost Savings Over 15-Year Period of Analysis – Per Square Foot – New Construction (ApartmentHighRise) for Gas Service Water Heating .................................................................................................................... 86
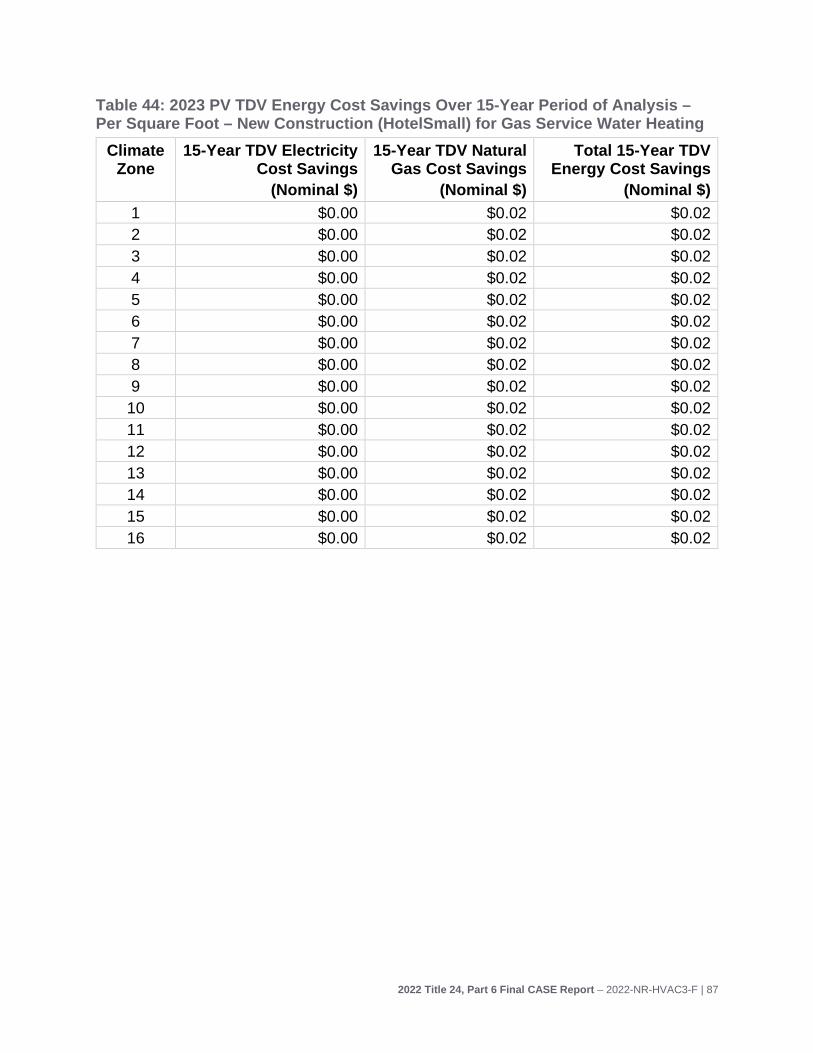
Table 44: 2023 PV TDV Energy Cost Savings Over 15-Year Period of Analysis – Per Square Foot – New Construction (HotelSmall) for Gas Service Water Heating ...... 87
Table 45: 2023 PV TDV Energy Cost Savings Over 15-Year Period of Analysis – Per Square Foot – New Construction (SecondarySchool) for Gas Service Water Heating ................................................................................................................................ 88
Table 46: 2023 PV TDV Energy Cost Savings Over 15-Year Period of Analysis – Per Dwelling Unit– New Construction (High Rise Mixed Use) for Gas Service Water Heating .................................................................................................................... 89
Table 47: 2023 PV TDV Energy Cost Savings Over 15-Year Period of Analysis – Per Square Foot – New Construction (Hospital) for Gas Service Water Heating ........... 90
2022 Title 24, Part 6 Final CASE Report – 2022-NR-HVAC3-F | 6
Table 48: 2023 PV TDV Energy Cost Savings Over 15-Year Period of Analysis – Per Square Foot – New Construction and Alterations for Oxygen Concentration on Process Boilers ....................................................................................................... 90
Table 49: Incremental Measure Equipment Cost for Nonresidential Space Heating Boilers ..................................................................................................................... 92
Table 50: Incremental Measure Equipment Cost for Nonresidential Service Water Heaters .................................................................................................................... 93
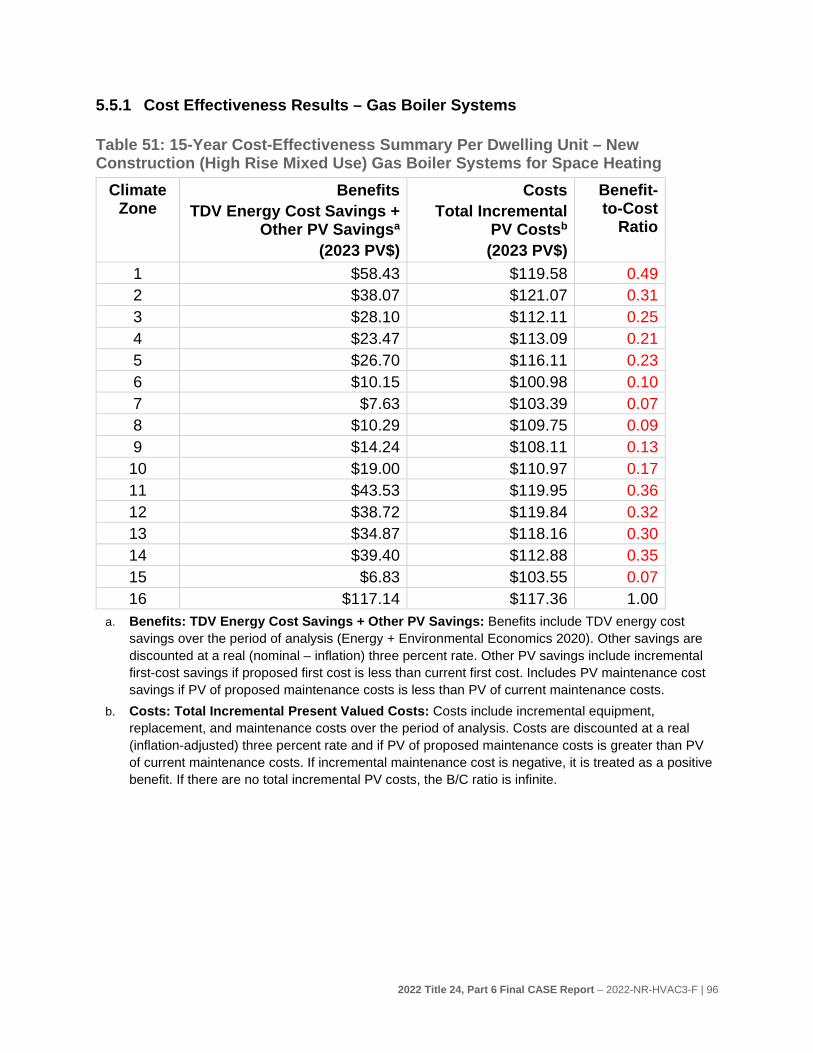
Table 51: 15-Year Cost-Effectiveness Summary Per Dwelling Unit – New Construction (High Rise Mixed Use) Gas Boiler Systems for Space Heating .............................. 96
Table 52: 15-Year Cost-Effectiveness Summary Per Square Foot – New Construction (HotelSmall) Gas Boiler Systems for Space Heating ............................................... 97
Table 53: 15-Year Cost-Effectiveness Summary Per Square Foot – New Construction (OfficeLarge) Gas Boiler Systems for Space Heating ............................................. 98
Table 54: 15-Year Cost-Effectiveness Summary Per Square Foot – New Construction (OfficeMedium) Gas Boiler Systems for Space Heating .......................................... 99
Table 55: 15-Year Cost-Effectiveness Summary Per Square Foot – New Construction (OfficeMediumLab) Gas Boiler Systems for Space Heating .................................. 100
Table 56: 15-Year Cost-Effectiveness Summary Per Square Foot – New Construction (SchoolSecondary) Gas Boiler Systems for Space Heating .................................. 101
Table 57: 15-Year Cost-Effectiveness Summary Per Square Foot – New Construction (Hospital) Gas Boiler Systems for Space Heating ................................................. 102
Table 58: 15-Year Cost-Effectiveness Summary Per Square Foot – New Construction (Apartment High Rise) Gas Boiler Systems for Space Heating ............................. 103
Table 59: 15-Year Cost-Effectiveness Summary Per Dwelling Unit – New Construction (Apartment High Rise) for Service Water Heating Systems .................................. 104
Table 60: 15-Year Cost-Effectiveness Summary Square Foot – New Construction (HotelSmall) for Service Water Heating Systems .................................................. 105
Table 61: 15-Year Cost-Effectiveness Summary Per Square Foot – New Construction (SchoolSecondary) for Service Water Heating Systems ....................................... 106
Table 62: 15-Year Cost-Effectiveness Summary Per Dwelling Unit – New Construction (High Rise Mixed Use) for Service Water Heating Systems .................................. 107
Table 63: 15-Year Cost-Effectiveness Summary Per Square Foot – New Construction (Hospital) for Service Water Heating Systems ...................................................... 108
2022 Title 24, Part 6 Final CASE Report – 2022-NR-HVAC3-F | 7
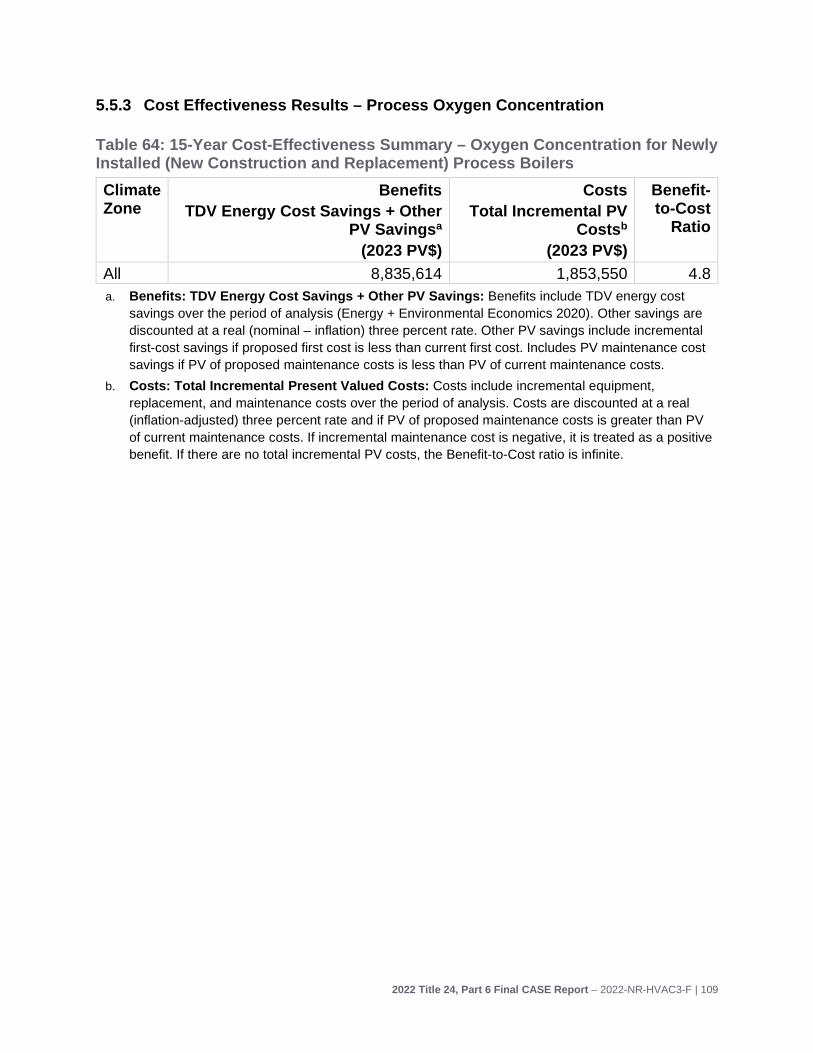
Table 64: 15-Year Cost-Effectiveness Summary – Oxygen Concentration for Newly Installed (New Construction and Replacement) Process Boilers .......................... 109
Table 65: Statewide Energy and Energy Cost Impacts – New Construction for Gas Boiler Systems for Space Heating ......................................................................... 111
Table 66: Statewide Energy and Energy Cost Impacts – New Construction for Gas Service Hot Water Heating System Efficiency ....................................................... 112
Table 67: Statewide Energy and Energy Cost Impacts – Newly Installed Process Boilers Oxygen Concentration ........................................................................................... 113
Table 68: Statewide GHG Emissions Impacts – New Construction, Alterations and Additions ............................................................................................................... 114
Table 69: First-Year Statewide Impacts on Material Use – Gas Boiler Systems ......... 116
Table 70: First-Year Statewide Impacts on Material Use – Gas Service Water Heating .............................................................................................................................. 116
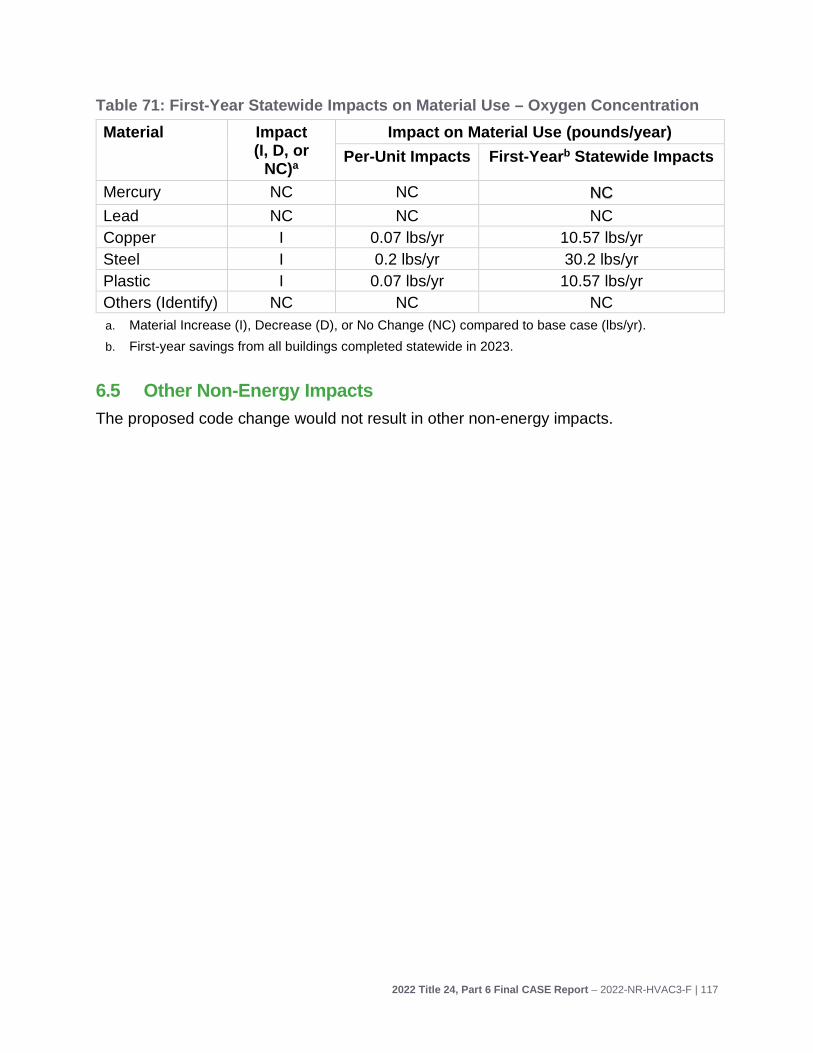
Table 71: First-Year Statewide Impacts on Material Use – Oxygen Concentration ..... 117
Table 72: Estimated New Nonresidential Construction Impacted by Proposed Code Change in 2023 (New Construction), by Climate Zone and Building Type (Million Square Feet), Gas Boilers ..................................................................................... 137
Table 73: Estimated New Nonresidential Construction Impacted by Proposed Code Change in 2023 (New Construction), by Climate Zone and Building Type (Million Square Feet), Gas Service Water Heating ............................................................ 138
Table 74: Example of Redistribution of Miscellaneous Category - 2023 New Construction in Climate Zone 1 ............................................................................. 139
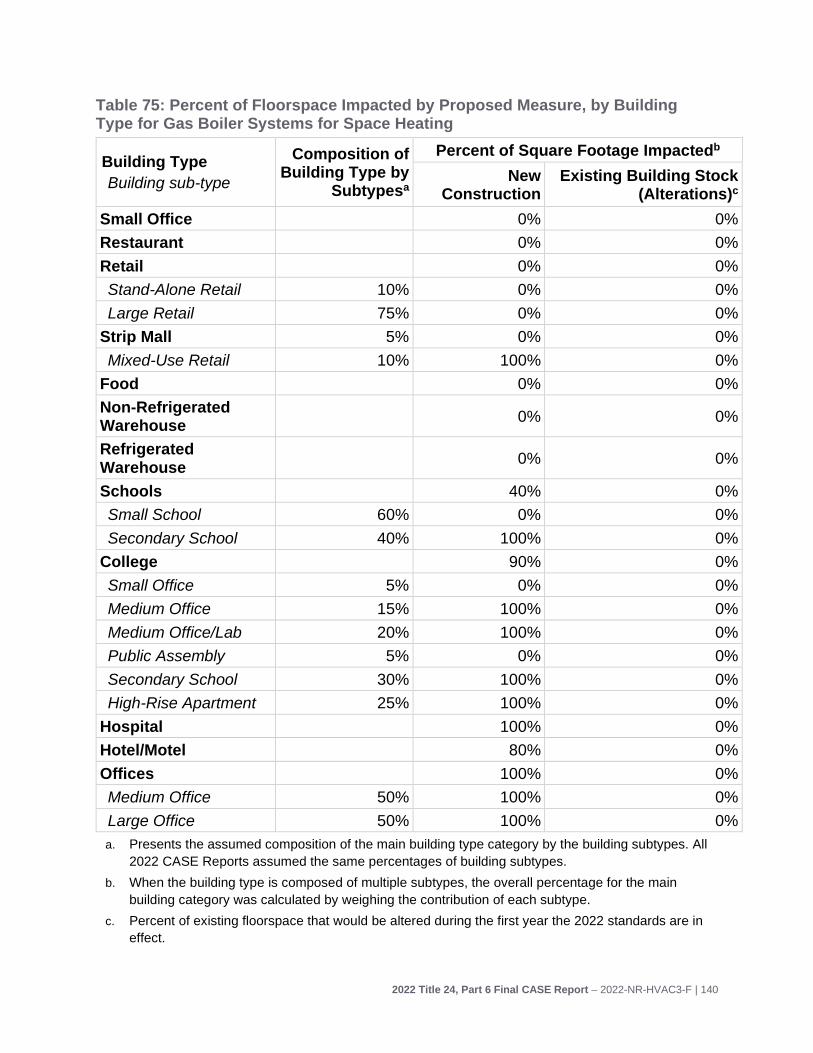
Table 75: Percent of Floorspace Impacted by Proposed Measure, by Building Type for Gas Boiler Systems for Space Heating ................................................................. 140
Table 76: Percent of Floorspace Impacted by Proposed Measure, by Building Type for Service Water Heating Systems ............................................................................ 141
Table 77: Percent of Floorspace Impacted by Proposed Measure, by Climate Zone for Gas Boiler Systems ............................................................................................... 142
Table 78: Percent of Floorspace Impacted by Proposed Measure, by Climate Zone for Gas Service Water Heating ................................................................................... 143
Table 79: First-Year Energy Impacts – 7.5 Million Btu/h Process Boiler for Oxygen Concentration- New Construction and Alterations ................................................. 144
Table 80: EnergyPlus Input Variables Relevant to Hot Water Boiler ........................... 149
Table 81: EnergyPlus Input Variables Relevant to Hot Water Heater ......................... 152
2022 Title 24, Part 6 Final CASE Report – 2022-NR-HVAC3-F | 8
Table 82: Roles of Market Actors in the Proposed Compliance Process .................... 156
Table 83: Summary of Outreach Contacts and Organizations .................................... 159
Table 84: Nominal TDV Energy Cost Savings Over 15-Year Period of Analysis –Square Foot – New Construction- Apartment High Rise .................................................... 160
Table 85: Nominal TDV Energy Cost Savings Over 15-Year Period of Analysis –Square Foot – New Construction- Hotel Small .................................................................. 161
Table 86: Nominal TDV Energy Cost Savings Over 15-Year Period of Analysis –Square Foot – New Construction- Office Large ................................................................. 162
Table 87: Nominal TDV Energy Cost Savings Over 15-Year Period of Analysis –Square Foot – New Construction- Office Medium .............................................................. 163
Table 88: Nominal TDV Energy Cost Savings Over 15-Year Period of Analysis –Square Foot – New Construction- Office Medium Lab ....................................................... 164
Table 89: Nominal TDV Energy Cost Savings Over 15-Year Period of Analysis –Square Foot – New Construction- Secondary School ........................................................ 165
Table 90: Nominal TDV Energy Cost Savings Over 15-Year Period of Analysis –Square Foot – New Construction- Hospital ........................................................................ 166
Table 91: Nominal TDV Energy Cost Savings Over 15-Year Period of Analysis –Square Foot – New Construction- High Rise Mixed Use ................................................... 167
Table 92: Nominal TDV Energy Cost Savings Over 15-Year Period of Analysis –Square Foot – New Construction- Apartment High Rise .................................................... 168
Table 93: Nominal TDV Energy Cost Savings Over 15-Year Period of Analysis –Square Foot – New Construction- High Rise Mixed Use ................................................... 169
Table 94: Nominal TDV Energy Cost Savings Over 15-Year Period of Analysis –Square Foot – New Construction- Hotel Small .................................................................. 170
Table 95: Nominal TDV Energy Cost Savings Over 15-Year Period of Analysis –Square Foot – New Construction- Secondary School ........................................................ 171
Table 96: Nominal TDV Energy Cost Savings Over 15-Year Period of Analysis –Square Foot – New Construction- Hospital ........................................................................ 172
Table 97: Nominal TDV savings process boilers ......................................................... 173
List of Figures Figure 1: Diagram of conventional boiler. ...................................................................... 26
Figure 2: Diagram of condensing boiler. ........................................................................ 26
Figure 3: Nonresidential boiler and service water heater distribution channels. ............ 38
2022 Title 24, Part 6 Final CASE Report – 2022-NR-HVAC3-F | 9
Figure 5: EnergyPlus input for a Water Heater ............................................................ 152
2022 Title 24, Part 6 Final CASE Report – 2022-NR-HVAC3-F | 10
Executive Summary This document presents recommended code changes that the California Energy Commission will be considering for adoption in Spring 2021. If you have comments or suggestions prior to the adoption, please email [email protected]. Comments will not be released for public review or will be anonymized if shared.
Introduction The Codes and Standards Enhancement (CASE) Initiative presents recommendations to support the California Energy Commission’s (Energy Commission) efforts to update the California Energy Code (Title 24, Part 6) to include new requirements or to upgrade existing requirements for various technologies. Three California Investor Owned Utilities (IOUs) – Pacific Gas and Electric Company, San Diego Gas and Electric, and Southern California Edison – and two Publicly Owned Utilities –Los Angeles Department of Water and Power, and Sacramento Municipal Utility District (herein referred to as the Statewide CASE Team when including the CASE Author) – sponsored this effort. The program goal is to prepare and submit proposals that will result in cost-effective enhancements to improve energy efficiency and energy performance in California buildings. This report and the code change proposals presented herein are a part of the effort to develop technical and cost-effectiveness information for proposed requirements on building energy-efficient design practices and technologies.
The Statewide CASE Team submits code change proposals to the Energy Commission, the state agency that has authority to adopt revisions to Title 24, Part 6. The Energy Commission will evaluate proposals submitted by the Statewide CASE Team and other stakeholders. The Energy Commission may revise or reject proposals. See the Energy Commission’s 2022 Title 24 website for information about the rulemaking schedule and how to participate in the process: https://www.energy.ca.gov/programs-and-topics/programs/building-energy-efficiency-standards/2022-building-energy-efficiency.
The overall goal of this CASE Report is to present a code change proposal for nonresidential boilers and service water heating. The report contains pertinent information supporting the code change.
Measure Description
Background Information
Boiler and Service Water Heater System Efficiency Boilers and water heaters capable of achieving efficiencies above 90 percent utilize larger heat exchangers and recuperate additional thermal energy through the flue gas.
2022 Title 24, Part 6 Final CASE Report – 2022-NR-HVAC3-F | 11
These high efficiency boilers and water heaters are referred to as condensing products because they are designed to condense moisture out of flue gas, recovering latent heat from water vapor present; the removal of this latent heat results in lower flue gas temperatures than traditional boiler and water heater technologies. These lower flue gas temperatures may impact the ability of combustion gases to escape through traditional atmospheric venting. Additionally, the recovered liquid condensate is acidic and requires proper disposal through non-corrosive piping. Condensing products, including boilers and water heaters, utilize more expensive stainless steel for use in heat exchangers to prevent corrosion from this acidic condensate.
Condensing operation requires a sufficient difference between the inlet and outlet water temperatures. If water returns to the boiler at temperatures well above 120°F, condensing will not occur, and the thermal efficiency of the boiler system will not reach 90 percent. Similarly, designing hot water space heating systems and their controls so that recirculation flow rates are less than 20 percent of the design flow enables lower return water temperatures and increases the likelihood that the boiler system will operate in the condensing range. Service water heating systems draw inlet water from local water infrastructure; those inlet temperatures are thus likely to reflect local ground temperatures and fall well below 100°F. Similar requirements are found in Addendum BC of the American Society of Heating, Refrigerating and Air-Conditioning Engineers (ASHRAE) 90.1-2019 Energy Standard for Buildings Except Low Rise Residential Buildings (ASHRAE 2019).
ASHRAE Standard 90.1-2019 Section 7.5.3 includes requirements that service water heating systems above 1 million British thermal units per hour (million Btu/h) achieve 90 percent weighted thermal efficiency (ASHRAE 2019). ASHRAE Standard 90.1-2019 Addendum BC includes similar requirements for boiler systems between 1 and 10 million Btu/h in achieving 90 percent weighted thermal system efficiency, along with the return water temperature and flow rate requirements reflected in this proposal.
Oxygen Concentration Requirements Controlling oxygen concentration in the combustion process allows for efficient system operation. If there is not enough oxygen in flue gas, this indicates that combustion is incomplete and unburnt natural gas is leaving the exhaust stack without releasing all its heat. If there is too much oxygen in the flue gas, this indicates that there is excess air in the flue gas; this results in lower temperatures and a higher volume of flue gas with shorter residence time for heat to be extracted from the flue gas. Oxygen concentration controls requires dynamic response as the density of inlet air to the combustion process decreases with increases in temperature or humidity. Designers typically recommend oxygen trim control to achieve optimal oxygen concentration as this type of control analyzes the stack-gas and provides feedback to the combustion air control so that the ratio of fuel to air is adjusted for maximum performance.
2022 Title 24, Part 6 Final CASE Report – 2022-NR-HVAC3-F | 12
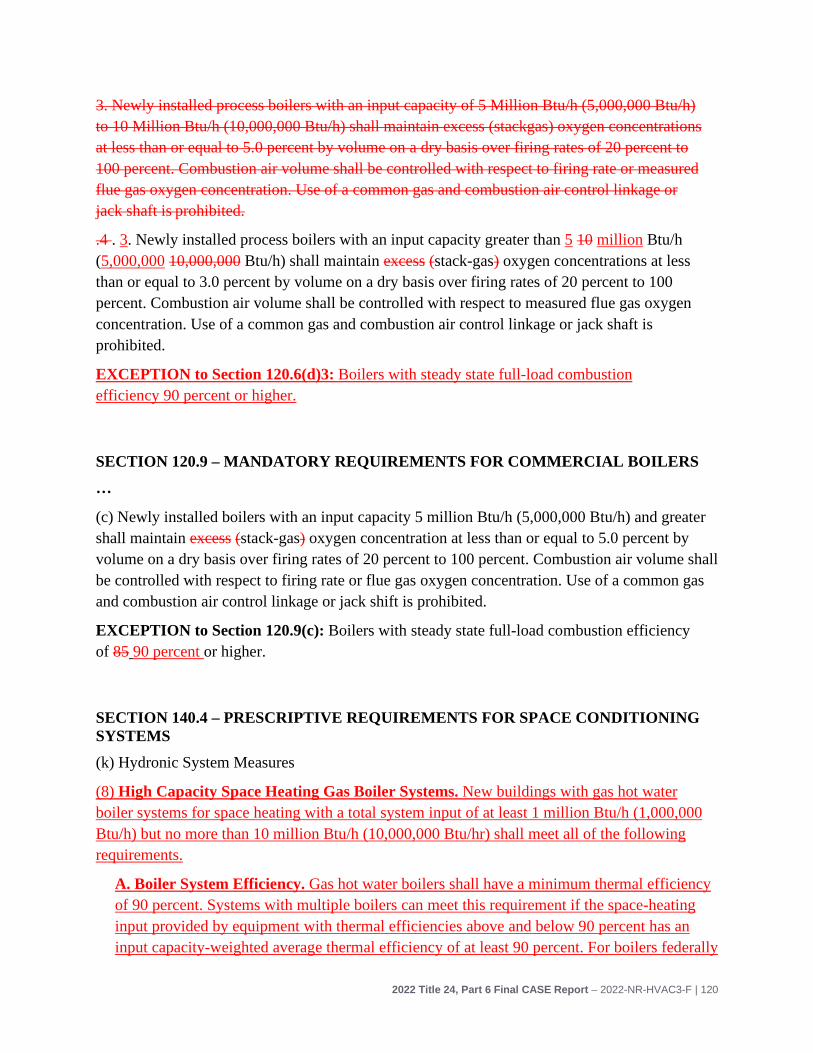
Oxygen concentration requirements for commercial and process boilers were added to Title 24, Part 6 in the 2013 codes cycle and have demonstrated significant savings. This proposal expands the scope of the 3 percent oxygen concentration requirement from all process boilers greater than 10 million Btu/h down to all process boilers greater than 5 million Btu/h. Additionally, this proposal exempts process and commercial boilers operating at or above 90 efficiency levels from oxygen concentration requirements.
Proposed Code Change This proposal is making three recommendations:
1. Gas Boiler Systems for Space Heating: The proposed prescriptive requirements for gas boiler systems would raise the minimum thermal efficiency of gas-fired hot water boiler systems for space heating to a weighted-thermal efficiency of 90 percent [Section 140.4(k)]. This change impacts gas hot water boiler systems of capacities between 1 and 10 million Btu/h installed in any type of newly constructed nonresidential building and high-rise multifamily buildings. Weighted thermal efficiencies are calculated based off the input each boiler provides to the total system capacity. This measure would also add two requirements for the hot water distribution system that aim to optimize condensing operation:
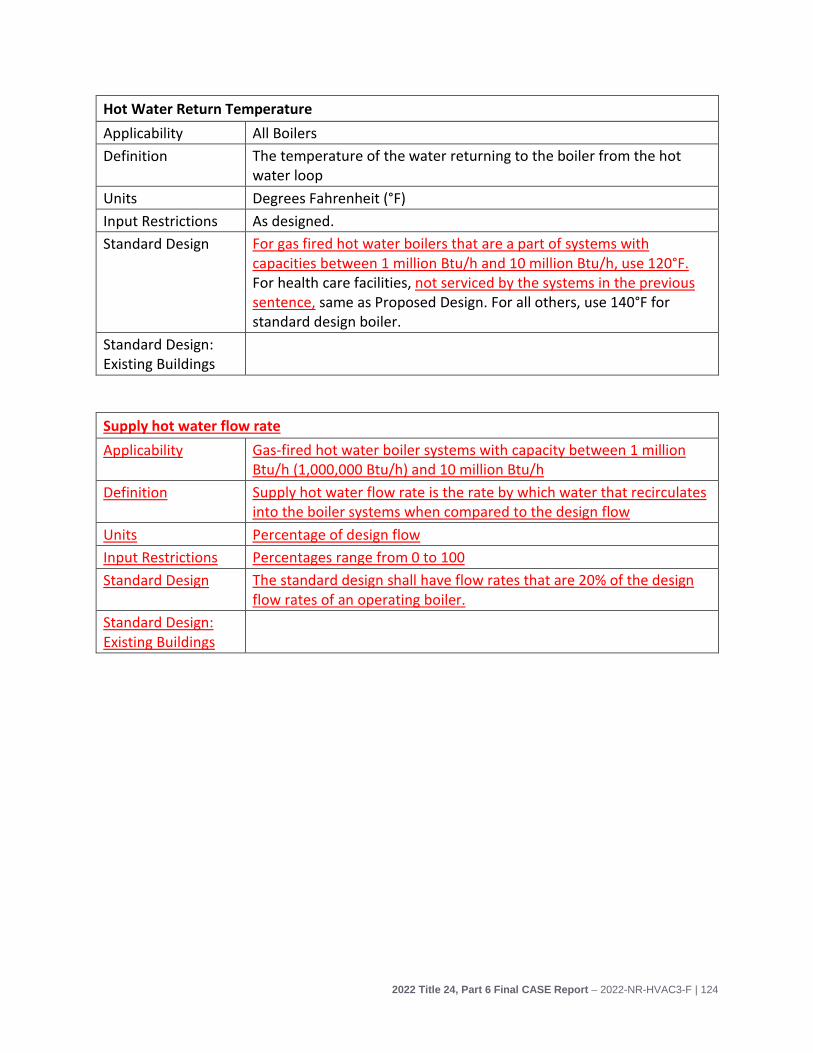
a. Space heating coils and heat exchangers are sized so that under design conditions the return temperature of hot water to hot water boilers is 120°F or less.
b. Hot water space heating systems is designed so that under all conditions the return water entering the boiler(s) must be 120°F or less, or flow rates for supply hot water that recirculates directly into the return system must be no greater than 20 percent of the design flow of the operating boiler.
2. Gas Service Water Heating Systems: The proposed prescriptive requirements for gas service water heating systems would raise the minimum thermal efficiency of gas-fired service water heating systems to a weighted-thermal efficiency of 90 percent. [Section 140.5(c) – new subsection]. This change impacts gas service water heating systems of capacities between 1 and 10 million Btu/h installed in any type of newly constructed nonresidential building and high-rise multifamily buildings. Water heating systems that serve individual dwelling units would not need to comply. Individual gas water heaters with input capacity less than 100,000 Btu/h are also excepted.
3. Oxygen Concentration: The proposed mandatory changes would adjust the stack-gas oxygen concentration requirements for newly installed process boilers with input capacity between 5 and 10 million Btu/h from 5 percent to 3 percent. [Section 120.6(d)]. This change would simplify the code by aligning with current
2022 Title 24, Part 6 Final CASE Report – 2022-NR-HVAC3-F | 13
requirements for process boilers greater than 10 million Btu/h. For process boilers, the Statewide CASE Team is also recommending a clarification that the combustion air volume be controlled only by flue gas concentration, eliminating the option of an open loop control based on firing rate. Finally, the CASE Team is recommending, for both process and commercial boilers greater than 5 Million Btu/h, to revise the high efficiency exception from combustion efficiency requirements from 85 percent to 90 percent or higher.
The first two proposals add boiler system efficiency and service hot water heating system efficiency requirements to the prescriptive compliance pathway and apply only to newly constructed nonresidential and high-rise multifamily buildings with large service water heating or hot water space heating systems, such as large offices, hospitals, hotel/motel, and high-rise multifamily buildings. These two changes would align Title 24, Part 6 requirements for the minimal thermal efficiencies of boiler and gas service hot water heating systems with the current requirements in ASHRAE 90.1-2019.
The next proposal is a modification to the mandatory oxygen concentration requirements that apply to newly installed commercial boilers and newly installed process boilers. Process boilers with an input capacity of 5 million Btu/h or greater would be required to maintain stack-gas oxygen concentrations at less than or equal to 3 percent by volume; this required level is assessed on a dry basis over firing rates of 20 to 100 percent. This proposal would impact all process boilers that meet the capacity threshold. The second submeasure is to change the exception for commercial oxygen concentration requirements for boilers from a thermal efficiency of 85 to a thermal efficiency of 90 percent or higher, aligning with the proposed exception for process boilers.
Scope of Code Change Proposal Table 1 summarizes the scope of the proposed changes and which sections of Standards, Reference Appendices, Alternative Calculation Method (ACM) Reference Manual, and compliance documents that would be modified as a result of the proposed change(s).
2022 Title 24, Part 6 Final CASE Report – 2022-NR-HVAC3-F | 14
Table 1: Scope of Code Change Proposal Measure Name
Type of Requirement
Modified Section(s) of Title 24,
Part 6
Modified Title 24, Part 6
Appendices
Would Compliance Software Be
Modified
Modified Compliance Document(s)
Gas Boiler Systems
Prescriptive 140.4(k); 110.2
No change Yes, Section 5.8.1 of the
ACM
NRCC-MCH-E
Gas Service Water Heating Systems
Prescriptive 140.5 No change Yes, Section 5.9.1.2 of the
ACM
NRCC-MCH-
E; NRCC-PLB-E
Oxygen Concentration – Process Boilers
Mandatory 120.6(d) No change No NRCC-PRC-E
Oxygen Concentration – Commercial Boilers
Mandatory 120.9(c) No change No None
Market Analysis and Regulatory Assessment The typical distribution channels for commercial boilers and large volume service water heaters includes five primary players: manufacturer, manufacturer representative or wholesaler, contractor, design engineer and owner. Oxygen trim controls are either sold with a new boiler or as a retrofit by a boiler controls manufacturer or manufacturer representative.
In new construction, it is most common for the building owner to work with a design engineer or contractor to plan and specify the boiler or water heating system. The design engineer or contractor would then contact a manufacturer or wholesaler to purchase equipment that meets the specifications. Manufacturer representatives handle the majority of large boiler and water heater sales.
The Statewide CASE Team does not expect any technical feasibility concerns because condensing boilers are a mature technology. The proposed minimum system thermal efficiency of 90 percent for gas-fired boiler systems was added to ASHRAE 90.1 in 2019 as a part of Addendum BC; the gas service water heating requirements were added to ASHRAE 90.1 for the 2016 edition. Furthermore, condensing products represent a one-for-one replacement of similar non-condensing products. The proposed code change would have minimal impacts on the current market as condensing technology is a mature, widely available technology and represents most sales in many applications.
2022 Title 24, Part 6 Final CASE Report – 2022-NR-HVAC3-F | 15
Currently, Title 24, Part 6 Section 110.2 requires a minimum thermal efficiency of 80 percent for gas fired boilers with capacities between 300,000 Btu/h and 2.5 million Btu/h and a minimum thermal efficiency of 82 percent for relevant equipment with capacities above 2.5 million Btu/h. These requirements are for individual boilers and not at the system level and align with federal minimum standards for this product category. There are no current hot water system distribution design requirements.
Similarly, current federal minimum thermal efficiency levels for gas fired water heaters is 80 percent, which aligns with California Appliance Efficiency Regulations (Title 20, appliance standards) under Section 1605.1 for commercial storage gas water heaters.
There are no current federal requirements for oxygen trim control, although California Title 24, Part 6 Section 120.6(d) requires excess stack-gas oxygen not to exceed 3 percent for boilers 10 million Btu/h or larger; this proposal seeks to lower that threshold to systems 5 million Btu/h or larger for process boilers.
Both boilers and water heaters are federally covered products, and thus states are pre-empted from setting standards above the federal minimum standards under 42 U.S.C. 6313. However, under 42 U.S.C. 6316(b)(2)(B) states can adopt higher efficiency levels for federally regulated products in new construction if the standard aligns with an amended ASHRAE/IES Standard. Addendum BC to ASHRAE 90.1-2016, which is now incorporated in Section 6.5.4.8 of ASHRAE 90.1-2019, establishes the minimum weighted thermal efficiencies of high capacity gas-fired boiler hot water systems to be 90 percent. Section 7.5.3 of ASHRAE 90.1-2016, contains a weighted thermal efficiency requirement for gas service water heating. Therefore, California can adopt these requirements in the 2022 Title 24, Part 6 code in new buildings without violating federal preemption.
Cost Effectiveness The proposed code change was found to be cost effective for all climate zones where it is proposed to be required. The benefit-to-cost (B/C) ratio compares the benefits or cost savings to the costs over the 15-year period of analysis for nonresidential prototypes and 30-year period of analysis for residential prototypes. Proposed code changes that have a B/C ratio of 1.0 or greater are cost-effective. The larger the B/C ratio, the faster the measure pays for itself from energy cost savings. The B/C ratios for all four submeasures are presented in Table 2. See Section 5 for the methodology, assumptions, and results of the cost-effectiveness analysis. As noted at the beginning of Section 4, the Statewide CASE Team used preliminary TDV factors to determine cost-effectiveness and would consider re-evaluating the cost saving results when the final TDV values are determined.
2022 Title 24, Part 6 Final CASE Report – 2022-NR-HVAC3-F | 16
Table 2: Summary of Benefit-to-Cost Ratios Submeasure Benefit-to-Cost Ratio Range (varies
by climate zone and building type) Gas Boiler Systems 0.07 to 6.59 Gas Service Water Heating Systems 2.16 to 13.33 Oxygen Trim Control – Process Boilers 4.8
Statewide Energy Impacts: Energy, Water, and Greenhouse Gas (GHG) Emissions Impacts Table 3 presents the estimated energy and demand impacts of the proposed code change that would be realized statewide during the first 12 months that the 2022 Title 24, Part 6 requirements are in effect. First-year statewide energy impacts are represented by the following metrics: electricity savings in gigawatt-hours per year (GWh/yr), peak electrical demand reduction in megawatts (MW), natural gas savings in million therms per year (million therms/yr), and TDV energy savings in kilo British thermal units per year (TDV kBtu/yr). See Section 6 for more details on the first-year statewide impacts calculated by the Statewide CASE Team. Section 4 contains details on the per-unit energy savings calculated by the Statewide CASE Team.
Table 3: First-Year Statewide Energy and Impacts Measure Electricity
Savings (GWh/yr)
Peak Electrical Demand
Reduction (MW)
Natural Gas Savings
(MMtherms/yr)
TDV Energy Savings
(million TDV kBtu/yr)
Gas Boiler Systems (Total)
N/A N/A 0.37
97.7
New Construction N/A N/A 0.37 97.7 Additions and Alterations N/A N/A N/A N/A Service Water Heating Systems (Total)
N/A N/A 0.02 5.8
New Construction N/A N/A 0.02 5.8 Additions and Alterations N/A N/A N/A N/A Oxygen Concentration - Process Boilers (total)
N/A N/A 0.62 149
New Construction N/A N/A 0.03 7.5 Additions and Alterations N/A N/A 0.59 141.5
The Statewide CASE Team believes that these savings estimates are very conservative in nature. Savings were only calculated for a limited range of CBECC-Com, CBECC-
2022 Title 24, Part 6 Final CASE Report – 2022-NR-HVAC3-F | 17
Res, California Public Utility Commission building prototypes that had boiler and service water heating capacities at or near the existing threshold requirements. These building prototypes present an estimate of equipment capacities, and the larger HVAC capacities that would be impacted by this code proposal are not necessarily represented. These larger systems would yield more savings than equipment that is at the proposal thresholds.
Table 4 presents the estimated avoided GHG emissions associated with the proposed code change for the first year the standards are in effect. Avoided GHG emissions are measured in metric tons of carbon dioxide equivalent (Metric Tons CO2e). Assumptions used in developing the GHG savings are provided in Section 6.2 and Appendix C of this report. The monetary value of avoided GHG emissions is included in TDV cost factors and is thus included in the cost-effectiveness analysis.
Water and Water Quality Impacts The proposed measure is not expected to have any impacts on water use or water quality, excluding impacts that occur at power plants. Maintenance costs have been added to account for the costs to neutralize condensate.
Compliance and Enforcement
Overview of Compliance Process The Statewide CASE Team worked with stakeholders to develop a recommended compliance and enforcement process and to identify the impacts this process would have on various market actors. The compliance process is described in Section 2.5. Impacts that the proposed measure would have on market actors is described in Section 3.3 and Appendix E. The key issues related to compliance and enforcement are summarized below:
2022 Title 24, Part 6 Final CASE Report – 2022-NR-HVAC3-F | 18
• Design Phase: There are some modest changes to the design phase of the compliance process. The HVAC (Heating, Ventilation, and Air Conditioning) design team would identify if a given project triggers these efficiency requirements based on system capacity measured in Btu/h. Calculating the weighted thermal efficiency would be a new step in the process for the design team requiring a straightforward calculation. The plumbing designer would ensure that the proposed flow rate and supply water return temperature is met along with the proposed oxygen trim control levels. Designers would need to be aware of the new trigger for oxygen trim control and adjust design recommendations accordingly.
• Permit Application Phase: During the permit application phase, the project team would submit design documents that include the individual boiler/water heater specifications, weighted thermal efficiencies, boiler flow rates and temperatures, and oxygen combustion control specifications. Specifications for weighted thermal efficiency for boilers and water heaters along with flow rate and return water temperatures is a new metric to include in permit applications that project teams must note. The plans examiner would need to understand the code updates as well as the relevant exceptions to the change.
• Construction Phase: During the construction phase, the contractor needs to be aware of the new weighted thermal efficiency metric in order to ensure that the equipment installed meets the updated code changes. Additionally, contractors must ensure that equipment is installed in accordance to compliance documents.
• Inspection Phase: Compliance documents Nonresidential Certificate of Compliance (NRCC)-MCH-E, NRCC-PLB-E, and NRCC-PRC-E would need to be revised. The compliance document would need to be updated to document the weighted thermal efficiency, the return temperature and flow rates of the boiler(s) and water heater(s).
Field Verification and Acceptance Testing This measure does not require field verification or acceptance testing. Compliance with these requirements can be demonstrated through updated certificate of compliance documents (NRCC-PLB-E, NRCC-MCH-E, and NRCC-PRC-E) in order to document weighted thermal efficiencies and the hot water return system specifications. Section 2.5 contains additional information regarding compliance.
2022 Title 24, Part 6 Final CASE Report – 2022-NR-HVAC3-F | 19
1. Introduction This document presents recommended code changes that the California Energy Commission will be considering for adoption in Spring 2021. If you have comments or suggestions prior to the adoption, please email [email protected]. Comments will not be released for public review or will be anonymized if shared.
The Codes and Standards Enhancement (CASE) initiative presents recommendations to support the California Energy Commission’s (Energy Commission) efforts to update the California Energy Code (Title 24, Part 6) to include new requirements or to upgrade existing requirements for various technologies. Three California Investor Owned Utilities (IOUs) – Pacific Gas and Electric Company, San Diego Gas and Electric, and Southern California Edison – and two Publicly Owned Utilities –Los Angeles Department of Water and Power and Sacramento Municipal Utility District (herein referred to as the Statewide CASE Team when including the CASE Author) – sponsored this effort. The program goal is to prepare and submit proposals that will result in cost-effective enhancements to improve energy efficiency and energy performance in California buildings. This report and the code change proposal presented herein are a part of the effort to develop technical and cost-effectiveness information for proposed requirements on building energy-efficient design practices and technologies.
The Statewide CASE Team submits code change proposals to the Energy Commission, the state agency that has authority to adopt revisions to Title 24, Part 6. The Energy Commission will evaluate proposals submitted by the Statewide CASE Team and other stakeholders. The Energy Commission may revise or reject proposals. See the Energy Commission’s 2022 Title 24 website for information about the rulemaking schedule and how to participate in the process: https://www.energy.ca.gov/programs-and-topics/programs/building-energy-efficiency-standards/2022-building-energy-efficiency.
The overall goal of this CASE Report is to present a code change proposal for high efficiency boilers and service water heating. The report contains pertinent information supporting the code change.
When developing the code change proposal and associated technical information presented in this report, the Statewide CASE Team worked with a number of industry stakeholders. For the gas boiler system submeasure and service water heating submeasures, manufacturers, engineering professionals, energy efficiency researchers provided valuable guidance and information for the Statewide CASE Team. For the oxygen concentration submeasure, researchers, boiler manufactures, and Title 24 energy analysts provided essential guidance based upon field experience and previous CASE reports. The proposal incorporates feedback received during a public stakeholder workshop that the Statewide CASE Team held on October 15, 2019, and March 12,
2022 Title 24, Part 6 Final CASE Report – 2022-NR-HVAC3-F | 20
2020. Notes from these stakeholder meetings can be found in the references section of this CASE Report (Statewide CASE Team 2019).
The following is a brief summary of the contents of this report:
• Section 2 of this Final CASE Report provides a description of the measure and its background. This section also presents a detailed description of how this code change is accomplished in the various sections and documents that make up the Title 24, Part 6 Standards.
• Section 3 – In addition to the Market Analysis section, this section a review of the current market structure. Section 3.2 describes the feasibility issues associated with the code change, including whether the proposed measure overlaps or conflicts with other portions of the building standards, such as fire, seismic, and other safety standards, and whether technical, compliance, or enforceability challenges exist.
• Section 4 – Energy Savings presents the per-unit energy, demand reduction, and energy cost savings associated with the proposed code change. This section also describes the methodology that the Statewide CASE Team used to estimate per-unit energy, demand reduction, and energy cost savings.
• Section 5 – This section includes a discussion and presents analysis of materials and labor required to implement the measure and a quantification of the incremental cost. It also includes estimates of incremental maintenance costs, i.e., equipment lifetime and various periodic costs associated with replacement and maintenance during the period of analysis.
• Section 6 – First-Year Statewide Impacts presents the statewide energy savings and environmental impacts of the proposed code change for the first year after the 2022 code takes effect. This includes the amount of energy that would be saved by California building owners and tenants and impacts (increases or reductions) on material with emphasis placed on any materials that are considered toxic by the state of California. Statewide water consumption impacts are also reported in this section.
• Section 7 – Proposed Revisions to Code Language concludes the report with specific recommendations with strikeout (deletions) and underlined (additions) language for the standards, Reference Appendices, Alternative Calculation Method (ACM) Reference Manual, compliance manual, and compliance documents.
• Bibliography presents the resources that the Statewide CASE Team used when developing this report.
• Appendix A: Statewide Savings Methodology presents the methodology and assumptions used to calculate statewide energy impacts.
• Appendix B: Embedded Electricity in Water Methodology presents the methodology and assumptions used to calculate the electricity embedded in
2022 Title 24, Part 6 Final CASE Report – 2022-NR-HVAC3-F | 21
water use (e.g., electricity used to draw, move, or treat water) and the energy savings resulting from reduced water use.
• Appendix C: Environmental Impacts Methodology presents the methodologies and assumptions used to calculate impacts on GHG emissions and water use and quality.
• Appendix D: California Building Energy Code Compliance (CBECC) Software Specification presents relevant proposed changes to the compliance software (if any).
• Appendix E: Impacts of Compliance Process on Market Actors presents how the recommended compliance process could impact identified market actors.
• Appendix F: Summary of Stakeholder Engagement documents the efforts made to engage and collaborate with market actors and experts.
• Appendix G: Nominal Savings Tables presents the energy cost savings in nominal dollars by building type and climate zone.
2022 Title 24, Part 6 Final CASE Report – 2022-NR-HVAC3-F | 22
2. Measure Description
2.1 Measure Overview The three code change proposals that the Statewide CASE Team is recommending are described below. These proposals aim to improve the energy performance of large boiler systems used for space and water heating and gas service water heating systems. The two proposals that impact the minimum thermal efficiency of high-capacity boiler and gas service water heating systems are closely modeled on requirements that are in ANSI/ASHRAE/IES Standard 90.1-2019 — Energy Standard for Buildings Except Low-Rise Residential Buildings (ASHRAE 90.1-2019).
2.1.1 Gas Boiler Systems The proposed prescriptive requirements for gas boiler systems would raise the minimum thermal efficiency of gas-fired hot water boiler systems for space heating to a weighted-thermal efficiency of 90 percent. This change impacts gas hot water boiler systems of capacities between 1 and 10 million Btu/h installed in newly constructed nonresidential and high-rise residential buildings. Boilers within the same building but on separate loops are not considered to be a part of the same system. Weighted thermal efficiencies are calculated based off the input each boiler provides to the total system capacity. For instance, if there are two individual boilers that are a part of a system, one with a capacity of 1 million Btu/h and efficiency of 95 percent and the other with a capacity of 500,000 Btu/h and efficiency of 90 percent, the weighted thermal efficiency is 93.3 percent. Space heating boilers installed in individual dwelling units would not be included in the calculation of thermal efficiency. Additionally, individual gas boilers with input capacity less than 300,000 Btu/h would not be included in calculations of the total system input or thermal efficiency. Table 5 below shows what system and individual level thresholds trigger this requirement for gas boilers.
This measure would also add two requirements for the hot water distribution system that aim to optimize condensing operation for boilers in the scope of the measure:
a. Space heating coils and heat exchangers are sized so that under design conditions the return temperature of hot water to hot water boilers is 120°F or less.
b. Hot water space heating systems is designed so that under all conditions the return water entering the boiler(s) must be 120°F or less, or flow rates for supply hot water that recirculates directly into the return system must be no greater than 20 percent of the design flow of the operating boiler.
The proposal includes a trade-off wherein boiler systems do not need to meet the thermal efficiency and hot water distribution design requirements if 25 percent of the
2022 Title 24, Part 6 Final CASE Report – 2022-NR-HVAC3-F | 23
annual space heating requirement is provided by on site renewable energy, site-recovered energy, or heat recovery chillers or where half or more of the design heating load is served using perimeter convective heating, radiant ceiling panels, or both.
2.1.2 Gas Service Water Heating Systems The proposed code change would require gas service hot water heating systems of capacity 1 million Btu/h or greater to have a minimum weighted thermal efficiency of at least 90 percent. The revisions to the prescriptive requirements would impact newly constructed nonresidential buildings and high-rise residential buildings. Water heating systems that serve individual dwelling units would not need to comply. Individual gas water heaters with input capacity less than 100,000 Btu/h are also excepted from efficiency and input-capacity calculations. Multiple gas service hot water heating units must also meet this requirement if their combined input capacity is above 1 million Btu/h. These systems can meet the requirement if the water-heating input provided by the individual equipment provides an input capacity-weighted average thermal efficiency of at least 90 percent.
The proposed code change would include an alternative prescriptive pathway in which service hot water heating systems do not need to meet efficiency requirements if 25 percent of the annual service water-heating requirement is provided by site-solar or site recovered energy.
Table 5 below shows what system and individual level thresholds trigger this requirement for gas service water heating and gas boilers.
Some service water heating systems can be used to provide space heating in addition to service water heating. These integrated units must comply with the proposed thermal efficiency requirements for service water heating systems.
Table 5: System and Individual Unit Thresholds of Proposed Requirements System Type System Threshold (Btu/h) Minimum Individual
Unit Threshold (Btu/h) Gas Boilers ≥ 1 million and ≤ 10 million 300,000 Gas Service Water Heating ≥1 million 100,000
2.1.3 Oxygen Concentration Heat exchange in boilers is more efficient when oxygen concentrations are within the optimal range. Existing code requirements that address excess stack-gas oxygen concentrations in commercial and process boilers result in boilers operating at higher levels of thermal efficiency. The proposed changes would adjust the stack-gas oxygen concentration requirements for all newly installed process boilers. The proposal would establish an oxygen concentration requirement of 3 percent for process boilers with
2022 Title 24, Part 6 Final CASE Report – 2022-NR-HVAC3-F | 24
input capacity of at least 5 million Btu/h or greater. This change also simplifies the code so all process boilers that are subject to oxygen concentration requirements must maintain a concentration of 3 percent or less. Previously, the concentration requirements varied by system capacity and a 5 percent level of oxygen concentration was required for process boilers with input capacities between 5 and 10 Million Btu/h. For process boilers, the Statewide CASE Team recommends a clarification that the combustion air volume be controlled only by flue gas concentration, eliminating the option to control based on firing rate. Currently, commercial boilers with steady state full-load thermal efficiency of 85 percent or higher are not required to meet oxygen concentration requirements. This exception would be updated to 90 percent to better reflect the market for high efficiency products. This oxygen concentration exception at 90 percent efficiency will also be added process boilers.
2.2 Measure History 2.2.1 Gas Boiler Systems and Gas Service Water Heating Boilers transfer heat from the combustion process to a heating medium, in this case water, for use in space or domestic heating applications. Figure 1 below shows the essential components of a standard boiler. More efficient units often utilize efficient burner designs and feature elements such as forced air burners and relatively larger heat exchange surfaces. Boiler system efficiency is assessed in terms of thermal efficiency, which incorporates both combustion efficiency, radiation, and convection losses. Generally, this measurement represents the percentage of useful thermal energy captured during the combustion process.
Boilers capable of achieving efficiencies above 90 percent utilize larger heat exchangers and recuperate additional thermal energy through the flue gas. These high efficiency boilers are referred to as condensing products because they can condense moisture out of flue gas, recovering latent heat from water vapor; the removal of this latent heat results in lower flue gas temperatures than traditional boilers. Figure 2 below shows the essential features of a condensing boiler. These lower flue gas temperatures may impact the ability of combustion gases to escape through traditional atmospheric venting. Additionally, the recovered liquid condensate is acidic and requires proper disposal through non-corrosive piping. Condensing products, including boilers and water heaters, utilize stainless steel for use in heat exchangers to prevent corrosion from this acidic condensate.
Gas service water heating is generally provided through one of three different types of equipment. The first type are storage water heaters that often utilize a glass lined steel tank, foam insulation, and a heat exchanger coil or flue running through the center of the tank, which is heated through a gas burner at the bottom of the tank. The hot gases from the combustion process ascend through the flue or heat exchanger coil and
2022 Title 24, Part 6 Final CASE Report – 2022-NR-HVAC3-F | 25
transfer heat to the surrounding water in the tank. Storage units maintain water in the tank at a constant temperature and heat is lost through the tank while awaiting a hot water draw.
The second type of commercial water heater are tankless models. The burner in tankless models is activated when a minimum water draw occurs. The burner then heats an exchanger, cold water enters the unit, and ascends through this heat exchanger where the combustion heat is transferred to the water. The third type of commercial water heater are larger, volume water heaters which operate as commercial boilers, discussed above. Storage, tankless, and volume water heaters may be condensing, or non-condensing, and condensing versions utilize the same technologies and have the same venting and condensate disposal considerations as condensing boilers.
All technologies that meet or exceed the proposed minimum system thermal efficiency standards would require condensing capability. While this proposal does not require that new buildings have all condensing water heaters, in order to achieve 90 percent weighted thermal system efficiency, the majority of the system capacity must be met by condensing water heaters or boilers. Condensing technologies for space heating equipment have been in existence for over two decades and represent a relatively mature market. Overall, condensing products can achieve energy savings of at least 10 percent compared to standard products (Consortium for Energy Efficiency 2001).
Condensing boilers and service water heaters operate at thermal efficiencies of 90 percent or more. This level of thermal efficiency is above the federal appliance standards that impact boilers manufactured on after January 10, 2023, which mandate thermal efficiency levels of 84 or 85 percent for commercial boilers in the scope of this measure (DOE n.d.). More information is given as to the specific federal standards for high-capacity individual boilers in Section 2.4.3.1.
2022 Title 24, Part 6 Final CASE Report – 2022-NR-HVAC3-F | 26
Figure 1: Diagram of conventional boiler.
Source: (Center for Energy and Environment 2008)
Figure 2: Diagram of condensing boiler.
Source: (Center for Energy and Environment 2008)
2022 Title 24, Part 6 Final CASE Report – 2022-NR-HVAC3-F | 27
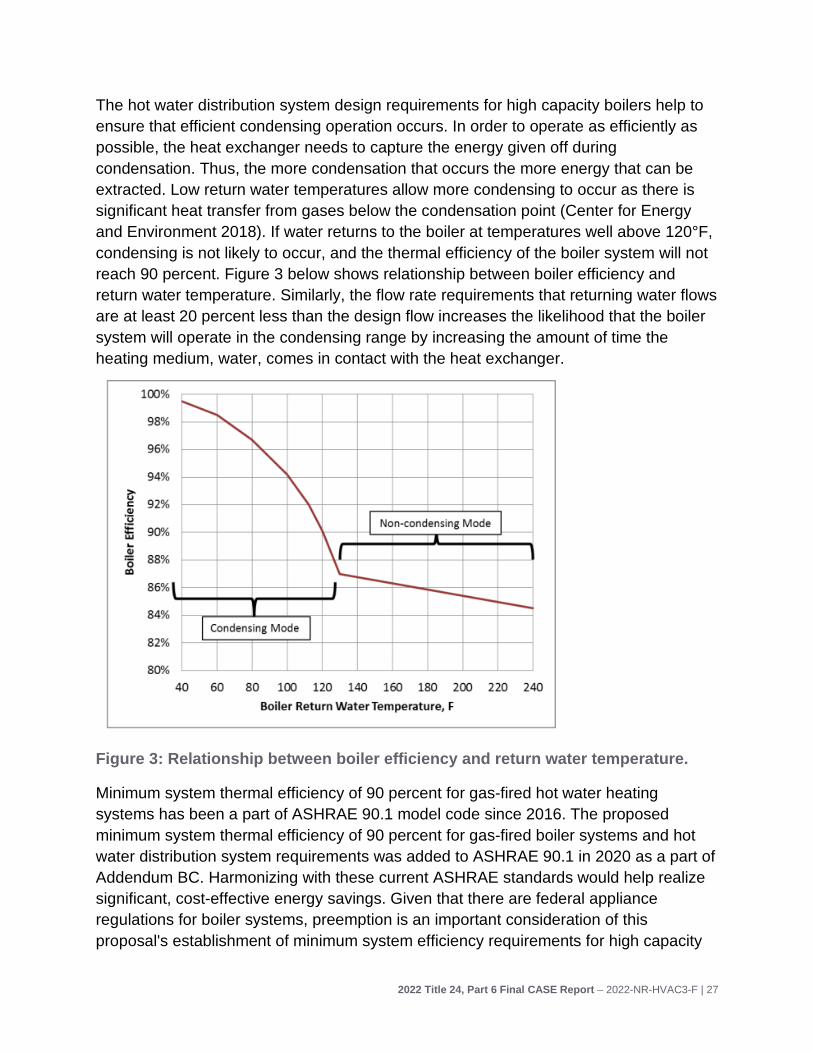
The hot water distribution system design requirements for high capacity boilers help to ensure that efficient condensing operation occurs. In order to operate as efficiently as possible, the heat exchanger needs to capture the energy given off during condensation. Thus, the more condensation that occurs the more energy that can be extracted. Low return water temperatures allow more condensing to occur as there is significant heat transfer from gases below the condensation point (Center for Energy and Environment 2018). If water returns to the boiler at temperatures well above 120°F, condensing is not likely to occur, and the thermal efficiency of the boiler system will not reach 90 percent. Figure 3 below shows relationship between boiler efficiency and return water temperature. Similarly, the flow rate requirements that returning water flows are at least 20 percent less than the design flow increases the likelihood that the boiler system will operate in the condensing range by increasing the amount of time the heating medium, water, comes in contact with the heat exchanger.
Figure 3: Relationship between boiler efficiency and return water temperature.
Minimum system thermal efficiency of 90 percent for gas-fired hot water heating systems has been a part of ASHRAE 90.1 model code since 2016. The proposed minimum system thermal efficiency of 90 percent for gas-fired boiler systems and hot water distribution system requirements was added to ASHRAE 90.1 in 2020 as a part of Addendum BC. Harmonizing with these current ASHRAE standards would help realize significant, cost-effective energy savings. Given that there are federal appliance regulations for boiler systems, preemption is an important consideration of this proposal's establishment of minimum system efficiency requirements for high capacity
2022 Title 24, Part 6 Final CASE Report – 2022-NR-HVAC3-F | 28
boilers. This proposal was written in a precise manner to avoid federal preemption. More information on preemption issues are discussed on Section 2.4.3.
2.2.2 Oxygen Concentration Systems that measure various flue gas constituents to increase combustion efficiency, such as oxygen trim control, have been sold by multiple manufacturers for over 30 years (Ultrasystems 1983). There are various combustion control strategies including fixed position parallel control, parallel positioning control, and oxygen trim control. Fixed position parallel control and parallel positioning control can achieve stack-gas oxygen levels of 4.5-8 percent and 4-6 percent, respectively, by adjusting fuel and air positioners based on firing rate (Farthing n.d.). Oxygen trim control measures excess oxygen and “provides feedback to the burner controls to automatically minimize excess combustion air and optimize the air-to-fuel ratio” (DOE 2012). Oxygen trim controls aid in the combustion process by balancing the oxygen ratios of excess air so the most efficient performance occurs. While commenters have indicated that multiple technologies may potentially be able to achieve the required levels, the only approach to achieve a 3 percent stack-gas oxygen concentration that the Statewide CASE Team has been able to verify utilizes oxygen trim control technology. Oxygen trim controls are either sold with a new boiler or as an aftermarket add-on.
In 2013, an oxygen concentration level requirement of 5 percent was added in Title 24, Part 6 for commercial boilers with rated input of at least 5 million Btu/h. Similarly, oxygen concentration level requirements of 5 percent and 3 percent for process boilers above 5 million Btu/h and 10 million Btu/h, respectively, were added to Title 24, Part 6 in the 2013 code cycle. The measures have achieved significant savings (California Statewide Utilities Codes and Standards Team 2012). This Final CASE Report proposes simplifying the code language and making a single stack-gas oxygen concentration requirement of 3 percent for process boilers larger than 5 million Btu/h. The 2013 Final CASE report on process boilers showed that an oxygen trim control level of 3 percent was nearly cost effective for boilers with inputs of 5 million Btu/h and was cost-effective for boilers with inputs at 5.5 million Btu/h or more. Due to changes in the market since this revision, this report shows the measure is now cost-effective. The proposal includes an exception to this 3 percent requirement for condensing products achieving 90 percent efficiency. The efficiency improvement of moving from a baseline product to a condensing product is greater than the efficiency gains from lowering the oxygen concentration from the current 5 percent requirement to the proposed 3 percent requirement. This proposed exception will also be extended to the current 5 percent oxygen concentration requirements for commercial boilers 5 million Btu/h or larger. Consistency in these exceptions would support ease of compliance and promote adoption of high efficiency condensing products.
2022 Title 24, Part 6 Final CASE Report – 2022-NR-HVAC3-F | 29
2.3 Summary of Proposed Changes to Code Documents The sections below summarize how the standards, Reference Appendices, Alternative Calculation Method (ACM) Reference Manuals, and compliance documents would be modified by the proposed change. See Section 7 of this report for detailed proposed revisions to code language.
2.3.1 Summary of Changes to the Standards This proposal would modify the following sections of the California Energy Code as shown below. See Section 7.2 of this report for marked-up code language.
Section 100.1- DEFINITIONS AND RULES OF CONSTRUCTION
• The purpose of the change to this section is to add a definition for the term “boiler system”.
Section 120.6 - MANDATORY REQUIREMENTS FOR SPACE-CONDITIONING EQUIPMENT
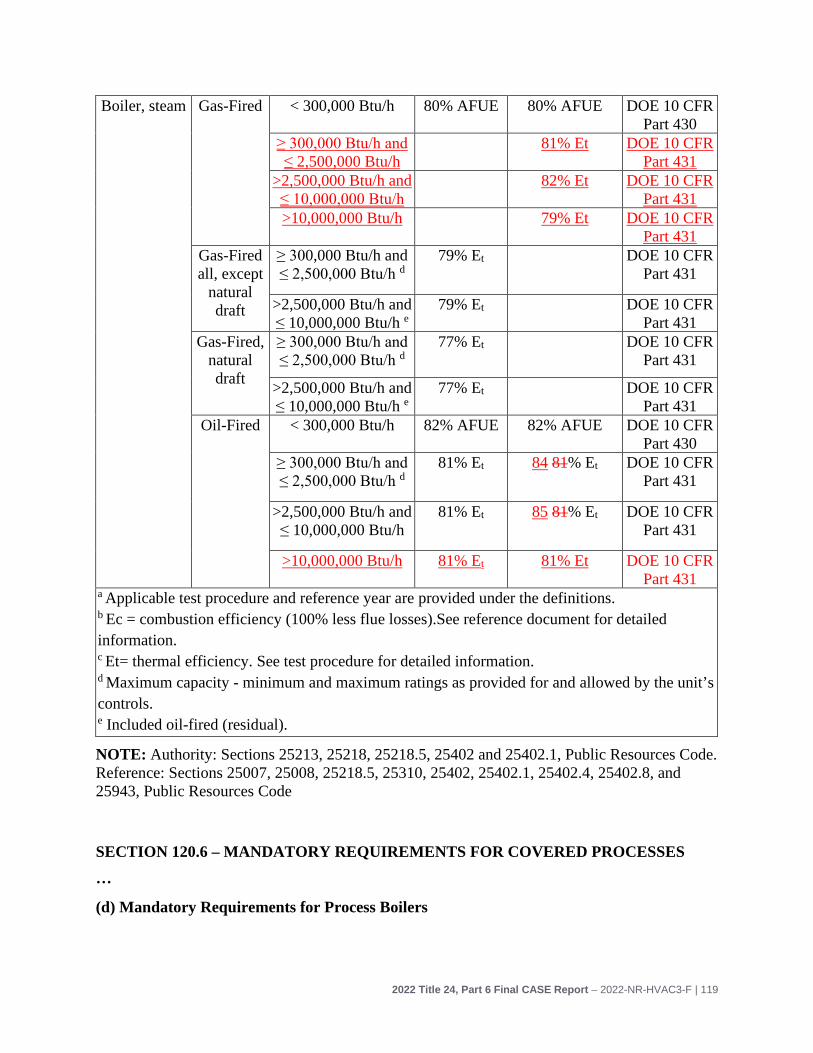
• Section 120.6 Table 110.2-K: Gas- and Oil-Fired Boilers, Minimum Efficiency requirements: The purpose of the change to Table 110.2-K is to align minimum efficiency requirements for hot water and steam boilers with updates in federal standards that will take effect January 2023 (see Section 2.4.3.1 for more information on updated federal code).
Section 120.6 - MANDATORY REQUIREMENTS FOR COVERED PROCESS
• Section 120.6(d): Mandatory Requirements for Process Boilers: The purpose of the proposed change to this Section is to adjust the oxygen concentration requirements for all newly installed process boilers above 5 million Btu/h to less than or equal to 3 percent. This would be accomplished by eliminating Section 120.6(d)3 and adjusting the capacity requirement in Section 120.6(d)4 from 10 to 5 million Btu/h. The change also clarifies that stack-gas oxygen concentration must be maintained by removing the word “excess” from code language. Additionally, an exception would be added to raise the oxygen concentration exception from boilers with thermal efficiencies above 85 percent to boilers with thermal efficiency above 90 percent
Section 120.9 – MANDATORY REQUIREMENTS FOR COMMERCIAL BOILERS
• Exception to Section 120.9(c): The purpose of the change to this Exception is to raise the oxygen concentration exception from boilers with thermal efficiencies above 85 percent to boilers with thermal efficiency above 90 percent. The change also clarifies that stack-gas oxygen concentration must be maintained by removing the word “excess” from code language.
Section 140.4 – PRESCRIPTIVE REQUIREMENTS FOR SPACE CONDITIONING SYSTEMS
• Section 140.4(k) Hydronic System Measures
2022 Title 24, Part 6 Final CASE Report – 2022-NR-HVAC3-F | 30
• Section 140.4(k)8: The purpose of the change to this Section is to create a minimum thermal efficiency level of 90 percent for gas fired water heating boiler systems in newly constructed nonresidential and high-rise residential buildings. The change establishes hot water distribution flow rate, temperature, and supply requirements for high-capacity boiler systems with input capacity between 1-10 million Btu/h. There are four added exceptions to this requirement. These exceptions remove the following boilers from the thermal efficiency requirements: space heating boilers installed in individual dwelling units, space heating boilers where 25 percent of the capacity is provided by clean or recovered energy, and boilers where 50 percent or more of the design heating load is served using perimeter convective heating or radiant ceiling panels. Additionally, gas boilers with input capacity of less than 300,000 Btu/h are not included in the calculation of system input or efficiency.
Section 140.5 – PRESCRIPTIVE REQUIREMENTS FOR SERVICE WATER HEATING SYSTEMS
• Section 140.5(a): The purpose of the change to this Section is to add a new requirement for nonresidential service water heating systems with capacities at or above 1 million Btu/h that is detailed in 140.5(c).
• Section 140.5 (b): The purpose of the change to this Section is to add a new requirement for nonresidential service water heating systems with capacities at or above 1 million Btu/h that is detailed in 140.5(c).
• Section 140.5(c): The purpose of the change to this Section is to create a minimum thermal efficiency level of 90 percent for gas service water-heating systems, with input capacities of at least 1 million Btu/h, in newly constructed nonresidential and high-rise residential buildings. Section 140.5(c) includes three exceptions.
2.3.2 Summary of Changes to the Reference Appendices The proposed code change would not modify the Reference Appendices.
2.3.3 Summary of Changes to the Nonresidential ACM Reference Manual The proposed code change would modify the following sections of the Nonresidential ACM Reference Manual.
SECTION 5.8 HVAC PRIMARY SYSTEMS
• 5.8.1 Boilers: Would be updated to add thermal efficiency requirements to the “boiler efficiency” table. The thermal efficiency would only be applicable to gas fired hot water boilers. The “hot water return temperature” table would be modified to reflect the new hot water design temperature requirements. A new table titled “Supply hot water flow rate” would be created in order to include the hot water flow rates for boilers.
SECTION 5.9 MISCELLANEOUS ENERGY USES
2022 Title 24, Part 6 Final CASE Report – 2022-NR-HVAC3-F | 31
• 5.9.1.2 Water Heaters: Would be updated to add the updated water heater thermal efficiency levels to the “thermal efficiency” table. See Section 7.4 of this report for the detailed proposed revisions to the text of the ACM Reference Manual.
2.3.4 Nonresidential Compliance Manual The proposed code change would modify the following sections of the Nonresidential Compliance Manual:
• Chapter 4, Subsection 4.2.2 would be updated to indicate that there are efficiency levels in Title 24, Part 6 for certain service water heaters and gas boilers
• Chapter 4, Subsection 10.9.2.2 would be updated to reflect new oxygen concentration levels.
• Chapter 4, Subsection 4.5.2.6 would be updated to include specifications regarding hot water distribution design.
See Section 7.5 of this report for the detailed proposed revisions to the text of the compliance manuals.
2.3.5 Summary of Changes to Compliance Documents The proposed code change would modify the compliance documents listed below. Examples of the revised documents are presented in Section 7.6.
• NRCC (Nonresidential Certificate of Compliance)-PLB-E – The purpose of the change to this certificate would be update the requirements for service water heating systems in Section 140.5. This change is necessary to ensure compliance with the proposed standards.
• NRCC-MCH-E- The purpose of this change is to update various tables to refer to the new performance standards for high capacity boilers. This change is necessary so as not to create confusion with the new requirements and clearly show when the proposed requirements are triggered.
• NRCC-PRC-E- The purpose of this change would be to reduce the number of choices for rated input capacity options for process boilers since the requirements for all boilers larger than 5 million Btu/h would be aligned. This change is necessary to avoid any unwarranted confusion between the combustion requirements for boilers between 5 and 10 million Btu/h.
2.4 Regulatory Context 2.4.1 Existing Requirements in the California Energy Code
2.4.1.1 Existing Requirements for Gas Boiler Systems
2022 Title 24, Part 6 Final CASE Report – 2022-NR-HVAC3-F | 32
The existing efficiency requirements for gas-fired hot water boilers in Title 24, Part 6 Section 110.2 are mandatory requirements that align with federal appliance efficiency standards. These standards require minimum thermal efficiency of 80 percent for equipment with capacities between 300,000 Btu/h and 2.5 million Btu/h and a minimum thermal efficiency of 82 percent for boilers with capacities above 2.5 million Btu/h. These requirements are for individual boilers and not at the system level. There are no current hot water system distribution design requirements. The proposed code language includes prescriptive requirements for system level efficiency and hot water distribution design.
2.4.1.2 Existing Requirements for Gas Service Water Heating The are no relevant thermal efficiency requirements for service water heating systems in Title 24, Part 6.
2.4.1.3 Existing Requirements for Oxygen Concentration Section 120.6(d)3-4 includes oxygen concentration requirements for newly installed process boilers with input capacities over 5 million Btu/h. Process boilers between 5 and 10 million Btu/h must maintain oxygen concentrations at less than or equal to 5 percent by volume with firing rates of 20 to 100 percent. Process boilers over 10 million Btu/h must maintain oxygen concentrations at less than or equal to 3 percent by volume with firing rates of 20 to 100 percent.
Section 120.9 of Title 24, Part 6 includes oxygen concentration requirements that apply to newly installed commercial boilers with input capacities at or above 5 million Btu/h. These boilers must maintain oxygen concentrations at less than or equal to 5 percent.
For both process and commercial boilers, oxygen concentration is measured by volume with firing rates of 20 to 100 percent. There is a discrepancy in the current code pertaining to whether combustion air volume can be controlled based on measured flue gas oxygen concentration or firing rate.
2.4.2 Relationship to Requirements in Other Parts of the California Building Code
There are relevant condensate drainage and control parameters noted in the California Plumbing Code, Title 24, Part 5. Section 814.1 includes specifics on the condensate pipe sizing and pump installation. Section 814.4 notes that condensate drain lines from condensing appliances should be sized according to the manufacturers’ instructions and drain lines from more than one appliance should be approved by the relevant authority. Section 807.2 contains specifics on the material make-up of the drainage system for undiluted condensate waste (California Plumbing Code n.d.).
The condensate parameters in the California Plumbing Code noted above for gas boiler systems also apply to service water heating systems. Additionally, Appendix L Section
2022 Title 24, Part 6 Final CASE Report – 2022-NR-HVAC3-F | 33
503.4.3 contains the same thermal efficiency levels for high-capacity service water heating systems as this proposal (California Plumbing Code n.d.).
2.4.3 Relationship to Local, State, or Federal Laws
2.4.3.1 Gas Boiler Systems Currently, the federal government minimum efficiency requirements for commercial boilers with rated input between 300,000 Btu/h and 2.5 Million Btu/h is 80 percent thermal efficiency (DOE n.d.). The federal efficiency requirements for gas fired hot water boilers with capacity above 2.5 Million Btu/h is a combustion efficiency of 82 percent (DOE n.d.). These requirements are referenced in Table 110.2-K of Title 24, Part 6.
An amendment to the federal register, that was published January 10, 2020, would raise the minimum efficiency requirements for gas-fired hot water boilers with rated input between 300,000 Btu/h and 2.5 Million Btu/h to 84 percent thermal efficiency. The minimum thermal efficiency for gas-fired hot water boilers with rated input between 2.5 Million Btu/h and 10 Million Btu/h would be 85 percent (DOE 2016). The amendment notes that that this standard will apply to all boilers manufactured on or after January 10, 2023.
There are no other relevant federal, state or local laws for gas boilers.
2.4.3.2 Gas Service Water Heating The existing efficiency requirements for gas-fired water heaters in Title 20 Section 1605.1(f) are mandatory requirements that align with federal appliance efficiency standards. These requirements include a thermal efficiency of 80 percent, along with maximum levels of standby loss determined by tank size through a volumetric formula for storage style water heaters (Westlaw n.d.). Additionally, Title 24, Part 6 Section 110.3 contains requirements on the installation and temperature controls of service water heating equipment. There are no other relevant federal, state or local laws for gas service water heating systems.
2.4.3.3 Oxygen Concentration There are no current oxygen concentration requirements at the federal, state or local level. As these controls can be added to boilers with minimum federal efficiencies, these controls are not preempted by federal efficiency standards.
2.4.3.4 Pre-emption Considerations Boilers and water heaters operating at 80 or 82 percent would not be able to meet the proposed system thermal efficiencies of 90 percent. Since commercial boilers and water heaters are federally covered products, states are pre-empted from setting standards above the federal minimum standards under 42 U.S.C. 6313 (Legal Information Institute
2022 Title 24, Part 6 Final CASE Report – 2022-NR-HVAC3-F | 34
n.d.). However, states can adopt higher efficiency levels for federally regulated products if two conditions are met according to 42 U.S.C. 6316 (Legal Information Institute n.d.). The first is that the standard does not exceed the energy efficiency of the product in an amended ASHRAE/IES (Illuminating Engineering Society) Standard. The second is that the building code does not take effect prior to the applicable in ASHRAE/IES Standard. Addendum BC of ASHRAE 90.1 establishes the minimum weighted thermal efficiencies of high capacity gas-fired boiler hot water systems for space heating to be 90 percent. Addendum BC of ASHRAE 90.1 should be adopted prior to January 2023 and will thus take effect before the new 2022 Title 24, Part 6 Standards. Therefore, California can adopt this standard in the 2022 Title 24 code change cycle. Section 7.5.3 of ASHRAE 90.1 includes the thermal weighted efficiency requirements for gas service hot water heating systems that this proposal recommends, and this section of ASHRAE has been in effect since 2016.
2.4.4 Relationship to Industry Standards As demonstrated above, the aim of this proposal is to align with the gas-fired boiler water heating system and gas service water heating system thermal efficiency requirements in ASHRAE 90.1-2019. The federal exception to preemption under 42 U.S.C. 6316 requires alignment between the proposed building code and current ASHRAE requirements. Therefore, this proposal matches those requirements in ASHRAE 90.1.
2.5 Compliance and Enforcement When developing this proposal, the Statewide CASE Team considered methods to streamline the compliance and enforcement process and how negative impacts on market actors who are involved in the process could be mitigated or reduced. This section describes how to comply with the proposed code change. It also describes the compliance verification process. Appendix E presents how the proposed changes could impact various market actors.
The activities that need to occur during each phase of the project are described below:
• Design Phase: First, the HVAC design team identifies if a given project triggers these efficiency requirements noted in Table 5. If the requirements apply to the building, the designer would need to calculate the weighted thermal efficiency using a straightforward calculation. Doing so would be a new step in the process for the design team. The HVAC designer or energy consultant would also need to complete the updated NRCC-MCH-E form and NRCC-PRC-E for any impacted process boilers. The plumbing designer or energy consultant would ensure that the new version of the NRCC-PLB-E is properly filled out and ensures that the
2022 Title 24, Part 6 Final CASE Report – 2022-NR-HVAC3-F | 35
proposed flow rate and supply water return temperature is met along with the proposed oxygen trim control levels.
• Permit Application Phase: During the permit application phase, the project team would submit design documents that include the individual boiler/water heater specifications, weighted thermal efficiencies for all equipment noted in Table 5, boiler flow rates and temperatures, and oxygen combustion control specifications. Specifications for the thermal efficiency for boilers and water heaters along flow rate and return water temperatures is a new metric to include in permit applications that must be noted by project teams. NRCC-MCH-E and NRCC-PLB-E would need to be updated to adhere to these new changes. The plans examiner would need to understand the code updates as well as the relevant exceptions to the change.
• Construction Phase: During the construction phase, the general contractor needs to be aware of the new weighted thermal efficiency metric to ensure that the equipment installed meets the updated code changes. This weighted thermal efficiency metric would be an average of each individual boiler and water heaters thermal efficiency weighted by heat input. Additionally, contractors must ensure that equipment is installed in accordance to compliance documents. Proper installation should be documented by the project team. The installers would need to ensure that all applicable nonresidential certificates of installation and acceptance, including NRCI-MCH-01, NRCI-PLB-01, and NRCI-PRC-01, are completed properly to meet the updated requirements. No new NRCI or NRCA forms would need to be created.
• Inspection Phase: The boiler or hot water system installers would need to accurately complete the Certificates of Acceptance documents NRCA- MCH-09 and NRCA-MCH-017. Lastly, the installing agent would need to complete the Certificate of Installation NRCI-MCH-01-E. These three forms would be provided to the building inspector to verify compliance. The building inspector would verify that the NRCC, NRCA, and NRCI are consistent with what is installed and would issue a certificate of occupancy.
Changes in the compliance process would primarily impact the workflows for HVAC and plumbing designers, plans examiner, and contractors. Both sets of designers as well as plans examiners would need to be aware of the new thermal efficiency calculations and include this in their equipment schedules. Additionally, contractors bidding on individual pieces equipment would need to ensure that boilers are chosen in a manner that allows system weighted thermal efficiency to meet the proposed levels. Calculating weighted thermal efficiencies with multiple boiler or water heaters should not pose a significant problem for these market actors, as weighted thermal efficiency is a well-known metric in the mechanical field. Additionally, the Statewide CASE Team recommends that
2022 Title 24, Part 6 Final CASE Report – 2022-NR-HVAC3-F | 36
design documents show weighted and individual efficiencies, which would streamline the weighted efficiencies calculation process for HVAC and plumbing designers. Plans examiners would need to verify that the weighted efficiencies were calculated correctly.
HVAC designers would also need to include flow rates and return water temperature in their plumbing specifications. Plans examiners would compare the updated compliance document with the hot water design specifications on the equipment schedule. To assist with this process, the Statewide CASE Team has proposed code language and compliance document that succinctly show the hot water system design requirements. Additionally, the Statewide CASE Team is reaching out to members of the industry to determine the most effective ways to verify these flow rate and water temperature requirements.
The proposed revisions to the stack-gas oxygen concentration requirements would simplify the compliance process. Oxygen concentration requirements have been in Title 24, Part 6 since the 2013 code, so all market actors are familiar with the requirements and accustom to the compliance process. The changes would simplify the code by eliminating variation in the maximum concentration allowances for process boilers based on boiler capacity. Instead of determining if the boiler needs to meet a 5 percent or 3 percent stack-gas oxygen concentration, if any process boiler meets the capacity threshold it must meet the 3 percent capacity. The Statewide CASE Team has learned that large boiler manufacturers typically calibrate oxygen levels upon installation. These boiler systems would be verified in the same manner as boilers with capacities over 10 million Btu/h currently are. The proposed changes revise the exception based on boiler thermal efficiency, providing a consistent level for commercial and process boilers, which would further simplify the compliance process because determining what triggers the requirements would be easier. Finally, the proposed changes simplify compliance verification by clarifying that oxygen concentration should be controlled based flue gas concentration for all boilers regardless of size and application. The updated NRCC’s would clearly show what boiler systems fall under the scope of the oxygen trim control requirements.
The Statewide CASE Team will be working closely with the Energy Commission as they make updates to the compliance manual, the compliance document, and the compliance software. See Appendix D for proposed revisions to the compliance software.
2022 Title 24, Part 6 Final CASE Report – 2022-NR-HVAC3-F | 37
3. Market Analysis
3.1 Market Structure The Statewide CASE Team performed a market analysis with the goals of identifying current technology availability, current product availability, and market trends. The Statewide CASE Team then considered how the proposed standard may impact the market in general as well as individual market actors. Information was gathered about the incremental cost of complying with the proposed measures. Estimates of market size and measure applicability were identified through research and outreach with stakeholders including utility program staff, Energy Commission staff, and a wide range of industry actors. In addition to conducting personalized outreach, the Statewide CASE Team discussed the current market structure and potential market barriers during public stakeholder meetings that the Statewide CASE Team held on October 15, 2019, and March 12, 2020.
According to a report compiled by the Consortium for Energy Efficiency (CEE), the typical distribution channels for a commercial boiler includes five primary market actors: manufacturer, manufacturer representative or wholesaler, mechanical contractor, design engineer, and owner (Chapman 2015). The distribution channels for a commercial water heater consists of the same market actors, performing the same core functions. Oxygen trim controls are either sold with a new boiler or as an aftermarket add-on by a boiler controls manufacturer or manufacturer representative. When sold with a new boiler, the sales channel is the same.
In new construction, it is most common for the building owner to work with a design engineer or contractor to plan and specify the boiler or water heating system. The design engineer or contractor would then contact a manufacturer or wholesaler to purchase equipment that meets the specifications (channel 3 in Figure 5 below). Manufacturer representatives handle the majority of large boiler and water heater sales. That said, there are several other pathways in which an owner can procure a new boiler as demonstrated in the table below (Chapman 2015).
2022 Title 24, Part 6 Final CASE Report – 2022-NR-HVAC3-F | 38
Figure 3: Nonresidential boiler and service water heater distribution channels.
Source: (Chapman 2015).
Table 6 summarizes the market actors and their potential core functions for the various pathways detailed in Figure 3; the most common functions are ordered from first to last.
Table 6: Nonresidential Boiler and Service Water Heater Market Actors and Roles Market Actor Potential Core Functions Manufacturers Production Manufacturer Representative or Wholesaler
Distribution of Product, Specifying Equipment, Logistics, Installation
3.2 Technical Feasibility, Market Availability, and Current Practices 3.2.1 Gas Boiler Systems The Statewide CASE Team does not expect any technical feasibility concerns because condensing boilers are a mature technology. The proposed minimum system thermal efficiency of 90 percent for gas-fired boiler systems and hot water distribution system requirements was added to ASHRAE 90.1 in 2019 as a part of Addendum BC. According to a report published by the United States General Services Administration (GSA), new construction applications space heating systems for commercial buildings can be designed for optimal use with condensing boilers (Parker and Blanchard 2012). Furthermore, the National Renewable Energy Laboratory states that condensing boilers “have been available in the marketplace for approximately 30 years” (Cutler 2014).
2022 Title 24, Part 6 Final CASE Report – 2022-NR-HVAC3-F | 39
According to data from the Air-Conditioning, Heating, and Refrigeration Institute (AHRI), there are 46 different manufacturers with gas-fired commercial boilers. Of those manufacturers, 42 have at least one model listed with a thermal efficiency of 90 percent or greater. Products are widely available by many manufacturers that would meet the system efficiency requirements for the proposed measure. The Statewide CASE Team received written and verbal feedback from major manufacturers: Aerco, Laars, Lochinvar and Bradford White.
The main installation considerations for this measure surround venting and condensate management. “The venting and condensate drainage must include corrosion-resistant materials. An alternative option for condensate is to incorporate a neutralization kit that will increase the pH of the condensate, allowing it to be safely disposed of down copper drains” (O'Donnell 2011). Operational requirements of a condensing system also require a Category IV vent stack that operates at positive pressure and can handle the acidic nature of the exhaust gas, therefore venting via the existing stack may not be an option for retrofits. While the venting materials are no more expensive compared to what is used on a minimally compliant boiler today, the condensate management systems are included in the incremental measure cost analysis.
The Statewide CASE Team reviewed several workpapers published by the California Public Utilities Commission (CPUC) for service water heating measure information. Workpaper WPSCGNRWH120206C, Revision 6 for Commercial Hot Water Boilers, published by SoCalGas in 2016, confirms the measure life is 20 years and the savings are persistent. As such, and because it is a conservative approach, it is expected that condensing boilers would effectively deliver savings over a full period of analysis used in the cost-effectiveness analysis presented in this report.
3.2.2 Gas Service Water Heating The Statewide CASE Team does not expect any technical feasibility concerns because condensing water heaters are a mature technology. Minimum system thermal efficiency of 90 percent for gas-fired hot water heating systems has been a part of ASHRAE 90.1 model code since 2016.
According to data from AHRI, there are 30 different manufacturers with gas-fired commercial water heaters. Of those manufacturers, 26 have at least one model listed with a thermal efficiency of 90 percent or greater. Products are widely available by many manufacturers that will meet the system efficiency requirements for the proposed measure. The Statewide CASE Team received written and verbal feedback from major manufacturers of this equipment including A.O. Smith, Bradford White, Rheem, Cleaver-Brooks, and Lochinvar.
As with condensing boilers, the main installation considerations for this measure surround venting and condensate management. “The venting and condensate drainage
2022 Title 24, Part 6 Final CASE Report – 2022-NR-HVAC3-F | 40
must include corrosion-resistant materials. An alternative option for condensate is to incorporate a neutralization kit that would increase the pH of the condensate, allowing it to be safely disposed of down copper drains” (O'Donnell 2011). Operational requirements of a condensing system also require a Category IV vent stack that operates at positive pressure and can handle the acidic nature of the exhaust gas, therefore venting via the existing stack may not be an option for retrofits. As this proposal only applies to new construction, sidewall venting is the most likely approach to address this consideration. While the venting materials are no more expensive compared to what is used on a minimally compliant water heater today, the condensate management systems are included in the incremental measure cost analysis.
The Statewide CASE Team reviewed several Workpapers published by the CPUC for service water heating measure information. PGECOHVC101, Revision 5 for Space Heating Boiler’s, published by PG&E in 2016, confirms the measure life is 20 years and the savings are persistent. Service water heating is provided by a variety of different technologies including storage, tankless and volume water heaters, as well as boilers utilizing an indirect tank. While these products may experience different expectant useful lifetimes, these condensing products last as long as standard efficiency models. Furthermore, as the workpaper indicates, performance does not decline over the effective useful life due to the nature of condensing technology.
3.2.3 Oxygen Concentration The Statewide CASE Team does not expect any technical feasibility concerns because oxygen concentration controls are a mature technology. Specifically, oxygen concentration requirements for process and commercial boilers were added to Title 24, Part 6 in the 2013 cycle. Boilers with capacities between 5-10 Million Btu/h are required achieve oxygen concentrations of 5 percent which can be achieved through parallel positioning or oxygen trim controls; according to stakeholder feedback many of the boilers of this size achieve these requirements through oxygen trim control. Process boilers are required to achieve oxygen concentrations of 3 percent which can only be achieved through oxygen trim control. Since these oxygen concentration levels are part of current code requirements, the market is familiar with installing oxygen trim technology. The Statewide CASE Team engaged manufacturers of this equipment including Autoflame, Patterson-Kelly and Clever-Brooks, but there is no known comprehensive database of oxygen trim controls manufacturers.
Oxygen trim controls have an expected life equal to the boiler measure, in this case 15 years. Additionally, energy savings from this measure would persist over the life of the system (CPUC 2011).
2022 Title 24, Part 6 Final CASE Report – 2022-NR-HVAC3-F | 41
3.3 Market Impacts and Economic Assessments 3.3.1 Impact on Builders Builders of residential and commercial structures are directly impacted by many of the measures proposed by the Statewide CASE Team for the 2022 code cycle. It is within the normal practices of these businesses to adjust their building practices to changes in building codes. When necessary, builders engage in continuing education and training in order to remain compliant with changes to design practices and building codes.
California’s construction industry is comprised of about 80,000 business establishments and 860,000 employees (see Table 7).1 In 2018, total payroll was $80 billion. Nearly 60,000 of these business establishments and 420,000 employees are engaged in the residential building sector, while another 17,000 establishments and 344,000 employees focus on the commercial sector. The remainder of establishments and employees work in industrial, utilities, infrastructure, and other heavy construction (industrial sector).
Table 7: California Construction Industry, Establishments, Employment, and Payroll Construction Sectors Establish
ments Employ
ment Annual Payroll
(billions $) Commercial 17,273 343,513 $27.8 Commercial Building Construction 4,508 75,558 $6.9 Building Equipment Contractors 6,015 128,812 $10.9 Industrial, Utilities, Infrastructure, & Other 4,103 96,550 $9.2 Industrial Building Construction 299 5,864 $0.5
Source: (State of California, Employment Development Department n.d.)
The proposed changes to boiler and service water heating thermal efficiency and oxygen concentration levels would likely affect commercial and industrial builders. The effects on the residential and commercial building industry would not be felt by all firms and workers, but rather would be concentrated in specific industry subsectors. Table 8 shows the commercial building subsectors the Statewide CASE Team expects to be impacted by the changes proposed in this report. Chiefly, contractors that focus on space heating and service heating equipment would be impacted by this proposal. The
1 Average total monthly employment in California in 2018 was 18.6 million; the construction industry represented 4.5 percent of 2018 employment.
2022 Title 24, Part 6 Final CASE Report – 2022-NR-HVAC3-F | 42
Statewide CASE Team’s estimates of the magnitude of these impacts are shown in Section 3.4.
Table 8: Specific Subsectors of the California Commercial Building Industry Impacted by Proposed Change to Code/Standard Construction Subsector Establish
ments Employ
ment Annual Payroll
(billions $) Commercial Building Construction 4,508 75,558 $7.0 Nonresidential plumbing and HVAC contractors 2,394 52,977 $4.5
Source: (State of California, Employment Development Department n.d.)
3.3.2 Impact on Building Designers and Energy Consultants Adjusting design practices to comply with changing building codes practices is within the normal practices of building designers. Building codes (including the California Energy Code) are typically updated on a three-year revision cycle and building designers and energy consultants engage in continuing education and training in order to remain compliant with changes to design practices and building codes.
Businesses that focus on residential, commercial, institutional, and industrial building design are contained within the Architectural Services sector (North American Industry Classification System 541310). Table 9 shows the number of establishments, employment, and total annual payroll for Building Architectural Services. The code change proposals would potentially impact all firms within the Architectural Services sector. The Statewide CASE Team anticipates the impacts for this measure to affect firms that focus on nonresidential construction.
There is not a North American Industry Classification System (NAICS)2 code specific for energy consultants. Instead, businesses that focus on consulting related to building energy efficiency are contained in the Building Inspection Services sector (NAICS 541350), which is comprised of firms primarily engaged in the physical inspection of
2 NAICS is the standard used by Federal statistical agencies in classifying business establishments for the purpose of collecting, analyzing, and publishing statistical data related to the U.S. business economy. NAICS was development jointly by the U.S. Economic Classification Policy Committee (ECPC), Statistics Canada, and Mexico's Instituto Nacional de Estadistica y Geografia, to allow for a high level of comparability in business statistics among the North American countries. NAICS replaced the Standard Industrial Classification (SIC) system in 1997.
2022 Title 24, Part 6 Final CASE Report – 2022-NR-HVAC3-F | 43
residential and nonresidential buildings.3 It is not possible to determine which business establishments within the Building Inspection Services sector are focused on energy efficiency consulting. The information shown in Table 9 provides an upper bound indication of the size of this sector in California.
Table 9: California Building Designer and Energy Consultant Sectors Sector Establishments Employment Annual Payroll
(billions $) Architectural Services a 3,704 29,611 $2.9 Building Inspection Services b 824 3,145 $0.2
Source: (State of California, Employment Development Department n.d.)
a. Architectural Services (NAICS 541310) comprises private-sector establishments primarily engaged in planning and designing residential, institutional, leisure, commercial, and industrial buildings and structures;
b. Building Inspection Services (NAICS 541350) comprises private-sector establishments primarily engaged in providing building (residential & nonresidential) inspection services encompassing all aspects of the building structure and component systems, including energy efficiency inspection services.
3.3.3 Impact on Occupational Safety and Health The proposed code change does not alter any existing federal, state, or local regulations pertaining to safety and health, including rules enforced by the California Division of Occupational Safety and Health (Cal/OSHA). All existing health and safety rules would remain in place. Complying with the proposed code change is not anticipated to have adverse impacts on the safety or health of occupants or those involved with the construction, commissioning, and maintenance of the building.
All proposed code changes would apply to healthcare facilities.
3.3.4 Impact on Building Owners and Occupants
Commercial Buildings The commercial building sector includes a wide array of building types, including offices, restaurants and lodging, retail, and mixed-use establishments, and warehouses
3 Establishments in this sector include businesses primarily engaged in evaluating a building’s structure and component systems and includes energy efficiency inspection services and home inspection services. This sector does not include establishments primarily engaged in providing inspections for pests, hazardous wastes or other environmental contaminates, nor does it include state and local government entities that focus on building or energy code compliance/enforcement of building codes and regulations.
2022 Title 24, Part 6 Final CASE Report – 2022-NR-HVAC3-F | 44
(including refrigerated) (Kenney 2019). Energy use by occupants of commercial buildings also varies considerably with electricity used primarily for lighting, space cooling and conditioning, and refrigeration. Natural gas consumed primarily for heating water and for space heating. According to information published in the 2019 California Energy Efficiency Action Plan, there is more than 7.5 billion square feet of commercial floor space in California and consumes 19 percent of California’s total annual energy use (Kenney 2019). The diversity of building and business types within this sector creates a challenge for disseminating information on energy and water efficiency solutions, as does the variability in sophistication of building owners and the relationships between building owners and occupants.
Building owners and occupants would benefit from lower energy bills. As discussed in Section 3.4.1, when building occupants save on energy bills, they tend to spend it elsewhere in the economy thereby creating jobs and economic growth for the California economy. The Statewide CASE Team does not expect the proposed code change for the 2022 code cycle to impact building owners or occupants adversely.
3.3.5 Impact on Building Component Retailers (Including Manufacturers and Distributors)
The Statewide CASE Team does not expect widespread changes to the boiler, service water heating, or oxygen concentration technology markets. As noted in Section 3.2, the technologies that meet these proposed requirements are mature and only a portion of the market would be impacted due to the respective capacity thresholds.
3.3.6 Impact on Building Inspectors Table 10 shows employment and payroll information for state and local government agencies in which many inspectors of residential and commercial buildings are employed. Building inspectors participate in continuing training to stay current on all aspects of building regulations, including energy efficiency. The Statewide CASE Team, therefore, anticipates the proposed change would have no impact on employment of building inspectors or the scope of their role conducting energy efficiency inspections.
2022 Title 24, Part 6 Final CASE Report – 2022-NR-HVAC3-F | 45
Table 10: Employment in California State and Government Agencies with Building Inspectors Sector Govt. Establishments Employment Annual Payroll
(millions $) Administration of Housing Programsa
State 17 283 $29.0 Local 36 2,882 $205.7
Urban and Rural Development Adminb
State 35 552 $48.2 Local 52 2,446 $186.6
Source: (State of California, Employment Development Department n.d.)
a. Administration of Housing Programs (NAICS 925110) comprises government establishments primarily engaged in the administration and planning of housing programs, including building codes and standards, housing authorities, and housing programs, planning, and development.
b. Urban and Rural Development Administration (NAICS 925120) comprises government establishments primarily engaged in the administration and planning of the development of urban and rural areas. Included in this industry are government zoning boards and commissions. Impact on Statewide Employment
As described in Sections 3.3.1 through 3.3.6, the Statewide CASE Team does not anticipate significant employment or financial impacts to any particular sector of the California economy. This is not to say that the proposed change would not have modest impacts on employment in California. In Section 3.4, the Statewide CASE Team estimates that the proposed change would affect statewide employment and economic output directly and indirectly through its impact on builders, designers and energy consultants, and building inspectors. In addition, it is estimated how energy savings associated with the proposed changes in boiler and service water heating thermal efficiency would lead to modest ongoing financial savings for California residents, which would then be available for other economic activities.
3.4 Economic Impacts For the 2022 code cycle, the Statewide CASE Team used the IMPLAN model software, along with economic information from published sources, and professional judgement to developed estimates of the economic impacts associated with each proposed code changes.4 While this is the first code cycle in which the Statewide CASE Team develops estimates of economic impacts using IMPLAN, it is important to note that the economic impacts developed for this report are only estimates and are based on limited and to some extent speculative information. In addition, the IMPLAN model provides a
4 IMPLAN (Impact Analysis for Planning) software is an input-output model used to estimate the economic effects of proposed policies and projects. IMPLAN is the most commonly used economic impact model due to its ease of use and extensive detailed information on output, employment, and wage information.
2022 Title 24, Part 6 Final CASE Report – 2022-NR-HVAC3-F | 46
relatively simple representation of the California economy and, though the Statewide CASE Team is confident that direction and approximate magnitude of the estimated economic impacts are reasonable, it is important to understand that the IMPLAN model is a simplification of extremely complex actions and interactions of individual, businesses, and other organizations as they respond to changes in energy efficiency codes. In all aspect of this economic analysis, the CASE Authors rely on conservative assumptions regarding the likely economic benefits associated with the proposed code change. By following this approach, the economic impacts presented below represent lower bound estimates of the actual impacts associated with this proposed code change.
Adoption of this code change proposal would result in relatively modest economic impacts through the additional direct spending by those in the commercial building industry, architects, energy consultants, and building inspectors. The Statewide CASE Team does not anticipate that money saved by commercial building owners or other organizations affected by the proposed 2022 code cycle regulations would result in additional spending by those businesses.
Table 11: Estimated Impact that Adoption of the Proposed Measure would have on the California Commercial Construction Sector Type of Economic Impact Employment
(jobs) Labor
Income (millions
$)
Total Value
Added (millions
$)
Output (millions
$)
Direct Effects (Additional spending by Commercial Builders) 78 $5.15 $6.83 $11.30 Indirect Effect (Additional spending by firms supporting Commercial Builders) 17 $1.23 $1.96 $3.79 Induced Effect (Spending by employees of firms experiencing “direct” or “indirect” effects) 34 $1.91 $3.42 $5.58 Total Economic Impacts 129 $8.30 $12.21 $20.66
Source: Analysis by Evergreen Economics of data from the IMPLAN V3.1 modeling software.
2022 Title 24, Part 6 Final CASE Report – 2022-NR-HVAC3-F | 47
Table 12: Estimated Impact that Adoption of the Proposed Measure would have on the California Building Designers and Energy Consultants Sectors Type of Economic Impact Employ
ment (jobs)
Labor Income
(millions $)
Total Value Added
(millions $)
Output (millions
$)
Direct Effects (Additional spending by Building Designers & Energy Consultants) 2 $0.23 $0.23 $0.41 Indirect Effect (Additional spending by firms supporting Bldg. Designers & Energy Consult.) 1 $0.09 $0.13 $0.20 Induced Effect (Spending by employees of firms experiencing “direct” or “indirect” effects) 2 $0.10 $0.17 $0.28 Total Economic Impacts 5 $0.42 $0.53 $0.89
Source: Analysis by Evergreen Economics of data from the IMPLAN V3.1 modeling software.
Table 13: Estimated Impact that Adoption of the Proposed Measure would have on California Building Inspectors Type of Economic Impact Employ
ment (jobs)
Labor Income
(millions $)
Total Value Added
(millions $)
Output (millions
$)
Direct Effects (Additional spending by Building Inspectors) 2 $0.16 $0.19 $0.23 Indirect Effect (Additional spending by firms supporting Building Inspectors) 0 $0.01 $0.02 $0.04 Induced Effect (Spending by employees of Building Inspection Bureaus and Departments) 1 $0.05 $0.09 $0.15 Total Economic Impacts 3 $0.22 $0.30 $0.41
Source: Analysis by Evergreen Economics of data from the IMPLAN V3.1 modeling software.
3.4.1 Creation or Elimination of Jobs The Statewide CASE Team does not anticipate that code changes proposed for the 2022 code cycle would lead to the creation of new types of jobs or the elimination of existing types of jobs. In other words, the Statewide CASE Team’s proposed change would not result in economic disruption to any sector of the California economy. Rather, the estimates of economic impacts discussed in Section 3.4 would lead to modest changes in employment of existing jobs.
2022 Title 24, Part 6 Final CASE Report – 2022-NR-HVAC3-F | 48
3.4.2 Creation or Elimination of Businesses in California As stated in Section 3.4.1, the Statewide CASE Team’s proposed change would not result in economic disruption to any sector of the California economy. The proposed change represents a modest change to space heating and service water heating systems which would not excessively burden or competitively disadvantage California businesses – nor would it necessarily lead to a competitive advantage for California businesses. Therefore, the Statewide CASE Team does not foresee any new businesses being created or eliminated due to the proposed code changes to the California Energy Code.
3.4.3 Competitive Advantages or Disadvantages for Businesses in California The code changes for the 2022 code cycle would apply to all businesses incorporated in California, regardless of whether the business is located inside or outside of the state.5 Therefore, the Statewide CASE Team does not anticipate that these measures proposed for the 2022 code cycle regulation would have an adverse effect on the competitiveness of California businesses. Likewise, the Statewide CASE Team does not anticipate businesses located outside of California would be advantaged or disadvantaged.
3.4.4 Increase or Decrease of Investments in the State of California The Statewide CASE Team analyzed national data on corporate profits and capital investment by businesses that expand a firm’s capital stock (referred to as net private domestic investment, or NPDI).6 As Table 14 shows. between 2015 and 2019, NPDI as a percentage of corporate profits ranged from 26 to 35 percent, and the average was 31 percent. While only an approximation of the proportion of business income used for net capital investment, the Statewide CASE Team believes it provides a reasonable estimate of the proportion of proprietor income that would be reinvested by business owners into expanding their capital stock.
5 Gov. Code, §§ 11346.3(c)(1)(C), 11346.3(a)(2); 1 CCR § 2003(a)(3) Competitive advantages or disadvantages for California businesses currently doing business in the state. 6 Net private domestic investment is the total amount of investment in capital by the business sector that is used to expand the capital stock, rather than maintain or replace due to depreciation. Corporate profit is the money left after a corporation pays its expenses.
2022 Title 24, Part 6 Final CASE Report – 2022-NR-HVAC3-F | 49
Table 14: Net Domestic Private Investment and Corporate Profits, U.S. Year Net Domestic Private
5-Year Average 31% Source: (Federal Reserve Economic Data n.d.)
The Statewide CASE Team does not anticipate that the economic impacts associated with the proposed measure would lead to significant change (increase or decrease) in investment in any directly or indirectly affected sectors of California’s economy. Nevertheless, the Statewide CASE Team is able to derive a reasonable estimate of the change in investment by California businesses by multiplying the sum of Business Income estimated in Table 10 through Table 13 above by 31 percent.
3.4.5 Effects on the State General Fund, State Special Funds, and Local Governments
The Statewide CASE Team does not expect the proposed code changes to have a measurable impact on the California’s General Fund, any state special funds, or local government funds.
3.4.5.1 Cost of Enforcement Cost to the State
State government already has budget for code development, education, and compliance enforcement. While state government would be allocating resources to update the Title 24, Part 6 Standards, including updating education and compliance materials and responding to questions about the revised requirements, these activities are already covered by existing state budgets. The costs to state government are small when compared to the overall costs savings and policy benefits associated with the code change proposals. This proposal may increase costs to construct state buildings such as large offices, but as shown in Section 5.2, all submeasures are cost-effective.
Cost to Local Governments
All revisions to Title 24, Part 6 would result in changes to compliance determinations. Local governments would need to train building department staff on the revised Title 24, Part 6 Standards. While this re-training is an expense to local governments, it is not a new cost associated with the 2022 code change cycle. The building code is updated on
2022 Title 24, Part 6 Final CASE Report – 2022-NR-HVAC3-F | 50
a triennial basis, and local governments plan and budget for retraining every time the code is updated. There are numerous resources available to local governments to support compliance training that can help mitigate the cost of retraining, including tools, training and resources provided by the IOU codes and standards program (such as Energy Code Ace). As noted in Section 2.5 and Appendix E, the Statewide CASE Team considered how the proposed code change might impact various market actors involved in the compliance and enforcement process and aimed to minimize negative impacts on local governments.
3.4.6 Impacts on Specific Persons While the objective of any of the Statewide CASE Team’s proposal is to promote energy efficiency, the Statewide CASE Team recognizes that there is the potential that a proposed update to the 2022 code cycle may result in unintended consequences. The Statewide CASE Team does not believe there would be negative impacts towards one any specific persons as a result of this code change proposal.
2022 Title 24, Part 6 Final CASE Report – 2022-NR-HVAC3-F | 51
4. Energy Savings
4.1 Key Assumptions for Energy Savings Analysis The energy and cost analysis presented in this report used the TDV factors that are consistent with the TDV factors presented during the Energy Commission’s March 27, 2020 workshop on compliance metrics (California Energy Commission 2020). The electricity TDV factors include the 15 percent retail adder and the natural gas TDV factors include the impact of methane leakage on the building site. The electricity TDV factors used in the energy savings analyses were obtained via email from Energy and Environmental Economics, Inc. (E3), the contractor that is developing the 2022 TDV factors for the Energy Commission, in a spreadsheet titled “Electric TDVs 2022 - 15 pct Retail Adj Scaled by Avoided Costs.xlsx”. The natural gas TDV factors used in the energy savings analyses were obtained via email from E3 in a spreadsheet titled “2022_TDV_Policy_Compliant_CH4Leak_FlatRtlAdd_20191210.xlsx”. The electricity demand factors used in the energy savings analysis were obtained via email from E3 in a spreadsheet titled “2022 TDV Demand Factors.xlsx”. The Energy Commission notified the Statewide CASE Team on April 21, 2020 that they were investigating further refinements to TDV factors using 20-year global warming potential (GWP) values instead of the 100-year GWP values that were used to derive the current TDV factors. It is anticipated that the 20-year GWP values would increase the TDV factors slightly. As a result, the TDV energy savings presented in this report are lower than the values that are expected if the final TDV use 20-year GWP values, and the proposed code changes would be more cost effective using the revised TDV. Energy savings presented in kWh and therms are not affected by TDV or demand factors.
The Statewide CASE Team used EnergyPlus to conduct the energy savings for the gas boiler systems and gas service water heating proposals. Spreadsheet analysis was used for the process boilers proposal. Energy models are sourced from the California Building Energy Code Compliance (CBECC) software for commercial buildings (CBECC-Com) prototypical building models and are modified to include the proposed changes to the energy standards. The high-rise mixed-use prototype was sourced from CBECC software for residential buildings (CBECC-Res). The hospital model is sourced from the Department of Energy’s (DOE) Commercial Porotype Buildings ASHRAE 90.1-2016 database. The baseline model is generated for these building types by modifying the DOE models with the 2019 Title 24, Part 6 mandatory and prescriptive HVAC requirements.
2022 Title 24, Part 6 Final CASE Report – 2022-NR-HVAC3-F | 52
4.1.1 Gas Boiler Systems The energy savings analysis compares the proposed prescriptive requirement of 90 percent thermal efficiency gas boiler systems to the current efficiency requirement of 80 percent. All other components of the existing conditions are assumed to be minimally compliant with the 2019 Title 24, Part 6 Standards. The CBECC and DOE building prototypes assume that the boiler thermal efficiency is solely a function of boiler part-load ratio (PLR). PLR is defined as the boiler capacity at part load conditions divided by the boiler capacity at design conditions. The default boiler performance curve is used to determine the boiler fuel consumption at a given PLR (Equation 1). The values of coefficients C1, C2, and C3 for Standard Design boilers are listed in the ACM Appendix 5.7.
4.1.2 Service Water Heating The submeasure was evaluated using the same methodology that was used for the gas boiler system submeasure. The energy savings compare the proposed prescriptive requirement of 90 percent thermal efficiency service water heaters to the current requirement of 80 percent thermal efficiency for commercial water heaters. All other components of the existing conditions are assumed to minimally comply with the 2019 Title 24, Part 6 and the minimum appliance efficiency standards. The minimum appliance efficiency standards are defined by federal regulations and are replicated under California’s Appliance Efficiency Regulations, Title 20.
4.1.3 Process Oxygen Concentration Table 15 lists the boiler combustion efficiencies at various level of excess oxygen. Energy savings calculations for the Process Boiler Oxygen Concentration measure were performed using a spreadsheet analysis. The methodology and assumptions are described in Section 4.2.3 with key assumptions presented in
Table 31. Boiler efficiency and the impact of reduced oxygen concentration are impacted by the temperature difference between the flue gas temperature and the combustion air. For process boilers, a temperature differential between the flue gas and combustion air of 300°F was selected for both the Baseline and Proposed Design. The
2022 Title 24, Part 6 Final CASE Report – 2022-NR-HVAC3-F | 53
higher temperature differential for process boilers, as opposed to commercial boilers, reflects the temperatures at which these boilers are typically operated as process boilers can be generating either hot water or steam. Table 15 summarizes the impacts of flue gas temperature and oxygen concentration on combustion efficiency. Combustion efficiency of 82.1 percent was selected for the baseline. This level reflects the efficiency of a minimally compliant boiler operating at 5 percent oxygen concentration. For the Proposed Design, the combustion efficiency of a minimally compliant boiler increases to 82.8 percent when operating with the proposed 3 percent excess oxygen. The calculation was conducted for a 5 million Btu/h boiler. This calculation is slightly conservative (under-estimates savings) as with less excess air the residence time of the gas is longer and flue gas temperature drops slightly.
Table 15: Combustion Efficiency Table for Natural Gas
Source: (Campbell-Sevey n.d.)
4.2 Energy Savings Methodology per Prototypical Building The Energy Commission directed the Statewide CASE Team to model the energy impacts using specific prototypical building models that represent typical building geometries for different types of buildings (California Energy Commission 2019). The prototype buildings that the Statewide CASE Team used in the analysis are presented in Table 16, Table 17, and Table 18.
The Statewide CASE Team estimated energy and demand impacts by simulating the proposed code change using the 2022 Research Version of CBECC-Com, CBECC-Res, and DOE building prototypes (California Energy Commission 2020a).
CBECC and the DOE prototypes generate two models based on user inputs: the Standard Design and the Proposed Design. The Standard Design represents the geometry of the design that the builder would like to build and inserts a defined set of features that result in an energy budget that is minimally compliant with 2019 Title 24, Part 6 code requirements. Features used in the Standard Design are described in the
Excess percent Combustion Efficiency Flue Gas Temperature Minus Combustion Air
2022 Title 24, Part 6 Final CASE Report – 2022-NR-HVAC3-F | 54
2019 Nonresidential ACM Reference Manual. The Proposed Design represents the same geometry as the Standard Design, but it assumes the energy features that the software user describes with user inputs. To develop savings estimates for the proposed code changes, the Statewide CASE Team created a Standard Design and Proposed Design for each prototypical building.
CBECC and the DOE prototypes calculate whole-building energy consumption for every hour of the year measured in kilowatt-hours per year (kWh/yr) and therms per year (therms/yr). It then applies the 2022 TDV factors to calculate annual energy use in kilo British thermal units per year (TDV kBtu/yr) and annual peak electricity demand reductions measured in kW. CBECC-Com also generates TDV energy cost savings values measured in 2023 PV$ and nominal dollars.
Savings for all four submeasures vary by climate zone, so the Statewide CASE calculated energy savings in each of the 16 California climate zones and used the climate-specific TDV factors when calculating TDV energy and energy cost impacts for every submeasure.
Per-unit energy impacts for nonresidential buildings are presented in savings per square foot. Annual energy and peak demand impacts for each prototype building were translated into impacts per square foot by dividing by the floor area of the prototype building. This step allows for an easier comparison of savings across different building types and enables a calculation of statewide savings using the construction forecast that is published in terms of floor area by building type.
CBECC-Res was used to model High Rise Mixed Use prototype building for the gas boiler system and gas service water heating submeasure and the hospital building prototype was sourced from the DOE prototype building models Per-unit energy impacts for multifamily buildings are presented in savings per dwelling unit. Annual energy and peak demand impacts for each prototype building were translated into impacts per dwelling unit by dividing by the number of dwelling units in the prototype building. This step enables a calculation of statewide savings using the construction forecast that is published in terms of number of multifamily dwelling units by climate zone.
4.2.1 Gas Boiler Systems Because the submeasure proposes to increase the minimum thermal efficiency for high-capacity boiler systems(1 – 10 Million Btu/h) to a weighted-thermal efficiency of 90 percent (90 percent Et), the energy modeling is only conducted for the prototypical building models with the total boiler capacity between 1 – 10 million Btu/h. For the prototype buildings, modeling was conducted for those building types that are expected to have some subset achieve the capacity thresholds (i.e. have a hot water system for space heating that has a combined input capacity greater than 1 million Btu/h). While only the Large Office prototype has a capacity above the threshold, for other prototype
2022 Title 24, Part 6 Final CASE Report – 2022-NR-HVAC3-F | 55
buildings that do not meet the thresholds, the energy savings per square foot or unit are assumed to scale as building size increases. Therefore, the cost-benefit ratios for prototype buildings are assumed to be consistent, even though the modeling was performed on prototypes below the size capacity threshold. Cost effectiveness for larger buildings may be greater than smaller ones, due to increased savings for these larger energy users. The energy savings from this submeasure varies by climate zone, so impacts were simulated in all California climate zones.
Table 16: Prototype Buildings Used for Energy, Demand, Cost, and Environmental Impacts Analysis
Prototype Name Number of
Stories
Floor Area (square
feet)
Description
HighRiseMixedUse 10 125,400 10-story (9-story residential, 1-story commercial), 117-unit building. Avg dwelling unit size: 850 ft2. Central gas storage DHW
HotelSmall 4 42,554 4 story Hotel with 77 guest rooms. WWR-11%
OfficeLarge 13 498,589 13 story + 1 basement office building with 5 zones and a ceiling plenum on each floor. Window/Wall Ratio (WWR)-0.40
OfficeMedium 3 53,628 3 story office building with 5 zones and a ceiling plenum on each floor. WWR-0.33
OfficeMediumLab 3 53,628 3 story office building with 5 zones and a ceiling plenum on each floor. WWR-0.33
SchoolSecondary 2 210866 High school with WWR of 35% and SRR 1.4%
Since CBECC-Com does not yet support all configurations of high efficiency boilers, this measure was modeled by modifying the baseline EnergyPlus input file generated by CBECC-Com and running the modified input file in EnergyPlus.
There is an existing Title 24, Part 6 requirement that covers the building system in question and applies to both new construction and alterations, so the Standard Design is minimally compliant with the 2019 Title 24, Part 6 requirements. In the updated Table 110.2-K in Section 110.2 that complies with the most recent federal changes – mandatory requirements for space conditioning equipment, the minimum thermal efficiency (Et) is 80 percent for all gas boilers with capacities between 300,000 and 2.5 million Btu/h to reflect current standards.
The Proposed Design was identical to the Standard Design in all ways except for the revisions that represent the proposed changes to the code. Table 17 presents precisely which parameters were modified and what values were used in the Standard Design
2022 Title 24, Part 6 Final CASE Report – 2022-NR-HVAC3-F | 56
and Proposed Design. Specifically, the proposed conditions assume 90 percent boiler efficiency for all the climate zones.
Comparing the energy impacts of the Standard Design to the Proposed Design reveals the impacts of the proposed code change relative to a building that is minimally compliant with the 2019 Title 24, Part 6 requirements.
Table 17: Modifications Made to Standard Design in Each Prototype to Simulate Proposed Code Change Prototype ID Climate
Zone Parameter Name Standard
Design Parameter
Value (Percent)
Proposed Design
Parameter Value
(Percent) HighRiseMixedUse All Nominal Thermal
Efficiency 80% 90%
HotelSmall All Nominal Thermal Efficiency
80% 90%
OfficeLarge All Nominal Thermal Efficiency
80% 90%
OfficeMedium All Nominal Thermal Efficiency
80% 90%
OfficeMediumLab All Nominal Thermal Efficiency
80% 90%
SchoolSecondary All Nominal Thermal Efficiency
80% 90%
4.2.2 Gas Service Water Heating Because the submeasure proposes to increase the minimum thermal efficiency for service water heaters between 1 and 10 million Btu/h to a weighted-thermal efficiency of 90 percent (90%Et), the energy modeling is initially conducted for the prototypical building models with the total water heating capacity of that size. While none of prototype building meet this threshold, the modeling was conducted for those building types that are expected to have some subset achieve the capacity thresholds. The detailed analysis presented in Appendix A demonstrates how the percent of impacted statewide floor area was determined. The energy savings per square foot or unit are assumed to scale as building size increases. Because the incremental cost is based on a per MBtu/h basis, these costs also scale as size increases. Therefore, the cost-benefit ratios for prototype buildings are assumed to be consistent, even though the modeling was performed on prototypes below the size capacity threshold. Cost-effectiveness for larger buildings may be greater than smaller ones, due to increased savings for these larger energy users. The energy savings from this submeasure varies by climate zones.
2022 Title 24, Part 6 Final CASE Report – 2022-NR-HVAC3-F | 57
Table 18: Prototype Buildings Used for Energy, Demand, Cost, and Environmental Impacts Analysis
Prototype Name Number of Stories
Floor Area (square feet)
Description
HighRiseMixedUse 10 125,400 10-story (9-story residential, 1-story commercial), 117-unit building. Avg dwelling unit size: 850 ft2. Central gas storage DHW
Apartment High Rise
10 93,632 10 story apartment building with a basement and elevator penthouse, 75 residential units and other common spaces including lobby, office, multipurpose room, exercise center, laundry and storage
School Secondary 2 210,866 High school with WWR of 35% and SRR 1.4%
Small Hotel 4 42,554 4 story Hotel with 77 guest rooms. WWR-11%
Since CBECC-Com does not yet support all configurations for service water heating, this measure was modeled by modifying the baseline EnergyPlus input file generated by CBECC-Com and running the modified input file in EnergyPlus.
There is an existing Title 24, Part 6 requirement that covers the building system in question and applies to both new construction and alterations, so the Standard Design is minimally compliant with the 2019 Title 24, Part 6 requirements. As indicated in Section 110.3- Mandatory Requirements for Service Water-Heating Systems and Equipment, equipment shall meet the applicable requirements of the federal standards which are replicated in the Appliance Efficiency Regulations, Title 20, as required by Section 110.1 of Title 24, Part 6. In Table F-4 of Section 1605.1(f) in Title 20, the minimum thermal efficiency is 80 percent for large gas water heaters that are a gas storage water heater with an input larger than 75,000 Btu per hour and a gas instantaneous water heater with an input larger than 200,000 Btu per hour.
The Proposed Design was identical to the Standard Design in all ways except for the revisions that represent the proposed changes to the code. Table 19 presents which parameters were modified and what values were used in the Standard Design and Proposed Design. Specifically, the proposed conditions assume 90 percent water heater efficiency for all climate zones.
Comparing the energy impacts of the Standard Design to the Proposed Design reveals the impacts of the proposed code change relative to a building that is minimally compliant with the 2019 Title 24, Part 6 requirements.
2022 Title 24, Part 6 Final CASE Report – 2022-NR-HVAC3-F | 58
Table 19: Modifications Made to Standard Design in Each Prototype to Simulate Proposed Code Change Prototype ID Climate
Zone Parameter Name Standard
Design Parameter
Value (Percent)
Proposed Design
Parameter Value
(Percent) HighRiseMixedUse All Nominal Thermal
Efficiency 80% 90%
Apartment High Rise
All Nominal Thermal Efficiency
80% 90%
Secondary School All Nominal Thermal Efficiency
80% 90%
Small Hotels All Nominal Thermal Efficiency
80% 90%
CBECC calculates whole-building energy consumption for every hour of the year measured in kilowatt-hours per year (kWh/yr) and therms per year (therms/yr). It then applies the 2022 TDV factors to calculate annual energy use in kilo British thermal units per year (TDV kBtu/yr) and annual peak electricity demand reductions measured in kW. CBECC also generates TDV energy cost savings values measured in 2023 PV$ and nominal dollars.
4.2.3 Process Oxygen Concentration For process boilers, the submeasure was evaluated using a spreadsheet analysis. This analysis was done independent of climate zones as the loads are dominated by processes rather than climate. The following assumptions were used:
• Boiler capacity: The proposed code change would impact boilers with a capacity range between 5 and 10 million Btu/hr. The Statewide CASE Team calculated per unit impacts of a 5 million Btu/h boiler to demonstrate cost effectiveness using the capacity that will have the lowest benefit-to-cost ratio. The Statewide CASE Team also calculated per unit impacts of a 7.5 million Btu/h boiler, which represents the middle of the capacity range and represents a better estimate for statewide savings calculations. The average capacity of the process boilers is 7.5 million Btu/h. Results from the 5 million Btu/hr boiler are presented in Table 34 and results from the 7.5 million Btu/hr boiler are presented in Table 79.
• Standard Design thermal efficiency: Standard Design excess air is 28 percent (or 5 percent excess oxygen) and Combustion efficiency is 82.1 percent, based on the relationship between excess oxygen and combustion efficiency, as found in Table 15.
• Proposed Design thermal efficiency: Proposed Design excess air is 15 percent (or 3 percent excess oxygen) and Combustion efficiency is 82.8 percent, based
2022 Title 24, Part 6 Final CASE Report – 2022-NR-HVAC3-F | 59
on the relationship between excess oxygen and combustion efficiency, as found in Table 15
• Net temperature difference (stack temp – intake temp) is 300˚F, a conservative estimate, and the impacts on combustion efficiency based on oxygen concentration is captured in Table 15.
• Operation hours: 5333 hrs/year boiler operation (14.6-hour shift x 365 days/year). This assumption is conservative as DOE reported that process boilers operate 8000 hours annually to serve process loads (DOE 2012).
• Fuel is natural gas at 239 TDVkBtu/therm. This is the TDV value averaged over 8760 hours among 16 climate zones.
• 15-Year present value (PV) adjustment factor is 0.089 $/TDVkBtu The annual energy and cost savings realized by implementing this submeasure are given by:
4.3 Statewide Energy Savings Methodology The per-unit energy impacts were extrapolated to statewide impacts using the Statewide Construction Forecasts provided by the Energy Commission (California Energy Commission Building Standards Office n.d.). The Statewide Construction Forecasts estimate new construction that will occur in 2023, the first year that the 2022 Title 24, Part 6 requirements are in effect. It also estimates the size of the total existing building stock in 2023 that the Statewide CASE Team used to approximate savings from building alterations. The construction forecast provides construction (new construction and existing building stock) by building type and climate zone. The building types used in the construction forecast, Building Type ID, are not identical to the prototypical building types available in CBECC-Com, so the Energy Commission provided guidance on which prototypical buildings to use for each Building Type ID when calculating statewide energy impacts. Table 20 presents the prototypical buildings and weighting factors that the Energy Commission requested the Statewide CASE Team use for each Building Type ID in the Statewide Construction Forecast.
2022 Title 24, Part 6 Final CASE Report – 2022-NR-HVAC3-F | 60
To determine the approximate building square footage impacted by these proposals, the Statewide CASE Team first analyzed the assumed boiler and service water heating capacities in the CBECC and DOE building prototypes. If these capacities triggered the respective submeasure thresholds, all square footage of new construction of that building type was assumed to be impacted by the proposal. If not, the Statewide CASE Team calculated an energy intensity per square foot of the given building type and determined a square footage threshold that was needed to trigger the requirement. Then, the Statewide CASE Team analyzed Commercial Building Energy Consumption Survey micro grain data from the US Department of Energy to determine a percentage of square footage that was in buildings met the calculated square footage threshold.
The number of annual installed process boilers is 151 and the capacity range is between 5 to 10 million Btu/h per communication with stakeholders. See Appendix A for background information on how this number was determined.
Appendix A presents additional information about the methodology and assumptions used to calculate statewide energy impacts.
2022 Title 24, Part 6 Final CASE Report – 2022-NR-HVAC3-F | 61
Table 20: Nonresidential Building Types and Associated Prototype Weighting Building Type ID from Statewide Construction Forecast
4.4 Per-Unit Energy Impacts Results Energy savings and peak demand reductions per square foot are presented in Table 21 through Table 32 for the boilers and service water heating submeasures. Table 34 presents savings for the proposed process boiler oxygen concentration requirements. The per-unit energy savings figures do not account for naturally occurring market adoption or compliance rates. For service water heating, per-unit savings for the first year are expected to be 0.00136 therms/yr. For boilers systems, per-unit savings for the first year are expected to range from 0.001 to 0.007 therms/yr depending upon climate zone. For all of the submeasures, there are no demand reductions or increases, as this measure does not impact electricity use. The process boiler oxygen trim proposal is not expected to have per-unit savings that vary by climate zone.
Together, these measures address the largest gas loads, space, water and process heating, for the largest energy users. Furthermore, while occupant behavior can impact
2022 Title 24, Part 6 Final CASE Report – 2022-NR-HVAC3-F | 62
energy savings, higher use applications would realize greater savings. The savings estimates for boiler systems are conservative as the baseline assumes efficient system performance, beyond rated boiler performance, while the proposed measure includes return water and flow rate requirements to ensure the operational system performance matches the rated efficiency.
On a per square foot basis, the gas boiler system submeasures saves, by a wide margin, the most energy out of all the submeasures assessed.The boiler and service water heating efficiency submeasures vary by climate zone since space heating boilers are run times are influenced by outdoor air temperature. For service water heating, assumed input water temperatures also vary by climate zone. Initial results show that savings for the submeasures are the least in Climate Zone 15 and the most in Climate Zone 16. These results are expected in that Climate Zone 15 is mainly hot desert while Climate Zone 16 is mainly a cold mountainous area.
The proposed measures do not have any expected demand management impacts due to the limited electric impacts and nature of how these large boiler and service water heating systems are operated.
2022 Title 24, Part 6 Final CASE Report – 2022-NR-HVAC3-F | 63
4.4.1 Per-Unit Energy Impacts Results – Gas Boiler Systems
Table 21: First-Year Energy Impacts Per Dwelling Unit – High Rise Mixed Use for Gas Boiler Systems – New Construction
2022 Title 24, Part 6 Final CASE Report – 2022-NR-HVAC3-F | 76
4.4.3 Per-Unit Energy Impacts Results – Process Oxygen Concentration
Table 34: First-Year Energy Impacts – 5 Million Btu/h Process Boiler for Oxygen Concentration- New Construction and Alterations Boiler Capacity Threshold (Million Btu/h) 5 Operation Hour per Shift 14.6 Annual Operation day 365 Annual Operation Hours 5333 Baseline Combustion Efficiency 82.1% Proposed Combustion Efficiency 82.8% Standard Design Energy Consumption per Boiler (Therms/year) 324,807 Proposed Design Energy Consumption per Boiler (Therms/year) 322,061 Annual Natural Gas Savings (Therms/year) 2,746 TDVkBtu/therm 239 Annual TDV Energy Savings (TDV kBtu/year) 657,465 15-Year PV Adjustment Factor, Nonresidential ($/TDVkBtu) 0.089 15 Year Nominal Adjustment Factor, Nonresidential ($/TDVkBtu) 1.42 Total Energy Cost Savings over 15-year period of analysis (2023 PV $) 58,514 Total Energy Cost Savings over 15-year period of analysis (Nominal $) 933,600 Incremental and Maintenance Cost Over 15-year period of analysis ($) 12275.17 Benefit-to-Cost Ratio 4.8
2022 Title 24, Part 6 Final CASE Report – 2022-NR-HVAC3-F | 77
5. Cost and Cost Effectiveness
5.1 Energy Cost Savings Methodology Energy cost savings were calculated by applying the TDV energy cost factors to the energy savings estimates that were derived using the methodology described in Section 4.2.3. TDV is a normalized metric to calculate energy cost savings that accounts for the variable cost of electricity and natural gas for each hour of the year, along with how costs are expected to change over the period of analysis (30 years for residential measures and nonresidential envelope measures and 15 years for all other nonresidential measures). For this measure, proposed changes to nonresidential buildings are assessed over 15 years. The Statewide CASE Team used the high-rise mixed use multifamily prototype to explore the energy and energy cost savings associated with applying the code requirements to multifamily buildings. The TDV cost impacts are presented in 2023 present value dollars and represent the energy cost savings realized over 15 years. The savings from the apartment high rise and high-rise mixed use multifamily prototypes are presented per dwelling unit, while nonresidential savings and impacts are represented per square foot.
The boiler and service water heating measures only apply to new construction, while the oxygen concentration measure apply to newly installed boilers. The energy cost savings from newly installed boilers in existing buildings for the process oxygen concentration submeasure are same for new construction because the assumed rated boiler efficiency is the same for both applications, compliant with current code.
5.2 Energy Cost Savings Results Per-unit energy cost savings for newly constructed buildings that are realized over the 15- and 30- year period of analysis are presented in 2023 dollars in Table 35 through
Table 46. Table 48 shows the process boiler energy savings.
The TDV methodology allows peak electricity savings to be valued more than electricity savings during non-peak periods; however, there were no associate peak savings in this measure.
2022 Title 24, Part 6 Final CASE Report – 2022-NR-HVAC3-F | 78
5.2.1 Per-Unit Energy Cost Savings Results – Gas Boiler Systems
Table 35: 2023 PV TDV Energy Cost Savings Over 15-Year Period of Analysis – Per Dwelling Unit– New Construction (HighRiseMixedUse) for Gas Boiler Systems
2022 Title 24, Part 6 Final CASE Report – 2022-NR-HVAC3-F | 82
Table 39: 2023 PV TDV Energy Cost Savings Over 15-Year Period of Analysis – Per Square Foot – New Construction (OfficeMediumLab) for Gas Boiler Systems
2022 Title 24, Part 6 Final CASE Report – 2022-NR-HVAC3-F | 83
Table 40: 2023 PV TDV Energy Cost Savings Over 15-Year Period of Analysis – Per Square Foot – New Construction (SchoolSecondary) for Gas Boiler Systems
2022 Title 24, Part 6 Final CASE Report – 2022-NR-HVAC3-F | 85
Table 42: 2023 PV TDV Energy Cost Savings Over 15-Year Period of Analysis – Per Square Foot – New Construction (Apartment High Rise) for Gas Boiler Systems
2022 Title 24, Part 6 Final CASE Report – 2022-NR-HVAC3-F | 86
5.2.2 Per-Unit Energy Cost Savings Results – Gas Service Water Heating
Table 43: 2023 PV TDV Energy Cost Savings Over 15-Year Period of Analysis – Per Square Foot – New Construction (ApartmentHighRise) for Gas Service Water Heating
2022 Title 24, Part 6 Final CASE Report – 2022-NR-HVAC3-F | 87
Table 44: 2023 PV TDV Energy Cost Savings Over 15-Year Period of Analysis – Per Square Foot – New Construction (HotelSmall) for Gas Service Water Heating
2022 Title 24, Part 6 Final CASE Report – 2022-NR-HVAC3-F | 88
Table 45: 2023 PV TDV Energy Cost Savings Over 15-Year Period of Analysis – Per Square Foot – New Construction (SecondarySchool) for Gas Service Water Heating
2022 Title 24, Part 6 Final CASE Report – 2022-NR-HVAC3-F | 89
Table 46: 2023 PV TDV Energy Cost Savings Over 15-Year Period of Analysis – Per Dwelling Unit– New Construction (High Rise Mixed Use) for Gas Service Water Heating
2022 Title 24, Part 6 Final CASE Report – 2022-NR-HVAC3-F | 90
Table 47: 2023 PV TDV Energy Cost Savings Over 15-Year Period of Analysis – Per Square Foot – New Construction (Hospital) for Gas Service Water Heating
5.2.3 Per-Unit Energy Cost Savings Results – Process Oxygen Concentration
Table 48: 2023 PV TDV Energy Cost Savings Over 15-Year Period of Analysis – Per Square Foot – New Construction and Alterations for Oxygen Concentration on Process Boilers Climate Zone
15-Year TDV Electricity Cost Savings
(2023 PV$)
15-Year TDV Natural Gas Cost Savings
(2023 PV$)
Total 15-Year TDV Energy Cost Savings
(2023 PV$) All 0 13,253,500 13,253,500
5.3 Incremental First Cost 5.3.1 Gas Boiler Systems Incremental first cost is the initial cost to adopt more efficient equipment or building practices when compared to the cost of an equivalent baseline project. Therefore, it was important that the Statewide CASE Team consider first costs in evaluating overall measure cost effectiveness. Incremental first costs are based on data available today
2022 Title 24, Part 6 Final CASE Report – 2022-NR-HVAC3-F | 91
and can change over time as markets evolve and professionals become familiar with new technology and building practices.
The Statewide CASE Team reviewed several incremental measure costs (IMCs) reported by California Program Administrators in Workpapers published by the CPUC. The IMC reported in Workpaper SWHC004 for Commercial Space Heating Boiler’s was selected to represent the IMC of this proposed submeasure (CPUC 2020). This Workpaper is also used statewide in California to provide a basis for energy efficiency incentives and savings estimates. The IMC’s used in this Workpaper were developed using the “2010-2012 WO017 Ex Ante Measure Cost Study Final Report” published in 2014 and submitted to the CPUC.
The incremental first cost of this submeasure includes the increase in equipment and maintenance costs associated with a condensing boiler compared to a non-condensing boiler. Added equipment costs include larger or additional non-corrosive heat exchangers and condensate management systems to allow for recovery of additional thermal energy from the flue gas. The corrosion-resistant pipe and neutralization kit for the condensate is included in this IMC since both are required for condensing systems. The annual maintenance costs needed for the condensate neutralization kits are included in Section 5.4.1. For new construction, there is no increase in labor costs as the mechanism for condensate disposal (generally discharging directly into the drainage system) and venting requirements can be incorporated in the building design.
The baseline used to determine the IMC is a space heating boiler with a thermal efficiency of 80 percent representing equipment that is minimally compliant with federal appliance efficiency standards. Costs between products that are 80-82 percent efficient are similar. The measure selected within the CPUC Workpaper to represent a compliant boiler for the proposed standard is a condensing boiler between 0.3 and 2.5 million Btu/h with a thermal efficiency of 94 percent. Though this is above the proposed minimum system efficiency for this submeasure, this value is closer to the average thermal efficiency for condensing boilers in the AHRI database. The baseline and measure equipment details and corresponding cost data are found in Table 49 below.
2022 Title 24, Part 6 Final CASE Report – 2022-NR-HVAC3-F | 92
Table 49: Incremental Measure Equipment Cost for Nonresidential Space Heating Boilers Equipment Type Cost Description Equipment Cost
($/MBtu/h) Commercial Space Heating Water Boiler, .3 million Btu/h - 2.5 million Btu/h, ≥ 80% TE
Standard Design $14.44
Commercial Space Heating Water Boiler, .3 million Btu/h - 2.5 million Btu/h, ≥ 94% TE
Proposed Design $20.32
Incremental Measure Cost $5.88
5.3.2 Gas Service Water Heating The Statewide CASE Team reviewed several IMCs reported by California Program Administrators in Workpapers published by the CPUC. The IMC reported in Workpaper WPSCGNRWH120206C, Revision 6 for Commercial Hot Water Boilers, published by SoCalGas in 2016, was selected to represent the IMC of this proposed submeasure (SoCalGas 2016). This included reviewing “Commercial Water Heater Cost Data” or Attachment D from the Workpaper which summarizes the methodology and sources used to develop this IMC. Sources included online stores for equipment costs, data collected from California rebate programs, and other California Workpapers. This is also the same IMC published in Workpaper SWWH005 for Service and Domestic Hot Water Boilers, which was approved by the CPUC in 2020 (CPUC 2020).
The incremental cost of this submeasure includes the increase in equipment and maintenance costs associated with a condensing water heater compared to a non-condensing water heater. Added equipment costs include larger or additional heat exchangers and condensate management systems to allow for systems to recover additional thermal energy from the flue gas. The corrosion-resistant pipe and neutralization kit for the condensate are included in this IMC since both are required for condensing systems. The annual maintenance costs needed for the condensate neutralization kits is included in section 5.4.1. For new construction, there is no increase in labor costs as the mechanism for condensate disposal (generally discharging directly into the drainage system) and venting requirements can be incorporated in the building design.
The baseline used to determine this IMC is an instantaneous water heater or commercial hot water boiler with a thermal efficiency of 80 percent. This is the minimum thermal efficiency to comply with the current code. Additionally, the CPUC 2016 Workpaper selected an instantaneous water heater or commercial hot water boiler as a baseline which is the expected equipment type for a building requiring between 1 and 10 million Btu/h capacity. Furthermore, this was the largest capacity nonresidential
2022 Title 24, Part 6 Final CASE Report – 2022-NR-HVAC3-F | 93
service water heating measure found in the California Workpapers, therefore this should best represent the IMC for the proposed standard. The measure efficiency represents a compliant water heater if the proposed standard were in effect today. The base case and proposed equipment details and corresponding cost data are found in Table 50 below.
Table 50: Incremental Measure Equipment Cost for Nonresidential Service Water Heaters Equipment Type Cost Description Equipment Cost
($/MBtu/h) Commercial Hot Water Boiler, > 200,000 Btu/h, ≥ 80% TE
Standard Design $ 17.94
Commercial Hot Water Boiler, > 200,000 Btu/h, ≥ 90% TE
Proposed Design $ 22.01
Incremental Measure Cost $ 4.07
5.3.3 Oxygen Concentration The Statewide CASE Team determined the incremental cost through stakeholder outreach and online research. Manufacturers and distributors have determined that the added cost for buying a standard or condensing boiler versus a standard or condensing boiler with oxygen trim controls is $7500. Oxygen trim control is the only technology the Statewide CASE Team has been able to verify that can maintain 3 percent stack gas oxygen levels. Since the oxygen concentration requirements impact newly installed boilers, there is no need to analyze any other incremental cost.
5.4 Incremental Maintenance and Replacement Costs Incremental maintenance cost is the incremental cost of replacing the equipment or parts of the equipment, as well as periodic maintenance required to keep the equipment operating relative to current practices over the period of analysis. The present value of equipment maintenance costs (savings) was calculated using a three percent discount rate (d), which is consistent with the discount rate used when developing the 2022 TDV. The present value of maintenance costs that occurs in the nth year is calculated as follows:
2022 Title 24, Part 6 Final CASE Report – 2022-NR-HVAC3-F | 94
5.4.1 Gas Boiler and Service Water Heating Systems The useful life for both boilers and service water heating equipment is over 15 years. CPUC assumed a useful life of 20 years in recent Workpapers (CPUC 2011). It is assumed that equipment would not be replaced during the period of analysis.
According to the Condensing Boiler Assessment, published by the GSA in 2014, “There are additional operation and maintenance (O&M) costs to be expected from a condensing boiler plant. Specifically, condensing boilers typically require the installation of condensate neutralizers. The acidic condensate that forms when the exhaust gases are cooled below the dew point are collected from the boiler and from the exhaust stack and piped to a condensate neutralizer, where the pH is raised to a point where it may be dumped safely to a sewage drain line. The neutralizer needs to be recharged or replaced periodically to maintain this capability. Neutralizer kits are available in an assortment of capacities designed to match boiler capacities. Typical O&M requirements are to replace or recharge the neutralizers annually.” This report estimates the cost to maintain the condensate management system is $400 per year.
Using this method, the present value of the annual maintenance discounted by 3 percent over 15 years is $4,775.17.
Condensing water heaters require the same condensate neutralizers and the estimated annual incremental maintained costs are the same as for space heating boilers. This was confirmed during interviews with major equipment manufacturers.
5.4.2 Oxygen Concentration A boiler’s air/fuel ratio is adjusted during boiler tuning. This occurs during installation and start-up and during maintenance activity, which is usually once per year. This occurs during installation and start-up and during maintenance activity, usually once per year. This occurs for both the standard and proposed design but requires more time for the proposed design. The maintenance cost for the standard design is 4 hours per year at a labor rate of $100 per hour. The maintenance cost for the proposed design is 8 hours per year at a labor rate of $100 per hour. Therefore, the incremental maintenance cost is 4 hours per year at a labor rate of $100 per hour. Energy savings from this measure would persist for the life of the system.
Using this method, the present value of the annual maintenance discounted by 3 percent over 15 years is $4,775.17.
5.5 Cost Effectiveness This measure proposes a prescriptive requirement. As such, a cost analysis is required to demonstrate that the measure is cost effective over the period of analysis.
2022 Title 24, Part 6 Final CASE Report – 2022-NR-HVAC3-F | 95
The Energy Commission establishes the procedures for calculating cost effectiveness. The Statewide CASE Team collaborated with Energy Commission staff to confirm that the methodology in this report is consistent with their guidelines, including which costs were included in the analysis. The incremental first cost and incremental maintenance costs over the -year period of analysis were included. The TDV energy cost savings from electricity and natural gas savings were also included in the evaluation.
Design costs were not included nor were the incremental costs of code compliance verification.
According to the Energy Commission’s definitions, a measure is cost effective if the benefit-to-cost (B/C) ratio is greater than 1.0. The B/C ratio is calculated by dividing the cost benefits realized over 15 years for nonresidential building prototypes and 30 years for residential prototypes by the total incremental costs, which include maintenance costs. Thus, 15 years was used in this analysis. The B/C ratio was calculated using 2023 PV costs and cost savings.
Results of the per-unit cost-effectiveness analyses are presented in Table 51 and Table 64.
The cost effectiveness results vary by climate zone for all submeasures. Initial results in Table 51 through Table 50 show that the gas boiler system submeasure is cost-effective for certain building types in all climate zones with B/C ratios ranging from 0.12 to 7.20. As was the case with Table 21 in Section 4.4, the B/C ratio for Climate Zone 15 is the least where the B/C ratio for Climate Zone 16 is the greatest.
Similarly, results show that the gas service water heating submeasure presents cost-effective savings for all climate zones. The B/C ratio ranges from 2.16 to 19.94 as shown in Table 59 through Table 62. While costs are the same throughout all climate zones, climate zones have different input water temperatures which changes the level of energy savings.
The B/C ratio for oxygen concentration for process boilers is 4.8.
2022 Title 24, Part 6 Final CASE Report – 2022-NR-HVAC3-F | 96
5.5.1 Cost Effectiveness Results – Gas Boiler Systems
Table 51: 15-Year Cost-Effectiveness Summary Per Dwelling Unit – New Construction (High Rise Mixed Use) Gas Boiler Systems for Space Heating
a. Benefits: TDV Energy Cost Savings + Other PV Savings: Benefits include TDV energy cost savings over the period of analysis (Energy + Environmental Economics 2020). Other savings are discounted at a real (nominal – inflation) three percent rate. Other PV savings include incremental first-cost savings if proposed first cost is less than current first cost. Includes PV maintenance cost savings if PV of proposed maintenance costs is less than PV of current maintenance costs.
b. Costs: Total Incremental Present Valued Costs: Costs include incremental equipment, replacement, and maintenance costs over the period of analysis. Costs are discounted at a real (inflation-adjusted) three percent rate and if PV of proposed maintenance costs is greater than PV of current maintenance costs. If incremental maintenance cost is negative, it is treated as a positive benefit. If there are no total incremental PV costs, the B/C ratio is infinite.
2022 Title 24, Part 6 Final CASE Report – 2022-NR-HVAC3-F | 97
Table 52: 15-Year Cost-Effectiveness Summary Per Square Foot – New Construction (HotelSmall) Gas Boiler Systems for Space Heating
a. Benefits: TDV Energy Cost Savings + Other PV Savings: Benefits include TDV energy cost savings over the period of analysis (Energy + Environmental Economics 2020). Other savings are discounted at a real (nominal – inflation) three percent rate. Other PV savings include incremental first-cost savings if proposed first cost is less than current first cost. Includes PV maintenance cost savings if PV of proposed maintenance costs is less than PV of current maintenance costs.
b. Costs: Total Incremental Present Valued Costs: Costs include incremental equipment, replacement, and maintenance costs over the period of analysis. Costs are discounted at a real (inflation-adjusted) three percent rate and if PV of proposed maintenance costs is greater than PV of current maintenance costs. If incremental maintenance cost is negative, it is treated as a positive benefit. If there are no total incremental PV costs, the B/C ratio is infinite.
2022 Title 24, Part 6 Final CASE Report – 2022-NR-HVAC3-F | 98
Table 53: 15-Year Cost-Effectiveness Summary Per Square Foot – New Construction (OfficeLarge) Gas Boiler Systems for Space Heating
a. Benefits: TDV Energy Cost Savings + Other PV Savings: Benefits include TDV energy cost savings over the period of analysis (Energy + Environmental Economics 2020). Other savings are discounted at a real (nominal – inflation) three percent rate. Other PV savings include incremental first-cost savings if proposed first cost is less than current first cost. Includes PV maintenance cost savings if PV of proposed maintenance costs is less than PV of current maintenance costs.
b. Costs: Total Incremental Present Valued Costs: Costs include incremental equipment, replacement, and maintenance costs over the period of analysis. Costs are discounted at a real (inflation-adjusted) three percent rate and if PV of proposed maintenance costs is greater than PV of current maintenance costs. If incremental maintenance cost is negative, it is treated as a positive benefit. If there are no total incremental PV costs, the B/C ratio is infinite.
2022 Title 24, Part 6 Final CASE Report – 2022-NR-HVAC3-F | 99
Table 54: 15-Year Cost-Effectiveness Summary Per Square Foot – New Construction (OfficeMedium) Gas Boiler Systems for Space Heating
a. Benefits: TDV Energy Cost Savings + Other PV Savings: Benefits include TDV energy cost savings over the period of analysis (Energy + Environmental Economics 2020). Other savings are discounted at a real (nominal – inflation) three percent rate. Other PV savings include incremental first-cost savings if proposed first cost is less than current first cost. Includes PV maintenance cost savings if PV of proposed maintenance costs is less than PV of current maintenance costs.
b. Costs: Total Incremental Present Valued Costs: Costs include incremental equipment, replacement, and maintenance costs over the period of analysis. Costs are discounted at a real (inflation-adjusted) three percent rate and if PV of proposed maintenance costs is greater than PV of current maintenance costs. If incremental maintenance cost is negative, it is treated as a positive benefit. If there are no total incremental PV costs, the B/C ratio is infinite.
2022 Title 24, Part 6 Final CASE Report – 2022-NR-HVAC3-F | 100
Table 55: 15-Year Cost-Effectiveness Summary Per Square Foot – New Construction (OfficeMediumLab) Gas Boiler Systems for Space Heating
a. Benefits: TDV Energy Cost Savings + Other PV Savings: Benefits include TDV energy cost savings over the period of analysis (Energy + Environmental Economics 2020). Other savings are discounted at a real (nominal – inflation) three percent rate. Other PV savings include incremental first-cost savings if proposed first cost is less than current first cost. Includes PV maintenance cost savings if PV of proposed maintenance costs is less than PV of current maintenance costs.
b. Costs: Total Incremental Present Valued Costs: Costs include incremental equipment, replacement, and maintenance costs over the period of analysis. Costs are discounted at a real (inflation-adjusted) three percent rate and if PV of proposed maintenance costs is greater than PV of current maintenance costs. If incremental maintenance cost is negative, it is treated as a positive benefit. If there are no total incremental PV costs, the B/C ratio is infinite.
2022 Title 24, Part 6 Final CASE Report – 2022-NR-HVAC3-F | 101
Table 56: 15-Year Cost-Effectiveness Summary Per Square Foot – New Construction (SchoolSecondary) Gas Boiler Systems for Space Heating
a. Benefits: TDV Energy Cost Savings + Other PV Savings: Benefits include TDV energy cost savings over the period of analysis (Energy + Environmental Economics 2020). Other savings are discounted at a real (nominal – inflation) three percent rate. Other PV savings include incremental first-cost savings if proposed first cost is less than current first cost. Includes PV maintenance cost savings if PV of proposed maintenance costs is less than PV of current maintenance costs.
b. Costs: Total Incremental Present Valued Costs: Costs include incremental equipment, replacement, and maintenance costs over the period of analysis. Costs are discounted at a real (inflation-adjusted) three percent rate and if PV of proposed maintenance costs is greater than PV of current maintenance costs. If incremental maintenance cost is negative, it is treated as a positive benefit. If there are no total incremental PV costs, the B/C ratio is infinite.
2022 Title 24, Part 6 Final CASE Report – 2022-NR-HVAC3-F | 102
Table 57: 15-Year Cost-Effectiveness Summary Per Square Foot – New Construction (Hospital) Gas Boiler Systems for Space Heating
a. Benefits: TDV Energy Cost Savings + Other PV Savings: Benefits include TDV energy cost savings over the period of analysis (Energy + Environmental Economics 2016, 51-53). Other savings are discounted at a real (nominal – inflation) three percent rate. Other PV savings include incremental first-cost savings if proposed first cost is less than current first cost. Includes PV maintenance cost savings if PV of proposed maintenance costs is less than PV of current maintenance costs.
b. Costs: Total Incremental Present Valued Costs: Costs include incremental equipment, replacement, and maintenance costs over the period of analysis. Costs are discounted at a real (inflation-adjusted) three percent rate and if PV of proposed maintenance costs is greater than PV of current maintenance costs. If incremental maintenance cost is negative, it is treated as a positive benefit. If there are no total incremental PV costs, the B/C ratio is infinite.
2022 Title 24, Part 6 Final CASE Report – 2022-NR-HVAC3-F | 103
Table 58: 15-Year Cost-Effectiveness Summary Per Square Foot – New Construction (Apartment High Rise) Gas Boiler Systems for Space Heating
a. Benefits: TDV Energy Cost Savings + Other PV Savings: Benefits include TDV energy cost savings over the period of analysis (Energy + Environmental Economics 2016, 51-53). Other savings are discounted at a real (nominal – inflation) three percent rate. Other PV savings include incremental first-cost savings if proposed first cost is less than current first cost. Includes PV maintenance cost savings if PV of proposed maintenance costs is less than PV of current maintenance costs.
b. Costs: Total Incremental Present Valued Costs: Costs include incremental equipment, replacement, and maintenance costs over the period of analysis. Costs are discounted at a real (inflation-adjusted) three percent rate and if PV of proposed maintenance costs is greater than PV of current maintenance costs. If incremental maintenance cost is negative, it is treated as a positive benefit. If there are no total incremental PV costs, the B/C ratio is infinite.
2022 Title 24, Part 6 Final CASE Report – 2022-NR-HVAC3-F | 104
5.5.2 Cost Effectiveness Results – Gas Service Water Heating
Table 59: 15-Year Cost-Effectiveness Summary Per Dwelling Unit – New Construction (Apartment High Rise) for Service Water Heating Systems
a. Benefits: TDV Energy Cost Savings + Other PV Savings: Benefits include TDV energy cost savings over the period of analysis (Energy + Environmental Economics 2016, 51-53). Other savings are discounted at a real (nominal – inflation) three percent rate. Other PV savings include incremental first-cost savings if proposed first cost is less than current first cost. Includes PV maintenance cost savings if PV of proposed maintenance costs is less than PV of current maintenance costs.
b. Costs: Total Incremental Present Valued Costs: Costs include incremental equipment, replacement, and maintenance costs over the period of analysis. Costs are discounted at a real (inflation-adjusted) three percent rate and if PV of proposed maintenance costs is greater than PV of current maintenance costs. If incremental maintenance cost is negative, it is treated as a positive benefit. If there are no total incremental PV costs, the B/C ratio is infinite.
2022 Title 24, Part 6 Final CASE Report – 2022-NR-HVAC3-F | 105
Table 60: 15-Year Cost-Effectiveness Summary Square Foot – New Construction (HotelSmall) for Service Water Heating Systems
a. Benefits: TDV Energy Cost Savings + Other PV Savings: Benefits include TDV energy cost savings over the period of analysis (Energy + Environmental Economics 2016, 51-53). Other savings are discounted at a real (nominal – inflation) three percent rate. Other PV savings include incremental first-cost savings if proposed first cost is less than current first cost. Includes PV maintenance cost savings if PV of proposed maintenance costs is less than PV of current maintenance costs.
b. Costs: Total Incremental Present Valued Costs: Costs include incremental equipment, replacement, and maintenance costs over the period of analysis. Costs are discounted at a real (inflation-adjusted) three percent rate and if PV of proposed maintenance costs is greater than PV of current maintenance costs. If incremental maintenance cost is negative, it is treated as a positive benefit. If there are no total incremental PV costs, the B/C ratio is infinite.
2022 Title 24, Part 6 Final CASE Report – 2022-NR-HVAC3-F | 106
Table 61: 15-Year Cost-Effectiveness Summary Per Square Foot – New Construction (SchoolSecondary) for Service Water Heating Systems
a. Benefits: TDV Energy Cost Savings + Other PV Savings: Benefits include TDV energy cost savings over the period of analysis (Energy + Environmental Economics 2016, 51-53). Other savings are discounted at a real (nominal – inflation) three percent rate. Other PV savings include incremental first-cost savings if proposed first cost is less than current first cost. Includes PV maintenance cost savings if PV of proposed maintenance costs is less than PV of current maintenance costs.
b. Costs: Total Incremental Present Valued Costs: Costs include incremental equipment, replacement, and maintenance costs over the period of analysis. Costs are discounted at a real (inflation-adjusted) three percent rate and if PV of proposed maintenance costs is greater than PV of current maintenance costs. If incremental maintenance cost is negative, it is treated as a positive benefit. If there are no total incremental PV costs, the B/C ratio is infinite.
2022 Title 24, Part 6 Final CASE Report – 2022-NR-HVAC3-F | 107
Table 62: 15-Year Cost-Effectiveness Summary Per Dwelling Unit – New Construction (High Rise Mixed Use) for Service Water Heating Systems
a. Benefits: TDV Energy Cost Savings + Other PV Savings: Benefits include TDV energy cost savings over the period of analysis (Energy + Environmental Economics 2016, 51-53). Other savings are discounted at a real (nominal – inflation) three percent rate. Other PV savings include incremental first-cost savings if proposed first cost is less than current first cost. Includes PV maintenance cost savings if PV of proposed maintenance costs is less than PV of current maintenance costs.
b. Costs: Total Incremental Present Valued Costs: Costs include incremental equipment, replacement, and maintenance costs over the period of analysis. Costs are discounted at a real (inflation-adjusted) three percent rate and if PV of proposed maintenance costs is greater than PV of current maintenance costs. If incremental maintenance cost is negative, it is treated as a positive benefit. If there are no total incremental PV costs, the B/C ratio is infinite.
2022 Title 24, Part 6 Final CASE Report – 2022-NR-HVAC3-F | 108
Table 63: 15-Year Cost-Effectiveness Summary Per Square Foot – New Construction (Hospital) for Service Water Heating Systems
a. Benefits: TDV Energy Cost Savings + Other PV Savings: Benefits include TDV energy cost savings over the period of analysis (Energy + Environmental Economics 2020). Other savings are discounted at a real (nominal – inflation) three percent rate. Other PV savings include incremental first-cost savings if proposed first cost is less than current first cost. Includes PV maintenance cost savings if PV of proposed maintenance costs is less than PV of current maintenance costs.
b. Costs: Total Incremental Present Valued Costs: Costs include incremental equipment, replacement, and maintenance costs over the period of analysis. Costs are discounted at a real (inflation-adjusted) three percent rate and if PV of proposed maintenance costs is greater than PV of current maintenance costs. If incremental maintenance cost is negative, it is treated as a positive benefit. If there are no total incremental PV costs, the B/C ratio is infinite.
2022 Title 24, Part 6 Final CASE Report – 2022-NR-HVAC3-F | 109
5.5.3 Cost Effectiveness Results – Process Oxygen Concentration
Table 64: 15-Year Cost-Effectiveness Summary – Oxygen Concentration for Newly Installed (New Construction and Replacement) Process Boilers Climate Zone
Benefits TDV Energy Cost Savings + Other
PV Savingsa (2023 PV$)
Costs Total Incremental PV
Costsb (2023 PV$)
Benefit-to-Cost
Ratio
All 8,835,614 1,853,550 4.8 a. Benefits: TDV Energy Cost Savings + Other PV Savings: Benefits include TDV energy cost
savings over the period of analysis (Energy + Environmental Economics 2020). Other savings are discounted at a real (nominal – inflation) three percent rate. Other PV savings include incremental first-cost savings if proposed first cost is less than current first cost. Includes PV maintenance cost savings if PV of proposed maintenance costs is less than PV of current maintenance costs.
b. Costs: Total Incremental Present Valued Costs: Costs include incremental equipment, replacement, and maintenance costs over the period of analysis. Costs are discounted at a real (inflation-adjusted) three percent rate and if PV of proposed maintenance costs is greater than PV of current maintenance costs. If incremental maintenance cost is negative, it is treated as a positive benefit. If there are no total incremental PV costs, the Benefit-to-Cost ratio is infinite.
2022 Title 24, Part 6 Final CASE Report – 2022-NR-HVAC3-F | 110
6. First-Year Statewide Impacts
6.1 Statewide Energy and Energy Cost Savings The Statewide CASE Team calculated the first-year statewide savings for new construction by multiplying the per-unit savings, which are presented in Section 4.4, by assumptions about the percentage of newly constructed buildings that would be impacted by the proposed code. The statewide new construction forecast for 2023 is presented in Appendix A as are the Statewide CASE Team’s assumptions about the percentage of new construction that would be impacted by the proposal (by climate zone and building type).
The first-year energy impacts represent the first-year annual savings from all buildings that were completed in 2023. The energy cost savings represent the energy cost savings over the entire analysis period. The statewide savings estimates do not take naturally occurring market adoption or compliance rates into account.
Table 65 through Table 67 present the first-year statewide energy and energy cost savings from newly constructed buildings by climate zone.
2022 Title 24, Part 6 Final CASE Report – 2022-NR-HVAC3-F | 111
Table 65: Statewide Energy and Energy Cost Impacts – New Construction for Gas Boiler Systems for Space Heating Climate
TOTAL 12.51 N/A N/A 0.02 $0.47 a. First-year savings from all buildings completed statewide in 2023.
2022 Title 24, Part 6 Final CASE Report – 2022-NR-HVAC3-F | 113
Table 67: Statewide Energy and Energy Cost Impacts – Newly Installed Process Boilers Oxygen Concentration
Climate Zone
Statewide New Construction Impacted by
Proposed Change in 2023 (million square
feet)
First-Yeara
Electricity Savings
(GWh)
First-Year Peak
Electrical Demand
Reduction (MW)
First-Year Natural Gas
Savings (MMtherms)
15-Year Present Valued
Energy Cost Savings
(PV$ million in 2023)
All N/A N/A N/A 0.62 13.3
Since the Statewide CASE Team is assuming replacement every 20 years for process boilers, an estimated 95 percent of savings occur retrofits and 5 percent in new construction as shown in Table 3.
6.2 Statewide Greenhouse Gas (GHG) Emissions Reductions The Statewide CASE Team calculated avoided GHG emissions assuming the emissions factors specified in the United States Environmental Protection Agency (U.S. EPA) Emissions & Generation Resource Integrated Database (eGRID) for the Western Electricity Coordination Council California (WECC CAMX) subregion. Avoided GHG emissions from natural gas savings attributable to sources other than utility-scale electrical power generation are calculated using emissions factors specified in U.S. EPA’s Compilation of Air Pollutant Emissions Factors (AP-42). See Appendix C for additional details on the methodology used to calculate GHG emissions. In short, this analysis assumes an average electricity emission factor of 240.4 metric tons CO2e per GWh based on the average emission factors for the CACX EGRID subregion.
Table 68: Statewide GHG Emissions Impacts – New Construction, Alterations and Additions present the estimated first-year avoided GHG emissions of the proposed code changes. During the first year, GHG emissions of 15,838 metric tons of carbon dioxide equivalents (Metric Tons CO2e) would be avoided.
2022 Title 24, Part 6 Final CASE Report – 2022-NR-HVAC3-F | 114
Table 68: Statewide GHG Emissions Impacts – New Construction, Alterations and Additions Measure Electricity
Savingsa (GWh/yr)
Reduced GHG
Emissions from
Electricity Savingsa
(Metric Tons CO2e)
Natural Gas Savingsa
(MMtherms/yr)
Reduced GHG
Emissions from Natural
Gas Savingsa (Metric Tons
CO2e)
Total Reduced
CO2e Emissionsa,b
(Metric Tons CO2e)
Gas Boiler Systems
0 0 0.37 2,032 2,032
Service Water Heating
0 0 0.02 122 122
Process Oxygen Concentration
0 0 0.62 3,392 3,392
TOTAL 0 0 1.01 5,551 5,551 a. First-year savings from all buildings completed statewide in 2023. b. Assumes the following emission factors: 240.4 MTCO2e/GWh and 5,454.4 MTCO2e/million therms.
6.3 Statewide Water Use Impacts The proposed code change would not result in water savings.
6.4 Statewide Material Impacts For the boiler and service water heating submeasures, the materials used for the heat exchangers would be impacted. Non-condensing boilers use a cast iron, aluminum, copper, stainless steel or steel for the primary heat exchanger. "A condensing boiler, can have either one primary heat exchanger that is made from corrosion-resistant material or one primary and one secondary heat exchanger with the latter being made from corrosion-resistant material" (DOE 2016). Condensing boilers use an aluminum, copper, stainless steel or steel for the heat exchanger(s). According to this DOE report, steel and aluminum primary heat exchangers represent about the same market share for non-condensing systems compared to condensing systems, therefore this analysis assumes no change in these materials. Since cast iron cannot be used for condensing boiler heat exchangers, there would be a decrease in cast iron and an increase in stainless steel and copper. To determine the per-unit decrease in cast iron, the overall shipping weights of cast iron boilers were compared to a weighted average of boilers using stainless steel and copper heat exchangers. First-year statewide impacts are estimated assuming that 40 percent of the newly installed boilers would have used cast
2022 Title 24, Part 6 Final CASE Report – 2022-NR-HVAC3-F | 115
iron heat exchangers (DOE 2016). To estimate the per-unit increases for stainless steel and copper, the weights of several boilers were compared that are made as either non-condensing or condensing and use stainless steel and copper in both applications. It is assumed that the increase in weight associated with these condensing systems is due to the increase of these materials used in the primary heat exchanger or used as the secondary heat exchanger. According to AHRI, approximately 75 percent of condensing natural gas-fired commercial boilers have stainless steel heat exchangers. For the purposes of this analysis, it is assumed that 75 percent of newly installed condensing boilers would have stainless steel heat exchangers and 25 percent have copper heat exchangers. The results of this analysis are found in Table 69.
For service water heating, stainless steel is generally required to ensure safe consumption of the water. Since condensing water heaters also use larger or additional heat exchangers compared to non-condensing water heaters, there would be an increase in stainless steel as shown in Table 70. To determine the per-unit impacts, the shipping weights of fifteen water heaters that are made as either condensing or non-condensing were compared, and the average weight difference is used. These water heaters range in capacity from 0.5 million Btu/h to 6 million Btu/h. It is assumed that the increase in weight of the condensing models is due to the additional stainless steel used in the heat exchanger(s).
Other materials may be impacted due to venting requirements and condensate management, but stakeholder feedback is needed to estimate the impacts since a variety of materials can be used to vent and neutralize condensate.
For the oxygen concentration submeasure, the 2013 CASE Report for process boilers was referenced for per unit material impacts. It is assumed that oxygen trim control would be used to achieve 3 percent excess oxygen. The material impacts are based on an estimated weight of approximately 5 pounds for the exhaust gas sampling probes and exhaust gas analyzer. This is composed of roughly 3 pounds of steel, 1 pound of copper, and 1 pound of plastic (CPUC 2011). Table 71 shows the per unit impacts and the first-year statewide impacts using the estimated 151 boilers that would need to comply with this submeasure.
2022 Title 24, Part 6 Final CASE Report – 2022-NR-HVAC3-F | 116
Table 69: First-Year Statewide Impacts on Material Use – Gas Boiler Systems Material Impact
(I, D, or NC)a Impact on Material Use (pounds/year)
Per-Unit Impacts First-Yearb Statewide Impacts Mercury NC NC NC Lead NC NC NC Copper I 119 lbs/yr 19,879 lbs/yr Stainless Steel I 85.1 lbs/yr 42,647 lbs/yr Plastic NC NC NC Cast Iron D 2,027 lbs/yr 541,877 lbs/yr Others (Identify) NC NC NC a. Material Increase (I), Decrease (D), or No Change (NC) compared to base case (lbs/yr). b. First-year savings from all buildings completed statewide in 2023.
Table 70: First-Year Statewide Impacts on Material Use – Gas Service Water Heating Material Impact
(I, D, or NC)a Impact on Material Use (pounds/year)
a. Material Increase (I), Decrease (D), or No Change (NC) compared to base case (lbs/yr). b. First-year savings from all buildings completed statewide in 2023.
2022 Title 24, Part 6 Final CASE Report – 2022-NR-HVAC3-F | 117
Table 71: First-Year Statewide Impacts on Material Use – Oxygen Concentration Material Impact
(I, D, or NC)a
Impact on Material Use (pounds/year) Per-Unit Impacts First-Yearb Statewide Impacts
Mercury NC NC NC Lead NC NC NC Copper I 0.07 lbs/yr 10.57 lbs/yr Steel I 0.2 lbs/yr 30.2 lbs/yr Plastic I 0.07 lbs/yr 10.57 lbs/yr Others (Identify) NC NC NC a. Material Increase (I), Decrease (D), or No Change (NC) compared to base case (lbs/yr). b. First-year savings from all buildings completed statewide in 2023.
6.5 Other Non-Energy Impacts The proposed code change would not result in other non-energy impacts.
2022 Title 24, Part 6 Final CASE Report – 2022-NR-HVAC3-F | 118
7. Proposed Revisions to Code Language
7.1 Guide to Markup Language The proposed changes to the standards, Reference Appendices, and the ACM Reference Manuals are provided below. Changes to the 2019 documents are marked with red underlining (new language) and strikethroughs (deletions).
7.2 Standards
SECTION 100.1 – DEFINITIONS AND RULES OF CONSTRUCTION BOILER SYSTEM is one or more boilers and their piping and controls that work together to supply steam or hot water to heat output devices remote from the boiler.
SECTION 110.2 – MANDATORY REQUIREMENTS FOR SPACE-CONDITIONING EQUIPMENT
TABLE 110.2-K Gas- and Oil-Fired Boilers, Minimum Efficiency requirements Equipment
Type Sub
Category Size Category
(Input) Minimum
Efficiencyb,c Test
Procedurea Before
3/2/2020 01/10/2023
On or After 3/2/2020
01/10/2023 Boiler, hot
water Gas-Fired < 300,000 Btu/h 82% AFUE 82% AFUE DOE 10 CFR
Part 430 ≥ 300,000 Btu/h and ≤ 2,500,000 Btu/h d
80% Et 84 80% Et DOE 10 CFR Part 431
> 2,500,000 Btu/h and
≤ 10,000,000 Btu/h e
82% Ec 85 82% Ec
>10,000,000 Btu/h 82% Ec 82% Ec DOE 10 CFR Part 431
Oil-Fired < 300,000 Btu/h 84% AFUE 84% AFUE DOE 10 CFR Part 430
≥ 300,000 Btu/h and ≤ 2,500,000 Btu/h d
82% Et 87 82% Et DOE 10 CFR Part 431
>2,500,000 Btu/h and ≤ 10,00,000 Btu/h e
84% Ec 88 84% Ec
>10,000,000 Btu/h 84% Ec 84% Ec DOE 10 CFR Part 431
2022 Title 24, Part 6 Final CASE Report – 2022-NR-HVAC3-F | 119
Boiler, steam Gas-Fired < 300,000 Btu/h 80% AFUE 80% AFUE DOE 10 CFR Part 430
≥ 300,000 Btu/h and ≤ 2,500,000 Btu/h
81% Et DOE 10 CFR Part 431
>2,500,000 Btu/h and ≤ 10,000,000 Btu/h
82% Et DOE 10 CFR Part 431
>10,000,000 Btu/h 79% Et DOE 10 CFR Part 431
Gas-Fired all, except
natural draft
≥ 300,000 Btu/h and ≤ 2,500,000 Btu/h d
79% Et DOE 10 CFR Part 431
>2,500,000 Btu/h and ≤ 10,000,000 Btu/h e
79% Et DOE 10 CFR Part 431
Gas-Fired, natural draft
≥ 300,000 Btu/h and ≤ 2,500,000 Btu/h d
77% Et DOE 10 CFR Part 431
>2,500,000 Btu/h and ≤ 10,000,000 Btu/h e
77% Et DOE 10 CFR Part 431
Oil-Fired < 300,000 Btu/h 82% AFUE 82% AFUE DOE 10 CFR Part 430
≥ 300,000 Btu/h and ≤ 2,500,000 Btu/h d
81% Et 84 81% Et DOE 10 CFR Part 431
>2,500,000 Btu/h and ≤ 10,000,000 Btu/h
81% Et 85 81% Et DOE 10 CFR Part 431
>10,000,000 Btu/h 81% Et 81% Et DOE 10 CFR Part 431
a Applicable test procedure and reference year are provided under the definitions. b Ec = combustion efficiency (100% less flue losses).See reference document for detailed information. c Et= thermal efficiency. See test procedure for detailed information. d Maximum capacity - minimum and maximum ratings as provided for and allowed by the unit’s controls. e Included oil-fired (residual).
NOTE: Authority: Sections 25213, 25218, 25218.5, 25402 and 25402.1, Public Resources Code. Reference: Sections 25007, 25008, 25218.5, 25310, 25402, 25402.1, 25402.4, 25402.8, and 25943, Public Resources Code
SECTION 120.6 – MANDATORY REQUIREMENTS FOR COVERED PROCESSES …
(d) Mandatory Requirements for Process Boilers
2022 Title 24, Part 6 Final CASE Report – 2022-NR-HVAC3-F | 120
3. Newly installed process boilers with an input capacity of 5 Million Btu/h (5,000,000 Btu/h) to 10 Million Btu/h (10,000,000 Btu/h) shall maintain excess (stackgas) oxygen concentrations at less than or equal to 5.0 percent by volume on a dry basis over firing rates of 20 percent to 100 percent. Combustion air volume shall be controlled with respect to firing rate or measured flue gas oxygen concentration. Use of a common gas and combustion air control linkage or jack shaft is prohibited.
.4 . 3. Newly installed process boilers with an input capacity greater than 5 10 million Btu/h (5,000,000 10,000,000 Btu/h) shall maintain excess (stack-gas) oxygen concentrations at less than or equal to 3.0 percent by volume on a dry basis over firing rates of 20 percent to 100 percent. Combustion air volume shall be controlled with respect to measured flue gas oxygen concentration. Use of a common gas and combustion air control linkage or jack shaft is prohibited.
EXCEPTION to Section 120.6(d)3: Boilers with steady state full-load combustion efficiency 90 percent or higher.
SECTION 120.9 – MANDATORY REQUIREMENTS FOR COMMERCIAL BOILERS …
(c) Newly installed boilers with an input capacity 5 million Btu/h (5,000,000 Btu/h) and greater shall maintain excess (stack-gas) oxygen concentration at less than or equal to 5.0 percent by volume on a dry basis over firing rates of 20 percent to 100 percent. Combustion air volume shall be controlled with respect to firing rate or flue gas oxygen concentration. Use of a common gas and combustion air control linkage or jack shift is prohibited.
EXCEPTION to Section 120.9(c): Boilers with steady state full-load combustion efficiency of 85 90 percent or higher.
SECTION 140.4 – PRESCRIPTIVE REQUIREMENTS FOR SPACE CONDITIONING SYSTEMS (k) Hydronic System Measures
(8) High Capacity Space Heating Gas Boiler Systems. New buildings with gas hot water boiler systems for space heating with a total system input of at least 1 million Btu/h (1,000,000 Btu/h) but no more than 10 million Btu/h (10,000,000 Btu/hr) shall meet all of the following requirements.
A. Boiler System Efficiency. Gas hot water boilers shall have a minimum thermal efficiency of 90 percent. Systems with multiple boilers can meet this requirement if the space-heating input provided by equipment with thermal efficiencies above and below 90 percent has an input capacity-weighted average thermal efficiency of at least 90 percent. For boilers federally
2022 Title 24, Part 6 Final CASE Report – 2022-NR-HVAC3-F | 121
regulated by combustion efficiency, the calculation for the input capacity-weighted average thermal efficiency shall use the combustion efficiency value.
B. Hot water distribution design. The hot water distribution system shall be designed to comply with items i and ii.
i. Coils and other heat exchangers shall be selected so that at design conditions the hot water return temperature entering the boilers is 120°F or less.
ii Under all operating conditions, the water temperature entering the boiler is 120°F or less or the flow rate of supply hot water that recirculates directly into the return system, such as by 3-way valves or minimum flow bypass controls, shall be no greater than 20 percent of the design flow of the operating boilers.
Exception 1 to 140.4(k)8: Where 25 percent of the annual space heating requirement is provided by on-site renewable energy, site-recovered energy, or heat recovery chillers.
Exception 2 to 140.4(k)8: Space heating boilers installed in individual dwelling units.
Exception 3 to 140.4(k)8: Where 50 percent or more of the design heating load is served using perimeter convective heating, radiant ceiling panels or both.
Exception 4 to 140.4(k)8: Individual gas boilers with input capacity less than 300,000 Btu/h shall not be included in the calculations of the total system input or total system efficiency.
SECTION 140.5 – PRESCRIPTIVE REQUIREMENTS FOR SERVICE WATER HEATING SYSTEMS (a) Nonresidential Occupancies. A service water heating system installed in a nonresidential
building complies with this section if it complies with the applicable requirements of Sections 110.1, 110.3 and 120.3 and 140.5(c).
(b) High-Rise Residential and Hotel/Motel Occupancies. A service water heating system installed in a high-rise residential or hotel/motel building complies with this section if it meets the requirements of Section 150.1(c)8 and 140.5(c).
(c) High Capacity Service Water Heating Systems. Gas service water-heating systems in new buildings with a total installed gas water-heating input capacity of 1 million Btu/h or greater must have gas service water-heating equipment with a minimum thermal efficiency of 90 percent. Multiple units are allowed to meet this requirement if the water-heating input provided by equipment with thermal efficiencies above and below 90 percent provides an input capacity-weighted average thermal efficiency of at least 90 percent. EXCEPTION 1 to 140.5(c): Service water heating systems where 25 percent of the annual service water-heating requirement is provided by site-solar energy or site-recovered energy. EXCEPTION 2 to 140.5(c): Water heaters installed in individual dwelling units.
EXCEPTION 3 to 140.5(c): Individual gas water heaters with input capacity at or below 100,000 Btu/h shall not be included in the calculations of the total system input or total system efficiency.
2022 Title 24, Part 6 Final CASE Report – 2022-NR-HVAC3-F | 122
7.3 Reference Appendices There are no proposed changes to the Reference Appendices.
7.4 ACM Reference Manual These proposed changes to the Nonresidential ACM Reference Manual are essential for the software to measure weighted thermal efficiencies of the covered boiler and water heater systems.
Section 5.8.1 Boilers
Boiler Efficiency Type Applicability All boilers Definition The full load efficiency of a boiler is expressed as one of the
following: Annual fuel utilization efficiency (AFUE) is a measure of the boiler’s efficiency over a predefined heating season. Thermal Efficiency (Et) is the ratio of the heat transferred to the water divided by the heat input of the fuel. Combustion efficiency (Ec) is the measure of how much energy is extracted from the fuel and is the ratio of the heat transferred to the combustion air divided by the heat input of the fuel. Input-weighted thermal efficiency is the thermal efficiencies of multiple boilers that are weighed by a water-heating input factor.
Units List (see above) Input Restrictions None Standard Design AFUE for all gas-fired boilers with less than 300,000 Btu/h capacity.
Thermal Efficiency (Et) for all gas and oil-fired boilers with capacities between 225,000 300,000 and 2,500,000 Btu/h. Combustion efficiency (Ec), for all gas and oil-fired boilers with capacities above 2,500,000 Btu/h. Weighted thermal efficiency is a system level metric that will be only be used for systems with capacities between 1 million Btu/h and 10 million Btu/h that have multiple gas-fired hot water boilers.
Standard Design: Existing Buildings
Boiler Efficiency Table The “boiler efficiency” in 5.8.1 would be modified to include the proposed thermal efficiencies for covered boilers.
2022 Title 24, Part 6 Final CASE Report – 2022-NR-HVAC3-F | 123
Boiler Efficiency Applicability All boilers Definition The full load efficiency of a boiler or boiler system at rated conditions
(see efficiency type above) expressed as a dimensionless ratio of output over input. The software must accommodate input in either thermal efficiency (Et), combustion efficiency (Ec), or AFUE. The software shall make appropriate conversions to thermal efficiency if either AFUE or combustion efficiency is entered as the rated efficiency. Where AFUE is provided, Et shall be calculated as follows:
75% ≤ 𝐴𝐴FUE< 80% 𝐸𝐸t = 0.1(AFUE + 72.5%)
80% ≤ 𝐴𝐴FUE ≤ 100% 𝐸𝐸t = 0.875(AFUE + 10.5%)
If combustion efficiency is entered, the compliance software shall convert the efficiency to thermal efficiency by the relation: 𝐸𝐸t = 𝐸𝐸c − 0.015 All electric boilers will have an efficiency of 98 percent.
Units Ratio Input Restrictions As designed Standard Design Gas-fired hot water boilers, with rated input of at least 300,000 Btu/h,
and a part of boiler systems, with one or more boilers, between 1 million Btu/h and 10 million Btu/h are assumed to have the minimum system thermal efficiency level of 90%. This design aligns with the associated boiler efficiency levels in ASHRAE 90.1 Addendum BC. Boilers for the standard design All other boilers and boilers that meet ASHRAE 90.1 Addendum BC exceptions are assumed to have the minimum efficiency as listed in Table E-4 of the California Appliance Efficiency Regulations.
Standard Design: Existing Buildings
2022 Title 24, Part 6 Final CASE Report – 2022-NR-HVAC3-F | 124
Hot Water Return Temperature Applicability All Boilers Definition The temperature of the water returning to the boiler from the hot
water loop Units Degrees Fahrenheit (°F) Input Restrictions As designed. Standard Design For gas fired hot water boilers that are a part of systems with
capacities between 1 million Btu/h and 10 million Btu/h, use 120°F. For health care facilities, not serviced by the systems in the previous sentence, same as Proposed Design. For all others, use 140°F for standard design boiler.
Standard Design: Existing Buildings
Supply hot water flow rate Applicability Gas-fired hot water boiler systems with capacity between 1 million
Btu/h (1,000,000 Btu/h) and 10 million Btu/h Definition Supply hot water flow rate is the rate by which water that recirculates
into the boiler systems when compared to the design flow Units Percentage of design flow Input Restrictions Percentages range from 0 to 100 Standard Design The standard design shall have flow rates that are 20% of the design
flow rates of an operating boiler. Standard Design: Existing Buildings
2022 Title 24, Part 6 Final CASE Report – 2022-NR-HVAC3-F | 125
Hot Water Supply Temperature table
Applicability All Boilers
Definition The temperature of the water produced by the boiler and supplied to the hot water loop
Units Degrees Fahrenheit (°F) Input Restrictions As designer
Standard Design
For health care facilities, same as Proposed Design. Use 160 °F, for gas hot water boilers, with capacity between 1 million Btu/h (1,000,000 Btu/h) and 10 million Btu/h. For all others, Use 180°F for standard design boiler.
Standard Design: Existing Buildings
2022 Title 24, Part 6 Final CASE Report – 2022-NR-HVAC3-F | 126
Section 5.9.1.2 Water Heaters
Thermal Efficiency Applicability Oil and gas-fired water heaters or gas-service water heater systems
not covered by NAECA Definition The full load efficiency of a water heater at rated conditions
expressed as a dimensionless ratio of output over input. It is also referred to as recovery efficiency.
Units Unitless ratio Input Restrictions Building descriptors for the proposed design should be consistent
with equipment specified on the construction documents or observed in the candidate building.
Standard Design For all nonresidential buildings and high-rise residential spaces including hotels and motels, gas service water heating systems with capacities over 1,000,000 Btu/h must have thermal efficiencies in accordance with Title 24, Part 6, Section 140.5. All other water heaters in nonresidential buildings and nonresidential spaces will have thermal efficiency determined from Table F-2 in the Appliance Efficiency Regulations. For high-rise residential spaces and residential living spaces of hotels and motels (guestrooms), the rules in the Residential ACM Reference Manual are followed.
Standard Design: Existing Buildings
7.5 Compliance Manuals Chapter 4 of the Nonresidential Compliance Manual would need to be revised. Section 4.2.2 would need to indicate there are relevant efficiency requirements for boiler and service water heating systems in Title 24, Part 6 that align with the associated efficiency requirements in ASHRAE 90.1 Addendum BC and ASHRAE 90.1 Section 7.5.3, respectively. Section 10.9.2.2 would need to be revised in order to account for the update to the oxygen concentration level for newly installed boilers with capacities above 5 million Btu/h (5,000,000 Btu/h). Changes would also be made to Section 4.5.2.6 to include the updated return hot water design requirements in the manual and in Section 4.7 to add the new prescriptive requirements for service water heating. Additionally, including examples of weighted thermal efficiencies in the question and answer sections is recommended.
7.6 Compliance Documents Compliance documents NRCC-MCH-E, NRCC-PLB-E, and NRCC-PRC-E would need to be revised. The compliance documents would need to be updated to document the
2022 Title 24, Part 6 Final CASE Report – 2022-NR-HVAC3-F | 127
weighted thermal efficiency, the return temperature and flow rates of the boiler(s) and water heater(s). Designers would need to be aware of the new trigger for oxygen trim control and adjust design recommendations accordingly.
2022 Title 24, Part 6 Final CASE Report – 2022-NR-HVAC3-F | 128
ASHRAE. 2019. ANSI/ASHRAE/IES Standard 90.1-2019 -- Energy Standard for Buildings Except Low-Rise Residential Buildings. https://www.ashrae.org/technical-resources/bookstore/standard-90-1.
BAAQMD. n.d. Public Records Request. Accessed 2020. https://www.baaqmd.gov/contact-us/request-public-records.
BW Research Partnership. 2016. Advanced Energy Jobs in California: Results of the 2016 California Advanced Energy. Advanced Energy Economy Institute.
California Air Resouces Board. 2019. "Global Warming Potentials." https://www.arb.ca.gov/cc/inventory/background/gwp.htm#transition.
California Department of Water Resources. 2016. "California Counties by Hydrologic Regions." Accessed April 3, 2016. http://www.water.ca.gov/landwateruse/images/maps/California-County.pdf.
California Energy Commission. 2015. 2016 Building Energy Efficiency Standards: Frequently Asked Questions. http://www.energy.ca.gov/title24/2016standards/rulemaking/documents/2016_Building_Energy_Efficiency_Standards_FAQ.pdf.
—. 2020. 2020 Workshops and Meetings. https://ww2.energy.ca.gov/title24/2022standards/prerulemaking/documents/.
—. 2020. 2020 Workshops and Meetings. March 27. https://ww2.energy.ca.gov/title24/2022standards/prerulemaking/documents/.
California Energy Commission Building Standards Office. n.d. Public Participation in the Energy Efficiency Standards Update. Accessed 2020. https://www.energy.ca.gov/title24/participation.html.
California Energy Commission. 2019. CBECC-Com Nonresidential Compliance Software. Accessed 2020. http://bees.archenergy.com/software2019.html.
—. 2022. "Energy Code Data for Measure Proposals." energy.ca.gov. https://www.energy.ca.gov/title24/documents/2022_Energy_Code_Data_for_Measure_Proposals.xlsx.
2022 Title 24, Part 6 Final CASE Report – 2022-NR-HVAC3-F | 129
—. 2019. "Housing and Commercial Construction Data - Excel." https://ww2.energy.ca.gov/title24/documents/2022_Energy_Code_Data_for_Measure_Proposals.xlsx.
—. 2018. "Impact Analysis: 2019 Update to the California Energy Efficiency Standards for Residential and Non-Residential Buildings." energy.ca.gov. June 29. https://www.energy.ca.gov/title24/2019standards/post_adoption/documents/2019_Impact_Analysis_Final_Report_2018-06-29.pdf.
California Plumbing Code. n.d. "California Plumbing Code." IAPMO. Accessed December 12, 2019. http://epubs.iapmo.org/2019/CPC/mobile/index.html#p=513.
California Public Utilities Commission (CPUC). 2015b. "Water/Energy Cost-Effectiveness Analysis: Revised Final Report." Prepared by Navigant Consulting, Inc. http://www.cpuc.ca.gov/WorkArea/DownloadAsset.aspx?id=5360.
California Public Utilities Commission. 2015a. "Water/Energy Cost-Effectiveness Analysis: Errata to the Revised Final Report." Prepared by Navigant Consulting, Inc. . http://www.cpuc.ca.gov/WorkArea/DownloadAsset.aspx?id=5350.
California Statewide Utilities Codes and Standards Team. 2012. Process Boilers. Accessed December 31, 2019. http://title24stakeholders.com/wp-content/uploads/2017/10/2013_CASE-Report_Process-Boilers.pdf.
Campbell-Sevey. n.d. Steam Tip 4: Improve Your Boiler's Combustion Efficiency. Accessed 2020. https://www.campbell-sevey.com/steam-tip-4-improve-your-boilers-combustion-efficiency/.
Center for Energy and Environment. 2008. Commercial Condensing Boiler Optimization. Accessed 2020. https://mn.gov/commerce-stat/pdfs/card-cee-slides.pdf.
—. 2018. Quality Installation and Retrocommissioning of High-Efficiency Condensing Boilers. May 31. Accessed January 6, 2020. http://mn.gov/commerce-stat/pdfs/card-condensing-boilers.pdf.
Chapman, George M. 2015. Commercial Boiler System Initiative Description. Initiative Description, Boston, MA: Consortium for Energy Efficiency. https://library.cee1.org/system/files/library/7543/CEE_ComBoilerSystems_InitiativeDescription_2015_FINAL.pdf.
Consortium for Energy Efficiency. 2001. A Market Assessment for. Accessed January 6, 2020. http://www.idc-online.com/technical_references/pdfs/mechanical_engineering/CommercialBoilerAsess.pdf.
CPUC. 2020. Boiler, Commercial. California Public Utilities Commission. https://www.caetrm.com/measure/SWWH005/01/.
2022 Title 24, Part 6 Final CASE Report – 2022-NR-HVAC3-F | 130
CPUC. 2011. Commercial Boilers. Codes and Standards Enhancement Initiative (CASE) Report, California Utilities Statewide Codes and Standards Team. http://title24stakeholders.com/wp-content/uploads/2017/10/2013_CASE-Report_Commercial-Boilers.pdf.
CPUC. 2011. Process Boilers. Codes and Standards Enhancement Initiative (CASE) Report, California Utilities Statewide Codes and Standards Team. http://title24stakeholders.com/wp-content/uploads/2017/10/2013_CASE-Report_Process-Boilers.pdf.
CPUC. 2020. Space Heating Boiler, Commercial. California Public Utilities Commission. https://www.caetrm.com/measure/SWHC004/01/.
Cutler, Dylan. 2014. Condensing Boilers Evaluation: Retrofit and New Construction Applications. Denver, CO: National Renewable Energy Laboratory.
DOE. n.d. 10 CFR 431.110. Accessed November 26, 2019. https://www.ecfr.gov/cgi-bin/text-idx?SID=a69096e892b13c204bbe6da3a92f8111&mc=true&node=se10.3.431_1110&rgn=div8.
—. n.d. 10 CFR 431.87. Accessed November 26, 2019. https://www.ecfr.gov/cgi-bin/text-idx?SID=7cc7e61cad1f0a474009880d24a8d553&mc=true&node=se10.3.431_187&rgn=div8.
—. n.d. Commerical Prototype Building Models. Accessed 2020. https://www.energycodes.gov/development/commercial/prototype_models.
—. 2016. Energy Conservation Standards for Commercial Packaged Boilers. December. Accessed December 4, 2019. https://www.energy.gov/sites/prod/files/2016/12/f34/CPB_ECS_Final_Rule.pdf.
DOE. 2012. Improve Your Boiler’s Combustion. https://www.energy.gov/sites/prod/files/2014/05/f16/steam4_boiler_efficiency.pdf.
DOE. 2016. Technical Support Document: Energy Efficiency Program For Consumer Products And Commercial And Industrial Equipment: Commercial Packaged Boilers. Washington, DC, March 4. https://energy.mo.gov/sites/energy/files/technical-support-document---commercial-packaged-boilers_doe.pdf.
Energy + Environmental Economics. 2016. "Time Dependent Valuation of Energy for Developing Building Efficiency Standards: 2019 Time Dependent Valuation (TDV) Data Sources and Inputs." Prepared for the California Energy Commission. July. http://docketpublic.energy.ca.gov/PublicDocuments/16-BSTD-
2022 Title 24, Part 6 Final CASE Report – 2022-NR-HVAC3-F | 131
Energy + Environmental Economics. 2020. "Time Dependent Valuation of Energy for Developing Building Efficiency Standards: 2022 Time Dependent Valuation (TDV) and Source Energy Metric Data Sources and Inputs."
Energy Information Administration. 2015. Commercial Building Energy Efficiency Consumption Survey. Accessed 2020. https://www.eia.gov/consumption/commercial/data/2012/.
Ettenson, Lara , and Christa Heavey. 2015. California's Golden Energy Efficiency Opportunity: Ramping Up Success to Save Billions and Meet Climate Goals. Natural Resources Defense Council & Environmental Entrepreneurs (E2).
Farthing, David C. n.d. "Combustion Control Strategies For Single and Duel Element Power Burners." https://www.federalcorp.com/tech/combustion%20control.pdf.
Federal Reserve Economic Data. n.d. https://fred.stlouisfed.org .
Goldman, Charles, Merrian C. Fuller, Elizabeth Stuart, Jane S Peters, Marjorie McRay, Nathaniel Albers, Susan Lutzenhiser, and Mersiha Spahic. 2010. Energy Efficiency Services Sector: Workforce Size and Expectations for Growth. Lawrence Berkeley National Laboratory.
Kenney, Michael, Heather Bird, and Heriberto Rosales. 2019. 2019 California Energy Efficiency Action Plan. Publication Number: CEC- 400-2019-010-CMF , California Energy Commission. Kenney, Michael, Heather Bird, and Heriberto Rosales. 2019. 2019 California Energy Efficiency Action Plan. California Energy Commission. Publication Number: CEC- 400-2019-010-CMF .
Legal Information Institute. n.d. 42 U.S.C. 6313. Accessed November 26, 2019. https://www.law.cornell.edu/uscode/text/42/6313.
—. n.d. 42 U.S.C. 6316. Accessed November 26, 2019. https://www.law.cornell.edu/uscode/text/42/6316.
National Energy Assistance Directors' Association. 2011. 2011 National Energy Assistance Survey Final Report. http://www.appriseinc.org/reports/Final%20NEADA%202011%20Report.pdf.
O'Donnell, Joanne. 2011. High Efficiency Commercial Boiler. Initiative Description, Boston, MA: Consortium for Energy Efficiency. https://library.cee1.org/sites/default/files/library/7543/CEE_GasComm_BoilerInitiativeDesc_16May2011.pdf.
2022 Title 24, Part 6 Final CASE Report – 2022-NR-HVAC3-F | 132
Parker, Steven, and Jeremy Blanchard. 2012. Condensing Boiler Assessment: Peachtree Summit Federal Building Atlanta, Georgia. Peachtree Summit Federal Building: Pacific Northwest National Laboratory.
PG&E. 2016. Workpaper and Disposition Archive. Prod. California Public Utilities Commission. http://deeresources.net/workpapers.
SCAQMD. n.d. Public Document Search. Accessed 2020. http://onbase-pub.aqmd.gov/publicaccess/DatasourceTemplate.aspx.
SoCalGas. 2016. "Commercial Hot Water Boilers." Workpaper and Disposition Archive. Prod. California Public Utilities Commission. http://deeresources.net/workpapers.
State of California, Employment Development Department. n.d. https://www.labormarketinfo.edd.ca.gov/cgi/dataanalysis/areaselection.asp?tablename=industry .
Statewide CASE Team. 2019. "Nonresidential HVAC Part 1 Meeting Notes." Title 24 Stakeholders. October 15. Accessed December 13, 2019. https://title24stakeholders.com/wp-content/uploads/2019/07/T24-2022-Stakeholder-Meeting-Notes-Nonresidential-HVAC.pdf.
Stone, Nehemiah, Jerry Nickelsburg, and William Yu. 2015. Codes and Standards White Paper: Report - New Home Cost v. Price Study. Pacific Gas and Electric Company. Accessed February 2, 2017. http://docketpublic.energy.ca.gov/PublicDocuments/Migration-12-22-2015/Non-Regulatory/15-BSTD-01/TN%2075594%20April%202015%20Codes%20and%20Standards%20White%20Paper%20-%20Report%20-%20New%20Home%20Cost%20v%20Price%20Study.pdf.
Thornberg, Christopher, Hoyu Chong, and Adam Fowler. 2016. California Green Innovation Index - 8th Edition. Next 10.
U.S. Census Bureau, Population Division. 2014. "Annual Estimates of the Resident Population: April 1, 2010 to July 1, 2014." http://factfinder2.census.gov/bkmk/table/1.0/en/PEP/2014/PEPANNRES/0400000US06.05000.
U.S. EPA (United States Environmental Protection Agency). 2011. "Emission Factors for Greenhouse Gas Inventories." Accessed December 2, 2013. http://www.epa.gov/climateleadership/documents/emission-factors.pdf.
Ultrasystems, INC. 1983. "Boiler Control Systems Theory of Operation Manual." Navel Civil Engineering Laboraty, February. https://apps.dtic.mil/dtic/tr/fulltext/u2/a124868.pdf.
2022 Title 24, Part 6 Final CASE Report – 2022-NR-HVAC3-F | 133
United States Environmental Protection Agency. 1995. "AP 42, Fifth Edition Compilation of Air Pollutant Emissions Factors, Volume 1: Stationary Point and Area Sources." https://www.epa.gov/air-emissions-factors-and-quantification/ap-42-compilation-air-emissions-factors#5thed.
United States Environmental Protection Agency. 2018. "Emissions & Generation Resource Integrated Database (eGRID) 2016." https://www.epa.gov/energy/emissions-generation-resource-integrated-database-egrid.
Urbanek, Lauren. 2019. Victory! Trump Administration Must Publish Delayed Energy Efficiency Standards. NRDC, October 10. https://www.nrdc.org/experts/lauren-urbanek/victory-trump-administration-must-publish-delayed-energy-efficiency-standards.
US Ninth Circuit Court of Appeals. 2019. December 2. Accessed December 12, 2019. https://www.documentcloud.org/documents/6566399-98-Mandate-12-2-2019-1.html.
Westlaw. n.d. California Code of Regulations. Accessed November 26, 2019. https://govt.westlaw.com/calregs/Document/IC95DA848BDAD489294F06754177B0C50?viewType=FullText&originationContext=documenttoc&transitionType=CategoryPageItem&contextData=(sc.Default)&bhcp=1.
Zabin, Carol, and Karen Chapple. 2011. California Workforce Education & Training Needs Assessment: For Energy Efficiency, Distributed Generation, and Demand Reponse. University of California, Berkeley Donald Vial Center on Employment in the Green Economomy. Accessed February 3, 2017. http://laborcenter.berkeley.edu/pdf/2011/WET_Appendices_ALL.pdf.
2022 Title 24, Part 6 Final CASE Report – 2022-NR-HVAC3-F | 134
Appendix A: Statewide Savings Methodology To calculate first-year statewide savings for gas boiler systems and gas service water heating systems, the Statewide CASE Team multiplied the per-unit savings by statewide construction estimates for the first year the standards will be in effect (2023). The projected nonresidential new construction forecast that will be impacted by the proposed code changes in 2023 are presented in Table 72 and Table 73. This appendix describes how the Statewide CASE Team developed these estimates. The proposed code changes will not impact alterations to existing buildings. This appendix describes how the Statewide CASE Team developed these estimates.
The Energy Commission construction forecast, which is available for public review on the Energy Commission’s website: https://www.energy.ca.gov/title24/participation.html.
The construction forecast presents total floorspace of newly constructed buildings in 2023 by building type and climate zone. The building types included in the Energy Commissions’ forecast are summarized in Table 20 This table also identifies the prototypical buildings that were used to model the energy use of the proposed code changes. This mapping was required because the building types the Energy Commission defined in the construction forecast are not identical to the prototypical building types that the Energy Commission requested that the Statewide CASE Team use to model energy use. This mapping is consistent with the mapping that the Energy Commission used in the Final Impacts Analysis for the 2019 code cycle (California Energy Commission 2018).
The Energy Commission’s forecast allocated 19 percent of the total square footage of new construction in 2023 to the miscellaneous building type, which is a category for all space types that do not fit well into another building category. It is likely that the Title 24, Part 6 requirements apply to the miscellaneous building types, and savings would be realized from this floorspace. The new construction forecast does not provide sufficient information to distribute the miscellaneous square footage into the most likely building type, so the Statewide CASE Team redistributed the miscellaneous square footage into the remaining building types so that the percentage of building floorspace in each climate zone, net of the miscellaneous square footage, would remain constant. See Table 74 for a sample calculation for redistributing the miscellaneous square footage among the other building types.
After the miscellaneous floorspace was redistributed, the Statewide CASE Team made assumptions about the percentage of newly constructed floorspace that would be impacted by the proposed code change. Table 72 and Table 73 present the assumed percentage of floorspace that would be impacted by the proposed code changes by building type.
2022 Title 24, Part 6 Final CASE Report – 2022-NR-HVAC3-F | 135
To determine the percentage of nonresidential square footage and multifamily dwelling units that were impacted, the Statewide CASE Team relied on the assumed boiler and service water heating capacities in the building prototypes that the Energy Commission provided. If a prototypical building hadcapacities triggered the requirements, then it was assumed that all newly constructed square footage for that building type was impacted by the proposal. For gas boiler systems, the following prototypes met the capacity thresholds (boilers systems with installed capacity of over 1 million Btu/h), so 100 percent of the floorspace was assumed to be impacted impacted: ApartmentHighRise (dorms), OfficeLarge, OfficeMediumLab, SchoolSecondary, and Hospital prototypes since these prototypes have. The Statewide CASE Team assumed that there are many office buildings smaller than the Office Large prototype, in which the input capacity of the boilers in the prototypical design is near 5 Million Btu/h, but larger than the Office Medium, in which the prototypical building has capacities near 800,000 Btu/h. Thus, i to more accurately estimate the statwide savings from offices, , the Statewide CASE Team assumed 100 percent of the floorspace in Office Medium prototype was impacted.
For service water heating systems, none of prototype buildings have the total capacity of at least 1 million Btu/h.
If the existing capacities of the CBECC or DOE building prototypes did not meet the threshold, the Statewide CASE Team utilized ASHRAE building prototype models to determine a boiler and service water heating Btu per square foot intensity for each building type (DOE n.d.). Using this number, a square footage “threshold” was determined to figure out the size a building needed to be to have service water heating or boiler space heating capacity of at least 1 million Btu. Information from the Energy Information Administration’s 2012 Commercial Buildings Energy Consumption Survey (CBECS) was then utilized to determine the percentage of buildings from each building type that would meet their respective size threshold such the boiler or service water heating systems would be equal to or greater than 1 million Btu. 2012 CBECS survey data gives information on the sizes of building prototypes (Energy Information Administration 2015). The CBECS building types do not align perfectly with prototypical buildings available in CBECC-Com, so assumptions were made to map the CBECS and CBECC-Com buildings as closely as possible.
For instance, ASHRAE data showed that hotels would need to have a square footage of at least 136,000 to have a service water heating system of 1 million Btu/h. By using the CBECS data, it was determined that 80 percent of hotel building square footage in the Pacific region was in buildings at or above this threshold. Thus, the Hotelsmall prototype was assumed to have 80 percent of floorspace impacted by gas boiler systems submeasure A similar process was completed for the SchoolSecondary, ApartmentHighRise, Hospital, and HotelSmall prototypes which were assumed to have
2022 Title 24, Part 6 Final CASE Report – 2022-NR-HVAC3-F | 136
11, 10, 33, 80 percent of floorspace impacted by gas service water heating submeasure, respectively.
Table 75 and Table 76 present percentage of floorspace assumed to be impacted by the proposed change by building type. Table 77 and Table 78 present percentage of floorspace assumed to be impacted by the proposed change by climate zone. The proposed code changes would apply in all climate zones, which is indicated with the 100 percent values.
To calculate first-year statewide savings for process boilers, the Statewide CASE Team calculated expected energy savings of a boiler with a 7.5 million Btu/h capacity, which represents the the middle of the 5 to 10 million Btu/h capacity range to which the proposed code change would apply. Note that per unit savings presented in Secttion 4 of this report present results based on a 5 million Btu/h boiler capacity to demonstrate cost-effectiveness of a system that would have the lowest B/C ratio. The energy savings from the 7.5 million Btu/h bouiler was then multiplied by the expected number of precess boilers that would be impacted by the proposed codde change. See Table 79 for the first-year energy impacts of a 7.5 million Btu/h boiler.
To determine the number of process boilers impacted by the proposal, the Statewide CASE Team analyzed permit data from multiple air quality maintenance districts across the state. The 2013 CASE Report on process boilers followed a similar procedure. Using data from the South Coast Air Management District and Bay Area Air Quality Management District, the Statewide CASE Team extrapolated the number of boilers statewide given permits to operate each year, assuming the assumption of a 20-year life span per process boiler (SCAQMD n.d.) (BAAQMD n.d.). This analysis determined that 151 process boilers are installed per year with capacities between 5 and 10 million Btu/h.
2022 Title 24, Part 6 Final CASE Report – 2022-NR-HVAC3-F | 137
Table 72: Estimated New Nonresidential Construction Impacted by Proposed Code Change in 2023 (New Construction), by Climate Zone and Building Type (Million Square Feet), Gas Boilers
Climate Zone
New Construction in 2023 (Million Square Feet) Apartment HighRise HotelSmall Office
2022 Title 24, Part 6 Final CASE Report – 2022-NR-HVAC3-F | 138
Table 73: Estimated New Nonresidential Construction Impacted by Proposed Code Change in 2023 (New Construction), by Climate Zone and Building Type (Million Square Feet), Gas Service Water Heating
Climate Zone
New Construction in 2023 (Million Square Feet) ApartmentHighRise HotelSmall SchoolSecondary Hospital TOTAL
Schools 40% 0% Small School 60% 0% 0% Secondary School 40% 100% 0%
College 90% 0% Small Office 5% 0% 0% Medium Office 15% 100% 0% Medium Office/Lab 20% 100% 0% Public Assembly 5% 0% 0% Secondary School 30% 100% 0% High-Rise Apartment 25% 100% 0%
Hospital 100% 0% Hotel/Motel 80% 0% Offices 100% 0% Medium Office 50% 100% 0% Large Office 50% 100% 0% a. Presents the assumed composition of the main building type category by the building subtypes. All
2022 CASE Reports assumed the same percentages of building subtypes. b. When the building type is composed of multiple subtypes, the overall percentage for the main
building category was calculated by weighing the contribution of each subtype. c. Percent of existing floorspace that would be altered during the first year the 2022 standards are in
effect.
2022 Title 24, Part 6 Final CASE Report – 2022-NR-HVAC3-F | 141
Table 76: Percent of Floorspace Impacted by Proposed Measure, by Building Type for Service Water Heating Systems
Schools 4% 0% Small School 60% 0% 0% Secondary School 40% 11% 0%
College 6% 0% Small Office 5% 0% 0% Medium Office 15% 0% 0% Medium Office/Lab 20% 0% 0% Public Assembly 5% 0% 0% Secondary School 30% 11% 0% High-Rise Apartment 25% 10% 0%
Hospital 33% 0% Hotel/Motel 80% 0% Offices 0% 0% Medium Office 50% 0% 0% Large Office 50% 0% 0% a. Presents the assumed composition of the main building type category by the building subtypes. All
2022 CASE Reports assumed the same percentages of building subtypes. b. When the building type is composed of multiple subtypes, the overall percentage for the main
building category was calculated by weighing the contribution of each subtype. c. Percent of existing floorspace that would be altered during the first year the 2022 standards are in
effect.
2022 Title 24, Part 6 Final CASE Report – 2022-NR-HVAC3-F | 142
Table 77: Percent of Floorspace Impacted by Proposed Measure, by Climate Zone for Gas Boiler Systems
Climate Zone
Percent of Square Footage Impacted New Construction Existing Building Stock (Alterations)a
a. Percent of existing floorspace that would be altered during the first year the 2022 standards are in effect.
2022 Title 24, Part 6 Final CASE Report – 2022-NR-HVAC3-F | 144
Table 79: First-Year Energy Impacts – 7.5 Million Btu/h Process Boiler for Oxygen Concentration- New Construction and Alterations Boiler Capacity Threshold (Million Btu/h) 7.5 Operation Hour per Shift 14.6 Annual Operation day 365 Annual Operation Hours 5333 Baseline Combustion Efficiency 82.1% Proposed Combustion Efficiency 82.8% Standard Design Energy Consumption per Boiler (Therms/year) 487,211 Proposed Design Energy Consumption per Boiler (Therms/year) 483,092 Annual Natural Gas Savings (Therms/year) 4,119 TDVkBtu/therm 239 Annual TDV Energy Savings (TDV kBtu/year) 148,915,732 15-Year PV Adjustment Factor, Nonresidential ($/TDVkBtu) 0.089 15 Year Nominal Adjustment Factor, Nonresidential ($/TDVkBtu) 1.42 Total Energy Cost Savings over 15-year period of analysis (2023 PV $) 13,253,500 Total Energy Cost Savings over 15-year period of analysis (Nominal $) 211,460,339 Incremental and Maintenance Cost Over 15-year period of analysis ($) 12,275.17 Benefit-to-Cost Ratio 7.2
2022 Title 24, Part 6 Final CASE Report – 2022-NR-HVAC3-F | 145
Appendix B: Embedded Electricity in Water Methodology There are no on-site water savings associated with the proposed code change.
2022 Title 24, Part 6 Final CASE Report – 2022-NR-HVAC3-F | 146
Appendix C: Environmental Impacts Methodology
Greenhouse Gas (GHG) Emissions Factors As directed by Energy Commission Staff, GHG emissions were calculated making use of the average emissions factors specified in the United States Environmental Protection Agency (U.S. EPA) Emissions & Generation Resource Integrated Database (eGRID) for the Western Electricity Coordination Council California (WECC CAMX) subregion (United States Environmental Protection Agency 2018). This ensures consistency between state and federal estimations of potential environmental impacts. The electricity emissions factor calculated from the eGRID data is 240.4 metric tons CO2e per GWh. The Summary Table from eGrid 2016 reports an average emission rate of 529.9 pounds CO2e/MWh for the WECC CAMX subregion. This value was converted to metric tons/GWh.
Avoided GHG emissions from natural gas savings attributable to sources other than utility-scale electrical power generation are calculated using emissions factors specified in Chapter 1.4 of the U.S. EPA’s Compilation of Air Pollutant Emissions Factors (AP-42) (United States Environmental Protection Agency 1995). The U.S. EPA’s estimates of GHG pollutants that are emitted during combustion of one million standard cubic feet of natural gas are: 120,000 pounds of CO2 (Carbon Dioxide), 0.64 pounds of N2O (Nitrous Oxide) and 2.3 pounds of CH4 (Methane). The emission value for N2O assumed that low NOx burners are used in accordance with California air pollution control requirements. The carbon equivalent values of N2O and CH4 were calculated by multiplying by the global warming potentials (GWP) that the California Air Resources Board used for the 2000-2016 GHG emission inventory, which are consistent with the 100-year GWPs that the Intergovernmental Panel on Climate Change used in the fourth assessment report (AR4). The GWP for N2O and CH4 are 298 and 25, respectively. Using a nominal value of 1,000 Btu per standard cubic foot of natural gas, the carbon equivalent emission factor for natural gas consumption is 5,454.4 metric tons per million therms.
GHG Emissions Monetization Methodology The 2022 TDV energy cost factors used in the lifecycle cost-effectiveness analysis include the monetary value of avoided GHG emissions based on a proxy for permit costs (not social costs). To demonstrate the cost savings of avoided GHG emissions, the Statewide CASE Team disaggregated the value of avoided GHG emissions from the other economic impacts. The authors used the same monetary values that are used in the TDV factors – $106 per metric tons CO2e.
2022 Title 24, Part 6 Final CASE Report – 2022-NR-HVAC3-F | 147
Water Use and Water Quality Impacts Methodology There are no impacts to water quality or water use.
2022 Title 24, Part 6 Final CASE Report – 2022-NR-HVAC3-F | 148
Appendix D: California Building Energy Code Compliance (CBECC) Software Specification
Introduction The purpose of this appendix is to present proposed revisions to CBECC-Com along with the supporting documentation that the Energy Commission staff and the technical support contractors would need to approve and implement the software revisions.
Appendix D1: Gas Boiler Systems
Technical Basis for Software Change Condensing boilers are a mature technology in commercial settings as addressed in Section 3.2.1. The current Standard Design specifies 80 percent thermal efficiency for gas-fired boilers with input heating capacities of 300,000 Btu/h or more. The new prescriptive criteria for gas-fired space heating boiler systems established in Section 4.1.1 modifies the efficiency of the Standard Design gas boiler to 90 percent, and outlines other key variables needed to simulate the performance of these systems in energy modeling software.
Description of Software Change
Background Information for Software Change This report describes how 90 percent boiler thermal efficiency can be implemented in CBECC-Com for the input heating capacities of 1 – 10 Million Btu/h.
Existing CBECC-Com Modeling Capabilities CBECC-Com currently models the Standard Design gas boiler with 80 percent thermal efficiency for input heating capacities of 300,000 Btu/h or more.
Summary of Proposed Revisions to CBECC-Com The proposed change is described in Section 4.1 including primary building types, space types, climate zones, or systems that are predominantly affected by the measure. CBECC-Com would need to be modified to adjust the Standard Design gas boiler system to perform at a thermal efficiency (Et) of 90 percent for systems between 1Million Btu/h and 10Million Btu/h design capacity. The Standard Design for these boiler systems also needs to be updated to reflect a 120°F boiler water inlet temperature and a temperature difference of 40°F or higher between inlet and outlet at design conditions.
2022 Title 24, Part 6 Final CASE Report – 2022-NR-HVAC3-F | 149
User Inputs to CBECC-Com No changes to user inputs are needed to support this measure.
Simulation Engine Inputs
EnergyPlus/California Simulation Engine Inputs Table 80 summarizes the relevant EnergyPlus input variable and corresponding variable name in CBECC-Com. In EnergyPlus, this variable is located in the Boiler:HotWater object (Figure 4).
Table 80: EnergyPlus Input Variables Relevant to Hot Water Boiler
Target EnergyPlus Class = BOILER:HOTWATER
EnergyPlus Field CBECC-Com user input/specified value (if applicable)
Units Notes
Name Name
Nominal Thermal Efficiency Thermal Eff None Loop Design Temperature Difference
Design Entering/Leaving Temperatures ºF
Figure 4: EnergyPlus object Boiler:Hotwater
2022 Title 24, Part 6 Final CASE Report – 2022-NR-HVAC3-F | 150
Calculated Values, Fixed Values, and Limitations The thermal efficiency of the boiler is between 0 and 1. In the ruleset of HVAC Primary Boiler, section RULE Blr:ThrmlEff needs to be changed to reflect the proposed thermal efficiency of gas boiler systems in Section 7.2. Thermal efficiency (Et) of 90 percent needs to be added for all gas-fired boilers with capacities between 1 million Btu/h and 10 million Btu/h.
Simulation Engine Output Variables CBECC-Com generates hourly EnergyPlus simulation results to CSV files during analysis. These hourly simulation results can be used by the analyst to debug a building energy model. Variables of particular interest in this case would include:
• Boiler Heating Rate,hourly; !- HVAC Average [W]
• Boiler Heating Energy,hourly; !- HVAC Sum [J]
• Boiler Gas Rate,hourly; !- HVAC Average [W]
• Boiler Gas Energy,hourly; !- HVAC Sum [J]
• Boiler Inlet Temperature,hourly; !- HVAC Average [C]
• Boiler Outlet Temperature,hourly; !- HVAC Average [C]
• Boiler Mass Flow Rate,hourly; !- HVAC Average [kg/s]
• Boiler Ancillary Electric Power,hourly; !- HVAC Average [W]
• Boiler Ancillary Electric Energy,hourly; !- HVAC Sum [J]
• Boiler Part Load Ratio,hourly; !- HVAC Average [] The existing algorithms for calculations, fixed values and limitations are sufficient for the proposed measure. No changes are needed.
Compliance Report No change needs to be made for the compliance report for this CASE measure.
Compliance Verification The existing compliance reports are sufficient for the proposed measure. No changes are needed.
Testing and Confirming CBECC-Com Modeling The existing testing and confirmation process are sufficient for the proposed measure. No changes are needed.
Description of Changes to ACM Reference Manual This information is available in Section 7.4.
2022 Title 24, Part 6 Final CASE Report – 2022-NR-HVAC3-F | 151
Appendix D2: Gas Service Water Heat
Technical Basis for Software Change Gas service hot water heating systems are a mature technology in commercial settings as addressed in Section 3.2.2. CBECC-Com currently models 80 percent thermal efficiency for the Standard Design gas storage water heater with input heating capacities larger than 75,000 Btu/h or gas instantaneous water heater with an input larger than 200,000 But/h. The new prescriptive criteria for gas-fired service water heating systems established in Section 4.1.2 provide a basis for changes to the Standard Design gas water heater, and outline the key variables needed to simulate the performance of these systems in energy modeling software.
Description of Software Change
Background Information for Software Change The compliance software would need to be modified to reflect a thermal efficiency (Et) of 90 percent for Standard Design gas service hot water systems with capacities between 1Million Btu/h and 10Million Btu/h.
Existing CBECC-Com Modeling Capabilities CBECC-Com currently models 80 percent thermal efficiency for the Standard Design gas storage water heater with input heating capacities of larger than 75,000 Btu/h or gas instantaneous water heater with an input of larger than 200,000 But/h.
Summary of Proposed Revisions to CBECC-Com This report proposes revising the thermal efficiency of Standard Design gas service hot water heating systems with design capacities between 1– 10Million Btu/h from 80 percent Et to 90 percent Et.
User Inputs to CBECC-Com No changes to user inputs are needed to support this measure.
Simulation Engine Inputs
EnergyPlus/California Simulation Engine Inputs Table 81 summarizes the relevant EnergyPlus input variable and corresponding variable name in CBECC-Com. In EnergyPlus, this variable is part of the WaterHeater:Mixed object. (Figure 5).
2022 Title 24, Part 6 Final CASE Report – 2022-NR-HVAC3-F | 152
Table 81: EnergyPlus Input Variables Relevant to Hot Water Heater Target EnergyPlus Class = WaterHeater:Mixed
EnergyPlus Field CBECC-Com user input/specified value (if applicable)
Units Notes
Name Name Heater Thermal Efficiency Thermal Efficiency None
Figure 5: EnergyPlus input for a Water Heater
2022 Title 24, Part 6 Final CASE Report – 2022-NR-HVAC3-F | 153
Calculated Values, Fixed Values, and Limitations In the ruleset of WaterHeater, section RULE WtrHtr:CodeMinThrmlEff needs to be changed to reflect the proposed thermal efficiency of gas boiler systems in Section 7.2. Thermal efficiency (Et) of 90 percent needs to be added for all gas-water heater with design capacities equal to or greater than 1 million Btu/h.
Simulation Engine Output Variables CBECC-Com generates hourly EnergyPlus simulation results to CSV files during analysis. These hourly simulation results can be used by the analyst to debug a building energy model. Variables of particular interest in this case would include:
• Water Heater Tank Temperature,hourly; !- HVAC Average [C] • Water Heater Final Tank Temperature,hourly; !- HVAC Average [C] • Water Heater Heat Loss Rate,hourly; !- HVAC Average [W] • Water Heater Heat Loss Energy,hourly; !- HVAC Sum [J] • Water Heater Use Side Mass Flow Rate,hourly; !- HVAC Average [kg/s] • Water Heater Use Side Inlet Temperature,hourly; !- HVAC Average [C] • Water Heater Use Side Outlet Temperature,hourly; !- HVAC Average [C] • Water Heater Use Side Heat Transfer Rate,hourly; !- HVAC Average [W] • Water Heater Use Side Heat Transfer Energy,hourly; !- HVAC Sum [J] • Water Heater Source Side Mass Flow Rate,hourly; !- HVAC Average [kg/s] • Water Heater Source Side Inlet Temperature,hourly; !- HVAC Average [C] • Water Heater Source Side Outlet Temperature,hourly; !- HVAC Average [C] • Water Heater Source Side Heat Transfer Rate,hourly; !- HVAC Average [W] • Water Heater Source Side Heat Transfer Energy,hourly; !- HVAC Sum [J] • Water Heater Off Cycle Parasitic Tank Heat Transfer Rate,hourly; !- HVAC
Average [W] • Water Heater Off Cycle Parasitic Tank Heat Transfer Energy,hourly; !- HVAC
Sum [J] • Water Heater On Cycle Parasitic Tank Heat Transfer Rate,hourly; !- HVAC
Average [W] • Water Heater On Cycle Parasitic Tank Heat Transfer Energy,hourly; !- HVAC
Sum [J] • Water Heater Total Demand Heat Transfer Rate,hourly; !- HVAC Average [W] • Water Heater Total Demand Heat Transfer Energy,hourly; !- HVAC Sum [J] • Water Heater Heating Rate,hourly; !- HVAC Average [W] • Water Heater Heating Energy,hourly; !- HVAC Sum [J] • Water Heater Unmet Demand Heat Transfer Rate,hourly; !- HVAC Average [W] • Water Heater Unmet Demand Heat Transfer Energy,hourly; !- HVAC Sum [J] • Water Heater Venting Heat Transfer Rate,hourly; !- HVAC Average [W]
2022 Title 24, Part 6 Final CASE Report – 2022-NR-HVAC3-F | 154
• Water Heater Venting Heat Transfer Energy,hourly; !- HVAC Sum [J] • Water Heater Net Heat Transfer Rate,hourly; !- HVAC Average [W] • Water Heater Net Heat Transfer Energy,hourly; !- HVAC Sum [J] • Water Heater Cycle On Count,hourly; !- HVAC Sum [] • Water Heater Runtime Fraction,hourly; !- HVAC Average [] • Water Heater Part Load Ratio,hourly; !- HVAC Average [] • Water Heater Gas Rate,hourly; !- HVAC Average [W] • Water Heater Gas Energy,hourly; !- HVAC Sum [J] • Water Heater Off Cycle Parasitic Gas Rate,hourly; !- HVAC Average [W] • Water Heater Off Cycle Parasitic Gas Energy,hourly; !- HVAC Sum [J] • Water Heater On Cycle Parasitic Gas Rate,hourly; !- HVAC Average [W] • Water Heater On Cycle Parasitic Gas Energy,hourly; !- HVAC Sum [J] • Water Heater Water Volume Flow Rate,hourly; !- HVAC Average [m3/s] • Water Heater Water Volume,hourly; !- HVAC Sum [m3] • Water Heater Mains Water Volume,hourly; !- HVAC Sum [m3]
Compliance Report The existing compliance reports are sufficient for the proposed measure. No changes are needed.
Compliance Verification The existing compliance verification processes are sufficient for the proposed measure. No changes are needed.
Testing and Confirming CBECC-Com Modeling The thermal efficiency of gas-fired service water heaters between 1Million Btu/h and 10 Million Btu/h in the Standard Design model should be confirmed by checking the thermal efficiency field of the Boiler:HotWater objects generated by CBECC-Com.
Description of Changes to ACM Reference Manual This information is available in Section 7.4.
2022 Title 24, Part 6 Final CASE Report – 2022-NR-HVAC3-F | 155
Appendix E: Impacts of Compliance Process on Market Actors This appendix discusses how the recommended compliance process, which is described in Section 2.5 could impact various market actors. Table 82 identifies the market actors who would play a role in complying with the proposed change, the tasks for which they would be responsible, their objectives in completing the tasks, how the proposed code change could impact their existing work flow, and ways negative impacts could be mitigated. The information contained in Table 82 is a summary of key feedback the Statewide CASE Team received when speaking to market actors about the compliance implications of the proposed code changes. Appendix F summarizes the stakeholder engagement that the Statewide CASE Team conducted when developing and refining the code change proposal, including gathering information on the compliance process.
To ensure compliance is achievable, straightforward and as effortless as possible, market actors would need to adopt new workflows to accommodate for the updated requirements. Changing boiler and service hot water requirements from individual thermal efficiencies to a weighted thermal efficiency would require new workflows from the HVAC and plumbing designer and plans examiners specifically. The design teams would need to first identify if the project is impacted by these proposed requirements and if so, calculate weighted thermal efficiencies in order to ensure the project complies. The flow rate, supply water return temperature, and oxygen concentration levels would be specified by the pluming designer. A new task for plans examiners would be to verify the newly created thermal efficiency metric.
2022 Title 24, Part 6 Final CASE Report – 2022-NR-HVAC3-F | 156
Table 82: Roles of Market Actors in the Proposed Compliance Process
Market Actor
Task(s) In Compliance Process
Objective(s) in Completing Compliance Tasks
How Proposed Code Change Could Impact Work Flow
Opportunities to Minimize Negative Impacts of Compliance Requirement
HVAC Designer
• Include rated efficiency in equipment schedule
• Include flow rates in equipment schedules and specifications
• Include return water temp in plumbing spec or as footnote to equipment
Document design conditions to ensure condensing operation of the water heater or boiler
WA boiler: Would require a minor calculation shift for HVAC designer to do a weighted avg. for boiler efficiency. Trigger based on boiler capacity.
Ensure design documents display individual efficiencies as well as weighted average efficiencies.
Plans Examiner
Can verify inputs (boiler capacity, # of boilers, rated efficiency) on the equipment schedule
Confirm that the weighted system thermal efficiency is 90 percent or above
• Temp & Flow rate: Would need to review return temp & flow rate on equipment schedule vs. the compliance document inputs.
• Verify weighted thermal efficiency has been calculated correctly
The Statewide CASE Team recommends providing clear language in the compliance manual to show when these proposed requirements are triggered
Plumbing Designer
Include rated efficiency in equipment schedule
Ensure design requirements are carried through in design
Include weighted average rated efficiency in equipment schedule
Ensure design documents display individual efficiencies as well as weighted average efficiencies.
HVAC Contractor
Install HVAC systems in compliance with current Title 24, Part 6 code
Ensure boiler and service water heating systems follow the thermal efficiencies and hot water return requirements in the design plan
Be aware of the new thermal efficiency, oxygen concentration, and return water requirements
Ensure design documents display individual efficiencies as well as weighted average efficiencies.
2022 Title 24, Part 6 Final CASE Report – 2022-NR-HVAC3-F | 157
Appendix F: Summary of Stakeholder Engagement Collaborating with stakeholders that might be impacted by proposed changes is a critical aspect of the Statewide CASE Team’s efforts. The Statewide CASE Team aims to work with interested parties to identify and address issues associated with the proposed code changes so that the proposals presented to the Energy Commission in this Final CASE Report are generally supported. Public stakeholders provide valuable feedback on draft analyses and help identify and address challenges to adoption including: cost effectiveness; market barriers; technical barriers; compliance and enforcement challenges; or potential impacts on human health or the environment. Some stakeholders also provide data that the Statewide CASE Team uses to support analyses.
This appendix summarizes the stakeholder engagement that the Statewide CASE Team conducted when developing and refining the recommendations presented in this report.
Utility-Sponsored Stakeholder Meetings Utility-sponsored stakeholder meetings provide an opportunity to learn about the Statewide CASE Team’s role in the advocacy effort and to hear about specific code change proposals that the Statewide CASE Team is pursuing for the 2022 code cycle. The goal of stakeholder meetings is to solicit input on proposals from stakeholders early enough to ensure the proposals and the supporting analyses are vetted and have as few outstanding issues as possible. To provide transparency in what the Statewide CASE Team is considering for code change proposals, during these meetings the Statewide CASE Team asks for feedback on:
• Proposed code changes
• Draft code language
• Draft assumptions and results for analyses
• Data to support assumptions
• Compliance and enforcement, and
• Technical and market feasibility
The Statewide CASE Team hosted two stakeholder meetings for Gas Boiler Systems and Service water Heating via webinar. Please see below for dates and links to event pages on Title24Stakeholders.com. Materials from each meeting. Such as slide presentations, proposal summaries with code language, and meeting notes, are included in the bibliography section of this report.
The first round of utility-sponsored stakeholder meetings occurred from September to November 2019 and were important for providing transparency and an early forum for stakeholders to offer feedback on measures being pursued by the Statewide CASE Team. The objectives of the first round of stakeholder meetings were to solicit input on the scope of the 2022 code cycle proposals; request data and feedback on the specific approaches, assumptions, and methodologies for the energy impacts and cost-effectiveness analyses; and understand potential technical and market barriers. The Statewide CASE Team also presented initial draft code language for stakeholders to review.
The second round of utility-sponsored stakeholder meetings occurred from March to May 2020 and provided updated details on proposed code changes. The second round of meetings introduced early results of energy, cost-effectiveness, and incremental cost analyses, and solicited feedback on refined draft code language.
Utility-sponsored stakeholder meetings were open to the public. For each stakeholder meeting, two promotional emails were distributed from [email protected] One email was sent to the entire Title 24 Stakeholders listserv, totaling over 1,900 individuals, and a second email was sent to a targeted list of individuals on the listserv depending on their subscription preferences. The Title 24 Stakeholders’ website listserv is an opt-in service and includes individuals from a wide variety of industries and trades, including manufacturers, advocacy groups, local government, and building and energy professionals. Each meeting was posted on the Title 24 Stakeholders’ LinkedIn page7 (and cross-promoted on the Energy Commission LinkedIn page) two weeks before each meeting to reach out to individuals and larger organizations and channels outside of the listserv. The Statewide CASE Team conducted extensive personal outreach to stakeholders identified in initial work plans who had not yet opted into the listserv. Exported webinar meeting data captured attendance numbers and individual comments,
7 Title 24 Stakeholders’ LinkedIn page can be found here: https://www.linkedin.com/showcase/title-24-stakeholders/.
2022 Title 24, Part 6 Final CASE Report – 2022-NR-HVAC3-F | 159
and recorded outcomes of live attendee polls to evaluate stakeholder participation and support.
Statewide CASE Team Communications The Statewide CASE Team held personal communications over email and phone with numerous stakeholders when developing this report. Below is a non-exhaustive summary of notable organizations and individuals that were contacted when developing this proposal.
Table 83: Summary of Outreach Contacts and Organizations Organization Contact A.O. Smith Ashley Armstrong Lochinvar Brian Iske Bradford White Eric Truskoski Clever Brooks Brian Huibregtse LAARS Chuck O'Donnell Sidel Systems Sid Abma ACEEE Christopher Perry Patterson-Kelley Patrick Villaume Autoflame Steve Kemp HTP David Martin Keiser Permanente Travis R. English ACCA Wes Davis AHRI Laura Petrillo-Groh 2050 Partners John Bade Rheem Joe Boros
2022 Title 24, Part 6 Final CASE Report – 2022-NR-HVAC3-F | 160
Appendix G: Nominal Savings Tables In Section 5, the energy cost savings of the proposed code changes over the 15-year period of analysis are presented in 2023 present value dollars.
This appendix presents energy cost savings in nominal dollars. Energy costs are escalating as in the TDV analysis but the time value of money is not included so the results are not discounted.
Gas Boiler Systems
Table 84: Nominal TDV Energy Cost Savings Over 15-Year Period of Analysis –Square Foot – New Construction- Apartment High Rise
2022 Title 24, Part 6 Final CASE Report – 2022-NR-HVAC3-F | 173
Process Oxygen Concentration
Table 97: Nominal TDV savings process boilers
Boiler Capacity Threshold (Million Btu/h) 5 Operation Hour per Shift 14.6 Annual Operation day 365 Annual Operation Hours 5333 Baseline Thermal Efficiency 82.1% Proposed Thermal Efficiency 82.8% Standard Design Energy Consumption per Boiler (Therms/year) 324,807 Proposed Design Energy Consumption per Boiler (Therms/year) 322,061 Annual Natural Gas Savings (Therms/year) 2,746 TDVkBtu/therm 239 Annual TDV Energy Savings (TDV kBtu/year) 657,465 15-Year PV Adjustment Factor, Nonresidential ($/TDVkBtu) 0.089 15 Year Nominal Adjustment Factor, Nonresidential ($/TDVkBtu) 1.42 Total Energy Cost Savings over 15-year period of analysis (2023 PV $) 58,514 Total Energy Cost Savings over 15-year period of analysis (Nominal $) 933,600 Incremental and Maintenance Cost Over 15-year period of analysis ($) 12275.17 Benefit-to-Cost Ratio 4.8