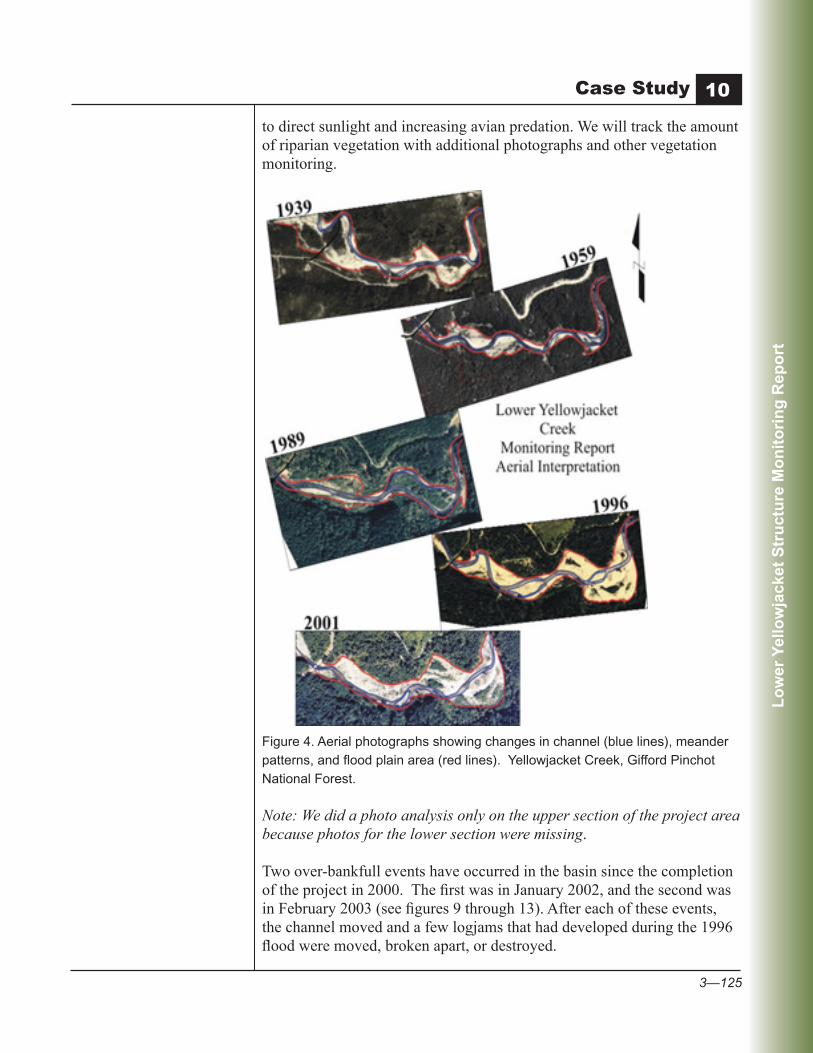
3—119 Case Study Lower Yellowjacket Structure Monitoring Report Project Overview Yellowjacket Creek is an average-sized westside cascade mountain stream with summer streamflows averaging 25 cubic feet per second. Overall length is a little over 12 miles, and the stream has stream reaches ranging from A2 to C3 (Rosgen 1996). Chinook, coho, and steelhead populate the stream up to a series of falls at approximately river mile 5.5. The stream has one culvert and two bridge crossings. The watershed is 66.5 square miles and, from the U.S. Geological Survey regression tables (WRIR 97- 4277), the 2-year-flow event is 2,650 cubic feet per second. In 1996 the Cispus River Watershed was hit by a 250-year flood event. This event caused catastrophic damage forest wide and numerous slides and culvert failures occurred in the Yellowjacket Creek watershed. The alluvial reach (project area) of Yellowjacket Creek was stripped of all vegetation, pools were filled, and a new series of logjams were deposited. The project area is divided by Forest Road 28 Bridge (figure 1). The area above the bridge has an average flood plain width of 750 feet, with little remaining vegetation. The section below the bridge has an average flood- plain width of 1,100 feet with some areas of vegetation, consisting mostly of willows and alders. We completed the Lower Yellowjacket Enhancement Project during the summer of 2000, placing 48 structures (110 logs) both in the channel and in the flood plain. The project reach is 1.5 miles in length. We designed these structures with two objectives in mind: l Provide structure to the flood plain for long-term stability. (Add enough wood to the flood plain so that the flood plain reaches a balance.) l Provide structure to the stream channel for pool development in the form of logjams and single logs. (Increase the number of pools to around 25 pools within the reach.) Of the 48 structures, we placed 31 (65 percent) in the flood plain or in dry side channels at time of construction. We placed the remaining 17 (35 percent) in the channel as fish habitat structures. 10 Lower Yellowjacket Structure Monitoring Report
Project Monitoring, Partnerships, and Costs TheimplementationoftheprojectwasfundedbytheLowerColumbia
SalmonRecoveryFund,andthetotalcostwas$19,662.50.Thiscostdidnotincludesalary.Themonitoringoftheprojectwasmadepossiblebyfunds($8,000)fromtheSanDimasTechnologyandDevelopmentCenter.Wewillcollectdata(logcount,vegetationplots)fromthelowerhalfoftheproject area during the summer.
Lessons Learned or developed Thefollowingarefewthingstothinkaboutwhensettingupamonitoring
4.Thinkabouthowandfromwhereyoucanviewasite(structure)duringafloodevent.Beingabletoobserveandgetphotosduringalltypesofweatherandflowsiscriticaltounderstandinghowthestructures are functioning.
For more information on this project contact: TerryLawson,CowlitzValleyR.D.,GiffordPinchotNationalForest,P.O.Box670,Randle,WA98377;phone:360-497-1100.
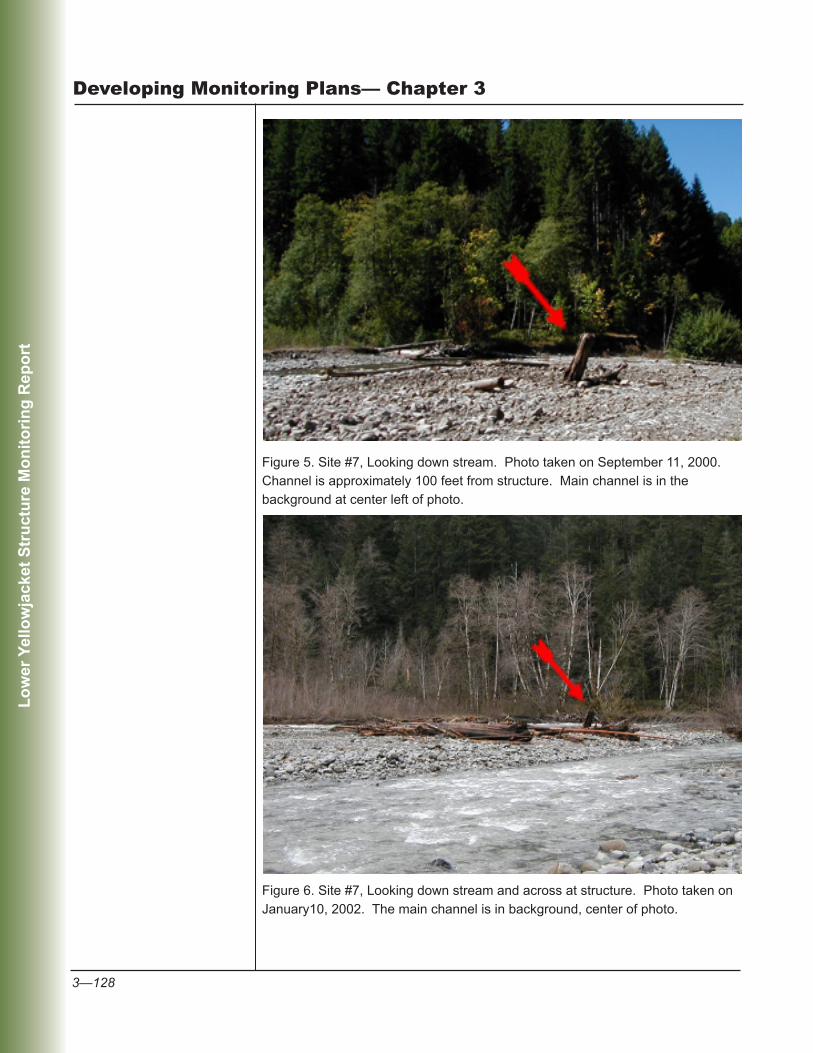
Figure 5. Site #7, Looking down stream. Photo taken on September 11, 2000. Channel is approximately 100 feet from structure. Main channel is in the background at center left of photo.
Figure 6. Site #7, Looking down stream and across at structure. Photo taken on January10, 2002. The main channel is in background, center of photo.
Lo
wer
Yel
low
jack
et S
tru
ctu
re M
on
ito
rin
g R
epo
rt
3—129
Case Study
Figure 7. Site #7, Looking down stream at structure. Photo taken on February 3, 2003. The main channel can not be seen in photo but it is at the shadow line.
Figure 8. Site #8, Looking down stream at structure. Photo taken on September 12, 2000. The main channel can not be seen in photo and is on the left side of the structure.
Lo
wer
Yel
low
jack
et S
tru
ctu
re M
on
ito
rin
g R
epo
rt
3—130
developing Monitoring Plans— Chapter 3
Figure 9. Site #8, Looking down stream at structure. Photo taken on January 10, 2002. The new channel is on the left side of the structure.
Figure 10. Site #8, Looking down stream and across to structure. Photo taken on March 2, 2002. The new channel is in the center of the photo.
Lo
wer
Yel
low
jack
et S
tru
ctu
re M
on
ito
rin
g R
epo
rt
3—131
Case Study
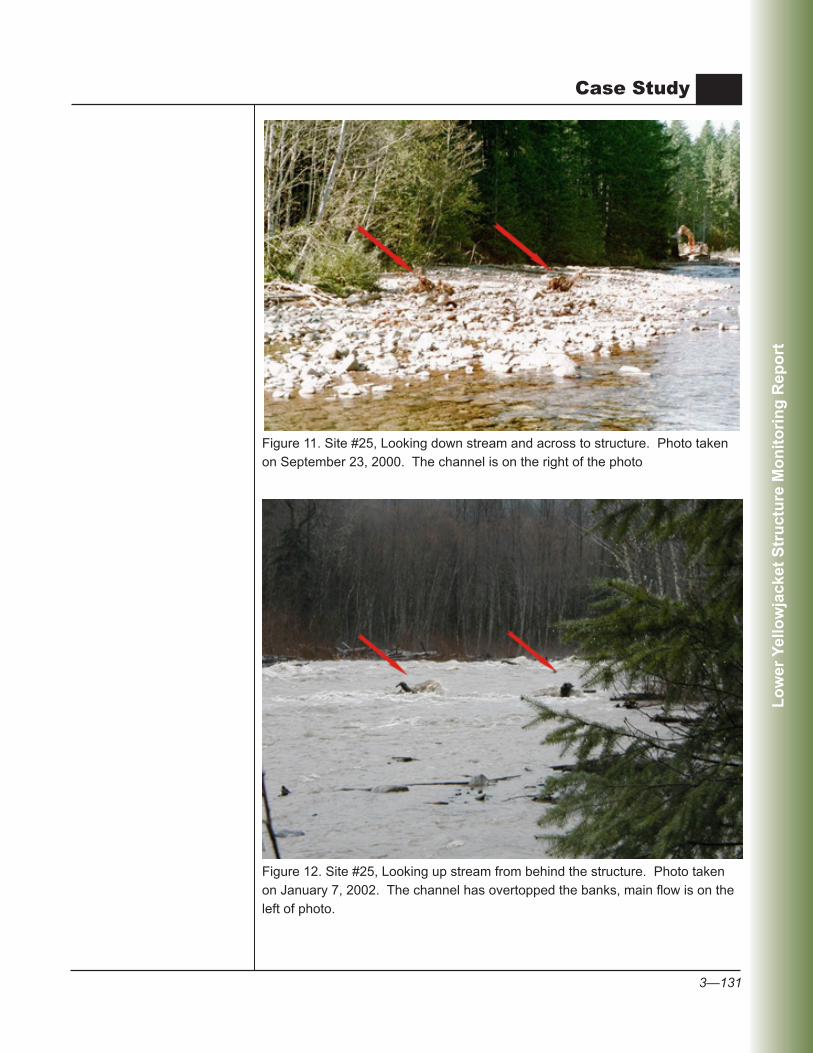
Figure 11. Site #25, Looking down stream and across to structure. Photo taken on September 23, 2000. The channel is on the right of the photo
Figure 12. Site #25, Looking up stream from behind the structure. Photo taken on January 7, 2002. The channel has overtopped the banks, main flow is on the left of photo.
Lo
wer
Yel
low
jack
et S
tru
ctu
re M
on
ito
rin
g R
epo
rt
3—132
developing Monitoring Plans— Chapter 3
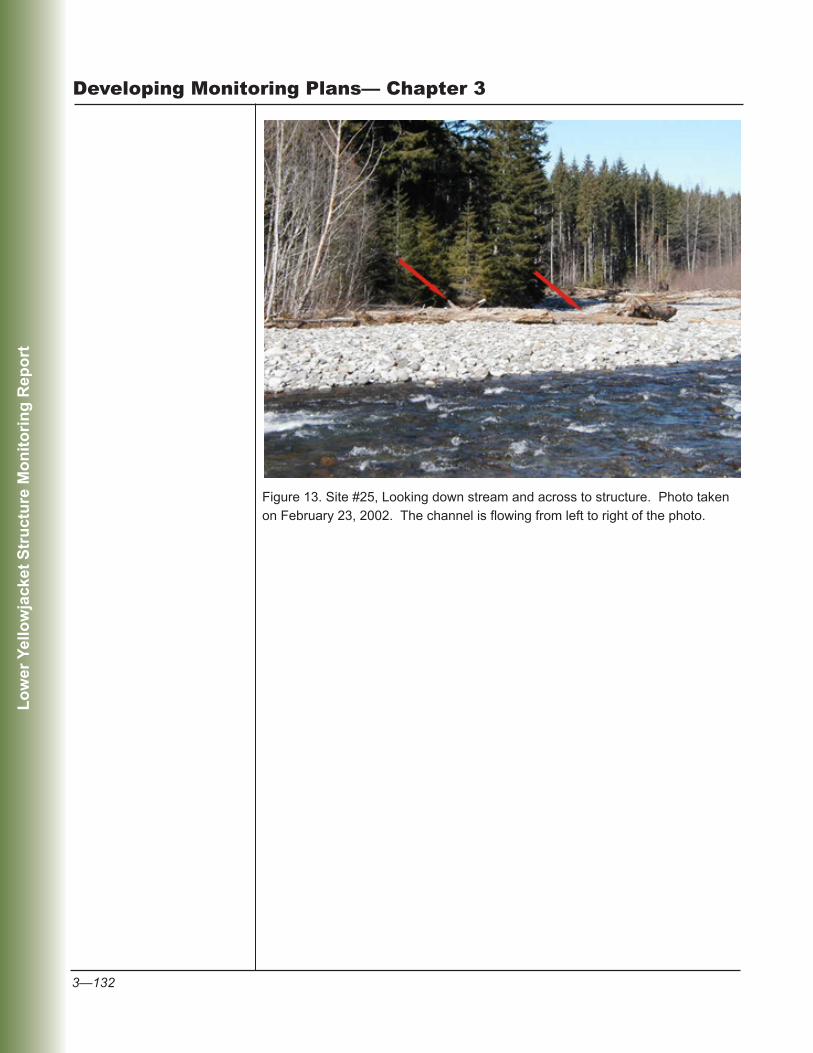
Figure 13. Site #25, Looking down stream and across to structure. Photo taken on February 23, 2002. The channel is flowing from left to right of the photo.