
3—119
Case Study
Lower Yellowjacket Structure Monitoring report
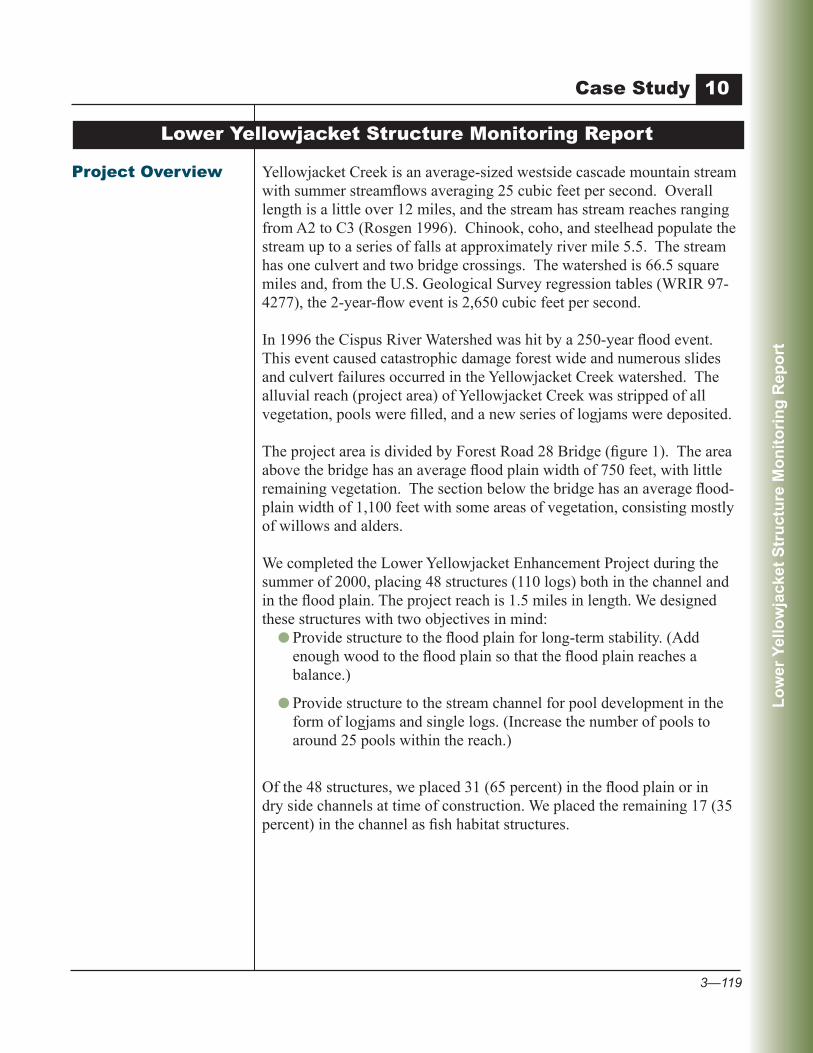
Project overview YellowjacketCreekisanaverage-sizedwestsidecascademountainstreamwithsummerstreamflowsaveraging25cubicfeetpersecond.Overalllengthisalittleover12miles,andthestreamhasstreamreachesrangingfromA2toC3(Rosgen1996).Chinook,coho,andsteelheadpopulatethestreamuptoaseriesoffallsatapproximatelyrivermile5.5.Thestreamhasoneculvertandtwobridgecrossings.Thewatershedis66.5squaremilesand,fromtheU.S.GeologicalSurveyregressiontables(WRIR97-4277),the2-year-floweventis2,650cubicfeetpersecond.
In1996theCispusRiverWatershedwashitbya250-yearfloodevent.ThiseventcausedcatastrophicdamageforestwideandnumerousslidesandculvertfailuresoccurredintheYellowjacketCreekwatershed.Thealluvialreach(projectarea)ofYellowjacketCreekwasstrippedofallvegetation,poolswerefilled,andanewseriesoflogjamsweredeposited.
TheprojectareaisdividedbyForestRoad28Bridge(figure1).Theareaabovethebridgehasanaveragefloodplainwidthof750feet,withlittleremainingvegetation.Thesectionbelowthebridgehasanaverageflood-plainwidthof1,100feetwithsomeareasofvegetation,consistingmostlyofwillowsandalders.
WecompletedtheLowerYellowjacketEnhancementProjectduringthesummerof2000,placing48structures(110logs)bothinthechannelandinthefloodplain.Theprojectreachis1.5milesinlength.Wedesignedthesestructureswithtwoobjectivesinmind:
lProvidestructuretothefloodplainforlong-termstability.(Addenoughwoodtothefloodplainsothatthefloodplainreachesabalance.)
lProvidestructuretothestreamchannelforpooldevelopmentintheformoflogjamsandsinglelogs.(Increasethenumberofpoolstoaround25poolswithinthereach.)
Ofthe48structures,weplaced31(65percent)inthefloodplainorindrysidechannelsattimeofconstruction.Weplacedtheremaining17(35percent)inthechannelasfishhabitatstructures.
10
Lo
wer
Yel
low
jack
et S
tru
ctu
re M
on
ito
rin
g R
epo
rt

3—120
developing Monitoring Plans— Chapter 3
Figure 1: Topographic map of the project area. (Streamflow is from bottom of page to top.
Lo
wer
Yel
low
jack
et S
tru
ctu
re M
on
ito
rin
g R
epo
rt
3—121
Case Study 10
Project Methods, design, and Monitoring Wetookserialphotographsin1996ofYellowjacketandotherstreams
intheCispusRiverwatershed.Photosfromthisflightshowthechannellocationandfloodplainconditiononlymonthsafterthe1996flood.By1997,thechannelhadmoved.Wesawclearlythatwithoutsomekindofstructureonorinthefloodplain,thechannelwasgoingtocontinuetomigrateatwill,anyfishstructuresaddedtothechannelwouldbeabandoned,andnothingcouldholdthemeandersinplace.
Giventhisnewinformation,wechangedthedesignstrategy.Thefirstentryontothefloodplainwouldincludeadesignfor48structures,eithersingle-logorsmalljams.Forthefirstentry,weplacedthesestructuresintheoverflowchannels,addedlogstotheexistingstructures,andbuiltjamstoprotectislandsofvegetation.Inafewcases,webuiltjamsonthefloodplainatareaswithahighprobabilityofbecomingameanderlocation.
Monitoring Objectives l Test the hypotheses:
cThatasthechannelmovedacrossthefloodplain,structuresplacedonorinthefloodplainwouldprovidestructureforpooldevelopmentandotherfunctionsofahealthychannelsegment.
cThatprovidingstructuretothestreamintheformoflogjamsandsinglelogswoulddeveloppools,increasingthenumberofqualitypoolstoabout25fortheentirereach.(Wedefinedaqualitypoolasonewitharesidualdepthof3feetormore.)
Monitoring Parameter lCountwoodydebrispiecesatstructuresites.
l Count and measure pools in the project area.
lTrackchannelmovementandinteractionofstructuresandchannel.
Procedures and Methods Duringtheinitialdesignphase,weestablished14photo-pointlocations,
andatopographicalsitesurvey.WesurveyedthesitewithaNikon430TMTotalStationGun.Thesurveycoveredtheprojectsitefromabedrockcontrolpointapproximately0.5milesupstreamfromFR28BridgetotheconfluenceofYellowjacketCreekandCispusRiver.Thesurveycoveredapproximately128acres,inwhichweestablished15controlpoints.Wedevelopedasitemapfromthesurveydataandusedthemapto
Lo
wer
Yel
low
jack
et S
tru
ctu
re M
on
ito
rin
g R
epo
rt

3—122
developing Monitoring Plans— Chapter 3
locatestructures,crosssections,photopoints,largelogjams,roadaccess,vegetationislands,sidechannel,andthemainchannel.Thesitemapalsoallowedustocalculatebeltwidthandmeanderwavelength.
WeusedRegion6LevelII(USDAForestService1990,2001)surveydatafrom1990and2001forwoodcounts,poolnumbers,andquality.Wealsouseddatafromthe1997designsurveyanda2003monitoringsurvey.
Thedistricthasanaerialphotolibrarystartedin1937,withdistrictcoverageto1999andspecialflightsto2003.TheconfluenceofCispusRiverandYellowjacketCreekhascoveragefrom1939to2001.Weusedthephotointerpretationtomeasurethechangesintheflood-plainvegetationandchannelmovement,andusedsitevisitsandphotopointstodocumentinteractionbetweenthestructuresandthechannel.
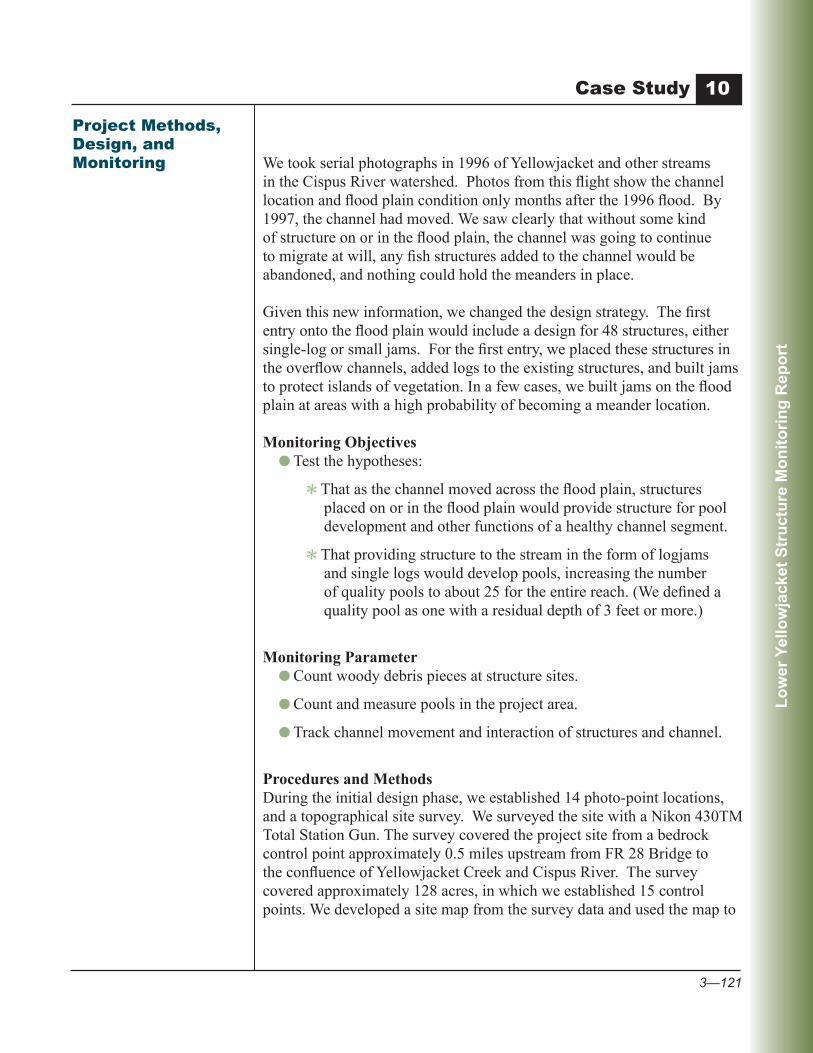
Monitoring results and Interpretation (a) Parameter: Count woody debris pieces at structure sites. Theoriginalprojectconsistedof35sites,withsomesiteshavingmultiple
structures.Thefinalnumberwas48structures,consistingof178logs(figure2).
Figure 2. Log count at the various sites.
Aspartofthemonitoringeffort,wephotographedeachsite,countedthelargerwoodydebris,andmatchedthecountagainsttheoriginalnumbers.WelocatedeachstructurebyGPS.Oftheoriginal48structuresbuiltinAugust2000,5sitesweredestroyedorhadmoveddownstream.These5
L ow er Y el l ow j ack et C r eek
M on i tor i n g R ep or t
L og C ou n t
0
5
10
15
20
25
30
35
Site 1 Site 3 Site5 Site7 Site 9 Site 11 Site 13 Site15 Site17 Site 19 Site 21 Site 23 Site25 Site27 Site 29 Site 31 Site 33 Site35
Logs per Site
Construction Year, 2000
Monitoring Year, 2003
Logs
per
site
Site Number
1 3 5 7 9 11 13 15 17 19 21 23 25 27 29 31 33 35
Lo
wer
Yel
low
jack
et S
tru
ctu
re M
on
ito
rin
g R
epo
rt

3—123
Case Study
sitesconsistedof48logs(27percentofthetotalnumberofpiecesplacedinAugust2000).Overall,weobservedanetgainoffivelogs,a3-percentincrease.
Weidentifiedsomelogsthathadmovedfurtherdownstream.However,wehavenotfoundallofthelogs,andbelievethatsomehavemadeittotheCispusRiver.Oneofthelargerlogs(67feetlongand96inchesaround,at4.5feetfromroots)atsite4Bhasmovedapproximately560feetandisnowinthemiddleofthechannel.Wefoundlogsfromsites14,15,and17scattereddownthestreamcourseandinanewlogjamthatformedjustupstreamfromthebridge—adistanceofabout1,100feet.Thelargerlogsdroppedoutearly,andthesmalllogsmadeittothejamabovethebridge.Belowthebridge,halfofsite24hasbeenrelocated:Averylargestump(mostofthestructure’smass)movedadistanceof640feet,buttherestofthestructureismissing.Site29,asmalllogjamkeyedintothechannelsubstrateandtheleftbank,appearstohavebeencompletelydestroyed.Noneofthelogsfromthisstructurehavebeenfound.
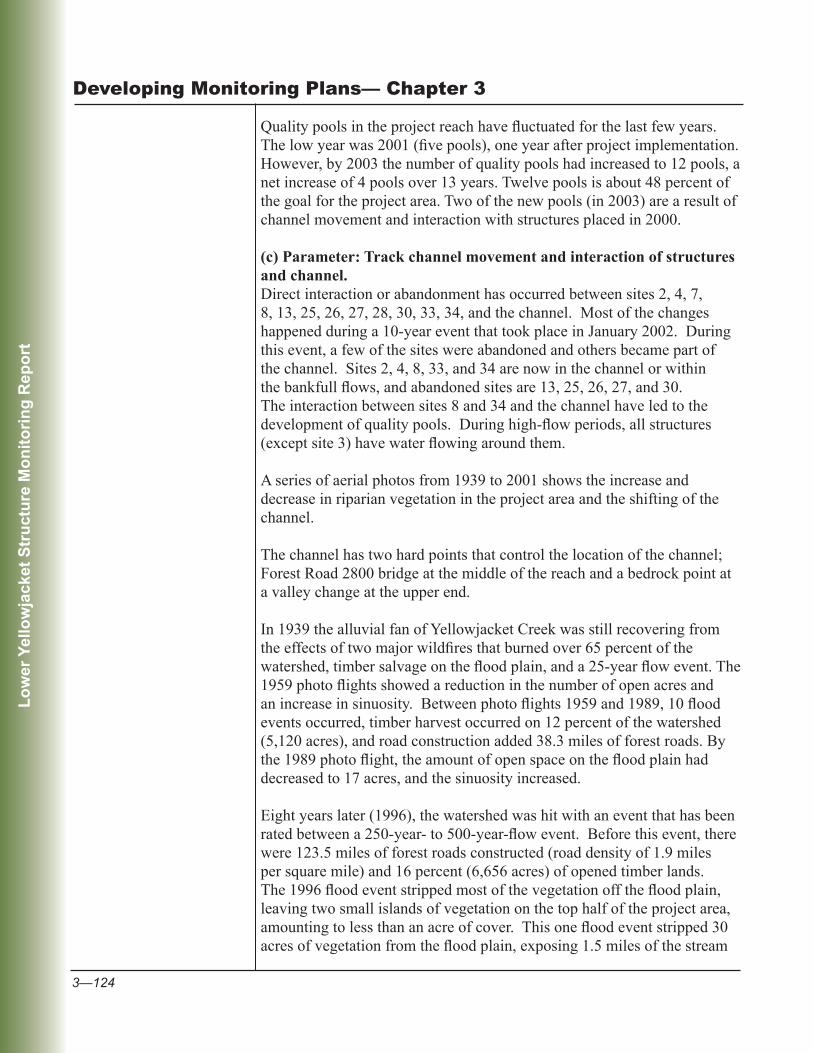
(b) Parameter: Count and measure pools in the project area. ThedistricthasdatafromtwoRegion6LevelIIsurveys(1990and2001)
andfromasitesurveydonein1997aspartofthedesigncriteriafortheproject.Wedidafourthpoolsurveyin2003,aspartofthemonitoringeffort(usingRegion6LevelIIprotocol).Twoofthepoolsin2003areadirectresultofinteractionbetweenaconstructedstructureandthechannelmoving(figure3).
Figure 3. Pool abundance within project area.
10
L ow er Y el l ow j a ck et C r eek
M on itor i n g R ep or t
P ool s
0
2
4
6
8
10
12
14
1990 1997 2001 2003Y e a r o f S u r v e y
# of Pools
Num
ber
of p
ools
Year of survey
Lo
wer
Yel
low
jack
et S
tru
ctu
re M
on
ito
rin
g R
epo
rt
3—124
developing Monitoring Plans— Chapter 3
Qualitypoolsintheprojectreachhavefluctuatedforthelastfewyears.Thelowyearwas2001(fivepools),oneyearafterprojectimplementation.However,by2003thenumberofqualitypoolshadincreasedto12pools,anetincreaseof4poolsover13years.Twelvepoolsisabout48percentofthegoalfortheprojectarea.Twoofthenewpools(in2003)arearesultofchannelmovementandinteractionwithstructuresplacedin2000.
(c) Parameter: Track channel movement and interaction of structures and channel.
Directinteractionorabandonmenthasoccurredbetweensites2,4,7,8,13,25,26,27,28,30,33,34,andthechannel.Mostofthechangeshappenedduringa10-yeareventthattookplaceinJanuary2002.Duringthisevent,afewofthesiteswereabandonedandothersbecamepartofthechannel.Sites2,4,8,33,and34arenowinthechannelorwithinthebankfullflows,andabandonedsitesare13,25,26,27,and30.Theinteractionbetweensites8and34andthechannelhaveledtothedevelopmentofqualitypools.Duringhigh-flowperiods,allstructures(exceptsite3)havewaterflowingaroundthem.
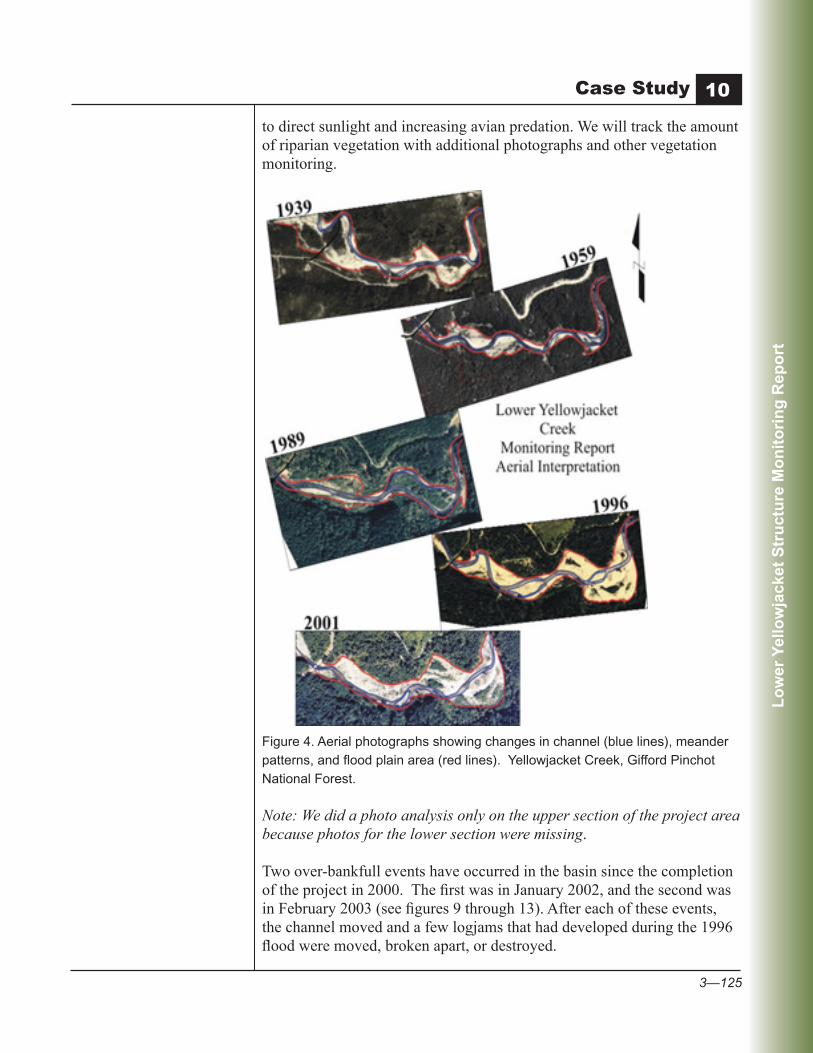
Aseriesofaerialphotosfrom1939to2001showstheincreaseanddecreaseinriparianvegetationintheprojectareaandtheshiftingofthechannel.
Thechannelhastwohardpointsthatcontrolthelocationofthechannel;ForestRoad2800bridgeatthemiddleofthereachandabedrockpointatavalleychangeattheupperend.
In1939thealluvialfanofYellowjacketCreekwasstillrecoveringfromtheeffectsoftwomajorwildfiresthatburnedover65percentofthewatershed,timbersalvageonthefloodplain,anda25-yearflowevent.The1959photoflightsshowedareductioninthenumberofopenacresandanincreaseinsinuosity.Betweenphotoflights1959and1989,10floodeventsoccurred,timberharvestoccurredon12percentofthewatershed(5,120acres),androadconstructionadded38.3milesofforestroads.Bythe1989photoflight,theamountofopenspaceonthefloodplainhaddecreasedto17acres,andthesinuosityincreased.
Eightyearslater(1996),thewatershedwashitwithaneventthathasbeenratedbetweena250-year-to500-year-flowevent.Beforethisevent,therewere123.5milesofforestroadsconstructed(roaddensityof1.9milespersquaremile)and16percent(6,656acres)ofopenedtimberlands.The1996floodeventstrippedmostofthevegetationoffthefloodplain,leavingtwosmallislandsofvegetationonthetophalfoftheprojectarea,amountingtolessthananacreofcover.Thisonefloodeventstripped30acresofvegetationfromthefloodplain,exposing1.5milesofthestream
Lo
wer
Yel
low
jack
et S
tru
ctu
re M
on
ito
rin
g R
epo
rt
3—125
Case Study
todirectsunlightandincreasingavianpredation.Wewilltracktheamountofriparianvegetationwithadditionalphotographsandothervegetationmonitoring.
Figure 4. Aerial photographs showing changes in channel (blue lines), meander
patterns, and flood plain area (red lines). Yellowjacket Creek, Gifford Pinchot National Forest.
Note: We did a photo analysis only on the upper section of the project area because photos for the lower section were missing.
Twoover-bankfulleventshaveoccurredinthebasinsincethecompletionoftheprojectin2000.ThefirstwasinJanuary2002,andthesecondwasinFebruary2003(seefigures9through13).Aftereachoftheseevents,thechannelmovedandafewlogjamsthathaddevelopedduringthe1996floodweremoved,brokenapart,ordestroyed.
10
Lo
wer
Yel
low
jack
et S
tru
ctu
re M
on
ito
rin
g R
epo
rt

3—126
developing Monitoring Plans— Chapter 3
Project Monitoring, Partnerships, and Costs TheimplementationoftheprojectwasfundedbytheLowerColumbia
SalmonRecoveryFund,andthetotalcostwas$19,662.50.Thiscostdidnotincludesalary.Themonitoringoftheprojectwasmadepossiblebyfunds($8,000)fromtheSanDimasTechnologyandDevelopmentCenter.Wewillcollectdata(logcount,vegetationplots)fromthelowerhalfoftheproject area during the summer.
Lessons Learned or developed Thefollowingarefewthingstothinkaboutwhensettingupamonitoring
project. 1.Theoriginalphotopointlocationswereidentifiedwith4-inch
by4-inchyellowplastictags.Someofthetagscameloose,andwithoutamapofthelocation,reestablishingthemwouldhavebeenimpossible.ThisyearwedidGPSmappingofalllocationsandaddeddescriptionstomostofthephotopointnarratives.WerecommendusingGPSforalllocationsandincreasingthedetailsinnarrativedescriptions.
2.Thechannelismovingeveryyear,destroyingsomeoftheflagging,paint,ormonumentsplacedonthefloodplain.WerecommendusingGPSforallsites,photopoints,andanythingelseyouwanttofindlater.
3.IfGPSisnotanoption,setamonumentormonumentsoutsideofthefloodplain,asdescribedinStreamChannelReferenceSites:AnIllustratedGuidetoFieldTechnique(April1994).
4.Thinkabouthowandfromwhereyoucanviewasite(structure)duringafloodevent.Beingabletoobserveandgetphotosduringalltypesofweatherandflowsiscriticaltounderstandinghowthestructures are functioning.
For more information on this project contact: TerryLawson,CowlitzValleyR.D.,GiffordPinchotNationalForest,P.O.Box670,Randle,WA98377;phone:360-497-1100.
references Cited Rosgen,D.1996.AppliedRiverMorphology.WildlandHydrologyBooks.PagosaSprings,CO.
Sumioka,S.S.;Kresch,D.L.;Kasnick,K.D.1998.MagnitudeandfrequencyoffloodsinWashington:waterinvestigationsreport97-4277.Denver,CO:U.S.DepartmentoftheInterior,U.S.GeologicalSurvey.
Lo
wer
Yel
low
jack
et S
tru
ctu
re M
on
ito
rin
g R
epo
rt

3—127
Case Study
U.S.DepartmentofAgriculture,ForestService.1990.Streaminventoryhandbook,levelIandlevelII,version4.0.Portland,OR:U.S.DepartmentofAgriculture,ForestService,PacificNorthwestRegion
U.S.DepartmentofAgriculture,ForestService.2001.Streaminventoryhandbook,levelIandlevelII,version2.1.Portland,OR:U.S.DepartmentofAgriculture,ForestService,PacificNorthwestRegion.
U.S,DepartmentofAgriculture,ForestService.1994.Streamchannelreferencesites:anillustratedguidetofieldtechniques.Gen.Tech.Rep.RM-245.FortCollins,CO:U.S.DepartmentofAgriculture,ForestService,RockyMountainForestandRangeExperimentStation.
10
Lo
wer
Yel
low
jack
et S
tru
ctu
re M
on
ito
rin
g R
epo
rt
3—128
developing Monitoring Plans— Chapter 3
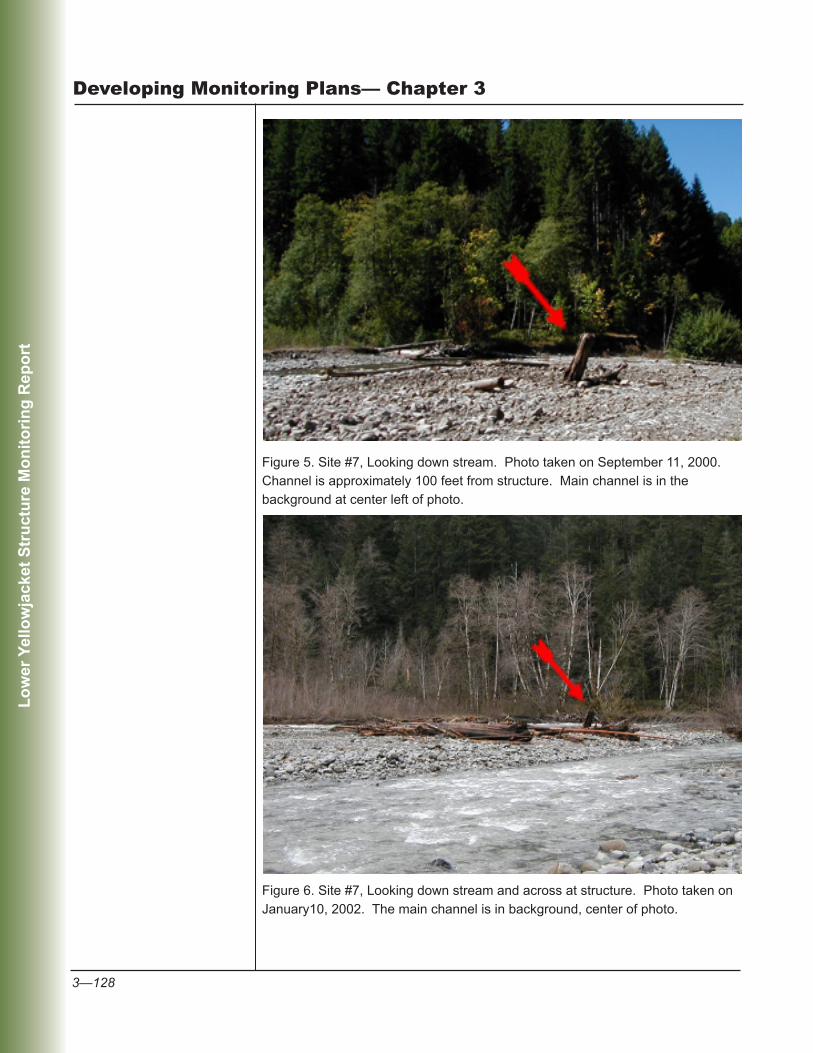
Figure 5. Site #7, Looking down stream. Photo taken on September 11, 2000. Channel is approximately 100 feet from structure. Main channel is in the background at center left of photo.
Figure 6. Site #7, Looking down stream and across at structure. Photo taken on January10, 2002. The main channel is in background, center of photo.
Lo
wer
Yel
low
jack
et S
tru
ctu
re M
on
ito
rin
g R
epo
rt

3—129
Case Study
Figure 7. Site #7, Looking down stream at structure. Photo taken on February 3, 2003. The main channel can not be seen in photo but it is at the shadow line.
Figure 8. Site #8, Looking down stream at structure. Photo taken on September 12, 2000. The main channel can not be seen in photo and is on the left side of the structure.
Lo
wer
Yel
low
jack
et S
tru
ctu
re M
on
ito
rin
g R
epo
rt

3—130
developing Monitoring Plans— Chapter 3
Figure 9. Site #8, Looking down stream at structure. Photo taken on January 10, 2002. The new channel is on the left side of the structure.
Figure 10. Site #8, Looking down stream and across to structure. Photo taken on March 2, 2002. The new channel is in the center of the photo.
Lo
wer
Yel
low
jack
et S
tru
ctu
re M
on
ito
rin
g R
epo
rt
3—131
Case Study
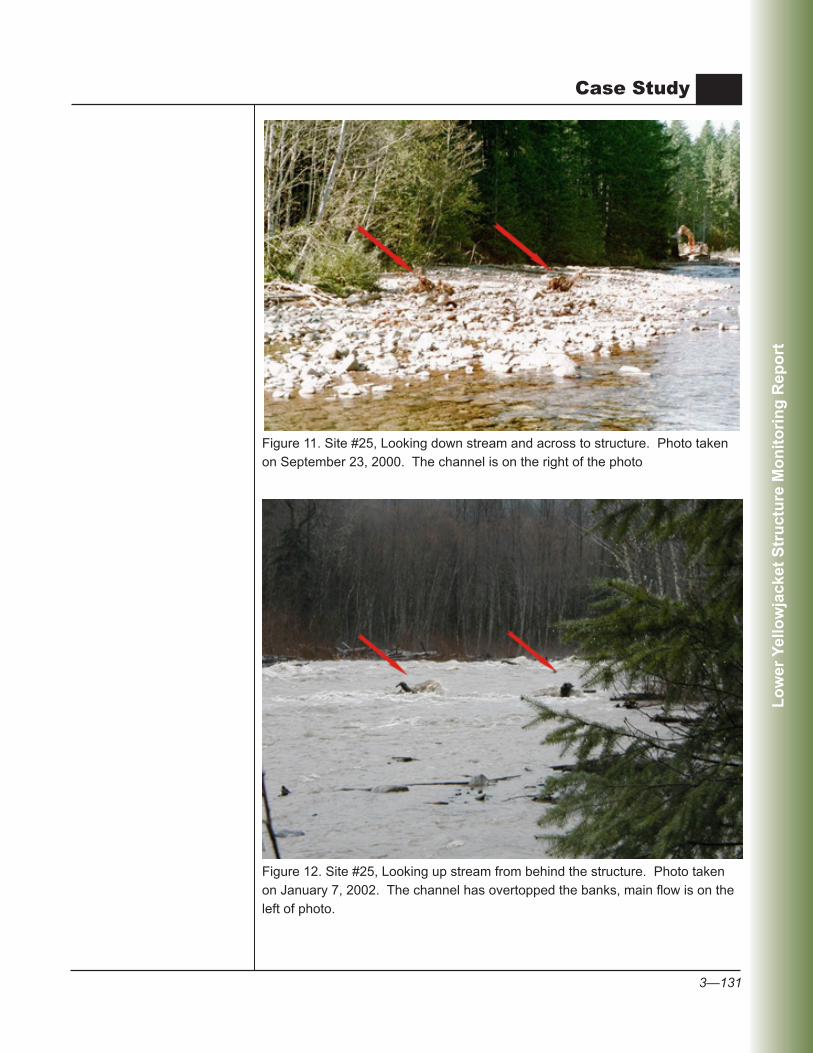
Figure 11. Site #25, Looking down stream and across to structure. Photo taken on September 23, 2000. The channel is on the right of the photo
Figure 12. Site #25, Looking up stream from behind the structure. Photo taken on January 7, 2002. The channel has overtopped the banks, main flow is on the left of photo.
Lo
wer
Yel
low
jack
et S
tru
ctu
re M
on
ito
rin
g R
epo
rt
3—132
developing Monitoring Plans— Chapter 3
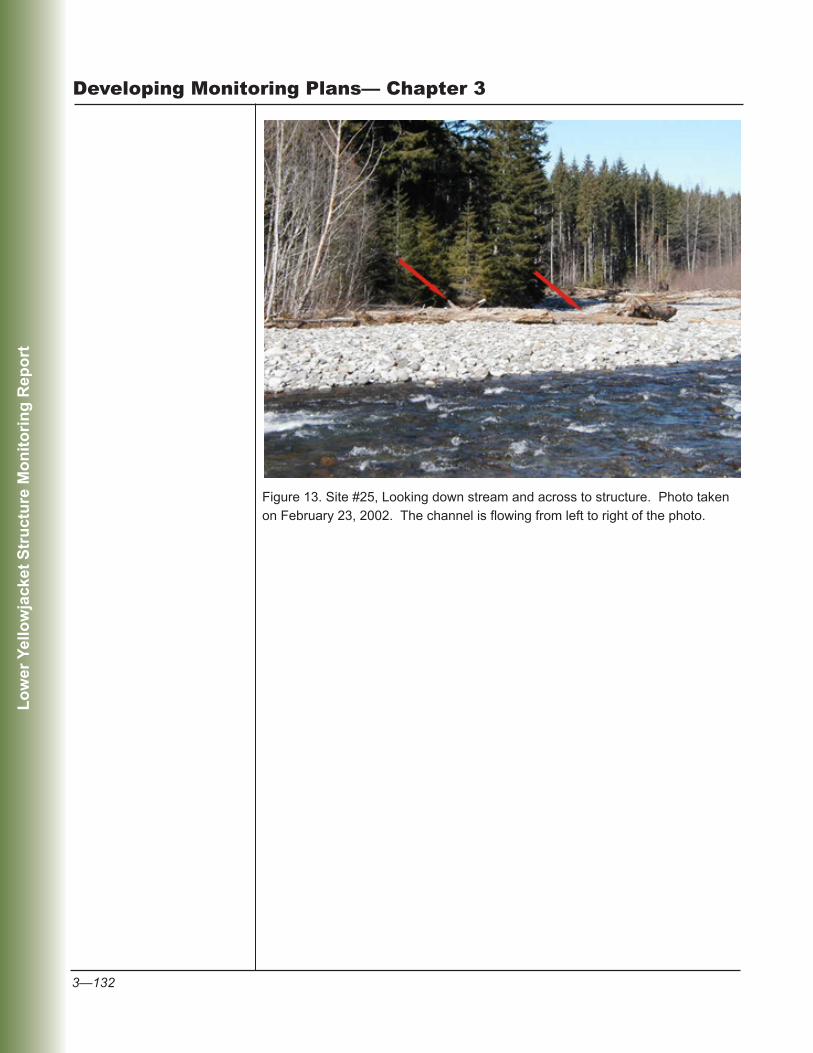
Figure 13. Site #25, Looking down stream and across to structure. Photo taken on February 23, 2002. The channel is flowing from left to right of the photo.
Lo
wer
Yel
low
jack
et S
tru
ctu
re M
on
ito
rin
g R
epo
rt


