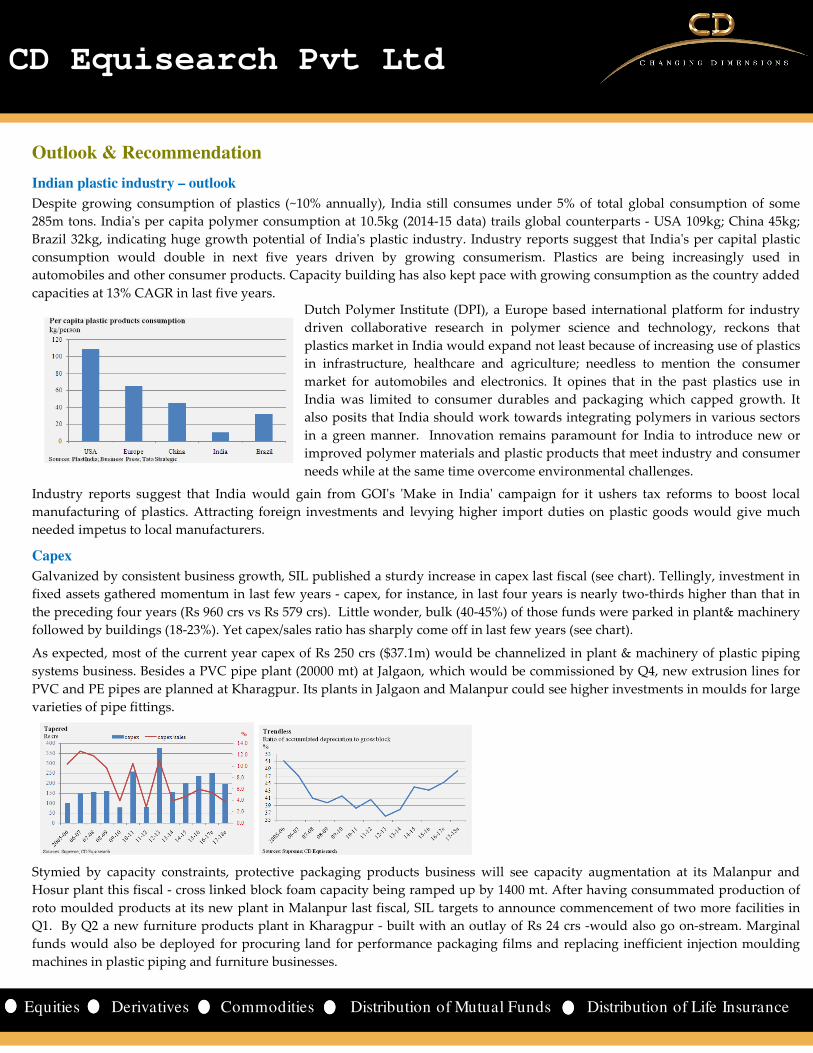
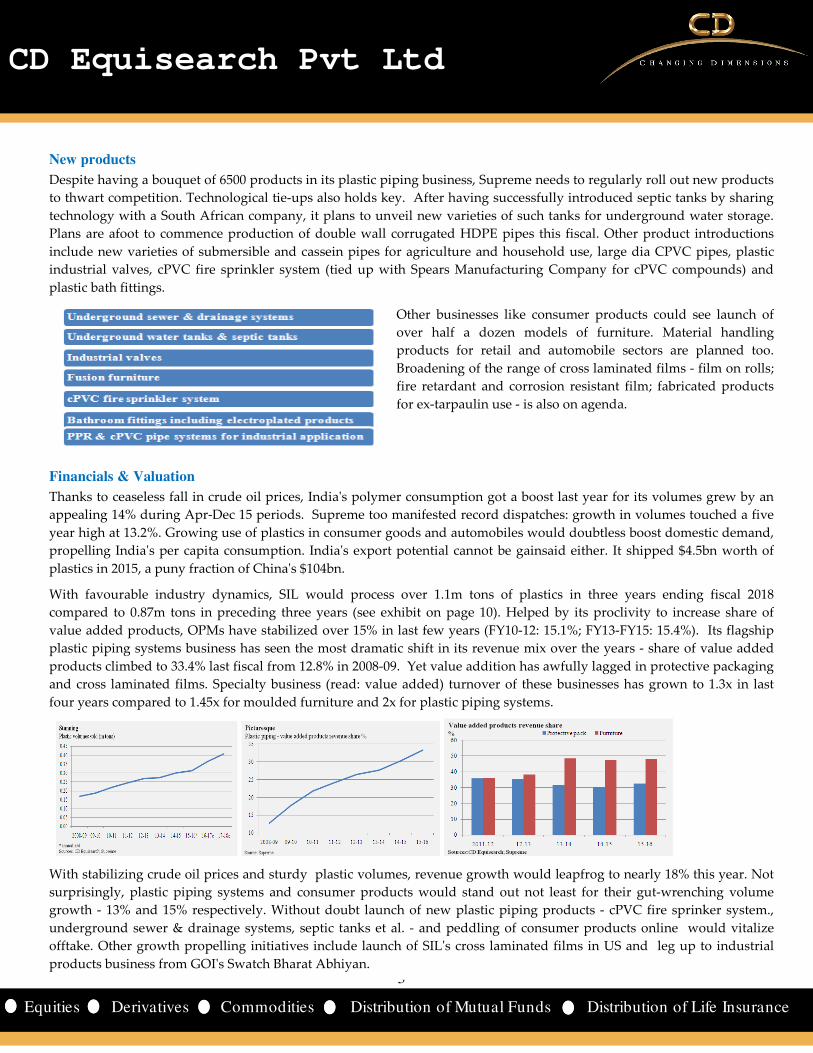
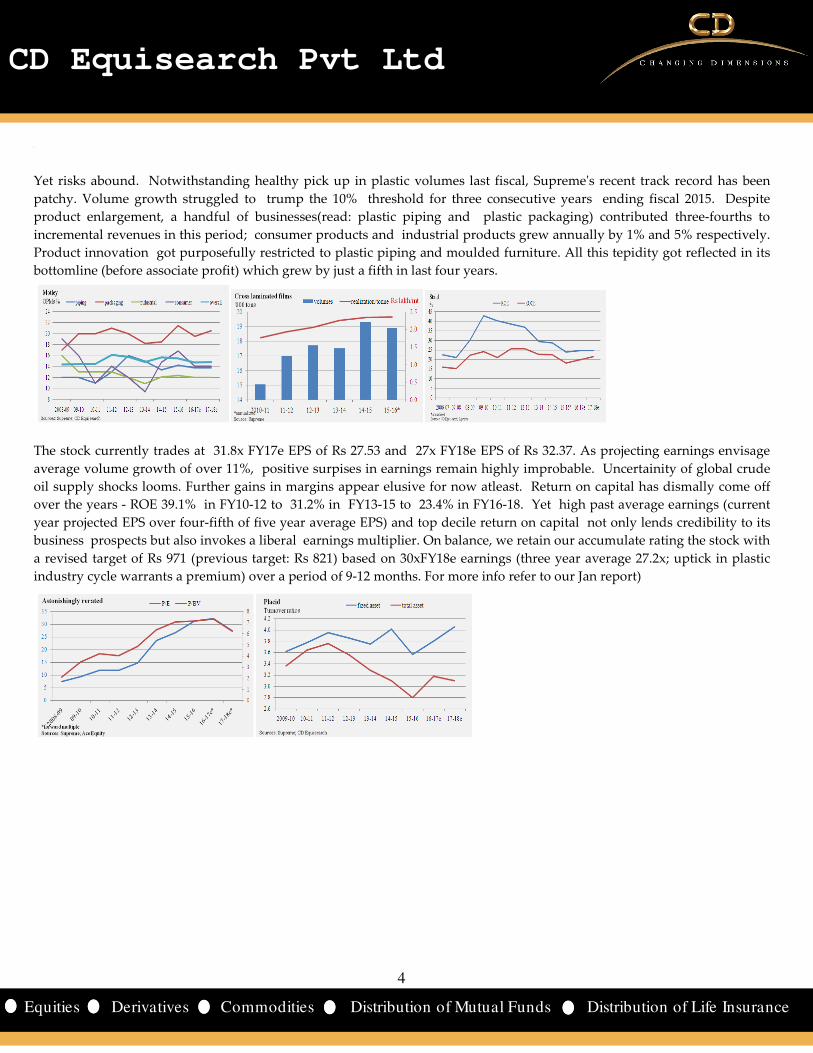
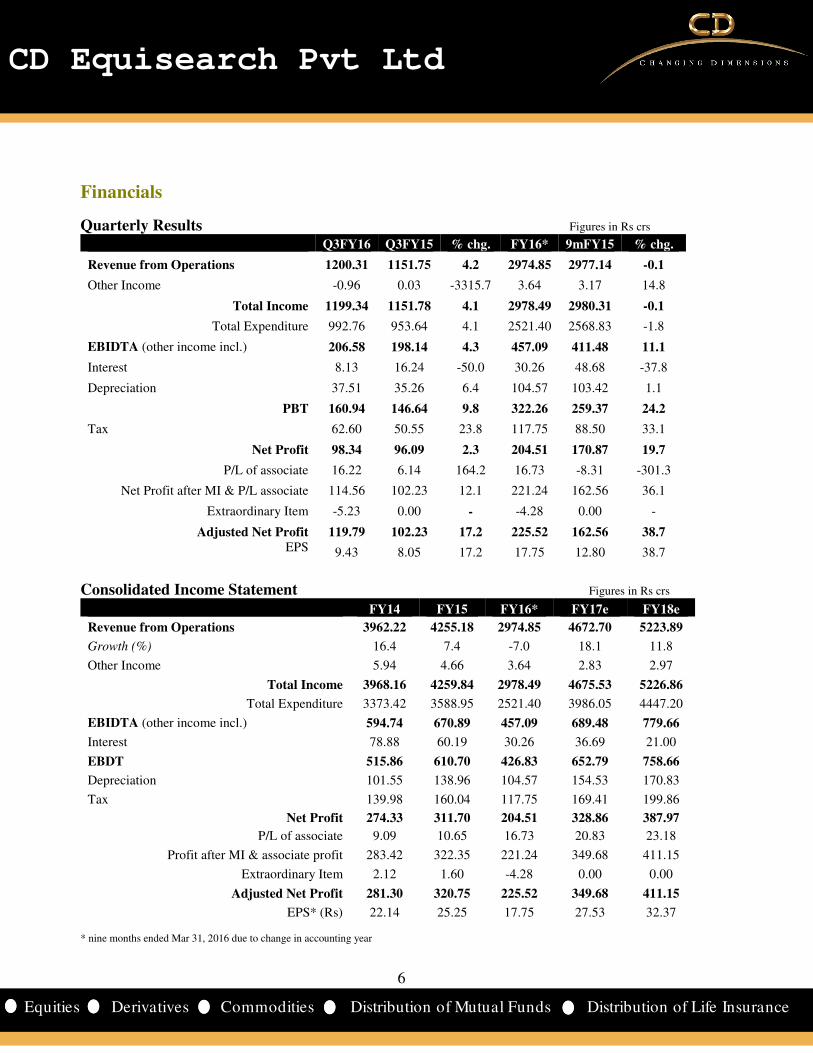
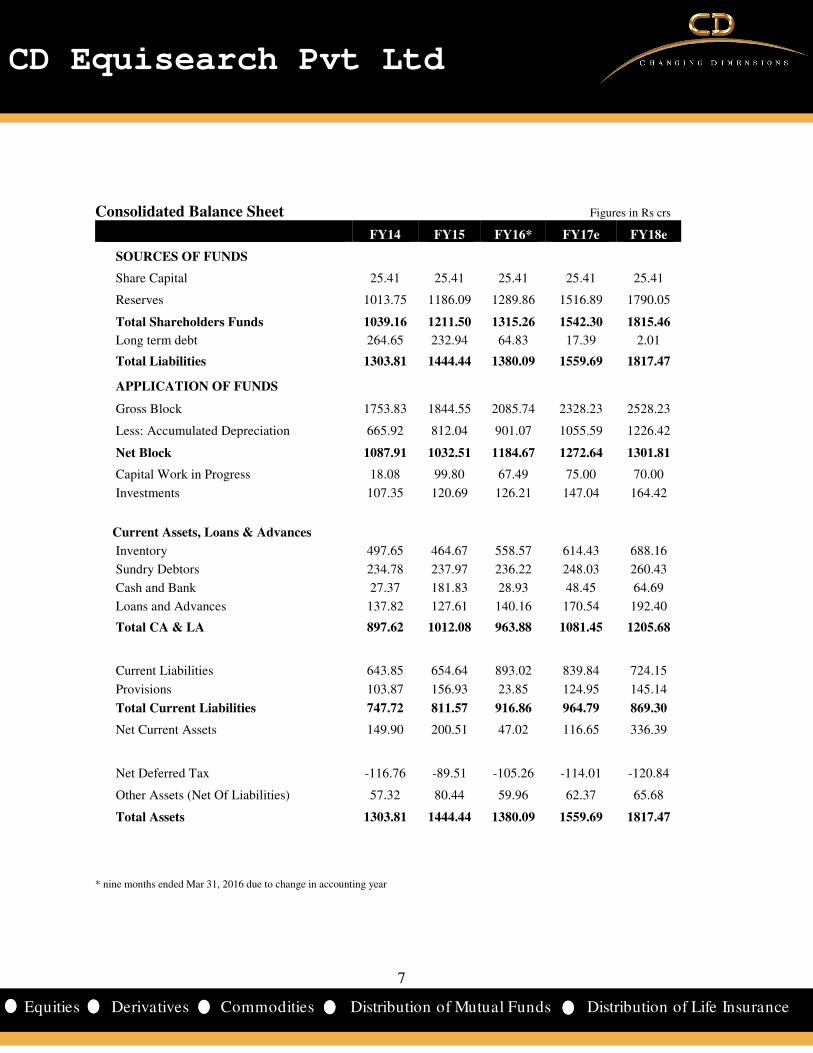
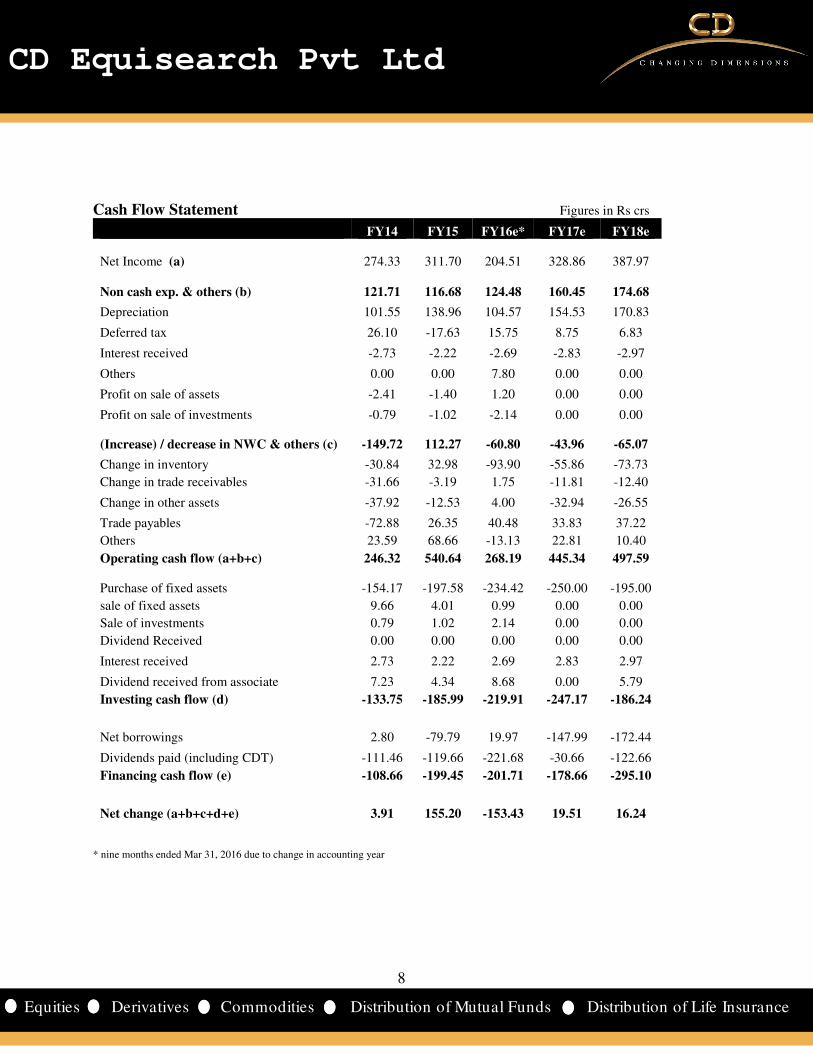
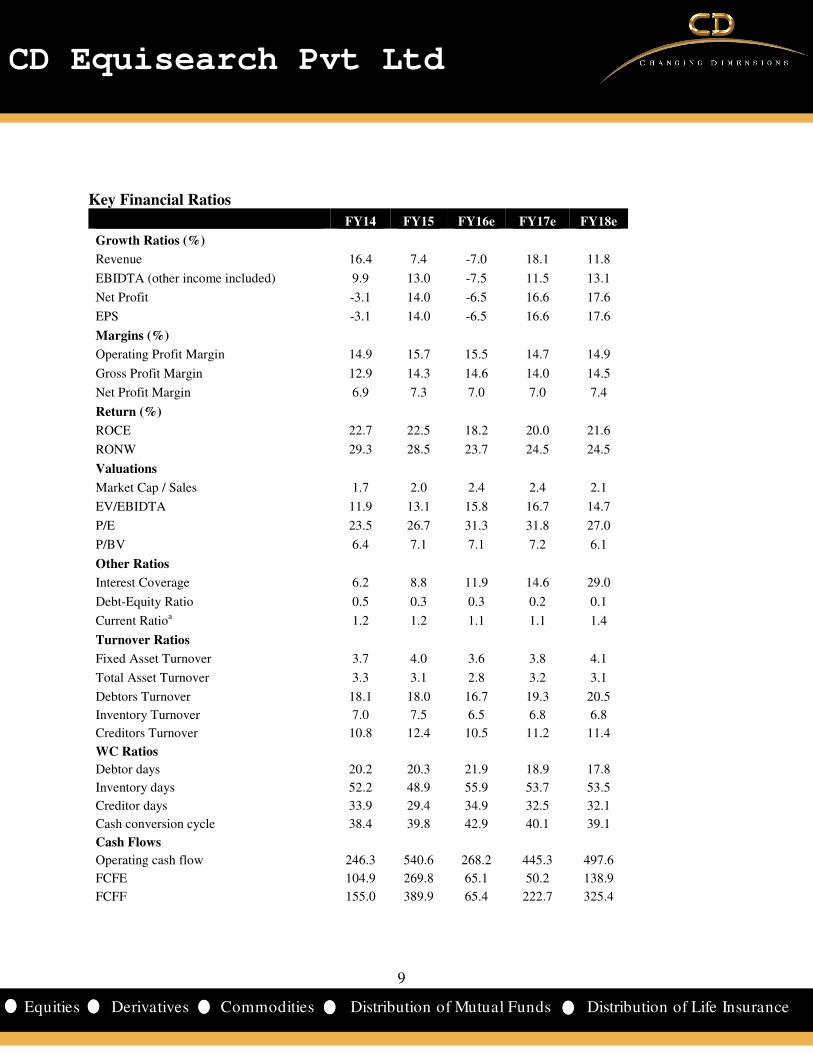
CD Equisearch Pvt Ltd June 21, 2016 Equities Derivatives Commodities Distribution of Mutual Funds Distribution of Life Insurance . * nine months ended Mar 31, 2016 due to change in accounting year The Supreme Industries Ltd No. of shares (m) 127.0 Mkt cap (Rs crs/$m) 11109/1648.0 Current price (Rs/$) 875/13.0 Price target (Rs/$) 971/14.4 52 W H/L (Rs.) 1000/540 Book Value (Rs/$) 103/1.5 Beta 0.5 Daily volume (avg. monthly) 155450 P/BV (FY17e/18e) 7.2/6.1 EV/EBITDA (FY17e/18e) 16.7/14.7 P/E (FY17e/18e) 31.8/27.0 EPS growth (F17e/18e) 16.6/17.6 OPM (FY16/17e/18e) 15.5/14.7/14.9 ROE (FY16/17e/18e) 23.7/24.5/24.5 ROCE(FY16e/17e/18e) 18.2/20.0/21.6 D/E ratio (FY16e/17e/18e) 0.3/0.2/0.1 BSE Code 509930 NSE Code SUPREMEIND Bloomberg SI IN Reuters SUPI.BO Shareholding pattern % Promoters 49.7 MFs / Banks / FIs 8.3 FIIs 20.6 Govt. Holding 0.0 Public & Others 21.4 Total 100.0 As on Mar 31, 2016 Recommendation ACCUMULATE Analyst KISHAN GUPTA, CFA, FRM Phone: + 91 (33) 4488 0043 E- mail: [email protected](Figures in Rs crs) FY14 FY15 FY16* FY17e FY18e Income from operations 3962.22 4255.18 2974.85 4672.70 5223.89 Other Income 5.94 4.66 3.64 2.83 2.97 EBITDA (other income included) 594.74 670.89 457.09 689.48 779.66 Profit after EO 281.30 320.75 225.52 349.68 411.15 EPS 22.14 25.25 17.75 27.53 32.37 EPS growth (%) -3.1 14.0 -6.5 16.6 17.6 Quarterly Highlights Trampled by incessant fall in global crude oil prices, polymer manufacturers faced a nasty shock. Most reported sharp fall in prices of their finished products, resulting in near brutal moderation in sales. SIL was no exception for its plastic business sales grew by just 4%. Its plastic piping system picked up the slack for it reported 13.7% growth in sales (18.6% in volumes) in FY16 (nine months). But its industrial products and packaging products businesses showed lousy growth in dispatches last fiscal: volumes of the former slid by 7.6% and that of the latter grew by a tiddly 6.6%. Surprisingly, SIL’s consumer products business proved most resilient for it has now posted double digit revenue growth for six quarters in a row; volumes too have complied - 19.8% median growth in last five quarters. Strong uptick in demand from agriculture and infrastructure sector - drinking water pipes; sewage etc explains the buoyancy in plastic piping system business. Resultantly, its CPVC business outgrew the industry by posting 24% growth in dispatches last fiscal. But this peppiness in overall demand barely reflects effects of seasonality. Piping volumes for instance grew by a measly 4.3% in Q2FY16. Third quarter of last fiscal alone contributed 46% to annual tally. Cumulative sales in two quarters (Q3&Q4) accounted for nearly 62% of total annual volumes in FY15. Notwithstanding growing value addition in packaging products business (read: cross laminated films and protective packaging), its revenues last fiscal grew at the slowest pace (6.6%) in seven years. Despite expansion in operating margins by some 120 bps, volumes of its most profitable cross laminated films advanced by just 5.8%. SIL reckons that capacity constraints would plague its protective packaging business for some more time. Build up in material margins of plastic business last fiscal largely explains the large increase (150 bps) in OPMs (including construction business). Ebullience in margins was pervasive too: packaging products reported a stunning 664 bps rise in OPMs last fiscal; consumer products business was not too far at 491 bps. That's not all. OPMs of all but plastic piping system business reached either multi-year or record highs last fiscal. The stock currently trades at 31.8x FY17e EPS of Rs 27.53 and 27x FY18e EPS of Rs 32.37. Uptick in volumes of India’s plastic industry prompts reduction in equity risk premiums. Yet SIL’s projected revenue growth of 15% (average) over the next two years partially reflects the unpredictibility of global crude oil markets. SIL’s high past average earnings and top decile return on capital would preclude sharp decline in earnings. On balance we retain our accumulate rating on the stock with revised target of Rs 971 (previous target: Rs 821 based on 30x FY18e earnings.
Transcript
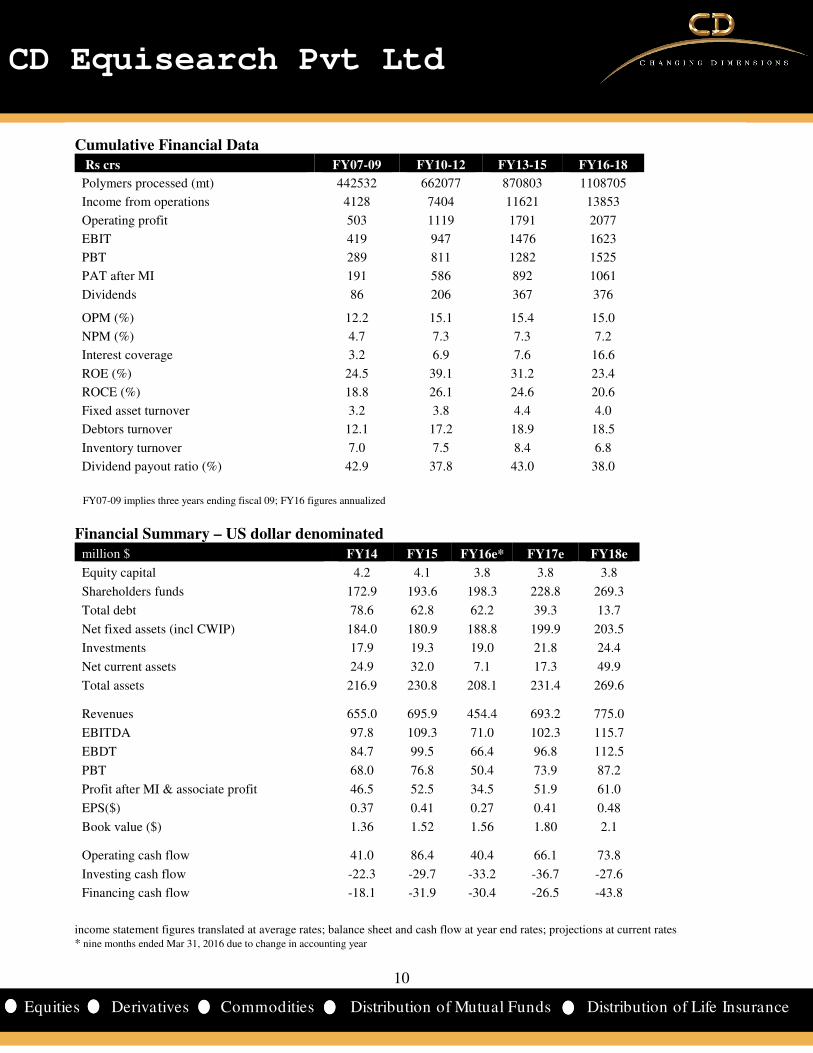
CD Equisearch Pvt Ltd June 21, 2016
Equities Derivatives Commodities Distribution of Mutual Funds Distribution of Life Insurance
.
* nine months ended Mar 31, 2016 due to change in accounting year
FY07-09 implies three years ending fiscal 09; FY16 figures annualized
Financial Summary – US dollar denominated
million $ FY14 FY15 FY16e* FY17e FY18e
Equity capital 4.2 4.1 3.8 3.8 3.8
Shareholders funds 172.9 193.6 198.3 228.8 269.3
Total debt 78.6 62.8 62.2 39.3 13.7
Net fixed assets (incl CWIP) 184.0 180.9 188.8 199.9 203.5
Investments 17.9 19.3 19.0 21.8 24.4
Net current assets 24.9 32.0 7.1 17.3 49.9
Total assets 216.9 230.8 208.1 231.4 269.6
Revenues 655.0 695.9 454.4 693.2 775.0
EBITDA 97.8 109.3 71.0 102.3 115.7
EBDT 84.7 99.5 66.4 96.8 112.5
PBT 68.0 76.8 50.4 73.9 87.2
Profit after MI & associate profit 46.5 52.5 34.5 51.9 61.0
EPS($) 0.37 0.41 0.27 0.41 0.48
Book value ($) 1.36 1.52 1.56 1.80 2.1
Operating cash flow 41.0 86.4 40.4 66.1 73.8
Investing cash flow -22.3 -29.7 -33.2 -36.7 -27.6
Financing cash flow -18.1 -31.9 -30.4 -26.5 -43.8
income statement figures translated at average rates; balance sheet and cash flow at year end rates; projections at current rates * nine months ended Mar 31, 2016 due to change in accounting year
11
11
CD Equisearch Pvt Ltd
Equities Derivatives Commodities Distribution of Mutual Funds Distribution of Life Insurance
Disclosure& Disclaimer CD Equisearch Private Limited (hereinafter referred to as ‘CD Equi’) is a Member registered with National Stock Exchange of India Limited,
Bombay Stock Exchange Limited and Metropolitan Stock Exchange of India Limited (Formerly known as MCX Stock Exchange Limited). CD
Equi is also registered as Depository Participant with CDSL and AMFI registered Mutual Fund Advisor. The associates of CD Equi are
engaged in activities relating to NBFC-ND - Financing and Investment, Commodity Broking, Real Estate, etc.
CD Equi is registered under SEBI (Research Analysts) Regulations, 2014 with SEBI Registration no INH300002274. Further, CD Equi hereby
declares that –
• No disciplinary action has been taken against CD Equi by any of the regulatory authorities.
• CD Equi/its associates/research analysts do not have any financial interest/beneficial interest of more than one percent/material
conflict of interest in the subject company(s) (kindly disclose if otherwise).
• CD Equi/its associates/research analysts have not received any compensation from the subject company(s) during the past twelve
months.
• CD Equi/its research analysts has not served as an officer, director or employee of company covered by analysts and has not been
engaged in market making activity of the company covered by analysts.
This document is solely for the personal information of the recipient and must not be singularly used as the basis of any investment decision.
Nothing in this document should be construed as investment or financial advice. Each recipient of this document should make such
investigations as they deem necessary to arrive at an independent evaluation of an investment in the securities of the companies referred to in
this document (including the merits and risks involved) and should consult their own advisors to determine the merits and risks of such an
investment.
Reports based on technical and derivative analysis center on studying charts of a stock's price movement, outstanding positions and trading
volume, as opposed to focusing on a company's fundamentals and as such, may not match with a report on a company's fundamentals.
The information in this document has been printed on the basis of publicly available information, internal data and other reliable sources
believed to be true but we do not represent that it is accurate or complete and it should not be relied on as such, as this document is for general
guidance only. CD Equi or any of its affiliates/group companies shall not be in any way responsible for any loss or damage that may arise to
any person from any inadvertent error in the information contained in this report. CD Equi has not independently verified all the information
contained within this document. Accordingly, we cannot testify nor make any representation or warranty, express or implied, to the accuracy,
contents or data contained within this document.
While, CD Equi endeavors to update on a reasonable basis the information discussed in this material, there may be regulatory compliance or
other reasons that prevent us from doing so.
This document is being supplied to you solely for your information and its contents, information or data may not be reproduced, redistributed
or passed on, directly or indirectly. Neither, CD Equi nor its directors, employees or affiliates shall be liable for any loss or damage that may
arise from or in connection with the use of this information.
CD Equisearch Private Limited (CIN: U67120WB1995PTC071521)